32
IIASA experience in analyzing global forest datasets Dmitry Schepaschenko, Myroslava Lesiv, Aline Moisnier, Steffen Fritz Independent monitoring GHG emission Marie Curie FP7-MC-IIF: SIFCAS
IIASA experience in analyzing global forest datasets
Dmitry Schepaschenko, Myroslava Lesiv,
Aline Moisnier, Steffen Fritz
Independent monitoring GHG emission
Marie Curie FP7-MC-IIF: SIFCAS
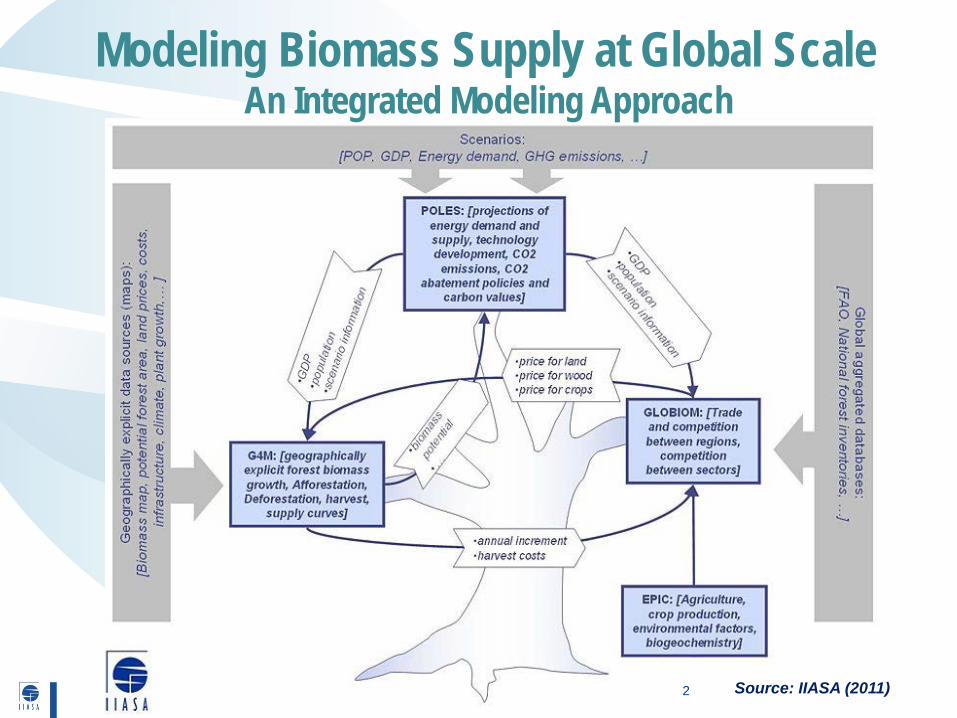
Modeling Biomass Supply at Global Scale An Integrated Modeling Approach
Source: IIASA (2011) 2
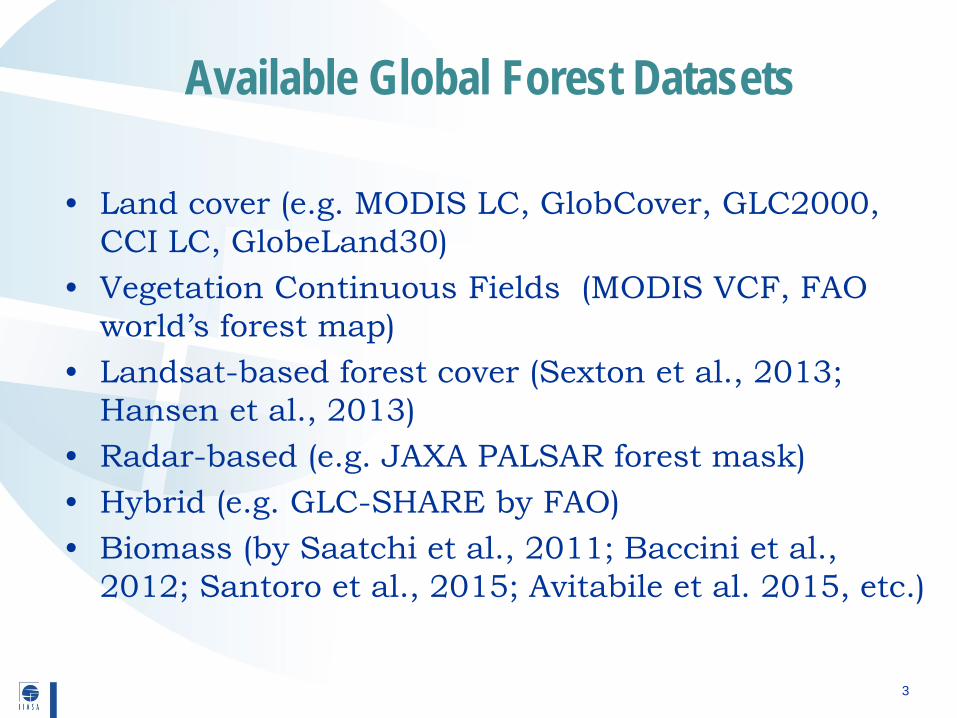
Available Global Forest Datasets
• Land cover (e.g. MODIS LC, GlobCover, GLC2000, CCI LC, GlobeLand30)
• Vegetation Continuous Fields (MODIS VCF, FAO world’s forest map)
• Landsat-based forest cover (Sexton et al., 2013; Hansen et al., 2013)
• Radar-based (e.g. JAXA PALSAR forest mask) • Hybrid (e.g. GLC-SHARE by FAO) • Biomass (by Saatchi et al., 2011; Baccini et al.,
2012; Santoro et al., 2015; Avitabile et al. 2015, etc.)
3
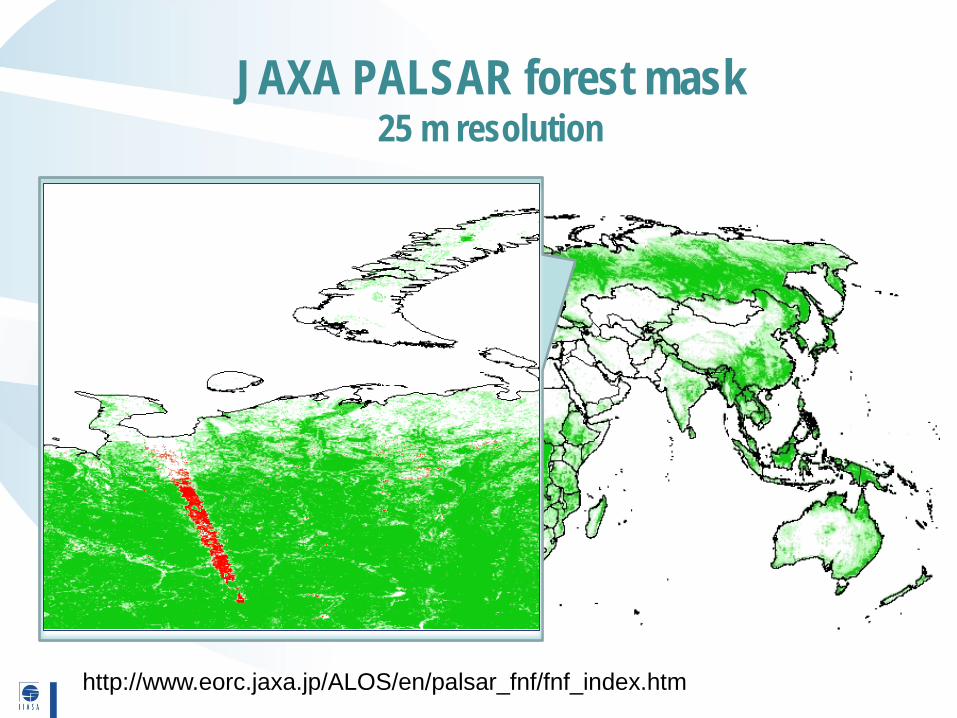
JAXA PALSAR forest mask 25 m resolution
http://www.eorc.jaxa.jp/ALOS/en/palsar_fnf/fnf_index.htm
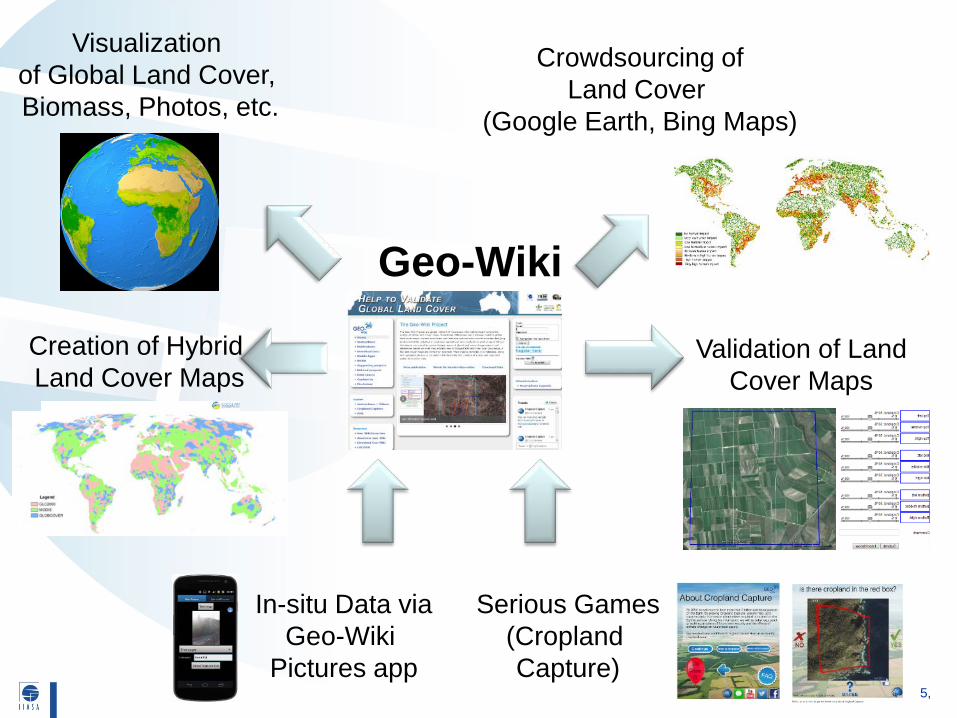
Geo-Wiki
Visualization of Global Land Cover, Biomass, Photos, etc.
Crowdsourcing of Land Cover
(Google Earth, Bing Maps)
Creation of Hybrid Land Cover Maps
Validation of Land Cover Maps
In-situ Data via Geo-Wiki
Pictures app
Serious Games (Cropland Capture)
5,
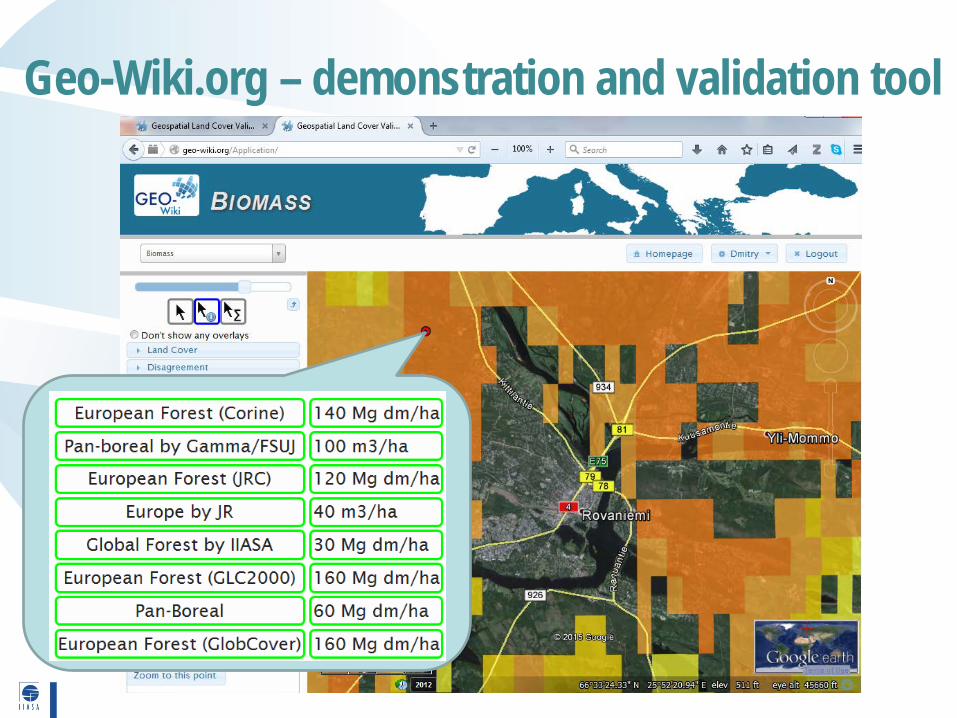
Geo-Wiki.org – demonstration and validation tool
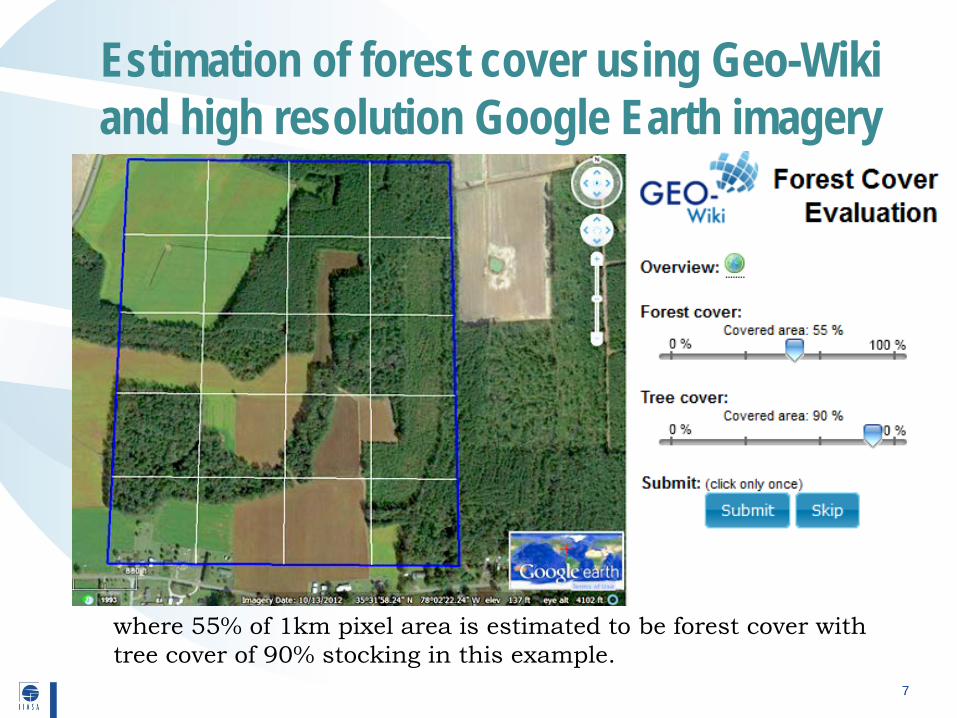
Estimation of forest cover using Geo-Wiki and high resolution Google Earth imagery
where 55% of 1km pixel area is estimated to be forest cover with tree cover of 90% stocking in this example.
7
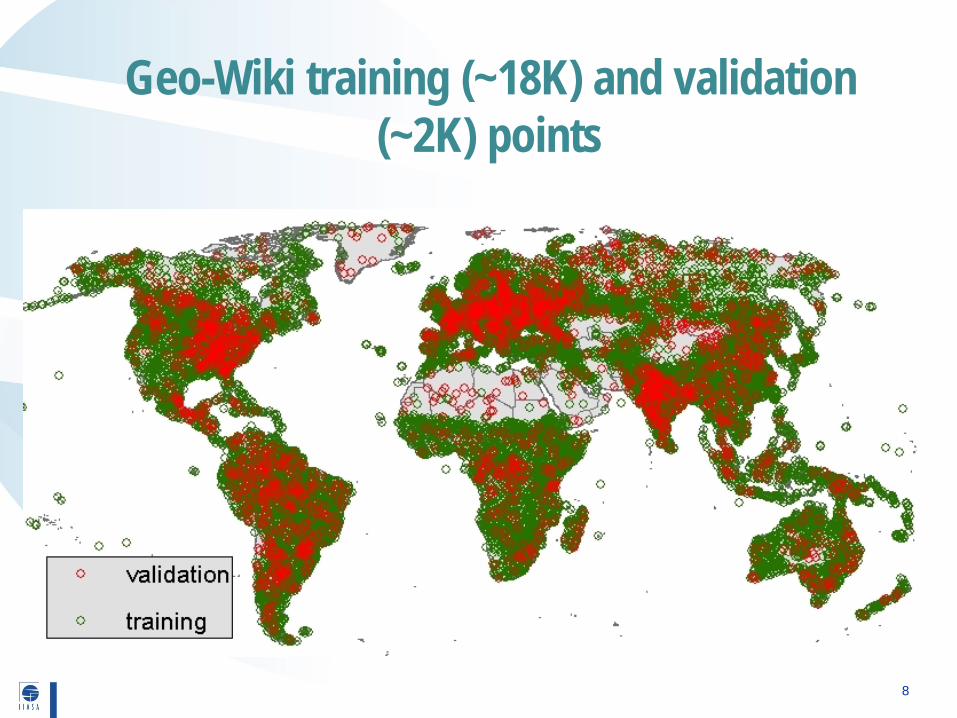
Geo-Wiki training (~18K) and validation (~2K) points
8
International Forest Biomass Network: Towards a Global Biomass Data Repository
• Support Calibration/Validation of the ESA BIOMASS mission
• Elaborate a Live Biomass database accessible for the entire community
• Populate the database with the data from several multinational networks (RAINFOR, ArtiTRON, etc.)
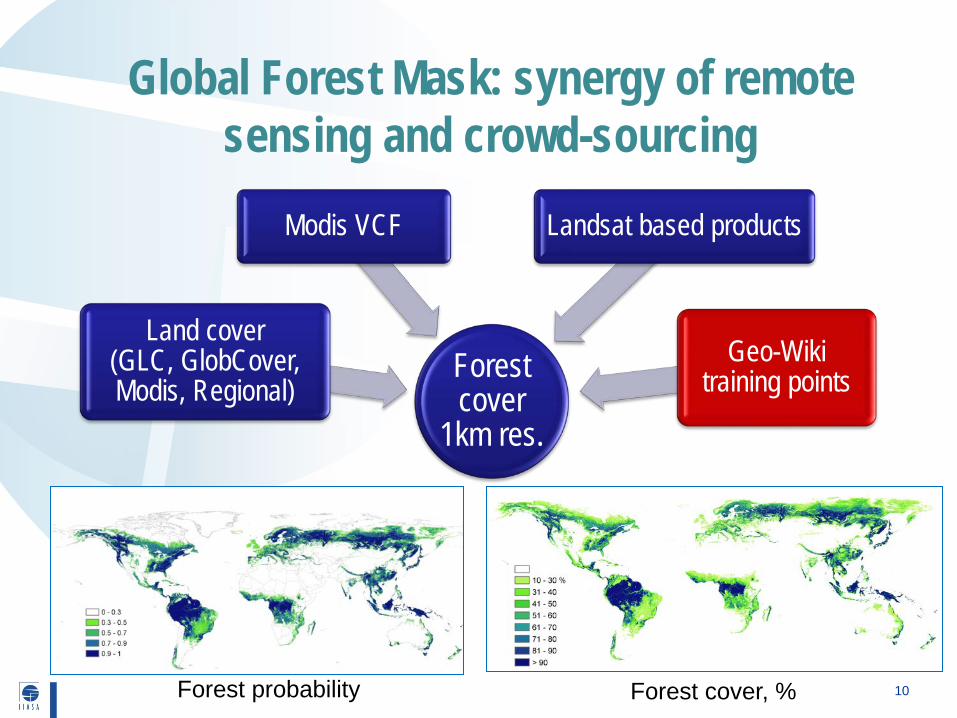
Global Forest Mask: synergy of remote sensing and crowd-sourcing
Forest cover, % Forest probability
Forest cover
1km res.
Land cover (GLC, GlobCover, Modis, Regional)
Modis VCF Landsat based products
Geo-Wiki training points
10
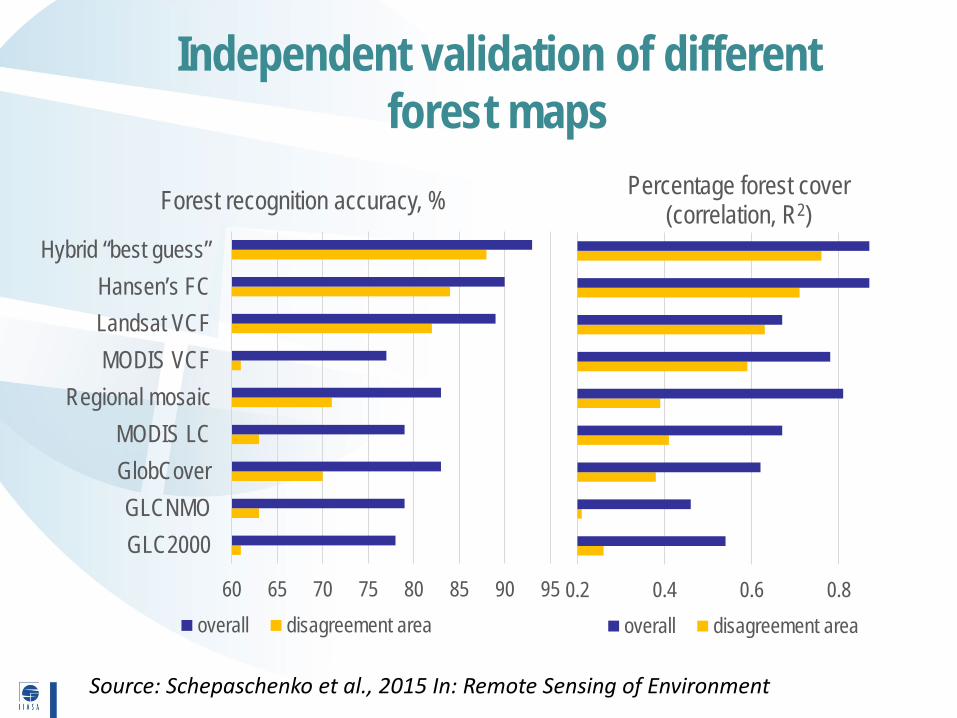
Independent validation of different forest maps
60 65 70 75 80 85 90 95
GLC2000GLCNMO
GlobCoverMODIS LC
Regional mosaicMODIS VCF
Landsat VCFHansen’s FC
Hybrid “best guess”
Forest recognition accuracy, %
overall disagreement area0.2 0.4 0.6 0.8
Percentage forest cover (correlation, R2)
overall disagreement area
Source: Schepaschenko et al., 2015 In: Remote Sensing of Environment
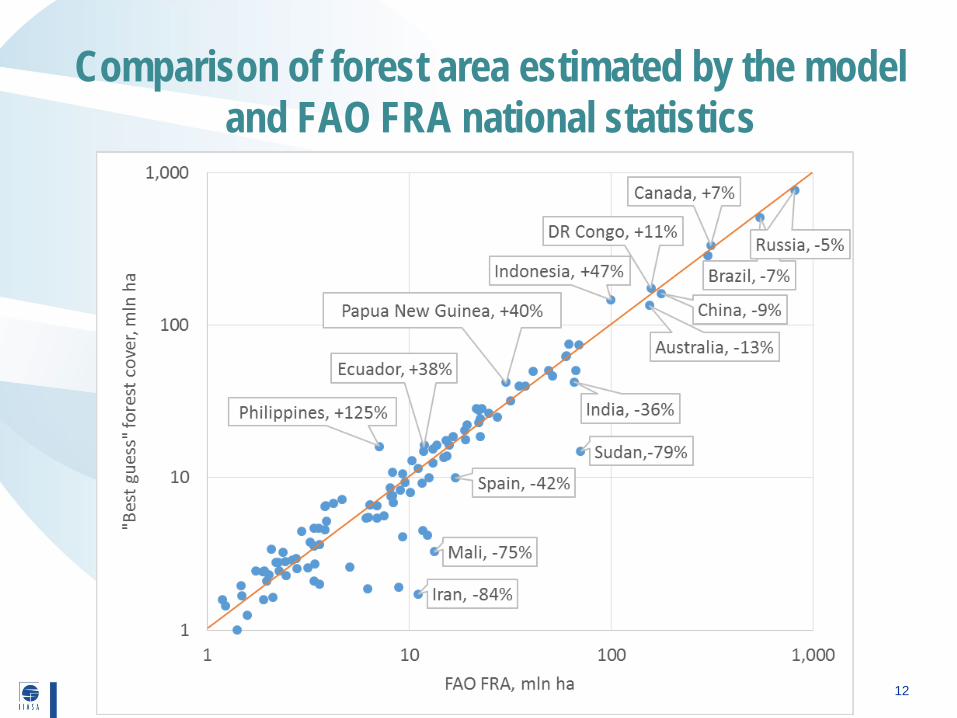
Comparison of forest area estimated by the model and FAO FRA national statistics
12
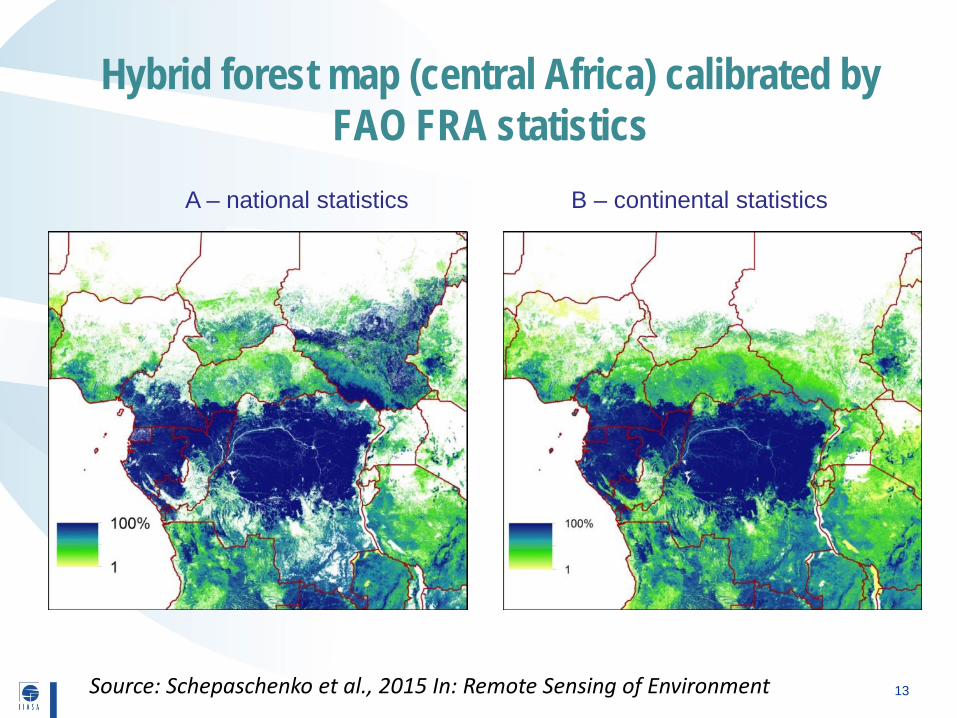
Hybrid forest map (central Africa) calibrated by FAO FRA statistics
A – national statistics B – continental statistics
13 Source: Schepaschenko et al., 2015 In: Remote Sensing of Environment
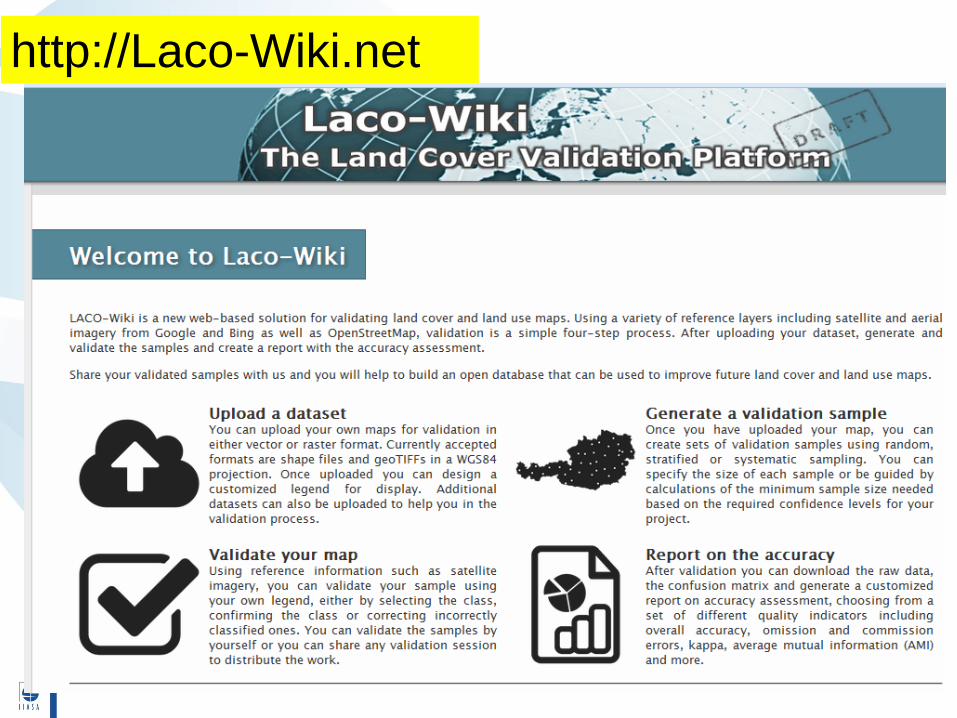
http://Laco-Wiki.net
Experience of developing a hybrid forest map for Poland and Ukraine
Marie Curie individual grant FP7-MC-IIF: SIFCAS
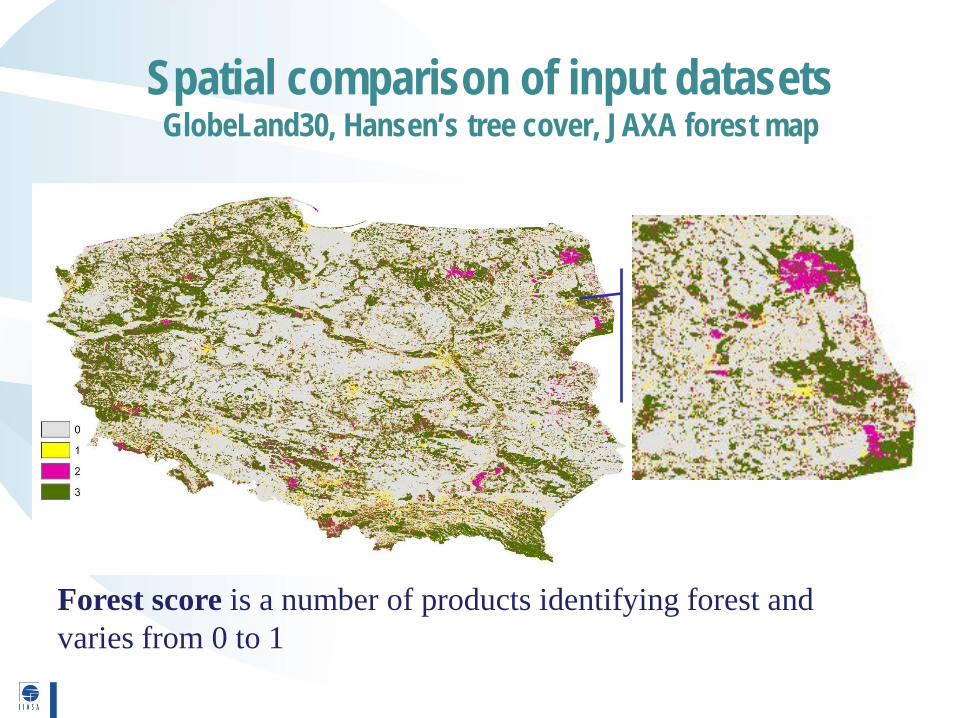
Spatial comparison of input datasets GlobeLand30, Hansen’s tree cover, JAXA forest map
Forest score is a number of products identifying forest and varies from 0 to 1
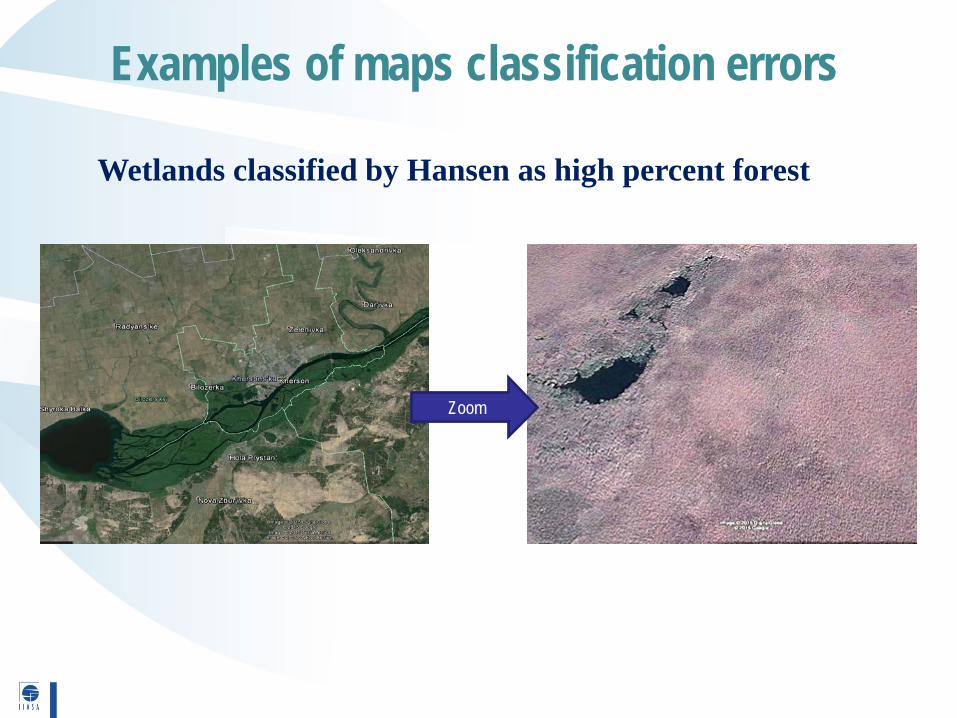
Examples of maps classification errors
Wetlands classified by Hansen as high percent forest
Zoom
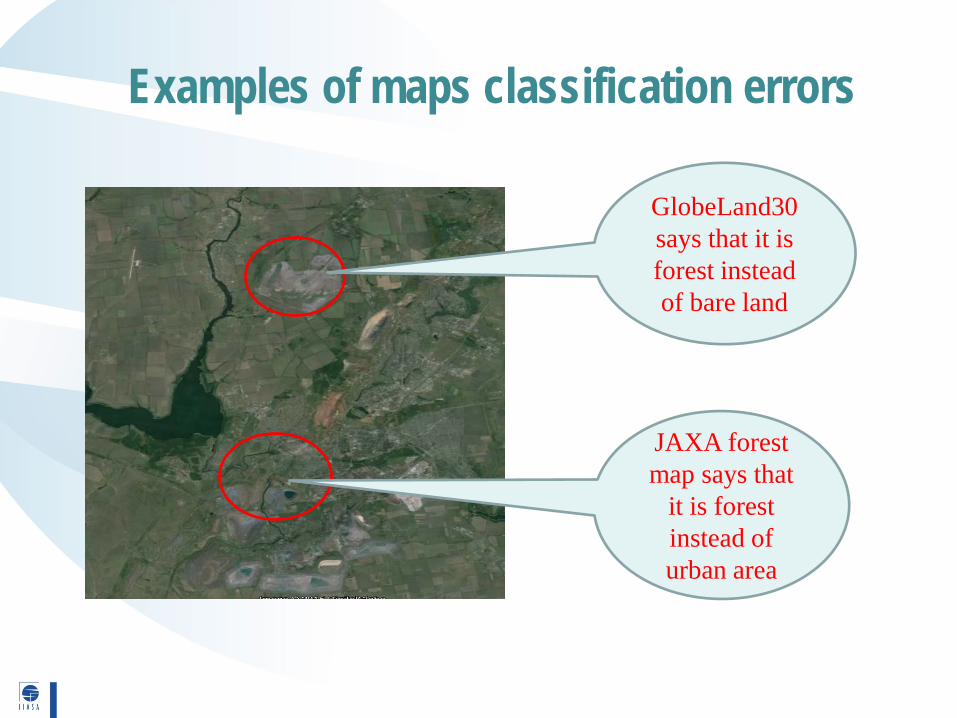
Examples of maps classification errors
GlobeLand30 says that it is forest instead of bare land
JAXA forest map says that
it is forest instead of urban area
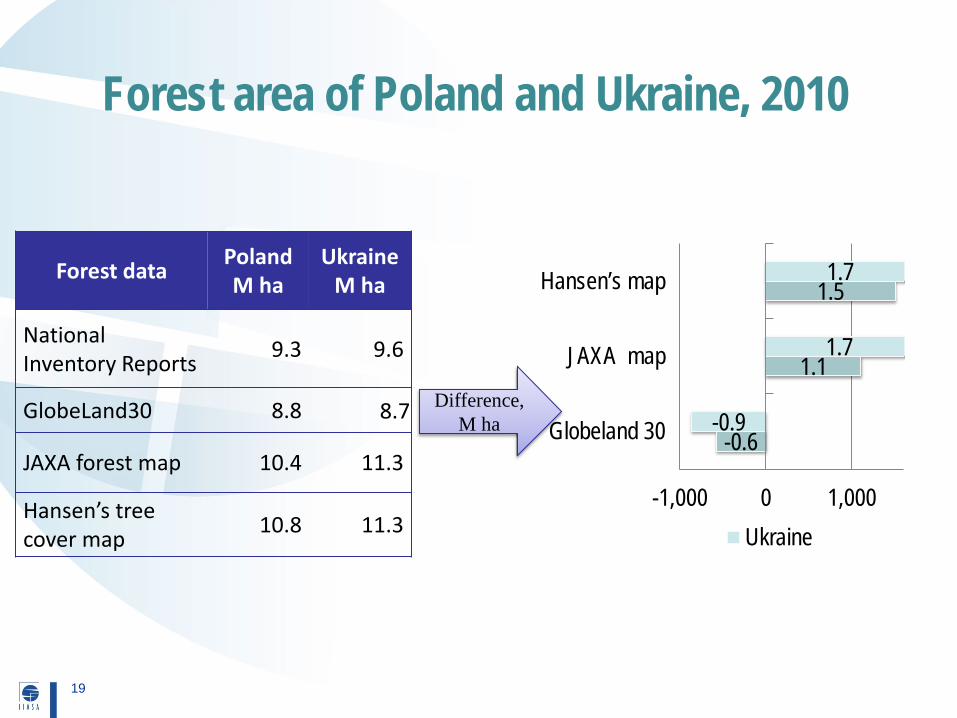
Forest area of Poland and Ukraine, 2010
Forest data Poland M ha
Ukraine M ha
National Inventory Reports 9.3 9.6
GlobeLand30 8.8 8.7
JAXA forest map 10.4 11.3
Hansen’s tree cover map 10.8 11.3
19
-0.6
1.1
1.5
-0.9
1.7
1.7
-1,000 0 1,000
Globeland 30
JAXA map
Hansen’s map
Ukraine
Difference, M ha
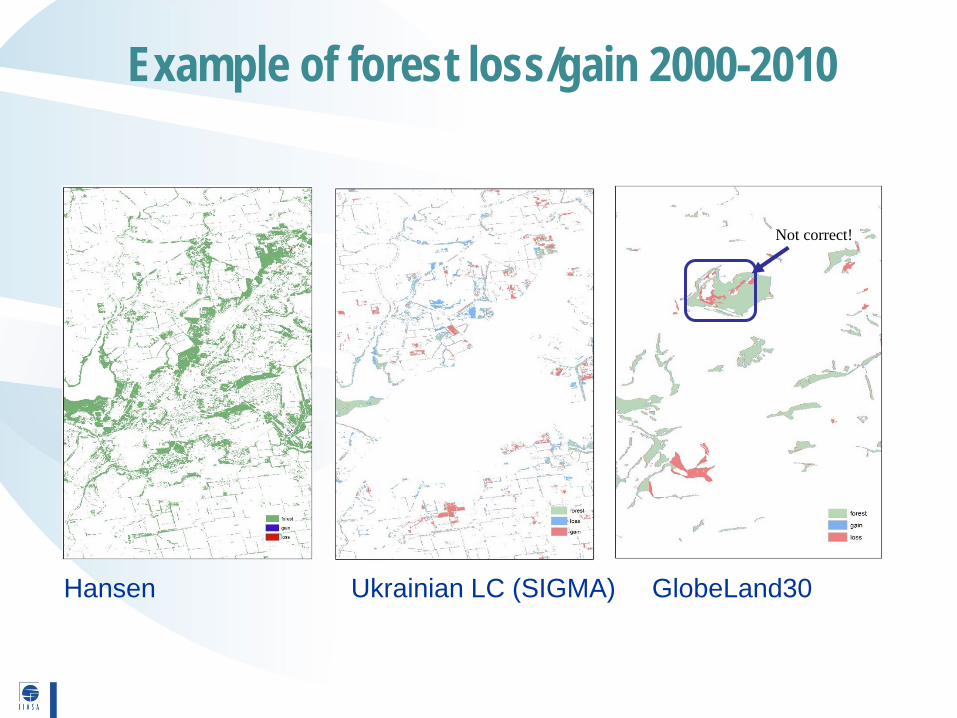
Example of forest loss/gain 2000-2010
Not correct!
Hansen Ukrainian LC (SIGMA) GlobeLand30
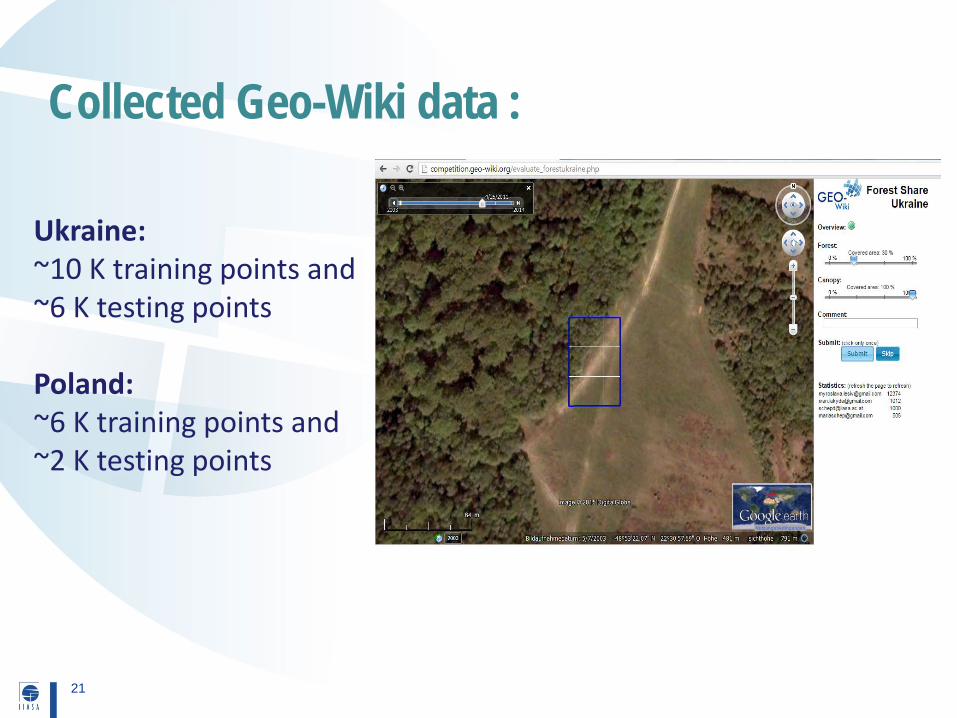
Collected Geo-Wiki data :
21
Ukraine: ~10 K training points and ~6 K testing points Poland: ~6 K training points and ~2 K testing points
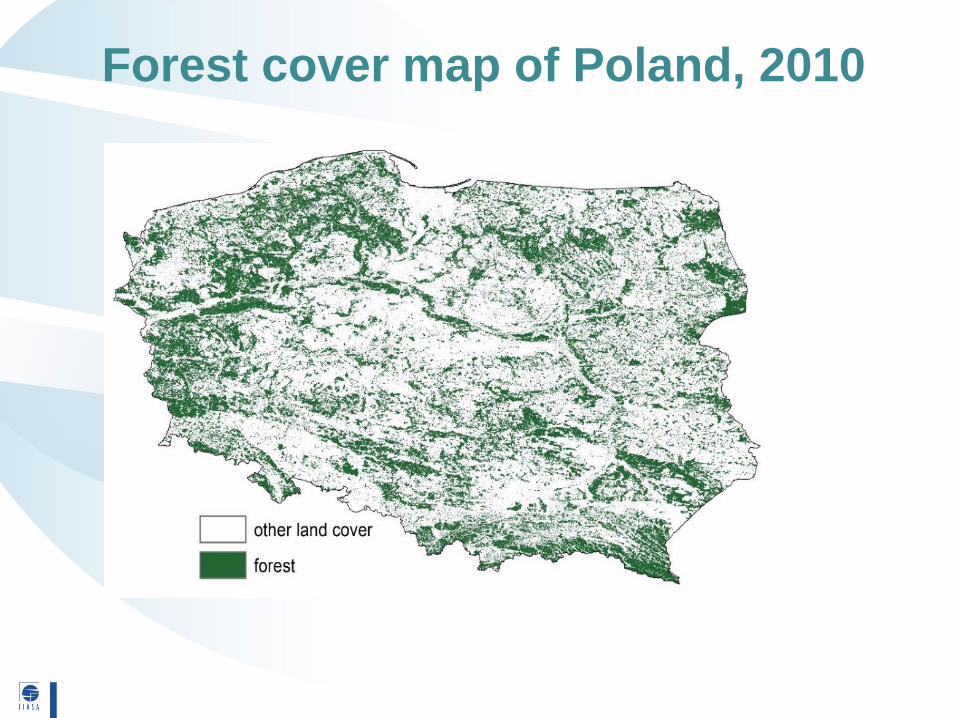
Forest cover map of Poland, 2010
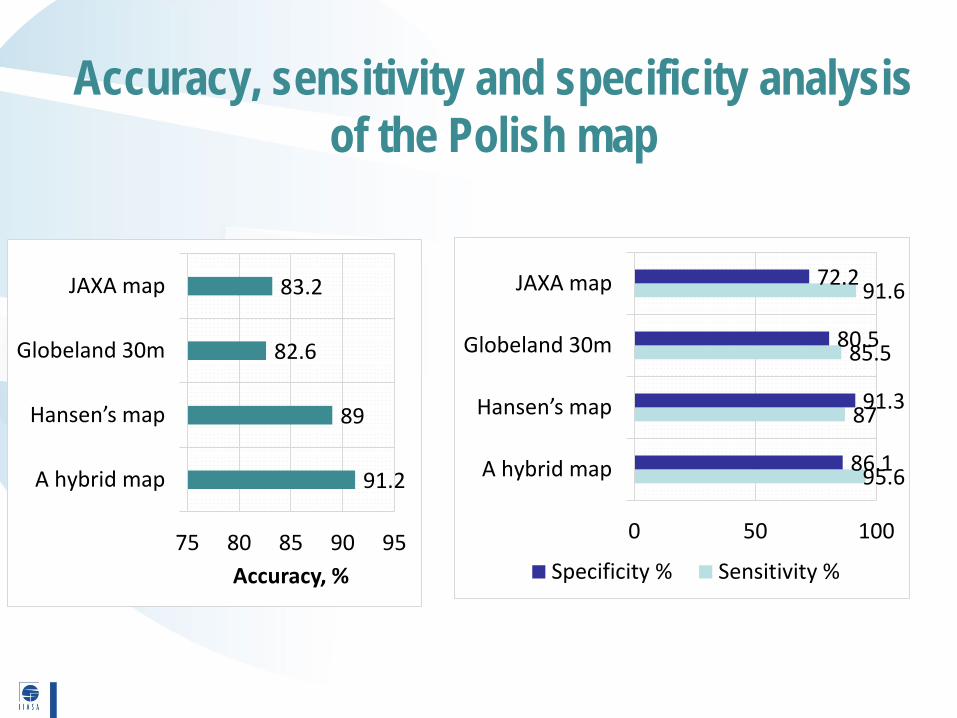
Accuracy, sensitivity and specificity analysis of the Polish map
91.2
89
82.6
83.2
75 80 85 90 95
A hybrid map
Hansen’s map
Globeland 30m
JAXA map
Accuracy, %
95.6
87
85.5
91.6
86.1
91.3
80.5
72.2
0 50 100
A hybrid map
Hansen’s map
Globeland 30m
JAXA map
Specificity % Sensitivity %
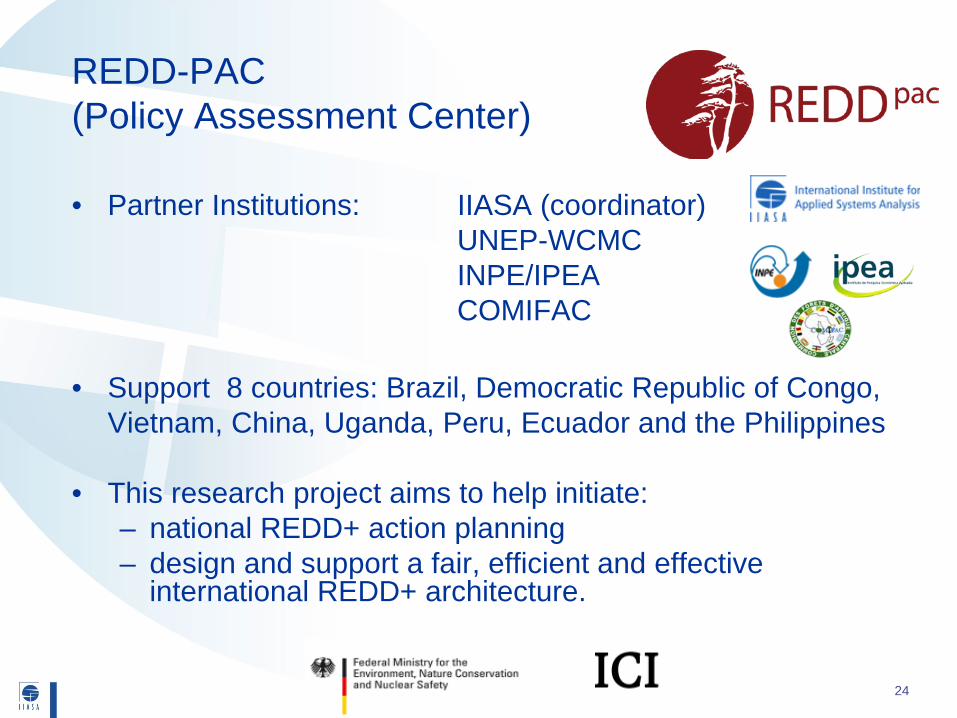
REDD-PAC (Policy Assessment Center)
• Partner Institutions: IIASA (coordinator)
UNEP-WCMC INPE/IPEA COMIFAC
• Support 8 countries: Brazil, Democratic Republic of Congo,
Vietnam, China, Uganda, Peru, Ecuador and the Philippines
• This research project aims to help initiate: – national REDD+ action planning – design and support a fair, efficient and effective
international REDD+ architecture.
24
Datasets used to compute future deforestation and related emissions with
GLOBIOM
• Land cover maps • Past land cover changes • Agricultural statistics (crops and livestock) • Biomass maps • (others: infrastructures, population, …)
25
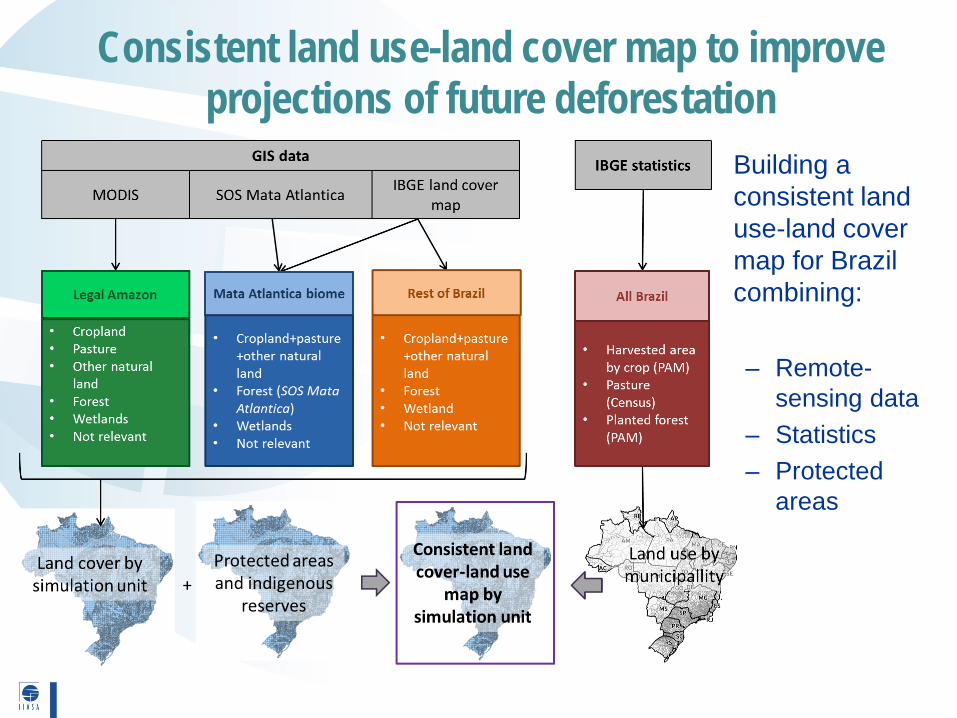
• Text • Building a consistent land use-land cover map for Brazil combining: – Remote-
sensing data – Statistics – Protected
areas
Consistent land use-land cover map to improve projections of future deforestation
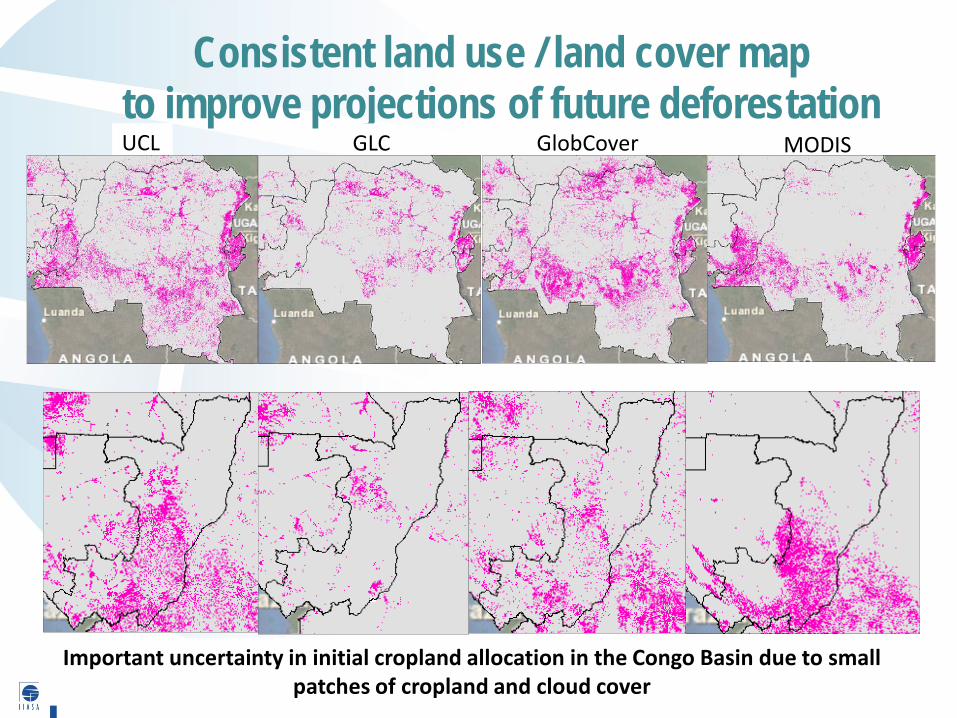
Consistent land use / land cover map to improve projections of future deforestation
27
GLC GlobCover MODIS UCL
Important uncertainty in initial cropland allocation in the Congo Basin due to small patches of cropland and cloud cover
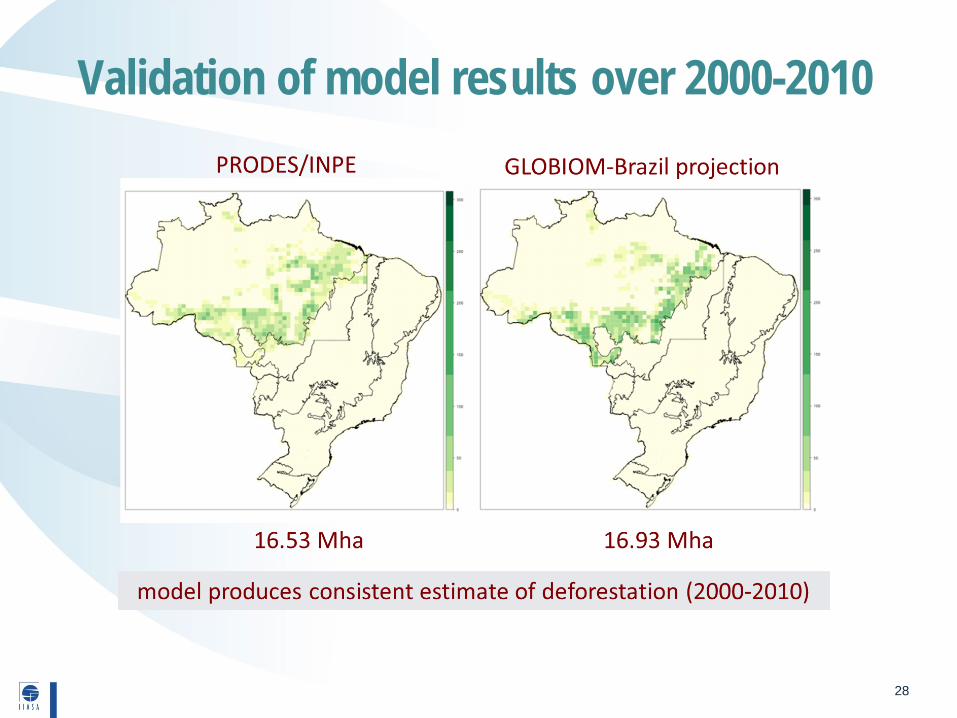
Validation of model results over 2000-2010
28
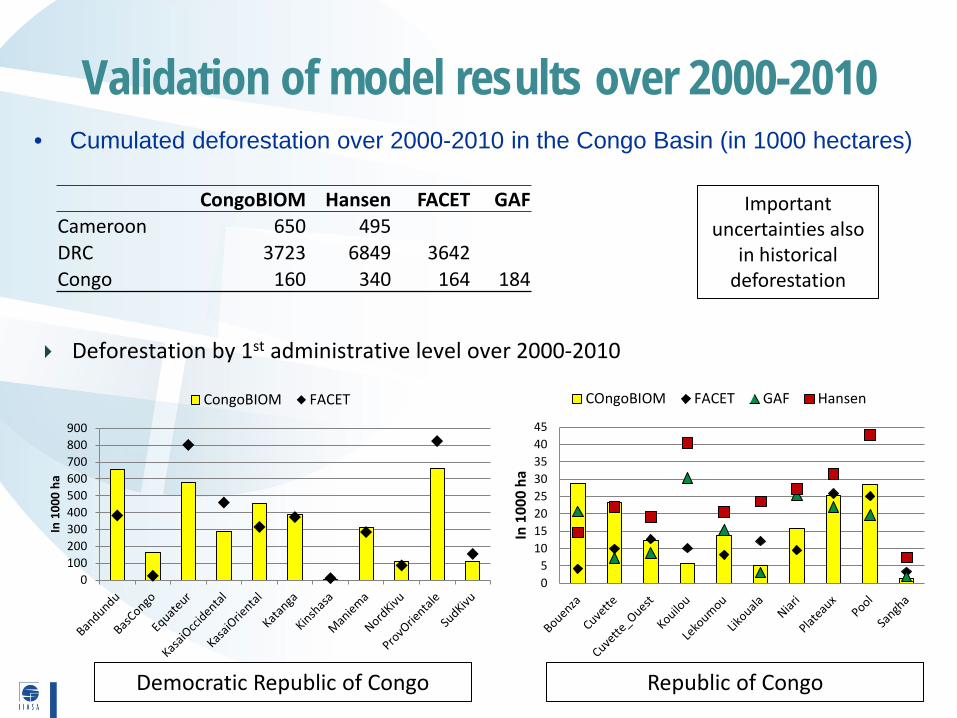
Validation of model results over 2000-2010
29
• Cumulated deforestation over 2000-2010 in the Congo Basin (in 1000 hectares)
CongoBIOM Hansen FACET GAF Cameroon 650 495 DRC 3723 6849 3642 Congo 160 340 164 184
0100200300400500600700800900
In 1
000
ha
CongoBIOM FACET
Democratic Republic of Congo
05
1015202530354045
In 1
000
ha
COngoBIOM FACET GAF Hansen
Deforestation by 1st administrative level over 2000-2010
Republic of Congo
Important uncertainties also
in historical deforestation
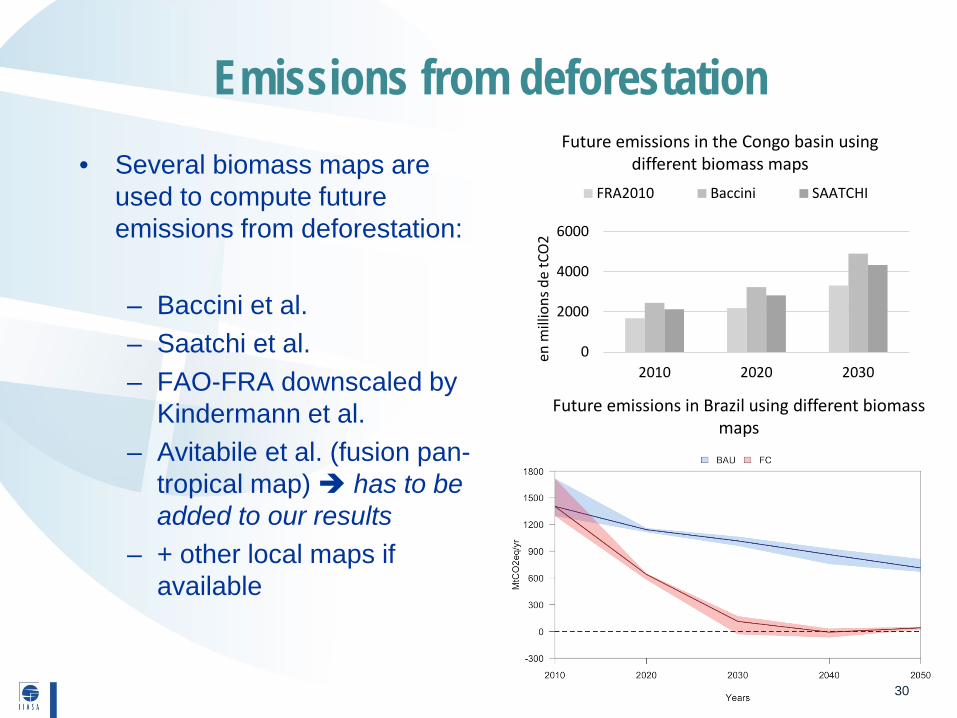
• Several biomass maps are used to compute future emissions from deforestation: – Baccini et al. – Saatchi et al. – FAO-FRA downscaled by
Kindermann et al. – Avitabile et al. (fusion pan-
tropical map) has to be added to our results
– + other local maps if available
30
Emissions from deforestation
0
2000
4000
6000
2010 2020 2030
en m
illio
ns d
e tC
O2
FRA2010 Baccini SAATCHI
Future emissions in the Congo basin using different biomass maps
Future emissions in Brazil using different biomass maps
Possible collaboration
• Participate (with your students) in crowdsourcing campaigns
• Get involved in sharing in situ data within International Forest Biomass Network
• Validate maps using Laco-Wiki
• Let’s collaborate in data analysis and producing new maps of better accuracy
32
Thank you for your attention
More information: http://geo-wiki.org http://www.iiasa.ac.at/web/home/research/modelsData/Geo-Wiki/Geo-Wiki.en.html
More readings:
Schepaschenko D, See L, Lesiv M, et al. (2015). Development of a global hybrid forest mask through the synergy of remote sensing, crowdsourcing and FAO statistics. Remote Sensing of Environment, 162:208-220.
See L, Fritz S, Perger C, Schill C, McCallum I, Schepaschenko D etc. (2015). Harnessing the power of volunteers, the internet and Google Earth to collect and validate global spatial information using Geo-Wiki. Technological Forecasting and Social Change
Fritz S, McCallum I, Schill C, Perger C, See L, Schepaschenko D, Kraxner F, Obersteiner M (2012). Geo-Wiki: An online platform for improving global land cover. Environmental Modelling and Software. V.31: 110-123 .


