26
IIASA A. Grübler, 2000 Technology in a Carbon Constrained World Arnulf Grübler [email protected] SHELL Workshop, London September 19-21, 2000
| Date post: | 18-Dec-2015 |
| Category: |
Documents |
| View: | 215 times |
| Download: | 2 times |
IIASA A. Grübler, 2000
Technology in a Carbon Constrained World
Arnulf Grübler
SHELL Workshop, London
September 19-21, 2000
IIASA A. Grübler, 2000
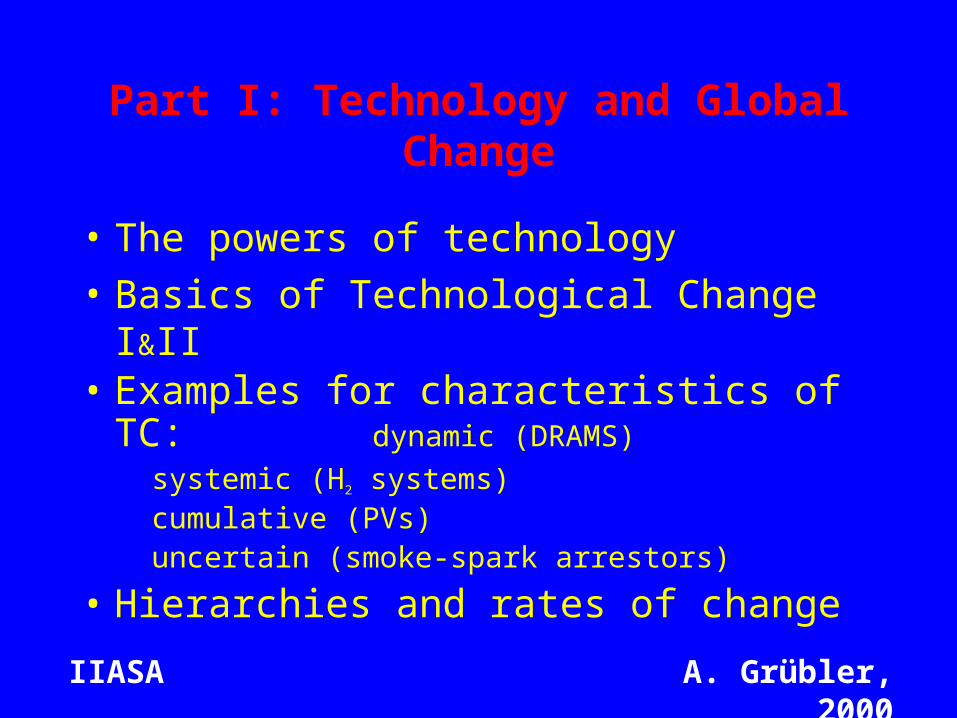
Part I: Technology and Global Change
• The powers of technology
• Basics of Technological Change I&II• Examples for characteristics of TC:
dynamic (DRAMS) systemic (H2 systems) cumulative (PVs) uncertain (smoke-spark arrestors)
• Hierarchies and rates of change

IIASA A. Grübler, 2000
Factors of Growth: The Last 200 Years
1800 2000 factor
World population,billion
1 6 x 6
Life expectancy, years* 35 75 x 2Work hours per year* 3,000 1,500 2Free time over life* 70,000 300,000 x 4
Mobility, km/day* (excl. walk)
0.04 40 x 1000
World income, trillion $ 0.5 36 x 70Global energy use, Gtoe 0.3 10 x 35Carbon, energy, GtC 0.3 6 x 22Carbon, all sources,
GtC0.8 8 x 10

IIASA A. Grübler, 2000
Dimensions of Global Change AD 2000
Land
106 km
2Water
km3
Materials
109 t
Energy Carbon
103
EJ GtC
Human 47 3.000 <140 0.4 <9 +7
Natural 84 10.000 <25 5440 ~600 --2
as % 56% 30% 560% 0.01% ~1% 300%
c:\leoben\global_change_shell.doc
Net source sink
Land - use vs. availabilityWater - use vs. surface water runoffMaterials - total materials used (40 Gt) and moved (100 Gt) vs. material transported by riversEnergy - global primary energy use vs. solar influxCarbon - sum of annual exchanges between reservoirs (bi-directional) vs. gross emissions
Source: Turner et al., 1990; IPCC, 1996; Grübler, 1998.

IIASA A. Grübler, 2000
Basics of Technological Change I:
• Technology = H+S+O = hardware + software + “orgware”
• Most important single factor of productivity and economic growth
• Source and remedy of adverse impacts
• Hierarchical levels of change (increasing size = slower diffusion)
IIASA A. Grübler, 2000
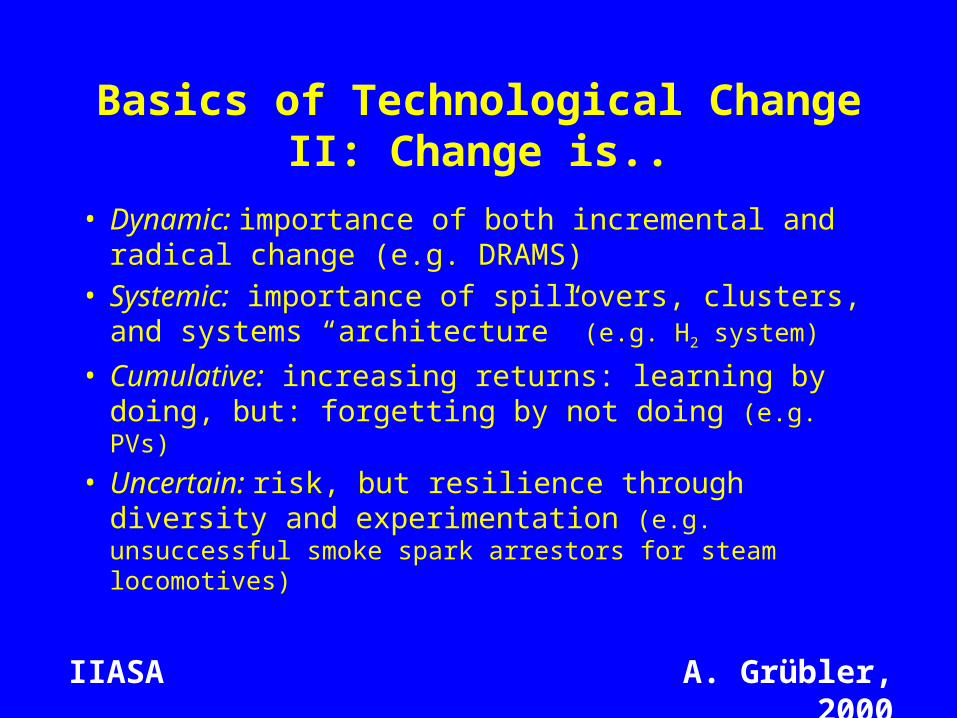
Basics of Technological Change II: Change is..
• Dynamic: importance of both incremental and radical change (e.g. DRAMS)
• Systemic: importance of spillovers, clusters, and systems “architecture” (e.g. H2 system)
• Cumulative: increasing returns: learning by doing, but: forgetting by not doing (e.g. PVs)
• Uncertain: risk, but resilience through diversity and experimentation (e.g. unsuccessful smoke spark arrestors for steam locomotives)

IIASA A. Grübler, 2000
DRAMs
• Key technology for increased computing performance
• Market size: ~30 billion $• Moore’s Law holds for >30 years
(self-fulfilling prophecy)• Density: doubles every 18-21 months
1kB to 1GB = x106• Cost decline ($/bit): a factor >100,000 !

IIASA A. Grübler, 2000
DRAMS: Memory Size
1.0E+03
1.0E+04
1.0E+05
1.0E+06
1.0E+07
1.0E+08
1970 1975 1980 1985 1990 1995 2000
bit
s p
er
DR
AM
average solddoubling time: 21 months
market introduction*doubling time: 18 months
* f irst year sales exceed 105 units 1K
4K
16K
64K
256K
1M
4M
16M
64M
256M

IIASA A. Grübler, 2000
DRAMS: Prices

IIASA A. Grübler, 2000
A Possible H2 System
IIASA A. Grübler, 2000
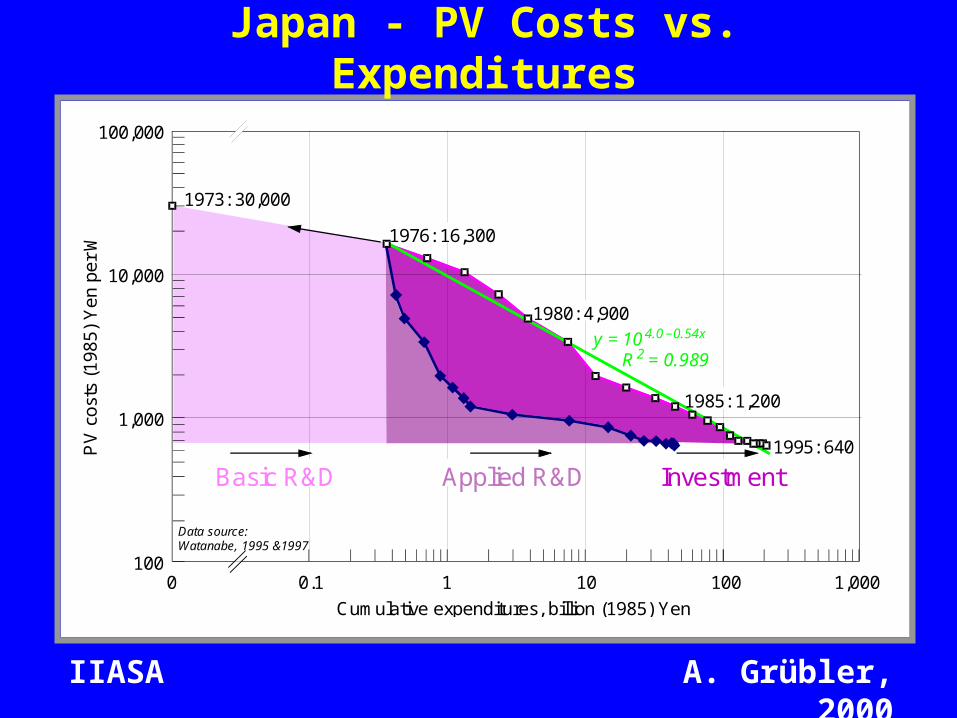
100
1,000
10,000
100,000
0 0.1 1 10 100 1,000
Cumulative expenditures, billion (1985) Yen
PV
co
sts
(19
85
) Y
en
pe
r W
1973: 30,000
y = 10 4.0 – 0.54x
R 2 = 0.989
1995: 640
Applied R&D InvestmentBasic R&D
1976: 16,300
1980: 4,900
1985: 1,200
Data source:Watanabe, 1995 &1997
Japan - PV Costs vs. Expenditures

IIASA A. Grübler, 2000
Technological Uncertainty: Patented but non-functional smoke-spark arrestors
Source: Basalla, 1988.

IIASA A. Grübler, 2000
Hierarchy of Technological Change
Technology = Hardware, Software, Orgware
Incremental (H)
Radical (Hn + S)
Systems (Hn + Sn + O)
Clusters & Families (Hn + Sn + On)
With increasing hierarchy (complexity):
larger market size, but slower diffusion.

IIASA A. Grübler, 2000
Hierarchies in Rates of Change
USA USSR t0 Δt t0 Δt
Total length of transportinfrastructure 1950 80 1980 80
Growth of railways 1830-1930 1930-1987
1858 Decline
54Decline
1890 1949
3744
Treated ties (USA) 1923 26Track electrification(USSR)
1965 27
Replacement of steamlocomotives 1950 12 1960 13
to = diffusion midpoint (50% completion rate)Δt = diffusion rate (years to grow from 10% to 90%)
IIASA A. Grübler, 2000
Part II: The GHG Economy: Challenges and Opportunities
• Challenges (e.g. unknown targets)
• Opportunities (e.g. continue decarbonization)
• Opportunities along hierarchy of TC
• An example: “Towngas” strategy
• Implications for SHELL

IIASA A. Grübler, 2000
Challenges
• Uncertain targets: long-term = unknown; short-term = not arguable
• No easy fix: pervasiveness of emissions (agriculture, energy, industry, land use, sewers, etc.)
• Extreme long time horizon: >100 yrs (act and see rather than see and act, mismatch between rhythms of climate change, socio-economic change, and politics)
• Externality not quantified (no binding targets = no price; future (ecosystems) damages: not quantifiable; damages < than costs with discounting; dilemma between intra- and inter-generational equity)
• Institutional settings not yet existing (“rules of the game”?, who decides?) with contradictory interests (global -- national; dominant -- emerging business)

IIASA A. Grübler, 2000
0
5
10
15
20
1990 2000 2010 2020 2030 2040 2050 2060 2070 2080 2090 2100
Car
bon
emission
s (G
tC y
r -1)
Year
550 ppmv (F = 1.1)550 ppmv (F = 0.6)550 ppmv (F = 2.6)F = 0.6 DT2x = 4.5F = 2.6 DT2x = 1.5
(2.6, 1.5)
(2.6, 2.5)
(1.1, 2.5)
(0.6, 2.5)
(0.6, 4.5)
(a)
0.1
1
10
100
1,000
10,000
1990 20002010 20202030 2040 2050 20602070 20802090 2100
CO
2 sh
adow
pric
e ($
per
ton
C)
Year
550 ppmv (F = 1.1)550 ppmv (F = 0.6)550 ppmv (F = 2.6)F = 0.6 DT2x = 4.5F = 2.6 DT2x = 1.5(not shown as zero)
(b)
A. Grübler, 2000k:\TNT2000\Arnulf|reprintfigs-transp-collandsc.dsf
Uncertainties in Stabilizing Climate at +2.5 ºC by 2100
IIASA A. Grübler, 2000
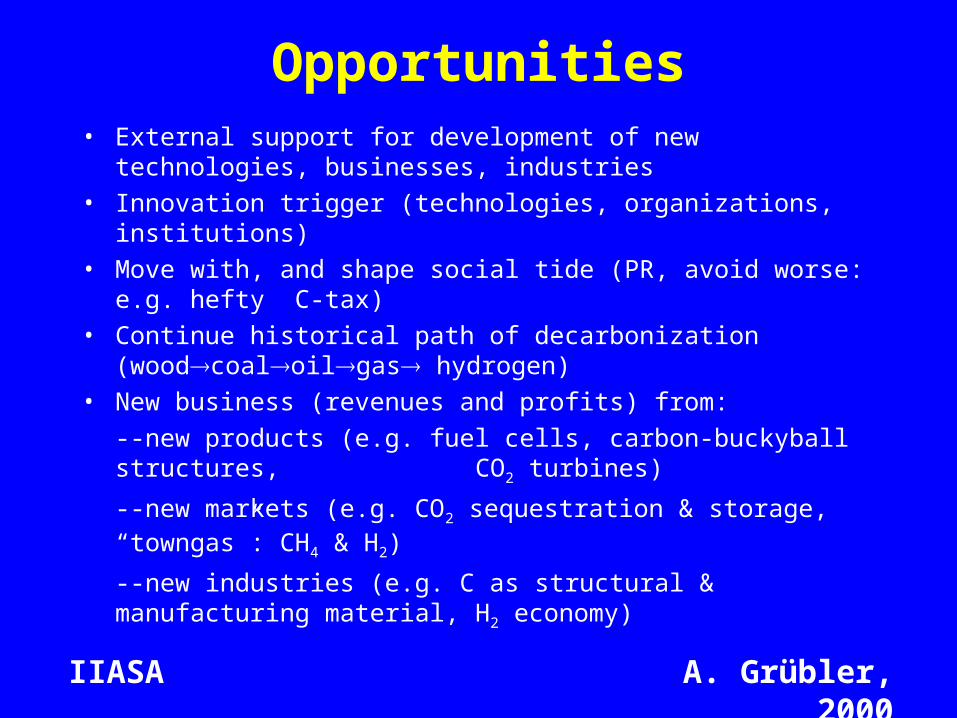
Opportunities• External support for development of new technologies,
businesses, industries• Innovation trigger (technologies, organizations, institutions)• Move with, and shape social tide (PR, avoid worse: e.g. hefty
C-tax)• Continue historical path of decarbonization
(woodcoaloilgas hydrogen)• New business (revenues and profits) from:
--new products (e.g. fuel cells, carbon-buckyball structures, CO2 turbines)
--new markets (e.g. CO2 sequestration & storage, “towngas”: CH4 & H2)
--new industries (e.g. C as structural & manufacturing material, H2 economy)

IIASA A. Grübler, 2000
Microchip
Television
Steamengine
Electricmotor
Gasolineengine
Vacuumtube
Commercialaviation
Nuclearenergy
1850 1900 1950 2000
Nuclear
HydroGasOil (incl. feedstocks)CoalTrad. renewables
Gto
e1.6 2.5 5.3
10
8
6
4
2
0
World primary energy use (Gtoe)
World population(billion)World Primary Energy Supply
IIASA A. Grübler, 2000
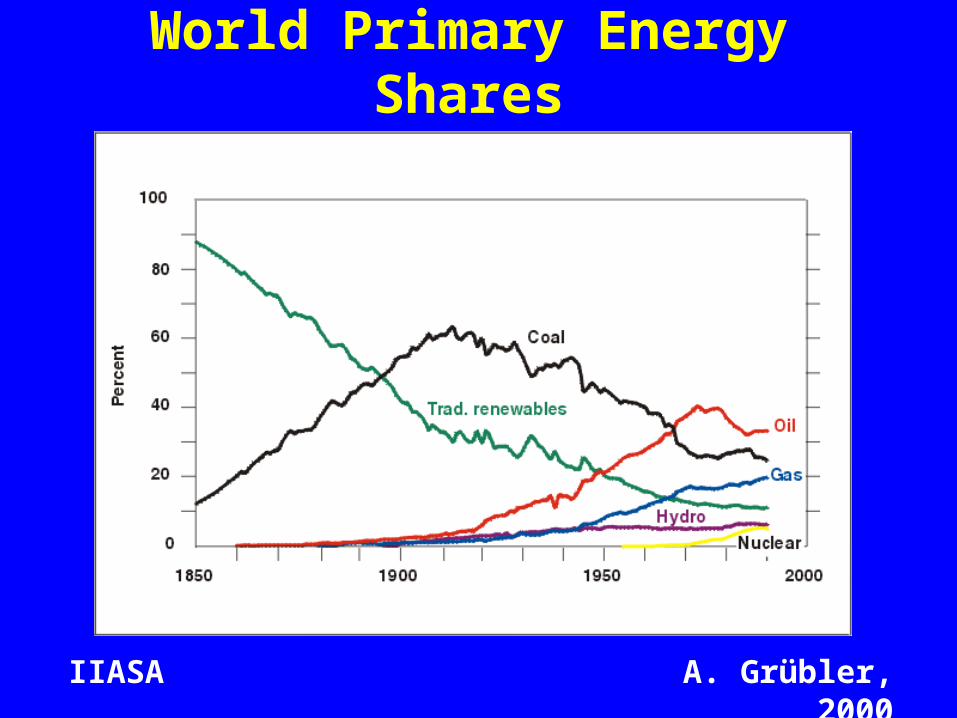
World Primary Energy Shares

IIASA A. Grübler, 2000
Decarbonization of Global Energy

IIASA A. Grübler, 2000
Hierarchies of ChangeT = H+S+O
• Incremental (H): e.g. CO2 capture from CO2-rich gas & reinjection; 3-litre car
• Radical (Hn+S): e.g. cheap&clean recovery of methane hydrates; CO2- turbine
• Systems change (Hn+Sn+O): e.g. CO2 market (sequestration + transport + disposal); “towngas” strategy
• Clusters, families, “paradigms” (Hn+Sn+On): e.g. H2 economy: H2 + FC = all energy services; consumers = utilities

IIASA A. Grübler, 2000
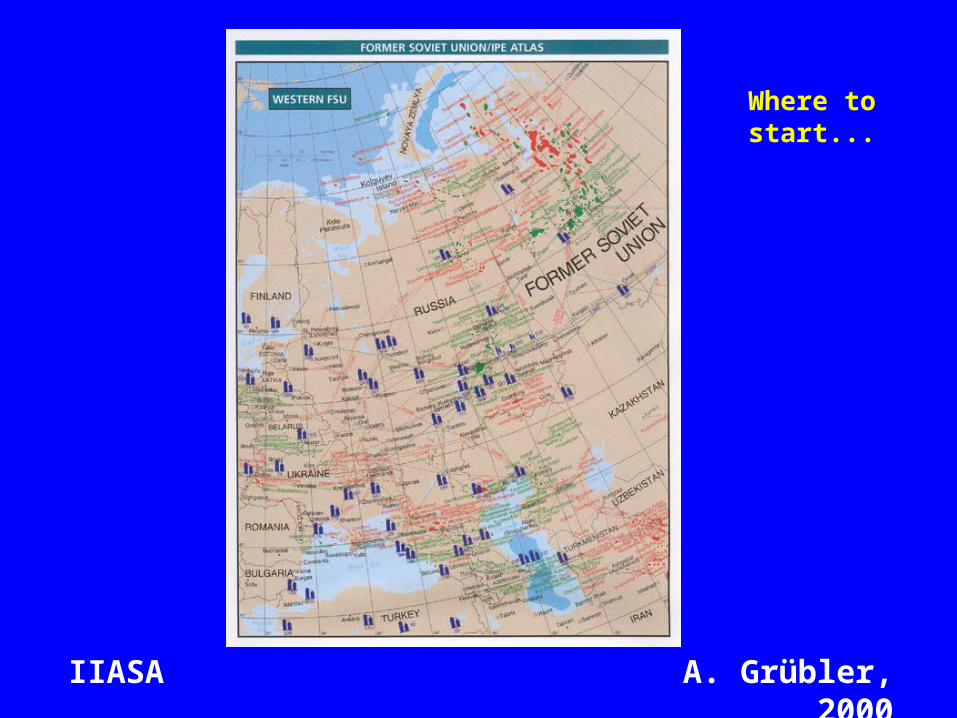
An (evolutionary) “Towngas” Strategy
• Location: close to major transit pipelines and old oilfields (e.g. West Ukraine)
• Steam reforming (endothermal - gas; later exothermal - nuclear)
• Towngas: CH4 + H2 (<30%)
• Transport to consumption centers in existing gas pipelines
• Membrane separation (H2FC; CH4gas turbines (with CO2 capture)
(C. Marchetti, 1989, Int.J.Hydrog.Energy 14(8):493-506)

IIASA A. Grübler, 2000
Methane Hydrogen
IIASA A. Grübler, 2000
Where to start...
IIASA A. Grübler, 2000
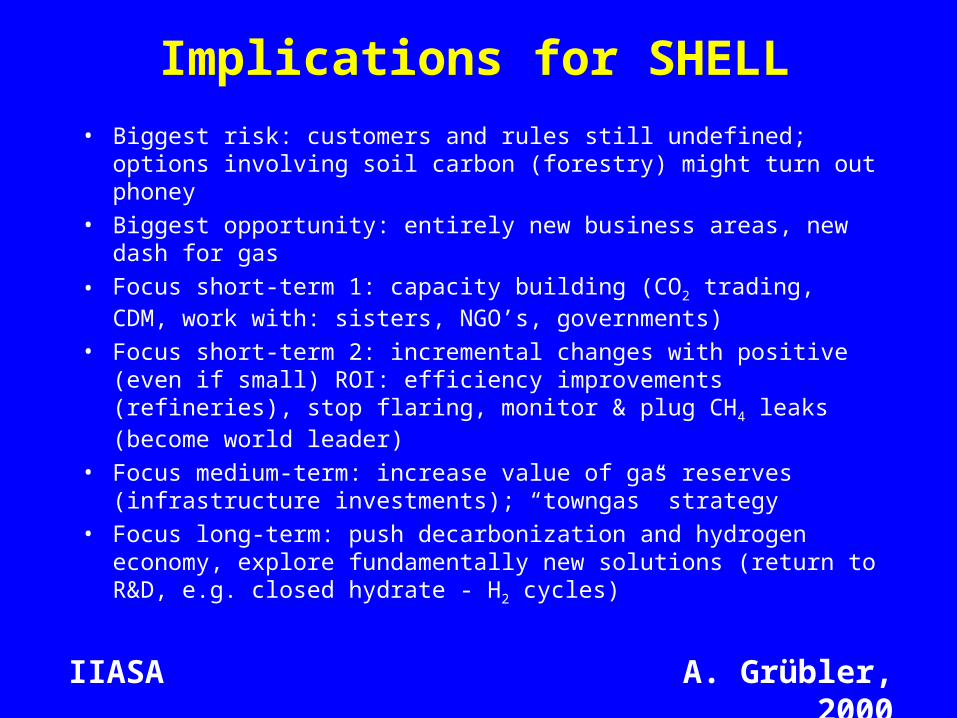
Implications for SHELL
• Biggest risk: customers and rules still undefined; options involving soil carbon (forestry) might turn out phoney
• Biggest opportunity: entirely new business areas, new dash for gas
• Focus short-term 1: capacity building (CO2 trading, CDM, work with: sisters, NGO’s, governments)
• Focus short-term 2: incremental changes with positive (even if small) ROI: efficiency improvements (refineries), stop flaring, monitor & plug CH4 leaks (become world leader)
• Focus medium-term: increase value of gas reserves (infrastructure investments); “towngas” strategy
• Focus long-term: push decarbonization and hydrogen economy, explore fundamentally new solutions (return to R&D, e.g. closed hydrate - H2 cycles)


