+ All Categories
Home > Documents > IID’s - caiso.com · 1 March 3, 2016 Imperial Irrigation District (IID) appreciates the...

IID’s - caiso.com · 1 March 3, 2016 Imperial Irrigation District (IID) appreciates the...

Date post: 22-Apr-2018
Category:
Upload: vukhue
View: 215 times
Download: 0 times
Share this document with a friend
18
1 March 3, 2016 Imperial Irrigation District (IID) appreciates the opportunity to comment on the California Independent System Operator (CAISO) presentation during its 2/18/16 Stakeholder meeting discussing the 2015-2016 Transmission Plan results and recommendations. IID’s comments are focused on the material related to IID Maximum Import Capability (MIC) and on the 50% Renewable Energy Special Study. 1. CAISO, in its 2013-2014 Transmission Plan page 143 made the following statement regarding IID Maximum Import Capability (MIC), “The ISO has established in accordance with Reliability Requirements BPM section 5.1.3.5 the target maximum import capability (MIC) from the Imperial Irrigation District (IID) to be 1,400 MW in year 2020 to accommodate renewable resources development in this area.” Further down on the same page CAISO explains the decrease in IID MIC primarily due to early retirement of SONGS but makes the following commitment, “However, the ISO is planning to identify further upgrades, as part of the 2014- 2015 transmission planning process that would be required to achieve the original 1,400 MW MIC target for IID.” It has been two years since the CAISO’s original commitment to restore IID MIC. IID would like to know what efforts CAISO has done or plans to do to meet its commitment? 2. Switching back to the current CAISO 2015-2016 Transmission Plan, CAISO states on page 280, Since all the constraints observed in Imperial zone can be mitigated by using SPS, the 2015-2016 policy-driven analysis confirms that the mitigation measures recommended in 2014-2016 TP have restored Imperial zone deliverability to ~1,700 to 1,800 MW.” If Imperial Zone deliverability have been “restored” then IID MIC should be back to its original value of 1400 MW in 2020. This Transmission Plan, on page 168 last paragraph, assigns IID MIC of 702 MW in 2020. How do you explain this discrepancy? 3. The deliverability numbers of 1700 to 1800 MW in Imperial Zone in the above paragraph are questionable. Imperial zone consists of 98% IID system and only 2% CAISO system. How much of this 1700-1800 MW were modeled in (or determined from) IID system? 4. IID’s internal studies have indicated that Imperial CREZ can actually accommodate up to about 2800 MW depending upon where generation is located while respecting the ECO- Miguel constrained path and Path 42 limits. Did CAISO consider the Locational Effectiveness Factor (LEF) for the generators while determining the 1700-1800 MW limit? 5. If CAISO would like to explore the LEF further, IID is recommending that CAISO take a lead and include other interested PTOs and / or Stakeholders including IID to identify
Transcript

1

March 3, 2016 Imperial Irrigation District (IID) appreciates the opportunity to comment on the California Independent System Operator (CAISO) presentation during its 2/18/16 Stakeholder meeting discussing the 2015-2016 Transmission Plan results and recommendations. IID’s comments are focused on the material related to IID Maximum Import Capability (MIC) and on the 50% Renewable Energy Special Study.

1. CAISO, in its 2013-2014 Transmission Plan page 143 made the following statement regarding IID Maximum Import Capability (MIC), “The ISO has established in accordance with Reliability Requirements BPM section 5.1.3.5 the target maximum import capability (MIC) from the Imperial Irrigation District (IID) to be 1,400 MW in year 2020 to accommodate renewable resources development in this area.” Further down on the same page CAISO explains the decrease in IID MIC primarily due to early retirement of SONGS but makes the following commitment, “However, the ISO is planning to identify further upgrades, as part of the 2014-2015 transmission planning process that would be required to achieve the original 1,400 MW MIC target for IID.”

It has been two years since the CAISO’s original commitment to restore IID MIC. IID would like to know what efforts CAISO has done or plans to do to meet its commitment?

2. Switching back to the current CAISO 2015-2016 Transmission Plan, CAISO states on

page 280, “Since all the constraints observed in Imperial zone can be mitigated by using SPS, the 2015-2016 policy-driven analysis confirms that the mitigation measures recommended in 2014-2016 TP have restored Imperial zone deliverability to ~1,700 to 1,800 MW.” If Imperial Zone deliverability have been “restored” then IID MIC should be back to its original value of 1400 MW in 2020. This Transmission Plan, on page 168 last paragraph, assigns IID MIC of 702 MW in 2020. How do you explain this discrepancy?

3. The deliverability numbers of 1700 to 1800 MW in Imperial Zone in the above paragraph are

questionable. Imperial zone consists of 98% IID system and only 2% CAISO system. How much of this 1700-1800 MW were modeled in (or determined from) IID system?

4. IID’s internal studies have indicated that Imperial CREZ can actually accommodate up to

about 2800 MW depending upon where generation is located while respecting the ECO-Miguel constrained path and Path 42 limits. Did CAISO consider the Locational Effectiveness Factor (LEF) for the generators while determining the 1700-1800 MW limit?

5. If CAISO would like to explore the LEF further, IID is recommending that CAISO take a

lead and include other interested PTOs and / or Stakeholders including IID to identify

2

the most promising locations for new renewables in the Imperial CREZ.

6. A discussion paper focusing on the use of Locational based methods to assess

Deliverability, prepared by ZGlobal on behalf of IID, is attached for reference.

7. On Page 208 of the Draft Transmission Plan, Table 3.4-3, the Greater Imperial Zone is estimated to have 2633 MW of Renewable resources (in-state portion). How much of this 2633 MW is considered or modeled within the IID service territory? Since IID service territory represents majority of the Imperial Zone, is it reasonable to include IID while modeling renewable resources within Imperial Zone?

1

An Analysis to Support Use of Locational Based Methods to Assess Deliverability

from the Imperial Valley

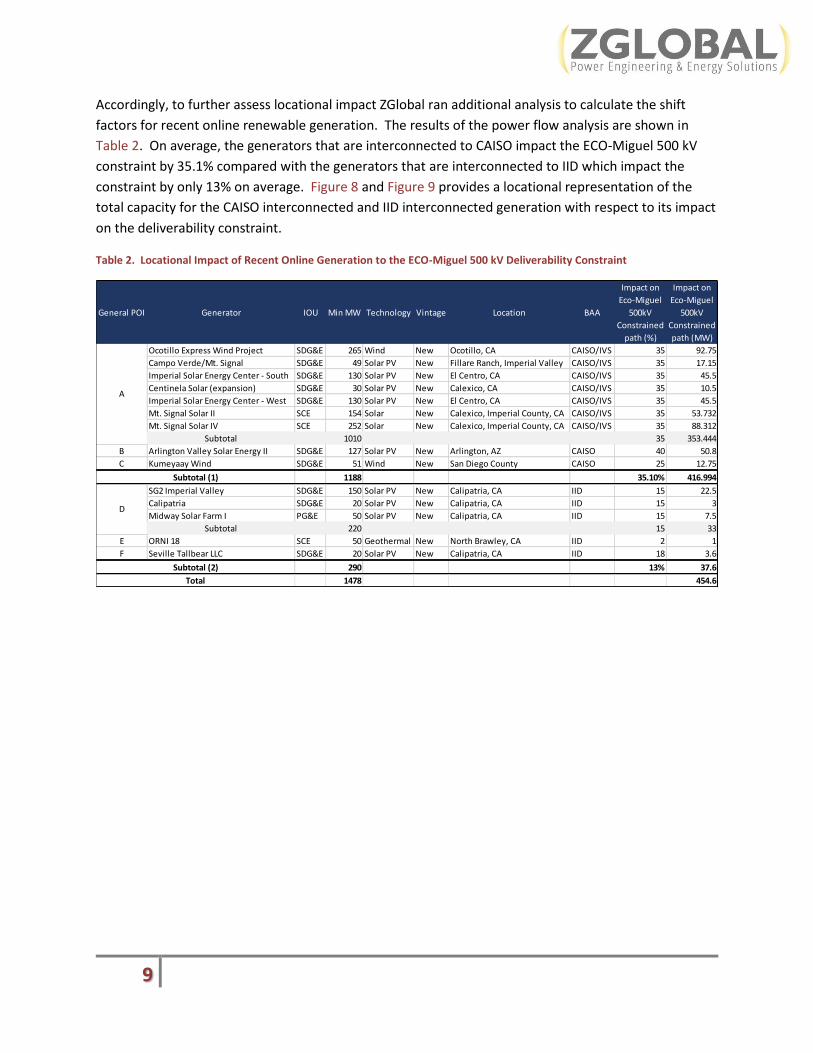
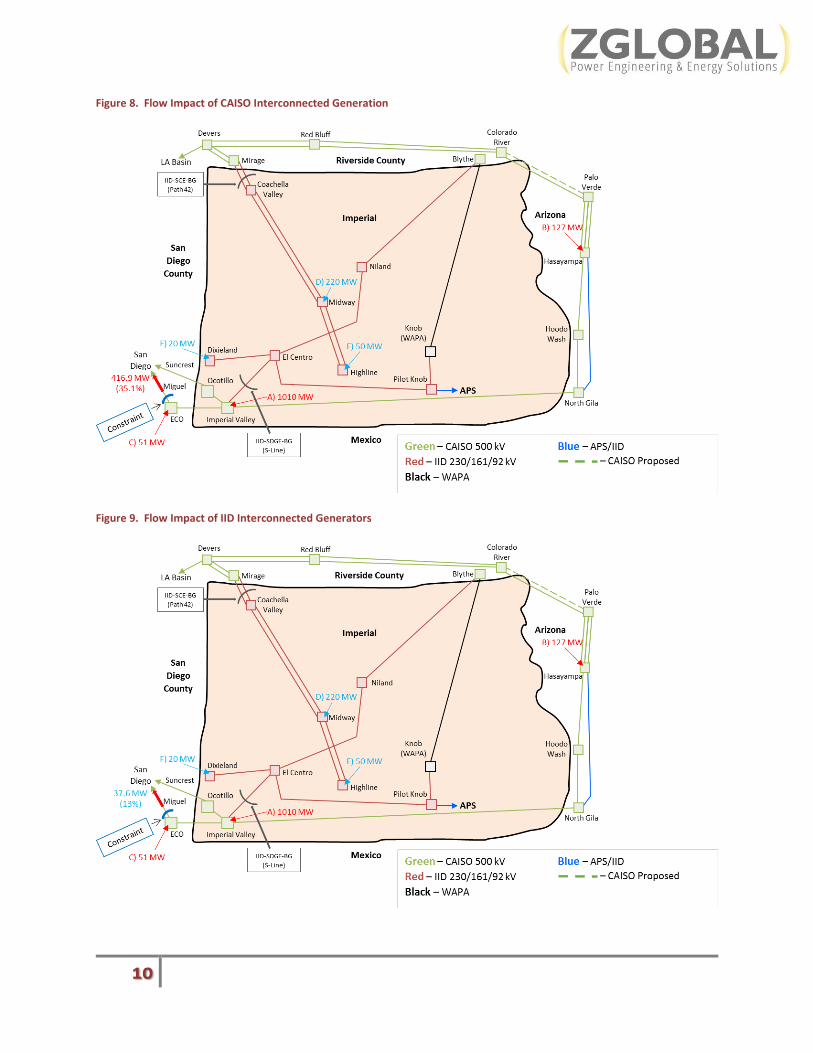
ZGlobal performed power flow and cost impact analysis to assess the locational effectiveness of

generator interconnections in the Imperial Valley area. The objective of this analysis is to quantify the

impact that location has when determining the “deliverability” of capacity from various locations in the

Imperial Valley area. “Deliverability” in this context refers to a resource’s ability to provide resource

adequacy capacity to aggregate load located in the CAISO Balancing Authority Area (BAA).

This paper will,

Provide background information on CAISO’s current deliverability assessment methodology and

discuss its potential inefficiencies,

Describe power flow analysis performed to quantify the impact of using a locational-based

methodology to assess deliverability from the Imperial Valley area, and

Provide data to quantify potential cost impact of existing CAISO method vs. locational-based

methods.

Background: CAISO Deliverability Assessments

Figure 1. Imperial Valley Area

2

Figure 1 is a rough geographic representation of the Imperial Valley area along with the major

transmission lines and corridors that would be expected to limit the deliverability of potential

generation to the CAISO BAA. As shown in the diagram, Imperial Valley generation can interconnect to

either CAISO’S or Imperial Irrigation District’s (IID) transmission system. The major substations for

CAISO include Imperial Valley and Ocotillo, while the major substations in IID include Coachella Valley, El

Centro, Dixieland, Midway and Highline.

In CAISO’s process, deliverability assessments are performed annually and consider various factors such

as changes to the system, new generation interconnection requests, and renewable energy

procurement targets to meet mandated state policy objectives. As stated in their “On-Peak

Deliverability Assessment Methodology,” the objective for the assessment is,

“…to determine if the aggregate of generation output in a given area can be simultaneously transferred to the remainder of ISO Control Area. Any generators requesting Full Capacity Deliverability Status in their interconnection request to the ISO Controlled Grid will be analyzed for “deliverability” in order to identify the Delivery Network Upgrades necessary to obtain this status. The ISO deliverability test methodology is designed to ensure that facility enhancements and cost responsibilities can be identified in a fair and nondiscriminatory manner.1”

Moreover, in the CAISO methodology, resources external to its BAA have an additional limiting

constraint placed on total imported energy by use of a Maximum Import Capability (MIC) target limit2.

The use of the MIC methodology fundamentally relies on historical import flows and CAISO-determined

target import limits rather than assessing import capability strictly based on the physics and locational

aspects of the interconnected transmission system. As a result, deliverability for resources imported to

CAISO from outside BAAs may be unnecessarily restricted. CAISO’s study methodology has particularly

impacted the deliverability results of Imperial Valley area generating resources which have

interconnections on both the CAISO’s and the Imperial Irrigation District’s (IID) transmission. Recent

deliverability assessments have resulted in zero (0) incremental capacity available for generators

interconnecting to IID’s transmission, whereas generation from resources interconnecting to CAISO grid

were deemed deliverable.3

1 http://www.caiso.com/Documents/On-PeakDeliverabilityAssessmentMethodology.pdf 2 Section 6.1.3.5, Deliverability of Imports, BPM for Reliability Requirements Version 28,

https://bpmcm.caiso.com/BPM%20Document%20Library/Reliability%20Requirements/BPM_for_Reliability_Requirements_V28_clean.docx.

3 Section 3.2.3 Resource adequacy import capability, Board Approved 2014-2015 Transmission Plan dated March 27, 2015, p. 150, http://www.caiso.com/Documents/Board-Approved2014-2015TransmissionPlan.pdf

3

The following explanations from CAISO illustrate their findings from their 2012-2013, 2013-2014 and

2014-2015 Transmission Planning process for deliverability from Imperial Valley4:

CAISO 2012-2013 Deliverability Assessment found that 1700 MW of new renewable generation

is deliverable from the Imperial Area assuming 938 MW from IID and 762 MW from CAISO. With

the existing Maximum Import Capability from IID to CAISO on the IID-SCE_BG being 462 MW,

this resulted in a target MIC of 1400 MW from IID. However, with the subsequent

announcement of SONGS generation retirement, CAISO determined that the 1700 MW

deliverability needed to be reduced to 0 MW (Figure 2).

Figure 2. 2012-2013 Deliverability Assessment

CAISO 2013-2014 Deliverability Assessment found that with approved transmission projects the

Imperial Area renewable portfolio of 1000 MW was achievable. Based on current project status

at the time of the studies, they noted that the 1000 MW deliverability was already used by

projects interconnecting to the CAISO. Thus, there is no additional deliverability allocation for

IID connected projects. Therefore, the CAISO did not increase MIC from the 462 MW level.

(Figure 3)

4 Technical Addendum to the July 2, 2014 Imperial County Transmission Consultation Draft Discussion Paper dated July 30,

2014, http://www.caiso.com/Documents/TechnicalAddendum-ImperialCountyDeliverability.pdf. Also, Section 3.2.3 of 2014-2015 Transmission Plan, dated March 27, 2015.

IIDTarget New Deliverable Gen

= 938 MW

CAISOTarget Deliverable Gen = 762 MW

MIC:IID-SDGE_BG = 0 MW

CURRENT MIC:IID-SCE_BG = 462 MW

Mirage

ImperialValley

Ocotillo

Imperial Renewable Generation Target* = 1700 MW (762 + 938)

Target IID MIC = 1400 MW(462 + 938 MW)

* With early retirement of SONGS, ISO changed its forecast for additional deliverability from Imperial from 1700 MW to 0 MW

4

Figure 3. 2013-2014 Deliverability Assessment

In CAISO’s 2014-2015 Deliverability Assessment, CAISO ran analysis for a 1000 MW deliverability

target for Imperial Valley as a base portfolio as well a sensitivity case for a 2500 MW target.

They determined that with the approved transmission project upgrades and recommended

mitigations, the Imperial Valley deliverability could be restored to the pre-SONGS retirement

levels (i.e. – 1700 – 1800 MW). However, they also noted that “potential additional renewable

generation development in the Imperial area may exceed remaining forecast deliverability given

the projects that are already in the ISO and IID interconnection processes.” More importantly

they concluded “the ISO will maintain the current 462 MW level of MIC from IID until West of

Devers upgrades are in place; at that time MIC will be increased by 200 MW in order to reflect

generation connecting to IID that have CPUC-approved PPAs with utilities in the ISO grid that

include resource adequacy capacity.” Additionally, assuming the potential for 1700 – 1800 MW

deliverability from Imperial Valley, they stated that about 850 – 1000 MW is connected to ISO

grid; thus, from a practical perspective only around 500 to 750 MW of additional generation

may be accommodated and this deliverability “may be shared between new resources not

already under PPA contract in the Imperial Zone (connected to either ISO or IID).”5 Despite

5 Table of Advisory Estimates for Future Resource Adequacy Import Capability Years 2015-2024, CAISO,

http://www.caiso.com/Documents/AdvisoryEstimates-FutureResourceAdequacyImportCapability_Years2015-2024.pdf

IIDTarget New Deliverable Gen =

0 MW

CAISOTarget Deliverable Gen = 1000 MW

MIC:IID-SDGE_BG = 0 MW

CURRENT MIC:IID-SCE_BG = 462 MW

Mirage

ImperialValley

Ocotillo

Imperial Renewable Generation Target* = 1000 MW (1000 + 0)

Target IID MIC = 442 MW(462 + 0 MW)

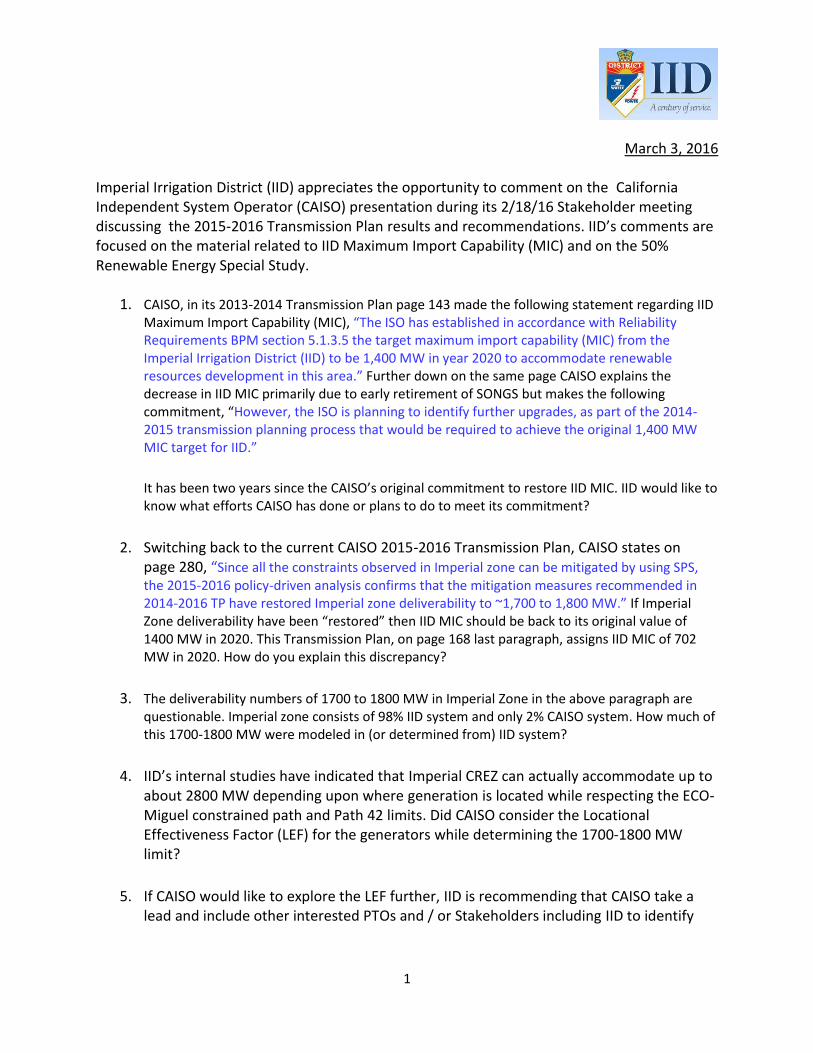
* Dependent on approved transmission projects and CAISO indicated that all of the 1000 MW generation target was used by CAISO interconnections thus there was no room to increase Target IID MIC.

5

noting that 500 to 750 MW of additional generation may be accommodated between CAISO and

IID, the MIC for future years beyond 2016 only accounted for an additional 200 MW. (Figure 4)

Figure 4. 2014-2015 Deliverability Assessment

CAISO’s explanation of its last 3 years of deliverability assessments highlights that the methodology does

not align deliverability allocation between CAISO and IID interconnections based on the actual physical

constraints of the two interconnected systems.

Impact of Using a Locational-based Methodology for Assessments

As stated earlier, the objective of CAISO deliverability assessments is to determine if new generation will

be able to provide its resource adequacy capacity to load located in the CAISO BAA. Scenarios or base

cases are developed to represent peak loading conditions and generation is dispatched per the criteria

described in the methodology’s Table 1, shown below:

IIDAdditional Deliverable Gen =

200 MW once West of Devers in-place

(Future MIC = 662 MW)

CAISODeliverable Gen = 850 - 1000 MW

2016 MIC:IID-SDGE_BG = 150 MW

2016 MIC:IID-SCE_BG = 391 MW

Mirage

ImperialValley

Ocotillo

Imperial Renewable Generation Target (Base) = 1000 MW (1000 + 0)Imperial Renewable Generation Target (Sensitivity)* = 1700-1800 MW

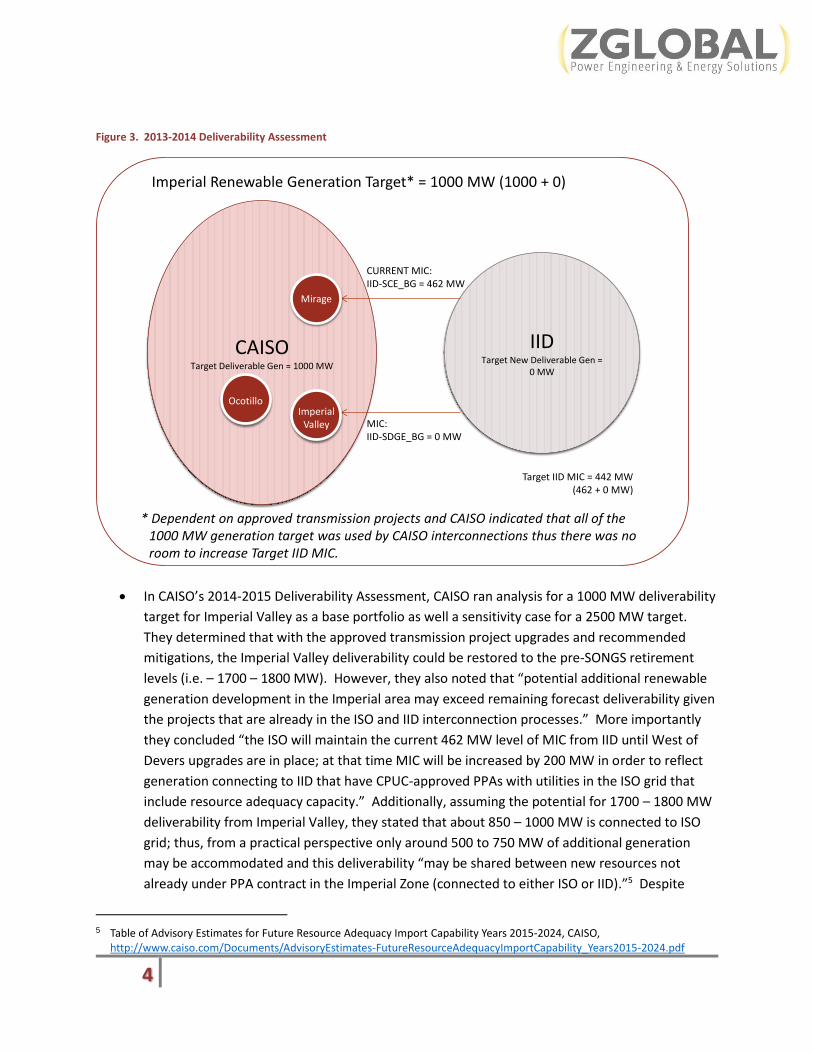
CAISO (850 to 1000) + IID (200) + (500 to 750 shared)

Target IID MIC = 541 MW(391 + 150 MW)

Target IID MIC for 2016 was adjusted to meet state policy goals for a total of 541 MW. Additional Deliverable Gen to increase IID MIC is dependent on West of Devers transmission upgrade. 500 to 750 MW additional may be shared between CAISO & IID.

6

Table 1: Resource Dispatch Assumptions (CAISO Deliverability Assessments)

Resource Type Base Case Dispatch

Available to Selectively Increase Output for Worst-Case Dispatch?

Available to Scale Down Output Proportionally with all Control Area Capacity Resources?

Existing Capacity Resources (Note 1)

80% to 95% of Summer Peak Net Qualified Capacity (NQC)

Y Up to 100% of NQC

Y

Proposed Full Capacity Resources (Note 2)

80% to 95% of Summer Peak Qualified Capacity (QC)

Y Up to 100% of QC

N

Energy-Only Resources Minimum commitment and dispatch to balance load and maintain expected imports

N Y

Imports (Note 3) Maximum summer peak simultaneous historical net imports by branch group

Load

• Non-pump load. 1 in 5 simultaneous peak load level for CAISO

N N

• Pump load Within expected range for Summer peak load hours (Note 4).

N N

Refer to CAISO’s ISO Generator Deliverability Assessment Methodology On-Peak Deliverability

Assessment Methodology for Resource Adequacy Purposes, Updated 4-10-2009 for an explanation of

Note 1 through 4.6

CAISO then performs a contingency analysis screening to identify if there are any potential limitations to

the target dispatch levels. For example, limitations could be due to transmission overloads or voltage

instability. For each limitation or “constraint” found, a 5% electrical circle is drawn around the

generators that contribute greater than 5% distribution factor flow impact to the constraint. The 5%

circle represents the relevant study area and additional power flows are performed by incrementally

increasing output of the contributing generators to find the worst dispatch level for the constraint.

When adjusting the output, CAISO’s notes starts “with units with the largest impact on the transmission

facility.” Once this constraint scenario is established, further analysis determines what mitigation is

required to allow for the deliverability of the impacted capacity.

What is not clear from CAISO methodology is the effectiveness of a generator’s location on resolving the

constraint. To further examine this, ZGlobal performed power flow analysis to illustrate the importance

6 http://www.caiso.com/Documents/On-PeakDeliverabilityAssessmentMethodology.pdf

7

of considering a generator’s locational impact when studying deliverability. An impedance diagram of

the Imperial Valley area and its vicinity is shown in Figure 5. Generators interconnecting to substations

in this area will have an impact on any deliverability constraints found with respect to delivering to load

in the CAISO BAA. As indicated in the diagram, the physical parameters of the system will dictate the

flow on the transmission system based on where generators inject power and thus have a different

effect on contributing or resolving a transmission bottleneck.

Figure 5. Impedance Diagram for Imperial Valley Area

For example, in its power flow analysis ZGlobal determined the ECO-Miguel 500 kV line to be a

constraint for deliverability from Imperial Valley. Power flow assessments were then run to calculate for

various generator locations its “Generator Shift Factor” with respect to contributing to the flow on the

ECO-Miguel 500 kV line. The Generator Shift Factor is a measure of the proportional flow on the ECO-

Miguel 500 kV when injecting 1 MW at the generator location to deliver 1 MW load in the CAISO BAA.

Figure 6 and Figure 7 illustrates the power flow results for injecting 100 MW at the CAISO’s Imperial

Valley and IID’s Coachella Valley substations respectively. Since 100 MW injection at Imperial Valley

substation contributes 34 MW flow on the ECO-Miguel 500 kV line, its shift factor is 0.34. Similarly, the

shift factor for generator at Coachella Valley is 0.02.

8

Figure 6. Impact of 100 MW Generator Interconnected at Imperial Valley Substation on ECO-Miguel 500 kV Constraint

Figure 7. Impact of 100 MW Generator Interconnected at Coachella Valley Substation on ECO-Miguel 500 kV Constraint

9

Accordingly, to further assess locational impact ZGlobal ran additional analysis to calculate the shift

factors for recent online renewable generation. The results of the power flow analysis are shown in

Table 2. On average, the generators that are interconnected to CAISO impact the ECO-Miguel 500 kV

constraint by 35.1% compared with the generators that are interconnected to IID which impact the

constraint by only 13% on average. Figure 8 and Figure 9 provides a locational representation of the

total capacity for the CAISO interconnected and IID interconnected generation with respect to its impact

on the deliverability constraint.

Table 2. Locational Impact of Recent Online Generation to the ECO-Miguel 500 kV Deliverability Constraint

General POI Generator IOU Min MW Technology Vintage Location BAA

Impact on

Eco-Miguel

500kV

Constrained

path (%)

Impact on

Eco-Miguel

500kV

Constrained

path (MW)

Ocotillo Express Wind Project SDG&E 265 Wind New Ocotillo, CA CAISO/IVS 35 92.75

Campo Verde/Mt. Signal SDG&E 49 Solar PV New Fillare Ranch, Imperial Valley CAISO/IVS 35 17.15

Imperial Solar Energy Center - South SDG&E 130 Solar PV New El Centro, CA CAISO/IVS 35 45.5

Centinela Solar (expansion) SDG&E 30 Solar PV New Calexico, CA CAISO/IVS 35 10.5

Imperial Solar Energy Center - West SDG&E 130 Solar PV New El Centro, CA CAISO/IVS 35 45.5

Mt. Signal Solar II SCE 154 Solar New Calexico, Imperial County, CA CAISO/IVS 35 53.732

Mt. Signal Solar IV SCE 252 Solar New Calexico, Imperial County, CA CAISO/IVS 35 88.312

Subtotal 1010 35 353.444

B Arlington Valley Solar Energy II SDG&E 127 Solar PV New Arlington, AZ CAISO 40 50.8

C Kumeyaay Wind SDG&E 51 Wind New San Diego County CAISO 25 12.75

1188 35.10% 416.994

SG2 Imperial Valley SDG&E 150 Solar PV New Calipatria, CA IID 15 22.5

Calipatria SDG&E 20 Solar PV New Calipatria, CA IID 15 3

Midway Solar Farm I PG&E 50 Solar PV New Calipatria, CA IID 15 7.5

Subtotal 220 15 33

E ORNI 18 SCE 50 Geothermal New North Brawley, CA IID 2 1

F Seville Tallbear LLC SDG&E 20 Solar PV New Calipatria, CA IID 18 3.6

290 13% 37.6

1478 454.6Total

A

Subtotal (1)

D

Subtotal (2)

10

Figure 8. Flow Impact of CAISO Interconnected Generation

Figure 9. Flow Impact of IID Interconnected Generators

11

The power flow analysis demonstrates that quantifying the locational effects of generator output should

be considered when assessing deliverability. The data shows that there could be more deliverability

from the entire Imperial Valley area if more generators were located at points that have lower impact to

the identified constraints. This concept of studying the locational impacts is already used by CAISO

when assessing deliverability for the LA Basin and San Diego to meet local reliability needs. The final

Board approved 2014-2015 Transmission Plan, provides a table of locational effectiveness factors for

buses in the LA Basin and San Diego areas that are helpful to lower the loading concerns of the major

constraints causing local reliability concerns in the area. CAISO further notes that the purpose of

calculating the LEF’s is to ”…determine existing resources’ effectiveness in mitigating post-transient

voltage instability; or determine the LEFs of new proposed potential resources to mitigate a reliability

concern. The latter was the focus of interest of the load serving entities (LSEs) as well as of the

generation developers who would like to propose their projects as part of the LSE’s procurement

process.” 7 Since they have adopted this approach to study local area reliability needs, it seems logical

that the same concept can be used to assess deliverability from the Imperial Valley area.

To further support use of a locational-based methodology, ZGlobal continued with its analysis by

quantifying an optimal resource dispatch that maximizes the total delivery from both the CAISO and IID

BAAs while assuring transmission constraints are mitigated. As described in Figure 10, incorporating the

locational effectiveness of generator locations allowed the total deliverability from Imperial Valley to

increase to 2883 MW compared with CAISO’s 2014-2015 assessment of 1700 – 1800 MW. Also, the

deliverability allocation between the CAISO BAA and the IID BAA was 1525 MW and 1358 MW compared

with 1000 MW and 662 MW respectively. This exercise demonstrates that incorporating a locational-

based assessment has the advantage of maximizing the efficiency of interconnected transmission grid.

7 Section 3.3. Locational Effectiveness Factors, Board Approved 2014-2015 ISO Transmission Plan dated March 27, 2015, p.152,

, http://www.caiso.com/Documents/Board-Approved2014-2015TransmissionPlan.pdf

12

Figure 10. ZGlobal’s Locational-based Deliverability Assessment Results

IIDDeliverable Gen = 1358 MW

CAISODeliverable Gen = 1525 MW

Optimal Flow:IID-SDGE_BG = 0 - 200 MW

Optimal Flow:IID-SCE_BG = 1158 - 1358 MW

Mirage

ImperialValley

Ocotillo

Imperial Renewable Generation Target = 2883 MW

Target IID MIC = 541 MW(391 + 150 MW)

ZGlobal’s power flow results increase deliverability from 1700 MW (2014-2015 CAISO results) to 2883 MW. Also, it maximizes deliverability from both the CAISO and IID BAAs.

13

Cost Impact of Current Deliverability Targets

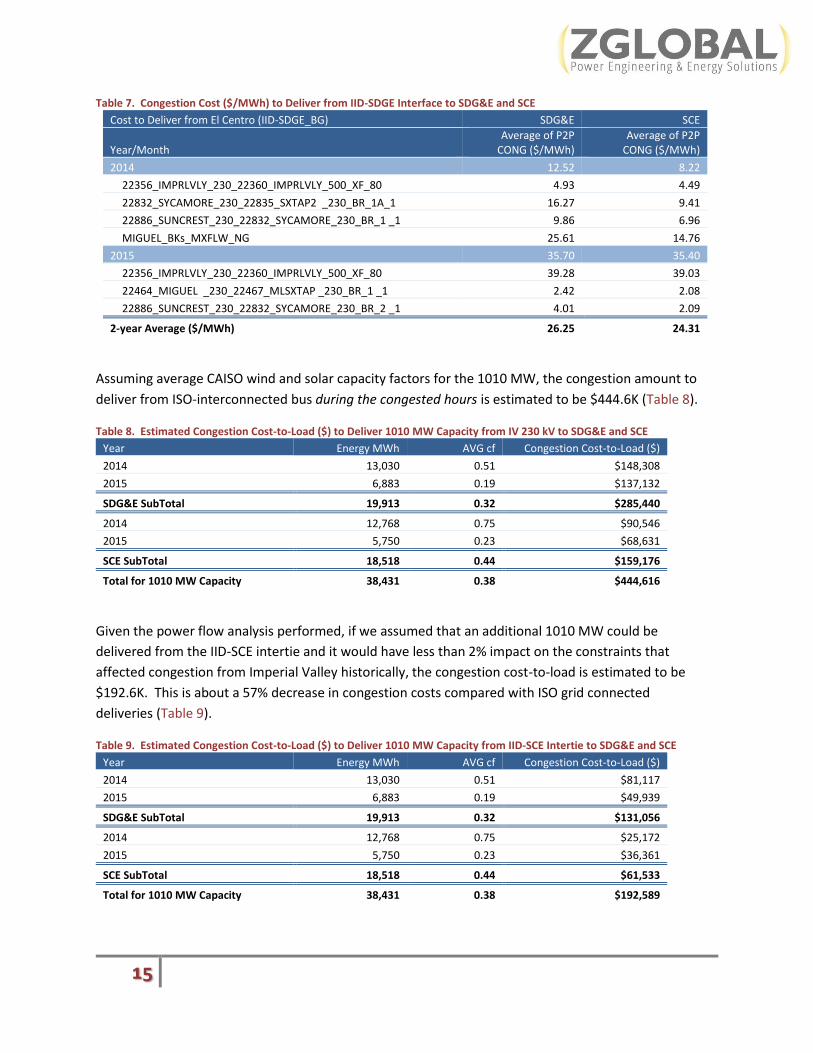
Approximately 1010 MW of new renewable capacity has been interconnected to ISO grid since 2013

(Table 3).

Table 3. New Generation Interconnections to ISO Grid

The higher concentration of area resources connected to ISO grid at Imperial Valley substation is

potentially resulting in higher congestion costs to the SDG&E and SCE load areas. ZGlobal reviewed Day

Ahead Market congestion costs for 2014 and 2015 for the following constraints identified by CAISO in

the 2014-2015 Transmission Plan as a deliverability constraint impacting Imperial Valley area8:

Miguel 500/230 kV #1 or #2

Sycamore-Suncrest 230 kV #1 or #2

Suncrest 500/230 kV #1 or #2

IV-ECO 500 kV

ECO-Miguel 500 kV

Path 46

Of the six limiting constraints identified, 3 constraints were binding in the Day Ahead market for each of

the 2-year period as shown in Table 4:

Table 4. Historical Day Ahead Congestion Summary for Constraints Limiting Imperial Valley Area Deliverability

Year CONSTRAINT # of Congested

Hours AVG Shadow

Price ($/MWh)

2014 22356_IMPRLVLY_230_22360_IMPRLVLY_500_XF_80 10 7.66

22886_SUNCREST_230_22832_SYCAMORE_230_BR_1 _1 20 18.93

22832_SYCAMORE_230_22835_SXTAP2 _230_BR_1A_1 3 61.37

MIGUEL_BKs_MXFLW_NG 9 32.21

2014 Summary 42 22.12

2015 22356_IMPRLVLY_230_22360_IMPRLVLY_500_XF_80 55 69.40

22886_SUNCREST_230_22832_SYCAMORE_230_BR_2 _1 2 10.38

22464_MIGUEL _230_22467_MLSXTAP _230_BR_1 _1 4 11.72

2015 Summary 61 63.68

2-year Summary 103 46.73

8 Table 4.3-15: Base Portfolio deliverability assessment results-Imperial Valley Deliverability Constraints, 2014-2015 Board

Approved Transmission Plan dated March 27, 2015

General POI Generator IOU Min MW Technology Vintage Location BAA COD (in-service)

Ocotillo Express Wind Project SDG&E 265 Wind New Ocotillo, CA CAISO/IVS 7/30/2013

Campo Verde/Mt. Signal SDG&E 49 Solar PV New Fillare Ranch, Imperial Valley CAISO/IVS 10/22/2013

Imperial Solar Energy Center - South SDG&E 130 Solar PV New El Centro, CA CAISO/IVS 10/11/2013

Centinela Solar (expansion) SDG&E 30 Solar PV New Calexico, CA CAISO/IVS 8/15/2014

Imperial Solar Energy Center - West SDG&E 130 Solar PV New El Centro, CA CAISO/IVS 1/17/2015

Mt. Signal Solar II SCE 154 Solar New Calexico, Imperial County, CA CAISO/IVS 2015

Mt. Signal Solar IV SCE 252 Solar New Calexico, Imperial County, CA CAISO/IVS 3/4/2014

Subtotal 1010

A

14

During hours of the constraint, the relevant load serving entity effectively pays congestion costs to move

energy from the ISO interconnection point at ISO’s Imperial Valley 230 kV station to its demand. This

congestion cost is quantified at the difference between the marginal cost of congestion (MCC) at the

sink and source. In the case of the renewable energy in Table 3 the source price is effectively the MCC

at Imperial Valley 230 kV substation and the sink price is either the Default Load Aggregation Price

(DLAP) for SDG&E or SCE load areas published by CAISO for each market. During the hours of

congestion shown in Table 4, the 2-year average congestion cost to transfer energy from Imperial Valley

230 kV station to demand in SDG&E or SCE was $29.31/MWh and $27.38/MWh respectively (Table 5).

Table 5. Congestion Cost ($/MWh) to Deliver from Imperial Valley 230 kV to SDG&E and SCE

Cost to Deliver from IV 230 kV SDG&E SCE

Year Average of P2P

CONG ($/MWh) Average of P2P

CONG ($/MWh)

2014 11.25 6.95

22356_IMPRLVLY_230_22360_IMPRLVLY_500_XF_80 5.50 5.06

22832_SYCAMORE_230_22835_SXTAP2 _230_BR_1A_1 17.01 10.14

22886_SUNCREST_230_22832_SYCAMORE_230_BR_1 _1 10.16 7.27

MIGUEL_BKs_MXFLW_NG 18.12 7.27

2015 41.75 41.45

22356_IMPRLVLY_230_22360_IMPRLVLY_500_XF_80 45.97 45.73

22464_MIGUEL _230_22467_MLSXTAP _230_BR_1 _1 2.44 2.10

22886_SUNCREST_230_22832_SYCAMORE_230_BR_2 _1 4.34 2.42

2-year Average ($/MWh) 29.31 27.38

This congestion rent is 268 - 354% higher than deliveries from IID from the IID-SCE intertie at

Coachella/Mirage and 11-12% higher than from the IID-SDGE interface at El Centro. Congestion costs

from those two locations were $7.95/MWh and $6.02/MWh for deliveries from Coachella and

$26.25/MWh and $24.31/MWh for deliveries from El Centro. Table 6 and Table 7 summarize the point-

to-point costs by constraint and location.

Table 6. Congestion Cost ($/MWh) to Deliver from IID-SCE Interface to SDG&E and SCE

Cost to Deliver from Coachella (IID-SCE_BG) SDG&E SCE

Year Average of P2P

CONG ($/MWh) Average of P2P

CONG ($/MWh)

2014 6.22 1.92

22356_IMPRLVLY_230_22360_IMPRLVLY_500_XF_80 0.88 0.44

22832_SYCAMORE_230_22835_SXTAP2 _230_BR_1A_1 9.79 2.93

22886_SUNCREST_230_22832_SYCAMORE_230_BR_1 _1 4.41 1.51

MIGUEL_BKs_MXFLW_NG 14.97 4.12

2015 9.15 8.84

22356_IMPRLVLY_230_22360_IMPRLVLY_500_XF_80 9.84 9.60

22464_MIGUEL _230_22467_MLSXTAP _230_BR_1 _1 2.83 2.49

22886_SUNCREST_230_22832_SYCAMORE_230_BR_2 _1 2.65 0.73

2-year Average ($/MWh) 7.95 6.02

15

Table 7. Congestion Cost ($/MWh) to Deliver from IID-SDGE Interface to SDG&E and SCE

Cost to Deliver from El Centro (IID-SDGE_BG) SDG&E SCE

Year/Month Average of P2P

CONG ($/MWh) Average of P2P

CONG ($/MWh)

2014 12.52 8.22

22356_IMPRLVLY_230_22360_IMPRLVLY_500_XF_80 4.93 4.49

22832_SYCAMORE_230_22835_SXTAP2 _230_BR_1A_1 16.27 9.41

22886_SUNCREST_230_22832_SYCAMORE_230_BR_1 _1 9.86 6.96

MIGUEL_BKs_MXFLW_NG 25.61 14.76

2015 35.70 35.40

22356_IMPRLVLY_230_22360_IMPRLVLY_500_XF_80 39.28 39.03

22464_MIGUEL _230_22467_MLSXTAP _230_BR_1 _1 2.42 2.08

22886_SUNCREST_230_22832_SYCAMORE_230_BR_2 _1 4.01 2.09

2-year Average ($/MWh) 26.25 24.31

Assuming average CAISO wind and solar capacity factors for the 1010 MW, the congestion amount to

deliver from ISO-interconnected bus during the congested hours is estimated to be $444.6K (Table 8).

Table 8. Estimated Congestion Cost-to-Load ($) to Deliver 1010 MW Capacity from IV 230 kV to SDG&E and SCE

Year Energy MWh AVG cf Congestion Cost-to-Load ($)

2014 13,030 0.51 $148,308

2015 6,883 0.19 $137,132

SDG&E SubTotal 19,913 0.32 $285,440

2014 12,768 0.75 $90,546

2015 5,750 0.23 $68,631

SCE SubTotal 18,518 0.44 $159,176

Total for 1010 MW Capacity 38,431 0.38 $444,616

Given the power flow analysis performed, if we assumed that an additional 1010 MW could be

delivered from the IID-SCE intertie and it would have less than 2% impact on the constraints that

affected congestion from Imperial Valley historically, the congestion cost-to-load is estimated to be

$192.6K. This is about a 57% decrease in congestion costs compared with ISO grid connected

deliveries (Table 9).

Table 9. Estimated Congestion Cost-to-Load ($) to Deliver 1010 MW Capacity from IID-SCE Intertie to SDG&E and SCE

Year Energy MWh AVG cf Congestion Cost-to-Load ($)

2014 13,030 0.51 $81,117

2015 6,883 0.19 $49,939

SDG&E SubTotal 19,913 0.32 $131,056

2014 12,768 0.75 $25,172

2015 5,750 0.23 $36,361

SCE SubTotal 18,518 0.44 $61,533

Total for 1010 MW Capacity 38,431 0.38 $192,589

16

Deliveries from either ISO-connected or IID-connected generation is impacted by all system congestion.

Using 2015 actually hourly MCCs, the total congestion amount to deliver 1010 MW capacity to SDG&E

and SCE was estimated and compared for ISO-connected versus IID-connected generators delivering to

the IID-SCE or IID-SDGE interties. The results are shown in Table 10. Total congestion amount for 2015

for all hours is $3.59 million and $2.48 million to deliver from Imperial Valley 230 kV to SDG&E and SCE

respectively. This amount includes the congestion for all constraints in the system. In comparison, the

estimated congestion amount for deliveries from the IID-SCE intertie (Coachella) is $2.12 million and

$1.21 million which is a cost difference of between -$1.4 and -$1.2 million.

Table 10. Estimated 2015 Congestion Cost Comparison from Imperial Valley for 1010 MW Capacity

SINK SOURCE Energy

MWh AVG

cf

Annual Congestion

Cost ($)

Congestion Cost Delta

from IV230 ($)

AVG MCC @Source

MCC Diff from IV230

DLAP_SDGE-APND IMPRLVLY_2_B1 1,310,240 0.25 $3,590,108 -1.95

COACHELV_2_N101 1,310,240 0.25 $2,123,525 -$1,466,583 -1.03 0.92

ELCENTRO_2_N001 1,310,240 0.25 $3,233,806 -$356,301 -1.64 0.30

DLAP_SCE-APND IMPRLVLY_2_B1 909,074.4 0.26 $2,483,796 -1.95

COACHELV_2_N101 909,074.4 0.26 $1,212,748 -$1,271,047 -1.03 0.92

ELCENTRO_2_N001 909,074.4 0.26 $2,380,069 -$103,727 -1.64 0.30

ZGlobal recognizes that the overall system congestion prices might have been different had there been

1010 MW of capacity imported from Coachella and the dollar figures calculated are for illustrating the

potential magnitude of difference if the same 1010 MW were connected at the more northern areas of

IID. As explained earlier, the constraints impacting CAISO’s deliverability studies are all in the

transmission corridors connecting IID to SDG&E areas. Further, SCE and IID have planned transmission

upgrades that will support IID-SCE transfers of up to 1400 MW. So given the 2015 congestion prices,

and the power flow analysis that ISO-connected resources have higher impact on the constraints, it is

reasonable to assume that additional capacity imported at Coachella would not have significantly been

different than estimated above.

Assessment Summary

CAISO may be missing opportunities to maximize efficiency of interconnected transmission grid with its

current deliverability assessment study approach. Initial power flow analysis illustrates that use of a

locational-based study approach can be used to increase total deliverability of resources connecting to

both ISO and IID transmission systems for the benefit of all potential users of the interconnected grid.

Recent Congestion Cost analysis suggest that recent ISO-connected generation could be paying higher

costs when compared with costs to deliver from IID located resources. It is estimated that deliveries

from ISO-connections are paying up to 57% higher congestion costs than deliveries from IID via

Coachella and up to 10% higher congestion cost than deliveries from El Centro.


Recommended