45
9 772158 284007 8 0

9 772158 284007 80
International Journal of Clinical Medicine, 2016, 7, 519-557 Published Online August 2016 in SciRes. http://www.scirp.org/journal/ijcm
Table of Contents
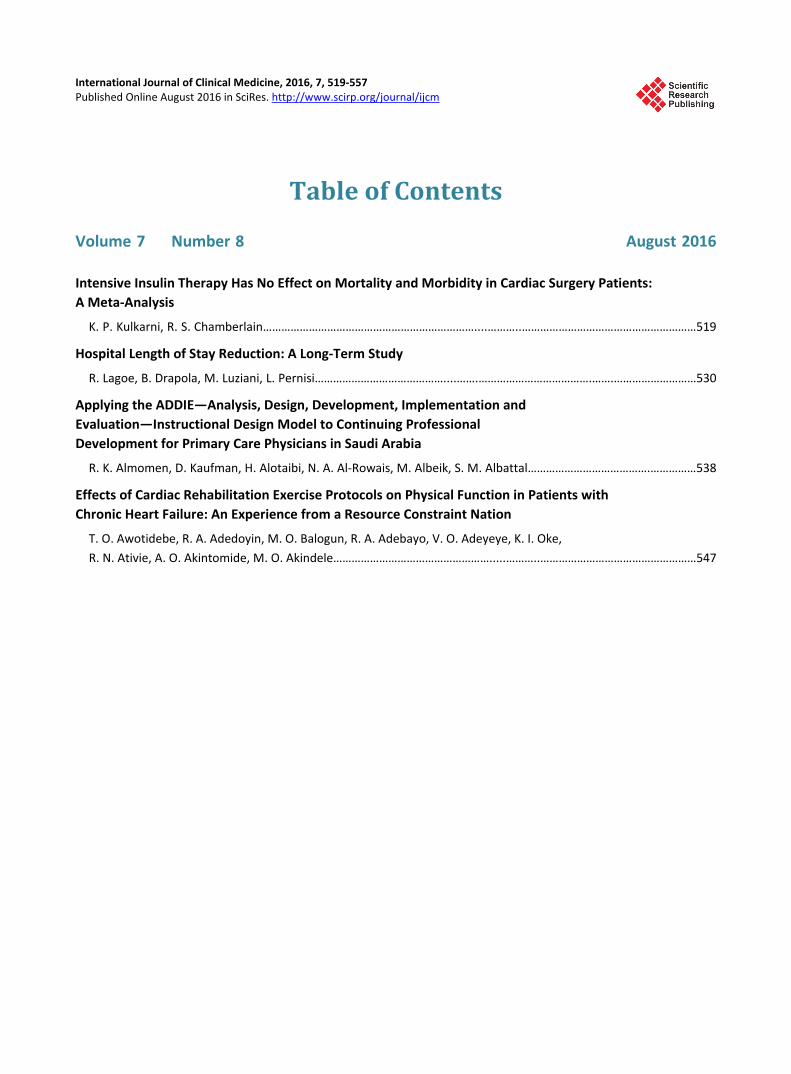
Volume 7 Number 8 August 2016 Intensive Insulin Therapy Has No Effect on Mortality and Morbidity in Cardiac Surgery Patients: A Meta-Analysis
K. P. Kulkarni, R. S. Chamberlain……………………………………………………………....………..…………………………………………………519
Hospital Length of Stay Reduction: A Long-Term Study
R. Lagoe, B. Drapola, M. Luziani, L. Pernisi……………………………………....…….……………………………….…….………………………530
Applying the ADDIE—Analysis, Design, Development, Implementation and Evaluation—Instructional Design Model to Continuing Professional Development for Primary Care Physicians in Saudi Arabia
R. K. Almomen, D. Kaufman, H. Alotaibi, N. A. Al-Rowais, M. Albeik, S. M. Albattal………………………………….……………538
Effects of Cardiac Rehabilitation Exercise Protocols on Physical Function in Patients with Chronic Heart Failure: An Experience from a Resource Constraint Nation
T. O. Awotidebe, R. A. Adedoyin, M. O. Balogun, R. A. Adebayo, V. O. Adeyeye, K. I. Oke, R. N. Ativie, A. O. Akintomide, M. O. Akindele…………………………………………….....………..……………………………………………547

International Journal of Clinical Medicine (IJCM)
Journal Information SUBSCRIPTIONS
The International Journal of Clinical Medicine (Online at Scientific Research Publishing, www.SciRP.org) is published monthly by Scientific Research Publishing, Inc., USA.
Subscription rates: Print: $79 per issue. To subscribe, please contact Journals Subscriptions Department, E-mail: [email protected]
SERVICES
Advertisements Advertisement Sales Department, E-mail: [email protected]
Reprints (minimum quantity 100 copies) Reprints Co-ordinator, Scientific Research Publishing, Inc., USA. E-mail: [email protected]
COPYRIGHT
COPYRIGHT AND REUSE RIGHTS FOR THE FRONT MATTER OF THE JOURNAL:
Copyright © 2016 by Scientific Research Publishing Inc.
This work is licensed under the Creative Commons Attribution International License (CC BY). http://creativecommons.org/licenses/by/4.0/
COPYRIGHT FOR INDIVIDUAL PAPERS OF THE JOURNAL:
Copyright © 2016 by author(s) and Scientific Research Publishing Inc.
REUSE RIGHTS FOR INDIVIDUAL PAPERS:
Note: At SCIRP authors can choose between CC BY and CC BY-NC. Please consult each paper for its reuse rights.
DISCLAIMER OF LIABILITY
Statements and opinions expressed in the articles and communications are those of the individual contributors and not the statements and opinion of Scientific Research Publishing, Inc. We assume no responsibility or liability for any damage or injury to persons or property arising out of the use of any materials, instructions, methods or ideas contained herein. We expressly disclaim any implied warranties of merchantability or fitness for a particular purpose. If expert assistance is required, the services of a competent professional person should be sought.
PRODUCTION INFORMATION
For manuscripts that have been accepted for publication, please contact: E-mail: [email protected]

International Journal of Clinical Medicine, 2016, 7, 519-529 Published Online August 2016 in SciRes. http://www.scirp.org/journal/ijcm http://dx.doi.org/10.4236/ijcm.2016.78057
How to cite this paper: Kulkarni, K.P. and Chamberlain, R.S. (2016) Intensive Insulin Therapy Has No Effect on Mortality and Morbidity in Cardiac Surgery Patients: A Meta-Analysis. International Journal of Clinical Medicine, 7, 519-529. http://dx.doi.org/10.4236/ijcm.2016.78057
Intensive Insulin Therapy Has No Effect on Mortality and Morbidity in Cardiac Surgery Patients: A Meta-Analysis Kedar P. Kulkarni1,2, Ronald S. Chamberlain1,2,3* 1Department of Surgery, Saint Barnabas Medical Center, Livingston, NJ, USA 2Saint George’s University School of Medicine, Grenada, West Indies 3Department of Surgery, Rutgers University, New Jersey Medical School, Newark, NJ, USA
Received 13 July 2016; accepted 31 July 2016; published 3 August 2016
Copyright © 2016 by authors and Scientific Research Publishing Inc. This work is licensed under the Creative Commons Attribution International License (CC BY). http://creativecommons.org/licenses/by/4.0/
Abstract
Introduction: Optimal glycemic control in cardiac surgery patients remains a laudable but confus-ing practice. Existing studies have primarily employed two maintenance strategies using either intensive insulin therapy (IIT) (maintain glucose < 120 mg/dl) or conventional insulin therapy (CIT) (<200 mg/dl) with conflicting outcomes. This meta-analysis evaluates the impact of IIT and CIT in regards to the incidence of mortality, length of stay (LOS), intensive care unit (ICU) LOS, atrial fibrillation (AF), and infections. Methods: A comprehensive literature search in PubMed, Google Scholar and the Cochrane Central Registry of Controlled Trials was completed between 1966 and 2016. Keywords searched were “insulin”, “bypass”, “coronary”, “CABG”, “glucose”, “ar-tery”, “intensive”, “cardiac”, and “surgery”. Eligible studies were randomized control trials (RCTs) comparing IIT (BGL 80-120 mg/dL) and CIT (BGL < 200 mg/dL). Primary outcomes were mortality, ICU LOS, and hospital LOS. Results: 8 RCTs were included in this study. IIT strategies did not sig-nificantly affect overall mortality (RR = 0.905, 95% CI = 0.604 to 1.356; p = 0.628), ICU LOS (MD = −0.073 days, 95% CI = −0.324 to 0.178; p = 0.568), or hospital LOS (MD = 0.269, 95% CI = −2.158 to 2.696; p = 0.828). No difference in AF rates (RR = 0.887, 95% CI = 0.681 to 1.155; p = 0.375) or deep sternal infection (RR = 0.985, 95% CI = 0.357 to 2.720; p = 0.977) were observed. Conclusion: IIT targeting blood sugar levels of 80 - 120 mg/dl have no effect on perioperative outcomes in car-diac surgery patients. IIT is associated with similar mortality, ICU LOS, hospital LOS, AF rates, and deep sternal infection rates compared to more liberal glycemic strategies. IIT should not replace CIT as the standard of care in cardiac surgery patients.
*Corresponding author.

K. P. Kulkarni, R. S. Chamberlain
520
Keywords Intensive Insulin Therapy, Tight Glycemic Control, Cardiac Surgery, CABG
1. Introduction Hyperglycemia is a common occurrence in postoperative cardiac surgery patients and has been associated with detrimental clinical outcomes [1]. Several studies have documented that many patients undergoing coronary ar-tery bypass grafting (CABG) often have blood glucose levels (BGLs) > 200 mg/dL despite no history of di-abetes [2]-[5]. The consequences of elevated BGLs in cardiac surgery patients has been linked to increased mortality, higher rates of wound infections, and longer hospital stays [3] [4]. In an effort to optimize glycemic control in intensive care unit (ICU) patients, the American Diabetes Association (ADA) and the American As-sociation of Clinical Endocrinologists (AACE) have recommended BGLs in the range of 140 - 180 mg/dL to balance the adverse effects of hyperglycemia and hypoglycemia [5].
Hyperglycemia, defined as a BGL of >100 mg/dL, is a normal occurrence in the post-prandial period. Persis-tent BGLs > 125 mg/dL for more than two hours after a meal is considered abnormal [5]. In the post-surgical period, hyperglycemia is not limited to those who have pre-existing insulin resistance or diabetes. Emotional and physical stresses experienced by surgical patients can cause “stress hyperglycemia” which is defined by the ADA and AACE as persistent BGLs > 140 mg/dL and a HbA1C of < 6.5% to rule out pre-existing diabetes [5].
Stress hyperglycemia is mediated by several hormones which affect glucose metabolism. Epinephrine in-creases gluconeogenesis in the liver and inhibits insulin secretion by the pancreas. Cortisol also increases hepat-ic gluconeogenesis while simultaneously increasing muscle catabolism to make more substrates for gluconeo-genesis. Tumor Necrosis Factor Alpha (TNF-α) directly reduces insulin sensitivity of cells by disrupting insulin receptor signaling. The combined effects of these stress hormones are thought to contribute to insulin resistance and consequently stress hyperglycemia. Insulin resistance also increases the concentration of free fatty acids (FFAs) in circulation which promote oxidative damage, disrupt the myocardial membrane, and inhibit glycolysis preventing cellular respiration in the ischemic conditions common to cardiac surgery [6].
Extensive research into stress hyperglycemia published by Van den Berghe et al. (2001),documented that sur-gical intensive care unit (SICU) patients experienced improved clinical outcomes, specifically related to morbid-ity and mortality, when the BGLs were maintained between 80 - 110 mg/dL [7]. Van den Berghe et al. (2006) subsequently reported no difference in mortality in IIT and CIT with an ICU population of surgical and non- surgical patients [8]. The normoglycemia in Intensive Care Evaluation and Surviving Using Glucose Algorithm Regulation (NICE SUGAR) trial raised further suspicion about the efficacy of IIT by demonstrating a 2.6% in-crease in mortality in the IIT group [9]. One explanation for this increase in mortality was a lack of parenteral nutrition [9]. IIT’s effect on mortality and morbidity in cardiac patients has remained controversial due to the conflicting outcomes of these studies. A previous systemic review by Haga et al. (2011) reported lower mortali-ty and morbidity with IIT (defined as BGL 100 - 200 mg/dL), compared to CIT (BLG 180 - 250 mg/dL) [10]. This meta-analysis sought to further clarify whether BGLs below CIT would decrease mortality and morbidity specifically in cardiac surgery patients.
2. Materials and Methods 2.1. Study Selection A literature search of all English published randomized control trials (RCTs) comparing IIT and CIT in post- operative cardiac surgery patients was conducted with PubMed, Google Scholar, Cochrane Central Registry of Controlled Trials (1966-2016). Additional citations were searched using references retrieved from prior publica-tions. The last search was conducted on May 20th, 2016. Keywords used were all relevant combinations of “in-sulin”, “bypass”, “coronary”, “CABG”, “glucose”, “artery”, “cardiac”, and “surgery” utilizing search operators “AND” or “OR” equivalents. Inclusion criteria consisted of RCTs with a target BGL of 80 - 120 mg/dL in the IIT group, a target BGL of <200 mg/dL in the control group, and reported mortality. The search strategy utilized conformed to the Preferred Reporting Items for Systematic Reviews and Meta-Analysis (PRISMA) standards [11].

K. P. Kulkarni, R. S. Chamberlain
521
2.2. Data Extraction Articles obtained from the above searches were reviewed for eligibility (Figure 1). Information regarding pa-tients, intervention and control groups, as well as study methodology was extracted. The primary clinical out-comes of interest were mortality, ICU length of stay (LOS), and hospital LOS. Secondary outcomes were inci-dence of a trial fibrillation and deep sternal infection.
2.3. Statistical Analysis For each study, relative risks (RR) with a 95% confidence interval (CI) were calculated for the incidence of mortality, infection, and atrial fibrillation. Differences in means (MD) with a 95% CI were calculated for ICU LOS, and hospital LOS. Meta-analysis of the pooled data was completed using Comparative Meta-Analysis software Version 3 (CMA v.3) (Biostat, Englewood, NJ, USA). A “0.5” continuity correction factor was applied to studies with an incidence of zero events to calculate the variance and RR. Both fixed-effects and ran-dom-effects models were considered, depending on the heterogeneity of the included studies. Heterogeneity between studies was assessed using both Cochrane’s Q statistic and I2 statistic and p < 0.05 or I2 > 50 was uti-lized as a cut-off for determining statistical significance. If there was significant heterogeneity, analysis was completed with a random-effects model whereas a fixed-effects model was used when there was no significant heterogeneity. For all outcomes, publication bias was assessed qualitatively with a funnel plot, as well as quan-titatively with both Egger’s and Begg’s tests. For all statistical analysis, a two-tailed p-value of <0.05 was deemed statistically significant. A subgroup analysis comparing patients with and without diabetes was con-ducted.
3. Results 3.1. Demographic Characteristics of the Studies 8 RCTs involving 3541 patients met the inclusion criteria (Table 1). There were 1701 patients in the IIT group with a target BGL of 80 - 120 mg/dL, and 1840 patients in the CIT group with a target BGL of <200 mg/dL.
Figure 1. CONSORT diagram of the study selection process.

K. P. Kulkarni, R. S. Chamberlain
522
Table 1. Characteristics of all published, randomized control trials comparing intensive insulin therapy and conventional insulin therapy in cardiac surgery patients that reported primary outcomes of mortality, intensive care unit length of stay, and hospital length of stay (1966-2016).
Study Year
Lower Glycemic Range Conventional Glycemic Range Diabetic status
Procedure (s) Results Conclusions
Lower limit
(mg/dL)
Upper limit
(mg/dL) N Timing
Lower limit
(mg/dL)
Upper limit
(mg/dL) N Timing
LGR CGR
1. Mortality (rate)
Mortality (rate) RR
2. ICU LOS
(days ± SD)
ICU LOS
(days ± SD) MD
3. Hospital LOS
(days ± SD)
Hospital LOS
(days ± SD) MD
Gandhi 2007 80 110 185 Intra-op
Post-op 100 200 186 Intra-op Mixed On-pump
CABG non-CABG
4/185 0/186
RR = 9.04 p = 0.19 No
difference in
mortality
NR NR NR
NR NR NR
Blaha 2015 80 110 1134 Intra-op
Post-op N/A 200 1249 Post-op Mixed
On-pump/ off-pump
CABG Valve replacement
37/1134 48/1249 RR = 0.84 p = 0.45
No difference
in mortality, ICU LOS, hospital
LOS
4.89 ± 5.50 4.81 ± 4.90 MD = 0.08 p = 0.70
11.7 ± 8.1 12.2 ± 9.4 MD = −0.50 p = 0.17
Hoede- makers 2005
80 110 10 Post-op N/A 200 10 Post-op Non-diabetics On-pump CABG
0/10 0/10 RR = N/A No difference
in mortality or
ICU LOS
0.92 ± 0.08 0.85 ± 0.10 MD = 0.08 p = 0.07
NR NR NR
Qiang 2014 80 110 33 Post-op N/A 200 32 Post-op Non-diabetics
On-pump aortic valve replacement
0/33 2/32 RR = 0.19 p = 0.28
No difference
in mortality.
IIT decreased ICU LOS
and hospital
LOS
1.18 ± 0.30 1.52 ± 0.33 MD = 0.34 p < 0.01
9.4 ± 3.3 11.5 ± 4.2 MD = −2.10 p = 0.03
Liou 2013 90 119 20 Post-op 180 200 30 Post-op Non-diabetics On-pump
CABG
0/20 0/30 (RR = N/A) No difference
in mortality.
IIT decreased hospital
LOS
3.8 ± 0.70 4.3 ± 1.00 MD = −0.50 p = 0.53
14.6 ± 3.20 10.3 ± 2 MD = 4.30 p < 0.01
Desai 2012 90 120 91 Post-op 121 180 98 Post-op Diabetics On-pump
CABG
1/91 1/98 RR = 1.08 p = 0.96 No
difference in mortality
NR NR NR
NR NR NR
Lazar 2011 90 120 40 Intra-op
Post-op 120 180 42 Intra-op Post-op Diabetics On-pump
CABG
0 0 RR = N/A No difference
in mortality, ICU LOS, hospital
LOS
2.90 ± 0.70 2.70 ± 0.50 MD = 0.06 p = 0.14
10.1 ± 3.5 10.8 ± 3.5 MD = −0.70 p = 0.37
Groban 2002 80 120 188 Intra-op N/A 200 193 Intra-op
Post-op Non-diabetics On-pump CABG
3/188 0/200 RR = 7.16 p = 0.19 No
difference in
mortality NR NR NR
NR NR NR
Total 3023 3167
Abbreviations: mg/dL: milligrams/deciliter; N: number of patients; CABG: coronary artery bypass graft; intra-op: intraoperatively; post-op: postoperatively; RR: relative risk; MD: mean difference; SD: standard deviation; LGR: lower glycemic range; CGR: conventional glycemic range; NR: not reported; N/A: not applicable.
K. P. Kulkarni, R. S. Chamberlain
523
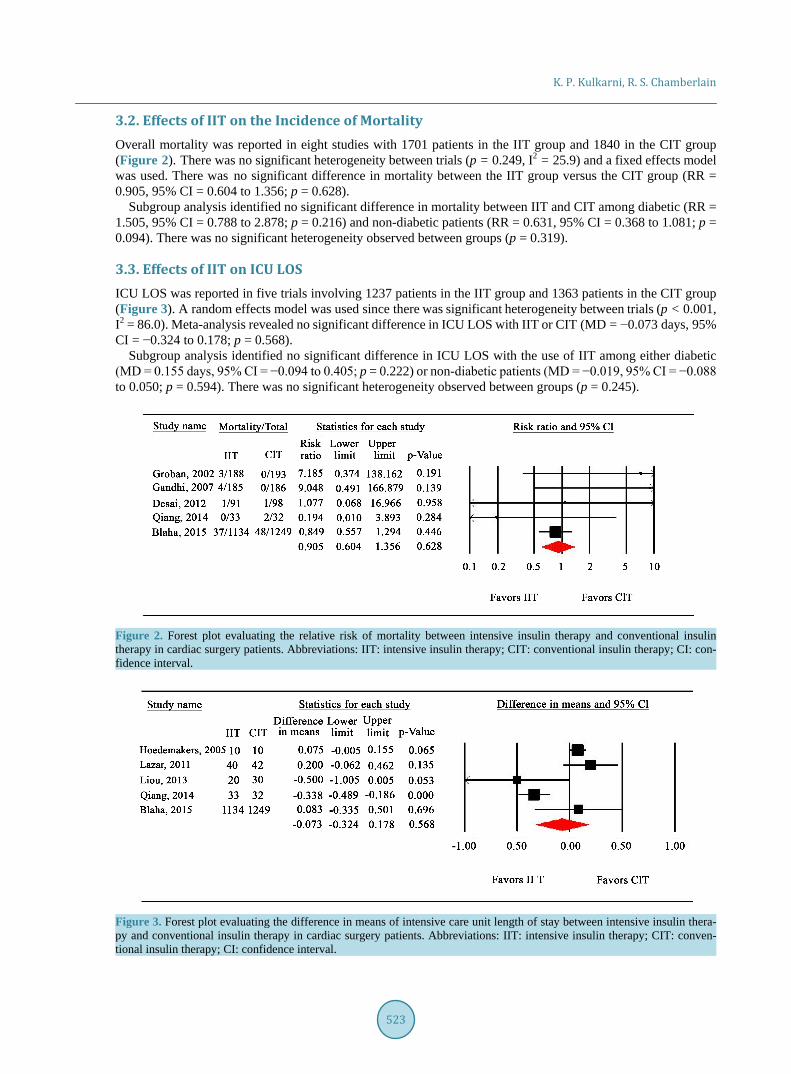
3.2. Effects of IIT on the Incidence of Mortality Overall mortality was reported in eight studies with 1701 patients in the IIT group and 1840 in the CIT group (Figure 2). There was no significant heterogeneity between trials (p = 0.249, I2 = 25.9) and a fixed effects model was used. There was no significant difference in mortality between the IIT group versus the CIT group (RR = 0.905, 95% CI = 0.604 to 1.356; p = 0.628).
Subgroup analysis identified no significant difference in mortality between IIT and CIT among diabetic (RR = 1.505, 95% CI = 0.788 to 2.878; p = 0.216) and non-diabetic patients (RR = 0.631, 95% CI = 0.368 to 1.081; p = 0.094). There was no significant heterogeneity observed between groups (p = 0.319).
3.3. Effects of IIT on ICU LOS ICU LOS was reported in five trials involving 1237 patients in the IIT group and 1363 patients in the CIT group (Figure 3). A random effects model was used since there was significant heterogeneity between trials (p < 0.001, I2 = 86.0). Meta-analysis revealed no significant difference in ICU LOS with IIT or CIT (MD = −0.073 days, 95% CI = −0.324 to 0.178; p = 0.568).
Subgroup analysis identified no significant difference in ICU LOS with the use of IIT among either diabetic (MD = 0.155 days, 95% CI = −0.094 to 0.405; p = 0.222) or non-diabetic patients (MD = −0.019, 95% CI = −0.088 to 0.050; p = 0.594). There was no significant heterogeneity observed between groups (p = 0.245).
Figure 2. Forest plot evaluating the relative risk of mortality between intensive insulin therapy and conventional insulin therapy in cardiac surgery patients. Abbreviations: IIT: intensive insulin therapy; CIT: conventional insulin therapy; CI: con-fidence interval.
Figure 3. Forest plot evaluating the difference in means of intensive care unit length of stay between intensive insulin thera-py and conventional insulin therapy in cardiac surgery patients. Abbreviations: IIT: intensive insulin therapy; CIT: conven-tional insulin therapy; CI: confidence interval.

K. P. Kulkarni, R. S. Chamberlain
524
3.4. Effects of IIT on Hospital LOS Hospital LOS was reported in four trials involving 1227 patients in the IIT group and 1353 patients in the CIT group (Figure 4). There was significant heterogeneity between studies (p < 0.001, I2 = 92.9), and a random ef-fects model was used. Meta-analysis revealed no difference in mean hospital LOS (MD = 0.269 days, 95% CI = −2.158 to 2.696; p = 0.828).
Subgroup analysis identified no significant difference in hospital LOS with the use of IIT among either diabetic (MD = −1.110 days, 95% CI = −2.228 to 0.008; p = 0.052) or non-diabetic patients (MD = 0.759, 95% CI = −2.435 to 3.953; p = 0.641). There was no significant heterogeneity observed between groups (p = 0.279).
3.5. Effects of IIT on Deep Sternal Infection Deep sternal wound infections were reported in three trials involving 316 patients in the IIT group and 326 pa-tients in the CIT group (Figure 5). There was no significant heterogeneity between trials (p = 0.441, I2 < 0.001), and a fixed effects model was used. Meta-analysis revealed no significant difference in infection (RR=0.985, 95% CI = 0.357 to 2.720; p = 0.977).
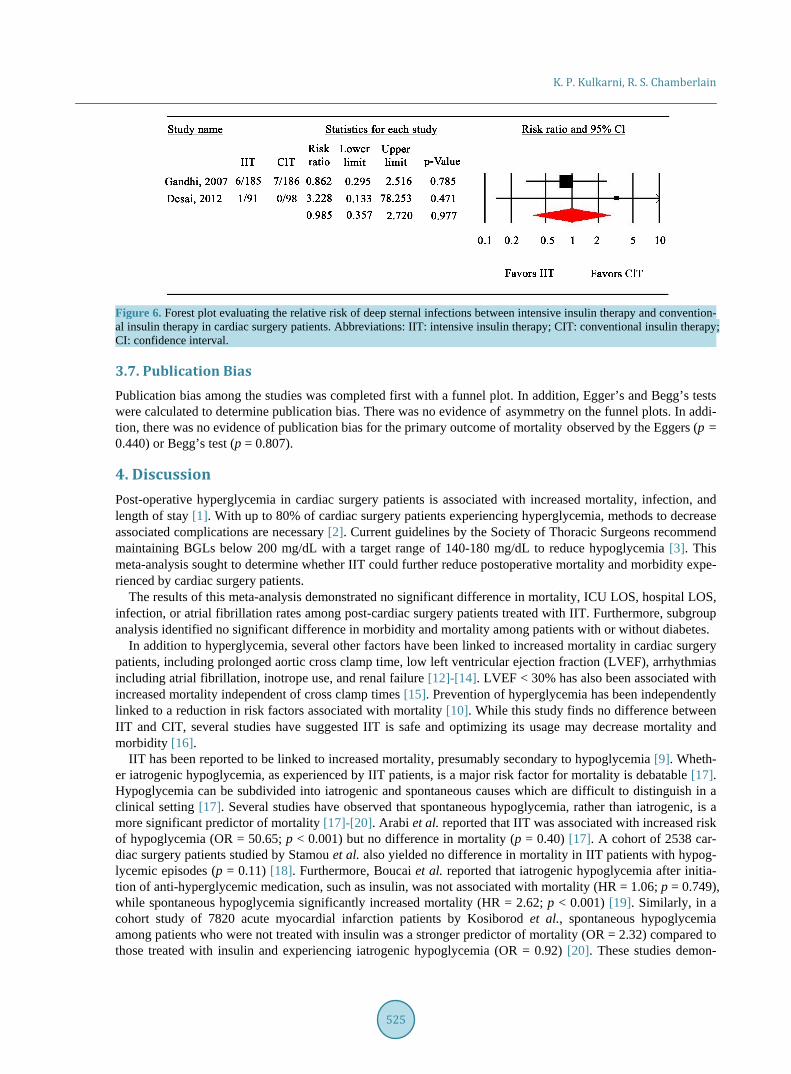
3.6. Effects of IIT on Atrial Fibrillation Atrial fibrillation was reported in three studies involving 316 patients in the IIT group and 326 patients in the CIT group (Figure 6). There was no significant heterogeneity between trials (p = 0.898, I2 < 0.001), and a fixed effects model was used. Meta-analysis revealed no significant difference in the risk of atrial fibrillation between IIT or CIT (RR = 0.887, 95% CI = 0.681 to 1.155; p = 0.375).
Figure 4. Forest plot evaluating the difference in means of hospital length of stay between intensive insulin therapy and conventional insulin therapy in cardiac surgery patients. Abbreviations: IIT: intensive insulin therapy; CIT: conventional in-sulin therapy; CI: confidence interval.
Figure 5. Forest plot evaluating the relative risk of atrial fibrillation between intensive insulin therapy and conventional in-sulin therapy in cardiac surgery patients. Abbreviations: IIT: intensive insulin therapy; CIT: conventional insulin therapy; CI: confidence interval.
K. P. Kulkarni, R. S. Chamberlain
525
Figure 6. Forest plot evaluating the relative risk of deep sternal infections between intensive insulin therapy and convention-al insulin therapy in cardiac surgery patients. Abbreviations: IIT: intensive insulin therapy; CIT: conventional insulin therapy; CI: confidence interval.
3.7. Publication Bias Publication bias among the studies was completed first with a funnel plot. In addition, Egger’s and Begg’s tests were calculated to determine publication bias. There was no evidence of asymmetry on the funnel plots. In addi-tion, there was no evidence of publication bias for the primary outcome of mortality observed by the Eggers (p = 0.440) or Begg’s test (p = 0.807).
4. Discussion Post-operative hyperglycemia in cardiac surgery patients is associated with increased mortality, infection, and length of stay [1]. With up to 80% of cardiac surgery patients experiencing hyperglycemia, methods to decrease associated complications are necessary [2]. Current guidelines by the Society of Thoracic Surgeons recommend maintaining BGLs below 200 mg/dL with a target range of 140-180 mg/dL to reduce hypoglycemia [3]. This meta-analysis sought to determine whether IIT could further reduce postoperative mortality and morbidity expe-rienced by cardiac surgery patients.
The results of this meta-analysis demonstrated no significant difference in mortality, ICU LOS, hospital LOS, infection, or atrial fibrillation rates among post-cardiac surgery patients treated with IIT. Furthermore, subgroup analysis identified no significant difference in morbidity and mortality among patients with or without diabetes.
In addition to hyperglycemia, several other factors have been linked to increased mortality in cardiac surgery patients, including prolonged aortic cross clamp time, low left ventricular ejection fraction (LVEF), arrhythmias including atrial fibrillation, inotrope use, and renal failure [12]-[14]. LVEF < 30% has also been associated with increased mortality independent of cross clamp times [15]. Prevention of hyperglycemia has been independently linked to a reduction in risk factors associated with mortality [10]. While this study finds no difference between IIT and CIT, several studies have suggested IIT is safe and optimizing its usage may decrease mortality and morbidity [16].
IIT has been reported to be linked to increased mortality, presumably secondary to hypoglycemia [9]. Wheth-er iatrogenic hypoglycemia, as experienced by IIT patients, is a major risk factor for mortality is debatable [17]. Hypoglycemia can be subdivided into iatrogenic and spontaneous causes which are difficult to distinguish in a clinical setting [17]. Several studies have observed that spontaneous hypoglycemia, rather than iatrogenic, is a more significant predictor of mortality [17]-[20]. Arabi et al. reported that IIT was associated with increased risk of hypoglycemia (OR = 50.65; p < 0.001) but no difference in mortality (p = 0.40) [17]. A cohort of 2538 car-diac surgery patients studied by Stamou et al. also yielded no difference in mortality in IIT patients with hypog-lycemic episodes (p = 0.11) [18]. Furthermore, Boucai et al. reported that iatrogenic hypoglycemia after initia-tion of anti-hyperglycemic medication, such as insulin, was not associated with mortality (HR = 1.06; p = 0.749), while spontaneous hypoglycemia significantly increased mortality (HR = 2.62; p < 0.001) [19]. Similarly, in a cohort study of 7820 acute myocardial infarction patients by Kosiborod et al., spontaneous hypoglycemia among patients who were not treated with insulin was a stronger predictor of mortality (OR = 2.32) compared to those treated with insulin and experiencing iatrogenic hypoglycemia (OR = 0.92) [20]. These studies demon-
K. P. Kulkarni, R. S. Chamberlain
526
strate iatrogenic hypoglycemia, as experienced in a critical care setting, is not associated with mortality to the same extent as spontaneous hypoglycemia.
Reducing glycemic variability, a measure of how much BGLs fluctuate, has also been linked to lower mortal-ity. Meyfroidt et al. examined the results of the two Van den Berghe et al. (2001 & 2006) studies, and demon-strated that patients with low daily BGL range fluctuation (0 - 4 mmol/dL) had decreased mortality versus pa-tients with high BGL fluctuation (>6 mmol/dL) (15.3 vs 35.5%; p< 0.001) [21]. Similarly, a cohort study of 194,772 patients by Badawi et al. reported higher mortality (OR = 1.67; p< 0.001) in patients with the high BGL fluctuations. A retrospective study of 44,964 patients by Krinsley et al. (2013) also observed an increase in mortality when glycemic variability, defined as a coefficient of variation > 20%, was present (9.2% vs 36.7%; p< 0.001) [16]. While the most optimal IIT range remains uncertain, reduced glycemic variability has been con-sistently shown to decrease mortality.
Patients with diabetes have also been reported to benefit from IIT. Van den Berghe et al. (2006) reported no increase in mortality when diabetic ICU patients were managed with IIT [8]. However, in a study involving car-diac surgery patients, Lazar et al. (2004) reported no difference in mortality with the use of IIT targeting BGL < 140 mg/dL, but did demonstrate reduced atrial fibrillation rates, LOS, and a 2-year survival advantage [22]. Krinsley et al. (2013) observed reduced mortality in diabetics (OR = 0.93; p = 0.003) regardless of BGL range [16]. These authors also noted that diabetics had lower mortality with a BGL of 110-140 mg/dL versus 80-110 mg/dL (12.6% vs 15.3%; p< 0.001) [16].
The duration of IIT may also be a factor in its effectiveness. Van den Berghe et al. (2001) demonstrated IIT managed patients with an ICU stay > 5 days had shorter duration of mechanical ventilation (p = 0.006), and lower incidence of renal impairment (p = 0.04), hyperbilirubinemia (p = 0.04), septicemia (p = 0.003), and po-lyneuropathy (p < 0.001) [7]. Mortality was also significantly lower in IIT patients with ICU stays > 5 days (10.2% vs. 20.2%; p = 0.005), but no benefit in either mortality or morbidity was observed among patients with ICU stays < 5 days [7]. In a later study, Van den Berghe et al. (2006) also reported decreased morbidity and mortality (52.5% vs. 43.0%; p = 0.009) in a mixed medical/surgical ICU population with ICU stays > 3 days, but no difference in ICU stays < 3 days [8]. Furnary et al. (2006) further observed that reduction in the 3-day average blood glucose after CABG in diabetic patients was associated with lower mortality [23]. These studies suggest a duration of 3 days for IIT to be effective.
The benefit of IIT in cardiac surgery patients may be due to insulin’s anti-inflammatory properties. Inflam-matory markers such as interleukin-6 (IL-6), tumor necrosis factor alpha (TNF-alpha), and C-reactive protein (CRP) are elevated in the post-cardiac surgery period [24]. All three are implicated in insulin resistance, which promotes hyperglycemia, further increasing inflammation in a positive feedback loop [25]. Insulin may break this loop by preventing hyperglycemia [25].
Despite no observed reduction in patient morbidity and mortality, IIT has been reported to reduce inflamma-tion and post-operative complications [24]-[27]. Atrial fibrillation has been linked to inflammation through ele-vated CRP levels by both Bruins et al. and Aviles et al. (OR = 1.8; p = 0.002) [28] [29]. Stegenga et al. reported increased stroke incidence with hyperglycemia, and Capps et al. reported that negative outcomes for stroke pa-tients were directly proportional to the level of hyperglycemia [30] [31]. Azevedo et al. reported a trend towards favorable outcomes, in terms of Risk, Injury, Failure, Loss, End-stage kidney disease (RIFLE) criteria, in renal failure with IIT, and an increase in poor outcomes proportional to the level of hyperglycemia [32]. These studies together support the role of IIT in ameliorating complications after cardiac surgery.
There are limitations to this study due to variation and heterogeneity of the RCTs. Protocols for the manage-ment of blood glucose varied between studies. Blood glucose was measured at different intervals and using dif-ferent methods. In addition, exclusively intra-operative use of IIT was explored by some studies. Additional stu-dies to determine the optimal protocol for reducing glycemic variability and hypoglycemia with appropriate du-ration of IIT are required. Methods by which this may be achieved are the use of an artificial pancreas, supple-mental nutrition, and continuing IIT for a minimum of 3 days’ duration.
Despite the limitations discussed, this study identified no significant difference in patient outcomes including mortality, ICU LOS, hospital LOS, atrial fibrillation or infection with the use of IIT compared to CIT in cardiac surgery patients. Given the large number of cardiac surgery procedures performed worldwide, the cost of pro-longed ICU stays, and the absence of benefit to patients, IIT should not be the preferred method for the man-agement of glycemic control in cardiac surgery patients.

K. P. Kulkarni, R. S. Chamberlain
527
References [1] Schmeltz, L.R., DeSantis, A.J., Thiyagarajan, V., et al. (2007) Reduction of Surgical Mortality and Morbidity in Di-
abetic Patients Undergoing Cardiac Surgery with a Combined Intravenous and Subcutaneous Insulin Glucose Man-agement Strategy. Diabetes Care, 30, 823-828.
[2] Furnary, A.P., Wu, Y. and Bookin, S.O. (2004) Effect of Hyperglycemia and Continuous Intravenous Insulin Infusion on Outcomes of Cardiac Surgical Procedures: The Portland Diabetic Project. Endocrine Practice, 10, 21-33. http://dx.doi.org/10.4158/EP.10.S2.21
[3] Donner, T.W. and Flammer, K.M. (2008) Diabetes Management in the Hospital. Medical Clinics of North America, 92, 407-425. http://dx.doi.org/10.1016/j.mcna.2007.10.001
[4] Van den Berghe, G., Wouters, P.J., Bouillon, R., et al. (2003) Outcome Benefit of Intensive Insulin Therapy in the Critically Ill: Insulin Dose versus Glycemic Control. Critical Care Medicine, 31, 359-366. http://dx.doi.org/10.1097/01.CCM.0000045568.12881.10
[5] American Diabetes Association (2005) Diabetes Mellitus and Other Categories of Description of Diabetes. American Diabetes Association, 28, s5-s10. http://dx.doi.org/10.2337/diacare.27.2007.S5
[6] Dungan, K.M., Braithwaite, S.S. and Preiser, J.C. (2009) Stress Hyperglycaemia. Lancet, 373, 1798-1807. http://dx.doi.org/10.1016/S0140-6736(09)60553-5
[7] van den Berghe, G., Wouters, P., Weekers, F., et al. (2001) Intensive Insulin Therapy in the Critically Ill Patients. New England Journal of Medicine, 345, 1359-1367. http://dx.doi.org/10.1056/NEJMoa011300
[8] Van Den Berghe, G., Wilmer, A., Milants, I., et al. (2006) Intensive Insulin Therapy in Mixed Medical/Surgical. Heal, 55, 3151-3159. http://dx.doi.org/10.2337/db06-0855
[9] Finfer, S., Chittock, D.R., Su, S.Y.-S., et al. (2009) Intensive versus Conventional Glucose Control in Critically Ill Pa-tients. New England Journal of Medicine, 360, 1283-1297. http://dx.doi.org/10.1056/NEJMoa0810625
[10] Haga, K.K., McClymont, K.L., Clarke, S., et al. (2011) The Effect of Tight Glycaemic Control, during and after Car-diac Surgery, on Patient Mortality and Morbidity: A Systematic Review and Meta-Analysis. Journal of Cardiothoracic Surgery, 6, 3. http://dx.doi.org/10.1186/1749-8090-6-3
[11] Liberati, A., Altman, D.G., Tetzlaff, J., et al. (2009) Annals of Internal Medicine Academia and Clinic the PRISMA Statement for Reporting Systematic Reviews and Meta-Analyses of Studies That Evaluate Health Care Interventions : Annals of Internal Medicine, 151, W65-W94. http://dx.doi.org/10.1371/journal.pmed.1000100
[12] Nashef, S.A.M., Roques, F., Michel, P., Gauducheau, E., Lemeshow, S. and Salamon, R. (1999) European System for Cardiac Operative Risk Evaluation (EuroSCORE). European Journal Cardio-Thoracic Surgery, 16, 9-13. http://dx.doi.org/10.1016/S1010-7940(99)00134-7
[13] Al-Sarraf, N., Thalib, L., Hughes, A., et al. (2011) Cross-Clamp Time Is an Independent Predictor of Mortality and Morbidity in Low- and High-Risk Cardiac Patients. International Journal of Surgery, 9, 104-109. http://dx.doi.org/10.1016/j.ijsu.2010.10.007
[14] El-Chami, M.F., Kilgo, P., Thourani, V., et al. (2010) New-Onset Atrial Fibrillation Predicts Long-Term Mortality Af-ter Coronary Artery Bypass Graft. Journal of the American College of Cardiology, 55, 1370-1376. http://dx.doi.org/10.1016/j.jacc.2009.10.058
[15] Doenst, T., Borger, M.A., Weisel, R.D., Yau, T.M., Maganti, M. and Rao, V. (2008) Relation between Aortic Cross- Clamp Time and Mortality—Not as Straightforward as Expected. European Journal Cardio-Thoracic Surgery, 33, 660-665. http://dx.doi.org/10.1016/j.ejcts.2008.01.001
[16] Krinsley, J.S., Egi, M., Kiss, A., et al. (2013) Diabetic Status and the Relation of the Three Domains of Glycemic Con-trol to Mortality in Critically Ill Patients: An International Multicenter Cohort Study. Critical Care, 17, R37. http://dx.doi.org/10.1186/cc12547
[17] Arabi, Y.M., Tamim, H.M. and Rishu, A.H. (2009) Hypoglycemia with Intensive Insulin Therapy in Critically ill Pa-tients: Predisposing Factors and Association with Mortality. Critical Care Medicine, 37, 2536-2544. http://dx.doi.org/10.1097/CCM.0b013e3181a381ad
[18] Stamou, S.C., Nussbaum, M., Carew, J.D., et al. (2011) Hypoglycemia with Intensive Insulin Therapy after Cardiac Surgery: Predisposing Factors and Association with Mortality. The Journal of Thoracic and Cardiovascular Surgery, 142, 166-173. http://dx.doi.org/10.1016/j.jtcvs.2010.09.064
[19] Boucai, L., Southern, W.N. and Zonszein, J. (2011) Hypoglycemia-Associated Mortality Is Not Drug-Associated but Linked to Comorbidities. American Journal of Medicine, 124, 1028-1035. http://dx.doi.org/10.1016/j.amjmed.2011.07.011
[20] Kosiborod, M., Inzucchi, S.E., Goyal, A., et al. (2009) Relationship between Spontaneous and Iatrogenic Hypoglyce-mia and Mortality in Patients Hospitalized with Acute Myocardial Infarction. JAMA, 301, 1556-1564.

K. P. Kulkarni, R. S. Chamberlain
528
http://dx.doi.org/10.1001/jama.2009.496 [21] Meyfroidt, G., Keenan, D.M., Wang, X., Wouters, P.J., Veldhuis, J.D. and van den Berghe, G. (2010) Dynamic Cha-
racteristics of Blood Glucose Time Series during the Course of Critical Illness: Effects of Intensive Insulin Therapy and Relative Association with Mortality. Critical Care Medicine, 38, 1021-1029. http://dx.doi.org/10.1097/CCM.0b013e3181cf710e
[22] Lazar, H.L., Chipkin, S.R., Fitzgerald, C., Bao, Y., Cabral, H. and Apstein, C.S. (2004) Tight Glycemic Control in Di-abetic Coronary Artery Bypass Graft Patients Improves Perioperative Outcomes and Decreases Recurrent Ischemic Events. Circulation, 109, 1497-1502. http://dx.doi.org/10.1161/01.CIR.0000121747.71054.79
[23] Furnary, A.P. and Wu, Y. (2006) Eliminating the Diabetic Disadvantage: The Portland Diabetic Project. Seminars in Thoracic and Cardiovascular Surgery, 18, 302-308. http://dx.doi.org/10.1053/j.semtcvs.2006.04.005
[24] Paparella, D., Yau, T.M. and Young, E. (2002) Cardiopulmonary Bypass Induced Inflammation: Pathophysiology and Treatment. An Update. European Journal Cardio-Thoracic Surgery, 21, 232-244. http://dx.doi.org/10.1016/S1010-7940(01)01099-5
[25] Ndumele, C.E., Pradhan, A.D. and Ridker, P.M. (2006) Interrelationships between Inflammation, C-Reactive Protein, and Insulin Resistance. Journal of the CardioMetabolic Syndrome, 1, 107-196. http://dx.doi.org/10.1111/j.1559-4564.2006.05538.x
[26] Hoedemaekers, C.W., Pickkers, P., Netea, M.G., van Deuren, M. and Van der Hoeven, J.G. (2005) Intensive Insulin Therapy Does Not Alter the Inflammatory Response in Patients Undergoing Coronary Artery Bypass Grafting: A Randomized Controlled Trial [ISRCTN95608630]. Critical Care, 9, R790-R797. http://dx.doi.org/10.1186/cc3911
[27] Kalman, J.M., Munawar, M., Howes, L.G., et al. (1995) Atrial Fibrillation after Coronary Artery Bypass Grafting Is Associated with Sympathetic activation. Annals of Thoracic Surgery, 60, 1709-1715. http://dx.doi.org/10.1016/0003-4975(95)00718-0
[28] Aviles, R.J., Martin, D.O., Apperson-Hansen, C., et al. (2003) Inflammation as a Risk Factor for Atrial Fibrillation. Circulation, 108, 3006-3010. http://dx.doi.org/10.1161/01.CIR.0000103131.70301.4F
[29] Bruins, P., Te, V.H., Yazdanbakhsh, A.P., et al. (1997) Activation of the Complement System during and after Cardi-opulmonary Bypass Surgery: Postsurgery Activation Involves C-Reactive Protein and Is Associated with Postoperative Arrhythmia. Circulation, 96, 3542-3548. http://dx.doi.org/10.1161/01.CIR.96.10.3542
[30] Capes, S.E., Hunt, D., Malmberg, K., Pathak, P. and Gerstein, H.C. (2001) Stress Hyperglycemia and Prognosis of Stroke in Nondiabetic and Diabetic Patients: A Systematic Overview. Stroke, 32, 2426-2432. http://dx.doi.org/10.1161/hs1001.096194
[31] Stegenga, M.E., van der Crabben, S.N., Blümer, R.M.E., et al. (2008) Hyperglycemia Enhances Coagulation and Re-duces Neutrophil Degranulation, Whereas Hyperinsulinemia Inhibits Fibrinolysis during Human Endotoxemia. Blood, 112, 82-89. http://dx.doi.org/10.1182/blood-2007-11-121723
[32] Azevedo, J.R.A., Azevedo, R.P., Lucena, L.C., Costa, N.N.R. and Sousa, W.S. (2009) Does Intensive Insulin Therapy Really Reduce the Incidence of Acute Renal Injury in Critically Ill Patients? An Analysis Using the RIFLE Criteria. Critical Care, 13, P37. http://dx.doi.org/10.1186/cc7839 http://ovidsp.ovid.com/ovidweb.cgi?T=JS&PAGE=reference&D=emed10&NEWS=N&AN=70339953

K. P. Kulkarni, R. S. Chamberlain
529
Abbreviation List IIT: Intensive insulin therapy mg: Milligrams dl: Deciliters CIT: Conventional insulin therapy ICU: Intensive care unit LOS: Length of stay AF: Atrial fibrillation CABG: Coronary artery bypass graft RCT: Randomized control trials BGL: Blood glucose levels MD: Mean difference RR: Relative risk CI: Confidence interval ADA: American diabetes association AACE: American association of clinical endocrinologists TNF-α: Tumor necrosis factor alpha FFA: Free fatty acid CRP: C-reactive protein IL: Interleukin RIFLE: Risk, injury, failure, loss, end-stage kidney disease SICU: Surgical intensive care unit
Submit or recommend next manuscript to SCIRP and we will provide best service for you: Accepting pre-submission inquiries through Email, Facebook, LinkedIn, Twitter, etc. A wide selection of journals (inclusive of 9 subjects, more than 200 journals) Providing 24-hour high-quality service User-friendly online submission system Fair and swift peer-review system Efficient typesetting and proofreading procedure Display of the result of downloads and visits, as well as the number of cited articles Maximum dissemination of your research work
Submit your manuscript at: http://papersubmission.scirp.org/

International Journal of Clinical Medicine, 2016, 7, 530-537 Published Online August 2016 in SciRes. http://www.scirp.org/journal/ijcm http://dx.doi.org/10.4236/ijcm.2016.78058
How to cite this paper: Lagoe, R., Drapola, B., Luziani, M. and Pernisi, L. (2016) Hospital Length of Stay Reduction: A Long- Term Study. International Journal of Clinical Medicine, 7, 530-537. http://dx.doi.org/10.4236/ijcm.2016.78058
Hospital Length of Stay Reduction: A Long-Term Study Ronald Lagoe1*, Barbara Drapola2, Mary Luziani3, Louise Pernisi4 1Hospital Executive Council, Syracuse, NY, USA 2Crouse Hospital, Syracuse, NY, USA 3St. Joseph’s Hospital Health Center, Syracuse, NY, USA 4Upstate University Hospital—SUNY UMU, Syracuse, NY, USA
Received 1 July 2016; accepted 6 August 2016; published 9 August 2016
Copyright © 2016 by authors and Scientific Research Publishing Inc. This work is licensed under the Creative Commons Attribution International License (CC BY). http://creativecommons.org/licenses/by/4.0/
Abstract This study evaluated length of stay reduction for adult medicine and adult surgery in the com-bined hospitals of Syracuse, New York between 1998 and 2016. The study was based on the All Pa-tients Refined Severity of Illness System. Through this approach, it controlled for changes in the degree of illness of hospital populations. The study data indicated that reductions in adult medi-cine and adult surgery stays in the Syracuse hospitals between 1998 and 2012 reduced the annual number of excess days compared with severity adjusted national averages by 49,000, or an aver-age daily census of 134.2. It appeared that the shift to reimbursement by discharges initiated by Medicare was a major cause of these reductions. The impact of this change was accompanied by length of stay reduction initiatives by the Syracuse hospitals, especially relating to long-term care. Between January-April 2012 and 2016, additional reductions brought the lengths of stay for adult medicine and adult surgery in the combined Syracuse hospitals close to the national average. The study suggested that remaining opportunities for length of stay reductions in Syracuse involved patients with high severity of illness and those discharged to nursing homes.
Keywords Hospitalization, Hospital Lengths of Stay, Hospital Reimbursement, Nursing Homes
1. Introduction In the United States, renewed interest is focusing on improving the efficiency and outcomes for health care. This interest is being generated by providers and payers of care [1] [2].
*Corresponding author.

R. Lagoe et al.
531
Historically, the implementation of the Prospective Payment System by Medicare in 1983 was probably the most important influence on the development of hospital efficiency. The change from payments per diem to payments per discharge shifted the focus of the acute care industry from keeping patients longer to discharging them sooner. Across the nation, this approach was adopted by Medicaid and insurance plans [3]-[6].
During the 1980s and 1990s, payments per discharge were responsible for the elimination of substantial vo-lumes of inpatient days in United States hospitals. Some payers established reimbursement mechanisms to pre-vent premature hospital discharges; however, this did not change the movement toward shorter hospital stays [7] [8].
An important part of this development was an increase in the importance of long-term care services. Increased efficiency and shorter stays in hospitals required support from home health care and institutional long-term care for patients who required additional services [9].
In the twenty first century, increased payer attention on the need for system wide health care efficiency con-tinued to develop. This attention has caused insurance plans such as Blue Cross and public payers such as Me-dicaid to become involved in regional and statewide efforts to improve hospital efficiency and outcomes.
Among health care providers, a recognition that efficient care is frequently the most effective care has been in development for some time. This recognition has been manifest in renewed efforts to develop post acute services and in initiatives to improve hospital outcomes such as post admission complications [10]-[12].
The connection between efficiency and outcomes in health care has drawn increased interest in the develop-ment of post hospital services with high severity of illness. This interest has led to the development of a new level of post acute services in some communities [13]-[15].
The impact of these developments has occurred in local health care systems throughout the nation. Because health care is a local function, the national impact is an aggregation of what occurs in local communities.
2. Population This study described the development of acute hospital stays and efforts to address them in the metropolitan area of Syracuse, New York. This area includes three urban acute care facilities (2015 inpatient discharges in paren-theses), Crouse Hospital (19,790 discharges), St. Joseph’s Hospital Health Center (24,808 discharges), and Ups-tate University Hospital (28,236 discharges). These hospitals provide primary and secondary acute care services to an immediate area with a population of approximately 600,000 and tertiary services to the eleven county Cen-tral New York Health Service Area, with a population of 1,400,000.
Historically, the Syracuse hospitals have worked cooperatively to improve the efficiency and outcomes of acute care through their planning organization, the Hospital Executive Council. A number of these efforts have focused on reduction of inpatient hospital stays. Because the hospitals directly control only about 14 percent of the nursing home beds in the community, a number of these efforts have focused on long-term care services [16] [17].
3. Method This study evaluated inpatient lengths of stay for adult medicine and adult surgery in the hospitals of Syracuse, New York between 1998 and 2016. During this period, these services accounted for 75 percent of discharges from the combined hospitals. The study focused on changes in inpatient stays and related utilization.
The study was carried out using patient specific data from each of the hospitals by the Hospital Executive Council. These data were obtained through Business Associate Agreements with each of the hospitals. The Council functions as a mechanism for the development of multihospital studies in the Syracuse metropolitan area.
The study data were analyzed using the All Patients Refined Diagnosis Related Group Severity of illness sys-tem developed by 3M™ Health Information Systems. This algorithm identified the severity of illness of each patient using the principal diagnosis, all secondary diagnoses, and demographic indicators such as age and gender. Levels of severity include Minor, Moderate, Major, and Extreme. In order to evaluate hospital lengths of stay, the algorithm identified comparison populations with the same distribution of patients by severity of ill-ness.
Comparison populations were developed for use at the mean length of stay level and for mean stay differences converted to patient days. Through this approach, changes in the severity of illness of major service populations

R. Lagoe et al.
532
over time were identified and compared with changes in lengths of stay. The initial component of the study focused on adult medicine and adult surgery stays for the combined Syra-
cuse hospitals between January-December 1998 and 2014. This analysis identified numbers of discharges and mean lengths of stay for each service for January-December 1998, 2008, 2010, 2012, and 2014. The analysis al-so identified quantitative differences between each annual stay for the combined hospitals and the severity ad-justed national average, as well as impact of this difference on patient days for the combined hospitals.
The time period of this component of the study included the long-term impact of the implementation of the change to reimbursement by discharges on the hospitals. This was the most important factor influencing the re-duction of hospital stays in the community because it impacted the hospitals through reimbursement from all acute care payers.
In Syracuse, this change was also reflected in the development of internal efficiencies within the three hospit-als and programs involving the hospitals and long-term care providers in the community. The community pro-grams included the sharing of information concerning Difficult to Place patients by distribution of weekly community wide lists concerning these patients. They also included hospital initiatives to develop programs in nursing homes for specific types of Difficult to Place patients such as those who required long-term acute care services such as single intravenous antibiotics, extensive wound care, and specific high cost medications.
The second component of the study focused on adult medicine and adult surgery lengths of stay for the com-bined hospitals during the most recent period for which completely abstracted data were available, January-April 2012-2016. In order to adjust for seasonal variations in stays, four month periods were used for each year. This analysis also included numbers of discharges and mean lengths of stay for each major service and time period, as well as severity adjusted comparisons with stays for each time period at the unit level and through their im-pact on excess inpatient days. It involved comparisons with severity adjusted national averages developed by 3M™ Health Information Systems.
The third component of the study focused on identification of adult medicine and adult surgery lengths of stay in the combined hospitals for the most recent period available, January-April 2016 in order to identify remaining opportunities for length of stay reduction. This analysis involved two major indicators, severity of illness and discharge status. It involved comparisons with severity adjusted national averages developed by 3M™ Health Information Systems.
4. Results The initial component of the study focused on lengths of stay for adult medicine and adult surgery in the Syra-cuse hospitals for January-December 1998-2014. Related data are summarized in Table 1.
This study data demonstrated that mean lengths of stay for adult medicine in the combined hospitals declined by 0.75 days, from 5.89 to 5.14 days between 1998 and 2012, before increasing to 5.45 days in 2014. The in-crease at the end of the period was related to the movement of approximately 1800 patients from inpatient to medical observation status brought about by a change in Medicare regulations concerning this subject.
The study data demonstrated that the reductions in adult medicine lengths of stay were paralleled by an in-crease in the severity of illness of the adult medicine population of the hospitals. This increase amounted to 0.56 days, or 12.6 percent, between 1998 and 2012. The shift of patients to medical observation in 2014 added another 4.5 percent to the severity adjusted comparison population.
The information in Table 1 demonstrated that the difference between the adult medicine mean length of stay for the combined Syracuse hospitals and the severity adjusted national average declined markedly, from 1.45 days in 1998 to 0.25 days in 2014. This was reflected in the reduction of the number of excess days from 36,653, an average daily census of 100.4, to 8355 days, an average daily census of 22.9.
The data in Table 1 demonstrated that mean lengths of stay for adult surgery in the combined Syracuse hos-pitals declined by 0.62 days, from 6.66 to 6.04 days, between January-December 1998 and 2014. This develop-ment did not include an increase in stays, such as that which occurred at the end of the period in adult medicine, because observation patients were not removed from this population.
The study data indicated that, as in adult medicine, the severity of illness of the inpatient population increased during this period. This increase amounted to 0.53 days, or 9.8 percent, during the time interval. This increase demonstrated that hospital stays declined as the severity of illness increased, resulting in an effective length of stay reduction of 1.15 days.

R. Lagoe et al.
533
Table 1. Inpatient mean lengths of stay, adult medicine and adult surgery, Syracuse Hospitals, 1998, 2008, 2010, 2012, 2014.
1998 2008 2010 2012 2014
Adult Medicine Number of Discharges 25,278 28,565 32,221 35,274 33,421
Mean Length of Stay (Days) 5.89 4.98 5.18 5.14 5.45
Severity Adjusted National Average 4.44 4.68 4.84 5.00 5.20
Length of Stay Difference 1.45 0.30 0.34 0.14 0.25
Patient Days Difference 36,653.10 8569.50 10,955.14 4938.36 8355.25
Adult Surgery Number of Discharges 20,100 19,241 19,170 20,439 20,562
Mean Length of Stay (Days) 6.66 6.23 6.25 6.04 6.04
Severity Adjusted National Average 5.42 5.63 5.89 5.75 5.95
Length of Stay Difference 1.24 0.60 0.36 0.29 0.09
Patient Days Difference 24,924.00 11,544.60 6901.20 5927.31 1850.58
Adult medicine data exclude Diagnosis Related Groups concerning surgery, obstetrics, pediatrics, psychiatry, alcohol/substance abuse treatment, rehabilitation, and all patients aged 0 - 17 years.
Adult surgery data exclude Diagnosis Related Groups concerning medicine, obstetrics, pediatrics, psychiatry, alcohol/substance abuse treatment, and all patients aged 0 - 17 years.
Source: Hospital Executive Council.
The information in Table 1 also demonstrated that, between January-December 1998 and 2014, the difference between the adult surgery length of stay for the combined Syracuse hospitals and the severity adjusted national average declined considerably, from 1.24 days in 1998 to 0.09 days in 2014. This was reflected in the reduction of the number of excess days from 24,924, an average daily census of 68.3, to 1850, an average daily census of 5.1.
The length of stay data in Table 1 demonstrated the impact of a combination of trends on utilization at the community level. The most important of these was the continuing effect of the shift to reimbursement by dis-charge on hospital efficiency. This included all payers and most hospital revenue. In Syracuse, this trend was supported by a community wide study of hospital stays and planning for length of stay reduction.
In Syracuse, length of stay reduction was also affected by the development of additional capacity for home care and nursing homes by the hospitals and by the development of programs addressing patients with the long-est stays. Programs developed by the hospitals to monitor the status of these patients and initiate programs in nursing homes for specific services also contributed to length of stay reduction during this period.
The second component of the study focused on adult medicine and adult surgery lengths of stay in the Syra-cuse hospitals between January-April 2012 and 2016. Relevant data are summarized in Table 2.
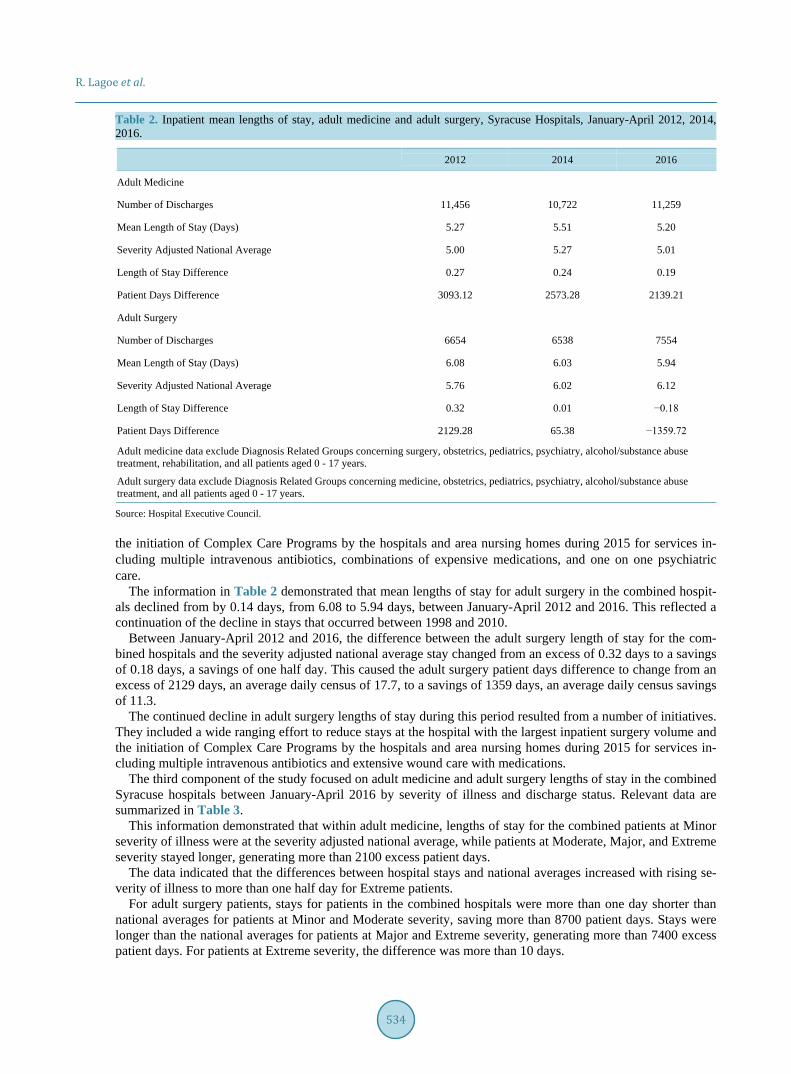
This information demonstrated that mean lengths of stay for adult medicine in the combined Syracuse hospit-als decreased by 0.7 days, from 5.27 to 5.20 days between January-April 2012 and 2016. After the implementa-tion of the Medicare medical observation regulations in 2013-2014, the mean adult medicine length of stay de-clined from 5.51 to 5.20 days.
Between January-April 2012 and 2016, the unit difference between the adult medicine hospital stay and the severity adjusted national average declined from 0.27 to 0.19 days, resulting in a decline in the number of excess patient days from 3093 to 2139. This left only 2139 excess adult medicine days, or an average daily census of 17.8 in the combined hospitals.
This decline demonstrated that the impact of provider efforts to reduce stays in the Syracuse hospitals and continued payer incentives for length of stay reduction offset the impact of the medical observation regulations. They included the implementation of a wide ranging effort to reduce stays throughout one of the hospitals and
R. Lagoe et al.
534
Table 2. Inpatient mean lengths of stay, adult medicine and adult surgery, Syracuse Hospitals, January-April 2012, 2014, 2016.
2012 2014 2016
Adult Medicine Number of Discharges 11,456 10,722 11,259
Mean Length of Stay (Days) 5.27 5.51 5.20
Severity Adjusted National Average 5.00 5.27 5.01
Length of Stay Difference 0.27 0.24 0.19
Patient Days Difference 3093.12 2573.28 2139.21
Adult Surgery Number of Discharges 6654 6538 7554
Mean Length of Stay (Days) 6.08 6.03 5.94
Severity Adjusted National Average 5.76 6.02 6.12
Length of Stay Difference 0.32 0.01 −0.18
Patient Days Difference 2129.28 65.38 −1359.72
Adult medicine data exclude Diagnosis Related Groups concerning surgery, obstetrics, pediatrics, psychiatry, alcohol/substance abuse treatment, rehabilitation, and all patients aged 0 - 17 years.
Adult surgery data exclude Diagnosis Related Groups concerning medicine, obstetrics, pediatrics, psychiatry, alcohol/substance abuse treatment, and all patients aged 0 - 17 years.
Source: Hospital Executive Council.
the initiation of Complex Care Programs by the hospitals and area nursing homes during 2015 for services in-cluding multiple intravenous antibiotics, combinations of expensive medications, and one on one psychiatric care.
The information in Table 2 demonstrated that mean lengths of stay for adult surgery in the combined hospit-als declined from by 0.14 days, from 6.08 to 5.94 days, between January-April 2012 and 2016. This reflected a continuation of the decline in stays that occurred between 1998 and 2010.
Between January-April 2012 and 2016, the difference between the adult surgery length of stay for the com-bined hospitals and the severity adjusted national average stay changed from an excess of 0.32 days to a savings of 0.18 days, a savings of one half day. This caused the adult surgery patient days difference to change from an excess of 2129 days, an average daily census of 17.7, to a savings of 1359 days, an average daily census savings of 11.3.
The continued decline in adult surgery lengths of stay during this period resulted from a number of initiatives. They included a wide ranging effort to reduce stays at the hospital with the largest inpatient surgery volume and the initiation of Complex Care Programs by the hospitals and area nursing homes during 2015 for services in-cluding multiple intravenous antibiotics and extensive wound care with medications.
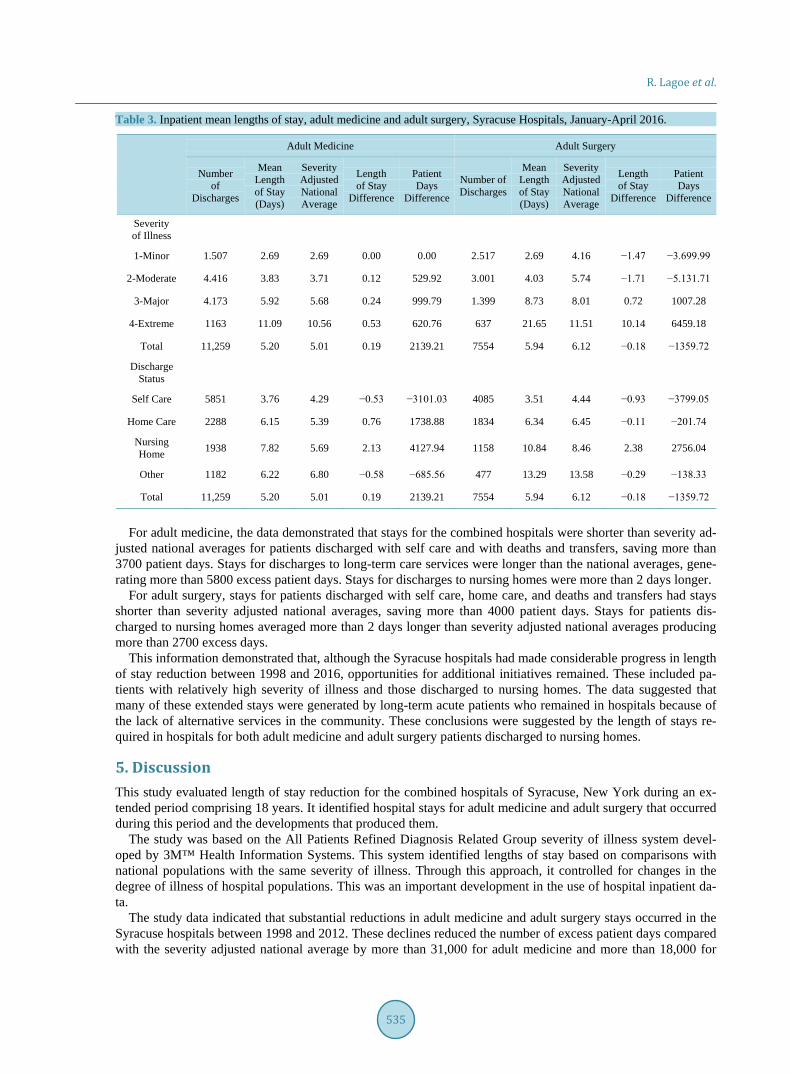
The third component of the study focused on adult medicine and adult surgery lengths of stay in the combined Syracuse hospitals between January-April 2016 by severity of illness and discharge status. Relevant data are summarized in Table 3.
This information demonstrated that within adult medicine, lengths of stay for the combined patients at Minor severity of illness were at the severity adjusted national average, while patients at Moderate, Major, and Extreme severity stayed longer, generating more than 2100 excess patient days.
The data indicated that the differences between hospital stays and national averages increased with rising se-verity of illness to more than one half day for Extreme patients.
For adult surgery patients, stays for patients in the combined hospitals were more than one day shorter than national averages for patients at Minor and Moderate severity, saving more than 8700 patient days. Stays were longer than the national averages for patients at Major and Extreme severity, generating more than 7400 excess patient days. For patients at Extreme severity, the difference was more than 10 days.
R. Lagoe et al.
535
Table 3. Inpatient mean lengths of stay, adult medicine and adult surgery, Syracuse Hospitals, January-April 2016.
Adult Medicine Adult Surgery
Number of
Discharges
Mean Length of Stay (Days)
Severity Adjusted National Average
Length of Stay
Difference
Patient Days
Difference
Number of Discharges
Mean Length of Stay (Days)
Severity Adjusted National Average
Length of Stay
Difference
Patient Days
Difference
Severity of Illness
1-Minor 1.507 2.69 2.69 0.00 0.00 2.517 2.69 4.16 −1.47 −3.699.99
2-Moderate 4.416 3.83 3.71 0.12 529.92 3.001 4.03 5.74 −1.71 −5.131.71
3-Major 4.173 5.92 5.68 0.24 999.79 1.399 8.73 8.01 0.72 1007.28
4-Extreme 1163 11.09 10.56 0.53 620.76 637 21.65 11.51 10.14 6459.18
Total 11,259 5.20 5.01 0.19 2139.21 7554 5.94 6.12 −0.18 −1359.72
Discharge Status
Self Care 5851 3.76 4.29 −0.53 −3101.03 4085 3.51 4.44 −0.93 −3799.05
Home Care 2288 6.15 5.39 0.76 1738.88 1834 6.34 6.45 −0.11 −201.74
Nursing Home 1938 7.82 5.69 2.13 4127.94 1158 10.84 8.46 2.38 2756.04
Other 1182 6.22 6.80 −0.58 −685.56 477 13.29 13.58 −0.29 −138.33
Total 11,259 5.20 5.01 0.19 2139.21 7554 5.94 6.12 −0.18 −1359.72
For adult medicine, the data demonstrated that stays for the combined hospitals were shorter than severity ad-
justed national averages for patients discharged with self care and with deaths and transfers, saving more than 3700 patient days. Stays for discharges to long-term care services were longer than the national averages, gene-rating more than 5800 excess patient days. Stays for discharges to nursing homes were more than 2 days longer.
For adult surgery, stays for patients discharged with self care, home care, and deaths and transfers had stays shorter than severity adjusted national averages, saving more than 4000 patient days. Stays for patients dis-charged to nursing homes averaged more than 2 days longer than severity adjusted national averages producing more than 2700 excess days.
This information demonstrated that, although the Syracuse hospitals had made considerable progress in length of stay reduction between 1998 and 2016, opportunities for additional initiatives remained. These included pa-tients with relatively high severity of illness and those discharged to nursing homes. The data suggested that many of these extended stays were generated by long-term acute patients who remained in hospitals because of the lack of alternative services in the community. These conclusions were suggested by the length of stays re-quired in hospitals for both adult medicine and adult surgery patients discharged to nursing homes.
5. Discussion This study evaluated length of stay reduction for the combined hospitals of Syracuse, New York during an ex-tended period comprising 18 years. It identified hospital stays for adult medicine and adult surgery that occurred during this period and the developments that produced them.
The study was based on the All Patients Refined Diagnosis Related Group severity of illness system devel-oped by 3M™ Health Information Systems. This system identified lengths of stay based on comparisons with national populations with the same severity of illness. Through this approach, it controlled for changes in the degree of illness of hospital populations. This was an important development in the use of hospital inpatient da-ta.
The study data indicated that substantial reductions in adult medicine and adult surgery stays occurred in the Syracuse hospitals between 1998 and 2012. These declines reduced the number of excess patient days compared with the severity adjusted national average by more than 31,000 for adult medicine and more than 18,000 for

R. Lagoe et al.
536
adult surgery. It appeared that the shift from reimbursement by patient days to reimbursement by discharges was a major
cause of these reductions. This shift was initiated by Medicare during the 1980s and followed by other payers, but its impact on hospitals at the community level developed over time. Additional factors, such as the introduc-tion of new technologies including robotic procedures, had contributed to reductions in stays for adult surgery.
The experience of the Syracuse hospitals indicated that the impact of the change in inpatient reimbursement was accompanied by hospital length of stay reduction initiatives. These included hospital efforts to address stays for patients discharged to long-term care, such as the development of additional home care and nursing home capacity. It also included the initiation of community wide efforts between hospitals and nursing homes to iden-tify Difficult to Place patients in hospitals and development of long-term acute care services for these patients in nursing homes.
The study data and the experiences of the Syracuse hospitals indicated that, since 2012, the rate of reductions in hospital stays has slowed as stays have become shorter, generating more focused efforts to address this sub-ject. Between January-April 2012 and 2016, adult medicine stays have approached severity adjusted national averages and adult surgery stays have become shorter. These developments have been supported by substantial efforts by hospital administrators to focus resources on length of stay reduction and the development of pro-grams with local nursing homes to address Complex Care services, such as multiple intravenous medications, extensive wound care, and mental health.
In recent years, efforts to reduce stays have also been supported by initiatives to improve the outcomes of care. These have included efforts to reduce inpatient complications, which are frequently associated with long stays.
The study suggested that remaining opportunities for length of stay reduction in the Syracuse hospitals in-volved patients with high severity of illness and those discharged to nursing homes. Addressing these needs will require initiatives that focus on remaining populations with extended stays, such as patients who require long- term acute care and complex care. In many communities, the initiative for development of these programs will need to come from hospitals. They are frequently the only providers with major interests in serving the needs of these patients. The development of services for these populations will require increasing levels of cooperation among hospitals, as well as between acute care and long-term care providers at the community level.
References [1] Dentzler, S. (2011) Urgent Measures for an Old Problem. Health Affairs, 30, 1626.
http://dx.doi.org/10.1377/hlthaff.2011.0961 [2] Marcus, A. (2009) Bending the Curve: The Twists and Turns. Health Affairs, 28, 1256-1258.
http://dx.doi.org/10.1377/hlthaff.28.5.1256 [3] Friedman, B., De La Mare, J., Andrews, R. and McKenzie, D.H. (2002) Practical Options for Estimating the Costs of
Hospital Stays. Journal of Health Care Finance, 29, 1-13. [4] Cushing, W.T. (2004) Extra Hospital Days Can Cost You Plenty. Medical Economics, 81, 83. [5] Fong, T. (2004) Medicaid under the Knife? Congress Considering Funding Cuts in Program? Modern Healthcare, 34,
6-7. [6] Hoadley, J.F., Cunningham, P. and McHugh, M. (2004) Popular Medicaid Programs Do Battle with State Budget
Pressures: Perspectives from Twelve States. Health Affairs, 23, 143-154. http://dx.doi.org/10.1377/hlthaff.23.2.143 [7] Shah, B.R., Reed, S.D., Francis, J., Ridley, D.B. and Schulman, K.A. (2003) The Cost of Inefficiency in U.S. Hospitals,
1985-1987. Journal of Health Care Finance, 30, 1-9. [8] Pena, A.D. and Ndiyae, M. (2002) Developing Hospital Efficiency Cost Control Measures. World Hospitals and
Health Services, 38, 41-43. [9] Marek, K.D. and Rantz, M.J. (2000) Aging in Place: A New Model for Long Term Care. Nursing Administration
Quarterly, 24, 1-11. http://dx.doi.org/10.1097/00006216-200004000-00003 [10] Weil, A.R. (2015) Hospital Cost and Quality. Health Affairs, 34, 1263. http://dx.doi.org/10.1377/hlthaff.2015.0786 [11] Skinner, J., Chandra, A., Goodman, D. and Fisher, E.S. (2009) The Elusive Connection between Health Care Spending
and Quality. Health Affairs, 28, w119-w123. http://dx.doi.org/10.1377/hlthaff.28.1.w119 [12] Fuller, R.L., McCullough, E.C., Bao, M.Z. and Averill, R.F. (2009) Estimating the Costs of Potentially Preventable
Hospital Acquired Complications. Health Care Financing Review, 30, 17-32. [13] Gawande, A.A. (2011) The Hot Spotters: Can We Lower Costs by Getting the Neediest Patients Better Care? New

R. Lagoe et al.
537
Yorker. [14] Hong, C.S., Siegel, A.L. and Ferris, T.G. (2014) Caring for High Need, High Cost Patients: What Makes for a Suc-
cessful Care Management Program? Commonwealth Fund, New York. http://dx.doi.org/10.15868/socialsector.25007 [15] Johnson, T.L., Rinehart, D.J., Durfee, J., Brewer, D., Batal, H., Blum, J., Oronce, C.J. and Melinkovich, P. (2015) For
Many Patients Who Use Large Amounts of Health Services, the Need Is Intense Yet Temporary. Health Affairs, 34, 1312-1323. http://dx.doi.org/10.1377/hlthaff.2014.1186
[16] Lagoe, R.J., Westert, G.P., Kendrick, K., Morreale, G. and Mnich, S. (2005) Managing Hospital Length of Stay Re-duction: A Multihospital Approach. Health Care Management Review, 30, 89-92. http://dx.doi.org/10.1097/00004010-200504000-00002
[17] Lagoe, R., Pasinski, T., Kronenberg, P., Quinn, T. and Schaengold, P. (2006) Linking Health Services at the Commu-nity Level. Canada Healthcare Quarterly, 9, 60-65. http://dx.doi.org/10.12927/hcq..18229
Submit or recommend next manuscript to SCIRP and we will provide best service for you: Accepting pre-submission inquiries through Email, Facebook, LinkedIn, Twitter, etc. A wide selection of journals (inclusive of 9 subjects, more than 200 journals) Providing 24-hour high-quality service User-friendly online submission system Fair and swift peer-review system Efficient typesetting and proofreading procedure Display of the result of downloads and visits, as well as the number of cited articles Maximum dissemination of your research work
Submit your manuscript at: http://papersubmission.scirp.org/

International Journal of Clinical Medicine, 2016, 7, 538-546 Published Online August 2016 in SciRes. http://www.scirp.org/journal/ijcm http://dx.doi.org/10.4236/ijcm.2016.78059
How to cite this paper: Almomen, R.K., Kaufman, D., Alotaibi, H., Al-Rowais, N.A., Albeik, M. and Albattal, S.M. (2016) Ap-plying the ADDIE—Analysis, Design, Development, Implementation and Evaluation—Instructional Design Model to Contin-uing Professional Development for Primary Care Physicians in Saudi Arabia. International Journal of Clinical Medicine, 7, 538-546. http://dx.doi.org/10.4236/ijcm.2016.78059
Applying the ADDIE—Analysis, Design, Development, Implementation and Evaluation—Instructional Design Model to Continuing Professional Development for Primary Care Physicians in Saudi Arabia Rabaa K. Almomen1*, David Kaufman2, Haifa Alotaibi1, Noura Abdullah Al-Rowais1, Mohamad Albeik1, Saad M. Albattal1 1Family & Community Medicine Department, Prince Sultan Medical Military City, Riyadh, KSA 2Faculty of Education, Simon Fraser University, Burnaby, BC, Canada
Received 18 July 2016; accepted 12 August 2016; published 15 August 2016
Copyright © 2016 by authors and Scientific Research Publishing Inc. This work is licensed under the Creative Commons Attribution International License (CC BY). http://creativecommons.org/licenses/by/4.0/
Abstract Background: As professionals, family physicians are obliged to remain current on advances and trends in medicine and health care delivery. This is usually achieved through engagement in con-tinuing professional development. Instructional design is a systematic method of development of education and training programs for improved learner performance. ADDIE is an instructional systems design model for building effective education and training in five phases: analysis, design, development, implementation and evaluation. Purpose: The purpose of this study was to intro-duce a professional development program for primary care physicians using the ADDIE instruc-tional design model. Methods: Program requirements were defined using a needs assessment questionnaire and consultation observations. Interactive sessions were designed and developed based on the analysis results. The sessions were evaluated with interim and final feedback forms, a final problem-based questionnaire, a self-assessment questionnaire, and focus groups. Results: Scores on the final knowledge assessment were lower than expected. However, at least 50% of participants self-reported their learning improvement as “great” for 16 out of 23 topics. Focus group feedback was generally positive but also identified areas for improvement. Conclusion: Ap-plying a structured instructional design model for creating professional development program for physicians is a fruitful, relevant experience in primary healthcare. 1) Continuing professional de-velopment (CPD) is an essential method to help physicians maintain and further develop know-
*Corresponding author.
R. K. Almomen et al.
539
ledge and expertise; 2) The ADDIE (analysis, design, development, implementation, evaluation) model provides an established and useful structure for creating effective CPD programs; 3) The ADDIE process ensures that physicians’ appropriate learning needs are met effectively; 4) The evaluation phase of the ADDIE process provides feedback that can lead to improvement in the CPD program’s future iterations.
Keywords ADDIE, Health Care Delivery
1. Introduction Physicians and other team members in primary health care are expected to work with their colleagues indepen-dently to provide required services to their patients and their families. Graduation from accredited medical col-leges and postgraduate medical residency programs provide the knowledge and skills necessary to enter the pro-fession and practice with patients [1]. As professionals, family physicians are obliged to remain current on ad-vances and trends in medicine and health care delivery [2]. This is usually achieved through engagement in a variety of activities that constitute continuing professional development (CPD) [3]. Professional development, also called staff development, is the process of improving staff capabilities through access to education and training opportunities in the workplace, often provided by an outside organization or by watching others per-formance on the job [4]. Professional development helps build and maintain staff members’ morale and is thought to attract higher quality staff to an organization [5].
In the medical context, continuing medical education (CME) refers to the same concept, i.e., providing educa-tion to maintain and improve professional competency among health care workers [4]. Strategies used to devel-op CME have been evaluated and often criticized as ineffective for achieving its intended goals [6] [7]. Perfor-mance evaluation of health employees, on the other hand, is a mandate of all organizations including hospitals, as well as primary care and community health services for monitoring staff performance, motivation, and pro-fessional development. Participation in CPD and CME could be used in performance evaluation, in addition to other work performance indicators such as staff attendance, clinical skills and work-related attitudes. However, most staff evaluation is based on pre-employment agreements, expectations, and/or job definitions [1].
Instructional design (ID) is a systematic method of development of education and training programs for im-proved learner performance [8]. Over the last decades, practitioners have developed a number of models for in-structional design (ID) [9]. An ID model is a set of main elements and tasks within a representation of real envi-ronment, developed to help educators and instructional designers incorporate fundamental elements of ID prin-ciples into a manageable process [9] [10]. The ID model is built upon some basic concepts about learning and instruction: firstly, learning takes place within an individual, involving cognitive and motor functions that lead to behavior. Secondly, instruction is the formal act of facilitating learning. One must therefore design the learn-ing experience/instruction in such a manner that it will optimize learning. The development of appropriate ID approaches is one way to optimize learning through the design of the instructional process [8]. Instructional de-sign is the key tool to establish systematic CPD that can ensure professional improvement, credibility and trans-parency to the community by analyzing, designing, developing, implementing, and evaluating the CPD educa-tion program [11].
Such education programs must provide high quality training built on strategic planning using an effective ID process. The CPD challenge is how to implement an effective program and performance evaluation that is valid, reliable, and practical for primary care physicians based on decisions about what should be expected from the physician, who is already certified, works in solo clinics most of the time, and is expected to manage a variety of patient problems.
Many professional instructional designers have applied the generic ADDIE framework [10] as a standard model for technology-based education. ADDIE is an instructional systems design model that presents a series of iterative steps for building effective education and training in five phases: analysis, design, development, im-plementation and evaluation.

R. K. Almomen et al.
540
2. Purpose The purpose of this study was to introduce a professional development program for primary care physicians us-ing the ADDIE (Analysis, Design, Development, Implementation, Evaluation) instructional design model to im-prove primary care physicians’ clinical performance.
3. Methods The study involved 37 primary care physicians working in the Family and Community Medicine Department of Prince Sultan Medical Military City in Riyadh, Saudi Arabia. This department is one of the largest departments of this medical city and comprises several community centers with different numbers of physicians and target populations. Physicians are ranked in the department according to their background, medical affiliations, and experience in the categories of consultant, senior registrar, registrar, and senior house officer. The last two cate-gories are the ones that constitute the focus of this study.
The analysis phase of the ADDIE model started by dividing 37 doctors into four smaller, mostly equal groups. The main program objective was to improve the approach to patients’ clinical management WHAT KIND?, en-hance doctor-patient communication skills and support doctors on their decision for investigations and prescrib-ing rationally rationalizing resources?. Before beginning the program, a survey was sent to all participants to inquire about their perceived performance gaps, their main problems during work in the clinics, and their pre-ferred style of learning (Appendix 1). Rounds were scheduled to observe doctors' consultation skills based on a patient consultation observation model (Appendix 2).
For the design, development, and implementation phases, six sessions were conducted over six months with each group on different medical topics. MORE DETAIL ON THESE PHASES? SOME DESCRIPTION?
Before beginning the program, a survey was sent to inquire about doctors’ performance gaps, their main problems during working in the clinics, and the style of learning they would prefer. Rounds were scheduled to observe doctors’ consultation skills based on a consultation observation model with patients (Appendix 1). The design, development and implementation phases are summarized as follows. Six sessions were conducted over six months with each group on different medical topics .Facilitators of the sessions were chosen from the de-partments in which consultants and senior trainers had more experience and/or qualifications in dealing with common family medicine problems. The sessions were designed to be interactive and case-based discussions were prepared on the topics listed (Table 1).
Cases were discussed in an interactive manner among facilitators and candidates and materials were provided if a topic required reading or preparation ahead of time. Some topics required presentation of slides, others
Table 1. Topics included in the case-based discussions.
Clinical approach to cardiovascular risk assessment using the ATPIII guidelines and Framingham point scores Bronchial asthma assessment in children and adults (severity and control) Use of inhalers and expiratory peak flow meters Management of dysfunctional uterine bleeding Management of a woman presenting with amenorrhea Management of polycystic ovary diseases in the clinics Management of a child presenting with fever with or without skin rash Management of a child presenting with abdominal pain Management of a coughing child Dealing with parents presenting with a child who is not eating well/ failing to thrive Children with otitis media and tonsillitis Describing a skin lesion Acne vulgaris modalities of management in family medicine Management of hair loss in men/women Commonly presenting skin fungal infections in primary care Referral letter writing Rationalizing resources Doctor-patient communication

R. K. Almomen et al.
541
required dummies for examination, and case scenarios with role plays were used to highlight communication is-sues (Table 2).
Facilitators of the sessions were chosen from the departments in which consultants and senior trainers had more experience and/or qualifications in dealing with common family medicine problems. The sessions were designed to be interactive, and case-based discussions were prepared on the topics listed in Table 1. Cases were discussed in an interactive manner among facilitators and candidates, and materials were provided if a topic re-quired reading or preparation ahead of time. Some topics required presentation of slides, others required dum-mies for examination, and case scenarios with role-plays (e.g., see Table 2) were used to highlight communica-tion issues.
Evaluation of the program was done using multiple instruments. An evaluation form was used to evaluate in-dividual sessions and facilitators. At the end of the six-month program, participants completed a final prob-lem-based multiple-choice assessment, a form-based evaluation of the program, and a self-assessment question-naire. Focus group discussions were conducted for both participants and trainers to explore their feelings and perceptions about the program activities.
4. Results Twenty-six out of the 37 physicians attended the sessions over the six-month period and completed both the fi-nal knowledge test and the self-assessment test. The remaining 11 participants were removed from the sessions to meet service needs or did not complete the full six months’ attendance due to leaves.
Figure 1 summarizes scores on the final knowledge assessment. The average mark was 35 correct answers out of 50 questions, ranging from 24 to 39; the majority of participants scored between 34 and 40.
Table 3 summarizes the results of the self-assessment questionnaire. Six participants’ self-assessments were removed from the analysis because they attended less than three sessions. For 16 out of the 23 topics discussed, at least 50% of participants rated their improvement as a result of attending the group sessions and discussions as “great”. Dermatology topics, however, showed less improvement.
Figure 1. Physicians’ scores on the final test of 50 items about clinical topics attended (n = 26).
28
34
24
37
35
3638
26
37
38
39
35 36
39 39
3634
38
36
38
35 34
38 38
29
32
0
5
10
15
20
25
30
35
40
45
50
Stud
ent 1
Stud
ent 2
Stud
ent 3
Stud
ent 4
Stud
ent 5
Stud
ent 6
Stud
ent 7
Stud
ent 8
Stud
ent 9
Stud
ent 1
0
Stud
ent 1
1
Stud
ent 1
2
Stud
ent 1
3
Stud
ent 1
4
Stud
ent 1
5
Stud
ent 1
6
Stud
ent 1
7
Stud
ent 1
8
Stud
ent 1
9
Stud
ent 2
0
Stud
ent 2
1
Stud
ent 2
2
Stud
ent 2
3
Stud
ent 2
4
Stud
ent 2
5
Stud
ent 2
6
Physicians' Scores

R. K. Almomen et al.
542
Table 2. Sample case used in the CPD sessions.
Topic Case Question Competencies Required
18-month-old child with adenoids
Mother and father presenting with a child breathing
through the mouth for the last three months with
disturbed sleep and continuous runny nose
What is your management
approach?
Definition of the problem Assessment of the child’s general wellbeing based on
history and examination Assessment of child’s risk factors Consideration of different management approaches
based on assessment Sharing decision options with parents Consideration of parents’ worries and anxieties
Table 3. Physicians’ self-assessments of their level of improvement (N = 20) as a result of attending the six-month course*.
Improvement
Medical topic None N (%)
Slight N (%)
Moderate N (%)
Great N (%)
Cardiovascular risk clinical assessment in primary care 0 (0) 5 (25) 5 (25) 10 (50)
Use of ATP/Framingham risk score 1 (5) 2 (10) 6 (30) 11 (55)
Communicating risk to patients 0 (0) 2 (10) 8 (40) 10 (50)
Rational investigations, e.g., lipids and diabetes screening 1 (5) 4 (20) 5 (25) 10 (50)
Assessment of severity of an asthmatic patient condition 2 (10) 3 (15) 3 (15) 12 (60)
Assessment of control of an asthmatic patient condition 3 (15) 2 (10) 5 (25) 10 (50)
Proper use of inhalers 3 (15) 2 (10) 5 (25) 10 (50)
Use of peak flow meter 3 (15) 2 (10) 5 (25) 10 (50)
Management of women presenting with irregular bleeding 0 (0) 5 (25) 6 (30) 9 (45)
Management of women presenting with missed periods 2 (10) 2 (10) 4 (20) 12 (60)
Polycystic ovary diseases–common clinical presentations 3 (15) 4 (20) 3 (15) 10 (50)
Management of feverish child presenting with/ without rash 2 (10) 4 (20) 2 (10) 12 (60)
Management of a child presenting with abdominal pain 1 (5) 4 (20) 4 (20) 11 (55)
Parents presenting with child who is not eating well 1 (5) 4 (20) 4 (20) 11 (55)
Earaches in children 1 (5) 5 (25) 3 (15) 11 (55)
Tonsillitis in children 3 (15) 2 (10) 5 (25) 10 (50)
Describing a skin lesion 2 (10) 6 (30) 4 (20) 8 (40)
Writing a letter to a dermatologist 2 (10) 6 (30) 5 (25) 7 (35)
Management of acne vulgaris 2 (10) 8 (40) 2 (10) 8 (40)
Management of a woman presenting with hair loss 1 (5) 6 (30) 7 (35) 6 (30)
Baldness in men—different management modalities 2 (10) 6 (30) 6 (30) 6 (30)
Rational investigation, e.g., zinc/vitamin D/vitamins 1 (5) 5 (25) 5 (25) 9 (45)
Communicating and explaining to patients 1 (5) 6 (30) 3 (15) 10 (50)
*Six participants did not complete this self-assessment form.

R. K. Almomen et al.
543
In addition to the above-mentioned assessments, a focus group discussion was conducted to explore physi-cians’ feelings and perceptions about the effect of being enrolled in these kinds of activities as a form of profes-sional development. Participants made positive comments regarding reviewing the topics from the clinical point of view and reflecting on the problems that they faced in their daily work. One of the participants voiced her opinion as “We have the knowledge background from basic education, but sometimes we need to review and share different views”. Another said that “It’s is a brilliant idea to be pulled out of work once a month for the purpose of continuing education and professional development”.
However, participants were concerned about the issue of the final appraisal being part of their annual em-ployee review, as a result of participating in this program. Participants often questioned the need for the final test and queried the weight of the final assessment on contract renewal. In addition, the trainers who facilitated the sessions were concerned about the variability between their usual teacher-directed teaching styles and their learner-centered group facilitation experience.
5. Discussion This study highlighted our valuable experience with the process of physicians’ continuing professional devel-opment in primary care. Application of the ADDIE model through a pre-designed, structured small-group re-view and discussions of relevant clinical topics led to better identification of physicians’ professional perfor-mance. The final objective assessment of clinical knowledge was identified as lower than expected for a prac-ticing physician; the average score was 35/50 (70%). This finding could be attributed to problems in the physi-cians’ clinical knowledge application due to workload issues or maybe a result of employee selection. Analyzing this further could be fruitful for the organization and patient care.
Participants’ evaluations of individual sessions identified issues such as low satisfaction scores for the der-matology sessions, where findings did not indicate significant improvement. Exploring the study participants’ and trainers’ views regarding the activity highlighted issues needing improvement such as the quality of training and employee appraisal.
Evaluating the effectiveness of different models of CPD is not new to the literature. As mentioned earlier, CPD is required for all physicians for reasons including improving performance and quality of care [12]. The workloads and structure in primary care mandate a different design and development process. The formats of conducting national and international events such as large audience conferences and big workshops might not always fulfill the purpose. Instructional design is the key tool to establishing a systematic CPD process that can ensure professional improvement, credibility and transparency to the community by analyzing, designing, de-veloping, implementing, and evaluating the CPD education program [11].
6. Conclusion Applying a structured instructional design model for creating professional development program for physicians is a fruitful, relevant experience in primary healthcare. We recommend that this study be repeated on a wider na-tional and international scale.
Declaration of Interest The authors report no declarations of interest.
References [1] Choudary, G.B. and Purnik, S. (2014) A Study on Employee Performance Appraisal in Health Care. Asian Journal of
Management Sciences, 2, 59-64. [2] Toon, P. (1997) Educating Doctors to Improve Patient Care. BMJ, 315, 326.
http://dx.doi.org/10.1136/bmj.315.7104.326 [3] Paterson, K. (2002) The Professional Development of Principals: Innovations and Opportunities. Educational Admin-
istration Quarterly, 38, 213-232. http://dx.doi.org/10.1177/0013161X02382006 [4] Towle, A. (1998) Changes in Health Care and Continuing Medical Education for the 21st Century. BMJ, 316, 301-304.
http://dx.doi.org/10.1136/bmj.316.7127.301 [5] Brigley, S., Young, Y., Littlejohn, P. and McEwen, J. (1998) Continuing Education for Medical Professionals: A Ref-

R. K. Almomen et al.
544
lective Model. Postgraduate Medical Journal, 73, 23-26. [6] Booth, B. (1997) Does Continuing Medical Education Make a Difference? Medical Journal of Australia, 167, 236-237. [7] Davis, D.A., Thomson, M.A., Oxman, A.D. and Haynes, R.B. (1995) Changing Physician Performance: A Systematic
Review of the Effect of Continuing Medical Education Strategies. JAMA, 274, 700-705. http://dx.doi.org/10.1001/jama.1995.03530090032018
[8] Moellem, M. (2001) Applying Constructivist and Objectivist Learning Theories in the Design of a Web-Based Course: Implications for Practice. Educational Technology & Society, 4, 113-125.
[9] Lee, J. and Jang, S. (2014) A Methodological Framework for Instructional Design Model Development: Critical Di-mensions and Synthesized Procedures. Educational Technology Research and Development, 62, 743-765. http://dx.doi.org/10.1007/s11423-014-9352-7
[10] Morrison, G.R. (2010) Designing Effective Instruction. 6th Edition, John Wiley & Sons, Hoboken, New Jersey. [11] Department of Health (2015) Allied Health Professions Project: Demonstrating Competence through Continuing Pro-
fessional Development [CPD]. http://webarchive.nationalarchives.gov.uk/+/www.dh.gov.uk/en/consultations/closedconsultations/DH_4071458
[12] Battles, J.B. (2006) Proving Patient Safety by Instructional Systems Design. Quality & Safety in Health Care, 15, 25- 29. http://dx.doi.org/10.1136/qshc.2005.015917
[13] COT-for-MRCGP-Workplace-Based-Assessment (2015). http://www.rcgp.org.uk/training-exams/mrcgp-workplace-based-assessment-wpba/cot-for-mrcgp-workplace-based-assessment.aspx

R. K. Almomen et al.
545
Appendix 1: Needs Assessment Dear colleague:
As an endeavor to promote doctors’ performance in the division, we seek your collaboration as a member to actively participate in the doctors’ on-the-job training program. In order to tailor the program to the needs and demands of the doctors, we ask you to complete this form. The results will help us to build up a program that responds to your needs and helps enhance your competencies and performance.
Name: (optional) Doctor’s title: Registrar Resident Have you had formal training in family medicine: Yes No How many years of training have you had in family medicine? Years: ____ How many years of experience in family medicine do you have? Years: ____ Do you have any special area of interest? Yes No Please specify _______________________________________ Have you had any training in the doctor-patient interaction/ commutation skills? Yes No Regarding the previous question, what type of training have you had? Formal Non-formal Other (please explain) ______________________________________ Plan of activities: What is your preferred frequency for this program? Daily Twice a week Weekly What is/are your preferred form/s of learning?
Lecture Group discussion
One-to-one Clinical observation
Case-based discussion Peer review
Other (please specify) __________________________________________________
Would you prefer practical sessions? Yes No Would you like to have sessions on special procedures and hands-on skills? Yes No Others (please specify) ____________________________________________________________ In what areas of your daily work do you feel that you need improvement?
Main area Specify topic(s)
• Adult medicine
• Pediatrics
• Geriatric
• Women’s health
• Psychiatry
• Derma
• Eye
• ENT
• Prevention
• Lab
• Imaging
• Other
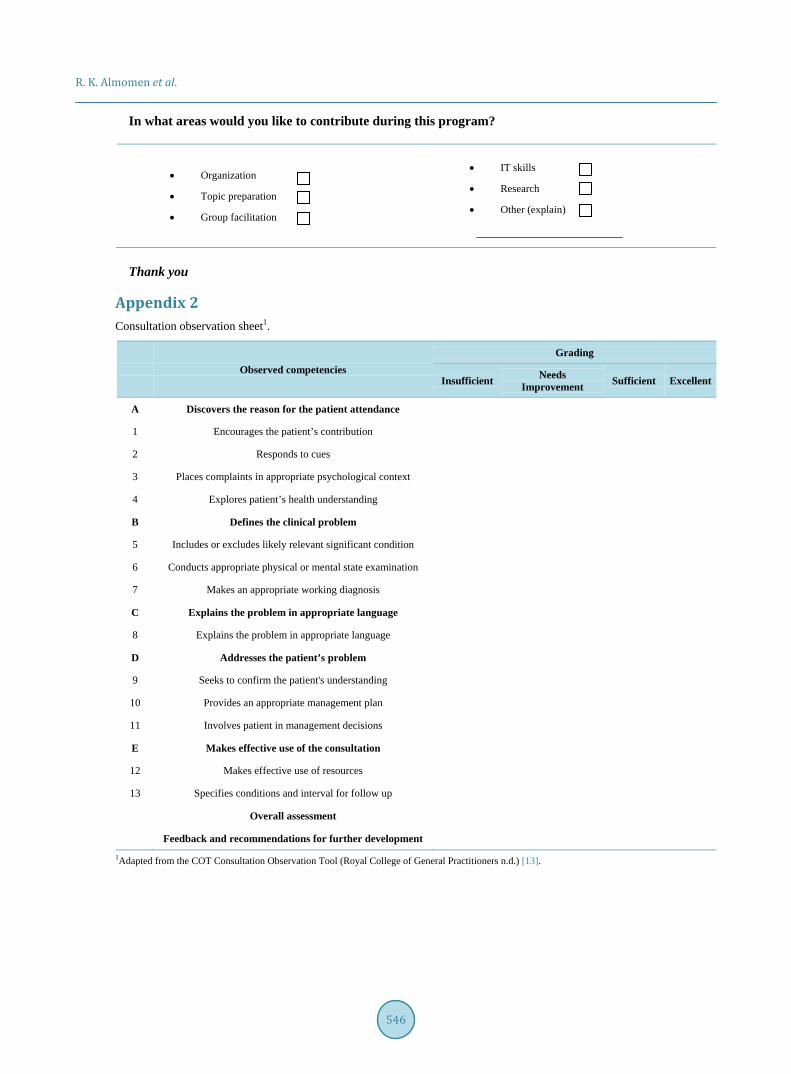
R. K. Almomen et al.
546
In what areas would you like to contribute during this program?
• Organization
• Topic preparation
• Group facilitation
• IT skills
• Research
• Other (explain)
Thank you
Appendix 2 Consultation observation sheet1.
Observed competencies Grading
Insufficient Needs Improvement Sufficient Excellent
A Discovers the reason for the patient attendance
1 Encourages the patient’s contribution
2 Responds to cues
3 Places complaints in appropriate psychological context
4 Explores patient’s health understanding
B Defines the clinical problem
5 Includes or excludes likely relevant significant condition
6 Conducts appropriate physical or mental state examination
7 Makes an appropriate working diagnosis
C Explains the problem in appropriate language
8 Explains the problem in appropriate language
D Addresses the patient’s problem
9 Seeks to confirm the patient's understanding
10 Provides an appropriate management plan
11 Involves patient in management decisions
E Makes effective use of the consultation
12 Makes effective use of resources
13 Specifies conditions and interval for follow up
Overall assessment
Feedback and recommendations for further development
1Adapted from the COT Consultation Observation Tool (Royal College of General Practitioners n.d.) [13].

International Journal of Clinical Medicine, 2016, 7, 547-557 Published Online August 2016 in SciRes. http://www.scirp.org/journal/ijcm http://dx.doi.org/10.4236/ijcm.2016.78060
How to cite this paper: Awotidebe, T.O., Adedoyin, R.A., Balogun, M.O., Adebayo, R.A., Adeyeye, V.O., Oke, K.I., Ativie, R.N., Akintomide, A.O. and Akindele, M.O. (2016) Effects of Cardiac Rehabilitation Exercise Protocols on Physical Function in Pa-tients with Chronic Heart Failure: An Experience from a Resource Constraint Nation. International Journal of Clinical Medi-cine, 7, 547-557. http://dx.doi.org/10.4236/ijcm.2016.78060
Effects of Cardiac Rehabilitation Exercise Protocols on Physical Function in Patients with Chronic Heart Failure: An Experience from a Resource Constraint Nation Taofeek O. Awotidebe1*, Rufus A. Adedoyin1, Michael O. Balogun2,3, Rasaq A. Adebayo2,3, Victor O. Adeyeye3, Kayode I. Oke4, Rita N. Ativie5, Anthony O. Akintomide2,3, Mukadas O. Akindele6 1Department of Medical Rehabilitation, College of Health Sciences, Obafemi Awolowo University, Ile-Ife, Nigeria 2Department of Medicine, College of Health Sciences, Obafemi Awolowo University, Ile-Ife, Nigeria 3Cardiac Care Unit, Obafemi Awolowo University Teaching Hospitals Complex, Ile-Ife, Nigeria 4Department of Physiotherapy, School of Medical Sciences, University of Benin, Benin, Nigeria 5Department of Medical Rehabilitation, College of Health Sciences and Technology, University of Nigeria, Enugu Campus, Enugu, Nigeria 6Department of Physiotherapy, College of Allied Health Sciences, Bayero University Kano, Kano State, Nigeria
Received 8 July 2016; accepted 14 August 2016; published 17 August 2016
Copyright © 2016 by authors and Scientific Research Publishing Inc. This work is licensed under the Creative Commons Attribution International License (CC BY). http://creativecommons.org/licenses/by/4.0/
Abstract Objective: This study investigated the effects of cardiac rehabilitation exercise protocols on phys-ical function (PF) in patients with chronic heart failure (CHF). Study Design and Setting: This ran-domized controlled trial recruited 70 patients who are in stage II CHF with ejection fraction (≤40%) from a Nigerian university teaching hospital. They were randomly assigned into Exercise Group (EG: n = 35) or Control Group (CG: n = 35). Physical function, activity of daily living (ADL), distance walked in six minutes and grip strength were assessed using a validated ADL question-naire, six minute walk test and a hand dynamometer respectively. In addition to medication, EG underwent aerobic and upper extremity resistance exercises thrice weekly for eight weeks while CG used medications only. Data were analyzed using descriptive and inferential statistics. Alpha level was at p < 0.05. Results: EG and CG were comparable in age and physical characteristics. Physical function and cardiovascular parameters were comparable at baseline (p > 0.05). Signifi-cant improvements were noticed at fourth week among participants’ ADL (30.0% ± 6.0%), 6MWD (321.7 ± 26.3 m) and VO2 max (8.9 ± 0.4 mL/kg/min) variables within the exercise EG but no sig-
*Corresponding author.
T. O. Awotidebe et al.
548
nificant changes were observed in the CG (p > 0.05). Participants in EG demonstrated more signif-icant improvements in ADL (15.0% ± 5.0%), 6MWD (406.0 ± 29.7 m) and VO2 max (10.3 ± 0.5 mL/kg/min) (p < 0.05) than CG: ADL (42.0% ± 5.0%), 6MWD (321.0 ± 25.7 m) and VO2 max (8.9 ± 0.4 mL/kg/min) at eighth (p > 0.05). Conclusions: Cardiac rehabilitation exercise protocols involving self-paced walking, sit-to-stand and upper extremity dynamic strength training improved activity of daily living, walking and functional capacity in patients with stable chronic heart failure.
Keywords Cardiac Rehabilitation Exercise, Physical Function, Heart Failure
1. Introduction In the recent time, the prevalence of Chronic Heart Failure (CHF) is on the increase globally [1]. The increasing prevalence has been attributed to rise in aged population, improvement in health and medical services [2]. In sub-Saharan Africa (SSA), the actual prevalence estimate of CHF is not known but hospital admission rate of 3.0% and 7.0% has been reported [3]. In addition, two separate studies in Nigeria, Adedoyin and Adesoye [4] and Ojji et al. [5] reported prevalence rates of 3.5% and 4.3% respectively.
There are evidence that major advances in pharmacological and device therapies have improved survival rate of patients with CHF; however, many remain burdened with exercise intolerance and disability [6] [7]. Exercise is the central element and the building block for improving physical function such as grasping, transferring, walking capacity that are required for activities of daily living [8] [9]. In turn, improved physical function pre-dicts survival and is associated with significant reduction in hospitalization and all-cause mortality in CHF [10].
Although, there are many exercise regimens in the literature, there is controversy on studies related CHF re-habilitation. A systematic review of literature shows that majority of studies used cycle ergometer or combined exercise programmes including treadmill walk and resistance training or jogging [11]. However, none of the studies attempted to assess patients’ acceptance of such exercise protocols and their ability to adopt such proce-dures on an individual long-term basis that may enhance sustainability and adherence practice [11] [12].
The National Institutes of Health Roadmap Initiative and the Patient Reported Outcomes Measurement In-formation System (PROMIS) have recommended activities involving mobility (lower extremity), dexterity (up-per extremity), axial or central (neck and back function) for optimal physical function [13]. However, exercise protocols involving upper extremity, self-paced walking and trunk muscles activation closely mimic activities of daily living that may be better suited as functional exercises [14]. The appropriate exercise protocols that will serve as the first line of exercise interventions for improving physical function in patients with CHF are still a challenge [15]. For example, exercise prescription including exercise intensity, frequency and duration vary across studies [16]. Furthermore, few studies have explored specific exercise training that is tailored towards improving physical function in patients with CHF. Also, studies investigating the effects of self-paced walk ex-ercise, sit-to-stand and upper extremity resistance training on physical function in patients with CHF are scant.
Cardiac rehabilitation programmes are well established in the developed nations with significant improvement in quality of life and prevention of deconditioning among patients with cardiac problems. Apart from limited resources and experts in the field of cardiac rehabilitation, physician are not routinely referring patients for re-habilitation, because many still have the notion that exercise may exacerbate the cardiac condition. This study was designed and executed jointly with cardiologists with a view of establishing the role of structured exercise in patients with cardiac challenges in developing nations. This study investigated the effects of cardiac rehabili-tation exercise including self-paced walking exercise, sit-to-stand and upper extremity resistance training on physical function among patients with CHF.
2. Methods 2.1. Study Sample This study was a randomized controlled trial. Participants for this study were patients with chronic heart failure who were attending the medical outpatient, Cardiac Care Unit of the Obafemi Awolowo University Teaching
T. O. Awotidebe et al.
549
Hospitals Complex (OAUTHC), Ile-Ife, Nigeria. Eligibility for participation included patients whose ages were 50 years and older, a clinical diagnosis of CHF, stage II stable CHF using the New York Heart Association (NYHA) functional classification. Furthermore, the Left Ventricular Ejection Fraction (LVEF) was less than 40% using echo-graphic assessment results obtained by the cardiologists (MOB2 and RAA2). Patients who pre-sented with unstable angina pectoris, severe medical conditions and musculoskeletal or neurological disorders limiting participation in exercise were excluded. Furthermore, recent history of participation in exercise pro-gramme or patients whose condition may require change of medications during the course of this study were ex-cluded.
The study was carried at a teaching hospital that was founded on integrated comprehensive health-care ser-vices based on pyramidal structure designed to secure excellent and efficient health-care services. The institution provides health-care services to more than 10 million Nigerians in South West Zone of Nigeria. The hospital is the first to provide kidney transplant service in the West Africa sub-region and also known as one of the leading hospitals for cardiovascular disease management which covers Ondo, Osun, Oyo, Ekiti, Edo and part of Kwara State [4].
Participants were recruited consecutively using purposive sampling technique and randomly assigned into Exercise Group (EG) (males = 18, females = 17) or Control Group (CG) (males = 14, females = 21). Randomi-zation was performed by a research assistant using computer generated random number. The sample size for this study was based on an effect size according to Pozehl et al. [17], at 80% power with a two-tailed significance level of 0.05 and for detecting a standardized effect size (Δ = 0.47) in outcome for the two groups. A total sam-ple size of 30 was obtained for each group. Owing to possible attrition, the sample size was increased to 35 in each group. Ninety-two patients with CHF were invited into the study, however, 12 patients declined participa-tion due to personal reasons while 10 were excluded for not satisfying the inclusion criteria. Consequently, a to-tal number of 70 eligible patients were recruited to accommodate for possible attrition. However, only 63 of the patients completed the eight week programme. Reasons for attrition in both groups included patients’ relocation, personal reasons and change in medications were stated in CONSORT (Figure 1).
2.2. Procedure The purpose of the study was explained to the participants before obtaining an informed consent. Socio-demo- graphic information, social history and current medications prescribed by the attending cardiologists were rec-orded. Anthropometric characteristics were measured using standard procedures. Cardiovascular parameters of resting heart rate, systolic and diastolic blood pressures were measured in sitting position using a validated elec-tronic sphygmomanometer. Participants in EG underwent exercise treadmill test before the commencement of exercise training using the modified Bruce protocol. Participants were encouraged to reach symptom-limited maximal exercise. Age-predicted maximal heart rate was defined as 220 minus age (years).
2.2.1. Assessment of Physical Function Hand Grip Strength Measure: Hand grip strength was assessed with an electronic Camry hand grip dynamo-
meter (Model EH 101) based on the guideline of the American Society of Hand Therapists [18]. Participants squeezed the dynamometer maximally in order to obtain the grip strength reading. Two measurements were taken for each upper extremity with a 2-minutes rest interval; the average was recorded in kilogram-force (Kgf) as grip strength value.
Six-Minute Walk Test (6-MWT): The Six-Minute Walk Test (6-MWT) was performed on a 30 meter level cor-ridor using the American Thoracic Society guidelines [19]. Participants were instructed to walk from the starting point to the end of the corridor at their own selected pace while attempting to cover as much ground as possible in six minutes and the distance covered was recorded. They were encouraged every 30 seconds or more in a standardized manner by saying: “You are doing well” or “Keep up the good work”. The functional capacity (Maximum Oxygen Consumption (VO2 max)) of participants was estimated using the predictive equation by the American College of Sport Medicine formulae [20].
Computation: VO2 max (mL O2 kg/min) = Speed (m/min) × 0.1 mL/O2/kg + 3.5 mL/O2/kg/min. Activity of Daily Living (ADL): Multi-Dimensional Health Assessment Questionnaire (MDHAQ) was used to
assess Activity of Daily Living (ADL) [21]. The MDHAQ consists of 10 items measuring activities of daily liv-ing (ADL) over the last week. The scale is a 4-point Likert-type ranging from “without any difficulty” = 0, “with

T. O. Awotidebe et al.
550
Figure 1. Flowchart for recruitment of patients into the study.
some difficulty” = 1, “with much difficulty” = 2 and “unable to do” = 3. Total score was summed up and trans-formed thus; 100 × (observed score − minimum possible score)/(maximum possible score − minimum possible score. The higher the score the lesser the activity of daily living.
2.2.2. Exercise Intervention Protocols Parts of the body targeted at improving functions were lower extremity (mobility), upper extremity (dexterity), neck and back function (axial or central). Participants in the EG in addition to pharmacological therapy under-went aerobic and resistance exercises involving self-paced walking, sit to stand exercise, strength training exer-cise thrice weekly for eight weeks. However, participants in the CG had pharmacological therapy only. Exercise intervention was supervised by (TOA1 and RAA1). Each participant’s training programme was individualized and based on the results of the baseline exercise tests. Exercise intensities, frequency and duration listed in Ta-ble 1 and Table 2 served as a guide for exercise prescription
Station 1: Self-paced walking: Participant performed self-paced walking on a 30 meter level corridor for a pe-riod of 6 minutes twice per session. During the subsequent weeks, self-paced walking duration was increased progressively by 1 minute on weekly basis.
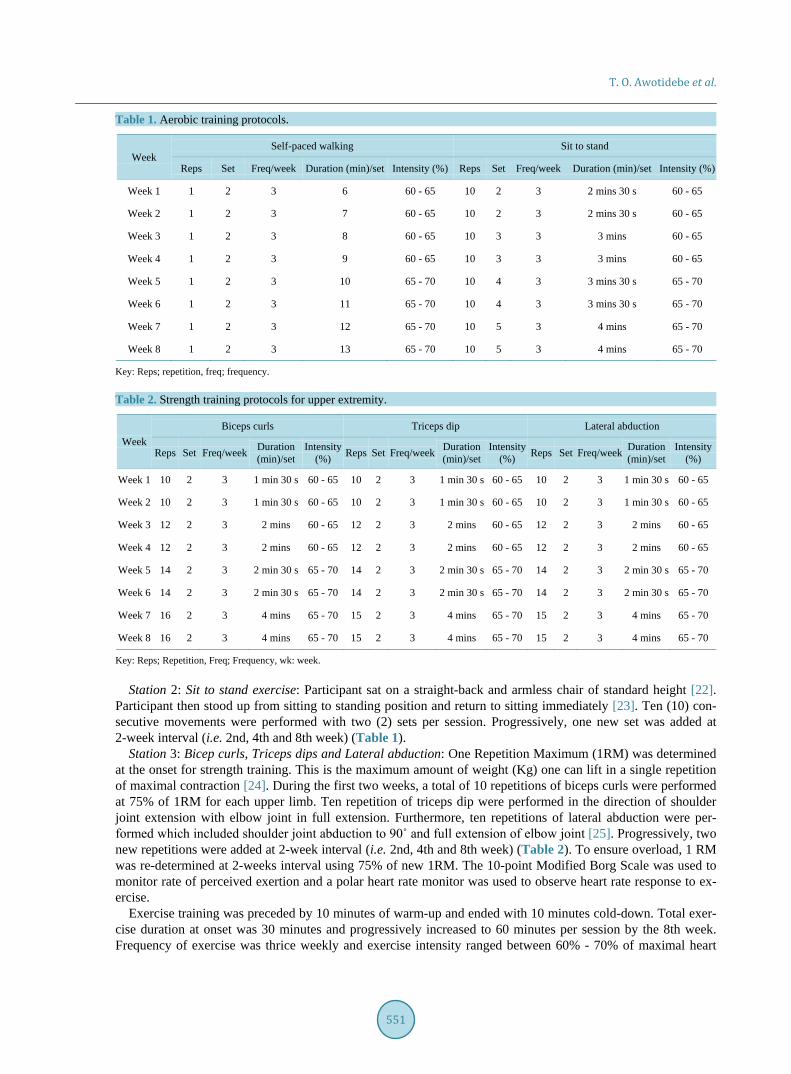
T. O. Awotidebe et al.
551
Table 1. Aerobic training protocols.
Week Self-paced walking Sit to stand
Reps Set Freq/week Duration (min)/set Intensity (%) Reps Set Freq/week Duration (min)/set Intensity (%)
Week 1 1 2 3 6 60 - 65 10 2 3 2 mins 30 s 60 - 65
Week 2 1 2 3 7 60 - 65 10 2 3 2 mins 30 s 60 - 65
Week 3 1 2 3 8 60 - 65 10 3 3 3 mins 60 - 65
Week 4 1 2 3 9 60 - 65 10 3 3 3 mins 60 - 65
Week 5 1 2 3 10 65 - 70 10 4 3 3 mins 30 s 65 - 70
Week 6 1 2 3 11 65 - 70 10 4 3 3 mins 30 s 65 - 70
Week 7 1 2 3 12 65 - 70 10 5 3 4 mins 65 - 70
Week 8 1 2 3 13 65 - 70 10 5 3 4 mins 65 - 70
Key: Reps; repetition, freq; frequency.
Table 2. Strength training protocols for upper extremity.
Week Biceps curls Triceps dip Lateral abduction
Reps Set Freq/week Duration (min)/set
Intensity (%) Reps Set Freq/week Duration
(min)/set Intensity
(%) Reps Set Freq/week Duration (min)/set
Intensity (%)
Week 1 10 2 3 1 min 30 s 60 - 65 10 2 3 1 min 30 s 60 - 65 10 2 3 1 min 30 s 60 - 65
Week 2 10 2 3 1 min 30 s 60 - 65 10 2 3 1 min 30 s 60 - 65 10 2 3 1 min 30 s 60 - 65
Week 3 12 2 3 2 mins 60 - 65 12 2 3 2 mins 60 - 65 12 2 3 2 mins 60 - 65
Week 4 12 2 3 2 mins 60 - 65 12 2 3 2 mins 60 - 65 12 2 3 2 mins 60 - 65
Week 5 14 2 3 2 min 30 s 65 - 70 14 2 3 2 min 30 s 65 - 70 14 2 3 2 min 30 s 65 - 70
Week 6 14 2 3 2 min 30 s 65 - 70 14 2 3 2 min 30 s 65 - 70 14 2 3 2 min 30 s 65 - 70
Week 7 16 2 3 4 mins 65 - 70 15 2 3 4 mins 65 - 70 15 2 3 4 mins 65 - 70
Week 8 16 2 3 4 mins 65 - 70 15 2 3 4 mins 65 - 70 15 2 3 4 mins 65 - 70
Key: Reps; Repetition, Freq; Frequency, wk: week.
Station 2: Sit to stand exercise: Participant sat on a straight-back and armless chair of standard height [22]. Participant then stood up from sitting to standing position and return to sitting immediately [23]. Ten (10) con-secutive movements were performed with two (2) sets per session. Progressively, one new set was added at 2-week interval (i.e. 2nd, 4th and 8th week) (Table 1).
Station 3: Bicep curls, Triceps dips and Lateral abduction: One Repetition Maximum (1RM) was determined at the onset for strength training. This is the maximum amount of weight (Kg) one can lift in a single repetition of maximal contraction [24]. During the first two weeks, a total of 10 repetitions of biceps curls were performed at 75% of 1RM for each upper limb. Ten repetition of triceps dip were performed in the direction of shoulder joint extension with elbow joint in full extension. Furthermore, ten repetitions of lateral abduction were per-formed which included shoulder joint abduction to 90˚ and full extension of elbow joint [25]. Progressively, two new repetitions were added at 2-week interval (i.e. 2nd, 4th and 8th week) (Table 2). To ensure overload, 1 RM was re-determined at 2-weeks interval using 75% of new 1RM. The 10-point Modified Borg Scale was used to monitor rate of perceived exertion and a polar heart rate monitor was used to observe heart rate response to ex-ercise.
Exercise training was preceded by 10 minutes of warm-up and ended with 10 minutes cold-down. Total exer-cise duration at onset was 30 minutes and progressively increased to 60 minutes per session by the 8th week. Frequency of exercise was thrice weekly and exercise intensity ranged between 60% - 70% of maximal heart
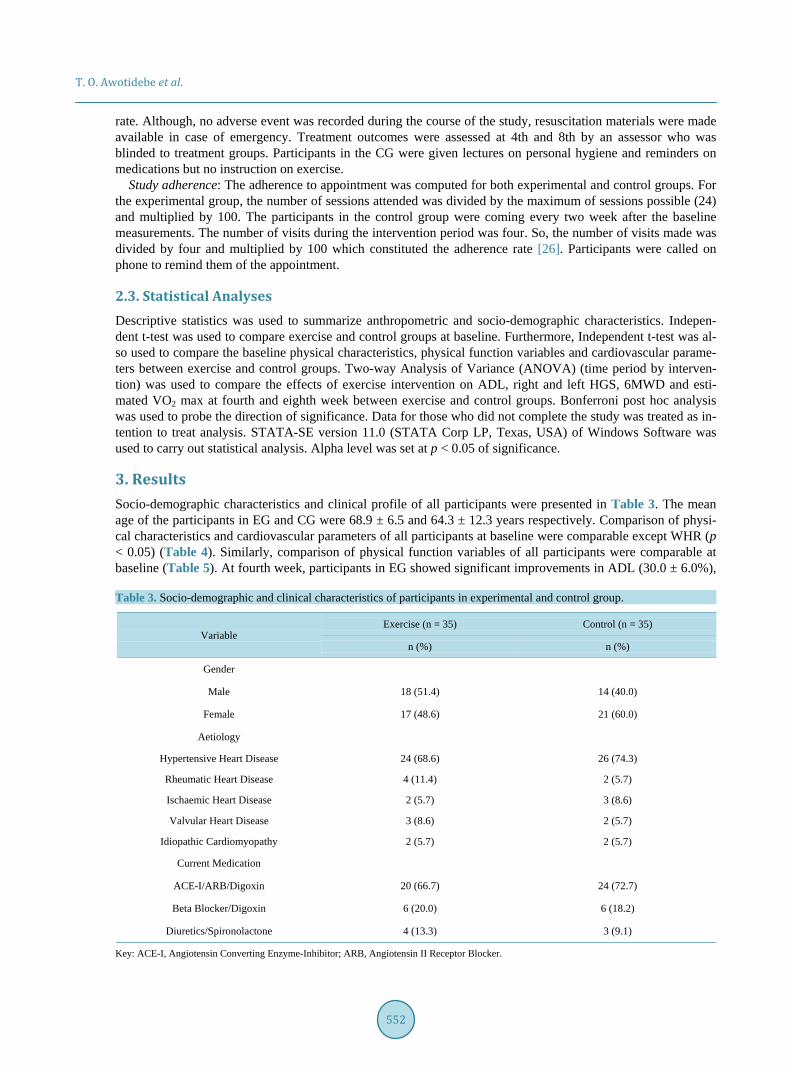
T. O. Awotidebe et al.
552
rate. Although, no adverse event was recorded during the course of the study, resuscitation materials were made available in case of emergency. Treatment outcomes were assessed at 4th and 8th by an assessor who was blinded to treatment groups. Participants in the CG were given lectures on personal hygiene and reminders on medications but no instruction on exercise.
Study adherence: The adherence to appointment was computed for both experimental and control groups. For the experimental group, the number of sessions attended was divided by the maximum of sessions possible (24) and multiplied by 100. The participants in the control group were coming every two week after the baseline measurements. The number of visits during the intervention period was four. So, the number of visits made was divided by four and multiplied by 100 which constituted the adherence rate [26]. Participants were called on phone to remind them of the appointment.
2.3. Statistical Analyses Descriptive statistics was used to summarize anthropometric and socio-demographic characteristics. Indepen-dent t-test was used to compare exercise and control groups at baseline. Furthermore, Independent t-test was al-so used to compare the baseline physical characteristics, physical function variables and cardiovascular parame-ters between exercise and control groups. Two-way Analysis of Variance (ANOVA) (time period by interven-tion) was used to compare the effects of exercise intervention on ADL, right and left HGS, 6MWD and esti-mated VO2 max at fourth and eighth week between exercise and control groups. Bonferroni post hoc analysis was used to probe the direction of significance. Data for those who did not complete the study was treated as in-tention to treat analysis. STATA-SE version 11.0 (STATA Corp LP, Texas, USA) of Windows Software was used to carry out statistical analysis. Alpha level was set at p < 0.05 of significance.
3. Results Socio-demographic characteristics and clinical profile of all participants were presented in Table 3. The mean age of the participants in EG and CG were 68.9 ± 6.5 and 64.3 ± 12.3 years respectively. Comparison of physi-cal characteristics and cardiovascular parameters of all participants at baseline were comparable except WHR (p < 0.05) (Table 4). Similarly, comparison of physical function variables of all participants were comparable at baseline (Table 5). At fourth week, participants in EG showed significant improvements in ADL (30.0 ± 6.0%),
Table 3. Socio-demographic and clinical characteristics of participants in experimental and control group.
Variable Exercise (n = 35) Control (n = 35)
n (%) n (%)
Gender
Male 18 (51.4) 14 (40.0)
Female 17 (48.6) 21 (60.0)
Aetiology
Hypertensive Heart Disease 24 (68.6) 26 (74.3)
Rheumatic Heart Disease 4 (11.4) 2 (5.7)
Ischaemic Heart Disease 2 (5.7) 3 (8.6)
Valvular Heart Disease 3 (8.6) 2 (5.7)
Idiopathic Cardiomyopathy 2 (5.7) 2 (5.7)
Current Medication
ACE-I/ARB/Digoxin 20 (66.7) 24 (72.7)
Beta Blocker/Digoxin 6 (20.0) 6 (18.2)
Diuretics/Spironolactone 4 (13.3) 3 (9.1)
Key: ACE-I, Angiotensin Converting Enzyme-Inhibitor; ARB, Angiotensin II Receptor Blocker.

T. O. Awotidebe et al.
553
Table 4. Physical characteristics and cardiovascular parameters of participants.
Variable Exercise Group (n = 35) Control Group (n = 35)
t-cal. p-value Mean ± S.D Mean ± S.D
Age (years) 68.9 ± 6.5 64.3 ± 12.3 1.32 0.197
Height (m) 1.7 ± 0.1 1.6 ± 0.1 0.56 0.577
Weight (kg) 66.0 ± 12.2 65.3 ± 15.5 0.31 0.758
BMI (kg/m2) 24.2 ± 4.7 23.8 ± 5.2 0.22 0.829
WHR 0.8 ± 0.1 0.9 ± 0.1 −3.23 0.003*
SBP (mmHg) 137.3 ± 17.2 136.8 ± 12.4 0.55 0.243
DBP (mmHg) 84.9 ± 6.3 85.1 ± 2.1 0.32 0.980
RHR (beat/min) 83.7 ± 6.2 83.0 ± 4.9 0.28 0.640
*p < 0.05. Key: BMI: Body Mass Index; WHR: Waist to Hip Ratio; Systolic Blood Pressure; DBP: Diastolic Blood Pressure; RHR: Resting Heart Rate.
Table 5. Baseline comparison of physical function variables between exercise and control groups.
Variable Exercise Group (n = 35) Control Group (n = 35)
t-cal. p-value Mean ± S.D Mean ± S.D
ADL (%) 45.0 ± 10.0 45.0 ±9.5 0.412 0.683
HGS-R (Kgf) 27.4 ± 5.3 25.1 ± 4.3 1.330 0.193
HGS-L (Kgf) 22.6 ± 5.6 21.8 ± 4.8 0.432 0.669
6-MWD (m) 307.7 ± 22.5 309.2 ± 27.8 −0.161 0.873
Estimated VO2 Max (mL/kg/min) 8.6 ± 0.4 8.6 ± 0.5 −0.161 0.873
Keys: ADL, Activity of daily Living; HGS-R, Right hand grip strength; HGS-L, Left hand grip strength; 6-MWD, 6-Minute walk distance; Est.VO2 Max, Estimated maximum oxygen consumption.
6MWD (321.7 ± 26.3 m) and VO2 max (8.9 ± 0.4 mL/kg/min) (p < 0.05) but no significant changes was ob-served in the CG (p > 0.05). Furthermore, participants in EG demonstrated significant improvements in ADL (15.0% ± 5.0%), 6MWD (406.0 ± 29.7 m) and VO2 max (10.3 ± 0.5 mL/kg/min) (p < 0.05) than participants in CG: ADL (42.0% ± 5.0%), 6MWD (321.0 ± 25.7 m) and VO2 max (8.9 ± 0.4 mL/kg/min) at eighth (p > 0.05) at eighth (p > 0.05). There was no significant improvement in both right and left HGS in both groups at fourth and eighth weeks of the study (p > 0.05) (Table 6).
4. Discussion This study investigated the effects self-paced walk exercise, sit to stand exercise and upper extremity resistance training on physical function in patients with stable CHF. The results showed that significant improvement was recorded in the activity of daily living (ADL) following exercise intervention. Our finding is in agreement with previous studies that exercise is capable of restoring functional activity of daily living of patients with chronic diseases [7] [11]. The improvement in ADL could be attributed to an increase in muscular strength and aerobic capacity following exercise training. Exercise has been reported to be useful in reversing pathological changes in CHF by improving muscular strength of atrophied muscles, increasing capillary density and mitochondria content or oxidative enzymes activity [10] [27]. Change in physiologic profile of patients with chronic illnesses often translate to significant increase in ADL such as personal self-care including bathing, dressing and feeding which are the basic building components of physical function.
Findings from our study show that the distance walked in 6 minute (6-MWD) in the exercise group improved significantly post intervention. In agreement with previous studies, exercise in CHF has been reported to lead to
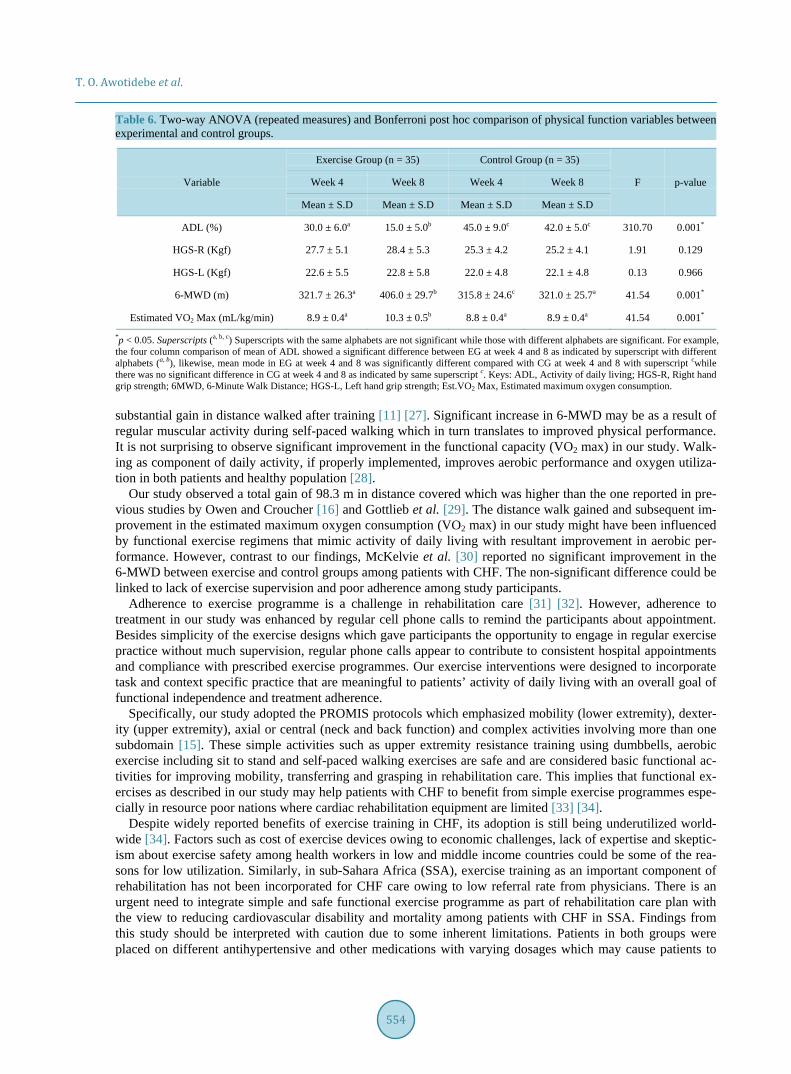
T. O. Awotidebe et al.
554
Table 6. Two-way ANOVA (repeated measures) and Bonferroni post hoc comparison of physical function variables between experimental and control groups.
Variable
Exercise Group (n = 35) Control Group (n = 35)
F p-value Week 4 Week 8 Week 4 Week 8
Mean ± S.D Mean ± S.D Mean ± S.D Mean ± S.D
ADL (%) 30.0 ± 6.0a 15.0 ± 5.0b 45.0 ± 9.0c 42.0 ± 5.0c 310.70 0.001*
HGS-R (Kgf) 27.7 ± 5.1 28.4 ± 5.3 25.3 ± 4.2 25.2 ± 4.1 1.91 0.129
HGS-L (Kgf) 22.6 ± 5.5 22.8 ± 5.8 22.0 ± 4.8 22.1 ± 4.8 0.13 0.966
6-MWD (m) 321.7 ± 26.3a 406.0 ± 29.7b 315.8 ± 24.6c 321.0 ± 25.7a 41.54 0.001*
Estimated VO2 Max (mL/kg/min) 8.9 ± 0.4a 10.3 ± 0.5b 8.8 ± 0.4a 8.9 ± 0.4a 41.54 0.001*
*p < 0.05. Superscripts (a, b, c) Superscripts with the same alphabets are not significant while those with different alphabets are significant. For example, the four column comparison of mean of ADL showed a significant difference between EG at week 4 and 8 as indicated by superscript with different alphabets (a, b), likewise, mean mode in EG at week 4 and 8 was significantly different compared with CG at week 4 and 8 with superscript cwhile there was no significant difference in CG at week 4 and 8 as indicated by same superscript c. Keys: ADL, Activity of daily living; HGS-R, Right hand grip strength; 6MWD, 6-Minute Walk Distance; HGS-L, Left hand grip strength; Est.VO2 Max, Estimated maximum oxygen consumption.
substantial gain in distance walked after training [11] [27]. Significant increase in 6-MWD may be as a result of regular muscular activity during self-paced walking which in turn translates to improved physical performance. It is not surprising to observe significant improvement in the functional capacity (VO2 max) in our study. Walk-ing as component of daily activity, if properly implemented, improves aerobic performance and oxygen utiliza-tion in both patients and healthy population [28].
Our study observed a total gain of 98.3 m in distance covered which was higher than the one reported in pre-vious studies by Owen and Croucher [16] and Gottlieb et al. [29]. The distance walk gained and subsequent im-provement in the estimated maximum oxygen consumption (VO2 max) in our study might have been influenced by functional exercise regimens that mimic activity of daily living with resultant improvement in aerobic per-formance. However, contrast to our findings, McKelvie et al. [30] reported no significant improvement in the 6-MWD between exercise and control groups among patients with CHF. The non-significant difference could be linked to lack of exercise supervision and poor adherence among study participants.
Adherence to exercise programme is a challenge in rehabilitation care [31] [32]. However, adherence to treatment in our study was enhanced by regular cell phone calls to remind the participants about appointment. Besides simplicity of the exercise designs which gave participants the opportunity to engage in regular exercise practice without much supervision, regular phone calls appear to contribute to consistent hospital appointments and compliance with prescribed exercise programmes. Our exercise interventions were designed to incorporate task and context specific practice that are meaningful to patients’ activity of daily living with an overall goal of functional independence and treatment adherence.
Specifically, our study adopted the PROMIS protocols which emphasized mobility (lower extremity), dexter-ity (upper extremity), axial or central (neck and back function) and complex activities involving more than one subdomain [15]. These simple activities such as upper extremity resistance training using dumbbells, aerobic exercise including sit to stand and self-paced walking exercises are safe and are considered basic functional ac-tivities for improving mobility, transferring and grasping in rehabilitation care. This implies that functional ex-ercises as described in our study may help patients with CHF to benefit from simple exercise programmes espe-cially in resource poor nations where cardiac rehabilitation equipment are limited [33] [34].
Despite widely reported benefits of exercise training in CHF, its adoption is still being underutilized world-wide [34]. Factors such as cost of exercise devices owing to economic challenges, lack of expertise and skeptic-ism about exercise safety among health workers in low and middle income countries could be some of the rea-sons for low utilization. Similarly, in sub-Sahara Africa (SSA), exercise training as an important component of rehabilitation has not been incorporated for CHF care owing to low referral rate from physicians. There is an urgent need to integrate simple and safe functional exercise programme as part of rehabilitation care plan with the view to reducing cardiovascular disability and mortality among patients with CHF in SSA. Findings from this study should be interpreted with caution due to some inherent limitations. Patients in both groups were placed on different antihypertensive and other medications with varying dosages which may cause patients to

T. O. Awotidebe et al.
555
respond differently to treatment. Furthermore, baseline physical activity of these patients was not assessed prior commencement of this study. More importantly, patients in our study might be involved in some physical activ-ity which were covert and not monitored during the course of this study. In addition, assessment of ADL in this study was assessed using a self-reported method which is prone to estimation error and recall bias.
5. Conclusions Supervised exercise training protocols involving self-paced walking, sit-to-stand and upper extremity dynamic strength training improved physical function including activity of daily living, walking and functional capacities in patients with stable chronic heart failure. Exercise intervention protocols that are safe and simple, mimicking functional activities and well tolerated among patients with stable chronic heart failure may enhance exercise adherence.
Acknowledgements The authors wish to thank the Consortium for Advanced Research Training in Africa (CARTA) for providing technical support. CARTA is jointly led by the African Population and Health Research Center and the Univer-sity of the Witwatersrand and funded by the Wellcome Trust (UK) (Grant No: 087547/Z/08/Z), the Department for International Development (DfID) under the Development Partnerships in Higher Education (DelPHE), the Carnegie Corporation of New York (Grant No: B 8606), the Ford Foundation (Grant No: 1100-0399), Swedish International Development Corporation Agency—SIDA (grant: 54100029), Google.Org (Grant No: 191994), and MacArthur Foundation Grant No: 10-95915-000-INP.
Ethical Approval The study protocol was approved by the Ethics and Research Committee (ERC/2012/08/04), Obafemi Awolowo University Teaching Hospitals Complex, Ile-Ife, Nigeria.
Presentation Abstract of this study was presented at the Scientific Symposium for Emerging Scholars in Health organized by the African Population and Health Research Centre (APHRC), Hilton Hotel, Nairobi, Kenya, July 15-17, 2013.
Conflict of Interest The author declares that they have no conflict of interest.
References [1] Lloyd-Jones, D., Adams, R.J., Brown, T.M., Carnethon, M., Dai De, S. and Simone, G. (2010) On Behalf of the
American Heart Association Statistics Committee and Stroke Statistics Subcommittee. Heart Disease and Stroke Sta-tistics—2010 Update. A Report from the American Heart Association. Circulation, 121, e1-170.
[2] Bleumink, G.S., Knetsch, A.M., Sturkenboom, M.C., Straus, S.M., Hofman, A. and Deckers, J.W. (2004) Quantifying the Heart Failure Epidemic: Prevalence, Incidence Rate, Lifetime Risk and Prognosis of Heart Failure. The Rotterdam Study. European Heart Journal, 25, 1614-1619. http://dx.doi.org/10.1016/j.ehj.2004.06.038
[3] Kingue, S., Dzudie, A., Menanga, A., Akono, M., Ouankou, M. and Muna, W. (2005) A New Look at Adult Chronic Heart Failure in Africa in the Age of the Doppler Echocardiography: Experience of the Medicine Department at Yaounde General Hospital. Annales de Cardiologie et d Angéiologie (Paris), 54, 276-283. http://dx.doi.org/10.1016/j.ancard.2005.04.014
[4] Adedoyin, R.A. and Adesoye, A.T. (2005) Incidence and Pattern of Cardiovascular Diseases in a Nigerian Hospital. Tropical Doctor, 35, 104-106.
[5] Ojji, D.B., Alfa, J., Ajayi, S.O., Mamven, M.H. and Falase, A.O. (2009) Pattern of Heart Failure in Abuja, Nigeria: An Echocardiographic Study. Cardiovascular Journal of Africa, 20, 349-352.
[6] Damasceno, A., Cotter, G., Dzudie, A., Sliwa, K. and Mayosi, B.M. (2007) Heart Failure in Sub-Saharan Africa: Time for Action. Journal of the American College of Cardiology, 50, 1688-1693. http://dx.doi.org/10.1016/j.jacc.2007.07.030
[7] Rees, K., Taylor, R.S., Singh, S., Coats, A.J. and Ebrahim, S. (2004) Exercise Based Rehabilitation for Heart Failure

T. O. Awotidebe et al.
556
(Cochrane Review). In: The Cochrane Library, John Wiley, Chichester, 3. [8] Boxer, R.S., Wang, Z., Walsh, S.J., Hager, D. and Kenny, A.M. (2008) The Utility of the 6-Minute Walk Test as a
Measure of Frailty in Older Adults with Heart Failure. The American Journal of Geriatric Cardiology, 17, 7-12. http://dx.doi.org/10.1111/j.1076-7460.2007.06457.x
[9] Ajiboye, O.A., Anigbogu, C.N., Ajuluchukwu, J.N. and Jaja, S.I. (2014) Exercise Training Improves Functional Walking Capacity and Activity Level of Nigerians with Chronic Biventricular Heart Failure. Hong Kong Physiothera-py, 33, 42-49. http://dx.doi.org/10.1016/j.hkpj.2014.11.002
[10] O’Connor, C.M., Whellan, D.J., Lee, K.L., Keteyian, S.J., Cooper, L.S. and Ellis, S.J. (2009) Efficacy and Safety of Exercise Training in Patients with Chronic Heart Failure: HF-ACTION Randomized Controlled Trial. JAMA, 301, 1439-1450. http://dx.doi.org/10.1001/jama.2009.454
[11] Lloyd-Williams, F., Mair, F.S. and Leitner, M. (2002) Exercise Training and Heart Failure: A Systematic Review of the Current Evidence. British Journal of General Practice, 52, 47-55.
[12] Piña, I.L., Apstein, C.S., Balady, G.J., Belardinelli, R., Chaitman, B.R., Duscha, B.D., et al. (2003) Exercise and Heart Failure: A Statement from the American Heart Association Committee on Exercise, Rehabilitation, and Prevention. Circulation, 107, 1210-1225. http://dx.doi.org/10.1161/01.CIR.0000055013.92097.40
[13] Cella, D., Yount, S., Rothrock, N., Gershon, R., Cook, K., Reeve, B., et al. (2007) The Patient Reported Outcomes Measurement Information System (PROMIS): Progress of an NIH Roadmap Cooperative Group during Its First Two Years. Medical Care, 45, 3-11. http://dx.doi.org/10.1097/01.mlr.0000258615.42478.55
[14] Berg-Emons, van den H.J.G., Bussmann, J., Balk, A., Keijzer-Oster, D. and Stam, H. (2001) Level of Activities Asso-ciated with Mobility during Everyday Life in Patients with Chronic Congestive Heart Failure as Measured with an Ac-tivity Monitor. Physical Therapy, 81, 1502-1511.
[15] Thompson, P.D. (2005) Exercise Prescription and Proscription for Patients with Coronary Artery Disease. Circulation, 112, 2354-2363. http://dx.doi.org/10.1161/CIRCULATIONAHA.104.502591
[16] Owen, A. and Croucher, L. (2000) Effect of an Exercise Programme for Elderly Patients with Heart Failure. European Journal of Heart Failure, 2, 65-70. http://dx.doi.org/10.1016/S1388-9842(99)00067-7
[17] Pozehl, B., Duncan, K., Hertzog, M. and Norman, J.F. (2010) Heart Failure Exercise and Training Camp: Effects of a Multicomponent Exercise Training Intervention in Patients with Heart Failure. Heart Lung, 39, S1-S13. http://dx.doi.org/10.1016/j.hrtlng.2010.04.008
[18] American Society of Hand Therapists (ASHT Editor) (1981) Clinical Assessment Recommendations. Garner, NC. [19] American Thoracic Society (ATS) Statement (2000) Guidelines for the Six-Minute Walk Test. American Journal of
Respiratory and Critical Care Medicine, 166, 111-117. [20] American College of Sport Medicine (ACSM) (1995) Prediction of Maximum Oxygen Consumption VO2 Max during
Level Walking. [21] Pincus, T., Sokka, T. and Kautiainen, H. (2005) Further Development of a Physical Function Scale on a Multidimen-
sional Health Assessment Questionnaire for Standard Care of Patients with Rheumatic Diseases. Journal of Rheuma-tology, 32, 1432-1439.
[22] Miller, J. (2009) Chairs. Conran, Mannheim, Deutschland. [23] Canning, C.G., Shepherd, R.B., Carr, J.H., Alison, J.A., Wade, L. and White, A. (2003) A Randomized Controlled Tri-
al of the Effects of Intensive Sit-to-Stand Training after Recent Traumatic Brain Injury on Sit-to-Stand Performance. Clinical Rehabilitation, 17, 355-362. http://dx.doi.org/10.1191/0269215503cr620oa
[24] Hetherington, N. (2005) How to Assess Your One Repetition Maximum (1RM) for Strength Training. In: Brian Mackenzie’s Successful Coaching, 2nd Edition, Electric Word Plc., 10-11.
[25] Pollock, M.L., Franklin, B.A., Balady, G.J., Chaitman, B.L., Fleg, J.L., Fletcher, B., et al. (2000) Resistance Exercise in Individuals with and without Cardiovascular Disease: Benefits, Rationale, Safety, and Prescription: An Advisory from the Committee on Exercise, Rehabilitation, and Prevention, Council on Clinical Cardiology. American Heart As-sociation, Position Paper Endorsed by the American College of Sports Medicine, AHA Science Advisory, Circulation, 101, 828-833. http://dx.doi.org/10.1161/01.cir.101.7.828
[26] Maruf, F.A., Akinpelu, A.O. and Salako, B.L (2013) Self-Reported Quality of Life before and after Aerobic Exercise Training in Individuals with Hypertension: A Randomized-Controlled Trial. Applied Psychology: Health and Well- Being, 5, 209-224. http://dx.doi.org/10.1111/aphw.12005
[27] Kiilavuori, K., Naveri, H., Salmi, T. and Harkonen, M. (2000) The Effect of Physical Training on Skeletal Muscle in Patients with Chronic Heart Failure. European Journal of Heart Failure, 2, 53-63. http://dx.doi.org/10.1016/S1388-9842(00)00058-1
[28] Hulsmann, M., Quittan, M. and Berger, R. (2004) Muscle Strength as a Predictor of Long Term Survival in Severe

T. O. Awotidebe et al.
557
Congestive Heart Failure. European Journal of Heart Failure, 6, 101-107. http://dx.doi.org/10.1016/j.ejheart.2003.07.008
[29] Gottlieb, S.S., Fisher, M.L. and Freudenberger, R. (1999) Effects of Exercise Training on Peak Performance and Qual-ity of Life in Congestive Heart Failure Patients. Journal of Cardiac Failure, 5, 188-194. http://dx.doi.org/10.1016/S1071-9164(99)90002-7
[30] McKelvie, R.S. (2003) Heart Failure. Clinical Evidence, 9, 95-118. [31] Jackson, L., Leclerc, J., Erskine, Y. and Linden, W. (2005) Getting the Most out of Cardiac Rehabilitation: A Review
of Referral and Adherence Predictors. Heart (British Cardiac Society), 91, 10-14. http://dx.doi.org/10.1136/hrt.2004.045559
[32] Jack, K. McLean, S.M., Moffett, J.K. and Gardinerc, E. (2010) Barriers to Treatment Adherence in Physiotherapy Outpatient Clinics: A Systematic Review. Manual Therapy, 15, 220-228. http://dx.doi.org/10.1016/j.math.2009.12.004
[33] Adedoyin, R.A., Adeyanju, S.A., Balogun, M.O., Akintomide, A.O., Adebayo, R.A., Akinwusi, P.O., et al. (2010) As-sessment of Exercise Capacity in African Patients with Chronic Heart Failure Using Six Minute-Walk. International Journal of General Medicine, 3, 109-113. http://dx.doi.org/10.2147/IJGM.S5533
[34] Mampuya, W.M. (2012) Cardiac Rehabilitation Past, Present and Future: An Overview. Cardiovascular Diagnosis and Therapy, 2, 38-49.
Submit or recommend next manuscript to SCIRP and we will provide best service for you: Accepting pre-submission inquiries through Email, Facebook, LinkedIn, Twitter, etc. A wide selection of journals (inclusive of 9 subjects, more than 200 journals) Providing 24-hour high-quality service User-friendly online submission system Fair and swift peer-review system Efficient typesetting and proofreading procedure Display of the result of downloads and visits, as well as the number of cited articles Maximum dissemination of your research work
Submit your manuscript at: http://papersubmission.scirp.org/
9 772158 284007 80


