DYNAMIC FINANCIAL LINKAGES OF JAPAN AND ASEAN ECONOMIES: EVIDENCE BASED ON REAL INTEREST PARITY AHMAD ZUBAIDI BAHARUMSHAH CHAN TZE HAW Faculty of Economics and Management Universiti Putra Malaysia KHONG WYE LEONG ROY Faculty of Business and Law Multimedia University ABSTRACT This article provides empirical evidence on the dynamic linkages of real interest rates among the ASEAN-5 during the post-liberalisation era (1984-1997). The upshots of our findings are four-fold. Firstly, there were co-movement of ASEAN real rates in the long-run and dynamic causalities in the short-run, which explicitly indicated monetary inter-dependency among the ASEAN countries. Secondly, most of the forecast error variance of real interest rates in own country can be attributed to other ASEAN-4’s innovations (more than 50%), which partly explains the contagion effects during the Asia crisis of 1997/98. Thirdly, the real interest differentials are mean reverting over time, implying that RIP holds between ASEAN-Japan (except Singapore) and ASEAN-US. Forthly, the deviations from RIP have half-lives of around 6 to 11 months, meaning RIP adjustments change rapidly to its parity of equilibrium value. All in all, this finding supports the recent proposal of Currency Union with the Japanese yen taken as common currency. Keywords: Interest linkages; real interest differentials; mean reversion; half- life; financial integration. JEL Classification: F15, F36, C32, C51 ABSTRAK Artikel ini memberi bukti empirik berkaitan hubungan dinamik kadar bunga benar antara ASEAN-5 semasa tempoh lepas-liberalisasi (1984-1997). Empat IJMS 14 (1), 23-48 (2007)
Transcript
DYNAMIC FINANCIAL LINKAGES OF JAPANAND ASEAN ECONOMIES: EVIDENCE BASED
ON REAL INTEREST PARITY
AHMAD ZUBAIDI BAHARUMSHAHCHAN TZE HAW
Faculty of Economics and ManagementUniversiti Putra Malaysia
KHONG WYE LEONG ROYFaculty of Business and Law
Multimedia University
ABSTRACT
This article provides empirical evidence on the dynamic linkages of real interestrates among the ASEAN-5 during the post-liberalisation era (1984-1997).The upshots of our findings are four-fold. Firstly, there were co-movement ofASEAN real rates in the long-run and dynamic causalities in the short-run,which explicitly indicated monetary inter-dependency among the ASEANcountries. Secondly, most of the forecast error variance of real interest rates inown country can be attributed to other ASEAN-4’s innovations (more than50%), which partly explains the contagion effects during the Asia crisis of1997/98. Thirdly, the real interest differentials are mean reverting over time,implying that RIP holds between ASEAN-Japan (except Singapore) andASEAN-US. Forthly, the deviations from RIP have half-lives of around 6 to11 months, meaning RIP adjustments change rapidly to its parity ofequilibrium value. All in all, this finding supports the recent proposal ofCurrency Union with the Japanese yen taken as common currency.
Keywords: Interest linkages; real interest differentials; mean reversion; half-life; financial integration.JEL Classification: F15, F36, C32, C51
ABSTRAK
Artikel ini memberi bukti empirik berkaitan hubungan dinamik kadar bungabenar antara ASEAN-5 semasa tempoh lepas-liberalisasi (1984-1997). Empat
IJMS 14 (1), 23-48 (2007)w
ww
.ijm
s.uu
m.e
du.m
y
24 IJMS 14 (1), 23-48 (2007)
penemuan utama dirumuskan. Pertama, wujudnya pergerakan bersama jangkapanjang dan aliran penyebab dinamik jangka pendek kadar bunga benar antaranegara-negara ASEAN, dengan jelas menunjukkan pergantungan monetaridi antara negara-negara tersebut. Kedua, kebanyakan varians ralat ramalankadar bunga benar di negara sendiri diterangkan oleh inovasi di negara-negaraASEAN-4 yang lain (lebih daripada 50%), yakni menerangkan sebahagiankesan kontagion semasa krisis Asia 1997/98. Ketiga, perbezaan bunga benardidapati berulang-balik pada nilai purata, membayangkan bahawa pariti kadarbunga benar (RIP) adalah benar antara ASEAN-Japan (kecuali Singapura)and ASEAN-US tidak dapat ditolak. Keempat, sisihan daripada RIPmempunyai separuh-hayat (half-life) di antara 6-11 bulan, bermaknapengubahsuai yang cepat kepada nilai pariti atau keseimbangan. Sekaligus,penemuan kami menyokong integrasi kewangan serantau dengan perananpimpinan Jepun terbukti. Umumnya, kajian ini menyokong pembentanganmata wang serantau dengan Yen Jepun diambil sebagai mata wang bersama.
INTRODUCTION
Theory suggests that in a perfect world where capital mobility andpurchasing power parity holds, ex-ante real interest rates should movetogether in the long-run. Thus, the extent to which they move togetherover time provides the degree of capital mobility or real interest rateconvergence. If real interest parity holds in absolute form, real interestrates should be equalised across countries. In other words, financialassets are perfect substitutes as returns on comparable financial assetstraded in domestic and foreign markets, which are identical. The bulkof the literature, however, has shown that real returns on bonds arehardly equalised and hence the parity is unfortunately a dismalempirical failure (Mishkin, 1984; Merrick & Saunders, 1986; Chan,2001).
The present article aims at examining one of the building blocks ininternational finance-the real interest rate parity (RIP). To this end, asample from the financial markets of the East Asian countries over thepast decade was drawn. Most of the countries in the region have takenpositive steps toward liberalisation of their domestic financial systemduring the study period. Recently, the transformation has been furtheraccelerated with the deregulation of money markets in both thedeveloping and developed markets1. We test for the existence of thelong-run relationship among real interest rates using the familiarJohansen’s multivariate cointegration analysis and assess the degreeof mean reversion of interest rates differentials by computing the half-life of the deviation from RIP. Additionally, we extend the analysis ofprevious studies by investigating the dominance of the Japan in thew
ww
.ijm
s.uu
m.e
du.m
y
IJMS 14 (1), 23-48 (2007) 25
developing Asian region using the Granger non-causality test. We alsodemonstrate how the addition of the US market to the system of theAsian interest rates affects the robustness of the empirical findings.The extent to which real interest rates is linked across countries andhow these linkages progress through time have gained considerableattention among researchers for several reasons. Firstly, real interestrates lie at the heart of the transmission mechanism of monetary policyand play an important role in influencing real activity through savingand investment behaviour. From a policy perspective, if RIP holds, acountry may pursue a stance of monetary policy which entails adifferent interest rate from the world interest rate (under fixed exchangerate). Monetary alternative may be less able to achieve independenteconomic policy via interest rate (credit rate) and may not bedetermined on a local level. Secondly, from a theoretical perspective,RIP is a key working assumption in various models of exchange ratedetermination2. Thirdly, because of its theoretical link to the PPP,confirmation (rejection) of RIP can be viewed as indication ofmacroeconomic integration (autonomy) in the microeconomic andmacroeconomic consequences of RIP (Fukao & Hanazaki, 1986).Indeed, some of the more recent studies on this topic have viewed theco-movements and dynamic linkages of real interest rates acrosscountries as an indicator of financial integration (Phylaktis, 1999; Awad& Goodwin, 1998; Hassapis, Nikitas & Ryprianos, 1999).
From the East Asian perspective, most studies on capital marketintegration have focused on integration between Japan and the US.Interest in the other East Asian countries was investigated by Faruqee(1992), who uncovered the interest rate differential between Singapore,Korea, and Thailand, and US Japanese LIBOR – taken to represent theworld interest rate. Phylaktis (1999) examined the extent of marketintegration in a group of countries (South Korea, Malaysia, Hong Kong,Taiwan, and Japan) which are closely linked with the world financialmarkets, and more so with Japan than the US. The article by Chinnand Frankel (1995) found that Hong Kong, Taiwan, and Malaysia, werelinked to both the US and Japan, while Singapore’s financial market isclosely connected with the US. More recent findings on the host subjectin the region were found in Anoruo’et al. (2002) and Baharumshah,Chan, and Stilianos (2005), among others. Nevertheless, the extent ofmarket integration in the region is by no means a settled issue.
The present article differs from the existing literature in severalimportant aspects. Firstly, ASEAN is a region of growing importancein the world economy, but the financial linkages among its membershave yet to be systematically analysed. The ASEAN-5 refers to the fiveoriginal members of the Association of Southeast Asian Nations,namely Indonesia, Malaysia, Singapore, Thailand, and Philippines.w
ww
.ijm
s.uu
m.e
du.m
y
26 IJMS 14 (1), 23-48 (2007)
While RIP has been a major topic of analysis in the Europeancommunity for the past decade, literature on East Asia, ASEAN inparticular, is scare. A different perspective may be gained fromexamining ASEAN emerging economies that have instituted differentregulatory regimes at different stages of their development.Additionally, although regional initiatives have increased intra-regionaltrade and foreign direct investment in the East Asia, progress towardsregional financial integration is still at its infancy stage (Park, 2002).
Secondly, whilst studies on RIP have appeared in abundance with theUS or Germany taken as base or centre country3, the Japanese-basedstudies have been meager, although Japan is now the world’s secondlargest economy. Recent developments have been accompanied bysigns that Japan has been increasing its trade and financial influencein East Asia (Yen Bloc) and possibly overshadowing that of the US.Japan has been the major trading partner and contributor of foreigninvestments in the ASEAN community since the 1980s. Japan’s directinvestments in ASEAN-5 peaked in 1996, and accounted for more thanUS$ 6 billion as compared to US$ 3.6 billion in 1991. In addition, Japanis also the main export market for most of the ASEAN countries (aboveone-sixth of the ASEAN’s exports). Together, these developments implysubstantial growth in regional trade and investment interdependencybetween ASEAN and Japan.
Thirdly, the half-life of deviations from RIP is computed to measurethe speed of adjustment back towards the long-run RIP, where the half-life is defined as the number of years it takes for the deviation fromRIP to settle permanently below 0.5 in response to a unit shock in thelevel of the series. If say, the half-lives of deviation from RIP are withinmonths, RIP will hold firmly. Conversely, if the half-lives are four tofive years, the strong form RIP is ruled out. We note that thecomputation of half-life is usually conducted for studies on PPP. In aseminal paper, Rogoff (1996) reported that three to five years are likelyvalues for the half-life of shocks to the real exchange rate under therecent floating era, and that the deviations from PPP are dampen outat the rate of about 15% per year. In a recent article, Holmes (2002) hadapplied the concept of half-life measurement to RIP for a set of EUcountries. Interestingly, Holmes found that the estimated half-life isabout two to three months. We would expect the estimates to be longerfor the ASEAN countries since the process of economic integration isfar more complete in the EU compared to the ASEAN-5 membercountries.
To examine these pertinent issues, this paper is structured in thefollowing sequence. Section 2 dwells with a brief review of the RIPtheory and the methodology utilised in the analysis. In section 3, thew
ww
.ijm
s.uu
m.e
du.m
y
IJMS 14 (1), 23-48 (2007) 27
data is described, while section 4 reports and discusses the empiricalresults. Finally in section 5, the concluding remarks and some policyimplications are presented.
THEORETICAL FRAMEWORK AND METHODOLOGY
Theoretical Framework
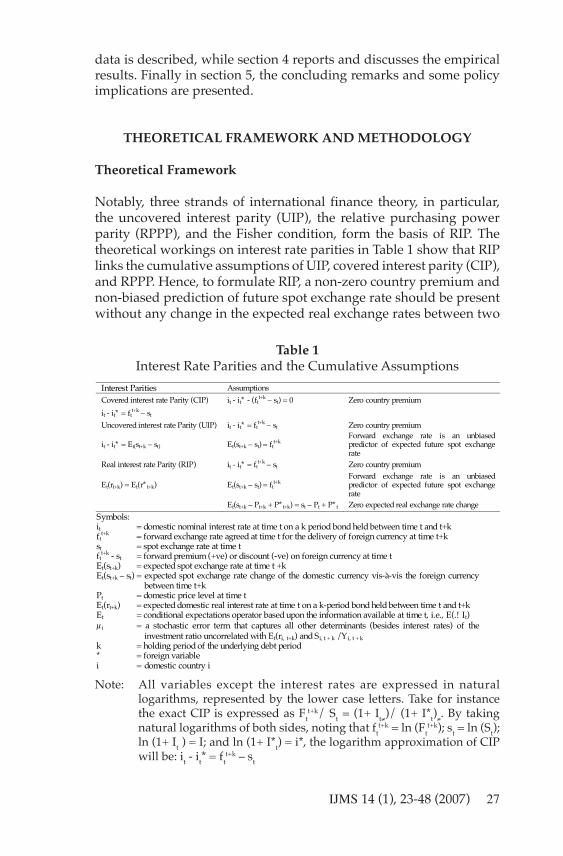
Notably, three strands of international finance theory, in particular,the uncovered interest parity (UIP), the relative purchasing powerparity (RPPP), and the Fisher condition, form the basis of RIP. Thetheoretical workings on interest rate parities in Table 1 show that RIPlinks the cumulative assumptions of UIP, covered interest parity (CIP),and RPPP. Hence, to formulate RIP, a non-zero country premium andnon-biased prediction of future spot exchange rate should be presentwithout any change in the expected real exchange rates between two
Interest Parities Assumptions
Covered interest rate Parity (CIP) it - it* - (ftt+k – st) = 0 Zero country premium
it - it* = ftt+k – st
Uncovered interest rate Parity (UIP) it - it* = ftt+k – st Zero country premium
it - it* = Et(st+k – st) Et(st+k – st) = ftt+k
Forward exchange rate is an unbiased predictor of expected future spot exchange rate
Real interest rate Parity (RIP) it - it* = ftt+k – st Zero country premium
Et(rt+k) = Et(r* t+k) Et(st+k – st) = ftt+k
Forward exchange rate is an unbiased predictor of expected future spot exchange rate
Et(st+k – Pt+k + P* t+k) = st – Pt + P* t Zero expected real exchange rate change
Symbols: it = domestic nominal interest rate at time t on a k period bond held between time t and t+k ft
t+k = forward exchange rate agreed at time t for the delivery of foreign currency at time t+k st = spot exchange rate at time t ft
t+k - st = forward premium (+ve) or discount (-ve) on foreign currency at time t Et(st+k) = expected spot exchange rate at time t +k Et(st+k – st) = expected spot exchange rate change of the domestic currency vis-à-vis the foreign currency
between time t+k Pt = domestic price level at time t Et(rt+k) = expected domestic real interest rate at time t on a k-period bond held between time t and t+k Et = conditional expectations operator based upon the information available at time t, i.e., E(.! It) μi = a stochastic error term that captures all other determinants (besides interest rates) of the
investment ratio uncorrelated with Et(ri, t+k) and Si, t + k / Yi, t + k k = holding period of the underlying debt period * = foreign variable i = domestic country i
Table 1Interest Rate Parities and the Cumulative Assumptions
Note: All variables except the interest rates are expressed in naturallogarithms, represented by the lower case letters. Take for instancethe exact CIP is expressed as Ft
t+k/ St = (1+ It≠)/ (1+ I*t)≠. By takingnatural logarithms of both sides, noting that ft
t+k = ln (Ftt+k); st = ln (St);
ln (1+ It ) = I; and ln (1+ I*t) = i*, the logarithm approximation of CIPwill be: it - it* = ft
t+k – stww
w.ij
ms.
uum
.edu
.my
28 IJMS 14 (1), 23-48 (2007)
countries. If RIP holds, by equation, real interest rates will equaliseacross countries; by words, financial and non-financial assets shouldmove unrestrictedly across countries in which any arbitrageopportunities or capital imperfections is not allowed. Since RIP involvesthe movement of real prices, RIP is often regarded as the price approachto measure financial integration and capital mobility (Lemmen &Eijffinger, 1995).
To examine the RIP condition that Et(rt+k) = Et(r*t+k) as shown in Table1, researchers have usually taken the form of estimating the followingregression:
rti = α0 + α1 rt
j + εt (1)
where rti and rt
j represent the real interest rates in countries i and j
respectively, and εt is the residual term. For RIP to hold, researchersused to test for the joint hypothesis that α0 = 0 and α1 = 1. However, theabove test is subjected to several critics. Firstly, it indicates strong formof integration, with neither capital imperfections nor any arbitrageopportunity allowed. Even in the absence of capital control, the jointhypothesis that α0 = 0 and α1 = 1 can be rejected because of transactioncosts and that will not imply any profitable arbitrage opportunity(Phylaktis, 1999). Secondly, previous regression results that assumeindividual real rates to be stationary are not indicative of real interestrate equalisation (Mishkin, 1984). If the series is non-stationary, thenthe estimation of parameters α0 and α1 could be consistent, but theestimated standard errors will not.
Estimation Procedure 1: Real Interest Rates of ASEAN-5
The cointegration procedure that was developed by Granger (1986) toexplore the long-run relationship between two series has overcomethe abovementioned problems. Two non-stationary series, such as realinterest rates of Malaysia and Singapore, are cointegrated when thereis some linear combination among them, which is a stationary process.Cointegrated variables move together over time so that any short-rundeviation from the long-term trend will be corrected. Johansen andJuselius (1990) later extended the bivariate process to the multivariatesystem. The test for the number of cointegrating vectors in the Johansen-Juselius procedure can be conducted using two likelihood ratio (LR)test statistics, namely the trace statistic and the maximum eigenvalue(l-Max) statistic as shown below:
Trace test : Ltrace (r) = -T ∑ ln (1 - λ i ) (2)ww
w.ij
ms.
uum
.edu
.my
IJMS 14 (1), 23-48 (2007) 29
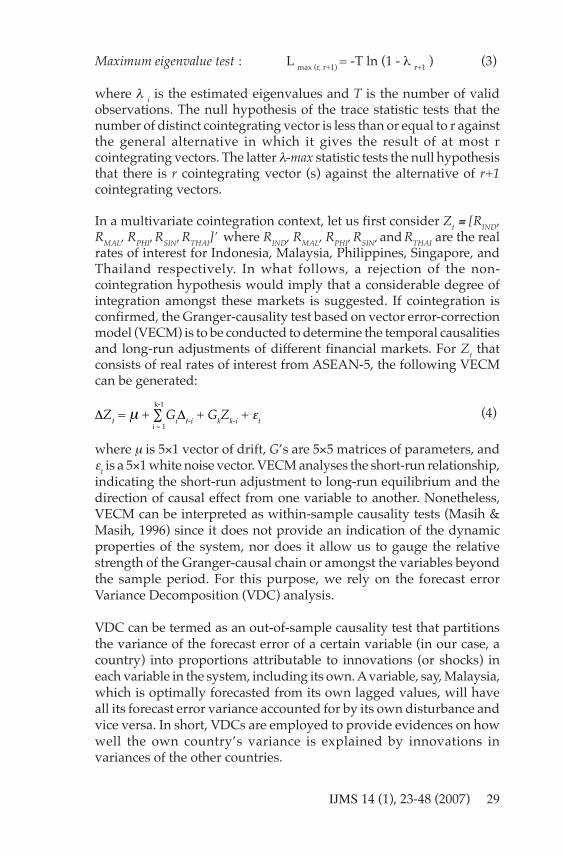
Maximum eigenvalue test : L max (r, r+1) = -T ln (1 - λ r+1 ) (3)
where λ i is the estimated eigenvalues and T is the number of validobservations. The null hypothesis of the trace statistic tests that thenumber of distinct cointegrating vector is less than or equal to r againstthe general alternative in which it gives the result of at most rcointegrating vectors. The latter λ-max statistic tests the null hypothesisthat there is r cointegrating vector (s) against the alternative of r+1cointegrating vectors.
In a multivariate cointegration context, let us first consider Zt ≡ [RIND,RMAL, RPHI, RSIN, RTHAI]’ where RIND, RMAL, RPHI, RSIN, and RTHAI are the realrates of interest for Indonesia, Malaysia, Philippines, Singapore, andThailand respectively. In what follows, a rejection of the non-cointegration hypothesis would imply that a considerable degree ofintegration amongst these markets is suggested. If cointegration isconfirmed, the Granger-causality test based on vector error-correctionmodel (VECM) is to be conducted to determine the temporal causalitiesand long-run adjustments of different financial markets. For Zt thatconsists of real rates of interest from ASEAN-5, the following VECMcan be generated:
(4)
where μ is 5×1 vector of drift, G’s are 5×5 matrices of parameters, andεt is a 5×1 white noise vector. VECM analyses the short-run relationship,indicating the short-run adjustment to long-run equilibrium and thedirection of causal effect from one variable to another. Nonetheless,VECM can be interpreted as within-sample causality tests (Masih &Masih, 1996) since it does not provide an indication of the dynamicproperties of the system, nor does it allow us to gauge the relativestrength of the Granger-causal chain or amongst the variables beyondthe sample period. For this purpose, we rely on the forecast errorVariance Decomposition (VDC) analysis.
VDC can be termed as an out-of-sample causality test that partitionsthe variance of the forecast error of a certain variable (in our case, acountry) into proportions attributable to innovations (or shocks) ineach variable in the system, including its own. A variable, say, Malaysia,which is optimally forecasted from its own lagged values, will haveall its forecast error variance accounted for by its own disturbance andvice versa. In short, VDCs are employed to provide evidences on howwell the own country’s variance is explained by innovations invariances of the other countries.
ΔZt = μ + ∑ GiΔt-i + GkZk-i + εt
k-1
i = 1
ww
w.ij
ms.
uum
.edu
.my
30 IJMS 14 (1), 23-48 (2007)
Estimation Procedure 2: Real Interest Rate Differentials of Japan-ASEAN 5
By imposing the restriction (a0, a1) = (0,1) on the cointegrating regressionin (1), we have a model of real interest differentials that can be specifiedas:4
rti - rt
j = εt (5)
where rti represents the real interest rates of ASEAN countries and rt
j isthe Japanese (foreign) real interest rate. Given the specification in (5),RIP holds in a long-run equilibrium condition if εt is stationary,implying that the real interest differential is mean reverting over time.Hence, both financial integration as well as good model integrationcan be tested from the deviation of RIP. To authenticate the stationarityprocess, we rely on the conventional single-equation based ADF unitroot tests. The ADF procedure extends the Dickey-Fuller test byallowing a higher order of autoregressive process as shown below:
(6)
(7)
where k represents the number of lagged changes in εt necessary tomake the residuals υt (υ’t) serially uncorrelated. The first and the secondequation are differentiated by a deterministic trend. By consideringthe null hypothesis of β1 = 0, and the alternative β1 < 0, we can decideon the absence or presence of a unit root. If the observed t-statisticexceeds the critical value at the standard level of significance, the nullhypothesis of the unit root is rejected, or otherwise.
Several studies have focused on the half-life of deviation from the paritycondition to bypass the many difficulties associated with the unit roottests. To assess the degree of mean reversion of real interest differentials,the half-life of deviation from RIP needs to be computed. Suppose thatthe deviation of the logarithm of real rate of interest differential yt fromits long-run value y0 , which is constant under RIP, follows an AR (1)process:
yt - y0 = β (yt-1 - y0) + εt (8)
where is a usual white noise, then, at horizon h, the percentage deviationfrom equilibrium is βh. The half life deviation from RIP is defined asthe horizon at which the percentage deviation from equilibrium is onehalf, that is:
Δεt = β0 + β1εt-1 + ∑ δ1Δεt-i+1 + υt
k
i = 2
Δεt = β0 + β1εt-1 + β2 + ∑ δ1Δεt-i+1 + υ’t
k
i = 2
ww
w.ij
ms.
uum
.edu
.my
IJMS 14 (1), 23-48 (2007) 31
(9)
The half-life measurement can be interpreted in two ways: the degreeof deviation from its long-run mean or, the speed of adjustment backtowards long-run RIP. Either one will indicate if RIP holds in a strongor weak form.
DATA
Following the Fisher equation, the real interest rate will take intoaccount of the expected inflation, which is estimated from the actualinflation as measured by changes in consumer price index (CPI). Inour case, the expected inflation is estimated by using the autoregressivedistribution lag approach rather than the actual inflation as proxy. Thenominal interest rates employed in the study are: the inter-bank moneymarket rates for Indonesia, Singapore, Thailand, and Japan; the 3-month Treasury bill rates for Malaysia; and the inter-bank call loanrates for the Philippines. Only short-term interest rates are used dueto the fact that long-term interest rates, such as government bond yield,are not available for most ASEAN countries The study sample spansfrom 1984:Q1 to 1997:Q2, considering the post-liberalisation era priorto the financial crisis. A crisis period that involves structural breaks inthe series would bias our results and hence, not included in our study.To assure the consistency and reliability of the data, we cross checkwith various sources such as the IMF International Financial Statistics,the Asian Development Bank (ADB) Key Indicators, and the CentralBanks of the respective countries.
RESULTS AND DISCUSSION
Univariate Analysis
A cointergrating relationship exists within a set of nonstationary timeseries when a linear combination of the variables can be identified thatyields a stationary result. Hence, for one to proceed with cointegrationtests, it is important to first examine the univariate properties of theindividual time series. Notably, the Johansen-Juselius cointegrationprocedure requires that all the variables under investigation are of anI(1) but not I(2) process. To verify this, we subjected all series (in ourcase real interest rates) to the classical Augmented Dickey-Fuller (ADF)
βh = = h =12
1n (1/2)1n (β)
ww
w.ij
ms.
uum
.edu
.my
32 IJMS 14 (1), 23-48 (2007)
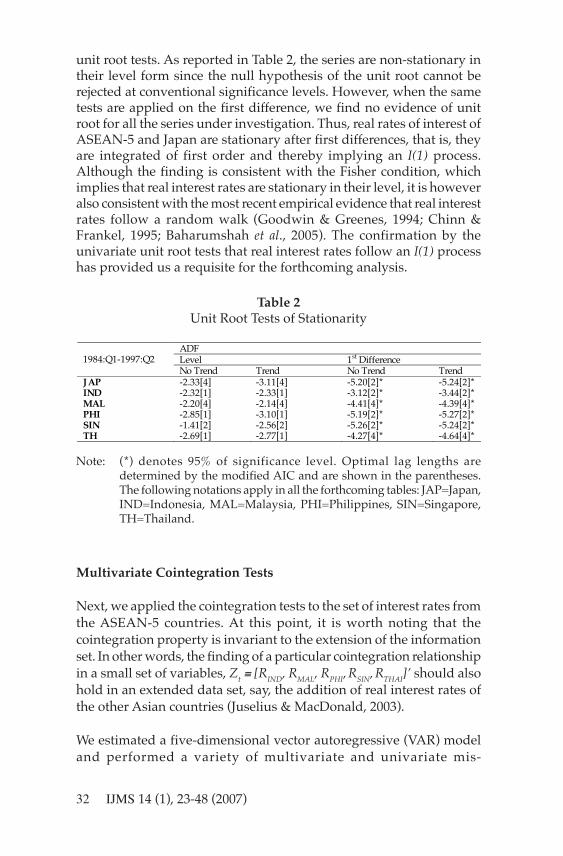
unit root tests. As reported in Table 2, the series are non-stationary intheir level form since the null hypothesis of the unit root cannot berejected at conventional significance levels. However, when the sametests are applied on the first difference, we find no evidence of unitroot for all the series under investigation. Thus, real rates of interest ofASEAN-5 and Japan are stationary after first differences, that is, theyare integrated of first order and thereby implying an I(1) process.Although the finding is consistent with the Fisher condition, whichimplies that real interest rates are stationary in their level, it is howeveralso consistent with the most recent empirical evidence that real interestrates follow a random walk (Goodwin & Greenes, 1994; Chinn &Frankel, 1995; Baharumshah et al., 2005). The confirmation by theunivariate unit root tests that real interest rates follow an I(1) processhas provided us a requisite for the forthcoming analysis.
Table 2Unit Root Tests of Stationarity
Note: (*) denotes 95% of significance level. Optimal lag lengths aredetermined by the modified AIC and are shown in the parentheses.The following notations apply in all the forthcoming tables: JAP=Japan,IND=Indonesia, MAL=Malaysia, PHI=Philippines, SIN=Singapore,TH=Thailand.
Multivariate Cointegration Tests
Next, we applied the cointegration tests to the set of interest rates fromthe ASEAN-5 countries. At this point, it is worth noting that thecointegration property is invariant to the extension of the informationset. In other words, the finding of a particular cointegration relationshipin a small set of variables, Zt ≡ [RIND, RMAL, RPHI, RSIN, RTHAI]’ should alsohold in an extended data set, say, the addition of real interest rates ofthe other Asian countries (Juselius & MacDonald, 2003).
We estimated a five-dimensional vector autoregressive (VAR) modeland performed a variety of multivariate and univariate mis-
ADF Level 1st Difference 1984:Q1-1997:Q2 No Trend Trend No Trend Trend
JAP -2.33[4] -3.11[4] -5.20[2]* -5.24[2]* IND -2.32[1] -2.33[1] -3.12[2]* -3.44[2]* MAL -2.20[4] -2.14[4] -4.41[4]* -4.39[4]* PHI -2.85[1] -3.10[1] -5.19[2]* -5.27[2]* SIN -1.41[2] -2.56[2] -5.26[2]* -5.24[2]* TH -2.69[1] -2.77[1] -4.27[4]* -4.64[4]*
ww
w.ij
ms.
uum
.edu
.my
IJMS 14 (1), 23-48 (2007) 33
specification tests. Test results revealed no evidence of autocorrelationor autoregressive conditional heteroscedasticity (ARCH) effects, butin some equations we found violation of normality. Gonzala (1994)had argued that the cointegration estimates are robust to the deviationfrom normality assumption, hence we may proceed with the Johansen’smultivariate test.
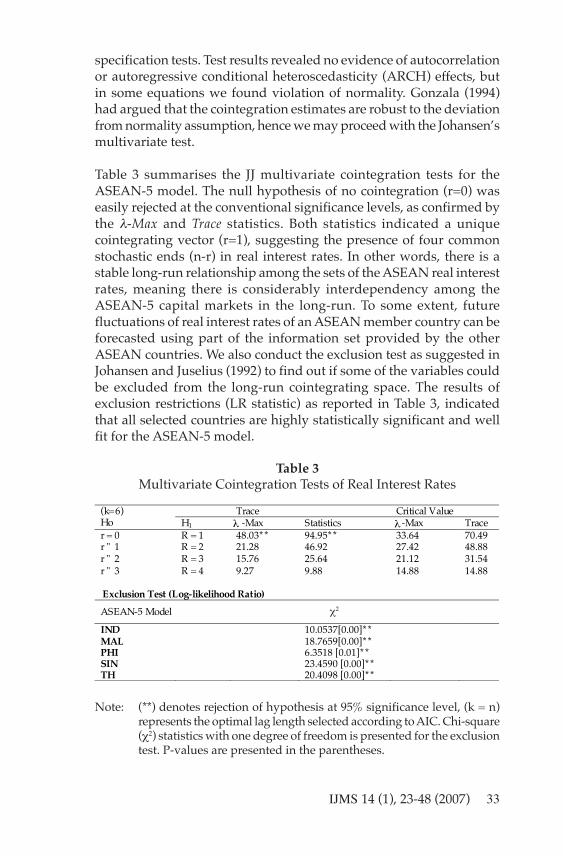
Table 3 summarises the JJ multivariate cointegration tests for theASEAN-5 model. The null hypothesis of no cointegration (r=0) waseasily rejected at the conventional significance levels, as confirmed bythe λ-Max and Trace statistics. Both statistics indicated a uniquecointegrating vector (r=1), suggesting the presence of four commonstochastic ends (n-r) in real interest rates. In other words, there is astable long-run relationship among the sets of the ASEAN real interestrates, meaning there is considerably interdependency among theASEAN-5 capital markets in the long-run. To some extent, futurefluctuations of real interest rates of an ASEAN member country can beforecasted using part of the information set provided by the otherASEAN countries. We also conduct the exclusion test as suggested inJohansen and Juselius (1992) to find out if some of the variables couldbe excluded from the long-run cointegrating space. The results ofexclusion restrictions (LR statistic) as reported in Table 3, indicatedthat all selected countries are highly statistically significant and wellfit for the ASEAN-5 model.
Table 3Multivariate Cointegration Tests of Real Interest Rates
Note: (**) denotes rejection of hypothesis at 95% significance level, (k = n)represents the optimal lag length selected according to AIC. Chi-square(χ2) statistics with one degree of freedom is presented for the exclusiontest. P-values are presented in the parentheses.
Trace Critical Value (k=6)
Ho H1 ! -Max Statistics ! -Max Trace r = 0 R = 1 48.03* * 94.95* * 33.64 70.49 r " 1 R = 2 21.28 46.92 27.42 48.88 r " 2 R = 3 15.76 25.64 21.12 31.54 r " 3 R = 4 9.27 9.88 14.88 14.88 Exclusion Test (Log-likelihood Ratio)
ASEAN-5 Model
#2
IND 10.0537[0.00]* * MAL 18.7659[0.00]* * PHI 6.3518 [0.01]* * SIN 23.4590 [0.00]* * TH 20.4098 [0.00]* *
χ2
λλ
ww
w.ij
ms.
uum
.edu
.my
34 IJMS 14 (1), 23-48 (2007)
Granger-causality and Vector Error Correction Modeling Analysis
Table 4 highlights that for both Malaysia and Singapore, the errorcorrection terms (ECTs) are statistically significant at the 95% level andthe temporal causality effects are active. Consequently, these twofinancial markets are endogenously determined in the model and sharethe burden of short-run adjustment to long-run equilibrium. In contrast,Indonesia is found to be statistically exogenous as neither the ECT northe channels of Granger-causality are significant or temporally active.
Table 4Granger-causality within the VECM
Note: (*) and (**) denote 95% and 99% significance level respectively. Chi-square (χ2) tests the joint-significance of the lagged values of theindependent variables while t-statistics tests the significance of theerror correction term (ECT). P-values are presented in the parenthesis.
Figure 1Short-run causality effects
The temporal Granger-causality channels abstracted from Table 4 aredisplayed in Figure 1. Notice that in the short-run changes of realinterest rates in Malaysia are being led by movements of real rates inIndonesia, Philippines, Singapore, and Thailand, whereas those in
k=6, r=1 Independent Variable
IND MAL PHI SIN TH Dependent Variable Chi-square, " 2
ECTt-1 t-stat
IND
- 0.11 [0.74]
0.19 [0.66]
0.10 [0.75]
1.17 [0.28]
-0.12
MAL
5.95* [0.02] - 8.66* *
[0.00] 4.50* [0.03]
7.41* * [0.01]
-3.17* *
PHI
6.15* * [0.01]
1.44 [0.23] - 1.15
[0.28] 0.18 [0.67]
1.61
SIN
1.50 [0.22]
2.63 [0.11]
3.88* [0.05] - 3.86*
[0.05] -2.24*
TH
1.21 [0.27]
1.45 [0.23]
0.14 [0.71]
0.92 [0.34] - -1.80
Δ
Δ
Δ Δ Δ Δ
Δ
Δ
Δ
Δ
Δ
IND PHI
MAL SIN
TH
ww
w.ij
ms.
uum
.edu
.my
IJMS 14 (1), 23-48 (2007) 35
Singapore are being directly led by Philippines’ and Thailand’s markets.Also, there is a unidirectional causal effect running from Indonesia tothe Philippines. The active temporal causality channels imply thatfinancial integration in ASEAN countries is even greater in the short-run. Both domestic interest rates and aggregate price levels of a countrywould be influenced by regional developments.
Explained by Innovation in IND MAL PHI SIN TH Foreign Horizon Percentage of Variance
“Foreign” takes account of accumulated innovations in other countrieswithout the own ones.
Table 5Generalised Variance Decomposition for ASEAN-5 Model
Variance Decomposition (VDC) Analysis
The VDC analysis enables us to gauge the extent that the externalshocks in one country are being explained by those in the other ASEANw
ww
.ijm
s.uu
m.e
du.m
y
36 IJMS 14 (1), 23-48 (2007)
countries. Table 5 indicates that most of the forecast error variance ofreal interest rates in any ASEAN-5 country can be attributed to otherASEAN-4’s innovations (more than 50%), rather than their own. Theout-of-sample forecasted results are in line with the previous causalityresults that ASEAN-5 markets are financially interdependent. However,the findings also imply that ASEAN member countries are morevulnerable to regional shocks and partly explain the contagion effectsduring the financial turmoil of 1997/98.
All in all, real interest rates in Malaysia, Thailand, and Singapore appearto be more explained by the innovations of other ASEAN countries.Although Singapore’s interest rate is also endogenously determined,it was hardly affected during the Asian financial crisis as compared tothose of Thailand and Malaysia, due to its strong economicfundamentals and well-developed capital market. On the other hand,Indonesia’s and the Philippines’ financial markets are less interactive,since over 41-45% of their own variances are being explained by theirown innovations. In addition, the forecast error variance of Malaysia’sinterest rate contributes the least to the other members of ASEANcountries, that is to say that shocks and innovations from Malaysia areless important in explaining the movement of real interest rates in theother member countries.
Real Interest Differentials Analysis
The real interest rates differentials were estimated through the specifiedregression (1) and (5) in section 2 previously. If the differentials arestationary and reverting to the long-run mean, RIP would hold betweenJapan and ASEAN-5, or otherwise. Table 6 reports the univariate ADFtests on the bilateral real interest differentials with respect to Japanfrom 1984:Q1 to 1997:Q2. Obviously, the null hypotheses of the unitroot was rejected at the standard significance levels for most cases(except Japan-Singapore), indicating that the real interest differentialsare mean reverting over time in a long proposition. In other words,RIP holds between Japan and ASEAN-4 but not between Japan-Singapore, implying that Singapore could be financially less integratedwith Japan as compared to the other ASEAN-4. This is not surprisingsince the Singaporean capital market is more influenced by the USmarket rather than the Japanese market5. In fact, this finding issupported by Chinn and Frankel (1995), who found that RIP holds forUS-Singapore but not for Japan-Singapore.
To have further insights on the extent of deviations from RIP, we referto the results in Table 7. Clearly, the adjustment to deviations from RIPis rapid and the estimated half-lives are considerably smaller than thosew
ww
.ijm
s.uu
m.e
du.m
y
IJMS 14 (1), 23-48 (2007) 37
reported in the PPP studies (3-5 years). For the ASEAN-4 where thedata are supportive of RIP, the deviations from RIP recorded a smallerhalf-life of approximately 1.9 to 2.7 quarters (or 6 to 8 months). It isworth noting that Indonesia and Malaysia showed the lowest half-lives of 1.90 and 1.74 quarters respectively, suggesting that they werevery much influenced by Japan. Turning to the results for Singapore,where RIP condition failed to hold, we found that the half-life wasapproximately 11 months. Again, we considered the size to be small,but in general, they appear to be longer than those found for EU thatcover over more or less the same time period (1986-1993). Thus, theresults are reflecting the fact that for Japan and ASEAN-4, RIP holds instrong form. More importantly, our findings have to a great extent,confirmed the Japan’s leading role in the ASEAN regional financialmarkets based on data that ended in 1997:Q2.
Note: ˜ The half-life measurement units are in quarters. A simple calculationwould suggest that 2.3 quarters approximately equivalent to 7 monthsor 0.6 year.
˜
Table 6ADF Unit Root Test of Real Interest Differentials for Japan-ASEAN 5
Note: (*) and (**) denote 5% and 1% statistically significant levels respectively.All real interest differentials are estimated with respect to Japan. TheADF critical values for estimated residuals are computed based onMacKinnon (1991). Optimal lags are selected based on modified AIC.
Lag Trend Lag Constant INDO 0 -4.15* * 0 -3.83* * MAL 0 -3.31 0 -3.29* PHI 1 -3.59* 1 -3.67* * SIN 2 -2.20 2 -1.86 TH 3 -3.23 3 -3.56* * Critical value 1% -4.10 -3.53 5% -3.48 -2.90
ww
w.ij
ms.
uum
.edu
.my
38 IJMS 14 (1), 23-48 (2007)
Adding US and other regional markets to the system
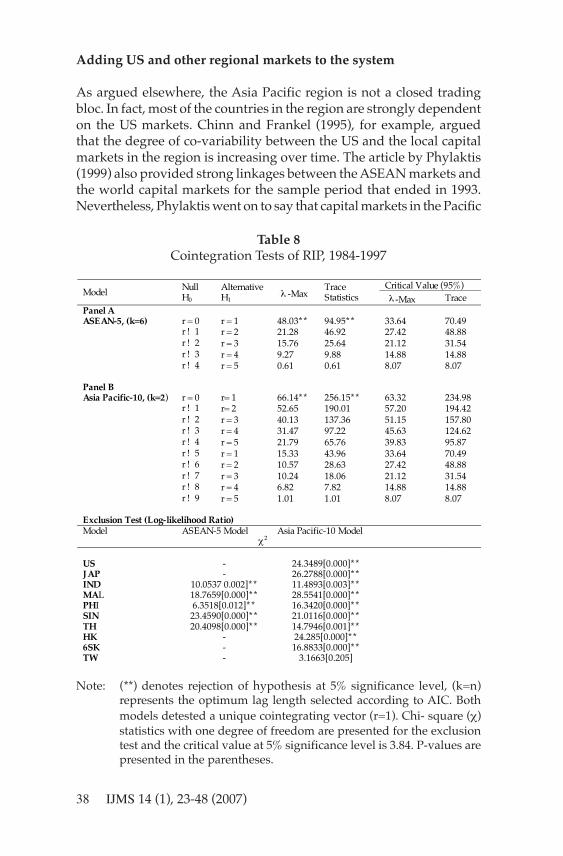
As argued elsewhere, the Asia Pacific region is not a closed tradingbloc. In fact, most of the countries in the region are strongly dependenton the US markets. Chinn and Frankel (1995), for example, arguedthat the degree of co-variability between the US and the local capitalmarkets in the region is increasing over time. The article by Phylaktis(1999) also provided strong linkages between the ASEAN markets andthe world capital markets for the sample period that ended in 1993.Nevertheless, Phylaktis went on to say that capital markets in the Pacific
Table 8Cointegration Tests of RIP, 1984-1997
Note: (**) denotes rejection of hypothesis at 5% significance level, (k=n)represents the optimum lag length selected according to AIC. Bothmodels detested a unique cointegrating vector (r=1). Chi- square (χ)statistics with one degree of freedom are presented for the exclusiontest and the critical value at 5% significance level is 3.84. P-values arepresented in the parentheses.
Critical Value (95%)
Model Null H0
Alternative H1
! -Max Trace Statistics ! -Max Trace
Panel A ASEAN-5, (k=6) r = 0 r = 1 48.03* * 94.95* * 33.64 70.49 r ! 1 r = 2 21.28 46.92 27.42 48.88 r ! 2 r = 3 15.76 25.64 21.12 31.54 r ! 3 r = 4 9.27 9.88 14.88 14.88 r ! 4 r = 5 0.61 0.61 8.07 8.07 Panel B
Asia Pacific-10, (k=2) r = 0 r= 1 66.14* * 256.15* * 63.32 234.98 r ! 1 r= 2 52.65 190.01 57.20 194.42 r ! 2 r = 3 40.13 137.36 51.15 157.80 r ! 3 r = 4 31.47 97.22 45.63 124.62 r ! 4 r = 5 21.79 65.76 39.83 95.87 r ! 5 r = 1 15.33 43.96 33.64 70.49 r ! 6 r = 2 10.57 28.63 27.42 48.88 r ! 7 r = 3 10.24 18.06 21.12 31.54 r ! 8 r = 4 6.82 7.82 14.88 14.88 r ! 9 r = 5 1.01 1.01 8.07 8.07 Exclusion Test (Log-likelihood Ratio) Model ASEAN-5 Model Asia Pacific-10 Model
2 US - 24.3489[0.000]* * JAP - 26.2788[0.000]* * IND 10.0537 0.002]* * 11.4893[0.003]* * MAL 18.7659[0.000]* * 28.5541[0.000]* * PHI 6.3518[0.012]* * 16.3420[0.000]* * SIN 23.4590[0.000]* * 21.0116[0.000]* * TH 20.4098[0.000]* * 14.7946[0.001]* * HK - 24.285[0.000]* * 6SK - 16.8833[0.000]* * TW - 3.1663[0.205]
χ
λ λ
ww
w.ij
ms.
uum
.edu
.my
IJMS 14 (1), 23-48 (2007) 39
Basin region are dominated by Japan as one moves to the post-liberalisation era. Thus, certain regularities may be missing for a systemof ASEAN interest rates that exclude the US as well the other Asianneighboring markets6. To examine the effects of the US and the otherregional markets (Hong Kong, South Korea, and Taiwan) on therobustness of the results reported earlier, we added the real interestrate of these countries to the basic system. This way, we were able toexamine the effect on a large number of variables and their interactionswith the non-US capital market without confronting the possiblearbitrariness of modeling international interdependence.
In the remainder of this paper, we re-examine the degree of financialintegration using interest rates from ten Pacific Basin countries:Malaysia, Thailand, Singapore, Indonesia, Philippines, South Korea,Taiwan, Hong Kong, US, and Japan. The sampling period chosen isthe same as before. The results from the larger system show that thereis one cointegrating vector among the interest rates. Thus, the mainconclusion remains unchanged with the addition of capital markets ofHong Kong, South Korea, Taiwan and the US. This finding suggeststhe interdependence of the economies in the Pacific Basin region withthe two major capital markets - the US and Japan. We also investigatedwhether some interest rates may be excluded from the long-runrelationship. With one cointegrating vector, the likelihood ratio (LR)test statistic is distributed as a χ2 random variable with one degree offreedom. As displayed in Table 5, we found that at the 5% significancelevel or better, none of the variables may be excluded from the long-
Figure 2Causality of APC-10 model during post-liberalisation, 1984-1997
US JAP ADVANCED
SK HK
NIE-3
TW
MAL SIN TH
ASEAN-5
PHI IND
ww
w.ij
ms.
uum
.edu
.my
40 IJMS 14 (1), 23-48 (2007)
run relationship with the sole exception of Taiwan. This implies thatall the nine interest rates series contribute significantly to thecointegrating relationship.
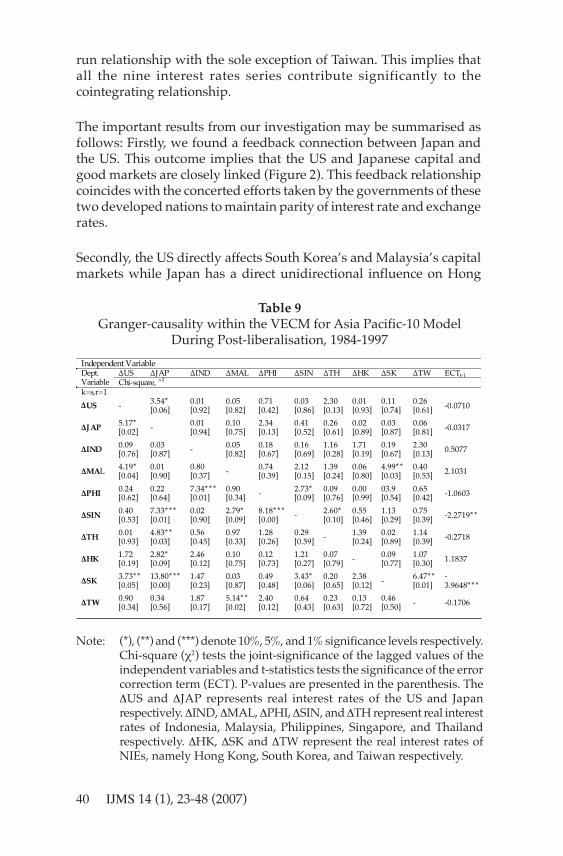
The important results from our investigation may be summarised asfollows: Firstly, we found a feedback connection between Japan andthe US. This outcome implies that the US and Japanese capital andgood markets are closely linked (Figure 2). This feedback relationshipcoincides with the concerted efforts taken by the governments of thesetwo developed nations to maintain parity of interest rate and exchangerates.
Secondly, the US directly affects South Korea’s and Malaysia’s capitalmarkets while Japan has a direct unidirectional influence on Hong
Table 9Granger-causality within the VECM for Asia Pacific-10 Model
During Post-liberalisation, 1984-1997
Note: (*), (**) and (***) denote 10%, 5%, and 1% significance levels respectively.Chi-square (χ2) tests the joint-significance of the lagged values of theindependent variables and t-statistics tests the significance of the errorcorrection term (ECT). P-values are presented in the parenthesis. TheΔUS and ΔJAP represents real interest rates of the US and Japanrespectively. ΔIND, ΔMAL, ΔPHI, ΔSIN, and ΔTH represent real interestrates of Indonesia, Malaysia, Philippines, Singapore, and Thailandrespectively. ΔHK, ΔSK and ΔTW represent the real interest rates ofNIEs, namely Hong Kong, South Korea, and Taiwan respectively.
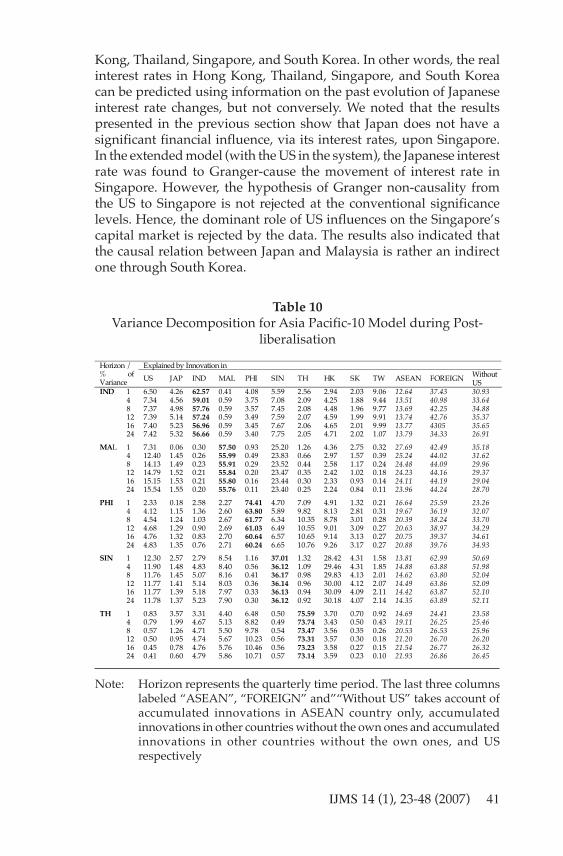
Kong, Thailand, Singapore, and South Korea. In other words, the realinterest rates in Hong Kong, Thailand, Singapore, and South Koreacan be predicted using information on the past evolution of Japaneseinterest rate changes, but not conversely. We noted that the resultspresented in the previous section show that Japan does not have asignificant financial influence, via its interest rates, upon Singapore.In the extended model (with the US in the system), the Japanese interestrate was found to Granger-cause the movement of interest rate inSingapore. However, the hypothesis of Granger non-causality fromthe US to Singapore is not rejected at the conventional significancelevels. Hence, the dominant role of US influences on the Singapore’scapital market is rejected by the data. The results also indicated thatthe causal relation between Japan and Malaysia is rather an indirectone through South Korea.
Table 10Variance Decomposition for Asia Pacific-10 Model during Post-
liberalisation
Note: Horizon represents the quarterly time period. The last three columnslabeled “ASEAN”, “FOREIGN” and”“Without US” takes account ofaccumulated innovations in ASEAN country only, accumulatedinnovations in other countries without the own ones and accumulatedinnovations in other countries without the own ones, and USrespectively
Explained by Innovation in Horizon /
% of Variance US JAP IND MAL PHI SIN TH HK SK TW ASEAN FOREIGN Without
Thirdly, except for Singapore (which is mostly affected by Hong Kong’sreal rate innovations), the link between real interest rates in the ASEANmembers has strengthened considerably in the recent years. Weobserved that variation in interest rates in Malaysia is mainly due todisturbances in Singapore, while the variation in real interest rate inThailand (the Philippines) is largely due to disturbances in thePhilippines’ (Thailand) market and the results hold both in the shortas well as the long horizons. This finding supports the notion that thereis considerable support for economic integration of the ASEANcountries.
Forthly, variance decompositions for the VAR model are reported inTable 10. The relationship selected for presentation includes therelationship between US and ASEAN, Japan and ASEAN, and thenewly industrial economies countries (NIEs). The results of the VDCsshow that US interest rates were observed to have some moderateimpact upon ASEAN interest rates, while the Japanese interest ratehad a somewhat smaller impact on the ASEAN interest rates.
Next, we looked at how long it would take for real interest rate parityto adjust to its equilibrium value following a one standard deviationshock in the US and Japanese interest rates. The first (second) columnin Table 11 shows the number of quarters it takes the real interest ratesin each of the Asian countries to converge to their equilibrium followingan impulse in the US (Japanese) real interest rate. It is observed in thistable that all the Asian countries (except for Indonesia and South Korea)converged to their equilibrium at a much faster rate following impulsefrom the US real interest rate, however, the difference in the speed isnot large. For instance, Indonesia would take 18 quarters to convergeto its parity following an impulse from the US real interest rate but ittook about an additional quarter (19) following an impulse from theJapanese interest rate. This is an indication of the degree of capitalmarket integration between the two financial centres. Thus, ourfindings do not support the results found in Phylaktis (1999) that showJapan’s dominant influence in the region.
Table 11Impulse Response, Analysis for Asia Pacific-10
Country Speed of Adjustment following an Impulse in the
US RIP Japan RIP
US - 16JAP 15 -ww
w.ij
ms.
uum
.edu
.my
IJMS 14 (1), 23-48 (2007) 43
Country Speed of Adjustment following an Impulse in the
Note: The analysis refers to the post-liberalisation period. All data sets arein quarterly form. Figures shown represent the time length for realinterest rates of each country to converge to their long-run equilibriumwith Japan and US respectively. For CV, figures shown represent theimpulse response of the multivariate system following a shock fromJapan and US respectively.
CONCLUDING REMARKS
In this paper, we presented evidence on several questions regardingthe movement in real interest rates in the ASEAN region: Is there alink between the Japanese rates and those in the ASEAN members?Are the real interest rates of ASEAN more closely link to Japan ratherthan the US?
As for our first question, the results of our analysis based on an arrayof econometric time series methods suggest that real interest rates inthe ASEAN region are becoming increasingly integrated with those inthe regional as well as the major financial centres. This means that thecapital and goods markets in the region are well integrated with thosein the global markets. We believe that with liberalisation and theopening up of the economy would have contributed to the linkages ofthe ASEAN markets to the international capital markets. From a policyperceptive, the strong linkage between the real domestic and foreignrates has implication on the ability of the domestic monetary authoritiesto control domestic economic activity. The positive correlation betweenthe US (Japan) and the ASEAN countries indicates that the effectivenesson monetary policy is limited in the long-run. The central banks’ abilityto conduct independent monetary policy in these emerging markets isgreatly hampered. As pointed by Chinn and Frankel (1995), this
(continued Table 11)w
ww
.ijm
s.uu
m.e
du.m
y
44 IJMS 14 (1), 23-48 (2007)
conclusion is conditional on the fact that interest rates used in theanalysis are representative of the economy-wide interest rates facingmost firms and consumers. Additionally, we found that most of theforecast error variance of real interest rates in own country can beattributed to other ASEAN-4’s interest rate innovations. Thisobservation partly explains the contagion effects during the Asian crisisof 1997/98. The 1997 financial crisis started in Thailand and quicklyspread to Malaysia, Thailand, Indonesia, and the Philippines.
As for the second question, the answer is less decisive. The existingliterature including Chinn and Frankel (1995) and Phylaktis (1999)suggested that while there is continued integration with the US, thereis also a growing sphere of influence by the Japanese interest ratesover time. All in all, our results suggest that the US has as stronginfluence as Japan on the movement of interest rates in the Asian Pacificregion. This conclusion is in line with that by Shan and Pappas (2000),but is not totally in agreement with the work of Phylaktis (1997). Basedon simple bivariate analysis, Phylaktis (1997) found that marketintegration was greater in the US than with Japan. One possibleexplanation for the conflicting results is the different sampling periodsas well as methods utilised in the study.
Recent events in the US suggest that the current account deficits havereached unprecedented levels and there is a strong support to pushup the interest rates. The implication of our finding is that if the USdecides to increase its interest rates, this would also inevitably affectJapan and the ASEAN countries. In other words, the region is likely tobe highly vulnerable to changes in the US’s monetary stance.
Finally, the period of study does not include the Asian financial crisis,and many of these countries underwent structural reform since thattime. A study on the impact of the structural change on the RIP, whichrequires cointegration tests that account for structural break, may beuseful for future studies. Additionally, recent studies have used non-linear framework to model RIP and PPP. The evidence of non-linearstochastic dynamics should be useful in understanding the complexitiesof economic integration in the emerging ASEAN market economies.This leaves many avenues for future research on this interesting topic.
ACKNOWLEDGEMENTS
A shorter version of this paper was presented at the MFA’s 5th AnnualSymposium held at the Multimedia University, Cyberjaya in 2003, andw
ww
.ijm
s.uu
m.e
du.m
y
IJMS 14 (1), 23-48 (2007) 45
was honoured the Best Paper Award. Comments and suggestions fromtwo anonymous referees, seminar participants and Siti Hamizah forproviding assistance in data collection and analysis are gratefullyacknowledged. All remaining errors are our own.
END NOTES
1 During the past two decades, financial institutions and markets haveundergone major transformations. These include structural changesin markets for financial services, improved communications, andproduction technology, and increasing interdependence andintegration of financial and economic systems. The transformationin the developing countries, and East Asia in particular, have beenmore profound since most of these countries were characterised asfinancially depressed and overly protected from external influence(Anoruo, Ramchander, & Thiewes, 2002).
2 Frankel (1979) developed a general monetary exchange rate modelbased on real interest differentials. If there is a disequilibrium set ofreal interest rates, the real exchange rate will deviate from its long-run equilibrium value. If the real domestic interest rate is below thereal foreign interest rate, then the real exchange rate of the domesticcurrency will be undervalued in relation to its long-run equilibriumvalue, so that there is an expected appreciation of the real exchangerate of the domestic currency to compensate.
3 See Kirchgassner and Wolters (1993) and Moosa and Bhatti (1996)for the German-dominance hypotesis; Chumby and Mishikin (1986)and Modjtahedi (1988) for the US-dominance hypotesis; Pain andThomas (1997) and Awad And Goodwin (1998) for the US- andGerman-dominance joints hypotesis.
4 The strong version of RIP implied by real interest rate equalisationrequires that the two interest rates given by [] should be cointegratedwith a cointegrating vector equal to [1-1].
5 The case of Singapore is an interesting one. In year 1999 for example,the US investments in Singapore amounted for US$ 24781 million,which are nearly half of the total US investments in ASEAN-5. Atthe same time, Japan’s direct investments in Singapore onlyaccounted for US$ 765 million. Classen (1992) noted that the periodof 1981-1985 was one where the Singapore dollar stabilised vis-a-visthe US dollar. Classen argued that during this period, the Monetaryww
w.ij
ms.
uum
.edu
.my
46 IJMS 14 (1), 23-48 (2007)
Authority of Singapore (MAS) switched from a “multicurrency peg”to a US-dollar peg to enhance its position as an international financialcentre.
6 The authors are grateful to an anonymous referee for pointing outthis point.
REFERENCES
Anoruo, E. S., Ramchander., & Thiewes, H. F. (2002). Internationallinkage of interest rates: Evidence from the emerging economiesof Asia. Global Finance Journal, 13, 217-235.
Awad, M. A., & Goodwin, B. K. (1998). Dynamic dinkages among realinterest rates in International Capital Market. Journal ofInternational Money and Finance, 17, 881-907.
Ahmad Zubaidi, Baharumshah., Chan, Tze Haw., & Stilianos, F. S.(2005). A panel study on real interest rate parity in East Asiancountries: Pre- and post-liberalisation era. Global Finance Journal,16(1), 1-112, 2005.
Chan, Tse Haw. (2001). International capital mobility and financialintegration: The Asia Pacific perspective. Master of ScienceDissertation, Universiti Putra Malaysia.
Chinn, M. D., & Frankel, J. A. (1995). Who drives real interest ratesaround the Pacific Rim: The USA or Japan. Journal of InternationalMoney and Finance, 14, 801-821.
Classen, E. M. (1992). Financial liberalisation and its impact on domesticstabilization policies: Singapore and Malaysia. Institute of SoutheastAsian Studies.
Cumby, R. E., & Mishkin, M. S. (1986). The international linkage ofreal interest rates: The European-US connection. Journal ofInternational Money and Finance, 5, 5-23.
Faruqee, H. (1992). Dynamic capital mobility in Pacific BasinDeveloping Countries: Estimation and policy implications. StaffPapers, International Monetary Fund, 39, 706-717.
Frankel, J. A. (1979). On the mark: A theory of floating exchange ratesbased on real interest differentials. American Economic Review,69, 610-622.
Fukao, M., & Hanazaki, M. (1986). Internationalisation of financial markets:Some implications for macroeconomic policy and for the allocation ofcapital. Economics Department Working Paper, No. 37, OECD:Paris.
Gonzala, J. (1994). Comparison of five alternative methods of estimatinglong-run equilibrium relationships. Journal of Econometrics, 60,203–233.ww
w.ij
ms.
uum
.edu
.my
IJMS 14 (1), 23-48 (2007) 47
Goodwin, B. K., & Greenes, T. J. (1994). Real interest rate equalisationand the integration of international financial markets. Journal ofInternational Money and Finance, 13, 107-124.
Granger, C. W. J. (1986). Developments in the study of cointegratedeconomic variables. Oxford Bulletin of Economics and Statistics,48, 213-228.
Hassapis, C., Nikitas, P., & Kyprianos, P. (1999). Unit roots and Grangercausality in the EMS interest rates: The German dominancehypothesis revisited. Journal of International Money and Finance,18, 47-73.
Holmes, M. J. (2002). Does long-run real interest parity hold amongEU countries? Some new panel data evidence. Quarterly Reviewof Economics and Finance, 42, 743-746.
Juselius, K., & MacDonald, R. (2003). International parity relationshipsbetween the USA and Japan. Japan and the World Economy, 482,1-18.
Johansen, S., & Juselius, K. (1990). Maximum likelihood estimation andinference on cointegration with applications to money demand.Oxford Bulletin of Economics and Statistics, 52, 169-210.
Johansen, S., & Juselius, K. (1992). Testing structural hypothesis in amultivariate cointegration analysis of the PPP and the UIP forUK. Journal of Econometrics, 53, 211-244.
Kirchgassner, G., & Wolters, J. (1993). Does the DM dominate the EuroMarket? An empirical investigation. The Review of Economics andStatistics, 75, 773-778.
Lemmen, J. J. G., & Eijffinger, S. C. W. (1995). The quantity approach tofinancial integration: The Feldstein-Horioka criterion revisited.Open Economies Review, l6, 145-165.
Masih, A. M. M., & Masih, R. (1996). Common stochastic trends,multivariate market efficiency and the temporal causal dynamicsin a system of daily spot exchange rates. Applied FinancialEconomics, 6, 495-504.
Merrick, J. J., & Saunders, A. (1986). International expected real interestrates: New tests of the parity hypothesis and US fiscal policyeffects. Journal of Monetary Economics, 8, 313-322.
Mishkin, F. S. (1984). Are real interest rates equal across countries? Anempirical investigation of international parity conditions. TheJournal of Finance, 39, 1345-1357.
Modjtahedi, B. (1988). Dynamics of real interest differentials: Anempirical investigation. European Economic Review, 32, 1191-1212.
Moosa, I., & Bhatti, R. H. (1996). Does Europe have an integrated capitalmarket? Evidence from real interest parity tests. Applied EconomicLetters, 3, 517-520.
Pain, D., & Thomas, R. (1997). Real interest rate linkages: Testing gotcommon trends and cycles. Bank of England Working Paper.ww
w.ij
ms.
uum
.edu
.my
48 IJMS 14 (1), 23-48 (2007)
Park, Y. C. (2002). Financial liberalisation and economic integration in EastAsia. Korea University, Unpublished Manuscript.
Phylaktis, K. (1997). Capital market integration in the Pacific Basinregion: An analysis of real interest linkages. Pacific Basin FinanceJournal, 5, 195-213.
Phylaktis, K. (1999). Capital market integration in the Pacific Basinregion: An impulse response analysis. Journal of InternationalMoney and Finance, 18, 267-287.
Rogoff, K. (1996). The purchasing power parity puzzle. Journal ofEconomic Literature, 34, 647-668.
Shan, J., & Pappas, N. (2000). The relative impacts of Japanese and USinterest rates on local interest rates in Australia and Singapore:A granger causality test. Applied Financial Economics, 10, 291-298.