Page 1
IJPAS Vol.03 Issue-02, (February, 2016) ISSN: 2394-5710
International Journal in Physical & Applied Sciences (Impact Factor- 3.960)
A Monthly Double-Blind Peer Reviewed Refereed Open Access International e-Journal - Included in the International Serial Directories International Journal in Physical & Applied Sciences
http://www.ijmr.net.in email id- [email protected] Page 16
Abstract
This Paper presents a study of surface roughness and wear analysis by CNC turning process
in the use of TNMG 16 04 08 carbide inserts on Fiber Particle Reinforced Polymer composites
(FPRP). The primary problem that has been encountered in the development of machining
operation is tool wear. Tool wear in machining is defined as the amount of volume loss of tool
material on the contact surface due to interaction between the tool and the work piece. Tool wear
is an important factor directly affecting the surface quality of the machined products. Recent
mathematical and computational advances have fashioned a number of researches focusing on
several aspects of modelling and analysis of tool wear. Many literatures indicate that in the turning
process, cutting speed, feed rate and depth of cut are the major influential parameters which affect
the tool wear. Hence it is essential to evaluate the effect of various processing parameters on the
tool wear.With this overall view, the present work is about to study the surface finish and tool wear
with different parameters viz. speed, feed, depth of cut, fiber orientation and diameter of fiber,
which will be a scope in Industrial purpose.
Keywords: FPRP , TNMG 16 04 08, Surface roughness, Tool wear, Taguchi.
ANALYSIS OF SURFACE ROUGHNESS AND WEAR BY TURNING OF FIBER PARTICULATE
REINFORCED POLYMER COMPOSITE
S.Navaneethakrishnan.a A.Athijayamani b
a Assistant Professor, Department of Mechanical Engineering, Chendhuran college of
engineering and technology pudukkottai , Tamilnadu India.
b Assistant Professor, Department of Mechanical Engineering,A.C.College of
Engineering,karaikudi,Tamilnadu.india.
Page 2
IJPAS Vol.03 Issue-02, (February, 2016) ISSN: 2394-5710
International Journal in Physical & Applied Sciences (Impact Factor- 3.960)
A Monthly Double-Blind Peer Reviewed Refereed Open Access International e-Journal - Included in the International Serial Directories International Journal in Physical & Applied Sciences
http://www.ijmr.net.in email id- [email protected] Page 17
1. Introduction
Fiber reinforced polymer composites are used extensively used in automobile,
aerospace and marine applications because of their high specific strength, high specific stiffness,
better impact characteristics, corrosion resistance and design flexibility. Fiber and particulate
reinforced composites are an economic alternative to stainless steel and other materials in
highly corrosive industrial applications. In recent years, fiber/particle reinforced polymers (FPRP)
have been extensively used in variety of engineering applications in different fields such as
aerospace, oil, gas and process industries. FPRP composite components are normally fabricated
by processes such as filament winding, hand lay-up, etc. After fabrication, they require further
machining to facilitate dimensional control for easy assembly and for functional aspects. The
machining of FPRP composites is different from conventional materials. The behavior of
composites is anisotropic. The quality of machined products depends upon the fibers, matrix
materials used, bond strength between fiber and matrix, type of weave, etc., The mechanism of
material removal is also different from that of single-phased material, such as metals. De-
lamination, fiber pull-out, fiber fragmentation, burring, and fuzzing are some of the types of
damage caused by machining FPRP, as reported by suleymanneseli [1]. H.M.Somashekara et al.
[2] suggested that surface roughness in turning operation using Taguchi technique for cemented
carbide tools to improve the machinability of composites. Poornima et al. [3] studied the
Optimization of machining parameters in CNC turning of martensitic stainless steel using RSM
and GA. B. Sidda Reddy et al. [4] carried out study on machining of polymer composites. They
concluded that higher cutting speeds give better surface finish. S. Rajesh [5] studied the Multi-
response optimization of machining parameters surface. Pankaj Sharma. [6] attempted a
Investigation Of Machining Parameters In CNC Turning By Taguchi Based Grey Relational
Analysis. Compared to conventional drilling, this method has resulted in reduced cutting forces,
less damage, and reduced tool wear. Show-ShyanLin et al. [7] reported that the Optimization of
6061T6 CNC Boring Process Using the Taguchi Method and Grey Relational Analysis. Muhammad
AL Firdausi bin johari [8] Optimize the cutting parameters for turning operation based on taguchi
method. Anil Gupta [9] reported that in high speed CNC turning of AISI P-20 tool steel
.Machining of FPRP material is difficult to carry out due to the non-homogenous structure of
material. Several authors studied the effect of process parameters on tool wear for different
work materials. However, studies on tool wear in FPRP are not widely available in literature.
Most of the researches have been carried out on the characterization of natural fiber
composites but the prediction of mechanical properties is found to be limited in
Page 3
IJPAS Vol.03 Issue-02, (February, 2016) ISSN: 2394-5710
International Journal in Physical & Applied Sciences (Impact Factor- 3.960)
A Monthly Double-Blind Peer Reviewed Refereed Open Access International e-Journal - Included in the International Serial Directories International Journal in Physical & Applied Sciences
http://www.ijmr.net.in email id- [email protected] Page 18
literature[10,11]. Some of the manufacturing studies on roselle fiber/particle reinforced polymer
composites have been carried out using taguchi method and ANOVA techniques.[12]
2. Material and Methods
Roselle fiber and coconut shell particles reinforced Polymer (FPRP) is a composite material,
which consist of vinylester thermosetting resin as matrix and fiber/particle as reinforcement.
Pultrusion technique is used to fabricate FPRP products in various continuous forms of structural
sections such as box, I-, H-, and plates, which are similar as steel sections. Pultrusion is the process of
"pulling" raw composites through a heated die creating a continuous composite profile. The term
pultrusion combines the words, "pull" and "extrusion". Extrusion is the pushing of material, such as a
billet of aluminum, through a shaped die. Whereas pultrusion, is the pulling of material, such as
fiberglass and resin, through a shaped die.
The pultrusion process starts with racks or creels holding rolls of fiber mat or doffs of fiber
roving. Most often the Reinforcement is fiberglass, but it can be carbon, aramid, or a mixture. This
raw fiber is pulled off the racks and guided through a resin bath or resin impregnation system. Resin
can also be injected directly into the die in some pultrusion systems. The experimental work was
carried out on the Galaxy- Midas 6 CNC turning machine. FPRP rod (Ø 45x100 mm) was used for the
present work. Its composition is 82.27% of Fiber/particle and 17.73% of Vinylester resin. The TNMG
16 04 08 carbide inserts were selected as cutting tool. The experimental conditions are given in
Table 2. After machining, the surface roughness values Ra were measured by a Mitutoyo SJ-201
Surface roughness tester. Also tool wear was measured by Tool maker microscope. Using L9 Taguchi
standard orthogonal array, the experimental results are carried out. This plan was developed for
establishing the quadratic model for surface roughness and tool wear by using Taguchi Method.
2.1 Design of Experiment
Design of experiments is a standard tool to conduct the experiment in an optimum way to
investigate the effects of process parameters on the response or output parameter. The design
matrix for three blocks, in which each of two factors are varied through the four possible
combinations of higher and lower limits. In each block a certain number of factors are put through
all combinations for the three factorial designs, while the other factors are kept at central values.
Accordance with literature survey identified the turning parameters and their levels for the
experiment are cutting speed, feed and depth of cut are given in Table.1.
Page 4
IJPAS Vol.03 Issue-02, (February, 2016) ISSN: 2394-5710
International Journal in Physical & Applied Sciences (Impact Factor- 3.960)
A Monthly Double-Blind Peer Reviewed Refereed Open Access International e-Journal - Included in the International Serial Directories International Journal in Physical & Applied Sciences
http://www.ijmr.net.in email id- [email protected] Page 19
Table 1: Process Parameters and their Levels
2.2 Taguchi’s Method
The Taguchi method for robust design is a powerful tool. Two major tools used in
robust design are S/N ratio and orthogonal array. Robust design is an important method for
improving product or manufacturing process design by making the output response insensitive
(robust) to difficult to control variations (noise). There are several types of quality characteristics,
such as the lower-the-better, the higher-the-better and the nominal-the-better. In this study, since
surface roughness should be a minimum and tool wear also minimum the smaller-the-better type of
the S/N ratio has been used and is defined as follows:
S/N= -10 log*1/n (y1²+ y2²+…. yn²) (1)
Where (y1²+ y2²+…. yn²) are the responses of the machining characteristic, for a trial condition
repeated times. The negative sign in Eq. (1) is for showing the smaller-the better quality
characteristic. The S/N ratios were computed using Eq. (1) for each of the 9 trials, and the values are
re-ported with their experimentally measured values. For this purpose, the first step in the
optimization process is to determine the S/N ratio for all the experimental tests using the Taguchi
method. The next step is to find out the objective function. The three machining performance
characteristics are to be optimized to meet the objective of the study. According to the literature
review, the following summaries can be made: (OA) to examine the quality characteristics through a
minimum number of experiments. The experimental results based on the OA are then transformed
into S/N ratios to evaluate the performance characteristics. Therefore, the Taguchi method
concentrates on the effects of variations on quality characteristics, rather than on the averages. That
is, the Taguchi method makes the process performance insensitive to the variations of
uncontrollable noise factors [1].
3. Experimental Details
This experiment works are planned using Taguchi,s orthogonal array in the design of
experiments (DOE), Which helps in reducing the number of experiments. The number of three
cutting parameters is selected for the present investigation is cutting speed (v), feed (f), and depth
of cut (d). previous studies on the effect of machining parameters on FPRP composites indicate that
higher cutting speeds were found to cause a large deformation range of fiber/particle, Taguchis
orthogonal array L9 is most suitable for this experiment. This needs 9 runs and has 8 degree of
freedoms.
Page 5
IJPAS Vol.03 Issue-02, (February, 2016) ISSN: 2394-5710
International Journal in Physical & Applied Sciences (Impact Factor- 3.960)
A Monthly Double-Blind Peer Reviewed Refereed Open Access International e-Journal - Included in the International Serial Directories International Journal in Physical & Applied Sciences
http://www.ijmr.net.in email id- [email protected] Page 20
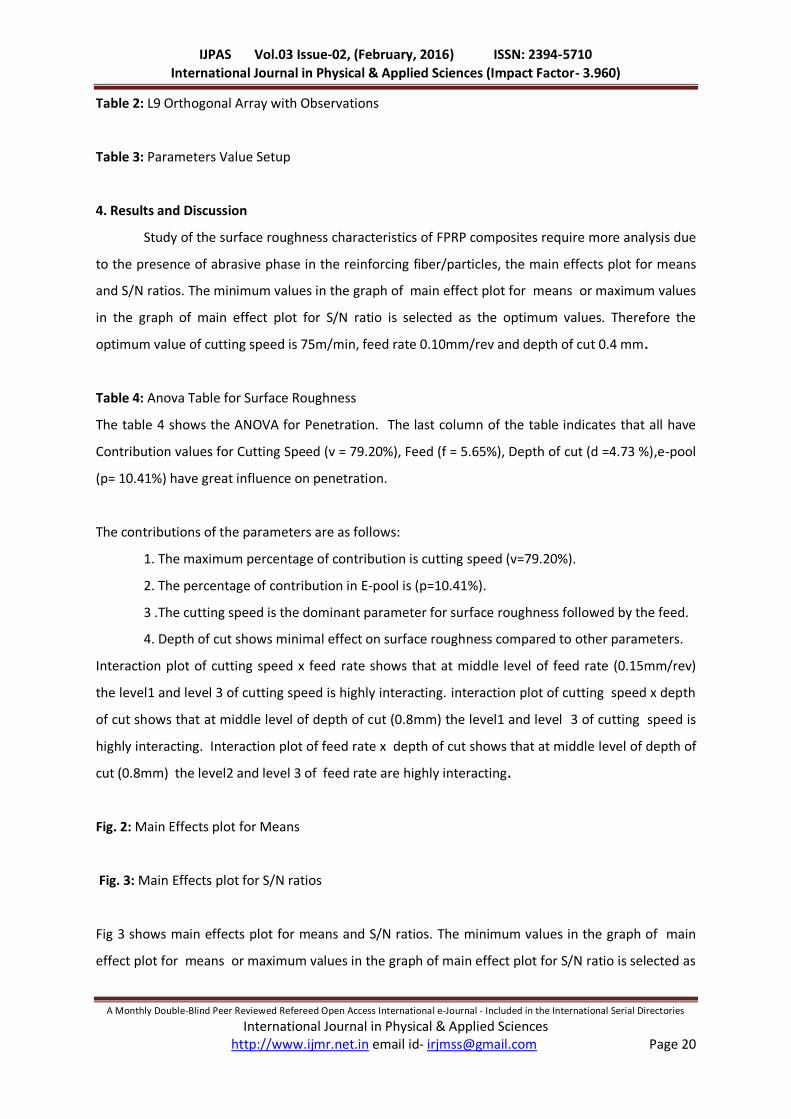
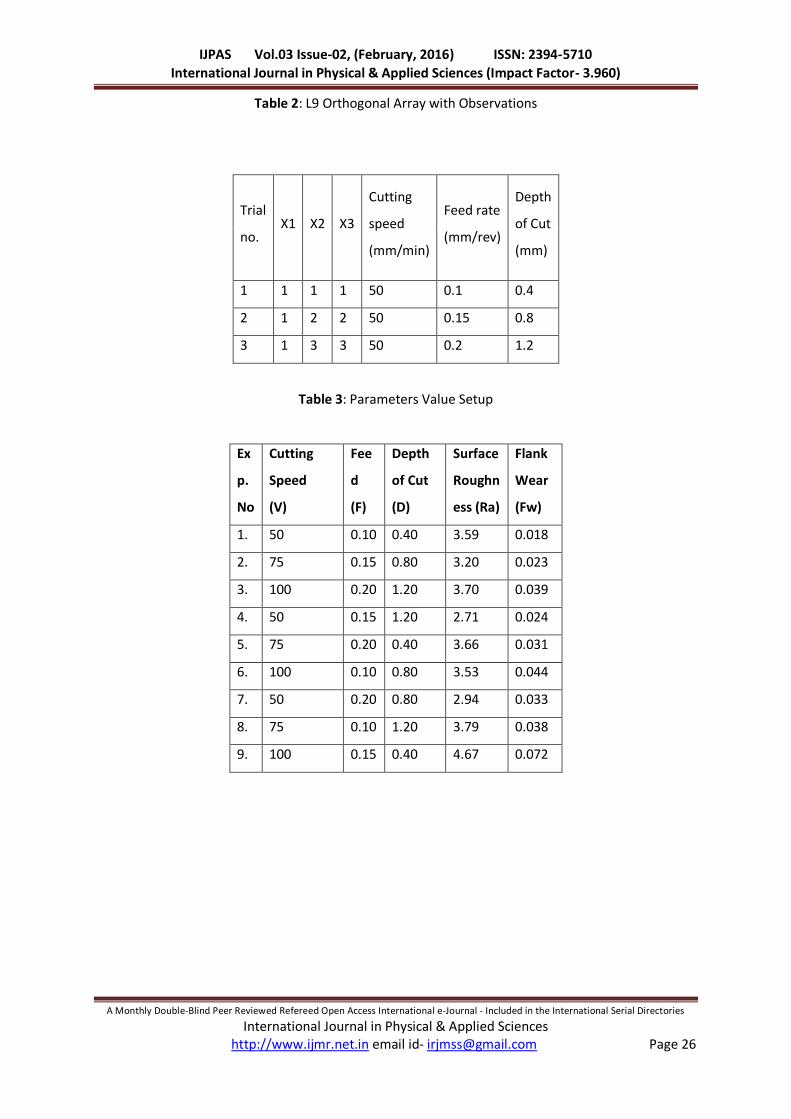
Table 2: L9 Orthogonal Array with Observations
Table 3: Parameters Value Setup
4. Results and Discussion
Study of the surface roughness characteristics of FPRP composites require more analysis due
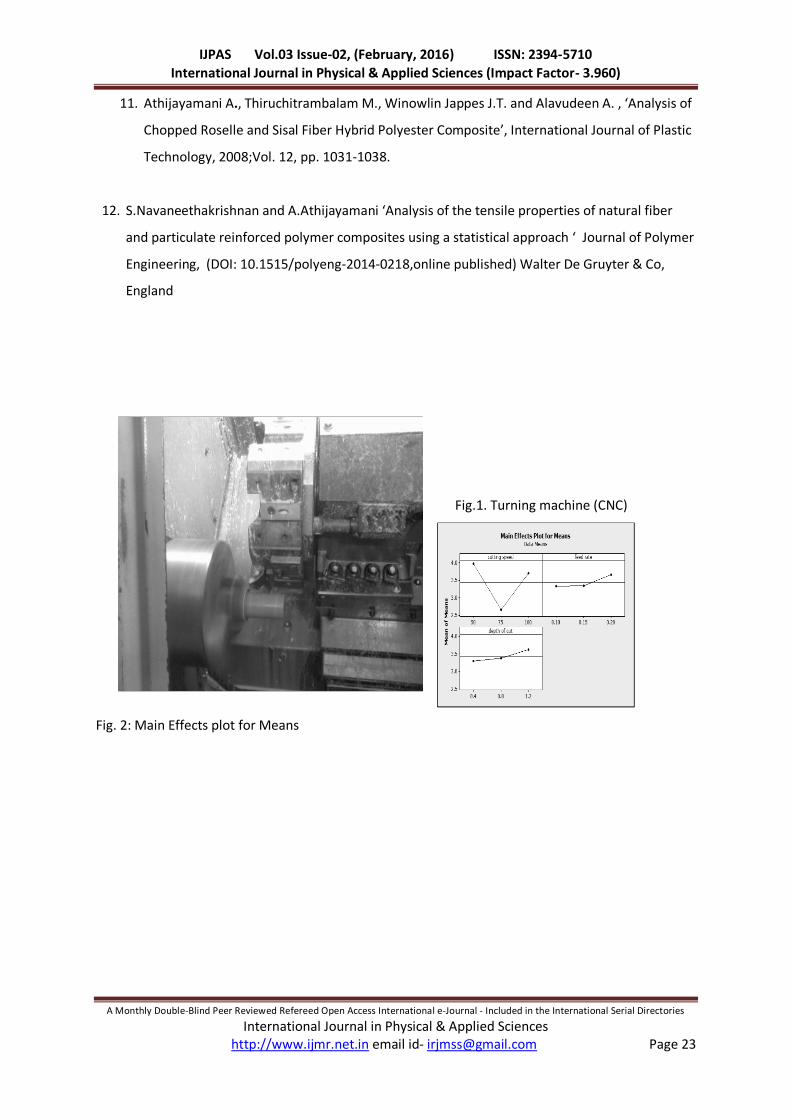
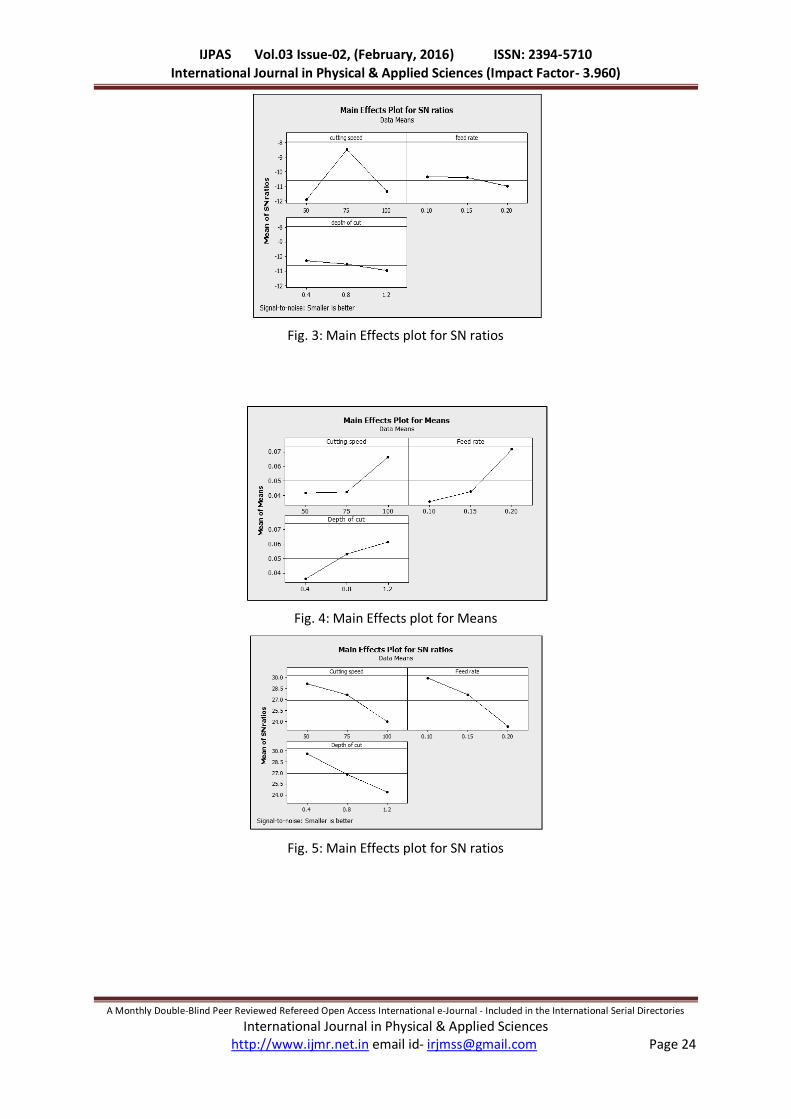
to the presence of abrasive phase in the reinforcing fiber/particles, the main effects plot for means
and S/N ratios. The minimum values in the graph of main effect plot for means or maximum values
in the graph of main effect plot for S/N ratio is selected as the optimum values. Therefore the
optimum value of cutting speed is 75m/min, feed rate 0.10mm/rev and depth of cut 0.4 mm.
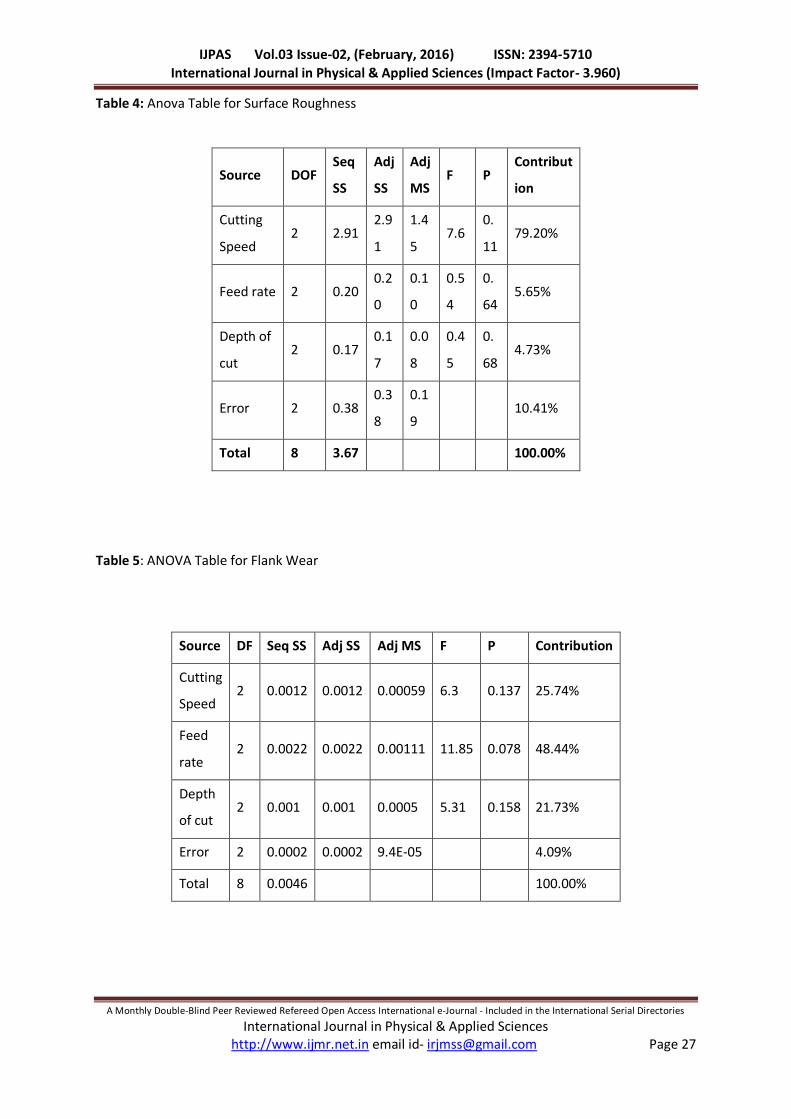
Table 4: Anova Table for Surface Roughness
The table 4 shows the ANOVA for Penetration. The last column of the table indicates that all have
Contribution values for Cutting Speed (v = 79.20%), Feed (f = 5.65%), Depth of cut (d =4.73 %),e-pool
(p= 10.41%) have great influence on penetration.
The contributions of the parameters are as follows:
1. The maximum percentage of contribution is cutting speed (v=79.20%).
2. The percentage of contribution in E-pool is (p=10.41%).
3 .The cutting speed is the dominant parameter for surface roughness followed by the feed.
4. Depth of cut shows minimal effect on surface roughness compared to other parameters.
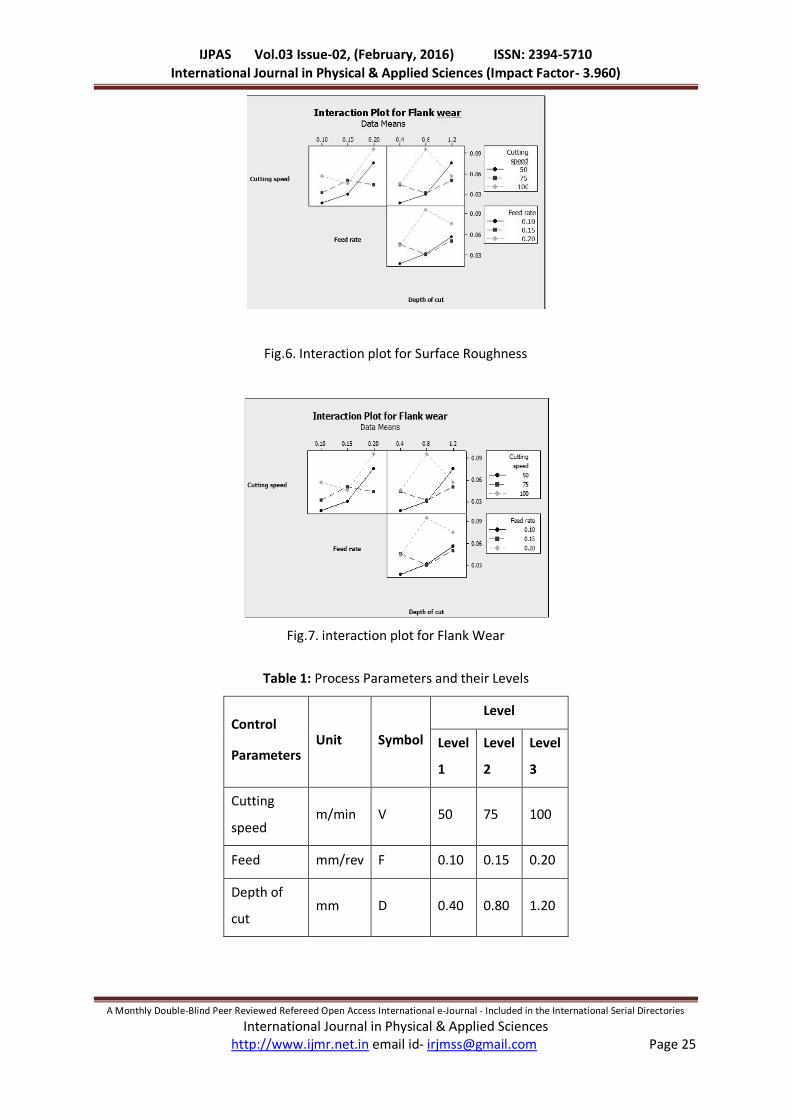
Interaction plot of cutting speed x feed rate shows that at middle level of feed rate (0.15mm/rev)
the level1 and level 3 of cutting speed is highly interacting. interaction plot of cutting speed x depth
of cut shows that at middle level of depth of cut (0.8mm) the level1 and level 3 of cutting speed is
highly interacting. Interaction plot of feed rate x depth of cut shows that at middle level of depth of
cut (0.8mm) the level2 and level 3 of feed rate are highly interacting.
Fig. 2: Main Effects plot for Means
Fig. 3: Main Effects plot for S/N ratios
Fig 3 shows main effects plot for means and S/N ratios. The minimum values in the graph of main
effect plot for means or maximum values in the graph of main effect plot for S/N ratio is selected as
Page 6
IJPAS Vol.03 Issue-02, (February, 2016) ISSN: 2394-5710
International Journal in Physical & Applied Sciences (Impact Factor- 3.960)
A Monthly Double-Blind Peer Reviewed Refereed Open Access International e-Journal - Included in the International Serial Directories International Journal in Physical & Applied Sciences
http://www.ijmr.net.in email id- [email protected] Page 21
the optimum values. Therefore the optimum value of cutting speed is 50m/min, feed rate
0.10mm/rev and depth of cut 0.4 mm.
Fig. 4: Main Effects plot for Means
Fig. 5: Main Effects plot for S/N ratios
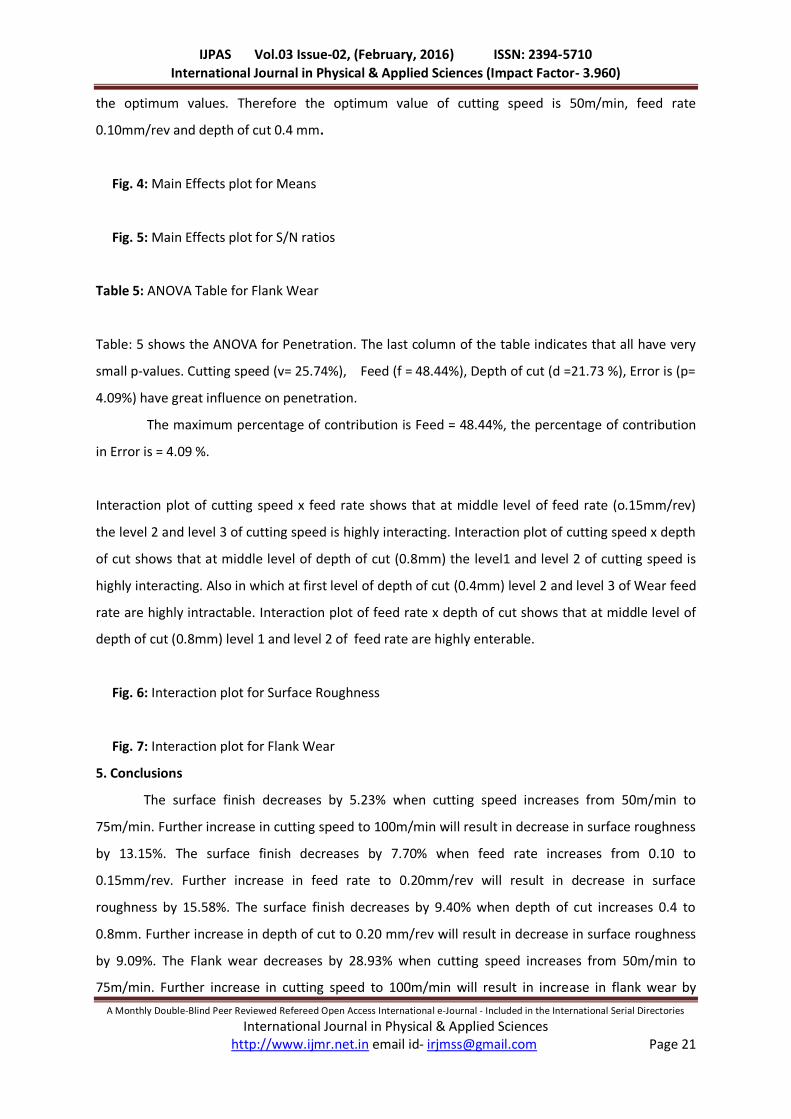
Table 5: ANOVA Table for Flank Wear
Table: 5 shows the ANOVA for Penetration. The last column of the table indicates that all have very
small p-values. Cutting speed (v= 25.74%), Feed (f = 48.44%), Depth of cut (d =21.73 %), Error is (p=
4.09%) have great influence on penetration.
The maximum percentage of contribution is Feed = 48.44%, the percentage of contribution
in Error is = 4.09 %.
Interaction plot of cutting speed x feed rate shows that at middle level of feed rate (o.15mm/rev)
the level 2 and level 3 of cutting speed is highly interacting. Interaction plot of cutting speed x depth
of cut shows that at middle level of depth of cut (0.8mm) the level1 and level 2 of cutting speed is
highly interacting. Also in which at first level of depth of cut (0.4mm) level 2 and level 3 of Wear feed
rate are highly intractable. Interaction plot of feed rate x depth of cut shows that at middle level of
depth of cut (0.8mm) level 1 and level 2 of feed rate are highly enterable.
Fig. 6: Interaction plot for Surface Roughness
Fig. 7: Interaction plot for Flank Wear
5. Conclusions
The surface finish decreases by 5.23% when cutting speed increases from 50m/min to
75m/min. Further increase in cutting speed to 100m/min will result in decrease in surface roughness
by 13.15%. The surface finish decreases by 7.70% when feed rate increases from 0.10 to
0.15mm/rev. Further increase in feed rate to 0.20mm/rev will result in decrease in surface
roughness by 15.58%. The surface finish decreases by 9.40% when depth of cut increases 0.4 to
0.8mm. Further increase in depth of cut to 0.20 mm/rev will result in decrease in surface roughness
by 9.09%. The Flank wear decreases by 28.93% when cutting speed increases from 50m/min to
75m/min. Further increase in cutting speed to 100m/min will result in increase in flank wear by
Page 7
IJPAS Vol.03 Issue-02, (February, 2016) ISSN: 2394-5710
International Journal in Physical & Applied Sciences (Impact Factor- 3.960)
A Monthly Double-Blind Peer Reviewed Refereed Open Access International e-Journal - Included in the International Serial Directories International Journal in Physical & Applied Sciences
http://www.ijmr.net.in email id- [email protected] Page 22
34.13%. The Flank wear increases by 0.12% when feed rate increases from 0.10 to 0.15mm/rev.
Further increase in feed rate to 0.20mm/rev will result in increase in Flank wear by 6.04%. The Flank
wear increases by 2.43% when depth of cut increases 0.4 to 0.8mm. Further increase in depth of cut
to 0.20mm/rev will result in increase in Flank wear by 4.28%.
6. References
1. IlhanAsilturk, suleymanneseli , Multi response optimisation of CNC turning parameters via
Taguchi method based response surface analysis. Measurement2012; 45; 785-794.
2. Somashekara H.M, Dr. Lakshmanaswamy .N. ,Optimizing surface roughness in turning
operation using Taguchi technique and Anova. J.Enng.Sci & Tech,. 2012 Vol. 4 No.05 .
3. Poornima, sukumar., Optimization of machining parameters in CNC turning of martensitic
stainless steel using RSM and GA. J.Modern Engg. Research.: 2012;2; 539-542.
4. Sidda Reddy B., Suresh Kumar J., Vijaya Kumar Reddy K. , Prediction of Surface Roughness in
Turning Using Adaptive Neuro-Fuzzy Inference System .J. J.Mech & Ind . Engg. 2009
5. Rajesh S.,. Devaraj D, SudhakaraPandian R. and Rajakarunakaran S.,.Multi-response
optimization of machining parameters on red mud-based aluminum metal matrix
composites in turning process”.Int J AdvManufTechnol. 2011; Volume 67, 811-821
6. Pankaj Sharma, Kamaljeet Bhambri . Multi-Response Optimization By Experimental
Investigation Of Machining Parameters In CNC Turning By Taguchi Based Grey Relational
Analysis, J. Engg. Research and Applications 2012;2:1594-1602.
7. Show-ShyanLin,Ming-TsanChuang,Jeong-LianWen,andYung-KuangYang, Optimization of
6061T6 CNC Boring Process Using the Taguchi Method and Grey Relational Analysis J. Open.
Ind .and Mfg. Engg 2009;2: 14-20.
8. Muhammad AL Firdausi bin johari , Design Optimization of cutting parameters for turning
operation based on taguchi method”. Faculty of Mechanical Engineering University Malaysia
Pahang. 2008
9. Anil Gupta, Hari Singh, AmanAggarwal ,Taguchi-fuzzy multi output optimization (MOO) in
high speed CNC turning of AISI P-20 tool steel.Expert Systems with Applications . 2011;38:
6822–6828.
10. Athijayamani A., Thiruchitrambalam M., Natarajan U. and Pazhanivel B. ‘Effect of moisture
absorption on the mechanical properties of randomly oriented natural fibers/polyester
hybrid composites’, Materials Science and Engineering: A, 2009;Vol.517, pp.344-353.
Page 8
IJPAS Vol.03 Issue-02, (February, 2016) ISSN: 2394-5710
International Journal in Physical & Applied Sciences (Impact Factor- 3.960)
A Monthly Double-Blind Peer Reviewed Refereed Open Access International e-Journal - Included in the International Serial Directories International Journal in Physical & Applied Sciences
http://www.ijmr.net.in email id- [email protected] Page 23
11. Athijayamani A., Thiruchitrambalam M., Winowlin Jappes J.T. and Alavudeen A. , ‘Analysis of
Chopped Roselle and Sisal Fiber Hybrid Polyester Composite’, International Journal of Plastic
Technology, 2008;Vol. 12, pp. 1031-1038.
12. S.Navaneethakrishnan and A.Athijayamani ‘Analysis of the tensile properties of natural fiber
and particulate reinforced polymer composites using a statistical approach ‘ Journal of Polymer
Engineering, (DOI: 10.1515/polyeng-2014-0218,online published) Walter De Gruyter & Co,
England
Fig.1. Turning machine (CNC)
Fig. 2: Main Effects plot for Means
Page 9
IJPAS Vol.03 Issue-02, (February, 2016) ISSN: 2394-5710
International Journal in Physical & Applied Sciences (Impact Factor- 3.960)
A Monthly Double-Blind Peer Reviewed Refereed Open Access International e-Journal - Included in the International Serial Directories International Journal in Physical & Applied Sciences
http://www.ijmr.net.in email id- [email protected] Page 24
Fig. 3: Main Effects plot for SN ratios
Fig. 4: Main Effects plot for Means
Fig. 5: Main Effects plot for SN ratios
Page 10
IJPAS Vol.03 Issue-02, (February, 2016) ISSN: 2394-5710
International Journal in Physical & Applied Sciences (Impact Factor- 3.960)
A Monthly Double-Blind Peer Reviewed Refereed Open Access International e-Journal - Included in the International Serial Directories International Journal in Physical & Applied Sciences
http://www.ijmr.net.in email id- [email protected] Page 25
Fig.6. Interaction plot for Surface Roughness
Fig.7. interaction plot for Flank Wear
Table 1: Process Parameters and their Levels
Control
Parameters Unit Symbol
Level
Level
1
Level
2
Level
3
Cutting
speed m/min V 50 75 100
Feed mm/rev F 0.10 0.15 0.20
Depth of
cut mm D 0.40 0.80 1.20
Page 11
IJPAS Vol.03 Issue-02, (February, 2016) ISSN: 2394-5710
International Journal in Physical & Applied Sciences (Impact Factor- 3.960)
A Monthly Double-Blind Peer Reviewed Refereed Open Access International e-Journal - Included in the International Serial Directories International Journal in Physical & Applied Sciences
http://www.ijmr.net.in email id- [email protected] Page 26
Table 2: L9 Orthogonal Array with Observations
Trial
no. X1 X2 X3
Cutting
speed
(mm/min)
Feed rate
(mm/rev)
Depth
of Cut
(mm)
1 1 1 1 50 0.1 0.4
2 1 2 2 50 0.15 0.8
3 1 3 3 50 0.2 1.2
Table 3: Parameters Value Setup
Ex
p.
No
Cutting
Speed
(V)
Fee
d
(F)
Depth
of Cut
(D)
Surface
Roughn
ess (Ra)
Flank
Wear
(Fw)
1. 50 0.10 0.40 3.59 0.018
2. 75 0.15 0.80 3.20 0.023
3. 100 0.20 1.20 3.70 0.039
4. 50 0.15 1.20 2.71 0.024
5. 75 0.20 0.40 3.66 0.031
6. 100 0.10 0.80 3.53 0.044
7. 50 0.20 0.80 2.94 0.033
8. 75 0.10 1.20 3.79 0.038
9. 100 0.15 0.40 4.67 0.072
Page 12
IJPAS Vol.03 Issue-02, (February, 2016) ISSN: 2394-5710
International Journal in Physical & Applied Sciences (Impact Factor- 3.960)
A Monthly Double-Blind Peer Reviewed Refereed Open Access International e-Journal - Included in the International Serial Directories International Journal in Physical & Applied Sciences
http://www.ijmr.net.in email id- [email protected] Page 27
Table 4: Anova Table for Surface Roughness
Source DOF Seq
SS
Adj
SS
Adj
MS F P
Contribut
ion
Cutting
Speed 2 2.91
2.9
1
1.4
5 7.6
0.
11 79.20%
Feed rate 2 0.20 0.2
0
0.1
0
0.5
4
0.
64 5.65%
Depth of
cut 2 0.17
0.1
7
0.0
8
0.4
5
0.
68 4.73%
Error 2 0.38 0.3
8
0.1
9 10.41%
Total 8 3.67
100.00%
Table 5: ANOVA Table for Flank Wear
Source DF Seq SS Adj SS Adj MS F P Contribution
Cutting
Speed 2 0.0012 0.0012 0.00059 6.3 0.137 25.74%
Feed
rate 2 0.0022 0.0022 0.00111 11.85 0.078 48.44%
Depth
of cut 2 0.001 0.001 0.0005 5.31 0.158 21.73%
Error 2 0.0002 0.0002 9.4E-05
4.09%
Total 8 0.0046
100.00%