1 DAMMED IF YOU DO, DAMMED IF YOU DON’T: TENSIONS BETWEEN ENSURING DAM SAFETY AND MAXIMIZING COLORADO’S WATER SUPPLY Ikard, Scott, Delborne, Jason, and Brunsdale, Kenley Abstract Reflecting a classic policy paradox, Colorado’s dam safety policies threaten the availability of the state’s long-term water supply. Recent studies indicate that Colorado water users will face water shortages that are expected to exceed 1.1 million acre-feet per year by 2050 representing a mixture of municipal, agricultural and environmental demands compounded by an increasing population and uncertainty due to predicted climate-change stresses. Increasing water availability without compromising the state's non-renewable ground water will require an expansion of Colorado's surface storage capacity to collect runoff during periods of high rainfall or snow melt. Paradoxically, at the same time that Colorado needs to expand surface storage capacity, state regulators are protecting the public from dam failures by restricting the storage capacity of many dams. This occurs when a dam is deemed unsafe and regulators require operators to lower the water level to assure public safety from a potential dam failure. This does not always enhance public safety from dam failures, and the net long-term effect is a reduction of Colorado’s total storage capacity which is counterproductive to long term water
Transcript
1
DAMMED IF YOU DO, DAMMED IF YOU DON’T: TENSIONS BETWEEN
ENSURING DAM SAFETY AND MAXIMIZING COLORADO’S WATER
SUPPLY
Ikard, Scott, Delborne, Jason, and Brunsdale, Kenley
Abstract
Reflecting a classic policy paradox, Colorado’s dam safety policies threaten the availability of
the state’s long-term water supply. Recent studies indicate that Colorado water users will face
water shortages that are expected to exceed 1.1 million acre-feet per year by 2050
representing a mixture of municipal, agricultural and environmental demands compounded by
an increasing population and uncertainty due to predicted climate-change stresses. Increasing
water availability without compromising the state's non-renewable ground water will require an
expansion of Colorado's surface storage capacity to collect runoff during periods of high rainfall
or snow melt. Paradoxically, at the same time that Colorado needs to expand surface storage
capacity, state regulators are protecting the public from dam failures by restricting the storage
capacity of many dams. This occurs when a dam is deemed unsafe and regulators require
operators to lower the water level to assure public safety from a potential dam failure. This
does not always enhance public safety from dam failures, and the net long-term effect is a
reduction of Colorado’s total storage capacity which is counterproductive to long term water
2
supply goals. This paper explores and quantifies this contradiction in meeting the public goals
of dam safety and water storage, pointing to the need for incentives to rehabilitate the storage
capacity of Colorado’s dams, and illustrating the potential for a market-driven storage leasing
approach to enhance public safety while reducing predicted water shortages by up to 33%.
1.0 Introduction
Colorado’s dam safety policies threaten the availability of the state’s long-term water
supply. Recent studies indicate that Colorado water users will face water shortages that are
expected to exceed 1.1 million acre-feet per year by 2050, representing a mixture of municipal,
agricultural and environmental demands compounded by an increasing population and
uncertainty due to predicted climate-change stresses (Rowan et al 2010). Paradoxically, at the
same time that Colorado needs to expand surface storage capacity, state regulators are
protecting the public from dam failures by restricting the storage capacity of many dams. This
may not always enhance public safety from dam failures, and the net long-term effect is a
reduction of Colorado’s total storage capacity which is counterproductive to long term water
supply goals.
In this paper we explore and quantify this contradiction in meeting the public goals of
dam safety and water storage, and point to the need for incentives to rehabilitate the storage
capacity of Colorado’s dams. We illustrate the potential for a market-driven storage leasing
approach to enhance public safety and the state’s available water supply. In section 2.0 we
explore the dam safety side of this paradox through trends in the hazard potential ratings and
the restriction status’ of Colorado’s dams, and the impacts that dams have on Colorado
citizens due to their relative locations. We present the most recent data published by the
3
Colorado Division of Water Resources’ (CODWR) Dam Safety Branch1. In section 3.0 we
illustrate the political and technical underpinnings of a dam safety-water supply policy paradox
in Colorado, and its impacts upon the forecasted water supply for the state. In section 4.0 we
highlight and discuss economic and social advantages of a policy alternative to the illustrated
paradox. We conclude our arguments and findings in section 5.0.
2.0 Dam Safety
2.1 Age and Hazard Classification
The apogee of U.S. dam building occurred between 1950 and 1970 (Doyle 2003). The
mean age of America's dam infrastructure is therefore approximately 51 years (American
Society of Civil Engineers 2009). A majority of the dams registered in the U.S. Army Corps of
Engineers’ National Inventory of Dams (NID) have either exceeded their intended life span, or
will exceed their intended life span in the foreseeable future. The Federal Emergency
Management Agency (FEMA 1999a) has estimated that 85% of all U.S. dams will exceed their
intended life span by the year 2020. Dams are becoming a national concern because they
deteriorate as they age and they can become public safety hazards if they are not regulated.
However, this is a burden that is predominantly left to state governments, because state
governments are responsible for regulating 95% of all dams registered in the NID (Lane 2008).
1 The CODWR most recently published dam safety data in the 2011 Annual Report on Dam Safety to the
Colorado General Assembly, corresponding to water year 2009-2010 (Haynes 2010). We inquired into the
availability of the 2012 annual report and were informed that the annual report would not be published in 2012,
but instead is being postponed until 2013.
4
The Dam Safety branch of the CODWR oversees approximately 2,900 dams throughout
Colorado, of which 1,937 are classified as jurisdictional (Haynes 2010). Section 37-87-105
C.R.S. defines jurisdictional dams as being greater than ten feet high when measured from the
toe to the spillway, and/or impounding a reservoir with twenty acres or more in surface area, or
one hundred acre-feet or more in reservoir capacity at the high water line. The CODWR
further classifies Colorado’s jurisdictional dams according to the FEMA (2004) hazard
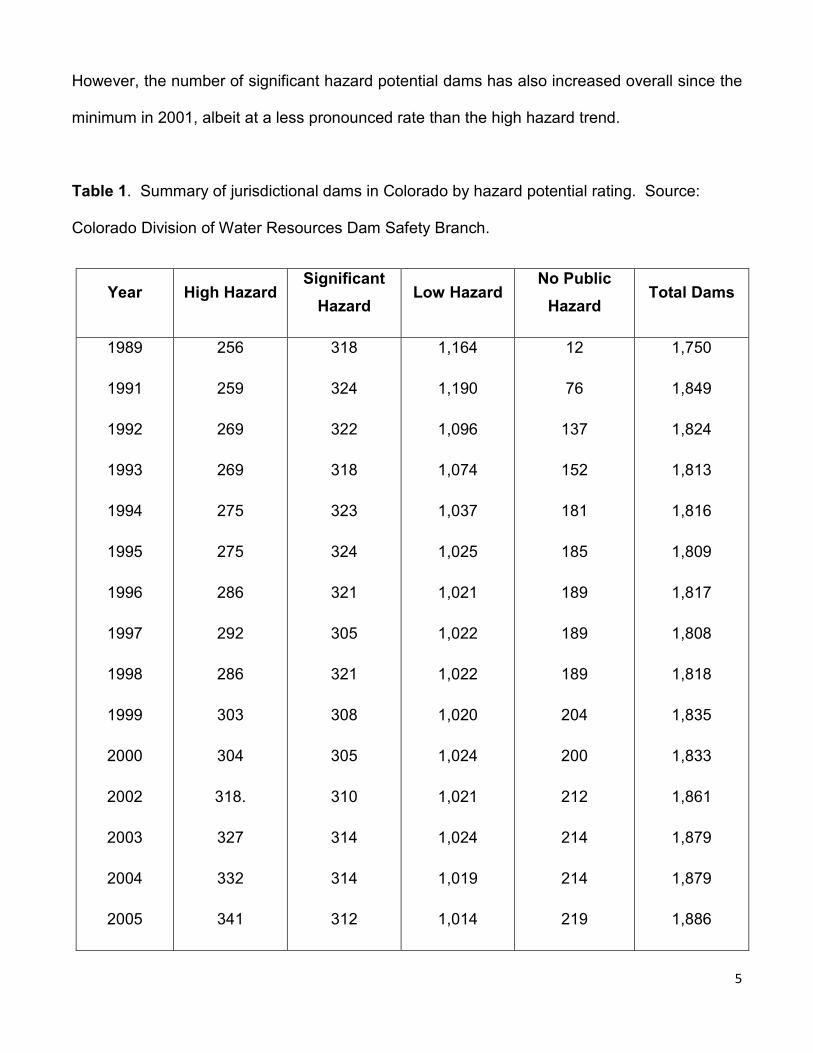
classification system as high, significant, low, or no-hazard potential. Table 1 summarizes the
total number of jurisdictional dams in the state of Colorado by their hazard potential category.
The majority of Colorado’s jurisdictional dams are low and significant hazard potential dams,
and their numbers have remained relatively constant since 1989. However, a steady linearly
increasing trend is apparent with respect to Colorado’s high hazard potential dams, and may
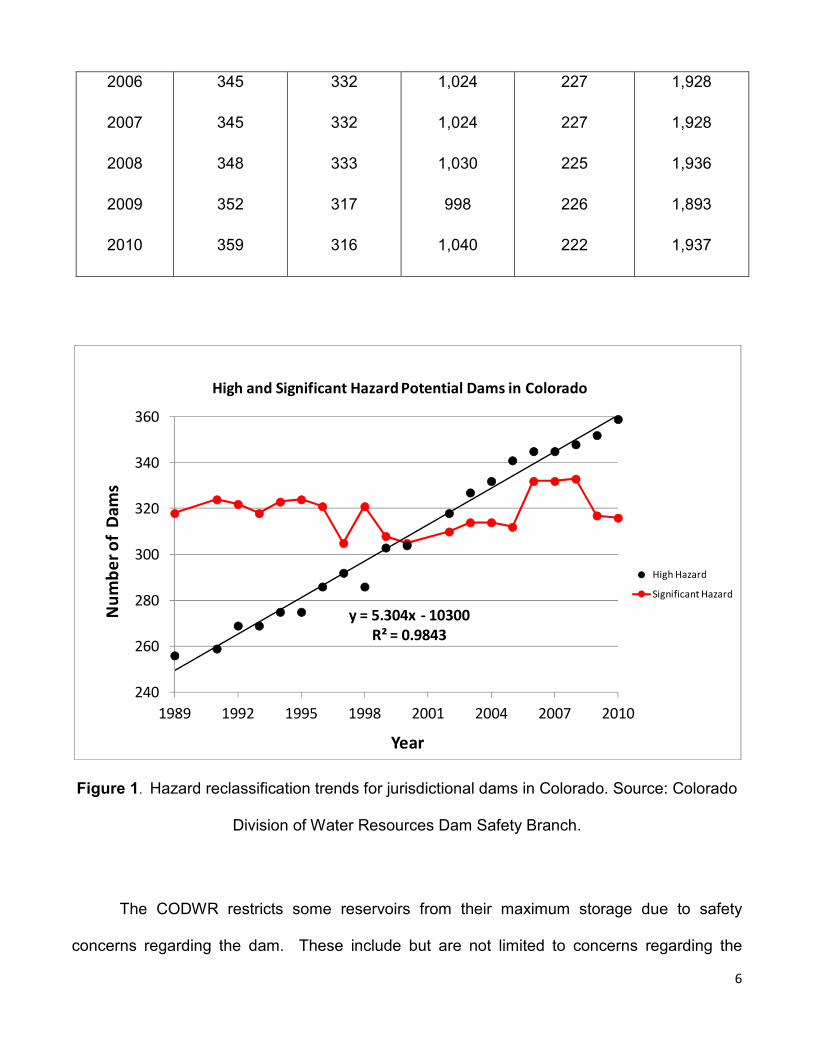
reflect reclassifications of low, significant and no-public hazard potential dams. Figure 1 shows
the annual numbers of high hazard and significant hazard potential dams in the state. The
total number of high hazard potential dams has increased by approximately 40% since 1989,
and this trend is likely to continue and perhaps accelerate as downstream development occurs
and the state’s population grows. The pronounced increase in high hazard potential dams
equates to an increased public and economic risk, especially if these dams become restricted.
A linear regression of the high hazard trend predicts that Colorado citizens may be surrounded
by 467 high hazard potential dams by 2030, and 573 high hazard potential dams by 2050.
These would account for approximately 24% and 30%, respectively, of the 1,937 jurisdictional
dams that the CODWR currently regulates. In contrast to high hazard potential dams, the total
number of significant hazard potential dams is shown to have remained relatively constant
since 1989, and on average there have been 318 significant hazard potential dams annually.
5
However, the number of significant hazard potential dams has also increased overall since the
minimum in 2001, albeit at a less pronounced rate than the high hazard trend.
Table 1. Summary of jurisdictional dams in Colorado by hazard potential rating. Source:
Colorado Division of Water Resources Dam Safety Branch.
Year High Hazard Significant
Hazard Low Hazard
No Public
Hazard Total Dams
1989
1991
1992
1993
1994
1995
1996
1997
1998
1999
2000
2002
2003
2004
2005
256
259
269
269
275
275
286
292
286
303
304
318.
327
332
341
318
324
322
318
323
324
321
305
321
308
305
310
314
314
312
1,164
1,190
1,096
1,074
1,037
1,025
1,021
1,022
1,022
1,020
1,024
1,021
1,024
1,019
1,014
12
76
137
152
181
185
189
189
189
204
200
212
214
214
219
1,750
1,849
1,824
1,813
1,816
1,809
1,817
1,808
1,818
1,835
1,833
1,861
1,879
1,879
1,886
6
2006
2007
2008
2009
2010
345
345
348
352
359
332
332
333
317
316
1,024
1,024
1,030
998
1,040
227
227
225
226
222
1,928
1,928
1,936
1,893
1,937
Figure 1. Hazard reclassification trends for jurisdictional dams in Colorado. Source: Colorado
Division of Water Resources Dam Safety Branch.
The CODWR restricts some reservoirs from their maximum storage due to safety
concerns regarding the dam. These include but are not limited to concerns regarding the
y = 5.304x - 10300
R² = 0.9843
240
260
280
300
320
340
360
1989 1992 1995 1998 2001 2004 2007 2010
Nu
mb
er
of
Da
ms
Year
High and Significant Hazard Potential Dams in Colorado
High Hazard
Significant Hazard
7
structural integrity of the dam, design methods for structural components such as spillways
and outlet works that may be inferior to current methods, concerns regarding slope stability or
internal instability problems that can arise from anomalous seepage and sinkholes, and in
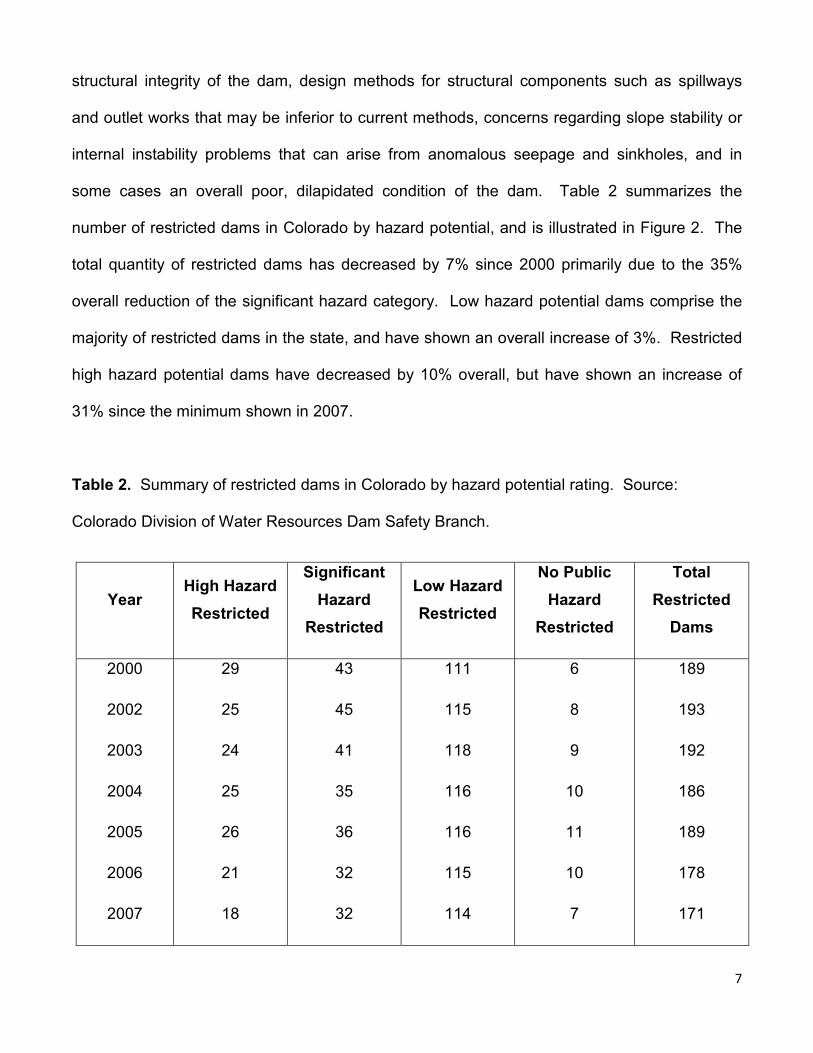
some cases an overall poor, dilapidated condition of the dam. Table 2 summarizes the
number of restricted dams in Colorado by hazard potential, and is illustrated in Figure 2. The
total quantity of restricted dams has decreased by 7% since 2000 primarily due to the 35%
overall reduction of the significant hazard category. Low hazard potential dams comprise the
majority of restricted dams in the state, and have shown an overall increase of 3%. Restricted
high hazard potential dams have decreased by 10% overall, but have shown an increase of
31% since the minimum shown in 2007.
Table 2. Summary of restricted dams in Colorado by hazard potential rating. Source:
Colorado Division of Water Resources Dam Safety Branch.
Year High Hazard
Restricted
Significant
Hazard
Restricted
Low Hazard
Restricted
No Public
Hazard
Restricted
Total
Restricted
Dams
2000
2002
2003
2004
2005
2006
2007
29
25
24
25
26
21
18
43
45
41
35
36
32
32
111
115
118
116
116
115
114
6
8
9
10
11
10
7
189
193
192
186
189
178
171
8
2008
2009
2010
21
20
26
34
33
28
107
110
114
6
17
8
168
180
176
Figure 2. Summary of dams restricted annually in Colorado by hazard potential rating.
Source: Colorado Division of Water Resources Dam Safety Branch.
Many of Colorado’s jurisdictional dams store large volumes of water in areas of high
population density along the Front Range. The Front Range is home to 80% of the state’s
0
25
50
75
100
125
150
175
200
1998 2002 2006 2010
Nu
mb
er
of
Da
ms
Year
Restricted Dams
High Hazard
Restricted
Significant Hazard
Restricted
Low Hazard
Restricted
No Public Hazard
Restricted
Total Restricted
9
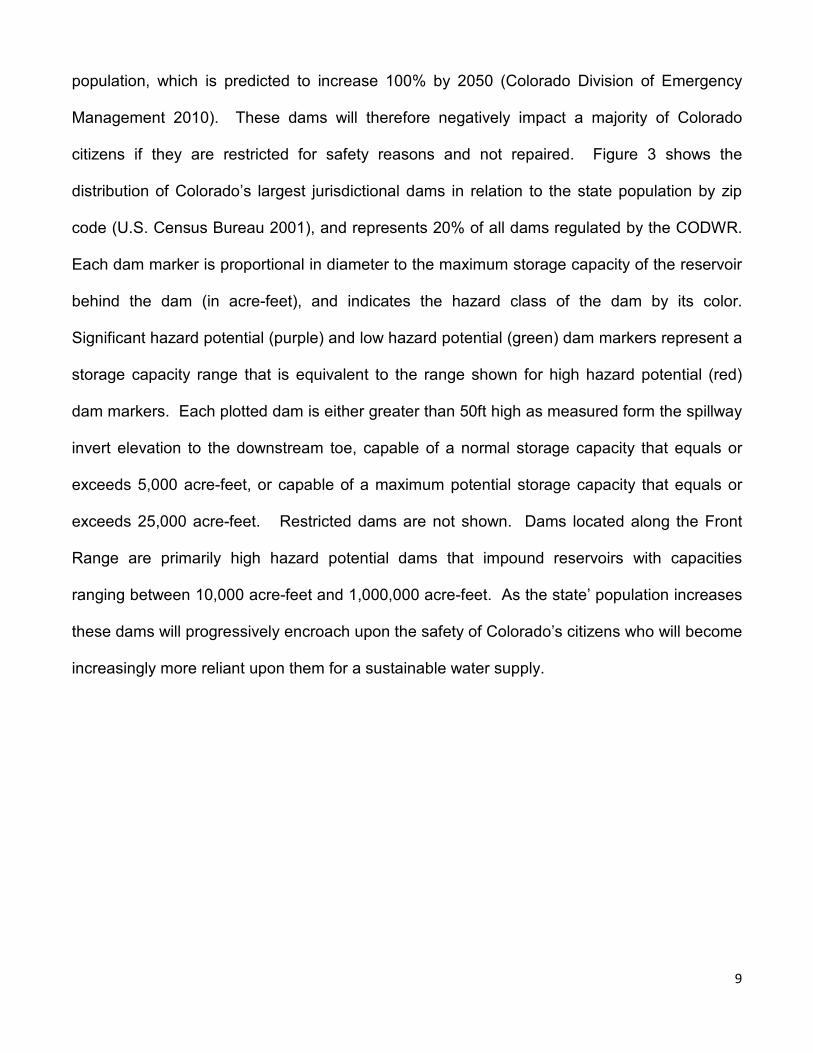
population, which is predicted to increase 100% by 2050 (Colorado Division of Emergency
Management 2010). These dams will therefore negatively impact a majority of Colorado
citizens if they are restricted for safety reasons and not repaired. Figure 3 shows the
distribution of Colorado’s largest jurisdictional dams in relation to the state population by zip
code (U.S. Census Bureau 2001), and represents 20% of all dams regulated by the CODWR.
Each dam marker is proportional in diameter to the maximum storage capacity of the reservoir
behind the dam (in acre-feet), and indicates the hazard class of the dam by its color.
Significant hazard potential (purple) and low hazard potential (green) dam markers represent a
storage capacity range that is equivalent to the range shown for high hazard potential (red)
dam markers. Each plotted dam is either greater than 50ft high as measured form the spillway
invert elevation to the downstream toe, capable of a normal storage capacity that equals or
exceeds 5,000 acre-feet, or capable of a maximum potential storage capacity that equals or
exceeds 25,000 acre-feet. Restricted dams are not shown. Dams located along the Front
Range are primarily high hazard potential dams that impound reservoirs with capacities
ranging between 10,000 acre-feet and 1,000,000 acre-feet. As the state’ population increases
these dams will progressively encroach upon the safety of Colorado’s citizens who will become
increasingly more reliant upon them for a sustainable water supply.
10
Figure 3. Distribution of high hazard potential (red), significant hazard potential (purple) and
low hazard potential (green) dams in Colorado relative to population. Geospatial data supplied
by the U.S. National Atlas were last published online 03/2006 and last accessed 04/2012.
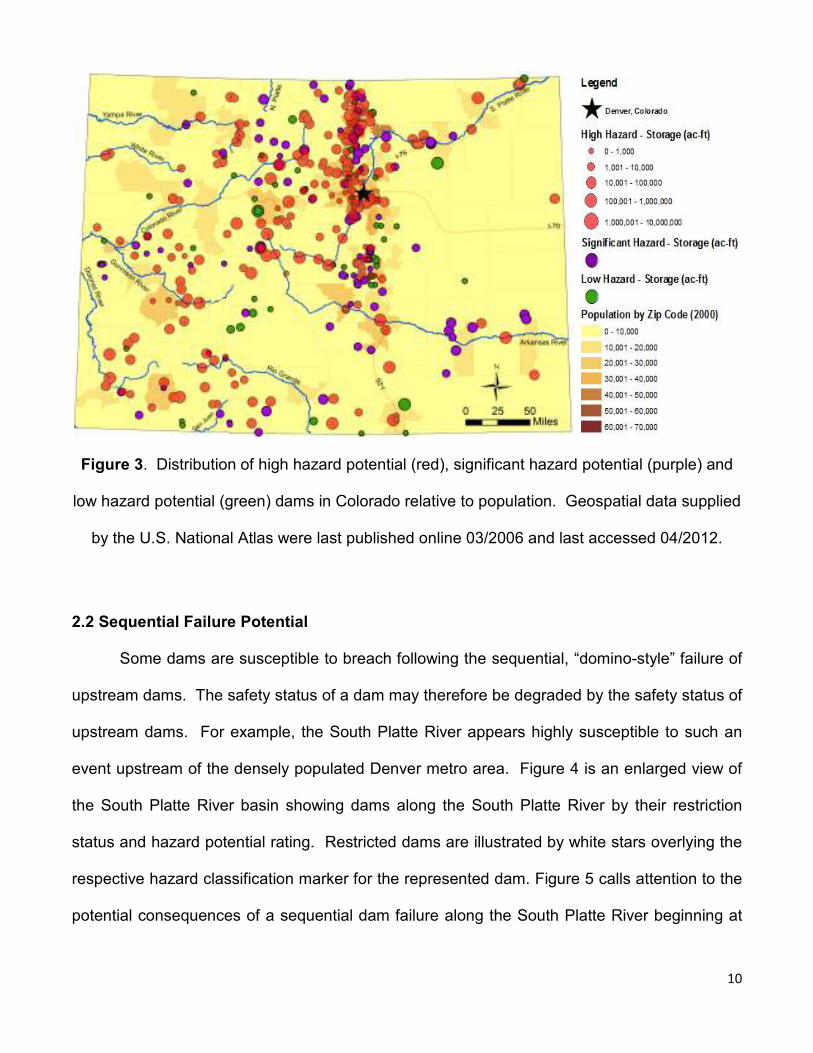
2.2 Sequential Failure Potential
Some dams are susceptible to breach following the sequential, “domino-style” failure of
upstream dams. The safety status of a dam may therefore be degraded by the safety status of
upstream dams. For example, the South Platte River appears highly susceptible to such an
event upstream of the densely populated Denver metro area. Figure 4 is an enlarged view of
the South Platte River basin showing dams along the South Platte River by their restriction
status and hazard potential rating. Restricted dams are illustrated by white stars overlying the
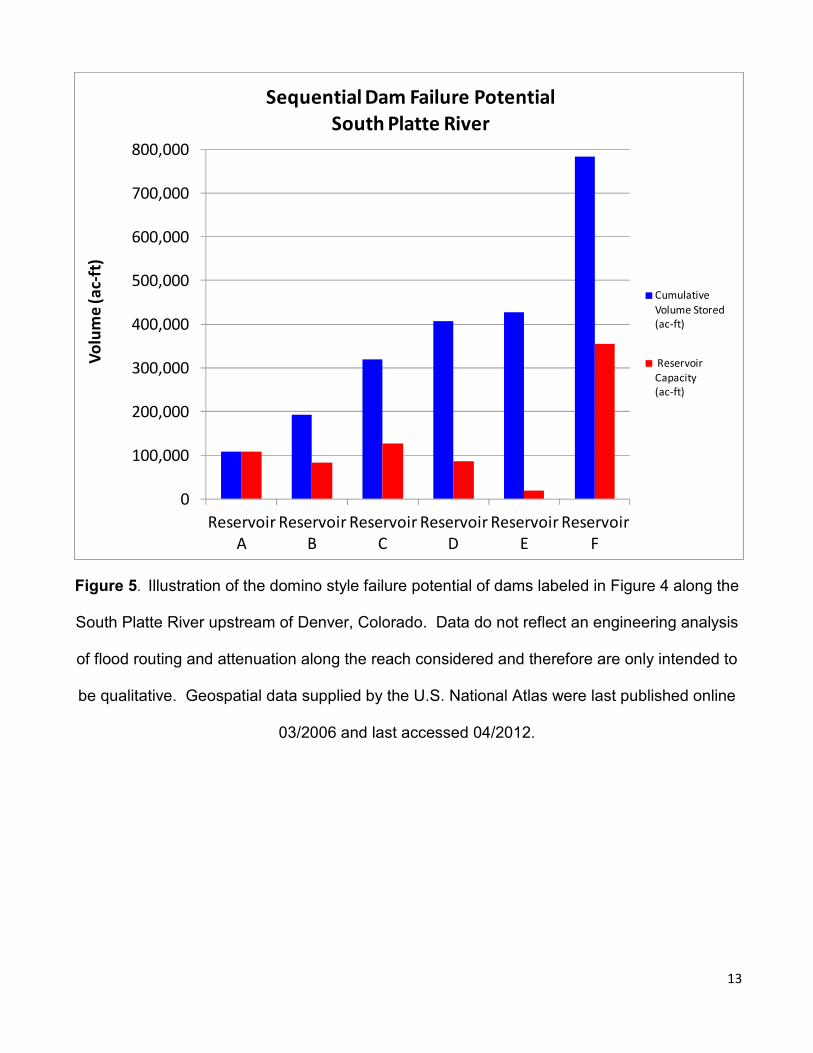
respective hazard classification marker for the represented dam. Figure 5 calls attention to the
potential consequences of a sequential dam failure along the South Platte River beginning at
11
Reservoir A, in Figure 4 (location A). Figure 5 shows the cumulative volume of water stored in
reservoirs A through F in comparison to the maximum storage capacities of the individual
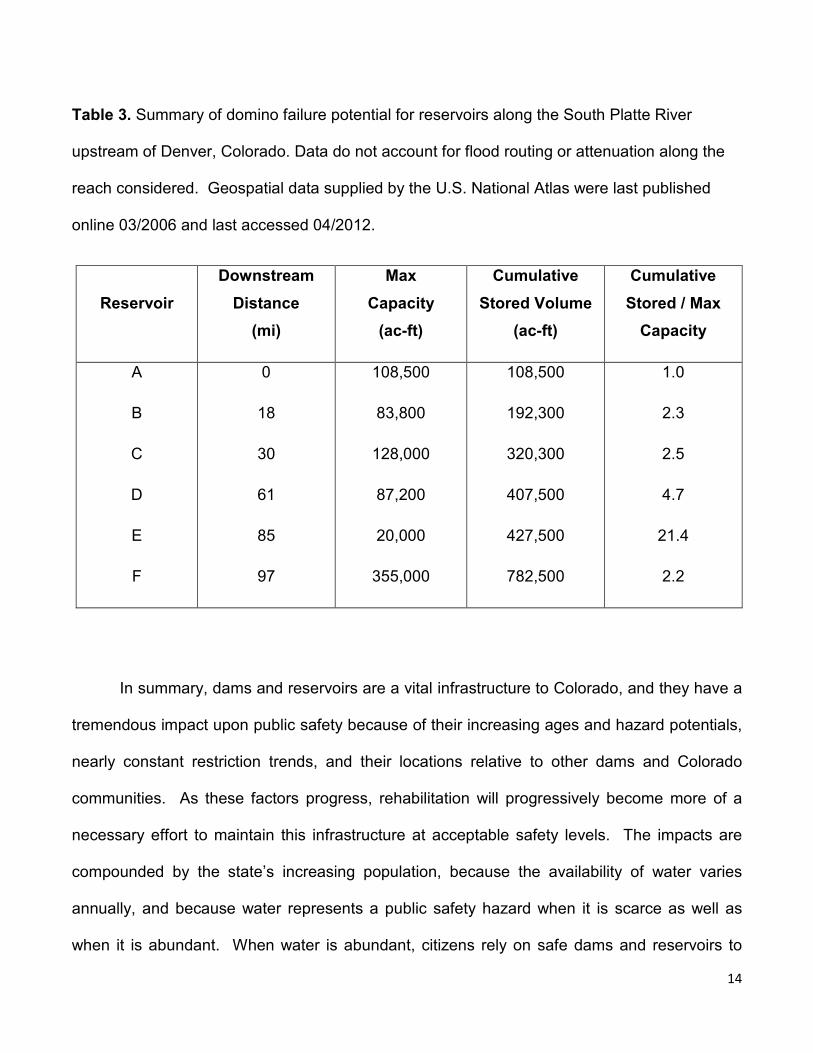
reservoirs. These data, summarized in Table 3, do not reflect an engineering analysis of
breach, flood routing, or attenuation for any dams or reaches of the channel considered. They
are intended to provide qualitative insights about the consequences of a sequential dam failure
along this reach of the South Platte River. A failure event beginning at Reservoir A can result
in the release of a large volume of water into the South Platte River channel over a reach
length of approximately 97 miles, if downstream dams also fail. The cumulative volume of
water that would travel through the channel during such an event may exceed the maximum
capacity of each illustrated reservoir by several multiples or more. The resulting flood wave
that would enter downtown Denver would undoubtedly be notable, and would likely inundate
many acres of valuable farmlands on the eastern Colorado plains as well. The Colorado
Division of Emergency Management (2010) currently predicts that a 100 year flood event
released along the South Platte River into downtown Denver would impact an estimated
250,000 people living in the low-lying floodplains, as well as 65,000 homes and 15,000
commercial and industrial businesses. The scale of potential public impact of a sequential
dam failure event on the South Platte River may exceed those described in historical accounts
of the Castlewood Canyon Dam failure that occurred in Colorado in 1933 (Randall et al 1997).
The Castlewood Canyon Dam breach released a 5,300 ac-ft reservoir and caused one of the
“worst floods in history” forty-five miles downstream in Denver (Randall et al 1997). Although
the flood wave traveled less than half of the distance than the reach considered in Figure 4,
the total volume that was released was a fraction of the cumulative volume that is currently
stored in reservoirs A through F.
12
Figure 4. Illustration of the domino failure potential along the South Platte River upstream of
Denver, Colorado, beginning at Reservoir A. Geospatial data supplied by the U.S. National
Atlas were last published online 03/2006 and last accessed 04/2012.
13
Figure 5. Illustration of the domino style failure potential of dams labeled in Figure 4 along the
South Platte River upstream of Denver, Colorado. Data do not reflect an engineering analysis
of flood routing and attenuation along the reach considered and therefore are only intended to
be qualitative. Geospatial data supplied by the U.S. National Atlas were last published online
03/2006 and last accessed 04/2012.
0
100,000
200,000
300,000
400,000
500,000
600,000
700,000
800,000
Reservoir
A
Reservoir
B
Reservoir
C
Reservoir
D
Reservoir
E
Reservoir
F
Vo
lum
e (
ac-
ft)
Sequential Dam Failure Potential
South Platte River
Cumulative
Volume Stored
(ac-ft)
Reservoir
Capacity
(ac-ft)
14
Table 3. Summary of domino failure potential for reservoirs along the South Platte River
upstream of Denver, Colorado. Data do not account for flood routing or attenuation along the
reach considered. Geospatial data supplied by the U.S. National Atlas were last published
online 03/2006 and last accessed 04/2012.
Reservoir
Downstream
Distance
(mi)
Max
Capacity
(ac-ft)
Cumulative
Stored Volume
(ac-ft)
Cumulative
Stored / Max
Capacity
A
B
C
D
E
F
0
18
30
61
85
97
108,500
83,800
128,000
87,200
20,000
355,000
108,500
192,300
320,300
407,500
427,500
782,500
1.0
2.3
2.5
4.7
21.4
2.2
In summary, dams and reservoirs are a vital infrastructure to Colorado, and they have a
tremendous impact upon public safety because of their increasing ages and hazard potentials,
nearly constant restriction trends, and their locations relative to other dams and Colorado
communities. As these factors progress, rehabilitation will progressively become more of a
necessary effort to maintain this infrastructure at acceptable safety levels. The impacts are
compounded by the state’s increasing population, because the availability of water varies
annually, and because water represents a public safety hazard when it is scarce as well as
when it is abundant. When water is abundant, citizens rely on safe dams and reservoirs to
15
capture, store, and control it, in order to prevent flooding. When water is scarce, droughts are
augmented by increasing storage in reservoirs to make water more abundant. Storage
capacity is necessary in either scenario, and therefore the state’s restriction trends incite doubt
regarding the long term effectiveness of a method aimed at restricting storage to enhance
public safety.
3.0 Colorado’s Dam Safety - Water Supply Paradox
3.1 Tensions between dam safety policies and water supply goals
The dam safety policies promulgated in the revised statutes of the Colorado
Constitution reduce the state’s total available storage capacity and limit the available water
supply2. The Dam Safety Branch of the CODWR ensures public safety from dam failures by
restricting the storage capacity of unsafe reservoirs. However, policies that incentivize dam
owners to repair their restricted dams do not exist, nor are there any that authorize the
Colorado State Engineers Office to enforce repair. The CODWR confirmed in February, 2011
that "out of 176 storage-restricted jurisdictional dams in the state, only three or four had
2 Sections 37-87-107, 37-87-108, 37-87-110 and 37-87-114 C.R.S authorize the State and Division Engineers to
discharge the dam safety duties of their office (Colorado Office of Legislative Legal Services 2012). 37-87-107
C.R.S. authorizes the State Engineer to perform dam safety inspections to determine the safe storage capacity of
reservoirs. 37-87-108 C.R.S. authorizes the Division Engineers to withdraw water from reservoirs that are not in
compliance with their determined safe storage capacities. 37-87-110 C.R.S authorizes the State Engineer to use
necessary force to adhere to duties outlined in 37-87-108 C.R.S. 37-87-114 C.R.S. provides incentive for dam
owners to comply with the State Engineer's determination of the safe storage capacity in the form of a $500
minimum per day fine if the safe storage levels are surpassed.
16
owners that were attempting to increase their reservoir storage capacity by performing the
needed repairs. The owners are not required to make repairs after their dam is restricted, and
may choose to continue to operate their dams while adhering to the reservoir restrictions
(CODWR, personal communication 02/16/2011).” Restricted reservoirs may also be
abandoned by the owners. The CODWR restriction records list several reservoirs that are
restricted due to abandonment (Haynes 2010). Restrictions due to abandonment limit
Colorado’s total water supply by greater than 3,000 acre-feet per year, and account for
approximately 18% to 25% of the annual restricted volume of water from low hazard potential
dams in the state.
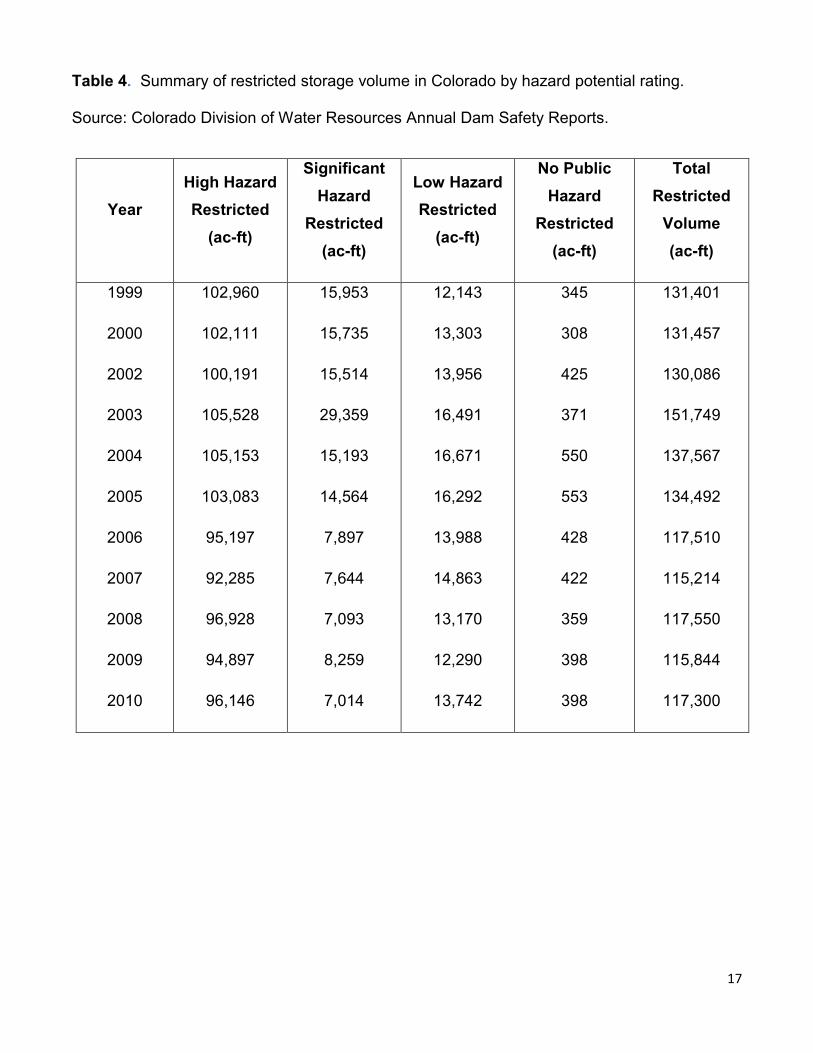
A large volume of water is lost annually to the state when all restricted dams are
considered. Ironically, this is occurring at the same time state officials are forecasting sizeable
water shortages. Table 4 summarizes the restricted volume lost in Colorado annually by the
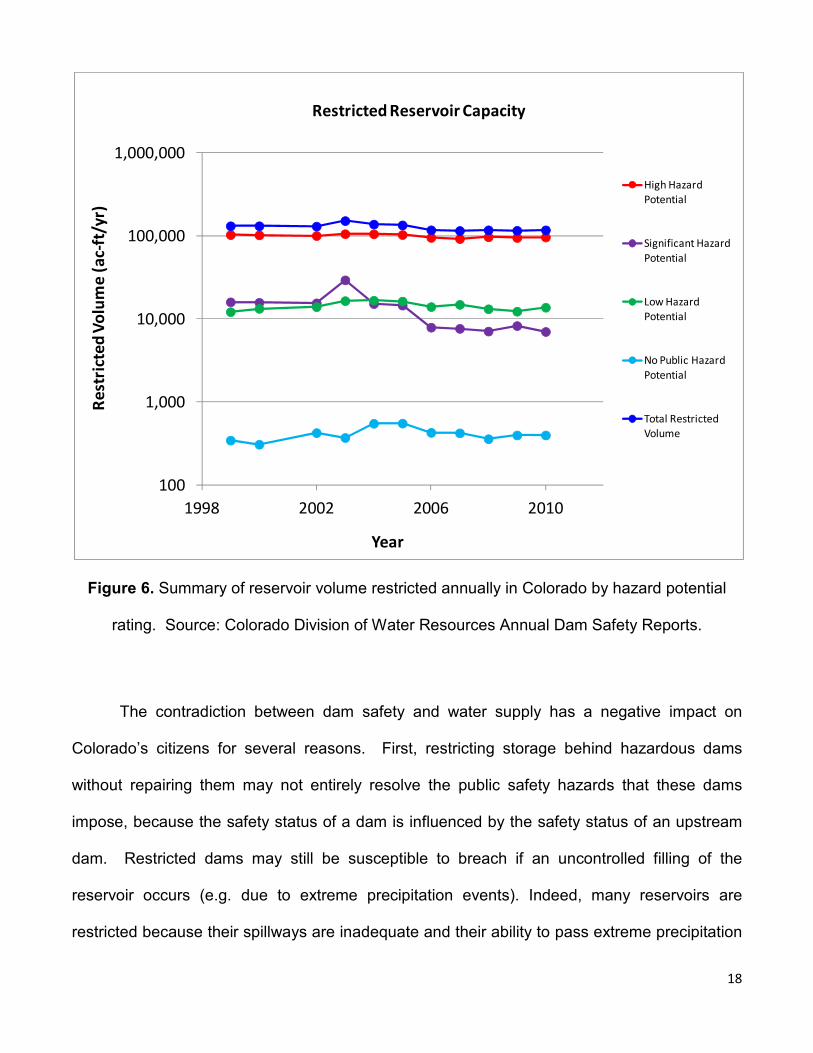
hazard potential rating of restricted dams, and is shown in Figure 6. Low hazard potential
dams comprise the majority of restricted dams in the state but account for only 11% of the
mean annual restriction. The majority of restricted storage is lost from the high hazard potential
constituent that comprises fewer dams but on average accounts for greater than 100,000 acre-
feet per year (78%) of the total restricted storage volume. Although restricted dams in general
have shown some reduction in quantity, the total restricted storage volume has remained
relatively constant, and on average has exceeded 127,000 acre-feet annually. This constant
trend is an indication that reservoirs dams with significant restricted storage capacity are not
being repaired.
17
Table 4. Summary of restricted storage volume in Colorado by hazard potential rating.
Source: Colorado Division of Water Resources Annual Dam Safety Reports.
Year
High Hazard
Restricted
(ac-ft)
Significant
Hazard
Restricted
(ac-ft)
Low Hazard
Restricted
(ac-ft)
No Public
Hazard
Restricted
(ac-ft)
Total
Restricted
Volume
(ac-ft)
1999
2000
2002
2003
2004
2005
2006
2007
2008
2009
2010
102,960
102,111
100,191
105,528
105,153
103,083
95,197
92,285
96,928
94,897
96,146
15,953
15,735
15,514
29,359
15,193
14,564
7,897
7,644
7,093
8,259
7,014
12,143
13,303
13,956
16,491
16,671
16,292
13,988
14,863
13,170
12,290
13,742
345
308
425
371
550
553
428
422
359
398
398
131,401
131,457
130,086
151,749
137,567
134,492
117,510
115,214
117,550
115,844
117,300
18
Figure 6. Summary of reservoir volume restricted annually in Colorado by hazard potential
rating. Source: Colorado Division of Water Resources Annual Dam Safety Reports.
The contradiction between dam safety and water supply has a negative impact on
Colorado’s citizens for several reasons. First, restricting storage behind hazardous dams
without repairing them may not entirely resolve the public safety hazards that these dams
impose, because the safety status of a dam is influenced by the safety status of an upstream
dam. Restricted dams may still be susceptible to breach if an uncontrolled filling of the
reservoir occurs (e.g. due to extreme precipitation events). Indeed, many reservoirs are
restricted because their spillways are inadequate and their ability to pass extreme precipitation
100
1,000
10,000
100,000
1,000,000
1998 2002 2006 2010
Re
stri
cte
d V
olu
me
(a
c-ft
/yr)
Year
Restricted Reservoir Capacity
High Hazard
Potential
Significant Hazard
Potential
Low Hazard
Potential
No Public Hazard
Potential
Total Restricted
Volume
19
events is questionable. Second, if the needed storage capacity is available but ineffectual, and
the water supply is adequate to fill the storage space, the volume that is restricted is then
entirely lost to Colorado to the benefit of downstream water users. If the mean annual
restricted volume of 127,000 acre-feet persists, Colorado will lose approximately 2.41 million
acre-feet of water by 2030 and 4.95 million acre-feet by 2050, assuming an adequate annual
supply. Third, the storage capacity that is restricted is valuable to Colorado water suppliers
and water users alike, and the value will inevitably rise. If the state’s water supply is overly
abundant (e.g. Finley (2012) reports that Colorado may be entitled to an additional 900,000
acre-feet of Colorado River water that is unappropriated by the 1922 Interstate Compact)
additional storage capacity will be needed to retain the water to avoid losing water to
downstream users. If the water supply is scarce the value of the restricted storage capacity
will rise with the value of water as it becomes increasingly more necessary to store water. For
either scenario, Colorado’s restricted storage capacity is a valuable asset that is available for
use.
3.2 Predicted Water Shortages
The availability of water in Colorado is anticipated to decrease. In 2004 the Statewide
Water Supply Initiative study conducted by the Colorado Water Conservation Board predicted
the state water needs to 2030 and concluded that "non-renewable ground water may not be
reliable for meeting competing public, agricultural and environmental water demands,
particularly along the Front Range (CODWR 2004)." This conclusion implies that Colorado
has a need for additional storage capacity in surface water reservoirs. Rowan et al (2010)
extended the CODWR (2004) projected needs to the year 2050 and accounted for the
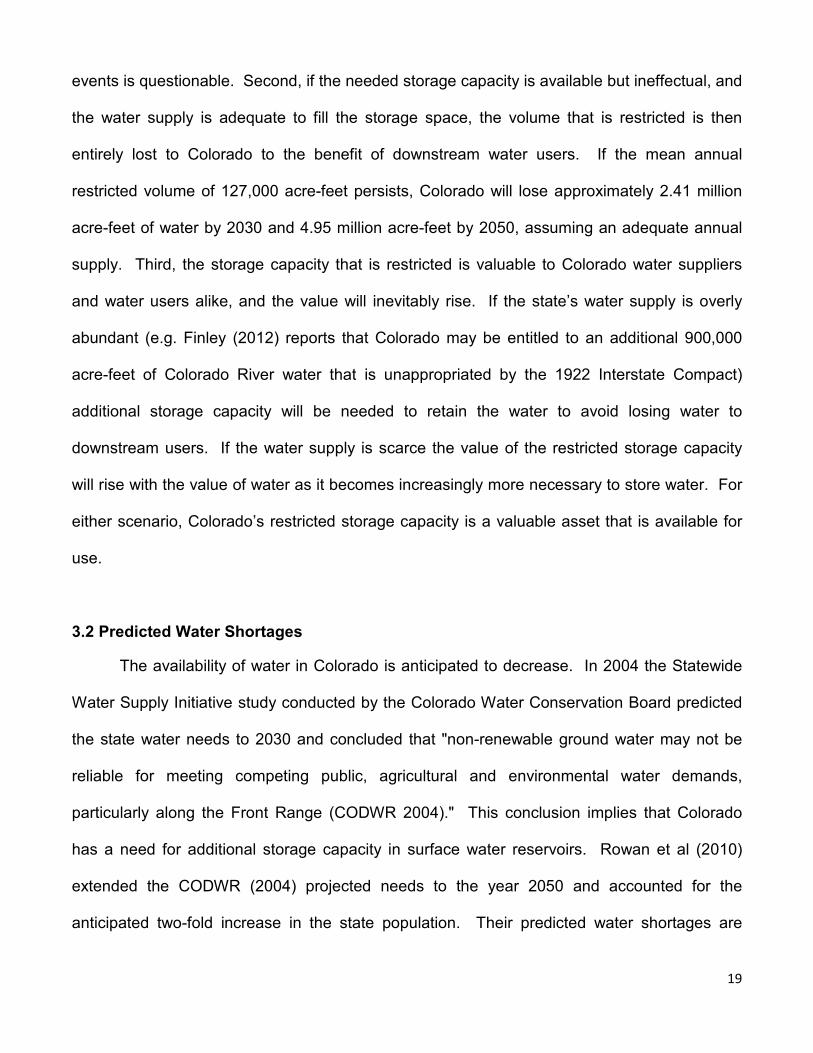
anticipated two-fold increase in the state population. Their predicted water shortages are
20
shown in Figure 7. They predicted water shortages by liberally assuming 100% of all identified
water development projects and planning processes (IPP’s) in the state (shown by the green
region) would be successful, despite the uncertain outcomes of many of these projects due to
permitting difficulties and stakeholder opposition. Rowan et al (2010) predicted a water deficit
by 2050 ranging between a minimum of -320,000 acre-feet for “low” water demands, and a
maximum of -1,100,000 acre-feet for “high” water demands, depending on the states
cumulative municipal and industrial water needs. Their predicted shortage represents
approximately the equivalent of one to four annual water supply volumes consumed by the City
of Denver, which requires approximately 245,000 acre-feet per year to meet municipal and
industrial needs (Rowan et al 2010). The magnitude of the anticipated water shortage is
shown by the purple region in Figure 7 and is dependent upon the success of IPP’s and
conservation plans that are represented by the green region. The deficit will be larger and will
occur more rapidly if less than 100% of all IPP’s are successful. Rowan et al (2010) conclude
that “the status quo approach to water supply will not lead to a desirable future for Colorado.”
This grim water supply forecast for the state points to the need for policy alternatives that
maximize the available water supply without constructing unnecessary reservoirs.
21
Figure 7. Summary of Colorado's predicted water shortages based on low, medium and high
municipal and industrial water needs. Source: Rowan et al., 2010.
4.0 Discussion
4.1 A Policy Alternative to Maximize Water Supply and Dam Safety
The contradiction between dam safety and water supply can be targeted to maximize
Colorado’s water supply, and a strategy of rehabilitating restricted reservoirs can be adopted to
quickly gain the additional storage capacity that is needed to meet the state’s future water
needs. This strategy may be advanced as a market-driven mechanism that incentivizes water
22
suppliers to lease the restricted storage in reservoirs in exchange for water storage capacity at
a significantly reduced cost.
This approach is advantageous compared to ground water development projects and
constructing new reservoirs. Developing ground water supplies at rates that are sufficient to
reduce the anticipated deficit is an unlikely solution because many of Colorado’s major rivers,
tributaries and aquifers are already over-appropriated. Constructing new reservoirs is not the
most desirable solution for expanding storage capacity because new construction projects
typically entail a lengthy and costly endeavor. Permitting procedures for new reservoir
construction projects typically require at least a decade (Finley 2011) and stakeholders’
oppositions will need to be negotiated. Money is scarce for new reservoir construction, and
many of the best sites for dams and reservoirs are already occupied. New dams will require
maintenance and repairs like any other, lest they be restricted and left to contribute to future
decay statistics, public hazards and water shortages throughout the state. These factors will
undeniably contribute to immense litigation and engineering costs as well as extend the
durations of new reservoir development projects.
4.2 Economic Considerations
Rehabilitating existing reservoirs is indeed more economical with respect to new
reservoir construction projects. For example, Glade and Galeton Reservoirs, proposed as a
component of Denver Water's Northern Integrated Supply Project (NISP), are projected to cost
$490 million and will expand the state’s surface storage capacity by 200,000 acre-feet (Whaley
2011). Extrapolation of the red and green curves in Figure 8 suggests that a single reservoir
with a comparable capacity can be rehabilitated for less than half of the projected cost of the
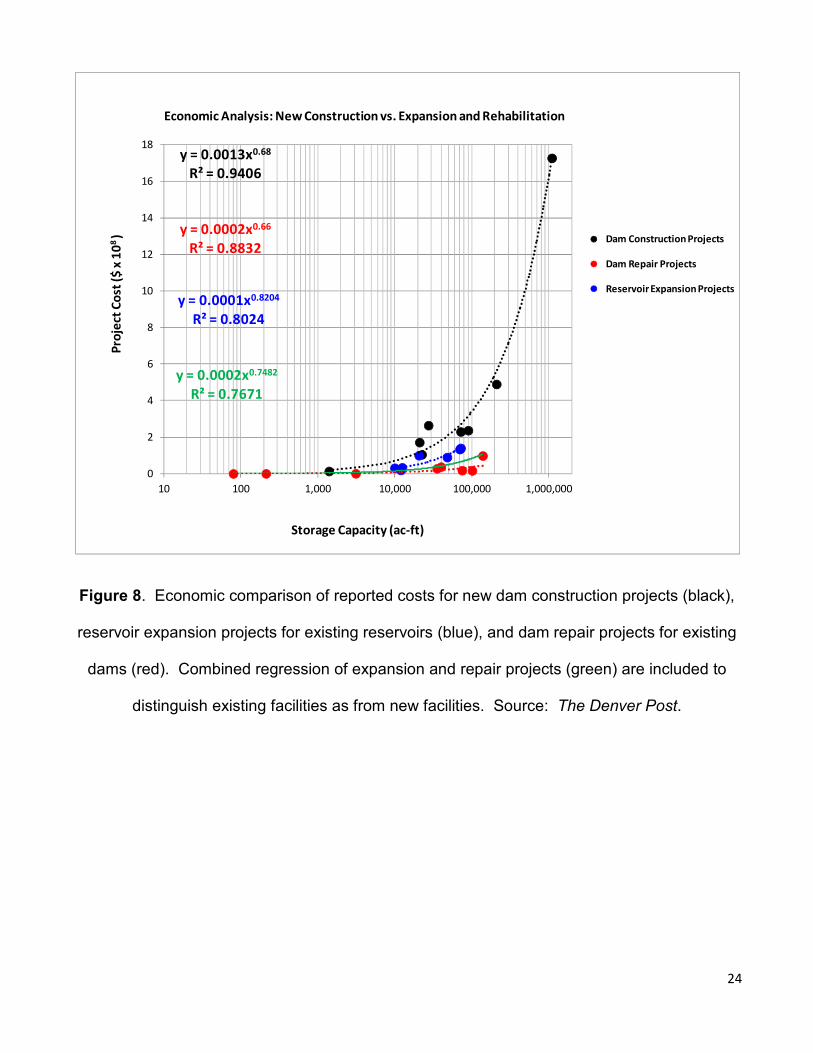
Glade and Galeton Reservoirs. Figure 8 compares project costs (in hundreds of millions of
23
2012 dollars) to the project size (represented by the total storage capacity of the reservoir, in
acre-feet), for new reservoir construction projects (black curve), repair projects for dams and
reservoirs (red curve), and reservoir expansion projects (blue curve) in Colorado. The
combined regression of dam repair and reservoir expansion data (green curve) is included to
compare costs for new construction projects with costs for existing facilities. The data are
summarized in Table 5 and include reported costs for completed projects as well as projects
that were attempted without success. They were compiled through a review of articles in The
Denver Post archives and other local newspaper archives reporting on current and historical
water development projects in Colorado. There are discernible differences in project costs
between each of the categories, and these differences suggest that reservoir expansion
projects and dam rehabilitation projects are significantly less expensive undertakings than new
reservoir construction projects. The costs associated with expansion projects are greater than
those for rehabilitation projects, which is the least costly category illustrated. This may even
be true when costs are cumulated over time for multiple rehabilitations that may be required to
maintain a dam for many decades. Overall, Figure 8 implies that rehabilitating restricted
reservoirs is a more economically desirable method of expanding the water storage capacity in
Colorado.
24
Figure 8. Economic comparison of reported costs for new dam construction projects (black),
reservoir expansion projects for existing reservoirs (blue), and dam repair projects for existing
dams (red). Combined regression of expansion and repair projects (green) are included to
distinguish existing facilities as from new facilities. Source: The Denver Post.
y = 0.0013x0.68
R² = 0.9406
y = 0.0001x0.8204
R² = 0.8024
y = 0.0002x0.66
R² = 0.8832
y = 0.0002x0.7482
R² = 0.7671
0
2
4
6
8
10
12
14
16
18
10 100 1,000 10,000 100,000 1,000,000
Pro
ject
Co
st (
$ x
10
8 )
Storage Capacity (ac-ft)
Economic Analysis: New Construction vs. Expansion and Rehabilitation
Dam Construction Projects
Dam Repair Projects
Reservoir Expansion Projects
25
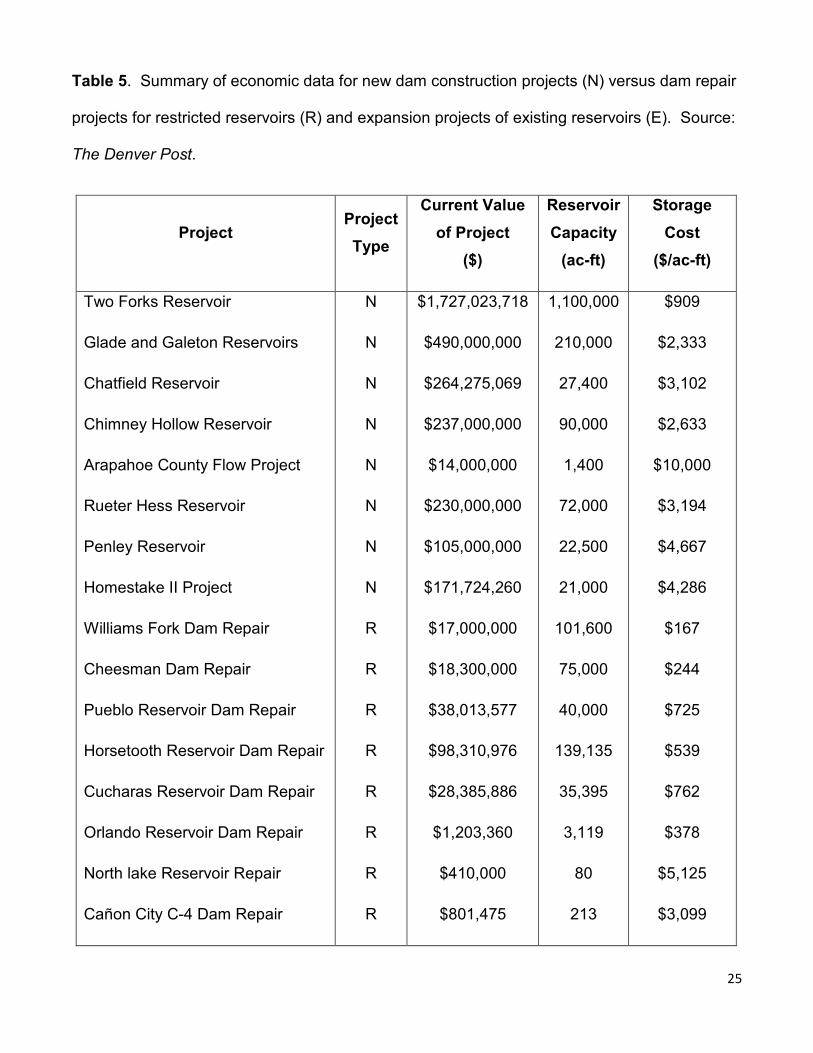
Table 5. Summary of economic data for new dam construction projects (N) versus dam repair
projects for restricted reservoirs (R) and expansion projects of existing reservoirs (E). Source:
The Denver Post.
Project Project
Type
Current Value
of Project
($)
Reservoir
Capacity
(ac-ft)
Storage
Cost
($/ac-ft)
Two Forks Reservoir
Glade and Galeton Reservoirs
Chatfield Reservoir
Chimney Hollow Reservoir
Arapahoe County Flow Project
Rueter Hess Reservoir
Penley Reservoir
Homestake II Project
Williams Fork Dam Repair
Cheesman Dam Repair
Pueblo Reservoir Dam Repair
Horsetooth Reservoir Dam Repair
Cucharas Reservoir Dam Repair
Orlando Reservoir Dam Repair
North lake Reservoir Repair
Cañon City C-4 Dam Repair
N
N
N
N
N
N
N
N
R
R
R
R
R
R
R
R
$1,727,023,718
$490,000,000
$264,275,069
$237,000,000
$14,000,000
$230,000,000
$105,000,000
$171,724,260
$17,000,000
$18,300,000
$38,013,577
$98,310,976
$28,385,886
$1,203,360
$410,000
$801,475
1,100,000
210,000
27,400
90,000
1,400
72,000
22,500
21,000
101,600
75,000
40,000
139,135
35,395
3,119
80
213
$909
$2,333
$3,102
$2,633
$10,000
$3,194
$4,667
$4,286
$167
$244
$725
$539
$762
$378
$5,125
$3,099
26
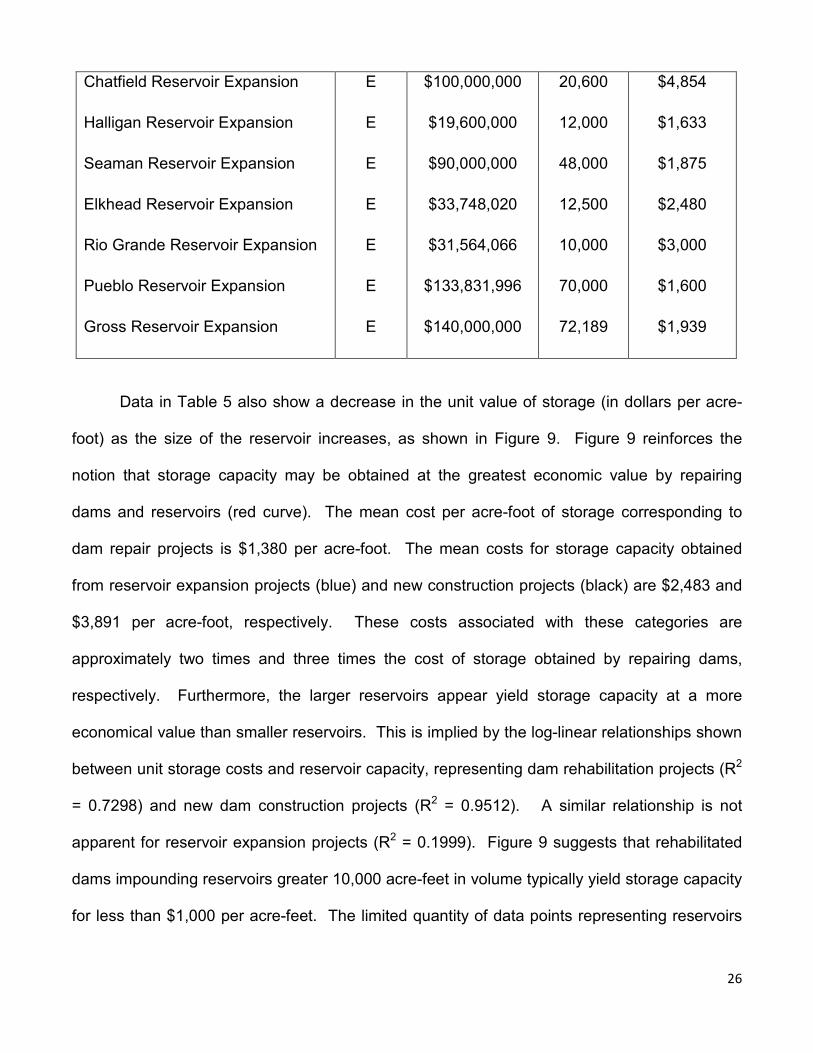
Chatfield Reservoir Expansion
Halligan Reservoir Expansion
Seaman Reservoir Expansion
Elkhead Reservoir Expansion
Rio Grande Reservoir Expansion
Pueblo Reservoir Expansion
Gross Reservoir Expansion
E
E
E
E
E
E
E
$100,000,000
$19,600,000
$90,000,000
$33,748,020
$31,564,066
$133,831,996
$140,000,000
20,600
12,000
48,000
12,500
10,000
70,000
72,189
$4,854
$1,633
$1,875
$2,480
$3,000
$1,600
$1,939
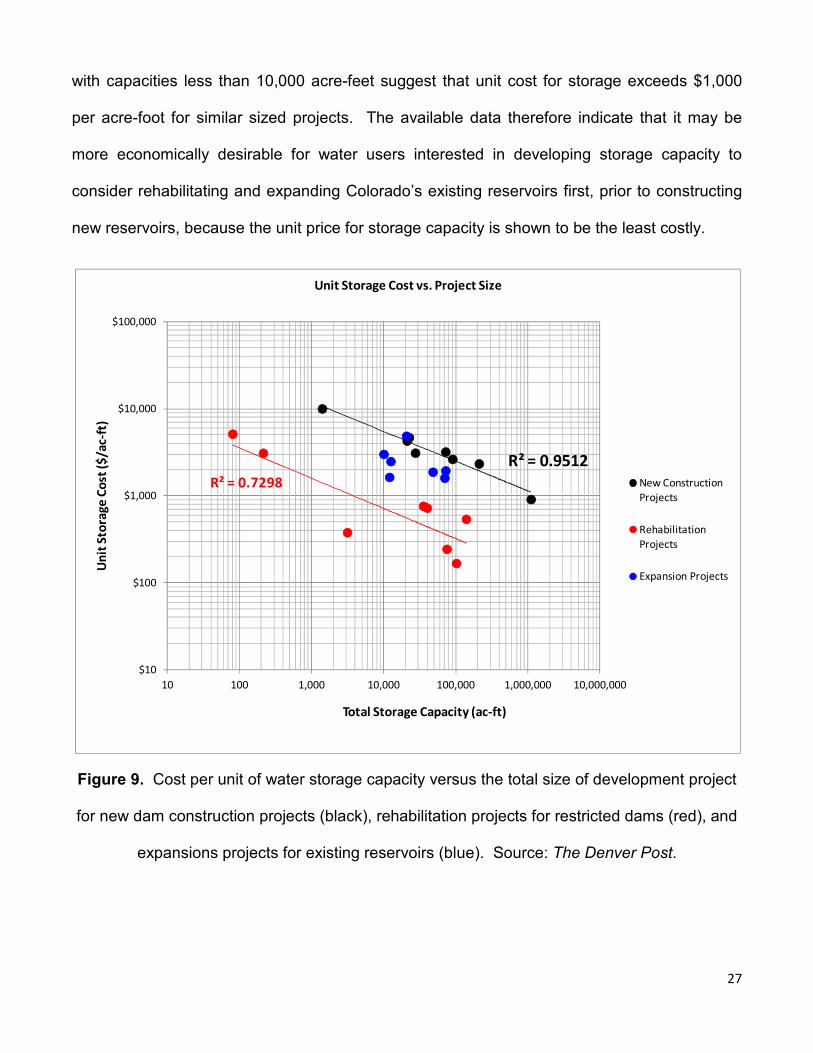
Data in Table 5 also show a decrease in the unit value of storage (in dollars per acre-
foot) as the size of the reservoir increases, as shown in Figure 9. Figure 9 reinforces the
notion that storage capacity may be obtained at the greatest economic value by repairing
dams and reservoirs (red curve). The mean cost per acre-foot of storage corresponding to
dam repair projects is $1,380 per acre-foot. The mean costs for storage capacity obtained
from reservoir expansion projects (blue) and new construction projects (black) are $2,483 and
$3,891 per acre-foot, respectively. These costs associated with these categories are
approximately two times and three times the cost of storage obtained by repairing dams,
respectively. Furthermore, the larger reservoirs appear yield storage capacity at a more
economical value than smaller reservoirs. This is implied by the log-linear relationships shown
between unit storage costs and reservoir capacity, representing dam rehabilitation projects (R2
= 0.7298) and new dam construction projects (R2 = 0.9512). A similar relationship is not
apparent for reservoir expansion projects (R2 = 0.1999). Figure 9 suggests that rehabilitated
dams impounding reservoirs greater 10,000 acre-feet in volume typically yield storage capacity
for less than $1,000 per acre-feet. The limited quantity of data points representing reservoirs
27
with capacities less than 10,000 acre-feet suggest that unit cost for storage exceeds $1,000
per acre-foot for similar sized projects. The available data therefore indicate that it may be
more economically desirable for water users interested in developing storage capacity to
consider rehabilitating and expanding Colorado’s existing reservoirs first, prior to constructing
new reservoirs, because the unit price for storage capacity is shown to be the least costly.
Figure 9. Cost per unit of water storage capacity versus the total size of development project
for new dam construction projects (black), rehabilitation projects for restricted dams (red), and
expansions projects for existing reservoirs (blue). Source: The Denver Post.
R² = 0.9512
R² = 0.7298
$10
$100
$1,000
$10,000
$100,000
10 100 1,000 10,000 100,000 1,000,000 10,000,000
Un
it S
tora
ge
Co
st (
$/a
c-ft
)
Total Storage Capacity (ac-ft)
Unit Storage Cost vs. Project Size
New Construction
Projects
Rehabilitation
Projects
Expansion Projects
28
4.3 Stakeholder Opposition
In contrast to policies in favor of new reservoir development, we anticipate dramatically
reduced stakeholder opposition to those that increase water supply by rehabilitating restricted
reservoirs. Fundamentally, stakeholder oppositions regarding existing reservoirs have already
been negotiated, and this will minimize any further efforts that are necessary to align
stakeholder interests.
We consider three broad categories of potential stakeholders that include water
suppliers; including water authorities and cooperatives that are likely to be investors in storage-
restricted facilities, facilities owners; including private reservoir owners that may share similar
interests with water users, and water users; including public citizens who have public safety as
well as environmental interests at heart. Water suppliers may support this approach if they
can obtain storage for their water rights in less time at a reduced cost. Facilities owners may
be in favor if they are able to profitably lease their restricted storage space to water suppliers in
exchange for the necessary upgrades to their dams and reservoirs. Water suppliers and
facilities owners alike are more likely to be in favor of this approach if they can maintain
ownership of their water rights while carrying out their water leasing transactions. The majority
of Colorado’s citizens will support this solution for three primary reasons. First, it will reduce
their costs for water usage. If water suppliers can inexpensively acquire storage capacity for
their water rights the savings can be passed to the water users through reduced service fees
for infrastructure development and water delivery. Second, an overall improvement in public
welfare can be attained by rehabilitating restricted dams and providing economic incentives for
capable parties to improve their dam maintenance regimes. Third, we predict a positive
environmental impact for the entire state of Colorado if new development is postponed in favor
of rehabilitating restricted reservoirs. Positive environmental impacts will equate to a better
29
quality of life for Colorado’s citizens. Pristine canyons and wilderness will be preserved if the
demand for new dams and reservoirs is satisfied by rehabilitating existing reservoirs. Denver
metro communities will be less dependent upon ground water, trans-basin diversions, and
dewatering of valuable farmlands on the eastern plains if the surface storage capacity is
expanded along the Front Range. This will alleviate the demand for the non-renewable ground
water in the Denver Basin aquifers, environmental stress on the Colorado River and its
tributaries, and valuable farmland on the eastern plains can be conserved rather than
dewatered.
Despite foreseeable advantages, questions regarding stakeholder cooperation will
inevitably arise prior to successfully implementing a storage-leasing solution to expand water
supply. Are multiple leases for multiple parties compatible? Are leases for summer water
users compatible with leases for winter water users? What are the liability concerns
associated with lessees? Whose water gets spilled first and whose water gets carried over
from one water year to the next? Whose water evapotranspires and whose returns to ground
water? Are multiple entities or co-operatives the ideal executors of leases due to increased
government immunities from damages? These and likely other questions will need to be
considered; however, the prospect of having more inexpensive water available to meet
municipal, industrial and agricultural demands overall will promote better cooperation between
vested stakeholders (Rowan et al 2010).
5.0 Conclusions
We present the political and technical underpinnings of an elegant, market-driven
solution that would apply the private resource of willing customers to help solve both a public
30
safety concern and a growing water supply crisis in the state of Colorado. A regulatory
paradox currently exists in Colorado, and requires regulators to assure public safety from dam
failures by restricting the storage capacity in the reservoir. This practice diminishes the states
long-term water supply at a time when experts are forecasting significant future water
shortages throughout the state. The current means of dam safety assurance is therefore
contradictory to Colorado’s long-term goals of water supply expansion. Without political
mechanisms to incentivize or enforce owner rehabilitation, state leaders will be faced with a
growing public safety hazard imposed by aged, high and significant hazard potential dams, in
addition to a burgeoning volume of unusable, restricted water storage space.
The contradiction between dam safety and water supply lends itself to a convenient
policy alternative to increase the available water supply. By incentivizing the rehabilitation of
restricted dams through a market-driven storage leasing approach, state leaders can increase
Colorado’s total storage capacity by more than 100,000 acre-feet per year, within a matter of a
few years and at a significantly reduced cost. This would enhance public safety from dam
failures, reduce the need for new reservoirs, reduce environmental stress on Colorado’s rivers
and aquifers, and resolve approximately 33% of the projected supply shortage for low water
needs. Our research has shown this solution to be more economical than constructing new
storage facilities and expanding existing storage facilities within the state.
Successfully implementing this solution may require increased legal and regulatory
flexibility to facilitate market-driven storage leases and water exchanges, and connect needy
and willing customers to the rehabilitated water supplies they have invested in. The package
of legal and regulatory adjustments needed to implement this solution is the subject of in-
progress research and analysis. However, it appears that the facilitation tools required can be
crafted without insult to Colorado’s existing water-law framework and systems.
31
6.0 Acknowledgements
This work was supported by the NSF-funded SmartGeo research fellowship (Project
IGERT: Intelligent Geosystems; DGE-0801692). We thank the Colorado Division of Water
Resources Division One Dam Safety Branch, and TZA Water Engineers, Inc. for supporting
this work.
7.0 References
1. American Society of Civil Engineers, 2009. Report Card for America’s Aging Infrastructure.
Full Report Cards for 2001-2009. American Society of Civil Engineers, Online
Publication available at: http://www.infrastructurereportcard.org/report-cards


![Parcelamento 2012b [modo de compatibilidade] loteamento](https://static.documents.pub/doc/80x56/5585dd40d8b42a7c4a8b4d1e/parcelamento-2012b-modo-de-compatibilidade-loteamento.jpg)