Thmisa C.~ IKaw 6fld"I ECo0m omilc growth and ere ploy- .ent in China A W-orU Bank Research P.i'cat . : - > . -. -~~~~~~~~~~~~~~* = ;-, X # E h j < o~~~~~14 Public Disclosure Authorized Public Disclosure Authorized Public Disclosure Authorized Public Disclosure Authorized Public Disclosure Authorized Public Disclosure Authorized Public Disclosure Authorized Public Disclosure Authorized
Transcript
Thmisa C.~ IKaw 6fld"I
ECo0m omilc growthand ere ploy- .entin China
A W-orU Bank Research P.i'cat .
: - > . -.-~~~~~~~~~~~~~~* = ;-,
X # E h j < o~~~~~14
Pub
lic D
iscl
osur
e A
utho
rized
Pub
lic D
iscl
osur
e A
utho
rized
Pub
lic D
iscl
osur
e A
utho
rized
Pub
lic D
iscl
osur
e A
utho
rized
Pub
lic D
iscl
osur
e A
utho
rized
Pub
lic D
iscl
osur
e A
utho
rized
Pub
lic D
iscl
osur
e A
utho
rized
Pub
lic D
iscl
osur
e A
utho
rized
)~ ~ ~ ~~~~~,-k O' O
Economic Growthand
Employmentin
China
Ret=aurn_to_B C,Ji-2O3
A World Bank Research Publication
70- ao 9o 100'
U.People's Republic of
CHINAS National Cpitals
a Provincial and Autonomous Region Capitals
o Other Principal Cities
- - Provincial and Autonomous Region .
-*- '.ttern:ttonal Boundaries .< ' /
MiBes ^ \O (00 ZOO 3C0 400 500 t, >
O Z2O -o 70 jKilonieteri rS5
40' _ U
g ) / SI N K I A N G
ud ~/ ( T S I N G HA I
~~ ~T I B E T _ _
0Nem Delhi f \ SZECHWAN
-N'1 o' 47 3Lh~~~~~~~~~0tasa
{-atmandu-r U fzhmh5 & (..
I N D I A /GAEH f unmg
,,a _s- / YUNNAN'O.~ ~ ~ ~ ~ ~~~~~ac / '-
Rangoon . ALN~.'
1;0- 120- 130- 140-
S. S. R.
K ____.- I' ~~~~HEILIJNGKIANGI . 7~~~~~~~~~~
Ll~Bator ;.-,Ulan Haor r O -1 ,tu s~~~~H.,bl.
G O L I A / . KIRIN Ch'o/
/' 1NNNGR ( E jLIAj (..I ... Mon) r LIAONING of lap*"
_ r,-f-- . /DEMOCR C PEO7LEIS(< NINGSJ) lPeki~,$? * REPUBLICOFKOREA
1818 H Street, N.W., Washington, D.C. 20433 U.S.A.
All rights reserved. No part of this publicationmay be reproduced, stored in a retrieval system,
or transmitted in any form or by any means,electronic, mechanical, photocopying, recording,
or otherwise, without the prior permission ofOxford University Press. Manufactured in the
United States of America.
The views and interpretations in this book are the author's andshould not be attributed to the World Bank, to its affiliated or-ganizations, or to any individual acting on their behalf. Themaps in this book have been prepared for the convenience ofreaders; the denominations used and the boundaries shown donot imply, on the part of the World Bank and its affiliates, anyjudgment on the legal status of any territory or any endorse-ment or acceptance of such boundaries.
Library of Congress Cataloging in Publication Data
Rawski, Thomas G 1943-Economic growth and employment in China.
Bibliography: p. 177Includes index.1. Laborsupply-China. 2. Employmentforecasting-
List of Tables page ixForeword by Benjamin B. King page xiPreface page xiii
Chapter OneIntroduction and Summary page 3
Economic Growth in China page 3Employment Problems and Goals during the 1950s page 6Critical Factors in Raising the Level of Employment page 8Evidence of High Employment Levels in the 1970s page 9Methodological Problems page 14Organization of the Book page 18
Chapter TwoSize and Sectoral Distribution of China's Labor Force
in 1957 and 1975 page 19The Population of China page 19Urban Population page 24Participation Rates in the Labor Force-Urban page 29Participation in the Labor Force-Rural page 30The Total Labor Force page 34Nonagricultural Employment page 36The Agricultural Labor Force and Employment page 38
Chapter ThreeDeterminants of Industrial Employment page 41
Pattems of Industrial Employment, 1957-75 page 42Economic Objectives and Industrial Structure page 45Technology and Employment in Three Types of
Industrial Units page 50Institutional Determinants of Industrial Employment page 67Conclusion page 69
Chapter FourLabor Absorption in Agriculture from 1957 to 1975 page 71
China's Agricultural System page 73
vii
Viii TABLE OF CONTENTS
Major Developments: Collectivization and Supplyof Modem Farm Inputs page 75
Intensification of Cropping Practices page 91Intensification of the Cropping Cycle page 102A Shift toward Labor-Using Farming Activities page 106Rural Construction page 109Overall Results: The Supply of, and Demand for, Agricultural
Labor page 113Overall Results: Productivity Trends in Agriculture page 118
Chapter FiveRetrospect and Prospect page 123
Employment and Unemployment in China page 123Prospects for China's Labor Market page 132Transferability of China's Experience to Other Countries page 141
MapsPeople's Republic of China frontispieceAgricultural Areas of China page 72
List of Tables
1-1. Indicators of Chinese Economic Development, Selected Years,1952-78 page 4
2-1. Estimated Population of the People's Republic of China, SelectedYears, 1952-78 page 21
2-2. Grain Production and Supply per Capita, 1955 and 1977 page 242-3. Population of Chinese Cities, 1953, 1957, and Mid-1970s page 272-4. Employed Population as a Percentage of Urban Population, the
1950s and 1974 and 1975 page 302-5. Population, Labor Force, and Labor Force Participation in
Selected Rural Areas, 1975 page 322-6. Rural Population and Employment, by Sex, 1957 and 1975
page 332-7. Estimates of China's Labor Force, 1957 and 1975 page 352-8. Nonagricultural Rural Employment, 1957 and 1975 page 372-9. The Agricultural Labor Force, 1957 and 1975 page 393-1. National and Selected Regional Labor Productivity in Industry,
1952-75 page 433-2. Average Annual Percentage Growth of Output, Employment, and
Fixed Capital in Producer-Goods Industries, 1952-65 and1957-65 page 45
3-3. Capital Intensity and Output Growth, by Industrial Sector,1952-72 page 47
3-4. National and Regional Investment Outlay and Project Size,1953-57 page 52
3-5. Factor Proportions and Labor Productivity, Selected Sectors in the1950s and Major Firms in 1965 page53
3-6. Employment Changes at Major Enterprises since the 1950spage 56
3-7. Share of Five Small Industries in Factory Output, 1972 page 634-1. Percentage Distribution of Ide Time, by Month, 1929-33
page 744-2. Percentage of Localities Reporting Agricultural Labor Shortages,
1929-33 page 754-3. Growth of Industrial Inputs into China's Rural Economy,
1957-78 page 80
ix
X LIST OF TABLES
4-4. Agricultural Labor Performance Using Various Techniques,1959 page 88
4-5. Estimate of Fertilizer Supply, by Source, 1957-71 page 924-6. Labor Requirements, Yields, and Productivity in Cotton
Growing, 1929-33 and 1962 page 994-7. Growth of Agricultural Output, 1957-74 page 1074-8. Sectoral Contributions to Growth of Agricultural Output, 1957-
74 page 1084-9. Water Management Statistics, 1930s to 1977 page 1II4-10. Supply of, and Demand for, Agricultural Labor, 1957 and
1975 page 1154-11. Labor Productivity in Agriculture, 1957 and 1975 page 1204-12. Estimated Factor Productivity in Agriculture, 1957 and
1975 page 120
5-1. Labor Force Projections, 1975-90 page 133
B-1. Nonagricultural Employment, by Sector, 1957 and 1975 page 156
B-2. Growth of Domestic Transport, 1949-73 page 160B-3. Industrial Output, Employment, and Productivity in Shanghai
and Liaoning Province, 1975 page 163B-4. Industrial Labor Productivity for 1955, Shanghai, Liaoning
Province, and Nationwide page 163
C-1. Estimated Employment in Small-Scale Producer-GoodsIndustries, 1975 page 171
C-2. Labor Productivity at Selected Farm Machinery Plants page 175
Foreword
THE PRESENT DECADE has seen much soul-searching about employ-ment policies in developing countries. The volume of literature onthe subject is large. Several particular aspects have been the sub-ject of intensive debate: appropriate technology, small-scale enter-prise, rural industries, farm mechanization, and the employmentand distributive aspects of small-scale farming and agrarian re-form. In some instances the debate is of long standing, but it con-tinues with as much intensity as before. Whatever the benefits ofindustrial exports for growth and employment may be in general,in the more populous developing countries the main market forindustry is the domestic one, and it is likely to remain so for sometime. Since, in addition, the labor force is preponderantly rural,agricultural development strategy has a critical bearing on the pat-tern, location, and pace of industrial development.
In writings on these matters, it is common to find some refer-ence to China's experience. Nevertheless, despite the rapidgrowth of the literature, there are few studies that have attemptedto map out China's policies on employment and, in particular, tomake a quantitative assessment of what most observers agree tohave been considerable achievements during the past two dec-ades. The World Bank asked that such a study be undertaken; thisbook was commissioned to help the Bank in its understanding ofurban and rural development, rural enterprise and nonfarm em-ployment, and the development of small enterprise.
The emphasis placed by China on labor-intensive methods ofraising agricultural output, supported by its rural industries' pro-gram, and the resulting effects on the regional dispersion of indus-try provide valuable insight, both for countries that have not op-ted for this as one of the elements of an employment and growthpolicy and for others that have or are in the throes of doing so. As
xi
Xii FOREWORD
the author concludes, even if China's political, social, and eco-nomic system is radically different, there are many examples ofhow knowledge of its experience can enrich the understanding ofthose concerned with employment policy elsewhere.
BENJAMIN B. KING
DirectorDevelopment Economics Department
Preface
THIsBoox4 a.xeLssAgand updated version of a report prepared forthe World Bank in 1977. In writing the original report and thepresent manuscript, I have benefited from the assistance of a num-ber of individuals and organizations.
My primary obligation is to Alice S. Y. Chan, whose diligentefforts unearthed much of the detailed information presented inthe following pages. Evelyn Rawski read and discussed countlessdrafts.
The following individuals and organizations generously sup-plied me with bibliographic assistance, unpublished research re-sults, and good advice: John Aird, Dennis Anderson, David M.Brown, Kang Chao, the Committe on Scholarly Communicationwith the People's Republic of China, Robert Dernberger, JohnPhilip Emerson, Robert Michael Field, Thomas Gottschang, Shi-geru Ishikawa, Ramon Myers, Dwight Perkins, Peter Schran,Benedict Stavis, Anthony Tang, Joseph Whitney, Peter Wiles,Bobby Williams, Florence Yuan, and several anonymous critics.Portions of the study were discussed in seminars at the WorldBank, the Midwest Seminar of the Association for Asian Studies,and the Universities of Pittsburgh and Toronto. Financial supportcame from the World Bank, the University of Toronto-York Uni-versity Joint Centre on Modern East Asia, and the University ofToronto.
Marilyn French typed the manuscript with speed and efficiency.The final manuscript was edited by Goddard Winterbottom andChristine Houle; the index was prepared by Nancy E. MacClin-tock; the maps were drawn by Larry A. Bowring; Richard Stod-dard designed the cover and dustjacket; and Brian J. Svikhart su-
xiii
XiV PREFACE
pervised production. Although many people have contributed to
this study, its shortcomings must still be blamed on the author.
THOMAS G. RAWSKI
Economic Growthand
Employmentin
China
Chapter One
Introduction and Summary
THE LEVEL OF EMPLOYMENT IS A CRITICAL INDICATOR of economicperformance in developing countries, a fact that economists havecome to recognize only during the past decade. The principal con-clusion of this study of the relation between economic growth andemployment in the People's Republic of China is that China hassucceeded in providing greater employment opportunities for alarge and rapidly growing labor force, with much of this absorp-tion of labor occurring in agriculture.
Economic Growth in China
China's economy has grown rapidly, though at times erratically,since the creation of the People's Republic in 1949.1 In addition tothe expansion of production both in aggregate and in per capitavalues, this growth process has brought with it important changesin economic structure, in technology, and in the level of economicwelfare enjoyed by the Chinese people. Quantitative indicators ofChina's recent progress along the path of modern economicgrowth are compiled in Table 1-1.
1. For detailed accounts of China's recent economic development and its histor-ical antecedents, consult Alexander Eckstein, thina's Economic Revolution (Cam-bridge, England: Cambridge University Press, 1977); Christopher Howe, OCina'sEconomy: A Basic Guide (New York: Basic Books, 1978) and Ctina's Modern Economy inHistorical Perspective, ed. Dwight H. Perkins (Stanford, Calif.: Stanford UniversityPress, 1975).
3
4 ECONOMIC GROWTH AND EMPLOYMENT IN CHINA
TABLE 1-1. INDICATORS OF CHINESE ECONOMIC DEVELOPMENT,
(billions of 1963 U.S. dollars)Exports 0.8 1.3' 2.2' 2.8 n.a. 6.obImports 1.0 1. 7e 1.9f 3.2 n.a. 5.4b
n.a. Not available. -Not applicable.a. Percentage share of each component is shown in parentheses.b. Growth rate is for 1952-74.c. Estimated capital formation is for 1973; growth rate is for 1952-73.d. Figure is probably an underestimate of actual output.
INTRODUCTION AND SUMMARY 5
TABLE 1-1 (continued)e. 1955 data.f. 1966 data.Sources: Line 7 Dwight H. Perkins, "Estimating China's Gross Domestic Product," Current
Scene 15.3 (1976), p. 16, extended from 1974 to 1978 and, for calculating the figures in Line 5, to1973 using an index calculated from U.S. National Foreign Assessment Center, China: EconomicIndicators (Washington, D.C.: Central Intelligence Agency, 1978), p. 1. Line 2 Aird's estimatesshown in Table 2-1. Line 4 Robert M. Field, "Real Capital Formation in the People's Republicof China, 1952-1973," in Quantitative Measures of OCina's Economic Output, ed. Alexander Eck-stein (Ann Arbor: University of Michigan Press, forthcoming), Table 19. Lilne 6 Dwight H.Perkins, "Growth and Changing Structure of China's Twentieth-Century Economy," in OGina'sModern Economy in Historical Perspective, ed. Dwight H. Perkins (Stanford: Stanford UniversityPress, 1975), p. 153; and Christopher Howe, Ciina's Economy: A Basic Guide (New York: BasicBooks, 1978), p. 176. Line 7 data for 1978 from "Communique on Fulfillment of China's 1978National Economic Plan," Beijiuig Reviewv, no. 27 (1979), pp. 37-38; other data, U.S. NationalForeign Assessment Center, China: Economic Indicators, p. 1, except for the estimate of 1974cotton cloth output, which is from Robert M. Field, "Civilian Industrial Production in thePeople's Republic of China: 1949-74," in U.S. Congress, Joint Economic Committee, Guina: AReassessment of the Economy (Washington, D.C.: U.S. Government Printing Office, 1975), p. 167.Line 8 Alexander Eckstein, China's Economic Revolution (Cambridge, England: Cambridge Uni-versity Press, 1977), p. 246.
In quantitative terms, these data show that aggregate and percapita output have grown at rates that, although not exceptional,exceed average performance among countries of the Third Worldby a considerable margin.2 Extensive changes in the structure ofthe economy-formerly dominated by agriculture and handicrafts,with industry contributing only a small and isolated segment oftotal output-have pushed industry ahead of agriculture as thelargest contributor to China's gross domestic product. Rising do-mestic saving and production of capital goods have lifted the shareof output devoted to investment from the 5 percent level recordedbefore World War II to approximately 25 percent in the mid-1970s.Massive growth of output in energy, metallurgy, engineering, andother basic industries has enabled China to supply itself withmost of the commodities needed to support its economic expan-sion. The level of foreign trade, although small in proportion tooverall output, has kept pace with the growth of the domesticeconomy, allowing imported goods and the exports that financeimport purchases to make a continuing contribution to the expan-sion of China's economy.
2. David Morawetz, Twenty-five Years of Economic Development, 1950 to 1975 (Bal-
timore and London: Johns Hopkins University Press, 1977), p. 19.
6 ECONOMIC GROWTH AND EMPLOYMENT IN CHINA
Qualitative changes are less easily documented, but they havebeen of equal significance. China has made great strides in pro-viding adequate food, shelter, health care, and other basic necessi-ties to its entire population, including the lowest income groups.Mastery of modern technology has spread rapidly over a broadrange of manufacturing industries and scientific disciplines. A na-tion that until 1957 could not manufacture tractors, power plants,or wristwatches now produces computers, earth satellites, oralcontraceptives, and nuclear weapons. The technical skills requiredfor industrial development are no longer confined within a fewisolated urban enclaves. The spread of rural electrification, localindustry, technical training, and publishing has brought modernscience and technology to the doorstep of most of China's 200-oddmillion households. Nearly universal participation by Chineseyouth in primary education and the rapid expansion of secondaryeducation ensure that the dissemination of knowledge will con-tinue to broaden and deepen.
Employment Problems and Goalsduring the 1950s
In the experience of many developing countries economic growthand industrial expansion have often failed to provide adequateemployment opportunities for broad segments of the labor force.With its huge and thickly clustered population, China has had along history of urban unemployment and rural underemployment.In the early years of the People's Republic, in the early 1950s, aconcentration of resources on a small number of large-scale, capi-tal-intensive industrial projects that formed the core of China'sFirst Five-Year Plan (1953-57) produced what is a classic pattern: arapid growth in output alongside open unemployment in thecities and seasonal idleness in the countryside.
Chinese and foreign accounts agree that urban unemploymentwas both severe and persistent during the 1950s. The rapid growthof urban and industrial job opportunities could not keep pace withthe sheer number of job seekers, which was swollen by masses ofpeasants flocking to the towns to escape the consequences of local
INTRODUCTION AND SUMMARY 7
food shortages or of the land reform and collectivization that fol-lowed- the establishment of the People's Republic. Chinese reportsof this period regularly mention urban unemployment figures run-ning into the millions.
An excessive supply of labor in the countryside led to wide-spread seasonal idleness both before and after 1949. Peter Schranhas estimated that the average peasant worked only 119 days eachyear during the early 1950s. The formation of farming cooperativesduring 1955-56 and the collectivization of farming in 1958 enabledthe Chinese government and the Communist Party to mobilizelabor for more intensive cultivation, rural construction projects,and production of nonagricultural commodities, but this increasein peasant effort left the average number of labor-days far belowthe full-employment norm of 250 used by Chinese economic plan-ners during the 1950s.3
Despite these problems of urban and rural underemployment,China's leaders mapped out ambitious plans for attaining full em-ployment. Urban unemployment would be curbed despite rapidlyrising productivity by accelerating the rate of industrial growth,by transferring idle urban dwellers to rural units, and by strictlylimiting peasant migration to the cities. At the same time, thenewly formed collectives, which had the potential to undertakeprojects whose scale would be beyond the reach of smaller organi-zations, were also expected to implement changes in methods ofagricultural production that would expand employment opportu-nities in the countryside. Here, targets were spelled out in detail:"In the seven years starting from 1956, every able-bodied man inthe countryside should be able to work at least about 250 workingdays a year.... [E]very able-bodied woman in the countryside
should, apart from time spent on household work, be able to giveno less than 80 to 180 days a year, to agriculture or sideline occupa-tions. "'4
3. Peter Schran, The Development of Chinese Agriculture, 1950-1959 (Urbana: Uni-versity of Illinois Press, 1969), chap. 3.
4. From The National Program for Agricultural Development, 1956-67, as repro-duced in Leslie T. C. Kuo, Agriculture in the People's Republic of China (New York:Praeger, 1976), p. 276.
8 ECONOMIC GROWTH AND EMPLOYMENT IN CHINA
Critical Factors in Raisingthe Level of Employment
The principal conclusion of this study is that, as of the mid-1970s,China had succeeded in reaching these ambitious goals. Unem-ployment certainly exists in the cities, but despite recent Chinesestatements emphasizing the growing seriousness of this problem,urban unemployment appears less prevalent in China than inmost developing countries. In the countryside seasonal idlenesshas been greatly reduced, and the average number of annual labor-days contributed by farm workers-of whom nearly 45 percent arewomen-has risen to approximately 250.
China's success in providing employment for a labor force thatincreased by roughly 150 million men and women between 1957and 1975 was primarily the result of the ability of the agriculturalsector to absorb two-thirds of those new workers. As will beshown in Chapter Four, these large increases in demand for laborin the farm sector were facilitated by two principal changes: by thecollectivization of farming, which occurred during 1956-58, andby the rapid growth in the supply of manufactured farm inputs,which began in the early 1960s.
Collectivization of farming meant that China's millions of peas-ant households were compelled to surrender their lands and theiranimals to collective units, the People's Communes, which com-pensate their members only in proportion to the labor servicesthat they render to the collective economy. Disorganization, poormanagement, and an erosion of economic incentive caused seri-ous problems in the early years of the communes, and these diffi-culties contributed heavily to the disastrous harvests of 1959-61.Thereafter, an increase in managerial experience and the return ofcontrol over production and income-sharing decisions to smallgroups comprising no more than a few dozen households allowedthe commune system to undertake and direct agricultural reformsthat have subsequently raised the demand for labor and output ofthe farms as well. These measures have included increased prepa-ration and application of organic manures, the supply of whichhas risen as a result of collective animal raising and animal pro-tection schemes; intensification of cultivation techniques by in-creasing the labor inputs for planting, weeding, pruning, irriga-
INTRODUCTION AND SUMMARY 9
tion, plant protection, and other farming tasks; diversification ofthe farm economy in directions that enhance the relative impor-tance of labor-intensive activities; and annual campaigns to mobi-lize seasonally idle labor for construction projects designed tostimulate agricultural output by leveling and terracing hilly lands,expanding water supplies, providing better protection againstflood and drought, and improving the rural transport network.
For these new patterns of farm activity to be undertaken, a kindand level of industrial support that was not available during the1950s had to come into being. In the wake of the economic read-justments made necessary by the agricultural collapse that oc-curred in China in 1959-61, growing quantities of industrial sup-plies began to flow into the farm sector. These commodities, manyof them produced by small and Mnedium-size rural enterprises,came to play an important role in promoting labor-absorbing agri-cultural policies. Cement, steel, and explosives for water con-servancy and land improvement projects, pumps and piping tomove water from newly built reservoirs to the fields, electricity tooperate irrigation equipment, chemical fertilizers to combine withincreased water supplies to raise crop yields, power tillers to haulearth, stone, building materials, and organic fertilizers, machinetools to stock the thousands of repair shops that now dot China'scountryside-all were essential ingredients in the process of rais-ing the demand for labor sufficiently to absorb nearly 100 millionnew workers into the farm sector while simultaneously raising thenumber of days worked each year throughout rural China.
Evidence of High Employment Levelsin the 1970s
After 1961, as the pace of winter construction campaigns and in-flows of manufactured farm inputs quickened and agriculturaloutput returned to normal levels, the demand for labor in ruralareas began to rise much as had been anticipated in the plan docu-ments of the mid-1950s. Beginning in the late 1960s and contin-uing to the present, a variety of evidence of high employment lev-els and sharply reduced involuntary idleness is found in both ur-ban and rural regions of China.
10 ECONOMIC GROWTH AND EMPLOYMENT IN CHINA
Recent accounts by foreign visitors are filled with observationsof high levels of employment. Visitors find that urban enterprisesnow experience difficulty in obtaining permission to recruit newworkers. Daytime gatherings of idle young men on city streets, acommon phenomenon in the cities of both developed and devel-oping countries, are not encountered. Together with statistical in-formation reported for some cities, as is discussed in ChapterTwo, this visual evidence points to high levels of urban employ-ment during the 1970s. The exception to this favorable view comesfrom reports, considered in Chapter Five, that as many as severalmillion youths assigned to rural areas may have illegally returnedto their urban homes in search of employment.
In the countryside visitors are surprised to hear of a shortage oflabor rather than of a surplus. Officials of communes emphasizethe need for increased mechanization of farm work to overcomeseasonal shortages of labor and to intensify even further the crop-ping system. An American Wheat Studies Delegation found in 1976that "all officials insisted that there was no labor surplus" at theunits visited; "instead they expressed concern about labor short-age, at least during the transplanting and harvesting seasons."5
Visitor accounts, even those of specialists whose knowledge ofChinese allows them to converse with persons other than officialspokesmen, leave much to be desired. Visitors are taken to out-standing rather than typical units. The same Wheat Studies Dele-gation, for example, toured ten units at which the smallest wheatyield for 1975 was almost two-thirds greater than the national aver-age figure for 1972; the average wheat yield at the ten units was230 percent above the national figure for 1972.6 Furthermore, vis-its to China are brief and often rushed. Foreign guests receivetightly scheduled itineraries that allow scant opportunity for de-tailed inquiry into the affairs of individual units.
Evidence of high employment levels in the 1970s, however,comes from Chinese as well as foreign accounts. Chinese pub-lications reveal an enthusiasm for mechanization throughout the
5. Peter Schran, "Farm Labor and Living in China" (Champaign: University of
Illinois, 1976; processed), p. 11.6. Virgil A. Johnson and Halsey L. Beemer, Jr., Wheat in the People's Republic of
China (Washington, D.C.: National Academy of Sciences, 1977), pp. 91 and 166.
INTRODUCTION AND SUMMARY 11
economy that would hardly be consistent with widespreadunemployment or underemployment. The following examplestypify thousands of positive reports about the effect of mechaniza-tion in industry, agriculture, and services: 7
Shih-chia-chuang [Hopei] Rolling Stock Works made 12pieces of pneumatic equipment to mechanize the main workline. Personnel dropped by one-third and productivity dou-bled.
Local industry in Fukien's Yung-ch'un County is developingrapidly. About 90 percent of the county's farm and subsidi-ary products are now processed by machine, saving 1.1 mil-lion man-days.
Agricultural mechanization is no doubt the center of agro-technical reform. It signifies the level of agricultural produc-tivity, and abundant forces must be made available to carry itout actively. But it should also be perceived that the mostprominent role of agricultural mechanization is to save laborpower.
The Haining postal machinery works has successfully trial-produced several high-speed letter stampers which performwell. The stamper can stamp 36,000 letters an hour, therebyraising work efficiency by more than ten times.
Chinese writers are well aware of the direct effect of mechaniza-tion on labor requirements. As these statements show, they wel-come the saving of labor inherent in machinery. Their reportsrarely contain persuasive arguments directed at opponents of newequipment, because they evidently expect readers to share theseviews.8 The rapid rise in stocks of rural machinery (see Table 4-3),
7. Ching-chi tao-pao [The Economic Reporter], no. 1,228 (1971), p. 20, and no.1,177 (1970), p. 23; ECMM, no. 409 (1964), p. 37; and BBC, no. W954 (1977), pp. A13-14.
8. Evidence of resistance to farm mechanization may be found in HuangChing, "On Agricultural Mechanization in China," Chi-hsieh kung-yeh [MachineryIndustry], no. 21 (1957), translated in BCMM, no. 120 (1958), pp. 36-37, and BenedictStavis, The Politics of Agricultural Mechanization in China (Ithaca, N.Y.: Comell Uni-versity Press, 1978), pp. 106, 157, 181, and 205-10. Ironically, the strongest resis-
12 ECONOMIC GROWTH AND EMPLOYMENT IN CHINA
most of which are purchased by communes and production bri-gades out of collective funds, also points to the popularity ofmechanization, as does information showing that machinery isused more intensively in China than in other countries.9
China has already attained a modest degree of farm mechaniza-tion: data presented in Chapter Four indicate that supplies of ma-chinery are now approaching Japanese levels of the early 1960s.Recent experience with farm machinery has convinced China'sleaders that accelerated mechanization holds the key to raising thegrowth rate of farm output. The Third National Conference on Ag-ricultural Mechanization, held in January 1978, adopted a target ofachieving basic agricultural mechanization by 1980. More specifi-cally, current plans anticipate the following:
[B]y 1980, 70 percent of the major agricultural, forestry, ani-mal husbandry, sideline production and fishery operationsshould be mechanized; large and medium-size tractors in-creased by 70 percent over the present figure; machine-drawn farm implements by 110 percent; hand-guided trac-tors by 36 percent; drainage and irrigation machines by 32percent.... The meeting also decided that there should be
fairly large increases in production of machines for farmlandcapital construction, plant protection, transportation, har-vesting, and agricultural and sideline processing, as well asincreases in the output of agricultural chemicals, dynamite,plastic sheet, forestry, animal husbandry, and fishery ma-chines, and small rural power stations and semimechanizedfarm implements.10
This across-the-board drive toward mechanization would make nosense in the presence of widespread rural underemployment.
China's unique program of conscripting urban school gradu-ates to migrate to the countryside provides additional evidencethat the demand for rural labor cannot fall far short of available
tance to mechanization seems to have come from officials in Shantung Province,which is now hailed as a national leader in farm mechanization.
9. Dwight Perkins and others, Rural Small-Scale Industry in the People's Republic ofChina (Berkeley: University of California Press, 1977), pp. 150-51.
10. FBIS, January 31, 1978, p. E7.
INTRODUCTION AND SUMMARY 13
supplies. Peasants sometimes oppose settlement of urban youthsin their local units, but rural hostility to newcomers arises not be-cause there is no work to be done, but because urban youths tendto be weak, unskilled, and often unwilling to take on the gruelingphysical labor required of China's farmers.
Reports of difficulties encountered by the program to "rusti-cate" urban youth reveal that employment standards of the 1970sare much higher than those of the late 1950s:
After . . . study, the educated youths sent to Chi County,
Hopei, made encouraging progress. In 1972 each personworked an average of 269 days, 64 days more than in 1971.
Under the tutelage of the party, the work attendance of theeducated youths in this comrmune [Huai-te County, Kirin]increases each year; the boys and girls on the average eachreported for work 225 days in 1970, 245 days in 1971, and 267days in 1972.
The youths in the countryside say, "Ch'ien-ying [Feng-jungCounty, Hopei] is our home, and the poor and lower-middlepeasants are thus our family." In the past eight years, theyhave spent every Spring Festival with the . . . peasants of
Ch'ien-ying. In 1972 every person participated in 300 days oflabor on the average."
At the national level, a regulation in 1974 required "communes toguarantee urban youths a minimum annual wage of 200 yuan, pro-vided they work . .. for at least 250 days per year."' 2 Finally, de-mands that commune and brigade leaders should participate inmanual labor for from 200 to 300 days a year provide further evi-dence that the typical work-year in China's countryside now in-cludes far more than the 190 labor days estimated for 1959 bySchran. t3
It is not easy to define with any degree of precision what "full
11. Peter J. Seybolt, ed., The Rustication of Urban Youth in China (White Plains,N.Y.: M. E. Sharpe, 1975), pp. 24, 38, and 54-55.
12. Thomas P. Bemstein, Up to the Mountains and Down to the Villages (NewHaven: Yale University Press), p. 153.
13. Ibid., pp. 325-26; and Schran, Chinese Agriculture, p. 75.
14 ECONOMIC GROWTH AND EMPLOYMENT IN CHINA
employment" means as it relates to agricultural workers. A roughapproximation is possible if it is assumed that the age and sexdistribution of China's present farming population resemblesavailable estimates of national figures. If the prime labor forcemembers, men aged from 15 to 54 and single women aged from 15to 24 are assumed to work 330 days each year (allowing ten days ofleisure at New Year and the Spring Festival and an extremely lowtotal of fifteen additional holidays for rest or illness) and the sec-ondary labor force, of housewives aged from 25 to 54 and menaged from 55 to 64 is assumed to work from 80 to 180 days a year,the range mentioned in the plan document cited above, then theaverage work schedule for all workers may be calculated at be-tween 246 and 279 days each year.'4 These rough calculationsshow that an average work year of 275 days represents an extreme-ly high utilization of rural labor; this will be taken as the defini-tion of "full employment" for agricultural workers.
Methodological Problems
Before beginning a detailed investigation of the relation betweeneconomic growth and employment in China, two issues requirebrief discussion. They concern the reliability of Chinese economicstatistics and the influence of political events on China's economy.
China's government stopped publishing regular statistical re-ports on economic performance during the late 1950s; even duringthe earlier period of relatively liberal publication, many types ofinformation that are readily and routinely made available for non-communist nations were not released. As a result, studies ofChina's economy are of necessity based on quantitative estimatespainstakingly compiled by foreign specialists from whateversources can be found. Most of this work consists of piecing togeth-er information from Chinese sources-newspapers, journals, ra-dio broadcasts, and the like-but other sources, including Chi-
14. These calculations are based on a breakdown of the July 1977 population byage and sex as estimated in U.S. National Foreign Assessment Center, China: Eco-nomic Indicators (Washington, D.C.: Central Intelligence Agency, 1977), p. 7.
INTRODUCTION AND SUMMARY 15
nese emigres, foreign press reports, and returned visitors, are alsoused.
An empirical study such as the present book is limited by thequantity and quality of available data. Since a large proportion ofthe data used in this study is compiled in this unorthodox fashion,it is natural for readers to question its value and authenticity.Three questions must be asked. First, is China's statistical report-ing system good enough to permit the government to collect rea-sonably accurate data on output, employment, and other quan-tities with which this study is concerned? Second, does the pub-lished information that serves as the principal source material forthis study coincide with the internal figures used by Chinese plan-ners and policymakers? Third, do the Chinese publish enough in-formation to permit an outsider to approximate unpublished mag-nitudes with a reasonable degree of accuracy?
These issues are discussed in Appendix A, in which it is arguedthat the answer to each of the three questions is a qualified yes.China's system of state-dominated central planning requires vastamounts of statistical information to function with a reasonabledegree of efficiency. There is voluminous evidence showing thatChina's factories, communes, and government agencies can anddo compile detailed and accurate data on a wide range of topics.China's statistical reporting system is set up in such a way that itis difficult to measure some economic variables, of which popu-lation is the most familiar example. Nevertheless, there is goodevidence that the range and quality of statistical information avail-able to economic policymakers are significantly greater in Chinathan in most countries in which average annual incomes fall belowUS$1,000 per capita.
Although China's government publishes only a fraction of theeconomic data it collects, there are no valid grounds for suspectingthat Peking issues data that are known to be false. Since most dataavailable to foreigners are either taken from, or repeated in, do-mestic Chinese media, the principal effect of such deceptionwould be to undermine the government's credibility with its owncitizens. Having experienced the corrosive effect of false reportingduring the Great Leap Forward of 1958-60, when the collapse ofaccurate statistical reporting led Peking to issue exaggeratedclaims of bumper harvests and soaring production that were later
16 ECONOMIC GROWTH AND EMPLOYMENT IN CHINA
retracted at considerable political cost, the Chinese scrupulouslyavoid publishing false claims. This is not to say that Chinese eco-nomic reporting is well balanced or that individual Chinese unitsdo not attempt to embellish their reputations by reporting falseachievements to their superiors. Both problems certainly exist.The outside observer, however, must pay careful attention only tothe danger of taking the (published) part for the (unavailable)whole. The problem of false reporting can be left to the presentChinese administration under Deputy Premier Teng Hsiao-p'ing,whose motto, "Seek Truth from Facts," indicates the prevalent at-titude toward statistical deception.
The question concerning the accuracy with which outsiders canestimate actual economic magnitudes from the partial informationavailable from Chinese and other sources will be fully answeredonly when the Chinese government chooses to release a sub-stantial flow of economic data. In the meantime, however, boththe history of the research project of which this book is the resultand, more generally, the history of foreign studies of China's eco-nomic development show that careful sifting of available informa-tion has made it possible to establish a sound empirical founda-tion for investigating quantitative as well as qualitative aspects ofChina's economy. This can be seen in the growing internationalconsensus among specialists concerning the basic quantitativepattern of China's economic growth since 1949,15 in the extent towhich the enlarged flow of information resulting from scholarlyexchanges with the People's Republic has reinforced rather thanupset this consensus, and in the frequency with which Chinesestatements confirm the inferences of empirical researchers.
In regard to the second methodological issue, readers of thisbook may be surprised at the extent to which political develop-ments are neglected. This is not accidental, but reflects the au-thor's belief that, contrary to the familiar slogan, politics is rarely"in command" of economic developments in China. Political ac-tivity dictates the course of economic events only during cam-paigns that take aspects of economic life as their central target. The
15. This consensus emerged at a conference in 1975 arranged by Alexander Eck-stein. Its results will appear in Quantitative Measures of China's Economic Output, ed.Alexander Eckstein (Ann Arbor: University of Michigan Press, forthcoming).
INTRODUCTION AND SUMMARY 17
land-reform campaign, the process of transferring ownership oflarge-scale industry and commerce to the state, and the collectivi-zation of agriculture all represented notable political initiativesthat were intended to bring about considerable and discontinuouseconomic changes-and did so.
All of these campaigns occurred before 1960. Since then onlythe decentralization of responsibility within the communes in theearly 1960s stands out as an example of a political decision thatcaused a fundamental structural change in the economy. After1960 both policy and performance display a high degree of conti-nuity; in comparison with the 1950s, politically inspired change isconspicuous by its absence. Only the emergence of an outward-looking administration from the confusion surrounding the de-cline and death of Chou En-lai and Mao Tse-tung, an administra-tion dedicated to economic and technical modernization, can per-haps be seen as another change that could influence economic lifeas profoundly as the earlier innovations of land reform, socializa-tion and collectivization.
The absence of significant political initiatives directed at theeconomy does not mean that politics and economics move in iso-lated orbits. On the contrary, political activity directed toward thepursuit of power or any of a wide range of other objectives oftenincludes economic components. But when the principal objectiveof political effort lies elsewhere, its effect on economic patternsdepends upon the extent to which secondary or tangential politicalenergies can displace the forces that normally compete for influ-ence over economic life: the economic institutions of the state andthe bureaucracies that run them; the regional and local aspirationsof provinces, counties, and towns; the individual interests ofworkers, peasants, and their families; and the internal logic of adynamic economy. The history of China's economy during the1960s and 1970s shows that, when the central concern of politicallife remains outside the economy, economic forces tend to pre-dominate on the inside. The period of the Cultural Revolution,1966-68, illustrates this perfectly. There was no shortage of sug-gested economic reforms, and high officials were cashiered for al-legedly placing "profit in command" and "taking the capitalistroad." But with political energies expended outside the economicarena, resistance to reform was largely successful. Some proposed
18 ECONOMIC GROWTH AND EMPLOYMENT IN CHINA
changes were never implemented, whereas others received initialbut superficial acceptance and were later sloughed off. Liu Shao-ch'i, Teng Hsiao-p'ing, and many other leaders disappeared fromview, but the policies for which they were castigated hardly weak-ened. A decade later, denigration of professional expertise,contempt for foreign technology, schools without examinations,and other "newborn things" prescribed for the economy duringthe Cultural Revolution are forgotten in China. They live on onlyin the nostalgic writings of foreign enthusiasts.
Organization of the Book
The following chapters present the results of a detailed study ofeconomic growth and employment in China. Discussion in Chap-ter Two provides a quantitative picture of China's population, la-bor force, and patterns of sectoral employment in two benchmarkyears, 1957 and 1975. The results show that, despite rapid growth,the nonfarm sectors of China's economy could not absorb morethan a fraction of new entrants into the labor force between 1957and 1975. Chapter Three constitutes an investigation of the de-terminants of employment growth in industry, the largest andfastest-growing sector of China's economy. Chapter Four containsa detailed investigation of how China's agricultural sector, bur-dened with a fixed land base and an already unfavorable man-landratio, succeeded in absorbing nearly 100 million new workers dur-ing 1957-75 while providing added employment opportunities forthe existing labor force. The results show that this enormous taskof labor absorption was accomplished only at the cost of sub-stantial declines in both labor productivity and total factor produc-tivity in agriculture. Chapter Five presents a summary of the find-ings of the study, considers the future balance between labor sup-ply and demand in China's economy, and briefly discusses thetransferability of Chinese economic patterns to other developingnations. Three appendices discuss the reliability of Chinese eco-nomic data and provide statistical background for Chapters Twoand Three.
Chapter Two
Size and Sectoral Distribution of China'sLabor Force in 1957 and 1975
ESTIMATES OF THE SIZE AND SECTORAL ATTACHMENT of China's laborforce in the benchmark years 1957 and 1975 are based on in-complete data and of necessity incorporate a variety of assump-tions. The results nonetheless indicate the character of the generaltrends in both the size and the sectoral distribution of this laborforce.
The Population of China
Demographers have argued for many years about the size ofChina's population. Before a direct examination of the labor forceis possible, it is necessary to come to some general notion of thesize of the population and to evaluate the various sets of conflict-ing statistics.
Recent reports of remarkably low birthrates and low rates ofnatural increase for individual urban neighborhoods, rural com-munes, major cities, and individual provinces have heightenedthe interest of foreign observers in obtaining accurate informationabout China's population.' The Chinese authorities, however,
1. Recent studies of China's population include John S. Aird, "PopulationGrowth in the People's Republic of China," in U.S. Congress, Joint EconomicCommittee, Chinese Economy Post-Mao (Washington, D.C.: U.S. Government Print-ing Office, 1978), vol. 1, pp. 439-75; Leo A. Orleans, Every Fifth Child: The Population
19
20 ECONOMIC GROWTH AND EMPLOYMENT IN CHINA
have not issued systematic demographic information since the late1950s, because either they prefer not to publicize population sta-tistics or, as was stated in a remarkable interview by Deputy Pre-mier Li Hsien-nien, Peking itself does not possess good estimatesof China's total population. 2
Available population data from Chinese sources are shown inTable 2-1. The figures for the 1950s are based on the census of 1953.Although some observers have questioned the validity of the 1953figures, independent studies have invariably taken them as thestarting point for estimating population figures for later years. Thedata for 1964 and 1972 were released without detailed descriptionsof how they were derived; perhaps the figures for both years areestimates of the 1964 population. The figure for 1976 is the sum ofrecently published population figures for China's provinces andmajor municipalities.
These data are generally plausible, but John Aird's detailed cri-tique leads him to conclude that the recent totals, along with thedata relating to 1964 and 1972, understate the actual population bya substantial margin. Szechwan, China's most populous province,offers the clearest example of implausibly low figures. Szechwan isnot cited as a leader in efforts at birth control and has not experi-enced large outmigrations, but the recently reported total of 90million inhabitants suggests the unbelievably low rate of naturalincrease of only 1.17 percent a year between 1957 and 1977.3
of China (Stanford, Calif.: Stanford University Press, 1972); H. Yuan Tien, China'sPopulation Struggle (Columbus: Ohio State University Press, 1973); and JudithBanister, "China's Demographic Transition in the Asian Context," in "The CurrentVital Rates and Population Size of the People's Republic of China and Its Prov-inces" (Ph.D. dissertation, Food Research Institute, Stanford University, 1977).
2. The following statements are reproduced from Li's 1971 interview with anArab newsman in A. Doak Barnett, Uncertain Passage (Washington, D.C.: Brook-ings Institution, 1974), p. 166: "Some people estimate the population of China at800 million and some at 750 million. Unfortunately, there are no accurate statisticsin this connection. Nevertheless, the officials at the supply and grain departmentare saying confidently, 'The number is 800 million people.' Officials outside thegrain department say the population is '750 million only,' while the Ministry ofCommerce insists on the bigger number in order to be able to provide goods inlarge quantities. The planning men reduce the figure in order to strike a balance inthe plans of the various state departments."
3. John S. Aird, "Recent Provincial Population Figures," China Quarterly, no. 73(1978), pp. 1-44; the Szechwan figure is from p. 24.
SIZE AND SECTORAL DISTRIBUTION OF CHINA'S LABOR FORCE 21
TABLE 2-1. ESTIMATED POPULATION OF THE PEOPLE'S REPUBLIC OF CHINA,
SELECTED YEARS, 1952-78(millions of persons as of January 1)
n.a. Not available.a. These data are rumors concerning the possible outcome of a population investigation in
1964.b. These data are from Shih-chieh ti-t'u ts'e [World Atlas] (Peking: Ti-t'u ch'u-pan she, Feb-
ruary and December 1972). See John S. Aird, "Recent Provincial Population Figures," ChinaQuarterly, no. 73 (1978), p. 16.
Sources: Chinese reports for 1952-57, Nai-ruenn Chen, Chinese Economic Statistics (Chicago: Al-dine, 1967), p. 124; for 1964 and 1974, John S. Aird, Population Estimates for the Provinces of thePeople's Republic of China: 1953 to 1974 (Washington, D.C.: U.S. Department of Commerce, 1974),p. 6, and "Recent Provincial Population Figures," China Quarterly, no. 73 (1978); pp. 15-16; for1974-78, figures are the sum of reported provincial population totals as adjusted to midyear 1976by Aird, "Recent Provincial Population Figures," p. 27, and projected forward and backward atan annual rate of 2 percent, "the figure cited repeatedly by Chinese authorities as the averageannual growth rate of the population" (Aird, ibid., p. 27). Aird estimates for 2952, U.S. NationalForeign Assessment Center, China: Economic Indicators (Washington, D.C.: Central IntelligenceAgency, 1978), p. 6; remaining figures, John S. Aird, "Population Growth in the People's Repub-lic of China," in U.S. Congress, Joint Economic Committee, Chinese Economy Post-Mao (Wash-ington, D.C.: U.S. Government Printing Office, 1978), p. 465. Aird's intermediate model isused here. Banister estimates, Judith Banister, "China's Demographic Transition in the AsianContext," in "The Current Vital Rates and Population Size of the People's Republic of Chinaand Its Provinces" (Ph.D. dissertation, Food Research Institute, Stanford University, 1977).Orleans estimates, Leo A. Orleans, "China's Population: Can the Contradictions be Resolved?"in U.S. Congress, Joint Economic Committee, China: A Reassessment of the Economy (Washing-ton, D.C.: U.S. Government Printing Office, 1975), p. 77.
22 ECONOMIC GROWTH AND EMPLOYMENT IN CHINA
Aird has long argued that the census of 1953 resulted in an un-dercount and that subsequent Chinese statements have continuedto understate actual population size by a considerable margin.Building on an exhaustive review of available demographic infor-mation, Aird has attempted to estimate the size and structure ofChina's population by means of three statistical models incorpo-rating assumptions that imply high, intermediate, and low rates ofpopulation growth.4 The results generated by the intermediatemodel fit well with recent Chinese statements concerning size ofpopulation. The population figures predicted by Aird's inter-mediate model are shown in Table 2-1, together with series com-piled by other outside observers who regard Aird's population es-timates as too high.
Recent Chinese statements provide an opportunity to test thesecompeting estimates for consistency with other types of data.Leading officials often refer to population totals in round num-bers. For years the figure 800 million appeared in Chinese mediareports and interviews with visitors. But in 1978, Chinese officialsbegan to mention a total of 900 million, and then, in a November 1conversation between Deputy Premier Teng Hsiao-p'ing and Ital-ian Foreign Trade Minister Renaldo Ossala, referred to a roundfigure of "1 billion Chinese." These developments supportAird's estimates; they are not consistent with the competing se-ries, especially the low figures advanced by Leo Orleans, ColinClark, and several U.S. and U.N. agencies. 5
Age distribution is another area in which limited verification ofthe total population figure is now possible. In 1977, China's pri-mary schools were reported to have enrolled 146,164,200 pupils, or95.5 percent of the school-age population. 6 The implied figure of153 million boys and girls in the primary school age group of from7 to 12 years fits well with Aird's intermediate and high popu-
4. The methodology and assumptions underlying these models are discussedin Aird, "Population Growth in the People's Republic of China," pp. 457-65.
5. Recent Chinese statements are from John Aird, personal communication,and from his "Population Growth in the People's Republic of China," pp. 455-57.The low population estimates, which appear to have little foundation beyond theintuition of their authors, are listed in Aird, "Recent Provincial Population Fig-ures," pp. 36-38.
6. Peking Review, no. 36 (1978), p. 15.
SIZE AND SECTORAL DISTRIBUTION OF CHINA'S LABOR FORCE 23
lation models, which yield figures of 148 and 156 million childrenin the relevant age group for 1977.7 Although Aird's is the onlyavailable estimate of age distribution, the lower population esti-mates shown in other sources appear inconsistent with recent Chi-nese statements about school attendance.
Foodgrain supply is another area in relation to which the plau-sibility of competing population estimates can be assessed. HuCh'iao-mu, the president of China's newly established Academyof Social Sciences, reports that "[i]n 1977, the average amount ofgrain per capita in the nation was the same as the 1955 level; inother words the growth of grain production was only about equalto the population growth plus the increase in grain requirementsfor industrial and other uses."8 Although information is lackingabout the "industrial and other uses" of grain, a category thatpresumably includes such items as fodder and losses in flour mill-ing, widespread agreement that China's grain harvest remainedstagnant at approximately 285 million tons during 1975-77 allowscomparison of the grain-supply implications of alternative popu-lation estimates with Hu's assertion that per capita output andavailability of foodgrains did not change between 1955 and 1977.
This is done in Table 2-2, in which the calculations show thatHu's observations fit best with the higher population figures.Aird's population series produces changes of only 2 percent in percapita grain production and supply between 1955 and 1977. Lowerpopulation figures produce larger deviations from constant percapita production and supply. The inconsistency with Hu's obser-vations increases as the assumed figures for the 1977 populationdecline. Orleans' figures, for example, imply increases of 9 percentand 14 percent, respectively, in per capita production and avail-ability of foodgrains between 1955 and 1977.
None of these comparisons is conclusive, but together they con-sistently support Aird's view that China's actual population must
7. John Aird, personal communication. China has begun to shift from a six-year program of primary education for children aged 7 to 12 inclusive to a five-yearprogram for children aged 6 to 10. To the extent that the new system was already inplace during 1977, the 153 million figure refers to a narrower age cohort and thusimplies a population larger than Aird's estimate.
8. Hu Ch'iao-mu, "Observe Economic Laws, Speed Up the Four Modern-izations," Peking Review, no. 47 (1978), p. 18.
24 ECONOMIC GROWTH AND EMPLOYMENT IN CHINA
TABLE 2-2. GRAIN PRODUCTION AND SUPPLY PER CAPITA, 1955 AND 1977
Grain availability per capita
Year-end Production Supplypopulation
Authority Year (millions) Kilograms Index Kilograms Index
n.a. Not available.Sources: Population, Table 2-1. Grain production, Robert M. Field and James A. Kilpatrick,
"Chinese Grain Production: An Interpretation of the Data," China Quarterly, no. 74 (1978), p.380, estimate grain output at 180 million tons for 1955 and 285 million tons for 1977. Grainsupply, sum of grain production and net imports. In 1955, China had an export balance of 3million tons of grain (average of figures for 1954/55 and 1955/56 shown in Nai-ruenn Chen,Chinese Economic Statistics, p. 408). In 1977 net grain imports were 6 million tons (average offigures for 1976/77 and 1977/78 shown in China Business Review, vol. 5, no. 5 [19781, p. 54).
substantially exceed the sum of recently published provincial to-tals, which amount to approximately 900 million persons as ofearly 1975 (Table 2-1). In comparison with alternative reconstruc-tions, Aird's intermediate model represents the most plausiblepicture of China's population size and structure. This model pro-vides the starting point from which estimates of China's laborforce are made below. Alternative estimates are derived from the1975 population figures presented in Chinese sources and summa-rized in Table 2-1. Fortunately, it will be possible to show that theprincipal conclusions concerning the growth of China's laborforce, the distribution of new entrants into the labor force betweenfarm and nonfarm occupations, and the balance between laborsupply and demand are not crucially dependent upon the choice ofpopulation data.
Urban Population
In view of the emphasis placed on rural development in Chinesepolicy statements, it is important to obtain a rough quantitative
SIZE AND SECTORAL DISTRIBUTION OF CHINA'S LABOR FORCE 25
indication of recent trends in urbanization. Chinese literature ofthe 1950s provides the following definitions of urban areas.9
All urban agglomerations with 100,000 or more inhabitants aremunicipalities or cities. Smaller cities may also be placed in thiscategory if they are industrial or mining centers, seats of impor-tant administrative or transport activities, or key nodes withinborder regions. Towns are smaller urban agglomerations with2,000 or more inhabitants, of whom at least half are engaged innonagricultural pursuits. Places with populations of as small as1,000 persons may also become towns if 75 percent of the populaceis nonagricultural and if they are centers of nonfarm economic ac-tivity. Urban places are therefore agglomerations with popu-lations of over 2,000 (and in some cases, 1,000), of whom the ma-jority are engaged in nonfarm pursuits.
In 1953 the total population of China's 164 municipalities was52.4 million, of which 83 percent was urban and 17 percent rural(that is, the farming population of city suburbs). The total urbanpopulation was 77.7 million. By 1958 the number of municipalitieshad increased to 185, and their combined population had sur-passed 70 million. ' 0 Total urban population reached 92 million bythe end of 1957 and undoubtedly surpassed 100 million during1958.11
IPolicy statements emphasizing the primacy of rural develop-ment and the well-publicized program of compulsory migration tothe countryside for urban school graduates have created the im-
9. This and the following paragraph are based on Morris B. Ullman, Cities ofMainland China: 1953 and 1958, International Population Reports Series P-95, no. 59,(Washington, D.C.: U.S. Department of Commerce, 1961), chap. 2.
10. Ullman's figures (Cities of Mainland China, pp. 35-36) imply a minimum of69.5 million. Since this calculation makes use of earlier data when the 1958 figuresare not available, the correct figure must be higher.
11. The 1957 total is from Ullman, Cities of Mainland China, p. 7. Orleans, EveryFifth Child, p. 65, states that "it was commonly reported (and usually accepted) thatthe urban population of China increased by some twenty million persons duringthe Great Leap, over a 1957 figure of almost ninety million. Some estimates ofurban population in 1959 ran as high as 130 million." One source gives a 1957figure of 99.5 million; see John S. Aird, "Population Growth and Distribution inMainland China," in U.S. Congress, Joint Economic Committee, An Economic Pro-file of Mainland China (Washington, D.C.: U.S. Government Printing Office, 1967),vol. 2, p. 381.
26 ECONOMIC GROWTH AND EMPLOYMENT IN CHINA
pression that China's urban population may have stopped grow-
ing during the 1960s and 1970s.' 2 This is not the case. Data forfifty-five cities that accounted for nearly three-fourths of the totalpopulation of China's municipalities in 1953 indicate an expan-sion of from 44 to 68 percent between 1958 and the mid-1970s;these figures are compiled in Table 2-3. In addition, statementssuch as the following indicate that smaller urban areas have alsoexpanded, perhaps more rapidly than the larger cities for whichdata are most readily available: "China has built up many smallcities and towns in outlying and sparsely populated places, in theinterior and in border and minority nationality areas which nowhave their own industry. The capitals of many provinces and auto-nomous regions and many county seats have become industrialcities of varying sizes.... New China puts stress on buildingsmall and medium cities."1' 3 Furthermore, new cities have ap-peared: only thirteen of twenty-nine cities described in a 1974pamphlet entitled "Newly Brilliant Cities of the Fatherland" werelisted as municipalities in 1958.14
The conclusion of this survey is that China's urban populationhas increased substantially since 1958. The data for fifty-five cities,most of them large, indicate overall growth of from 44 to 68 percentbetween 1958 and 1975; since smaller cities may have grown morerapidly than larger urban areas, national urban population growthis probably near or even above the upper end of this range. Giventhe near certainty that China's urban population surpassed 100million during 1958 and grew by at least two-thirds between 1958and 1975, an assumption of an urban population of some 175 mil-lion persons for 1975 is not unrealistic. This figure implies that theproportion of urban dwellers to total national population has risenfrom 13 percent in 1953 and 14 percent in 1957 to slightly under 19percent in 1975.
12. Pi-chao Chen, "Overurbanization, Rustication of Urban-Educated Youths,and Politics of Rural Transformation," Comparative Politics (April 1972), pp. 373-74,cites statements indicating that Chinese officials may have hoped to stabilize theurban population at 110 million during the mid-1960s.
13. BBc, no. W899 (1976), p. Al.14. Tsu-kuo hsin-kuang ch'eng-shih [Newly Brilliant Cities of The Fatherland]
(Shanghai: Jen-min ch'u-pan she, 1974).
SIZE AND SECTORAL DISTRIBUTION OF CHINA'S LABOR FORCE 27
TABLE 2-3. POPULATION OF CHINESE CITIES, 1953, 1957, AND MID-1970s(thousands of persons)
Mid-1970s
Low HighProvince and city 1953 1957 estimate estimate
Sources: For 1953 and 1957; Morris B. Ullman, Cities of Mainland China: 1953 and 1958 (Wash-ington, D.C.: U.S. Department of Commerce, 1961), pp. 35-36, and Nai-ruenn Chen, ChineseEconomic Statistics, pp. 129-30. For the mid-1970s; based on a variety of published sources andtravelers' reports. The figures are not all for the same year; data closest to 1975 were used whenseveral figures were found. When there are two figures for a single city, the lower figure oftenrefers to the urban area only, whereas the higher figure includes suburban and rural areasadministered by city govemments.
SIZE AND SECTORAL DISTRIBUTION OF CHINA'S LABOR FORCE 29
Participation Rates in the Labor Force-Urban
Available information on employment rates among urban resi-dents is compiled in Table 2-4. The population-weighted averageof employment rates for four major urban areas during the 1950s iscalculated at 33.3 percent, which is nearly identical with the figureof 32.6 percent compiled from a national sample survey conductedin 1956. It can therefore be assumed with reasonable confidencethat approximately 33 percent of urban residents were employedin 1957. Since unemployment is estimated below at roughly 8.5percent of the urban population, urban labor force participationfor 1957 amounted to approximately 41.5 percent of the urban pop-ulation.
Repeated campaigns to resettle idle town dwellers in the coun-tryside and the emergence of new employment opportunities forurban housewives in neighborhood industries lead to the ex-pectation that both employment rates and participation ratesshould be higher in urban areas for the 1970s than for the 1950s.1 5
This expectation is confirmed by the data in Table 2-4, which showthat employment rates in Nanking and Shanghai jumped fromabout 33 percent to more than 50 percent between the late 1950sand the mid-1970s.16 Survey results summarized in Table 2-4show that urban employment rates of 50 percent or higher arecommon except in mining centers, where women find only limited
15. Christopher Howe, Employment and Economic Growth in Urban China, 1949-1957 (Cambridge, England: Cambridge University Press, 1971), p. 39, estimatesopen unemployment in 1957 at 670,000 for Shanghai alone. Chinese observers mea-sured what they called the "temporary and floating" populations of the cities in themillions; see sCMP, no. 1,764 (1958), p. 39. A typical report on neighborhood indus-tries states that "women dependents of workers and staff of plants, mines andother enterprises in Sining Municipality had set up 93 factories by the end of 1975with over 9,200 women dependents working in them" (BBc, no. W878 [1976],p. A6). For further discussion, see James B. Stepanek, "Planning of Urban Small-Scale Industry in China" (paper presented at a conference on "Regionalism andEconomic Development in China: Historical and South Asian Comparative Per-spectives," Philadelphia, January 20-21, 1978).
16. David M. Brown of the University of Toronto has obtained time series datafor employees as a percentage of Nanking's nonagricultural population. The per-centage rises from 25.7 percent in 1953 to 36.2 percent in 1964 and 50.6 percent in1974.
30 ECONOMIC GROWTH AND EMPLOYMENT IN CHINA
TABLE 2-4. EMPLOYED POPULATION AS A PERCENTAGE OF URBAN
POPULATION, THE 1950s AND 1974 AND 1975
Population,Percentage 1958
City employed (thousands)
Data for the 1950sCanton 25.0 1,867Lushun-Talien 32.5 1,590Nanking-Wuhsi 33.2 2,071Shanghai 35.8 6,977Weighted average of above cities' 33.3 -
National urban sample survey, 1956 32.6 -
Datafor 1974 and 1975Nankingb 50.6 1,296Shanghai, 52.6 5,700Survey of 150 citiesd
Comprehensive centers 50-55 n.a.County towns 50-60 n.a.Industrial centers 50 n.a.Mining centers 35-45 n.a.Regional transport and communication centers 50-55 n.a.Special function cities 40 n.a.
n.a. Not available.a. Weighted average using population figures for 1958 as weights.b. Data refer to the nonagricultural population of Nanking.c. Data appear to exclude Shanghai's farm population.d. These data come from a survey in 1975 of 150 cities in eastem China from Heilungkiang
to Fukien; 85 cities were taken as representative for purposes of compiling these figures.Sources: Data for the 1950s, Chnstopher Howe, Employment and Economic Growth in Urban
China (Cambridge, England: Cambridge University Press, 1971), p. 44. Data for 1974 and 1975,for Shanghai, BBC, no. W792 (1974), A4; remaining data were supplied by David M. Brown,University of Toronto, from lecture notes taken at the Department of Geography, University ofNanking, May 24, 1978.
employment opportunities, and in cities performing unspecified"special functions." On the basis of these data, an employmentrate of 50 percent can be assumed for urban residents in 1975.Since unemployment in 1975 appears limited to less than 1 percentof the urban population (Table 2-7, below), this figure also pro-vides an estimate of participation in the urban labor force in 1975.
Participation Rates in the Labor Force-Rural
Open unemployment does not appear as part of the Chinese ruralscene either before or after 1949. Underutilization of labor does
SIZE AND SECTORAL DISTRIBUTION OF CHINA'S LABOR FORCE 31
exist, however, mainly in the form of seasonal idleness. Underthese circumstances, participation and employment rates are in-distinguishable, and the number of workdays per man-year be-comes the most useful indicator of the balance between the supplyand demand for labor.
Participation rates in the rural labor force are difficult to mea-sure. Chinese communes do not appear to use a clear and consis-tent definition of "labor force." When questioned by visitors,commune representatives cannot explain the precise meaning ofstatements such as "this commune has a population of 55,000 anda labor force (lao-tung-li) of 22,000."1" Although some communesinclude part-time workers as fractional members of their laborforce, it appears that the term "labor force" usually refers to thenumber of commune members who regularly earn work points(used to compute year-end shares of collective income) in collec-tive activities; and that occasional participants such as house-wives, old people, and students who work only during intervals ofpeak labor demand are typically excluded from enumeration aspart of the rural labor force. As will be seen, however, employedpersons can work more or fewer days each year, a fact that createsfurther problems of measurement.
Despite these uncertainties, available data on labor force as apercentage of rural population fall consistently in the neighbor-hood of 45 percent. Peter Schran's review of rural surveys showedthat the share of employed persons in China's peasant populationwas approximately 46 to 48 percent during both the 1930s and the1950s.18 Extreme labor mobilization associated with the GreatLeap Forward (1958-60) undoubtedly increased these rates, butonly temporarily.
S.J. Burki's survey of thirteen communes in 1965 found that 40.2percent of the 287,111 inhabitants were classified as "able-bodiedworkers." In addition, at least one unit had released workers to
17. This was the impression of the American Rural Small-Scale Industry Dele-gation sponsored by the Committee on Scholarly Communication with thePeople's Republic of China, National Academy of Sciences, of which the authorwas a member. This group visited China during June and July 1975.
18. Peter Schran, 7he Development of Chinese Agriculture, 1950-1959 (Urbana:University of Illinois Press, 1969), p. 53.
32 ECONOMIC GROWTH AND EMPLOYMENT IN CHINA
TABLE 2-5. POPULATION, LABOR FORCE, AND LABOR FORCE PARTICIPATIONIN SELECTED RURAL AREAS, 1975
ParticipationLocality Population Labor force rate (percent)
County and provinceHsiyang (Shansi) 200,000 78,000 39.0Wuhsi (Kiangsu) 900,000 350,000 38.9
Total for county data 1,100,000 428,000 38.9
Commune or brigade (county and province)Anp'ing commune (Hsiyang) 10,000 3,800 38.0Ch'iliying commune (Hsinhsiang,
Honan) 55,000 30,000 54.5Holei commune (Wuhsi) 15,002 7,000 46.7Kaochuang commune (Hui, Honan) 42,000 13,000 20.9Malu commune (Chiating, Shanghai) 28,000 18,000 64.3Meits'un commune (Wuhsi) 38,817 10,200 33.1Shihp'in brigade (Hsiyang) 1,970 640 32.5Yangshih commune (Wuhsi) 22,000 10,500 47.7
Total for commune and brigades 204,789 93,140 45.5
Combined total' 1,225,000 489,000 39.9
a. Commune and brigade units located in Hsiyang and Wuhsi counties are excluded fromthese totals to avoid double counting.
Source: Author's trip notes as a member of the Rural Small-Scale Industry Delegation, June-July 1975.
urban employers. These were excluded from enumeration amongthe commune's labor force but apparently were included in thepopulation total, thus imparting a downward bias to the 40.2 per-cent overall participation rate.' 9
Data collected by the Rural Small-Scale Industries Delegation in
1975 appear in Table 2-5. Participation rates for several communes
and brigades average out to 45.5 percent; figures for two countiesgive rates slightly below 40 percent. These data, like Burki's, maycontain a downward bias because of the temporary migration ofcommune members to nearby cities. This is especially likely in thesuburban communes located near industrial centers such asShanghai and Wusih. Labor force data for eight units observed bya Wheat Studies group that visited China in 1976 show an average
19. Shahid Javed Burki, A Study of Chinese Communes, 1965 (Cambridge, Mass.:East Asian Research Center, Harvard University, 1969), pp. 50-97.
SIZE AND SECTORAL DISTRIBUTION OF CHINA'S LABOR FORCE 33
TABLE 2-6. RURAL POPULATION AND EMPLOYMENT, BY SEX, 1957 AND 1975(millions of persons)
1957 1975
Category Total Male Female Total Male Female
1. National population 632.7 319.4 313.3 933.7 469.7 464.02. Rural population
A. Total 540.7 273.0 267.7 758.7 381.6 377.1B. Working age 263.1 137.9 125.2 368.7 193.2 175.5
3. Rural employmentA. Total 243.3 137.9 105.4 341.4 193.2 148.2B. Sex composition
(percent) 100.0 56.7 43.3 100.0 56.6 43.44. Working-age population
A. Percent employed 92.5 100.0 84.2 92.6 100.0 84.4B. Percent not employed 7.5 0 15.8 7.4 0 15.6
5. Rural births per nonworkingfemale of working age 0.97 0.83
Sources: Line 1, unpublished worksheet provided by John S. Aird, intermediate model,January 1. Line 2A, derived by subtracting estimated urban population (92 million in 1957, 175million in 1975) from the total and applying the national sex ratio to the rural populace. Line 2B,derived by assuming that rural age structure is identical with the national figures shown inAird's worksheet. In this analysis Aird defines the working-age population to include malesaged 16 to 55 years and females aged 16 to 50 years. Line 3A, rural labor force is assumed to be45 percent of rural population (see text). AU working age males are assumed to be employed.Female employment is derived as a residual. Line 4A, quotient of lines 3A and 2B expressed inpercentages. Line 5, total births are calculated from the estimated number of births per thou-sand persons shown in John S. Aird, "Population Growth in the People's Republic of China,"p. 467, and the population totals in line 1. The share of rural areas in total births is assumed toequal their share in total population.
participation rate of 42.8 percent for a population of just under150,000 persons.2 0
These fragmentary data give the impression that rural participa-tion rates in the mid-1970s are not significantly different fromthose of the 1950s and suggest a rural participation rate of 45 per-cent for both 1957 and 1975. In view of the widespread impressionthat collectivization has raised female participation rates in thecountryside, this may be seen as a surprising conclusion. Table 2-6
20. Calculated from Virgil A. Johnson and Halsey L. Beemer, Jr., eds., Wheat inthe People's Republic of China (Washington, D.C.: National Academy of Sciences,1977), p. 157.
34 ECONOMIC GROWTH AND EMPLOYMENT IN CHINA
explores the implications of this result for the sex composition ofthe rural labor force in 1957 and 1975. With use of Aird's estimatesof age and sex structure, employment figures for rural females arecalculated as residuals on the basis of a 45 percent overall partici-pation rate by assuming that all males of working age (16 to 55years) are employed. Although this assumption overstates the pro-portion of male employment, the resulting employment figures forfemales are high. For both 1957 and 1975, a 45 percent overall par-ticipation rate implies that no fewer than 84 percent of rural fe-males aged from 16 to 50 years were regularly employed. 21 Sincethe number of nonworking females of working age correspondsclosely with the number of rural births in both years, it is evidentthat female participation rates were already near their natural limitduring the 1950s. A rural participation rate of 45 percent for both1957 and 1975 carries no unacceptable implications with regard tothe sex composition of the rural work force. This 45 percent rateis therefore applied both to 1957 and 1975 rural population totals.
The Total Labor Force
The foregoing discussion makes it possible to construct estimatesof China's urban, rural, and overall labor force in the benchmarkyears 1957 and 1975. The results appear in Table 2-7. These calcu-lations use the figures for national and urban population and forurban and rural participation rates obtained in the manner de-scribed above; rural population is derived as a residual by sub-tracting the urban from the national population totals.
Although open unemployment does not appear as a significantphenomenon in rural China, urban unemployment does exist. Inthe absence of comprehensive data, assumptions regarding itsmagnitude are needed to complete the task of estimating the sizeof the labor force. The discussion in Chapters One and Five sug-gests that open urban unemployment amounted to no more than 1million persons during 1975. If one works backwards from 1975 by
21. Marina Thorborg, "Chinese Employment Policy in 1949-78 with SpecialEmphasis on Women in Rural Production," in U.S. Congress, Joint EconomicCommittee, Chinese Economy Post-Mao, vol. 1, cites reports indicating that from 65to 80 percent of working age rural women were employed in agriculture during1956 and 1957 (pp. 572-73) and guesses at a comparable figure of 70 percent in 1974(p. 584).
SIZE AND SECTORAL DISTRIBUTION OF CHINA'S LABOR FORCE 35
TABLE 2-7. ESTIMATES OF CHINA'S LABOR FORCE, 1957 AND 1975
(millions of persons)
Version A Version B
Category 1957 1975 1957 1975
Total population 628 898 633 934Urban sector
Population 92 175 92 175Percent employed 33 50 33 50
Percent share in increase 62.6 66.1Total 134.5 148.5
Average annual labor force increase,1957-75 (percent)Urban 4.8 4.8Rural 1.7 1.9Total 2.2 2.4
Sources: Tables 2-1 and 2-6 and discussion in the text.
assuming that half of the increase in urban employment rates be-tween 1957 and 1975 was the result of reduced levels of in-voluntary unemployment, urban unemployment during 1957 maybe calculated as 8.5 percent of the urban population. This is anarbitrary assumption, and the resulting figure represents no morethan a guess that is intended to give some idea of the order ofmagnitude of urban unemployment during 1957.
With these assumptions, two sets of labor force estimates canbe obtained from the alternative population series shown in Table2-1. Version A, based on population figures given in Chinesesources, shows that the labor force rose by 134.5 million, or 48percent, between 1957 and 1975, with 63 percent of the incrementoccurring in rural areas. Version B, based on Aird's populationestimates-which, it will be recalled, are thought to give a more
36 ECONOMIC GROWTH AND EMPLOYMENT IN CHINA
realistic picture of actual demographic conditions-shows a laborforce increment of 148.5 million, or 52 percent, between 1957 and1975, with 66 percent of the increment occurring in rural areas.
Although the results shown in Table 2-7 incorporate a variety ofassumptions, some of which undoubtedly contain significant er-rors, several conclusions can be drawn from the data that do notappear sensitive either to possible errors in assumptions or to var-iations between the underlying population figures. The broad ac-curacy of the labor force estimates for 1957 is confirmed by an ar-ticle in which a vice chairman of the State Planning Commissionsays that the number of labor force units in 1957 was approximate-ly 260 million, or within 10 percent of either of the estimatesshown in Table 2-7.22
These results show that between 1957 and 1975, China's laborforce rose at a rate equal to, or perhaps slightly greater than, therate of population growth. This rise produced a large increase inthe supply of labor, most of which occurred in the countryside.Given the absence of large-scale open unemployment in either ur-ban or rural areas during the 1970s, there can be no doubt thatemployment opportunities have also risen substantially between1957 and the mid-1970s, and that the increase in demand for laborhas also included a large rural component. The data in Table 2-7point strongly to the conclusion that China's farm sector absorbedvery large numbers of new workers between 1957 and 1975. Thisimplication is confirmed by estimates of the level and growth ofnonagricultural employment.
Nonagricultural Employment
Estimates of nonagricultural employment in 1957 and 1975 areshown in Table 2-8. The derivation of these figures, which excludepart-time employees and workers in farmland capital construction(such as land leveling, reclamation, and terracing) and water con-servancy projects, is explained in Appendix B. Although these re-sults incorporate a variety of assumptions, they appear to provide
22. Wang Kuang-wei, "How to Organize Agricultural Labor Power," Chi-huaching-chi [Planned Economy], no. 8 (1957), translated in EcMM, no. 100 (1958), p. 12.
SIZE AND SECTORAL DISTRIBUTION OF CHINA'S LABOR FORCE 37
reasonable approximations to the actual numbers of workers inthe nonagricultural branches of China's economy. A 1978 reportindicating that the number of "workers and employees"-a cate-gory that includes "personnel of enterprises owned by the wholepeople [that is, state enterprises] . . . as well as those who drawwages from the government"-was approximately 90 millionchecks closely with the 1975 figure of eighty-eight and eight-tenthsmillion workers and employees derived in Table B-1.23 Another
TABLE 2-8. NONAGRICULTURAL RURAL EMPLOYMENT, 1957 AND 1975(millions of persons)
Sector 1957 1975
IndustryState sector, including utilities 8.0 25.0Collective 0 14.3Handicrafts 6.6 0.3
Construction8 1.9 6.5Transport, posts, and communication 4.4 8.9Trade, food and drink, finance, banking, and insurance 8.4 18.0Personal services 0.5 1.1Health 1.9 6.6Education and culture 2.7 7.6Government administration and mass organizations 2.9 6.2Salt 0.5 1.1Fishing 1.5 1.2Civilian nonagricultural employment 39.3 96.8Military personnel 3.0 3.5Total nonagricultural employment 42.3 100.3
a. Excludes employment in farmland improvement and water conservancy.Sources: For 1957, John P. Emerson, Nonagricultural Employment in Mainland China, 1949-1958
(Washington, D.C.: U.S. Government Printing Office, 1965), p. 128; and Ta-chung Liu andKung-chia Yeh, The Economy of the Chinese Mainland (Princeton, N.J.: Princeton UniversityPress, 1965), p. 209. For 1975, Appendix B.
23. The 1978 figure is from a statement by Teng Ying-ch'ao (the wife of the latepremier, Chou En-lai), who reported that the number of female workers and em-ployees had increased fifty times from the 1949 level of 600,000 and now accountedfor one-third of the national total, which would therefore be 0.6 50 3, or 90 million(FlIs, October 24, 1978, p. E2). The definition of workers and employees is fromCh'en Chih-ho, "The Question of Groups Included in Labor Force Statistics," Chi-hua yfi t'ung-chi [Planning and Statistics], no. 11 (1959), translated in John P. Emer-son, Nonagricultural Employment in Mainland China, 1949-1958 (Washington, D.C.:U.S. Government Printing Office, 1965), pp. 195-96. The estimated number ofworkers and employees for 1975 is shown in Table B-1.
38 ECONOMIC GROWTH AND EMPLOYMENT IN CHINA
1978 report states that "in all, 17 million commune members workin commune- and brigade-run enterprises." Since output of theseenterprises rose by 22 percent during 1975-76 and by 49.6 percentduring the first half of 1977, the figure of 17 million workers inrural collective industry seems consistent with the present esti-mate of 14.2 million workers in all collective industries for 1975.24
The Agricultural Labor Force and Employment
The estimates shown in Tables 2-7 and 2-8 permit derivation ofestimates of China's agricultural labor force in 1957 and 1975 bysubtracting nonagricultural employment and urban unemploy-ment from the overall labor force totals. Since open unemploymentappears to be a purely urban phenomenon, the categories "agri-cultural labor force" and "agricultural employment" are identical.This assumption, however, conceals possible changes in the annu-al number of days worked by agricultural laborers. This subject istaken up in Chapter Four, in which it is shown that the averagenumber of days worked is substantially higher, and the extent ofseasonal idleness correspondingly smaller, in 1975 than in 1957.
The figures for China's agricultural labor force presented inTable 2-9 amply confirm the expectation of large increases in farmemployment between 1957 and 1975. Because the calculations inversion B seem more realistic than those in version A and becauseof possible overestimation of nonagricultural employment in 1957(see Appendix B), it is entirely plausible to conclude that agricul-ture and subsidiary farming activities, farmland construction, andwater conservancy have among them absorbed nearly 100 millionnew workers between 1957 and 1975, representing an increase of42 percent in the agricultural work force (version B). The generalvalidity of these results, which indicate an agricultural work forceof from 313 to 329 million men and women in 1975, is confirmedby recent Chinese statements that "some 300 million able-bodied
24. The 1978 report of employment and of output growth for 1975176 (fifteenprovinces only) and for 1976/77 is in F1is, January 6, 1978, p. E17.
SIZE AND SECTORAL DISTRIBUTION OF CHINA'S LABOR FORCE 39
TABLE 2-9. THE AGRICULTURAL LABOR FORCE, 1957 AND 1975
people take part in agricultural production" and that "our countryhas an agricultural labor force of 300 million people."2 5
The annual growth rate of either 1.7 or 2.0 percent implied inthese figures is high by recent international standards. Regionaldata for developing countries covering the period 1950-70 showthat only eastern Africa experienced so rapid an expansion of itsagricultural labor force. In South Asia, where man-land ratiosmore closely resemble those in China, the agricultural work forcegrew at estimated yearly rates of 0.81 percent during 1950-60 and1.16 percent during 1960-70.26 This comparison shows that thechallenge of agricultural labor absorption in China was large inrelative as well as absolute terms.
How has China's agricultural sector managed to absorb nearly100 million new workers within a period of less than two decades?This question provides the focus for Chapter Four. Before probinginto that question, however, the subject of industrial employmentdeserves attention, since industry is the sector responsible for the
25. FBss, October 4, 1978, p. E18, and August 15, 1978, p. E21.26. World Bank, Development Issues in Rural Non-farm Employment (Washington,
1977), Table A-2. Note that the absence of major shifts in the sex composition of
40 ECONOMIC GROWTH AND EMPLOYMENT IN CHINA
largest single increment in nonagricultural employment in theyears after 1957.
China's rural labor force (Table 2-6) and the age structure of the entire population(John S. Aird, "Population Growth in the People's Republic of China," pp. 468-73)indicates that conversion of the present labor force figures to man-equivalentswould not substantially alter the conclusions reached in the text.
Chapter Three
Determinants of Industrial Employment
RAPID EXPANSION OF THE SIZE and technological sophistication ofthe industrial sector has been an outstanding feature of China'seconomic growth since 1949. Industrial production has risen at anaverage annual rate of approximately 10 percent for three decades,and the share of industry in total national output, which stood at15 to 20 percent in the early 1950s, had risen to more than 40 per-cent in the early 1970s. Important changes have occurred in thestructure as well as the size of the industrial sector. Engineeringand petroleum have replaced textiles and food processing as thelargest contributors to value of output. Metallurgy and chemicalshave also enlarged their share of total output at the expense ofolder industries based on an earlier generation of raw materi-als.' Considerable insight into the effect of industrial growth on
1. The growth of industrial output is calculated from the estimates of the grossvalue of industrial output shown in Table 3-1. Output shares are taken from esti-mates of gross domestic product compiled in Dwight H. Perkins, "Issues in theEstimation of China's National Product," in Quantitative Measures of China's Econom-ic Output, ed. Alexander Eckstein (Ann Arbor: University of Michigan Press, forth-coming), Table 7. Gross output, which is called "global output" in some studies ofthe Soviet bloc countries, includes the value of intermediate goods consumed inthe production process and can therefore lead to highly misleading measures ofgrowth of industrial output. In the Soviet case, officially compiled gross- or global-value data typically grow more rapidly than industrial value added. Chinese gross-value figures, however, appear free of upward bias, and can therefore be used asindicators of the growth of value added in industry. For further discussion, seeThomas G. Rawski, "Chinese Industrial Production, 1952-1971," Review of Econom-ics and Statistics, vol. 55, no. 2 (1973), pp. 169-81, and "China's Industrial Perfor-mance, 1949-1973," in Quantitative Measures of China's Economic Output.
41
42 ECONOMIC GROWTH AND EMPLOYMENT IN CHINA
the size of China's industrial labor force can be gained, after abrief quantitative overview, by examining the political, tech-nological, and institutional determinants of industrial employ-ment.
Patterns of Industrial Employment, 1957-75
The estimates compiled in Table 2-8 indicate that industrial em-ployment nearly tripled between 1957 and 1975, with the numberof workers in manufacturing, mining, and utilities rising from lessthan 15 million to nearly 40 million in less than two decades. Inview of industry's great overall contribution to China's recent eco-nomic growth, it is not surprising to find that it accounts for alarge share of incremental nonagricultural employment. Data com-piled in Appendix B and summarized in Table 2-8 show that the-state sector of industry alone absorbed 29 percent of new non-agricultural employees during 1957-75. Employment in handi-crafts and in collective enterprises operated by rural communesand production brigades and by urban neighborhood groups ab-sorbed another 14 percent of new nonagricultural employees,bringing the combined share of state and collective industry inincremental nonagricultural employment to 43 percent during1957-75.
If, however, industrial job creation is related to the estimatedlabor force increment of 148.5 million persons (Table 2-7), its effectappears much smaller. New industrial employment absorbed only11 to 17 percent of estimated labor force growth during 1957-75,with the exact percentage depending on the definition of industry.If these figures are compared with industry's much larger share inincremental product, which amounted to approximately 59 per-cent for 1957-71, it becomes evident that in China, as in manyother developing nations, the effect of industrial expansion on em-ployment has been modest. 2
2. Industry's share in incremental product is calculated from Dwight H. Perk-ins, "Growth and Changing Structure of China's Twentieth-Century Economy," inChina's Modern Economy in Historical Perspective, ed. Dwight H. Perkins (Stanford,Calif.: Stanford University Press, 1975), p. 161.
DETERMINANTS OF INDUSTRIAL EMPLOYMENT 43
TABLE 3-1. NATIONAL AND SELECTED REGIONAL LABOR PRODUCTIVrrY
IN INDUSTRY, 1952-75
Industrial Gross outputValue of gross output employment per worker
Shanghai1955 9.047a. d 0.599n 15.1041975 55.707 2.3 24,220
Tientsin1955 2.853a d 0.157a 18,1721975 18.748 1.0 18,748
Note: Figures for 1952-57 are in 1952 prices; those for 1975 are in 1957 prices except forestimated output of the "Five Small Industries," which is based on 1952 prices. Comparisonbetween data in 1957 prices and earlier figures in 1952 prices understates actual growth ofoutput value or productivity.
a. These measures of output or employment specifically include a handicraft component.
b. Chang Ch'un-ch'iao, "On Exercising All-Round Dictatorship over the Bourgeoisie," Pe-king Review, vol. 14 (1975), p. 6, states that the output shares of state and collective industry for1973 were 86 and 14 percent of the industrial total. The same proportions are used to decom-pose output for 1975.
c. Obtained by applying the 30.4 percent rise in producer industry output estimated for1972-75 in U.S. National Foreign Assessment Center, China: Economic Indicators (Washington,D.C.: Central Intelligence Agency, 1977), p. 15, to the estimate for 1972 shown in Table 3-7.The term "five smaD industries" refers to the small-plant component of the following indus-tries: building materials, chemical fertilizer, energy (coal mining and hydropower), iron andsteel, and machinery.
d. Derived from data on the gross value of factory output, which exdudes handicrafts, byassuming that the ratio of total industrial output to factory output alone was the same for 1955as for 1956 or 1957.
Sources: Value of gross output, Robert M. Field, Nicholas R. Lardy, and John P. Emerson, AReconstruction of the Gross Value of Industrial Output by Province in the People's Republic of China:1949-73 (Washington, D.C.: U.S. Department of Commerce, 1975), pp. 6, 17, and 20-21; andProvincial Industrial Output in the People's Republic of China: 1949-75 (Washington, D.C.: U.S.Department of Commerce, 1976), pp. 11, 17, and 20. Employment, national total for 1952 is fromJohn P. Emerson, Nonagricultural Employment in Mainland China: 1949-1958 (Washington, D.C.:
44 ECONOMIC GROWTH AND EMPLOYMENT IN CHINA
TABLE 3-1 (continued)
U.S. Department of Commerce, 1965), p. 128; for 1957 and 1975, see Tables 2-8 and C-1. Provin-cial data for Liaoning and Shanghai are from Tables B-3 and B-4, for Peking and Tientsin, seeNai-ruenn Chen, Chinese Economic Statistics (Chicago: Aldine, 1967), p. 483; and Chung-kungyen-dnu [Studies on Chinese Communism], September 1976, p. 20.
Another aspect of the process of industrial job creation emergesfrom Table 3-1, which presents available national and regionaldata for industrial output, employment, and labor productivity.These figures reveal a strong upward trend in labor productivity.The most plausible explanation of this trend lies in the gradualprocess of industrial capital deepening that began with the influxof Soviet equipment and technology during the 1950s.
Although existing data relating to capital stock and investmentare sparse, the rough estimates presented in Table 3-2 for thegrowth of output, employment, and fixed assets in the producer-goods industries indicate a rapid increase in fixed assets perworker and after 1957 a parallel rise in the ratio of capital to grossoutput for the dominant sector of industry.3
The degree of labor intensity in Chinese industry remainsmuch higher. than in U.S., European, or Japanese industry, but thedirection of change is consistently toward substitution of capitalfor labor. This is evident even in rural industry, whose origins arelinked with the capital-saving policies associated with the GreatLeap Forward of 1958-60. After investigating approximately fiftyplants during the summer of 1975, an American Small-Scale Indus-try Delegation noted that "[t]ime and again we were told by factoryrepresentatives of the efforts they were making to eliminate man-ual, highly labor-intensive methods and to substitute mechanizedmethods. To some degree these modern methods seem to be de-sired for their own sake, but often the firm appeared to be underpressure to expand output without any major increases in employ-ment. China's rural small-scale industries remain highly labor in-tensive when compared to urban enterprises in China, and thecontrast is even greater with similar industries in the United
3. The share of China's producer industries in the value of gross industrialoutput has risen from about one-third in 1952 and one-half in 1957 to more thanthree-quarters in the mid-1970s. See Rawski, "Industrial Performance," in Quan-titative Measures, Table H-12.
DETERMINANTS OF INDUSTRIAL EMPLOYMENT 45
TABLE 3-2. AVERAGE ANNUAL PERCENTAGE GROWTH OF OUTPUT,EMPLOYMENT, AND FDYED CAPITAL IN PRODUCER-GOODS INDUSTRIES,1952-65 AND 1957-65
Value ofPeriod gross outputa Employment Fixed capital
a. Excludes handicrafts.Source: Thomas C. Rawski, "The Growth of Producer Industries, 1900-1971," in China's
Modern Economy in Historical Perspective, ed. Dwight H. Perkins (Stanford, Calif.: Stanford Uni-versity Press, 1975), pp. 222-23.
States. But most Chinese efforts at the moment appear to be direct-ed not at exploiting the employment potential of labor-intensivetechniques, but toward modernizing those techniques in a capital-intensive direction."4
What factors are responsible for the steady increase in capitalintensity that is characteristic of Chinese industry in all periodssave that of the Great Leap? Why have investment policies notplaced greater emphasis on labor-using, employment-creatingproduction methods?
Economic Objectives and Industrial Structure
China's economic ambitions were well summarized in an addressin 1975 by Premier Chou En-lai, who called on his fellow citizensto build plans "to accomplish the comprehensive modernizationof agriculture, industry, national defense, and science and tech-nology before the end of the century, so that our national economywill be advancing in the front ranks of the world."5
In a large economy that must inevitably supply most of its ownintermediate and capital goods, it is the industrial sector-and es-pecially engineering, chemicals, metallurgy, mining, and otherbranches of the producer sector-whose output is essential to thetransformation of society's production possibilities. As one Chi-
4. Dwight Perkins and others, Rural Small-Scale Industry in the People's Republic ofahina (Berkeley: University of California Press, 1977), p. 8.
5. Peking Review, no. 4 (1975), p. 23.
46 ECONOMIC GROWTH AND EMPLOYMENT IN CHINA
nese writer observed, it is these branches of industry which use"modem technology to equip agriculture, industry, the military,and science for achieving the modernization of all these sectors."6
To the natural propensity of a continental nation to rely primar-ily on domestic sources of supply, there must be added the experi-ence of China's present leaders in their guerrilla days before 1949and, more recently, in the years following the abrupt withdrawalof Soviet technicians in 1960. Chinese economists fully under-stand that there are economic gains to be derived from domesticand international specialization and division of labor. The historyof these two periods shows, however, that isolation and autarkycan provide sufficient incentive to seek solutions to problems thatwould never be confronted if outside supplies could be obtained.This view, which is supported by the experiences of the advancedindustrial nations during World War II, has led Chinese plannersto limit dependence on external supplies-from domestic as wellas foreign sources-to situations in which local products cannotmeet the quality, cost, or time requirements of current demand.Showing an awareness of the costs of excessive specialization andof the potential benefits of isolation, as well as of the traditionalbenefits of interregional and international division of labor, theChinese policy of economic self-reliance has brought about an in-vestment program that seeks to develop a broad range of indus-tries at the regional as well as the national level.
This decision-to limit dependence on external supplies of in-dustrial commodities by pursuing a broad-ranging program of im-port substitution-obliged China to commit a large share of itsinvestment resources to the development of steel, fuel, engineer-ing, and other basic industries having a myriad of interindustriallinks to other sectors of the economy. Available production tech-nologies in most of these industries have relatively high degrees ofcapital intensity. This emerges clearly from Table 3-3, which pro-vides separate rankings for various industries relative to theirfixed assets per worker and output growth. The correlation be-tween capital intensity and rapidity of growth is striking: with theexception of paper, a capital-intensive but slowly growing indus-
6. Wang Hu-sheng, "Several Problems of Classifying Heavy and Light Indus-try," Ching-cii yen-rhiu [Economic Research], no. 4 (1963), p. 18.
DETERMINANTS OF INDUSTRIAL EMPLOYMENT 47
TABLE 3-3. CAPITAL INTENSITY AND OUTPUT GROWTH,
BY INDUSTRIAL SECTOR, 1952-1972
Sectors ranked in order Productivefixedof decreasing assets per Sectors ranked in order Gross
capital-labor ratio, production worker of outputgrowth, output, 19721952-53 (yuan) 1952-72 (1952 = 1)
1. Electric power 51,197 1. Petroleum 76.42. Petroleum 24,945" 2. Machinery 61.83. Paper 9,528 3. Chemicals 35.44. Ferrous metallurgy 9,251 4. Ferrous metallurgy 16.05. Chemicals 8,120 5. Electric power 15.2Average for all industry 5,656 Average for all industry 11.66. Coal 5,029 6. Building materials 10.47. Textiles 4,806 7. Paper 6.38. Machinery 4,750" 8. Coal 5.89. Food processing 3,373 9. Food processing 2.9
Note: Assets per worker are 1952-53 figures for state and joint state-private enterprises,categories that include large factories and exclude small handicraft workshops. Output figuresare for the gross value of factory output (excluding handicrafts) based on 1952 prices.
a. Crude oil extraction.b. Data refer to metal processing, which includes manufacture of metal products and re-
pair work as well as manufacture of machinery.Source: Thomas G. Rawski, China's Transition to Industrialism: Producer Goods and Economic
Development in the Twentieth Century (Ann Arbor: University of Michigan Press, forthcoming),Table 4.9.
try, and machinery, a relatively labor-intensive industry with ahigh growth rate, all industries with above average capital in-tensity grow at above average rates, whereas sectors with relative-ly low capital intensity experience below average growth. As aresult, structural change alone can be identified as an importantcause of capital deepening within the industrial sector.
Within individual enterprises, the gradual adoption of mecha-nization has tended to raise capital per worker and probably theratio of capital to output as well. Reasons for mechanization,which include worker pressure for relief from physically onerousduties and the widespread availability of machine shops, are dis-cussed below. The results of mechanization are visible throughoutindustry: in fertilizer and cement plants that plan to install auto-matic bagging devices to limit the workers' exposure to dust andfumes; in textile enterprises that provide mobile seats so that indi-vidual workers can tend more machines; and in machinery plants
48 ECONOMIC GROWTH AND EMPLOYMENT IN CHINA
in which overhead cranes, conveyer belts, and pneumatic tools areused to reduce manual labor in assembly and intraplant transport.
Several aspects of China's industrial strategy have, however,partially offset the trend toward capital deepening. Rural industri-alization, for example, which gained national prominence from thecampaign to produce steel in "backyard furnaces" during theGreat Leap Forward, was carried on in part because of its promiseof low capital requirements, a promise that the experience of twodecades has only partially fulfilled. As the output of rural industryhas grown, tiny units with low capital-labor ratios have beenabandoned in favor of substantial plants employing hundreds ofworkers, large complements of machinery and equipment, andtechnical processes that on the whole offer few surprises to West-ern engineers. Although capital per worker is less in small-scalerural plants than in large-scale urban units, the more successfulrural plants often have capital-labor ratios that exceed the relevantsectoral averages for the 1950s. Furthermore, Jon Sigurdson hasfound that investment costs per ton of capacity are often larger inrelatively small plants. 7 All of this leads to the conclusion that, inassessing the contribution of rural industry to China's economicdevelopment, the capital-saving contribution of small plants is ofrelatively little significance.
A second area of industrial policy that may have helped to slowthe growth of capital intensity involves efforts to separate, or de-compose, advanced technologies so that some operations can becarried out with labor-intensive techniques without affectingproduct quality. Reports by visitors who discover "an incrediblemixture of ancient and modern" production techniques, withsome operations "done in a very elementary way while otherswere tooled with highly sophisticated machinery" indicate the de-gree to which Chinese manufacturers of engineering and electron-ics products have succeeded in grafting labor-intensive ancillaryoperations onto a technological core of more advanced and capital-intensive processes. 8 It appears, however, that opportunities for
7. Jon Sigurdson, Rural Industrialization in China (Cambridge, Mass.: HarvardUniversity Press, 1977), chap. 4.
8. Quotations from "Report of SMMT [Society of Motor Manufacturers and Trad-ers] Trade Mission to the People's Republic of China, 2-17 November 1973" (Lon-
DETERMINANTS OF INDUSTRIAL EMPLOYMENT 49
such technological decomposition exist only in certain industries.Industries with continuous processes, such as petrochemicals andcement, and those with major scale economies, such as ferrousmetallurgy and electric power, seemingly offer little scope for costreduction through partial substitution of labor for capital in pe-ripheral activities. Furthermore, a recent flood of complaints aboutproduct quality and overall efficiency in the farm machinery sec-tor, which is among the leading practitioners of technological de-composition, suggests that reductions in capital-intensity maycarry a significant cost.9
Additional policies that have acted to reduce capital require-ments in industry are those designed to increase the overall levelof resource utilization. These programs include transfer of sec-ondhand machinery to small enterprises; setting industrial priceshigh enough so that even the most backward producers can aspireto break even; exploitation of resource deposits that are too smallto permit the use of mechanized techniques; and recruitment ofurban housewives to staff enterprises that use waste and scrapfrom larger factories. Each of these policies has other objectivesand effects, but each has encouraged activities that tend to reducethe average capital requirement per worker and per unit of in-dustrial output.
Despite the presence of factors tending to move industry in thedirection of more capital-extensive production techniques, thetrend over the past twenty-five years has been one of increasingcapital intensity. This is evident both from limited statistical dataand from the observations of visitors familiar with Chinese facto-ries. Recent discussions by Chinese economists and officials makeit clear that this trend will continue. Growing imports of completeplants and industrial equipment from Europe, North America,and Japan will contribute to increased capital intensity both di-rectly and, if imports serve as models for domestic producers toimitate, indirectly as well.
don, 1974; processed), p. 32; and David Scott, "China Opens Doors for Rare Viewof Auto Production," Automotive Engineering, vol. 82, no. 8 (1974), p. 30.
9. Vice Premier Yu Ch'iu-li's "Summation Report on Agricultural Mechaniza-tion" in January 1978, translated in FBIS, January 31, 1978, pp. E6-25, is representa-tive of recent critical comment about the state of China's farm machinery industry.
50 ECONOMIC GROWTH AND EMPLOYMENT IN CHINA
Reform plans for industries supplied by domestic producers al-so appear directed toward increased capital intensity. In the farmmachinery sector Vice Premier Yu Ch'iu-li has called for "exten-sive utilization of highly effective and specialized equipment, theorganization of assemblyline methods and automation in produc-tion, and the improvement of enterprise management and tech-nology," which he expects will "greatly enhance the quality andquantity of farm machinery, considerably reduce the consumptionof manpower and materials, and significantly lower productioncosts."1 0 In the lagging coal industry Vice Premier Teng Hsiao-p'ing has called for a "great mining campaign" to construct newmines, develop capable leadership, and "aggressively develop ad-vanced and large mining equipment, transportation equipment,and other mining machines"-a capital-intensive prescriptionthat specifically rejects the alternative of large increases in employ-ment.1 ' Plans for accelerated development of consumer industrieswith relatively low capital coefficients will slow, but cannot re-verse, the trend toward capital deepening. 12
Technology and Employment in Three Typesof Industrial Units
Given the general pattern of industrial investment, growth, andmix of output, what determines the level of employment at the
10. Ibid., p. E13.11. "Some Problems in Speeding Up Industrial Development," translated in
Issues and Studies, vol. 13, no. 7 (1977), pp. 103-04. Hsiao Han, the minister of coalindustry, states that "the key to speedy development of the coal industry lies inmechanization" ("Developing Coal Industry at High Speed," Peking Review, no. 8[1978], p. 7), while an editorial in People's Daily observed that "we should not resortto great increases in manpower to quicken the development of the coal industry"(FBIS [December 13, 1977], p. E15).
12. Chinese sources indicate that output of light industry, including textiles,processed foods, and other consumer manufactures, is expected to grow at an an-nual rate of 12 percent during 1976-85. Although this exceeds the 10 percent annualgrowth rate projected for the entire industrial sector, much of the added output isto come "from fuller utilization of capacity and more efficient use of inputs" ratherthan from new plants. See U.S. National Foreign Assessment Center, China: InPursuit of Economic Modernization (Washington, D.C.: Central Intelligence Agency,1978), pp. 8 and 14.
DETERMINANTS OF INDUSTRLAL EMPLOYMENT 51
enterprise level? Insight into Chinese industrial technology can begained by considering the character and contribution of threetypes of industrial units that have figured prominently in China'sindustrial achievements during successive periods: the large So-viet-aid projects that dominated the investment program underthe First Five-Year Plan (FFYP; 1953-57); smaller units (most inher-ited from the Republican era of 1911-49) that attained technicalleadership in some industrial sectors during the 1960s by sub-stituting experience and entrepreneurship for capital equipment;and the revived and expanded rural industries that since the mid-1960s have begun to forge increasingly close ties between industryand agriculture.
Soviet-assisted projects of the First Five-Year Plan
China's First Five-Year Plan sought to implement a strategy ofbalanced growth by developing a group of large, modem pro-ducer-goods enterprises that would cater primarily to demandgenerated within the emerging heavy industry complex. The coreof the plan consisted of about 150 Soviet-aided investment projectsfor which the Soviets provided designs, equipment, engineers,and repayable loans.13
These plants were large, integrated, and capital intensive. Ascan be seen from the data in Table 3-4, each of 154 projects wasexpected to absorb an average of more than 70 million yuan during1953-57 alone (many were not completed until later). Togetherwith 143 ancillary projects, these undertakings absorbed morethan half of all industrial investment undertaken during the FFYP
years. These projects included a major expansion of the Japanese-built steel complex at Anshan in the northeast, construction ofnew steelworks at Wuhan in central China and at Paot'ou in InnerMongolia, development of a number of giant machinery plants inShenyang, Harbin, and other cities in the northeast, and develop-ment of a new industrial complex adjoining the north China city ofLoyang. Several projects were enormous, with budgets for invest-
13. 1967 Fei-ch'ing nien-pao [1967 Yearbook of Chinese Communism] (Taipei:Fei-ch'ing yen-chiu tsa-chih-she, 1967), pp. 850-54, gives a list of projects that re-ceived foreign technical assistance during the FFYP period.
52 ECONOMIC GROWTH AND EMPLOYMENT IN CHINA
TABLE 3-4. NATIONAL AND REGIONAL INVESTMENT OUTLAY
AND PROJECT SIZE, 1953-57(millions of current yuan)
n.a. Not available.a. Ten Great Years (Peking: Foreign Language Press, 1960; reprint edition, Bellingham:
Westem Washington State College, 1974), p. 44.b. Planned outlays shown in First Five-Year Plan for Development of the National Economy of the
People's Republic of China in 1953-1957 (Peking: Foreign Language Press, 1956), p. 39.c. Kuang-ming jih-pao [Kuang-ming Daily], September 24, 1957. Average project outlay is
for 600-700 projects undertaken in 1956.d. Ta-chung Ith-pao [Mass Daily], September 30, 1957; data refer to 1952-56.e. Wen-hui pao [Wen-hui News], October 14, 1957.f. Ta-kung pao [Impartial Daily], July 9, 1957, reported that 177 million yuan was to be spent
on 212 major units during 1957.g. Denved by applying the 79.8 percent share of industry in total investment for 1953-56
reported in Chi-lin jih-pao [Kirin Daily], August 9, 1957.h. Data for 1949-57 in Wen-hui pao [Wen-hui News], September 19, 1957.i. Hu-pei lih-pao [Hupei Daily], December 31, 1957, reported that 36.3 percent of the prov-
ince's investments had gone to industry during 1953-57.j. Hsan Hu-nan pao [New Hunan News], September 30, 1957.k. Figure for 1953-56 only was reported in JMJP, March 31, 1957.Source: Except as noted, data are from Nicholas R. Lardy, "Centralization and Decentraliza-
tion in China's Fiscal Management," C7una Quarterly, 61 (1975), pp. 31 and 40. The gross outputtotal for industry in 1957 (excluding handicrafts) amounted to 65.02 bllion 1952 yuan.
ment exceeding aggregate industrial investment for whole prov-inces (see Table 3-5).
The figures in Table 3-5 also illustrate the capital intensity of thenew plants. Comparison of data on employment and constructioncost for individual new plants with sectoral and national data onfixed assets per production worker (Table 3-3) shows that capital
DETERMINANTS OF INDUSTRIAL EMPLOYMENT 53
TABLE 3-5. FACTOR PROPORTIONS AND LABOR PRODUCTIVITY, SELECTED
SECTORS IN THE 1950s AND MAJOR FIRMS IN 1965(yuan)
workera per Number Construction outputworker, of cost per per
Category 1952 1955 19560 workers worker worker
All industry 5,656 6,835 12,172 - - -
Metal processing 4,750 6,035 12,569 - - -
Loyang Tractor - - - 2 0 ,5 0 0 b 19,5120 15 ,24 4bT'aiyuan Heavy Machinery - - - 7 ,20 0 d 27,7780 n.a.Wuhan Heavy Machinery - - - 7 ,0 0 0 b 1 8 ,5 7 1f 3 2 ,50 0 b
Iron and steel 9,251 13,302 19,625Wuhan Steel - - - 3 5 ,0 0 0 b 54,285" 2 8 ,5 7 1b
n.a. Not available. - Not applicable.Note: Data for the 1950s are for state and joint state-private enterprises; small handicraft
workshops are excluded. Several of the items for 1965 are the midpoints between altemativefigures.
a. Production workers only.b. Barry M. Richman, Industrial Society in Communist China (New York: Random House,
1969), pp. 154 and 827-33.c. Chagoku shiryd geppd [China Materials Monthly], no. 95 (1956), pp. 17 and 21. Entry under
Wuhan Steel is the cost of constructing an unspecified steel facility with annual capacity of 1.5million tons.
d. Chagoku kagaku gijutsu no genjo bunseki [Analysis of the Current State of China's Scienceand Technology] (Tokyo: Shokoku kagaku gijutsu kenkyukai, 1965), vol. 1, pp. 64-65.
e. 1967 Fei-ch'ing nien-pao [1967 Yearbook of Chinese Communism] (Taipei: Fei-ch'ing yen-chiu tsa-chih she, 1967), p. 928.
f. Furui Yoshimi and others, Hdchu shoken [A Visit to China] (Tokyo: n.p., 1959), p. 26.Source: Except as noted, data are from Nai-ruenn Chen, Chinese Economic Statistics, (Chicago:
Aldine, 1967), pp. 260 and 485-86.
per worker at the Soviet-aided plants was several times the nation-al average in both machinery and ferrous metallurgy.
These plants have achieved a mixed record. On the positiveside, gradual completion of the Soviet-aided projects during themid- and late 1950s led to a major expansion of import substitutionand output volume in a wide range of industries. Much of thegrowth in industrial output volume during 1957-65 is attributableto these plants.14 On the qualitative side, these new enterprises
14. Time series estimates of physical output for a number of industrial productsare available in Robert M. Field, "Civilian Industrial Production in the People'sRepublic of China: 1949-71," in U.S. Congress, Joint Economic Committee, China:
54 ECONOMIC GROWTH AND EMPLOYMENT IN CHINA
manufactured many import substitutes, often at a much lower costthan the foreign products that they replaced. References to the op-posite tendency are rare.
Nevertheless, construction and manufacturing operations atthese plants encountered difficulties that led Chinese economiststo question the value of large, capital-intensive facilities severalyears before the abrupt withdrawal of Soviet technical assistancein 1960 forced China to abandon the investment policy of the pre-ceding decade. The weakness of the economic analysis underlyingthe FFYP investment program led to many problems. Wuhan'sHeavy Machinery Plant was designed in the mid-1950s on thebasis of demand expected in 1967 and therefore faced marketingproblems.15 Investment in nitrogenous fertilizers was four to fivetimes that in phosphate fertilizers, but this proportion was fixedwithout any systematic effort to ascertain a desirable ratio be-tween output of various types of fertilizers. 1 6 In automobiles andtractors, although demand was "large in varieties but small inquantity, we planned for the future and built big integrated plantswith many specialized machine tools."'17 These blunders necessi-tated expensive model changes at some plants and conversion toentirely different product lines at others.
Many of the new plants embodied standards of mechanizationthat, as Chinese writers soon recognized, were not appropriate forChina. The automated casting shop at Shenyang's #1 MachineTool Plant, for example, was attacked as being pleasant (for theworkers) but a costly and irrational frill. A reply to the critics ac-tually supported their position. Mechanized casting admittedlyfailed to improve upon technical performance or quality indicatorsat other plants. And despite reductions in unit labor and materials
A Reassessment of the Economy (Washington, D.C.: U.S. Government Printing Office,1975), pp. 165-67; and Christopher Howe, China's Economy: A Basic Guide (NewYork: Basic Books, 1978), chap. 4.
15. Hsiang Lin, "How to Implement the Principle of Frugal National Construc-tion," Chi-hsieh kung-yeh [Machinery Industry], no. 11 (1957), p. 18.
16. P'an Kuang-chi, "Opinions on the Development of Basic Chemical Indus-tries," Hua-hsiueh kung-yeh [Chemical Industry], no. 8 (1957), p. 34.
17. Pai Ou, "Brief Discussion of the Direction and Tasks of the Machinery In-dustry," Chi-hsieh kung-yeh [Machinery Industry], no. 12 (1957), p. 2.
DETERMINANTS OF INDUSTRIAL EMPLOYMENT 55
costs, higher depreciation charges and operating expenses at themechanized plant gave more primitive facilities a substantial costadvantage even with interest charges on fixed capital omitted fromthe calculation. 18 Numerous other reports document the inclusionin major projects of expensive items of equipment that added littleto the performance of the enterprise.
As in any investment program, errors in planning were com-pounded by problems arising during implementation. Delays,discovery of incorrect drawings and technical specifications, costoverruns (expansion of Shenyang's #1 Machine Tool Plant cost fivetimes the planned amount), and unexpected bottlenecks in supply(managers at the new Loyang Bearing Works found that designat-ed suppliers had no plans to produce the required inputs) addedto the difficulties encountered by the new plants.19
On balance, these plants have certainly made great contribu-tions to China's industrialization. Their output forms the quan-titative backbone of a vastly enlarged industrial sector. Problemsof technology, product assortment, and management have beengradually ameliorated, in many cases under conditions of greatdifficulty created by the unexpected withdrawal of Soviet technicalassistance in 1960. One feature of these plants which has notchanged, however, is their high degree of capital intensity as mea-sured by the complement of capital per worker. This can be seenfrom the data in Table 3-6, which indicate that employment hasexpanded quite slowly at major plants, including enterprises thatdid and did not receive Soviet aid during the 1950s. Slow growthof employment is particularly noteworthy when it is consideredthat many of these units were still under construction or at thestage of trial output during 1957-60 and that their output has sub-sequently risen steeply.
Enterprises inherited from the Republican era
A different type of industrial unit has become prominent in
18. Meng Chih-chien, "On Mechanization of Casting Shops," Chi-hsieh kung-yeh [Machinery Industry], no. 13 (1957), pp. 5-8.
19. Pai Ou, "Brief Discussion," p. 5; and Wang Te-yuan, "Perceive the Condi-tions of Steel Supply, Dig Up Latent Sources of Domestic Supply," Chi-hsieh kung-yeh [Machinery Industry], no. 9 (1957), p. 29.
56 ECONOMIC GROWTH AND EMPLOYMENT IN CHINA
TABLE 3-6. EMPLOYMENT CHANGES AT MAJOR ENTERPRISES
SINCE THE 1950s
Plant Year Number of workers
Plants built with Soviet assistanceLoyang Tractor Plant 1959 20,000a
T'aiyuan Heavy Machinery Plant 1957 5,000k1964 7,200m
a. Furui Yoshimi and others, Hdcha shoken [A Visit to China] (Tokyo: n.p., 1959), pp. 12-26.
b. Dr. Doris Dohrenwend, personal communication.c. Ozaki Shotar6, "Visit to Mukden No. 1 Machine Tool Plant," Ajia keizai jumpd [Asian
Economic Weekly], no. 475 (1960), p. 10.d. Far Eastern Economic Reutew, June 18 and June 30, 1964.e. Chd7goku kogyo tsaishin [China Industrial Bulletin], no. 2 (1971), p. 10.f. Barry M. Richman, Industrial Society in Communist China (New York: Random House,
1969), p. 754.g. Ross Terrill, Flowers on an Iron Tree (Boston: Atlantic-Little, Brown, 1975), p. 289.h. Excludes miners.i. Chieh-fang jih-pao [Liberation Daily], September 30, 1957.j. Report of the Canadian Electrical Power Mission to the People's Republic of China, August 29 to
September 18, 1973 (Ottawa: Ministry of Industry, Trade and Commerce, 1973).k. Shin Chagoku no kikai kogyo [New China's Machinery Industry] (Tokyo: Toa keizai ken-
kyukai, 1960), pp. 136 and 145.1. Dwight Perkins and others, Rural Small-Scale Industry in the People's Republic of China
(Berkeley: University of Califomia Press, 1977), p. 40.m. Chtigoku kagaku gijutsu no genjo bunseki [Analysis of the Current State of China's Sci-
ence and Technology] (Tokyo: Shokoku kagaku gijutsu kenkyuikai, 1965), vol. 1, pp. 64-65.
DETERMINANTS OF INDUSTRIAL EMPLOYMENT 57
China since 1960. These are older, smaller enterprises, often partof the legacy of prewar industrial advance in the private sector;they have typically received only modest infusions of investmentfunds, imported equipment, and external technical aid. Thesefirms deserve major credit for the flexibility, successful in-novation, and responsiveness to demand that, in contrast to the1950s, seem typical of industrial performance over the past fifteenyears.
Shanghai's Ta-lung Machinery Works provides a well-docu-mented example of this type of firm.2 0 Ta-lung was established in1902 as a ship repair works; it had eleven workers. In 1906, with astaff of fifty, the firm began to specialize in repairing machineryfor Shanghai's growing textile industry. After 1911 the businessgradually shifted toward manufacture, first of textile machineparts, later of individual machines, and by the 1930s of a full lineof cotton spinning machinery that was installed in several profit-able mills.
Following wartime efforts that included replacement of dam-aged equipment and munitions manufacture, Ta-lung resumed itspattern of manufacturing a variety of equipment. During 1949-52its products included spindles, looms, machine tools, engines,and steel ingots. In 1953 machine tools and mining equipmentwere the major products. In 1955 the firm was assigned to special-ize in producing formerly imported items of petroleum equip-ment. In 1958 chemical fertilizer equipment was added to Ta-lung's product list.
Since 1960, Ta-lung has produced equipment for the petroleumand fertilizer industries and for synthesizing diamonds, and it hasexperimented with advanced techniques for metallurgy and com-pressors. At the same time, the plant continues to function as ajobshop: "When a heavy chain on a 10,000 hp diesel manufacturedby the Hutung Shipyard was found faulty and someone higher upinsisted that it should be substituted by an imported chain, work-
20. Discussion of the Ta-lung Machinery Works is based on Thomas G. Rawski,"The Growth of Producer Industries, 1900-1971," in China's Modern Economy in His-torical Perspective, ed. Dwight H. Perkins (Stanford: Stanford University Press,1975), pp. 202-13 and 232; and "Choice of Technology and Technological In-novation in China's Economic Development," in The Relevance of China's Experiencefor the Other Developing Countries, ed. Robert F. Demberger (forthcoming).
58 ECONOMIC GRowrH AND EMPLOYMENT IN CHINA
ers of the Ta-lung Machine Works overcame all difficulties andprovided a high-quality chain to make sure that every part of thediesel was of Chinese origin."2 1
Features shared by most of these plants include moderate size,a lengthy and varied industrial history that often includes repairwork as well as manufacturing, and a substantial proportion ofequipment that is old, self-manufactured, or both. Despite theirhaving low priority in China's investment policy and their con-sequent lack of advanced capital equipment, these plants, clus-tered in Shanghai, Tientsin, and other centers of prewar industrialdevelopment, form the cutting edge of Chinese technological ad-vance. Their primary function is to respond to shifts in domesticdemand by providing an appropriate mixture of embodied anddisembodied (through training and consulting programs, confer-ences, and the like) technological change drawn from both foreignand domestic sources.
Chinese sources make it clear that Shanghai, whose industry isdominated by small and medium-size plants of the type describedabove, is the nation's technological leader. Manufacturers of steel,machine tools, cable, diesels, pumps, pneumatic tools, sewingmachines, and many other commodities judge their products bycomparing them with Shanghai's and to a lesser extent with Tient-sin's.
The contribution of these older units to the development of newindustries may be illustrated by reference to petroleum and chem-ical fertilizers, both of which were assigned secondary priorityduring the 1950s but emerged as vitally important after 1960. Out-put in both sectors has expanded rapidly with only limited re-liance on imported equipment. The petroleum sector, in whichoutput has risen from 1.5 to 104 million tons of crude oil since 1957(Table 1-1), obtains much of its equipment from converted engi-neering works, including Ta-lung and other old plants.
The case of chemical fertilizers, in which output has risen from0.6 to nearly 50 million tons since 1957 (Table 4-3)-again, withlittle reliance on foreign equipment-provides even clearer evi-dence of the role of older firms and especially of Shanghai's indus-
21. Eastern Horizon, vol. 15, no. 5 (1976), p. 40.
DETERMINANTS OF INDUSTRIAL EMPLOYMENT 59
try as supplier of equipment. 2 2 Fertilizer equipment was pro-duced in quantity beginning in 1962. Shanghai led the way, sup-plying 25,000 tons of equipment to one major plant. In 1965,Shanghai firms tumed out China's first equipment for manufac-ture of urea. Small fertilizer plants, which have provided the bulkof output growth since 1965, now obtain some machinery fromprovincial and local sources. The core of the equipment industryremains in Shanghai, however, where a group of more than 400plants supplied 300 sets of equipment for synthetic ammoniaplants between 1970 and 1972.
The strength of older firms lies in their reservoirs of productionexperience and their tradition of entrepreneurial behavior devel-oped both before and after 1949. With their "skilled veteran work-ers and experienced technical persons" and superior developmentof interenterprise cooperation, another legacy of the past, "old in-dustrial bases and old enterprises . . . find it easier to tackle ...
complicated technical problems than new enterprises and new in-dustrial bases."2 3
With these advantages, it is the established centers that are bestable to copy and modify designs and samples of foreign equip-ment, to cull useful information from foreign technical literature,and to apply it to domestic problems. More generally, experiencedfirms act as technological intermediaries between the mass of Chi-nese producers, whose mission is to strive for "advanced nationallevels" of quality, cost, and technique, and the outside world,whose standards become the goal of Shanghai's technological as-pirations.
Despite their major contribution to expanding the range andtechnical sophistication of China's industries, these plants havenot provided employment opportunities for large numbers of newworkers. This limited growth in employment is the result of thedependence of these enterprises on the skill and dedication of in-
22. Statements on sources of equipment for the fertilizer and petroleum sectorsand on Shanghai's overall technological leadership are based on Thomas G. Raw-ski, China's Transition to Industrialism: Producer Goods and Economic Development in theTwentieth Century (Ann Arbor: University of Michigan Press, forthcoming), chap. 3.
23. scMp, no. 3,275 (1964), pp. 4-5.
60 ECONOMIC CROWTH AND EMPLOYMENT IN CHINA
dividual employees. Just as the functioning of the large Soviet-aided plants appears to require maintenance of a high degree ofcapital intensity, the operation of this second group of enterprisesdepends on maintaining a high degree of skill intensity, and thisin turn limits the employment potential of these plants as a whole.
Small-scale industry
The general features of China's small industries are describedin several sources and require little elaboration.2 4 Small plants lo-cated in county seats and rural areas are relatively easy to equipand can make use of small local resource deposits. Rural industrycan reduce rural claims on overburdened national transport facili-ties and cater to local requirements that are often overlooked byurban industry. If properly managed, small plants may have rela-tively low capital costs and short gestation periods. By meetinglocal demand, small industry can reduce the pressure on urbanoutput, allowing advanced units to concentrate on innovation andquality control rather than on maximizing the volume of currentproduct. Rural industry provides a constructive outlet for regionalpride and allows localities to compensate for some of the errorsand oversights of a centrally directed system of economic plan-ning.
The initial impetus toward expansion of rural industry came atthe end of the FFYP. Premature expansion of small plants duringthe Great Leap Forward led, however, to waste and confusion, andmany units were closed during the retrenchment of 1960-62. Then,as agricultural conditions stabilized and the opportunity cost ofrural industrial ventures declined, official policy began once againto encourage local industrial development.
The volume of resources devoted to small factories has ex-panded steadily since about 1963. Careful attention to pilot proj-ects, cost reduction, and quality control has led to greatly im-proved results. In 1964, for instance, the Hsin-hui (Kwangtung)Farm Machinery Works turned out power tillers at only 55 percent
24. See, for example, Carl Riskin, "Small Industry and the Chinese Model ofDevelopment," China Quarterly, no. 46 (1971), pp. 245-73; Perkins and others,Rural . .. Industry; and Sigurdson, Rural Industrialization.
DETERMINANTS OF INDUSTRIAL EMPLOYMENT 62
of the cost of useless models produced in 1960; by 1972 annualoutput had risen to 2,700 units.2 5
As a result of continued investment in rural industry, most ofChina's 2,000-odd counties are now active in one or morebranches of the producer sector. In 1971 reports indicated that"more than half of the counties had established small machinery,chemical fertilizer, cement, and iron and steel plants and smallcoal pits." In 1972, 96 percent of all counties were reported to oper-ate workshops for making and repairing farm machinery, and in1974, 80 percent of counties possessed small cement plants. Recentyears have seen a rapid expansion of industrial activity at the com-mune and brigade levels, which now operate more than 1 million"small factories and other enterprises." 2 6
Small industry is not spread evenly over China's rural land-scape. One Chinese account notes that "local industry has devel-oped on a larger scale and at a faster speed in provinces that have amuch better industrial foundation" and are therefore betterequipped to aid new enterprises with equipment and technicaladvice.27 Hilly districts with mineral deposits and hydropowerpotential, areas in which unusually high or rapidly rising grainyields make it easy to finance start-up costs, and counties close tothe technical resources of urban industrial centers all seem to en-joy above average success in expanding the size and scope of localindustry.
How large is the small-scale industry sector? Rural industrialactivity can be divided into two segments: the collective and state-owned sectors. The collective sector consists mainly of enterprisesowned, financed, and managed by agricultural communes andtheir constituent brigades and teams. Information on the scope ofcollective industry is limited, but it appears that processing ofgrains, cotton, and other plant products, handicrafts, repair offarm machinery, carpentry, and other sideline ventures pre-dominate, although some communes also engage in coal mining,
25. Nan-fang jih-pao [Southern Daily], April 18, 1965, and aBc, no. W706 (1973),p. A12.
26. Statements in this paragraph are derived from scmr, no. 4,992 (1971), p. 28;Peking Review, no. 48 (1972), p. 17, and no. 2 (1974), p. 23; and FBIs, January 6, 1978,p. E17.
27. Peking Review, no. 39 (1971), p. 9.
62 ECONOMIC GROWTH AND EMPLOYMENT IN CHINA
hydroelectric generation, and manufacture of machinery, cement,fertilizer, and other producer goods. In 1973 "industry under col-lective ownership accounted for 3 percent of the fixed assets, 36.2percent of the industrial population, and 14 percent of the totaloutput value" of all industry.28
The state sector of rural industry consists mainly of enterprisesoperated at the county level. These plants derive their fixed assetsfrom the state budget and remit most of their profits to the state.They are typically located in or near the county seat, which is oftena city of some size, and are much larger and better equipped thancommune enterprises. The bulk of the producer-goods output ofsmall industry, which is estimated for 1972 in Table 3-7, comesfrom these plants.
Estimates of the size, in output and employment, of the collec-tive sector and of the "five small industries" are shown in Table 3-1. Calculations shown in this table draw on the more detailed esti-mates of small plant output and employment in Tables 3-7 andAppendix C. Although these figures are only approximations,there can be little doubt of the general validity of the conclusionsdrawn from the data in Table 3-1.
First, it is clear that, despite the crucial role of small industryproducts in the agricultural development process described inChapter Four and the importance of the output of small plantsin the growth of certain branches of industry (particularly build-ing materials, chemical fertilizer, and farm machinery), smallplants provide only a fraction of overall industrial output. The fivesectors included in Table 3-7 account for 6.3 percent of estimatedgross value of factory output in 1972; the addition of less devel-oped small industry sectors for which data are not available mightadd one or two percentage points to this total, but no more. It istherefore evident that, despite the expansion of rural industry,large-scale urban industry has retained its position as the leadingforce in Chinese industrial expansion.
Second, the collective sector, which partially overlaps with thefive small industries, also accounts for only a modest share of in-dustrial output. Many of the collective enterprises included under
28. Chang Ch'un-ch'iao, "On Exercising All-Round Dictatorship over the Bour-geoisie," Peking Review, no. 14 (1975), p. 6.
DETERMINANTS OF INDUSTRIAL EMPLOYMENT 63
TABLE 3-7. SHARE OF FIVE SMALL INDUSTRIES IN FACTORY OurPUr, 1972
Small-scale Gross value offactory output
share (billions of 1952 yuan)
Product or sector (percent) Total Small-scale
Building materials 500 6.480 3.240Chemical fertilizer 60b 3.643 2.186Energy
Total for five small industries 35.1 56.663 19.869Total for entire producer-goods sector 7.5 263.826 19.869Gross value of factory output 6.3 312.991 19.869
a. Small plant share of 1974 cement output as estimated by Ian H. McFarlane, "Construc-tion Trends in China, 1949-74," in U.S. Congress, Joint Economic Committee, China: A Reas-sessment of the Economy (Washington, D.C.: U.S. Government Printing Office, 1975), p 315.
b. Calculated on the basis of tonnage estimates in Robert M. Field, "Civilian IndustrialProduction in the People's Republic of China: 1949-74," ibid., p. 166.
c. Figure for 1973 from sBc, no. W803 (1974), p. A15.d. Small plants account for 20 percent of hydropower capacity (Peking Review, no. 21 [1975],
p. 31), which in turn accounts for an estimated 28 percent of aggregate generating capacity(Thomas G. Rawski, "The Role of China in the World Energy Situation" [unpublished, 1973], p.27). The output share of small plants may therefore be estimated at 20 -0.28, or about 6 percent.
e. Figure for 1966 cited by Carl Riskin, "Small Industry and the Chinese Model of Develop-ment," China Quarterly, no. 46 (1971), p. 271.
f. Farm machinery accounted for from 6 to 7 percent of total machinery output in 1956(Chao I-wen, Hsin Chung-kuo ti kung-yeh [Industry of New China] [Peking: T'ung-chi ch'u-panshe, 1957], p. 43). This share is assumed to have risen to 15 percent by 1972. Overall machineryoutput for 1972 is given in Appendix C.
g. In 1972 small plants accounted for 22 and 15 percent of China's output of pig iron andcrude steel, respectively, (U.S. Central Intelligence Agency, China: Role of Small Plants in Eco-nomic Development [Washington, D.C., 1974], p. 15). The 18 percent small plant share is as-sumed on the basis of these estimates.
Source: Gross value data in the second column are from Thomas G. Rawski, "China'sIndustrial Performance, 1949-1973," in Quantitative Measures of China's Economic Output, ed.Alexander Eckstein (Ann Arbor: University of Michigan Press, forthcoming), Tables 21, 27, 34,and 37. Data in the third column are calculated from the figures in the first and second columns.
the rubric of "industry" engage in activities that might reasonablybe classified as nonindustrial. Cotton ginning, flour milling, ricehulling, and other types of crop processing, as well as self-con-sumed handicraft production, included in agricultural output dur-ing 1953-57, are now assigned to industry. These activities nowgenerate perhaps one-fourth of the output of collective indus-
64 ECONOMIC GROWTH AND EMPLOYMENT IN CHINA
try.2 9 Other semi-industrial activities apparently contained in thetotal for collective industry include carpentry shops, mat-weaving,basketry, and sewing and embroidery shops, as well as othertypes of traditional crafts.
These activities, which are not new to China's countryside, areincreasingly mechanized and hence industrial in character. At thesame time, part of the output of collective industry consists ofmodernized forms of traditional craft activities, and genuinelynew activities, such as manufacture of cement, fertilizers, and ma-chinery, contribute only a modest fraction to the total output ofcollective industry.
A third set of conclusions that become evident from the datain Table 3-1 concerns the effect of rural industrialization onpatterns of employment. The data show that the direct employ-ment effect of collective and small-scale industry is extremelysmall. The combined employment total in collective industry (in-cluding handicrafts) and in the five small industries for 1975 is 19.4million workers. This figure is far higher than the actual level ofindustrial employment in rural areas for several reasons. First, em-ployment in collective enterprises that produce commodities listedin Table 3-7 is counted twice. Second, most of the state-operatedenterprises whose output and employment is estimated in Table 3-7 and Appendix C are located in county towns; their employmentis part of urban rather than rural employment. Third, some collec-tive enterprises are located in cities; their workers are also part ofthe urban labor force. Fourth, employment figures for collectiveenterprises in the countryside may include part-time workers. The19.4 million figure includes state-sector small-scale plants in in-dustries other than those shown in Table 3-7 (textiles, food pro-cessing, and so on), but such plants appear to be relatively few innumber and also tend to have urban locations.
It can therefore be concluded that 15 million is a generous esti-
29. The activities transferred from agriculture to industry generated 15.4 per-cent of the 1955 gross value of agricultural output; see Robert M. Field, Nicholas R.Lardy, and John P. Emerson, A Reconstruction of treGross Value of industrial OutputbyProvince in the People's Republic of China: 1949-73 (Washington, D.C.: U.S. Depart-ment of Commerce, 1975), pp. 5 and 47. If this relation is assumed to have existedin 1975, the share of the transferred activities in the output of collective industrycan be calculated from Tables 3-1, 4-8, and 4-12.
DETERMINANTS OF INDUSTRIAL EMPLOYMENT 65
mate of full-time industrial employment in rural areas for 1975.Although rural industrial employment amounts to more thanone-third of all employment in industry, the share of rural enter-prises in national industrial output is limited to a portion of theoverlapping totals for collective plants and for the five small indus-tries shown in Table 3-1. This share is much smaller, perhaps from10 to 15 percent. Furthermore, when employment in rural industryis compared with the agricultural rather than the industrial workforce, its significance is much reduced. Rural industrial employ-ment totaling 15 million persons represents less than 5 percent ofthe total rural labor force shown in Table 2-9 for 1975. This impliesthat the 5 percent limit on industrial employment reported insome rural areas applies in practice to China as a whole. 3 0
The technological level of small-scale plants has been describedin detail elsewhere. The basic conclusion of the Rural Small-ScaleIndustry Delegation was that the plants visited, most of whichwere identified by Chinese hosts or Chinese press reports as lead-ing units in their field, are effective and productive enterprisesthat have succeeded in applying modern industrial technologyand equipment to produce useful outputs. With some exceptions,notably the widespread production of ammonium bicarbonate, afertilizer product that appears to be unique to China, the materi-als, equipment, processes, and products encountered in Chineseplants were not unfamiliar to American engineers and social scien-tists. Apprentice machinists were performing the same tasks as-signed to apprentices at General Motors; fertilizer plants and trac-tor models resemble U.S. plants and tractors built during WorldWar II; and a temporary disruption of operations at a Peking steelrolling plant reminded visitors of similar experiences at steel millsin Brazil and Canada.31
Small plants in any particular industry appear to include unitsof widely varying technical sophistication. Chinese publications
30. The five percent limit is reported in Jon Sigurdson, "Rural Industrializationin China," in U.S. Congress, Joint Economic Committee, China: A Reassessment ofthe Economy (Washington, D.C.: U.S. Government Printing Office, 1975), p. 412.
31. The statements in this paragraph are based on Perkins and others, Rural ...Industry, chaps. 4-7, and on the author's observations as a member of the RuralSmall-Scale Industry Delegation that prepared the report.
66 ECONOMIC GROWTH AND EMPLOYMENT IN CHINA
describe tiny plants rigged with primitive homemade equipment;these units are not shown to visitors and appear to contribute littleto aggregate output. Their function is to develop rudimentary sup-port facilities for agriculture in areas that are not able to obtainindustrial farm inputs or capital equipment needed to produce thefarm inputs, because of remote location, financial constraints, orthe inadequacy of industrial output. Primitive plants also serve astraining grounds to prepare the way for future expansion and up-grading of local industrial facilities.
The bulk of the output of small plants now comes from fairlylarge and sophisticated plants of the type shown to the RuralSmall-Scale Industry Delegation. These plants are often neithersmall nor rural. County plants typically are located in or near thecounty seats, which may, as in the case of Hsinhsiang, Honan,have populations as large as 450,000 persons. As for size, the aver-age employment level at 18 county plants toured by the group was379 workers.3 2
These plants operate large quantities of machinery, sometimesincluding items obtained from leading national-level plants. Atthe same time, they invariably possess substantial machine shopsthat produce considerable quantities of equipment for their ownuse. Although small plants tend to use less capital per worker thanlarger units, workers at leading small enterprises nonetheless op-erate substantial quantities of equipment, frequently includingautomatic machine tools and other sophisticated items. Further-more, falling machinery prices (both absolutely and relative to la-bor costs), growing skill of local engineering units, and a wide-spread desire to increase labor productivity have led to an increas-ing level of mechanization and hence capital intensity in plantsvisited by the Rural Small-Scale Industry Delegation.
The contribution of the output of small plants to China's econo-my has been assessed elsewhere by means of detailed cost com-parisons for similar products of large and small enterprises.3 3 Theresults of such studies indicate that small plants, although general-ly incapable of matching the current cost performance of large-scale enterprises, have succeeded in raising industrial capacity
32. Ibid., p. 68.33. Ibid., chap. 4 and Appendix F; Sigurdson, Rural Industrialization, chap. 4;
and Rawski, "Choice of Technology."
DETERMINANTS OF INDUSTRIAL EMPLOYMENT 67
with minimal use of foreign exchange, interregional transport net-works, and other resources of high opportunity cost, and withoutsignificant cost escalation from the standards established by largerenterprises during the 1950s. The substantial and positive benefitsthat local industrialization has provided to the agricultural sector,a topic to be discussed in the following chapter, add further sub-stance to the conclusion that the expansion of small-scale industryhas contributed significantly to the development of China's econo-my during the past two decades.
Institutional Determinants of Industrial Employment
Strong incentives to raise labor productivity and hence to limitlabor requirements are implicit in China's industrial objectives,technological policy, and enterprise structure.
Chinese economic planners are highly conscious of a tradeoffbetween aggregate consumption and investment. Wages in thestate industrial sector, including county-level plants, are muchhigher than incomes of agricultural workers.3 4 This pay dif-ferential, inherited from the past, is now reinforced by an ideologythat identifies industrial workers as the "vanguard of the proletari-at," by the steadily widening gap in productivity between indus-trial and agricultural workers, and by the limited but very realpolitical strength of urban workers. This large differential meansthat transfer of agricultural workers into the state industrial sys-tem raises aggregate disposable income and hence personal con-sumption. This process not only reduces the surplus available forinvestment but also necessitates reallocation of reduced invest-ment outlays toward consumer products to avoid excess demandand consequent inflationary pressures. In addition, state-sectoremployees receive pensions, subsidized medical care, child-carefacilities, and other fringe benefits not normally available to com-
34. Only a tiny minority of farm workers can hope to earn annual incomesequivalent to the wages of from 600 to 800 yuan that are common even amongsemiskilled industrial workers. A survey by Martin K. Whyte concludes that "theurban-rural incomes differential is something on the order of 2:1 (whether consid-ered on a per capita or per labourer basis)." See "Inequality and Stratification inChina," China Quarterly, no. 64 (1975), p. 687.
68 ECONOMIC GROWTH AND EMPLOYMENT IN CHINA
mune members. Urban housing, which is also heavily subsidized,adds substantially to the cost of higher employment in the statesector, so much so that government outlays for residential con-struction during 1953-57 exceeded state investment in water con-servancy, nonrailway transport, and even agriculture.3 5
Planners' perceptions of costs attached to higher industrial em-ployment relate primarily to the state sector. Commune membersemployed in collective enterprises at the commune or brigade lev-el are paid in work points rather than in cash, live in privatelyfinanced housing, and enjoy only those fringe benefits which areextended to fellow members of their communes.
At the enterprise level, growth in employment is limited by thewhole structure of Chinese economic planning, which encouragesmanagers to make the most of existing resources. Expanding out-put by increasing labor productivity rather than the number ofemployees creates a gap between potential and planned output, atleast in the short run, which increases an enterprise's ability towithstand unexpected breakdowns of equipment or supply lineswithout endangering plan fulfillment. Rising productivity also fa-cilitates the attainment of goals for quality, cost, and profit, whichin turn attracts favorable attention from superiors and increasesthe firm's prospects of obtaining investment funds.
In an economy in which real industrial wages did not rise per-ceptibly from 1957 until late 1977, when modest increases weregiven to about* half of the industrial workers whose monthlywages were below ninety yuan, it is probable that worker moraleresponds favorably to innovations designed to reduce physicallytaxing, hazardous, and unpleasant tasks.3 6 Such reforms demon-strate leaders' concern with workers' welfare, an important aspectof Chinese economic ideology, and are also likely to raise produc-tivity. Sliding seats for machine tenders in textile plants, automat-ic bagging at fertilizer and cement plants, and ventilation and dustremoval at textile and cement plants are examples of innovationsthat may be designed primarily to improve working conditions,but also have the effect of increasing capital intensity and laborproductivity.
35. Nai-ruenn Chen, Chinese Economic Statistics (Chicago: Aldine, 1967), p. 165.36. BBc, no. W957 (1977), p. Al.
DETERMINANTS OF INDUSTRIAL EMPLOYMENT 69
Finally, growth in employment is limited by bureaucratic ob-stacles. To obtain new workers, factory managers are required tomake formal application to labor bureaus, which allow additionalhiring only after inquiries have shown that new workers are genu-inely necessary. 37 A similar procedure is required to obtain allo-cations of state investment funds. But the latter, once obtained,are virtually a free good, for there appear to be no interest chargesattached to capital grants. This certainly biases the choice of tech-nology at the enterprise level toward capital-using alternatives.
In addition, and perhaps more important, is the ability of manyfirms to fulfill at least some of their equipment needs without en-tering into these application procedures. The high degree of verti-cal integration in Chinese industry is discussed in manysources. 38 China's relatively inflexible system of industrial re-source allocation gives managers a strong incentive to developcaptive ancillary facilities. Especially prized are repair shops thatcan alter or repair existing equipment, produce new and improvedmachines for self-use or barter, and in some sectors contribute tocurrent output at critical times. The widespread existence offoundries and machine shops attached to factories in many sectorsand the apparent ease with which they acquire raw materialscreate an additional bias toward expansion of output and qualityof product along capital-intensive lines.
Conclusion
The growth of industrial employment, though impressive in abso-lute terms, is relatively modest in comparison with the extent of
37. Alexander Eckstein, China's Economic Development (Ann Arbor: University ofMichigan Press, 1975), pp. 362-64. Reports of communes sending members to workin industrial and mining regions raise the possibility that factories may colludewith rural units to circumvent these restrictions.
38. See, for example, Barry M. Richman, Industrial Society in Communist China(New York: Random House, 1969), p. 796, and Rawski, China's Transition to Industri-alism, chap. 5. Vice Premier Yu Ch'iu-1i's complaint that too many farm machineryplants "are either 'large and comprehensive' or 'small and comprehensive'; theymanufacture everything from parts and accessories to entire machines" with dele-terious effects on cost, quality, and customer service, illustrates Chinese views onthis issue ("Summation Report," p. E12).
70 ECONOMIC GROWTH AND EMPLOYMENT IN CHINA
industrial expansion. The contrast between the dominant contri-bution of industry to China's incremental output and its limitedcontribution to creating employment must be understood in thecontext of China's industrial strategy, technological alternatives,and institutional patterns. The prevalence of comparatively highand rising capital-labor ratios and rising labor productivity in alltypes of industrial enterprises means that the task of absorbinglarge new cohorts of workers has fallen primarily to the agricultur-al sector. Absorption of labor in China's agricultural economy andthe contribution of industry to raising the demand for rural laborare taken up in the following chapter.
Chapter Four
Labor Absorption in Agriculturefrom 1957 to 1975
CHINA'S LABOR FORCE INCREASED by an estimated 148.5 millionpersons between 1957 and 1975, as was demonstrated in ChapterTwo. Of this number, 58 million entered industry and other non-agricultural pursuits (see Tables 2-7 and 2-8). If it is assumed thatthere is no open unemployment in the countryside, some 97.3 mil-lion workers are left to be absorbed into agriculture (Table 2-9),which is broadly defined to include water conservancy and landimprovement as well as farming. In addition, the considerablegrowth of labor-augmenting mechanization has reduced severalcomponents of rural labor demand, thus enlarging the potentialproblem of labor absorption.
This chapter will show that these potential problems have notmaterialized. China's farm sector has succeeded in absorbingnearly 100 million new workers, amounting to an increase of morethan 40 percent in the labor force, with no significant addition tocultivated acreage. Despite the resulting increase in the man-landratio, which was high to begin with, both the number of work-days per laborer and the value of agricultural output per man-yearincreased between 1957 and 1975. At the same time, however, di-minishing returns are discernible in the declining level of farmoutput per man-day and in falling total factor productivity in agri-culture.
71
76° eo- 9U - S 12o- S20 * 130l
U S. S. R.
J~~~~~
/vt X J' -_x'-/__h, C S'5-1-tD i
MONGOLIA J/ - /
EA~~~~~~A
40.C_f <a E>--
WIN X LaXRVIFHI LE
or AC ARRICULTURAL ARE AS
J ZCA RICEA -CHINA- AREA . ' SRWHERAREA, . -o Ser
- - - - Crop Ame, B..ndaries
I N D I A U.. /i~~~~~~~~~~~~~~~~~~~- j ___ ~~~~~~~~Prov,ncral and AutonornousI N D I A L7A ~~~~~~~~~~~~~~~~~~~~~~~~~fRegion Boundaries
Before discussing rural labor absorption during the past two de-cades, several important features of Chinese agriculture should benoted briefly. Varying conditions of temperature, rainfall, andpopulation density divide China's landscape into several distinctfarming regions that are shown on the accompanying map.China's southern and central regions, which enjoy relatively longgrowing seasons and abundant water supplies, cultivate irrigatedrice as the staple crop, while farmers in the relatively dry northernprovinces rely on wheat, maize, millet, and sorghum as their chiefgrain crops. The line separating the predominantly wheat-growingareas in the north from the rice-growing regions of the south runsslightly north of the Yangtze River, cutting through Kiangsu,Anhwei, Honan, and Shensi provinces.
In both the northern and southern regions, China's historic ex-perience of rising population density and man-land ratios hasstimulated the development of intensive methods of cultivation inwhich large inputs of labor, fertilizer, and, when available, waterare applied to small plots of land. An early twentieth-century ob-server remarked that "[a]lmost every foot of land is made to con-tribute material for food, fuel or fabric. Everything which can bemade edible serves as food for man or domestic animals. Whatevercannot be eaten or worn is used for fuel. The wastes of the body, offuel and of fabric are taken back to the field; before doing so theyare housed against waste from weather, intelligently compoundedand patiently worked . . . to bring them into the most efficient
form to serve as manure for the soil."'This system of farming is more akin to gardening than to West-
ern techniques of extensive farming. In the case of irrigated rice,the predominant crop in many areas of south China, CliffordGeertz has observed that output "can be almost indefinitely in-creased by more careful, fine-comb cultivation techniques" andthat the capacity of small plots "to respond to loving care is amaz-ing."2
1. F. H. King, Farrners of Forty Centuries (Emmaus, Pa.: Organic GardeningPress, n.d.), p. 25.
2. Clifford Geertz, Agricultural Involution (Berkeley: University of CaliforniaPress, 1966), p. 35.
74 ECONOMIC GROWTH AND EMPLOYMENT IN CHINA
TABLE 4-1. PERCENTAGE DISTRIBUTION OF IDLE TIME, BY MONTH, 1929-33
Source: Survey of 15,013 farns in 140 counties and 22 provinces reported in John L. Buck,Land Utilization in China (Nanking: University of Nanking, 1937), p. 296.
This system of intensive farming supported a sevenfold popu-lation increase between 1400 and 1950 with no decline in availabil-ity of foodstuffs per capita. Although part of the rise in grain out-put came from newly settled lands, most came from higheryields.3 By the twentieth century China possessed a highly devel-oped farming system with few areas in which traditional reformscould bring about sharp increases in output in the absence ofchemical fertilizer, machinery, and other moden farming inputs.
Despite its success in supporting growing numbers of in-habitants at constant living standards, traditional agriculturefailed to provide full employment for the farming populace. Sur-vey data from the 1930s show that seasonal idleness existed in allfarming regions, with most regions clustering near the nationalaverage of 1.7 idle months per able-bodied rural male.4 The sea-sonal distribution of idle time shown in Table 4-1 indicates a clus-ter of slack periods during the three months beginning in mid-November. During this interval, a typical male worker would beidle for 1.7 30 .80, or approximately 40 days. At the same time,the intensity of the farming cycle was restricted by seasonal peri-ods of peak labor demand. The data reported in Table 4-2 show
3. Dwight H. Perkins, Agricultural Development in China, 1368-1968 (Chicago:Aldine, 1969), chaps. 1 and 9.
4. John L. Buck, Land Utilization in China (Nanking: University of Nanking,1937), p. 294.
LABOR ABSORPTION IN AGRICULTURE, 1957-75 75
TABLE 4-2. PERCENTAGE OF LOCALITIES REPORTING AGRICULTURAL LABORSHORTAGES, 1929-33
Fann operations All Rice Wheathampered by shortages regions region region
Source: Survey of 260 localities in 169 counties and 20 provinces reported in John L. Buck,Land Utilization in China (Nanking: University of Nanking, 1937), p. 301.
that more than four-fifths of the localities surveyed experiencedlabor shortages at some point during the annual cropping cycle,most often at harvest time.
This pattern of seasonal peaks and valleys in the demand forfarm labor shows both the potential and the danger of farm mecha-nization, which can allow further intensification of the croppingcycle by breaking labor bottlenecks-but may also displace laborand extend the phenomenon of seasonal idleness.
Major Developments: Collectivization and Supplyof Modern Farm Inputs
The success of China's agricultural sector in absorbing large co-horts of new workers and in raising output to accommodate un-precedented rates of population increase can be traced to two fac-tors: collectivization and the infusion of industrial products intofarm production.
Collectivization
Following the extensive and violent land reform of the yearsimmediately after 1949, in which from 40 to 50 percent of arableland was confiscated from its owners and redistributed to lower-income farm households, family farming remained the dominantform of agricultural organization until 1956. Within the context of
76 ECONOMIC GROWTH AND EMPLOYMENT IN CHINA
family farming, the government and the Chinese Communist Par-ty encouraged the growth of cooperative units: at first, as mutualaid teams, then, as cooperatives in which members were remuner-ated on the basis of their contributions of both land and labor. In1956 most farm households were grouped into higher-level coop-eratives in which remuneration was based solely on contributionsof labor.
In 1958, as part of the series of campaigns known as the GreatLeap Forward, the rural populace was organized into large-scalecollectives known as "People's Communes." These communes at-tempted to practice full communism. The consequent ruptureof the link between peasant effort and income combined withgeneral disorganization and bad weather to produce a series of dis-astrous harvests. This prompted in the early 1960s a policy of radi-cal decentralization that abandoned the drive to attain full commu-nism; instead, it returned control over agricultural production andincome distribution to smaller units corresponding roughly to thelower-level cooperatives that had been formed before 1956.5
There have been no major reorganizations since this decentral-ization. The communes remain the basic unit of local governmentand administration in rural China. Chinese statements giving thenumbers of communes and of their constituent production bri-gades and production teams yield the following rough estimates ofthe average size of these units:6
Type of Number of Average size of units
unit units, 1978 Households Persons
Commune 53,000 3,383 14,887Production brigade 600,000 299 1,315Production team 4,000,000 45 197
5. For one of many detailed accounts of collectivization, see Audrey Donni-thorne, China's Economic System (London: Allen and Unwin, 1967), chaps. 2 and 3.
6. Numbers of units are reported in a "Briefing on China's Agriculture," dis-tributed by the Bureau of Foreign Affairs, Ministry of Agriculture and Forestry,Peking, September 18, 1978, p. 2. Estimated unit sizes are based on a rural popu-lation of 789 million derived by projecting the estimated 1975 rural population(Table 2-6) forward at an annual rate of 2 percent and on rural household size of 4.4persons estimated by Frederick W. Crook, "The Commune System in the People'sRepublic of China, 1963-1974," in U.S. Congress, Joint Economic Committee,
LABOR ABSORPTION IN AGRICULTURE, 1957-75 77
Involvement of communes in agriculture is now generally limitedto management of fishing, forestry, animal husbandry, and horti-culture. Communes do, however, exercise control over health careand secondary education. In addition, many communes manage avariety of industrial enterprises, especially in the fields of foodand fiber processing. In recent years growing numbers of com-munes have moved into other industries such as metallurgy,machinery manufacture and repair, hydropower, and buildingmaterials.
Production brigades have grown in importance as centers ofrural economic and political life. Many brigades now have head-quarters buildings, communist party branches, and militia units.Brigade headquarters often house local branches of credit and sup-ply-marketing cooperatives. Brigades also operate primary schoolsand cooperative health-care programs. "The brigade receives stateplan targets, compulsory state procurement (grain) quotas, andschedules for delivering grain taxes and then works out plans withits teams to achieve these targets. Brigades continue to mobilizethe rural labor force to build roads, canals, and water conservationprojects."' Brigades also operate sideline activities such as pig-geries, equipment repair shops, and food-processing workshops.
Production teams are the basic unit of agricultural productionand income distribution. They are responsible for tilling most ofChina's farmland. After gathering the harvest and deducting theshares owing to the state (taxes and a compulsory grain deliveryquota) and to the team itself (for purchase of current inputs, pay-ing for investment projects, compensation of team leaders, repay-ment of loans, and replenishment of the team's welfare fund), theteam distributes the remaining income to its members in propor-tion to the number of work-points accumulated by each personduring the preceding year. Work-point systems are not uniform,but are generally based on labor-days adjusted by. a coefficient re-flecting the strength, experience, diligence, and in some casesclass background, a factor used to discriminate against those
China: A Reassessment of the Economy (Washington, D.C.: U.S. Government PrintingOffice, 1975), p. 409. Discussion of the division of responsibilities among com-munes, brigades, and teams is based on Crook's account.
7. Crook, "The Commune System," p. 391.
78 ECONOMIC GROWTH AND EMPLOYMENT IN CHINA
whose families had been landlords or rich peasants before 1949.The primacy of the small production team-with an average of
several dozen households and somewhat less than 100 agriculturalworkers-in managing cultivation, accounting, and income distri-bution appears essential for preserving a close link between effortand reward in China's farm sector. Although some units haveshifted the basis of crop and income management from the pro-duction team to the larger production brigade, a change that drewsupport from the Maoist wing of China's political elite before MaoTse-tung's death, the constitution of 1975 includes a provisionspecifying the production team as the "basic unit of accounting."China's present administration strongly supports the concept ofteam autonomy and decries the negative effect of high-level inter-ference with farming decisions. In a typical statement, Shensileader Wang Jen-chung insisted in 1978 that "from now on thecommunes and the leading government departments will not beallowed to send orders on what to sow or how to assign produc-tion targets."8
In addition to the collective lands cultivated by commune mem-bers under the direction of production team leaders, rural house-holds are permitted to maintain small private plots. The size ofprivate plots has varied somewhat with the political climate. Dur-ing the 1970s private plots occupied approximately 5 percent ofarable farmland; they probably provided about one-fifth of the to-tal income of farm households. 9
The early problems encountered by communes were largely re-sponsible for the disastrous harvests of 1959-61. They stemmedfrom unrealistic ambitions, inexperienced management, and theerosion of incentives associated with egalitarian distribution ofincome at the commune level. Growth of experience, abandon-ment of full communism, and the return of control over cultivationand distribution to the team level have overcome most but, as is
8. China News Analysis, no. 1,141 (1978), p. 6.9. The size and importance of private plots are discussed by Crook, "The Com-
mune System," pp. 402-05; Shahid Javed Burki, A Study of Chinese Communes, 1965(Cambridge, Mass.: Harvard University East Asian Research Center, 1969), p. 40;William L. Parish and Martin K. Whyte, Village and Family in Contemporary China(Chicago: University of Chicago Press, 1978), p. 365; and Christopher Howe,China's Economy: A Basic Guide (New York: Basic Books, 1978), p. 49.
LABOR ABSORPTION IN AGRICULTURE, 1957-75 79
evident from recent Chinese criticism of agricultural performance,not all of these difficulties. This in turn has allowed the communesystem to exploit the advantages of collective agriculture, whichinclude the following:
* Increased central control over rural life, and particularly overgrain supplies, which increases state influence over rural sav-ings and investment decisions.
* The possibility of mobilizing seasonally idle labor to partici-pate in construction projects designed to raise farm output.This opportunity arises from the ability of the commune to in-ternalize benefits from water conservancy, afforestation, roadbuilding, and the like, which individual households or smallgroups could not capture in a market economy.
Development of a closely knit network of rural extensionservices that makes farmers more responsive to suggestionsfrom research institutes and other scientific units. This has apotentially negative aspect if, as occurred often during 1958-60 and sometimes thereafter, these suggestions are inappro-priate to local farming conditions.
Development of a diversified rural economy, which may bestimulated by the ability of the commune to spread risks orstart-up costs over a large population. Diversification may in-clude creation of new industries, addition of new field crops, ordevelopment of insurance programs for human and animalhealth care.
* Improved allocation of resources in cultivation. This in-cludes specialization and division of labor among the populaceas well as such reforms as leveling boundaries between fields toincrease plot size and sown area.
The existence of collectives does not ensure that these potentialadvantages will in fact be exploited. After the early period inwhich the net effect of collectivization on agricultural performancewas strongly negative, however, the combination of growingmanagerial experience and sensible economic policies at all levelsof government has allowed communes to make an increasinglypositive contribution to agricultural development.
TABLE 4-3. GROWTH OF INDUSTRIAL INPUTS INTO CHINA'S RURAL ECONOMY, 1957-78
Inventory data (millions of horsepower)
Rural power Millions of tons Total for three categoriesconsumption(billions of Small-scale Chemical Irrigation Horsepower perkilowatt- cement fertilizer and drainage Power Millions of cultivatedhours) output output' equipment Tractors tillers horsepower hectare
a. Based on product weight, not nutrient weight.b. Linear interpolation between figures for consecutive years.c. Reported to be six times the figure for 1962; cited in Thomas B. Wiens, "Agricultural Statistics in the People's Republic of China," in Quantitative Meisures of
China's Economic Output, ed. Alexander Eckstein (Ann Arbor: University of Michigan Press, forthcoming), Table 17.d. Based on increase for 1965-75 reported in Peking Review, no. 41 (1976), p. 17.e. "Communique on Fulfillment of China's 1978 Economic Plan," Beijing Review, no. 27 (1979), p. 38. Tractor horsepower is assumed to have grown in propor-
tion to the 19.3 percent increase in the number of tractors reported for 1977/78.f. Previous year's inventory less 5 percent for retirements (assumed) plus 1977 output, as estimated in U.S. National Foreign Assessment Center, China:
Economic Indicators (Washington, D.C.: 1978), p. 20.g. Calculated from Nai-ruenn Chen, Chinese Economic Statistics (Chicago: Aldine, 1%7), p. 186, and China Reconstructs, vol. 28, no. 4 (1979), pp. 8 and 56.h. Beijing Review, no. 2 (1979), p. 7.i. "Briefing on China's Agriculture" (Peking: Bureau of Foreign Affairs, Ministry of Agriculture and Forestry), p. 4, reports inventories of 800,000 power
tillers. The average size of power tillers is assumed to be 10 horsepower.Sources except as noted: Column 1, Kang Chao, Agricultural Production in Communmst China (Madison: University of Wisconsin Press, 1970), pp. 139 and 151.
Columns 2 and 3, U.S. National Foreign Assessment Center, China Economic Indicators (Washington, D.C.: Central InteUigence Agency, 1978), pp. 24-25. Columns4-6, U.S. National Foreign Assessment Center, China: Economic Indicators (1977), p. 13. Column 8, based on a constant total of 107 million cultivated hectares cited
co in Dwight H. Perkins, "Constraints Influencing China's Agricultural Performance," in U.S. Congress, Joint Economic Committee, China: A Reassessment of theEconomy (Washington, D.C.: U.S. Government Printing Office, 1975), p. 353.
82 ECONOMIC GROWTH AND EMPLOYMENT IN CHINA
Increase of industrial inputs
The second major change that has contributed to the develop-ment of China's agricultural sector since 1957 is the presence ofrapidly increasing and, by the 1970s, large supplies of industrialinputs, including power, machinery, building materials, steel, pe-troleum products, and chemical fertilizer. The pace of growth isillustrated in Table 4-3, from which average annual growth ratesfor flows and stocks of several products can be derived, as shownbelow:
Averageannualgrowthrates
Flows and stocks (percent)
Rural power consumption, 1957-78 21Small-scale cement output, 1962-77 23Chemical fertilizer output, 1957-78 22Stock of irrigation and drainage equipment, 1957-78 25Stock of tractors (horsepower), 1957-78 20Stock of power tillers (horsepower), 1970-78 50Stock of three machinery types (horsepower per hectare), 1957-78 24
The magnitude of these product flows may be illustrated by ob-serving that in 1977/78 power consumption and small-scale cementmanufacture in rural areas alone surpassed the national output to-tals for power in 1957 and for cement in 1971.
The addition of growing quantities of chemical fertilizer, muchof it manufactured in county-level plants, to traditional organicfertilizers has pushed China into "a class with some of the world'shighest users of fertilizers including Japan." 10 Chemical manufac-turers also provide the farm sector with large quantities of pesti-cides and plastic sheeting. Rural construction projects, includingannual winter works campaigns involving more than 100 millionpeasants, depend on cement, steel, explosives, and other manu-factured construction materials.
The expanded production of farm machinery has brought about
10. Dwight H. Perkins and others, Rural Small-Scale Industry in the People's Re-public of China (Berkeley: University of California Press, 1977), p. 199.
LABOR ABSORPTION IN AGRICULTURE, 1957-75 83
a significant degree of agricultural mechanization. Table 4-3 pre-sents inventory estimates for three types of farm equipment: ir-rigation and drainage machinery, tractors, and power tillers. Thesefigures show that three types of equipment alone now provideChinese farmers with mechanical power somewhat larger than the0.69 horsepower per hectare of cultivated land available to Japa-nese farmers from all types of power machinery in 1955."1 SinceChinese farmers also make use of large numbers of threshers aswell as lesser quantities of other types of rmachines, it is possibleto conclude that, despite the evident labor intensity of Chinesefarm practices, agriculture will soon approach the levels of mecha-nization that prevailed in Japan in the early 1960s. Under theseconditions China's present objective of achieving basic mechani-zation by 1980, although vague, is not unrealistic.
Rural electrification and farm machinery, both of which havespread rapidly through the Chinese countryside since the mid-1960s, illustrate the effect of industrial goods on the farm econo-my.' 2 Perhaps the largest quantitative effect of electrification onrural employment patterns has resulted from the mechanization ofgrain processing, which has relieved women of a time-consumingchore. A knowledgeable county official in Kiangsu province in-formed members of the Rural Small-Scale Industry Delegation thatbefore mechanization there were two ways of processing rice. Onewas by ramming with a stone rod (mortar and pestle), whichmight process five kilograms in two hours; the other was a pedal-operated device that could hull twenty-five kilograms of grain inthree hours. If it is assumed that these data refer to the quantity ofunhulled rice that can be processed in a given time period, thefeeding of a family of five on a rice diet of 1,000 kilograms wouldrequire a housewife to process one ton of unhulled grain each
1t. Japanese figures calculated from Keizo Tsuchiya, "Economics of Mechani-zation in Small-Scale Agriculture," in Agriculture and Econ,omic Growth: Japan's Expe-rien'ce, ed. Kazushi Ohkawa, Bruce F. Johnston, and Hiromitsu Kaneda (Princeton,N.J.: Princeton University Press, 1969), p. 158; and Yujiro Hayami and Vernon W.Ruttan, Agricultural Development (Baltimore: Johns Hopkins Press, 1971), p. 340.
12. In addition to the power-consumption figures in Table 4-3, the spread ofelectricity in rural China can also be traced from the frequency of articles in farmjournals warning of its hazards, emphasizing the need to keep power lines aboveground level, and describing first-aid procedures for shock victims.
84 ECONOMIC GROWTH AND EMPLOYMENT IN CHINA
year. This would involve from 240 to 800 hours of work during thecourse of a year.
Although these figures refer only to rice processing, they give arough idea of the amount of labor released by mechanization ofgrain processing, which may eliminate as much as 95 percent ofthe labor required in grain milling.1 3 If the average rural house-wife devoted only 250 hours a year to this task, and assuming 170million peasant households, the annual premechanization laborinput into household grain processing would be 42.5 billion man-hours-or, assuming a work-year of 275 eight-hour days, theequivalent of 19.3 million man-years. If the average rural house-hold devoted 800 annual man-hours to the task of grain hulling,the full-time equivalent would amount to 61.8 million man-years.'4 These man-equivalents give only the order of magnitudeof the released labor time, but they suffice to show that, in com-parison with the estimated growth of agricultural labor force of97.3 million persons during 1957-75, the labor time released bythis one variety of mechanization was very large.
Mechanized spinning has also released large quantities of fe-male household labor. According to one account from Honanprovince: "It had long been a tradition for women in China's cot-ton-growing areas to spend their spare time spinning yarn onhome-made wheels, and then weaving cloth to their own taste.The weaving, on a wooden loom, is not so hard. A skilled house-wife could turn out 10 to 20 feet of cloth a day. But it took four orfive days to spin the yarn needed for a day's weaving. The spin-ning mill has been built by the commune to take this burden offthe women."' 5 In this case, mechanization reduces the direct la-bor input into home weaving by 80 percent; the superior qualityof machine-spun yam also lowers the amount of cotton required toproduce each foot of cloth.
Irrigation, which absorbed from 12 to 17 percent of farm labor
13. One report implies that mechanization raises labor productivity in the man-ufacture of rice flour by a factor of twenty. See C.hina News Analysis, no. 1,127 (1978),
p. 6.14. The figure of 170 million rural households is derived from the rural popu-
lation figure for 1975 shown in Table 2-6 and average rural household size of 4.4estimated by Crook, "The Commune System," p. 409.
15. Chu Li and Tien Chieh-yun, Inside a People's Commune (Peking: Foreign Lan-guages Press, 1974), pp. 86-87.
LABOR ABSORPTION IN AGRICULTURE, 1957-75 85
in China's rice-growing areas during the 1930s,16 is another majortask that is being transformed by electrification and mechaniza-tion. Delivery of water to the fields by electric or diesel pumps isnow standard practice throughout large areas of rural China. Thiseliminates the need for human and animal power formerly usedby traditional methods of moving water. Wooden chain pumps ofa type commonly used in prewar China enable one man to liftthirty-nine tons of water a distance of three feet in one ten-hourday. A longer lift reduced productivity: traditional waterwheelsused to raise water from wells may have produced less than twotons per man-day. Improved manual waterwheels developed dur-ing the 1960s raised this figure to between 4.2 and 5 tons per man-day."' A five-horsepower gasoline-powered pump can move 570tons of water a day; depending on the vertical distance involved,one horsepower of this type of machinery may perform the workof between 15 and 285 laborers. 18 A number of reports from sever-al provinces indicate that one horsepower of pumping equipment,operating from 800 to 1,000 hours each year, can provide enoughwater to irrigate and drain from 30 to 40 mou of cropland.' 9
Mechanized irrigation does more than simply replace humanand animal labor. Mechanical pumps can perform tasks that werepreviously impossible. They can service fields situated far aboveor far away from natural water courses; they can also exploit waterdeposits deep beneath the ground.2 0 The land can be rapidly irri-
16. Buck, Land Utilization, p. 304.17. Information on wooden chain pumps is from King, Farmers of Forty Cen-
turies, p. 263; for improved manual waterwheels, see JPRS, no. 42,495 (1965), p. 7,which states that these devices raised working efficiency "more than twofold,"implying that labor productivity for traditional waterwheels was only one-third ofthe level reached by improved versions.
18. See Table 4-4.19. One mou is equivalent to 0.0667 hectare or 0.1647 acre. "Several Points
About Mechanized Irrigation and Drainage in Kiangsu," Chung-kuo shui-li [ChineseWater Control], no. 1 (1957), p. 49, reports that in 1957 the province's 125,000 horse-power of irrigation and drainage equipment served 5.8 million mou of cropland,for an average of 46 mou per horsepower; most equipment was used between 800and 1,000 hours a year. Similar averages for regions in Chekiang and Hupei as wellas Kiangsu appear in jpRs, no. 15,657 (1962), p. 21; no. 16,268 (1962), p. 49; and no.22,806 (1963), p. 72.
20. A report published in 1967 stated that a 3.5-horsepower lift pump can ser-vice 100 mou of land located 100 meters above water level, and a 7-horsepower lift
86 ECONOMIC GROWTH AND EMPLOYMENT iN CHINA
gated or drained with pumps that operate twenty-four hours aday. As a result, mechanization creates a potential not only forhigher output within the traditional cropping pattern, but also foradditional increases from the introduction of modified croppingsystems that use greater quantities of resources but promise ahigher output in return.
Mechanized threshing, which is now common in some parts ofChina, illustrates how machinery can create the opportunity forintensified farming cycles. Electric threshing machines come invarious sizes: large models can remove 50 kilograms of grain aminute, and smaller units can handle 1,200 kilograms of wheat anhour.2 ' These machines require from two to three workers to feedin the sheaves and remove stalks and grain; additional labor isneeded to winnow the grain, sometimes aided by electric fans toblow away the chaff. Although this is still a labor-intensive pro-cess, it consumes less labor and is also less taxing than traditionalmethods of threshing. Reducing the length and intensity of laborrequirements in the peak season clearly creates opportunities forintensification of farming.
Wheat threshing is also accomplished using stone rollers pulledby tractors. One report states that one tractor can perform the workof twenty-four draft animals, each of which consumes from 150 to300 kilograms of food grains a year, along with quantities of fod-der.2 2 This shows that machinery can save land by freeing arableacreage from fodder crops as well as saving labor, here in the formof animal tending.
A variety of other machines are now used to process crops. Hsi-yang county in Shansi province reports that a corn-shucking ma-chine can process 50,000 kilograms a day, whereas a strong workercan process only 250 kilograms by hand.2 3 A cotton gin testednear Peking enabled three men to process six kilograms an hour-
pump can irrigate 200 mou of land situated 200 meters above water level (jPRS, no.42,484 [1967], p. 8). High-pressure piston pumps made by county-level machineryplants in Honan province and raising water well over fifty meters were inspectedby the Rural Small-Scale Industry Delegation in June 1975 (Rawski Trip Notes).
21. Perkins and others, Rural . .. Industry, pp. 130-34; and Rawski Trip Notes.22. JPRS, no. 21,361 (1963), pp. 1 and 6.23. Yung Ta-chai ching-shen kao nung-yeh chi-hsieh-hua [Use the Ta-chai Spirit to
Raise Farm Mechanization] (T'aiyuan: Shan-hsi jen-min ch'u-pan-she, 1974), p. 25.
LABOR ABSORPTION IN AGRICULTURE, 1957-75 87
or, assuming an eight-hour day, sixteen kilograms per man-day,compared with from two to three kilograms for manual la-bor.24 Other crop-processing machines used in rural China in-clude fodder choppers, sugar-cane defoliators, winnowing ma-chines, and small numbers of combine harvesters.
Transport is another area in which machines have influencedpatterns of rural employmcnt. Rural transport has been affected bythe growth of national networks of rail, water, and highway trans-port and by the expansion of bicycle production, but the greatesteffect has come from the growing substitution of tractors and pow-er tillers for carrying poles and man- and animal-drawn carts.
Power tillers are manufactured in most provinces and cost ap-proximately 2,000 yuan. They are powered by diesels of from sev-en to twelve horsepower, which are usually made in the sameprovince as the tractor. One producer reports that when hitched toa trailer, a twelve-horsepower power tiller can haul one ton of car-go at a speed of fifteen kilometers an hour.25 The increasing use ofthese vehicles releases labor for other tasks. The potential numberof workers involved may be seen from a 1957 estimate of 10 millionworkers, or 4.3 percent of the agricultural labor force, engaged intraditional transport work.26
Tractors and power tillers are also used in land preparation. Ma-chine plowing not only saves labor, but also may improve thequality of plowing in depth and timing. The overall effect of thesemachines is illustrated by the experience of a model unit in Shansiprovince: "The power tiller ... is a multi-purpose machine. Eachunit is used 345 days per year to plow 500 mou of land, transport550 tons of grain, 3,500 tons of organic fertilizer, 50 tons of taxgrain, 625 tons of ashes, 20 tons of threshed grain, deliver 100 tonsof chemical fertilizer and cement, haul 500 tons of coal for the com-mune members, 390 tons of straw, also to fight drought by pump-ing 40,000 cubic meters of water and to haul 100,000 cubic metersof rock."2"
24. JPRS, no. 44,251 (1968), p. 29.25. Perkins and others, Rural . . . Industry, chap. 5; and Rawski Trip Notes.26. Ta-chung Liu and Kung-chia Yeh, The Economy of the Chinese Mainland
(Princeton, N.J.: Princeton University Press, 1965), p. 69.27. Yung Ta-chai dcing-shen, p. 56.
TABLE 4-4. AGRICULTURAL LABOR PERFORMANCE USING VARIous TECHNIQUEs, 1959
Traditional Improved MechanicalActivity implements implements implements
Plowing One man, two animals, One man, two animals, Two men, one 35-horsepowerthree mou a day ten mou a day tractor, seventy mou a day
Seeding One man, one animal, Two men, three animals, Two men, one 24-horsepowertwelve mou a day fifty mou a day tractor, 240 mou a day
Irrigation One man drawing from One man using Five-horsepower gasolinea well using bucket, waterwheel, pump, 570 tons a dayfive tons a day ten tons a day
Harvesting Manual, one man, One man, one animal, Four men, one 40- horsepowertwo mou a day sixty mou a day tractor, 330 mou a day
Threshing Stone rollers, Animal-powered One large 22- horsepowerone man, one animal, thresher, six men, thresher, fourteen men,750 kilograms a day one animal, 20,000 kilograms a day
2,500 kilograms a day
Source jmjp, November 17, 1959, cited in Yamamoto Hideo, Ou2goku nogyd gijutsu taikei no tenkai [Development of China's System of Agricultural Technology](Tokyo: Ajia keizai kenkyuijo, 1965), p. 153.
LABOR ABSORPTION IN AGRICULTURE, 1957-75 89
China stands on the verge of major efforts to mechanize somebasic field operations, principally the transplanting of rice. Me-chanical transplanters are manufactured and used in the suburbanregions surrounding Shanghai and Peking and in other regions aswell. At Ma-lu Commune (Chia-ting county, Shanghai), experi-ments have shown that, with special paddy preparation, mechani-cal transplanting of rice can save labor without reducingyields.2 8 At another model commune in Hupei, machine trans-planting reduced labor requirements in transplanting from theprevious level of from sixteen to seventeen man-days per mou forsingle-crop rice to the 1976 level of from eleven to twelve man-daysper mou for transplanting two crops.2 9 Experiments conducted inseveral regions during 1959 indicated that transplanting machinescould increase labor productivity in this task by a factor of fromfive to seven; one commune near Shanghai reports a fifteenfoldrise in labor productivity after transplanting was mechanized. 3 0
Nationally, the number of transplanters in use rose from 31,100 in1966 to 277,000 in 1973.31
The results of a study made in 1959 are shown in Table 4-4; theysummarize some of the ways in which mechanization can reducehuman and animal labor requirements. These data illustrate thelabor-saving nature of electrification and mechanization inChlna's farm economy. But what of the economic effect of thesechanges? Mechanical operations are often expensive in relation tomanual labor. The purchase price alone for a power tiller is equiv-alent to the product of from six to seven man-years of farm labor;larger tractors cost up to ten times as much as power tillers; fuelcosts, although subsidized, are not low. In perhaps an extremecase, a unit in Chekiang reported that bills for fuel, repairs, and
28. Perkins and others, Rural . .. Industry, pp. 128-29; and Rawski Trip Notes.29. Liu-chi kung-she nung-yeh chi-hsieh-hua [Farm Mechanization At Liu-chi Com-
mune] (Peking: Jen-min ch'u-pan she, 1976), p. 20.30. jmjP, March 5, 1960, cited in Amano Motonosuke, Chagoku n6gy6shi kenkyu
[Studies in Chinese Agricultural History] (Tokyo: Ochanomizu shob6, 1962), pp.462-63; and Peter Schran, "Farm Labor and Living in China," (Champaign: Uni-versity of Illinois, processed, 1976), p. 14.
31. Leslie T. C. Kuo, Agriculture in the People's Republic of China (New York: Prae-ger, 1976), p. 224.
90 ECONOMIC GROwrH AND EMPLOYMENT IN CHINA
other costs associated with mechanical pumping amounted to one-fourth of all farm production costs.3 2
High costs imply that mechanization will not be profitable un-less it leads to an increase in total farm output. The high yieldsdeveloped under traditional systems of husbandry make it unlike-ly that substantial increases in output can be obtained merely byreplacing human or animal labor with machines. Unless the laborreleased by mechanization is diverted to activities that contributeto further intensification of cultivation or create new income-earn-ing opportunities, mechanization is likely to raise farming costsand reduce employment opportunities.
With the exception of mechanical irrigation, the direct and im-mediate effect of the innovations described above invariably re-duces the demand for labor. Improved water supply acts in theopposite way by stimulating the growth of both crops and weedsand therefore raising labor requirements for weeding, cultivating,harvesting, threshing, and storage. Other types of mechanization,however, displace workers without creating new demands for la-bor. In an economy already troubled by seasonal idleness, the in-troduction of large quantities of machinery into a static farmingsystem might therefore do more harm than good.
This unfavorable outcome has not occurred in China becausethe farming system has been modified in directions that permitmechanization to complement rather than compete with rural la-bor. The success of China's farm economy in raising productionthrough the simultaneous absorption of both labor and machineryis best seen through a detailed review of recent changes in theagricultural sector. These shifts are grouped into four categories:intensification of cropping practices, intensification of the crop-ping cycle, shifts toward labor-using farm activities, and rural con-struction programs.
China's undeniable success in absorbing new cohorts of ruralworkers, however, has brought with it a substantial decline in themarginal product of labor. Although the rising number of work-days per farm laborer has prevented output per man-year fromdeclining, both output per man-day and total factor productivity
32. JPRS, no. 15,657 (1962), p. 21.
LABOR ABSORPTION IN AGRICULTURE, 1957-75 91
in agriculture were considerably lower in 1975 than in 1957. Theproductivity dimension of labor absorption is discussed in theconcluding section of this chapter.
Intensification of Cropping Practices
The phrase "intensification of cropping practices" refers to an in-crease in the resources applied to each unit of sown acreage in theabsence of changes in the type of crops grown or in the rotationcycle. Chinese publications and visitors' accounts indicate thatthis type of intensification has absorbed considerable quantities oflabor.
Land preparation
Chinese farm specialists advocate deeper plowing than was tra-ditionally practiced. Although deep plowing, which is intended toraise crop yields, is often associated with mechanization, therehas probably been some increase in human and animal labor de-voted to plowing each unit of land that is not plowed by tractors.
The major increase in labor devoted to land preparation, how-ever, has come in the use of organic fertilizers. These fertilizers,which include human and animal manure, plant wastes, ash, silt-bearing mud, and a variety of other materials, are applied in largequantity to arable lands throughout China. Two U.S. groups tour-ing China in 1975 and 1976 visited a number of communes atwhich a minimum of 50 and a maximum of 225 metric tons oforganic fertilizers were applied annually to each hectare of culti-vated land (that is, from 5 to 22.5 kilograms a square me-ter). 33 Numerous other reports could be cited from visitor ac-counts or Chinese sources.
At the national level, Thomas Wiens has calculated the growthof nutrients supplied by organic and chemical fertilizers during1957-71; his results are shown in Table 4-5. Estimated nutrientsupplies rose by 40 percent, with virtually the entire increase com-
33. Perkins and others, Rural . . . Industry, Table 8.3; Virgil A. Johnson andHalsey L. Beemer, Jr., eds., Wheat in the People's Republic of China (Washington,D.C.: National Academy of Sciences, 1977), p. 163.
92 ECONOMIC GROWTH AND EMPLOYMENT IN CHINA
TABLE 4-5. ESTIMATE OF FERTILIZER SUPPLY, BY SOURCE, 1957-71(million of tons of nutrient)
Kilograms of nitrogen percultivated hectare 51.1 53.5 69.8 92.8
a. Interpolated or assumed constant in original source.Source: Taken or calculated from Thomas B. Wiens, "Agricultural Statistics in the People's
Republic of China," in Quantitative Measures of Cnna's Economic Output, ed Alexander Eckstein(Ann Arbor: University of Michigan Press, forthcoming), Table 18.
ing during the decade 1962-71. China's hog population, whichrose from 146 million in 1957 to 287 million in 1974 and to 301million in 1978, provided much of the increased nutrients.3 4 In-deed, Wiens' data show that, following a decline in the hog popu-lation caused by poor harvests and early commune mismanage-ment, growth of the hog population contributed more nutrients toChina's farmlands during 1962-71 than the rapidly expandingsupply of chemical fertilizers.
Taken together, the organic nutrient sources noted in Table 4-5contributed 56.2 percent of increased nutrients during 1957-71and 60.9 percent during the shorter period 1962-71. Despite thegrowing share of chemical products in the fertilizer total, evidenceof widespread nutrient deficiency shows the continuing impor-tance of organic fertilizers to raising the supply of nutrients as wellas to maintaining soil structure.3 5
34. The figure for 1957 is from Nai-ruenn Chen, Chinese Economic Statistics (Chi-cago: Aldine, 1967), p. 340; for 1974, see Bureau of Foreign Affairs, "Briefing onChinese Agriculture," p. 3; for 1978, see "Communique on Fulfillment of China's1975 Economic Plan," Beijing Review, no. 27 (1979), p. 38.
35. Visiting plant scientists report that "on farmers' fields there was evidencein most areas visited of a nitrogen shortage for rice. It appeared that some nitrogen
LABOR ABSORPTION IN AGRICULTURE, 1957-75 93
In the present context, the most significant characteristic of or-ganic fertilizer is the enormous labor input associated with its col-lection, preparation, and application. One pig produces an aver-age of 1,642 kilograms of excreta annually. Nitrogen retention issubstantially increased by mixing the excreta with dirt from thefloor of the pigsty and burying this compost in covered pits topromote fermentation. 36 In Hai-ch'eng county of Liaoning prov-ince the peasants accumulate from 17,500 to 20,000 kilograms ofmanure (excreta plus earth) annually for each pig. This processrequires the following amounts of labor:37
Process Man-days Animal-days
Earth transport 2.5-3.5 5-7Dumping earth into pit 1.2-1.5 -Paving pit with grass 1-2 -Getting manure out of pit 1.5-3.5 -Pulverizing manure 3-3.2 -Manure transport 6.5-7.5 6.5-7.5Manuring fields 1.5-2.5
Annual total for preparingand applying manure fromone pig 18.2-23.7 11.5-14.5
I Ts'ai and Wang P'i-chang contend that although this process en-sures a high rate of nitrogen retention, "it causes excessive ex-penditures of labor and animal power." They suggest that annualmanure accumulation be reduced to 10,000 kilograms per pig byusing less earth.3 8 If it were assumed that reducing manure accu-mulation from about 18,750 kilograms (the midpoint of the datafrom Hai-ch'eng county) to 10,000 kilograms for each pig wouldreduce labor requirements proportionately, the labor requirement
had been applied, but the leaf color often suggested that this was inadequate"(Plant Studies in the People's Republic of China (Washington, D. C.: National Academyof Sciences, 1975], p. 46). For similar observations on north China, see Schran,"Farrn Labor and Living," p. 20.
36. Nung-yeh ch'ang-yung shu-tzu shou-ts'e [Handbook of Common AgriculturalData] (Peking: Jen-min ch'u-pan she, 1975), p. 101; I Ts'ai and Wang P'i-chang,"Ways of Improving the Economic Effect of Fertilization," Ching-chi yen-cdiu [Eco-nomic Research], no. 4 (1965), translated in ECMM no. 475 (1965), p. 30.
37. 1 and Wang, pp. 37-38.38. Ibid.
94 ECONOMIC GROWTH AND EMPLOYMENT IN CHINA
for treating each pig's manure might be expected to decline fromapproximately twenty-one man-days and thirteen animal-days toabout 53 percent of these amounts: that is, to about eleven man-days and seven animal-days:
Large animals-horses, mules, donkeys, cows, buffalo, andoxen-produce more excreta than hogs. An average of data forhorses and oxen gives an annual total of 9,125 kilograms per head,or 5.6 times the output of one hog. If similar labor inputs are as-sumed for processing one ton of excreta for pigs and large animals,labor requirements for composting pig and large-animal manurein 1957 and 1975 may be calculated as follows:3 9
Labor requirements for compostingEstimated animal (millions)
At 275 working days a year, the increased direct human labor (ex-clusive of animal tending) required to compost and process themanure of the enlarged animal population annually is equivalentto 11.5 million man-years for hogs and 23.3 million man-years forlarge animals. The combined total of 34.8 million man-yearsamounts to more than one-third of the rough total of 97.3 millionworkers added to China's agricultural labor force between 1957and 1975.
Less is known about the growth of quantities applied andhence of labor absorbed in preparing other types of organic fertil-izers. Application of human nightsoil is closely related to popu-lation growth. Availability of green manure and bean cakes de-pends on cultivation of green manure crops (which may have ex-
39. Animal population for 1957 from Chen, Chinese Economic Statistics, p. 340;for 1974175 from "Briefing on Chinese Agriculture," p. 3 (for hogs) and from un-published estimates made by Anthony Tang and Thomas Gottschang (for largeanimals). The reduced labor requirements mentioned in the text are used in thesecalculations.
LABOR ABSORPTION IN AGRICULTURE, 1957-75 95
panded more rapidly than is shown in Table 4-5) and of soybeans,respectively.40 One might speculate that the category "other non-chemical"-which includes mud from the bottoms of canals,streambeds, reservoirs, fishponds, lakes, and rivers; ash, leaves,weeds, and pirant refuse not used as animal feed; and manure fromchickens, ducks, rabbits, and other domestic animals-has not re-mained constant, as shown in Table 4-5, but has increased alongwith such variables as the number of dams, fish ponds, trees, andirrigation canals, as well as household coal consumption and over-all output of plant products.
In any case, there can be no doubt that collection, mixing, stor-age, transport, and application of various types of organic fertil-izers account for a significant portion of the increased labor inputinto China's farm economy. One Chinese economist sees the accu-mulation and application of organic fertilizer as limited by the op-portunity cost of the required labor: "[A]pplying fertilizers in lay-ers and giving the field a greater number of dressings according tothe dissimilar needs of agricultural crops . . . at different periodsof growth definitely can yield good results technically. But apply-ing fertilizers in layers and giving the field a greater number ofdressings will spend more labor. This calls for the weighing of theadvantages and disadvantages through comparing and analyzingthe economic results before we can make a final decision."41
The significance of organic fertilizers in rural China's laboreconomy may be summarized by referring to the same author'sobservation that "under the present condition of having to supplyan abundance of organic fertilizer, the amount of manpower andanimal power spent in the accumulation, transportation and appli-cation of manure generally takes up between 30 and 40 percent of the
40. The area planted to green manure crops rose from 3.42 million hectares in1957 to 6.78 million hectares in 1965 (Kang Chao, Agricultural Production in Commu-nist China [Madison: University of Wisconsin Press, 1970), p. 312) and to 12.3 mil-lion hectares in 1977 or 1978 ("Briefing on China's Agriculture," p. 3). Since thisarea rose by 81 percent between 1965 and 1978, it is quite likely that supplies ofgreen manure rose during 1965-71 rather than stagnating, as is shown in Table 4-5.
41. Yen jui-chen, "Several Questions on Increasing the Economic Benefits ofFertilizers," Ching-chi yen-chiu [Economic Research], no. 6 (1964), translated inECMM, no. 429 (1964), p. 24, with emphasis added.
96 ECONOMIC GROWTH AND EMPLOYMENT IN CHINA
total amount of manpower and animal powver expended in the wholeyear. "42
Planting and transplanting
Chinese farm specialists have advocated "close planting,"which means raising the density of plants in the fields, since theearly 1950s. Support for this labor-absorbing method has beeneroded, however, by the memory of irrational implementationand consequent reductions of output during the years of the GreatLeap Forward. Since then, Chinese agronomists have promoted"rational close planting," but recent disclosures indicate that thisalso has at times been counterproductive: for example, experi-ments in Hsiang-fen county, Shensi province, show that reducingthe number of cotton plants from 4,000 to 2,000 per mou raisescotton yields and also permits vegetables to be grown between therows of cotton plants.4 3 Other districts have claimed positive re-sults from close planting of cotton. In Hsin-hsiang county, Honanprovince, "Ch'i-li-ying Commune, after years of testing and popu-larization, has raised the density of its cotton plants from 2,000 to7,000 and even 8,000 per mou"; with use of this method, yieldsrose by 250 percent between 1957 and 1973.44 In Hsin-chou coun-ty, Hupei province, cotton was planted at a density of from 3,000to 4,000 plants per mou during the mid-1960s, with good results.4 5
The contribution of close planting to output growth and laborabsorption in other types of cropping is equally unclear. Closerplanting of rice plants can raise yields, but only if accompanied byincreased fertilization. 4 6 Specialists from the United States haveobserved that stunted produce may be the chief result of tighterspacing of vegetable plants.4 7
42. Ibid., with emphasis added. 1967 Fei-dh'ing nien-pao [1967 Yearbook of Chi-nese Communism] (Taipei: Fei-ch'ing yen-chiu tsa-chih she, 1967), p. 1383, gives anational figure of 40 percent of labor power occupied with manuring for the 1950s.
43. China News Analysis, no. 1,141 (1978), p. 6.44. Chu and Tien, inside a People's Commune, pp. 16 and 40.45. Ch'eng Chin-chieh, "The Way Liuchi Commune Wins Its Higher Grain and
46. 1 and Wang, "Fertilization," pp. 29-30.47. Plant Studies, p. 87.
LABOR ABSORPTION IN AGRICULTURE, 1957-75 97
Transplanting of rice shoots from seed beds into the main fieldis a well-known feature of traditional Chinese agriculture. Thisprocedure economizes on land and reduces the growing period inthe main field, thus allowing an increase in the index of multiplecropping (sown area/cultivated area) within a fixed growing sea-son. The highly labor-intensive practice of transplanting youngshoots from seed beds into the fields has been adopted for a grow-ing range of crops. In addition to rice, which is universally trans-planted, and vegetables, which were commonly transplanted be-fore 1949, some regions now transplant wheat, maize, cotton, soy-beans, rape, and "such fiber crops as hemp, jute and abutilonavicennae.1"48
Crop management
The amount of labor devoted to each crop-hectare is now con-siderably larger than in the past. Buck's surveys of China's farm-ing regions showed the following average human labor inputs percrop-hectare during 1929-33:49
National Average for region withCrop average highest labor inputs
The American Wheat Studies Delegation, which visited China in1976 was told that:
... the cultivation of "high yield plots" of wheat required225-450 days of work per sown hectare in the communes vis-ited, the most frequent reference being to 300 days per hec-tare. Similar estimates were given for corn, rice, and cotton.This greater and more uniform effort per unit of cropped landappears to be attributable to the fact that all land-not only
48. Ibid., p. 86; G. F. Sprague, "Agriculture in China," Science, no. 188 (1975),p. 552; Johnson and Beemer, eds., Wheat, pp. 19 and 111; JPRS, no. 42,524 (1967), p.12, and no. 44,014 (1967), p. 9.
49. Buck, Land Utilization, p. 302.
98 ECONOMIC GROWTH AND EMPLOYMENT IN CHINA
rice land-is being irrigated, that the same kind of heavyfertilizing is practiced on all crops, and that deep plowingand other forms of more intensive cultivation are used as arule. The workdays per sown hectare reached 450 in two in-stances . . . where corn and wheat were being transplanted
by hand. And they stayed-or had fallen below-150 in onecase . . . where part of the work had been mechanized.5 0
This information, which comes from a sample of advancedfarming regions, indicates that abundant supplies of organic andchemical fertilizers and water have created labor requirements (ex-clusive of composting) of roughly five times the prewar nationalaverage for each unit of land sown to wheat and maize, 2.3 timesfor cotton, and 1.5 times for rice (based on 300 man-days per sownhectare). These labor requirements do not take into account anyincrease in the index of multiple cropping. If the figure of 300 man-days per sown hectare for high-yield fields of irrigated maize,wheat, rice, and cotton is compared not with national averages,but with regions of peak prewar labor input for each crop, it isclear that the labor requirements of intensive cultivation in the1970s outstrip even these higher figures for every crop except rice.
To what tasks is this extra labor assigned? In the case of cotton,Chinese reports allow an answer of some precision. The data inTable 4-6 permit comparison of unit labor requirements derivedfrom Buck's nationwide surveys of the 1930s with reports fromthree units in Wu-kung county, Shensi province, for 1962. Thesecomparisons show that the added labor applied to cotton in theunirrigated Wu-kung fields goes primarily to three activities: culti-vating and pruning, harvesting, and indirect labor (probably com-posting).
Developments in Wu-kung may not be atypical. Chinese de-scriptions of cotton cultivation portray a highly labor-intensivesystem in which each plant receives individual attention. Farmjournals report that "during the budding period of cotton, the bestresult is observed when the fertilizer is applied directly near theroot" of the plant, rather than being broadcast.5 1 Another sourceobserves that "a usual process was to pluck the tips of cotton
50. See Johnson and Beemer, eds., Wheat, p. 111.51. JPRS, no. 43,415 (1967), p. 42.
LABOR ABSORPTION IN AGRICULTURE, 1957-75 99
TABLE 4-6. LABOR REQUIREMENTS, YIELDS, AND PRODUCTIVITY
IN COTTON GROWING, 1929-33 AND 1962
Wu-kung, Shensi, 1962
Survey data, Individual units1929-33 A B C
Labor requirements, total Labor requirements,(man-days per mou) 8.8 total (man-days 40.28 35.90 34.57
Direct labor per mou)Plowing 0.3 Direct laborDigging 0.2 Land preparation 0.84 1.33 3.75Harrowing 0.2 Planting 0.13 0.11 0.57Planting 0.4 Cultivating andCultivating 2.3 pruning 10.75 11.25 8.75Fertilizing 0.6 Transport andHarvesting 3.0 apply fertilizer 1.88 2.00 2.50Total 7.0 Plant protection 1.88 1.25 1.40
Output per man-day Output per man-day(kilograms)a 1.4 (kilograms)' 1.0 0.6 0.4
a. Output in kilograms of ginned cotton.Sources: 1929-33 data, John L. Buck, Land Utilization in China (Nanking: University of Nan-
king, 1937), pp. 302-04; 1962 data, Wu Yung-hsiang, "Appraisal of the Economic Effect of Dry-land Cotton Cultivation in Wu-kung County," Ching-chi yen-chiu [Economic Research], no. 10(1963), p. 33.
plants. ... A new method has been used since 1961 . . . the tipsare pinched slightly."5 2 A third source states that farmers in onearea rely on constant plowing and loosening of the soil and timelycutting of leaves and branches to control growth during the crucialbudding period.5 3 Similar care is exercised at the final stages ofplant growth, when "it is important to exterminate insect pests,
52. JPRS, no. 43,073 (1967), p. 18.53. JPRS, no. 43,410 (1967), p. 32.
100 ECONOMIC GROWTH AND EMPLOYMENT IN CHINA
prune the cotton plants properly, and carry out weeding work justas carefully as at the early stage" of growth.5 4 Harvesting is alsodone on a plant-by-plant basis. Chinese sources emphasize thedelicacy of this task, and visitors report that cotton fields "arepicked frequently and few open bolls are visible at any onetime. "55
How effective is this increase in the labor applied to preparing,cultivating, and harvesting in raising cotton yields? At the nation-al level, average yields per mou are known to have risen from thefigure of 12.6 kilograms reported by Buck for 1929-33 to 19 in 1957and an estimated 24 for 1964/65, indicating some progress towardthe regional yield targets of 20, 30, 40, and 50 kilograms per mouestablished during the mid-1950s.5 6 At least some of this increasemust be attributed to improved supplies of chemical fertilizer, wa-ter, and pesticides and to better seeds and mechanization-leav-ing the output effect of increased labor inputs uncertain. The datafor Wu-kung county are no more revealing. The figures in Table 4-6 seem to indicate a positive association between labor intensityand both yield and output per man-day; here again, however, useof pesticides and machinery must be considered. Furthermore,data for seven production brigades within the commune de-scribed as "Unit A" in Table 4-6 show a distinctly negative associ-ation between labor application and output per man-day, suggest-ing diminishing marginal labor productivity. Again, the impact ofhigher labor input is indeterminate.
Scattered references indicate that similar labor-using methodsare commonly applied to crops other than cotton:57
It is important to clean the peanut plant at the time of sprout-ing.
54. JPRS, no. 44,050 (1968), p. 1.55. jpRs, no. 43,377 (1967), p. 34, and Plant Studies, p. 108.56. National yield data from Thomas B. Wiens, "Agricultural Statistics," in
Quantitative Measures of China's Economic Output, ed. Alexander Eckstein (Ann Ar-bor: University of Michigan Press, forthcoming), Table 22; regional yield targetsfrom Kuo, Agriculture, pp. 110-11.
57. Quotations are from: JPRS, no. 42,495 (1967), p. 9, and no. 44,527 (1968), p.26; Plant Studies, pp. 46, 65 and 116; and Harold Reynolds, "Chinese Insect ControlIntegrates Old and New," Chemical and Engineering News (March 15, 1976), p. 30.
LABOR ABSORPTION IN AGRICULTURE, 1957-75 101
Increase the production of broad beans by cutting tips andmain stems.
Research in the northeast confirms results obtained else-where that a concentration of nitrogen fertilizers near theroot zone of the rice plant gave a greater efficiency of utiliza-tion than broadcast applications.
[Maize] planting is done by hand. Weed control is almostexclusively done by hand hoeing. Herbicides are used toonly a limited extent because of problems posed by both in-terplanting and crop sequences.
In the vegetable growing area around Shanghai . . . handwatering of individual plants helps assure success of thetransplanted crop.
One of the biggest plant protection resources is their hugehuman labor force.... Some 1,500 people in one communevisited are involved in plant protection work. Of these, 65raise and herd some 220,000 ducks-a traditional method ofcontrolling paddy insects. . . . The country has the manpow-
er to grow and deploy [wasps, fungi, bacteria, and other bio-logical control agents] by methods economically infeasiblehere. . . . Masses of 300,000 wasps per acre are released ...
Biological methods were used to control plant diseases and insectpests on 3.47 million hectares of land in 1976.55
Increasing use of chemical technology also requires a sub-stantial labor input. Reynolds reports that in the field of in-secticides, the Chinese have moved away from DDT, which bredresistance among target species, toward "narrower spectrum, lesspersistent organophosphorus insecticides," which require re-peated applications. 5 9 Chinese sources also emphasize the desir-ability of multiple applications of chemical fertilizers, particularlyfor sandy soils, which do not retain unused nutrients.6 0
The materials presented in this section lead to the conclusion
58. Peking Review, no. 30 (1977), p. 31.59. Reynolds, "Chinese Insect Control," p. 30.60. 1 and Wang, "Fertilization," pp. 27-28; JpRs, no. 43,679 (1967), p. 4, no.
44,050 (1968), p. 4, and no. 44,527 (1968), p. 3.
102 ECONOMIC GROWTH AND EMPLOYMENT IN CHINA
that intensification of cropping practices-an increase in resourcesapplied per crop-hectare of particular crops in the absence ofchanges in multiple-cropping or rotation patterns-has absorbedlarge amounts of labor during the past two decades. The largestsources of new labor demand within this category appear to havecome from an increased application of organic fertilizers and fromlarge increases in labor requirements for transplanting and culti-vating cotton, wheat, maize, other northern grain crops, and, to alesser extent, rice.
Intensification of the Cropping Cycle
The phrase "intensification of the cropping cycle" refers to an in-crease in the number of crops harvested per unit of cultivated landresulting from multiple cropping and intercropping. Multiplecropping and intercropping have long histories in China. Buckfound that the overall index of multiple cropping (sown area di-vided by cultivated area) had reached 1.49 in the regions for whichhe collected survey data during 1929-33; for regions in whichdouble cropping of rice was the chief farming system, the indexwas as high as 1.76. Since 1949 the national index of multiplecropping has risen from 1.31 in 1952 to 1.41 in 1957 and to morethan 1.50 in 1977 or 1978.61
Multiple cropping
Raising the index of multiple cropping requires major increasesin farm labor. In rice-growing areas, for example, a shift from oneto two crops raises labor requirements by from 60 to 70 per-cent. 62 Extension of multiple cropping is feasible in many areas inChina in which intensification is limited less by climate than bythe supply of labor, water, and fertilizer.
61. Information on index of multiple cropping from Buck, Land Utilization, p.274; Chen, Chinese Economic Statistics, pp. 284-85; and "Briefing on China's Agricul-ture," p. 4. The report that China's index of multiple cropping is more than 1.50probably indicates a figure between 1.50 and 1.60.
62. "Evolution and Development of the Paddy Crop Situation in the Lake Dis-trict," Chung-kuo nung-pao [China Agricultural Bulletin], no. 8 (1964), p. 27.
LABOR ABSORPTION IN AGRICULTURE, 1957-75 103
One way of raising the ratio of sown to cultivated acreage is todevelop plant varieties that either mature in a shorter time or aremore resistant to extreme weather conditions than existing varie-ties. In China reforms of this type are difficult because of the al-ready intensive cropping system developed over the centuries.New varieties of rice developed at the International Rice ResearchInstitute are unsuited to many parts of China because their grow-ing period is too long to fit into existing patterns of double andtriple cropping.6 3 A review of the secondary literature suggeststhat Chinese efforts at seed development over the past twentyyears have emphasized development of varieties that provide highyields while resisting common plant diseases, rather than devel-opment of fast-growing plant types. Recent reports indicate, how-ever, that more attention is being given to development of early-maturing varieties of rice, wheat, and vegetables to expand thescope for multiple cropping.64
The major stimulus to expansion of multiple cropping since1957 has come from changes that eliminate bottlenecks arisingfrom seasonal shortages of farm inputs, notably human and ani-mal labor. Buck found that 81 percent of 260 localities surveyedduring 1929-33 reported seasonal labor shortages, most often dur-ing the harvest period (see Table 4-2). The following report fromHsin-chou county, Hupei province, illustrates the problems en-countered by localities attempting to intensify the cropping cycle:
This place harvests a cotton crop and a wheat crop each year.However, from planting to harvesting, wheat and cottonneed a total of 428 days. . . . [T]his is the principal con-
tradiction of the two-crop system.... It finds concentrated
reflection in the two periods of "four quicks" and "threekinds of autumn work" during the summer harvest.
First, the "four quicks" period [that is, quick in harvestingwheat, destroying the stubble, controlling insect pests, and
63. Plant Studies, p. 45.64. General treatments include Plant Studies; Kuo, Agriculture, chap. 14; and
Benedict Stavis, Making Green Revolution (Ithaca, N.Y.: Cornell University RuralDevelopment Program, 1974). In 1976 the Wheat Studies Delegation observed that"the one major objective of all programs visited is early maturity" (Johnson andBeemer, eds., Wheat, p. 31).
104 ECONOMIC GROWTH AND EMPLOYMENT IN CHINA
dressing the land] lasts only about ten days, but there areeleven kinds of work to be done at the same time. Theamount of work involved is huge, and there is a time limit.
Next, the period for "three kinds of autumn work" [that is,autumn harvesting, plowing, and planting] also lasts onlyabout ten days. It is necessary to harvest cotton as well as toplant wheat. If the removal of cotton plants is postponed inorder to ensure the cotton harvest, wheat cannot be sown ingood time. If the cotton plants are removed earlier, cottonyield must suffer. This is the second hurdle which must benegotiated in order to ensure the two-crop system.6 5
If farmers attempt to complete a rotation cycle for which re-sources cannot meet peak demands, yields will fall. In Yuan-chiang county, Hunan province, a region in which double crop-ping of rice requires that four man-days of labor be devoted toeach mou within a period of fifteen or sixteen days during July andAugust, reducing the area of two crop rice from 70 to 57 percent ofthe paddy field area raised average yields. Observers concludedthat "[u]nder present conditions of labor supply and reliance onmanual labor, it makes sense for the lake district to allocate about50 percent of paddy land to double cropping."6 6
Under these conditions machines capable of replacing laborformerly devoted to irrigation, harvesting, threshing, transport,plowing, and transplanting during seasonal periods of peak labordemand can eliminate bottlenecks limiting the spread of multiplecropping. In the Hupei example described above, machinery per-formed tasks equivalent to 61 work-days for each of one com-mune's 2,205 workers. Use of threshing machines and power till-ers ensured timely processing of the wheat harvest and sowing ofthe cotton crop. In the same unit, "the 'two-way rush' [that is,rushing through harvesting and planting] has for years been thecritical period of time in which cotton and rice fight for labor pow-er, fertilizer, and water supply. But in 1964, because machineswere used to lift water, abundant labor power was saved. The
65. Ch'eng, "Liu-chi Commune," p. 3.66. "Evolution ... of the Paddy Crop," p. 28.
LABOR ABSORPTION IN AGRICULTURE, 1957-75 105
pressure of the 'two-way rush' on paddy fields was reduced, andthere were special shifts responsible for fighting the drought andguarding against insect pests in cotton fields."fi' Mechanizationallowed unprecedented harvests in this locale.
These anecdotes show that mechanization can create opportu-nities to add crops to the annual cycle without breaching the new-ly enlarged peak supplies of human, animal, and machine power.A recent report placing the 1977/78 index of multiple croppingabove 1.50, an increase of about 10 percent over the 1957 figure of1.41, indicates modest success in intensifying cropping patterns.New double-cropping areas have emerged in areas north of theYellow River, including Hopei and Shansi provinces and parts ofShantung and Honan, and a shift from double to triple cropping isreported for the delta regions of Kiangsu and Kwangtung. Becausethe area planted to green manure crops, which Chinese sourcesexclude from calculations of the multiple cropping index, grew by8.9 million hectares between 1957 and 1977/78, the overall sownarea has risen by approximately 17 percent over a period of twodecades, during which the cultivated area has remained near the1957 level of 112 million hectares.6 8
Intercropping
Intercropping, or simultaneous cultivation of more than onecrop in a single field, is common in many regions of China. Al-though foreign agricultural specialists report a wide variety of in-tercropping systems, the extent to which this represents a modifi-cation of traditional practice remains uncertain, as does thetreatment of interplanting in estimates of multiple-croppingindexes.6 9 It is worth noting, however, that intercropping raises
67. Ch'eng, "Liu-chi Commune," p. 4.68. Information about the index of multiple cropping and area sown to green
manure crops is from notes 40 and 61, above. The spread of multiple cropping isdiscussed in Plant Studies, pp. 114-15. Computation of the index of multiple crop-ping is discussed in Chen, Chinese Economic Statistics, p. 59. For cultivated area, seeibid., p. 285; Dwight H. Perkins, "Constraints Influencing China's AgriculturalPerformance," in U.S. Congress, Joint Economic Committee, China: A Reassessmentof the Economy (Washington, D.C.: U.S. Government Printing Office, 1975), p. 353;and "Briefing on Chinese Agriculture," p. 2.
69. Plant Studies, pp. 85 and 115-16; Johnson and Beemer, eds., Wheat, pp. 16-20.
106 ECONOMIC GROWTH AND EMPLOYMENT IN CHINA
requirements for both direct and (through fertilizer, water, and soon) indirect labor input into the growing process.
A Shift toward Labor-Using Farming Activities
One way of raising agricultural manpower requirements is to in-crease the share of relatively labor-using activities in the totalfarming picture. Data presented in Tables 4-7 and 4-8 show that theyears since 1957 have witnessed a modest but definite trend in thisdirection.
Buck gives the following data for main labor requirements forgrowing various crops during 1929-33:70
The five nongrain crops above can be regarded as labor intensivebecause they require more labor per acre than any grains exceptpaddy rice. Cotton is included because of recent increases in itslabor intensity. Other labor-intensive activities include vegetablegrowing and, because of the labor associated with the collectionand treatment of manure, the raising of hogs and draft animals.
Table 4-7 summarizes available data on output growth for vari-ous sectors of China's farm economy between 1957 and (wheneverpossible) 1974. These data show a clear pattern of differentialgrowth favoring labor-intensive products. With the exception oflarge animals (for which slow growth is associated with the grow-ing availability of tractors) and silkworm cocoons, each labor-in-tensive activity has grown more rapidly than output of graincrops.
A rough calculation of the gross value of agricultural output for
70. Calculated from Buck, Land Utilization, p. 302.
LABOR ABSORPTION IN AGRICULTURE, 1957-75 107
TABLE 4-7. GROWTH OF AGRICULTURAL OUTPUT, 1957-74
Gross value, 1957 Growth rate, Period(billions of post-1957 covered1952 yuan) (percent) by data in (2)
Other 2.12 2.20Soybeans 1.41 2.4e 1957-74Hemp 0.40 1.0 1957-74Sheep and goats 0.31 2.8 1957-72
Total identified 37.15 2.6aUnidentified 9.93Total output, plant and
animal products, 1957 47.08f
a. Average of component growth rates weighted by 1957 gross output values.b. Dwight H. Perkins, "Growth and Changing Structure in China's Twentieth-Century
Economy," in China's Modern Economy in Historical Perspective, ed. Dwight H. Perkins (Stanford,Calif.: Stanford University Press, 1975), p. 154, converted from 1957 to 1952 prices usingan index derived from Nai-ruenn Chen, Chinese Economic Statistics (Chicago: Aldine, 1967),p. 364.
c. Based on hog population figures shown in note 34 of this chapter.d. U.S. Central Intelligence Agency, People's Republic of China: Handbook of Economic In-
dicators (Washington, D.C., 1976), p. 3.e. U.S. Central Intelligence Agency, China: Agricultural Performance in 1975 (Washington,
D.C., 1976), p. 9.f. Thomas B. Wiens, "Agricultural Statistics in the People's Republic of China," in
Quantitative Measures of China's Economic Output, ed. Alexander Eckstein (Ann Arbor: Univer-sity of Michigan Press, forthcoming), Table 8.
Sources (except as noted): Column 1, Ta-chung Liu and Kung-chia Yeh, The Economy of theChinese Mainland (Princeton, N.J.: Princeton University Press, 1965), pp. 397-98. Column 2,Wiens, "Agricultural Statistics," Table 21, and, for tea, Wiens' note 81.
1974, presented in Table 4-8, shows that the incremental contribu-tion of labor-intensive activities to farm output growth was nearly50 percent more than their share in total output in 1957, whereasthe incremental contribution of grain is only about three-fourths
of its initial share of output. If data were available for dairying andhorticulture, two labor-intensive sectors that appear to have
108 ECONOMIC GROWTH AND EMPLOYMENT IN CHINA
TABLE 4-8. SECTORAL CONTRIBUIrONs TO GROWTH
OF AGRICULTURAL OUTPUT, 1957-74(billions of 1957 yuan)
a. Dwight H. Perkins, "Growth and Changing Structure in China's Twentieth-CenturyEconomy," in China's Modern Economy in Histoncal Perspective, ed. Dwight H. Perkins (Stanford,Calif.: Stanford University Press, 1975), p. 154.
b Based on the 1957 figure and the 2.6 percent annual growth rate for 1957-74 derived inTable 4-7
c. Based on component growth rates derived in Table 4-7.d. Converted from 1952 to 1957 prices using an index derived from Nai-ruenn Chen, Chi-
nese Economic Statistics (Chicago: Aldine, 1967), p. 364.e. Residuals.Source: Table 4-7.
grown rapidly since 1957, the trend toward labor-using activities
might be stronger than is shown in Tables 4-7 and 4-8.71
Strong performance of labor-intensive segments of the farm
economy raises the present estimate of the gross value of agricul-
tural output for 1974, shown below, above Perkins' results:7 2
Gross value of agricultural output(billions of 1957 yuan)
71. Chi 1-chai, "A Study of Food Output in Mainland China III," Fei-ch'ing yueh-pao [Chinese Communist Affairs], vol. 10, no. 9 (1967), translated in JPRS, no. 43,937(1968), p. 17, estimates that production of powdered milk rose at an annual rate of12.3 percent between 1957 and 1966.
72. Gross value estimates are from Dwight H. Perkins, "Growth and Changing
LABOR ABSORPTION IN AGRICULTURE, 1957-75 109
Perkins' estimate for 1964 is derived from the figure for 1974 us-ing Premier Chou En-lai's statement that output rose by 51 percentduring 1964-74. This shows the need for some upward revision ofPerkins' figure for 1974 which implies that growth of output dur-ing 1964/65-a year of stagnant grain production-reached an im-possibly high figure of 14.5 percent. Raising the figure for 1974 to83.076 billion yuan lowers the 1964/65 increase to 7.2 percent. Thisis still excessive, suggesting that either Perkins' figure for 1965 istoo high or the present figure for 1974 is too low.73
Further increases in labor requirements may have occurred as aresult of shifts in the composition of grain output. Since "the man-ual labor required for working in paddy fields is 2-3 times that forwheat or [maize]," the northward spread of rice cultivation mayhave raised the average level of labor input for each unit of acreagesown to food grains.74
Rural Construction
Annual campaigns to build water-conservancy and land-improve-ment projects during the winter months have become a regularfeature of Chinese rural life and one which has absorbed vastamounts of manpower during the past fifteen years. These cam-paigns, which encompass major projects coordinated in Peking, aswell as local projects planned and carried out by communes andbrigades, cover a wide range of activities including water encatch-
Structure of China's Twentieth-Century Economy," in China's Modern Economy inHistorical Perspective, ed. Dwight H. Perkins (Stanford, Calif.: Stanford UniversityPress, 1975), p. 155; Perkins, "Constraints," p. 351; Wiens, "Agricultural Statis-tics," Table 23; and Tables 4-8 and 4-11 in this chapter.
73. Although Perkins ("Growth and Changing Structure," pp. 117 and 155) andother analysts assume an unchanging rate of value added in agriculture, rapidlyrising consumption of chemical fertilizer, electric power, insecticides, petroleumproducts, and other purchased inputs means that the ratio of value added to grossvalue of output has declined over time, and that the growth rate of value added isconsequently lower than that of the gross value of agricultural output. This infer-ence is confirmed by a sample survey of 2,162 production brigades, which foundthat between 1965 and 1976 output per mou rose by 36 percent while productioncosts increased by 54 percent ("Strengthen Scientific Research on the Farm Econo-my," Kuang-ming jih-pao [Kuang-ming Daily], December 7, 1978).
74. JPRS, no. 21,971 (1963), p. 37.
110 ECONOMIC GROWTH AND EMPLOYMENT IN CHINA
ment, afforestation, irrigation, flood control, hydroelectric sta-tions, tubewells, and leveling, terracing, and reclamation of arableland.
In some regions, these programs have achieved dramatic re-sults. One Chinese source says the following about the formerlygrain-deficient northern provinces of Hopei, Honan, and Shan-tung:
Each winter-spring season, tens of millions of people bravedthe biting wind and snow and worked on irrigation projects.They raised and reinforced 1,000 kilometers of dykes....Several thousand rivers and tributaries were dredged ...freeing more than 6.6 million hectares of low-lying land fromthe threat of flooding and waterlogging. At the same time theinhabitants went in for water conservancy and other farmimprovement projects, concentrating on fighting drought.Reservoirs and terraced fields were built and trees planted onthe hilly areas ... to prevent soil erosion. Wells and ditcheswere dug on the plains and alkali leached from the soil, all ofwhich involved a tremendous amount of work. By 1970,however, the three provinces were in the main self-sufficientin grain, while their record output in 1973 was 2.5 times thatof . .. 1949, and an increase of 16,500 million kilograms over1965.75
Available data on the overall size and results of these cam-paigns appear in Table 4-9. These data show the truly massivescale of China's winter works campaigns, which in recent yearshave involved 30 percent of the entire rural labor force. With morethan half of the reported increase in irrigated area attributable totubewells, the bulk of construction work is directed toward im-proving use of existing water supplies and reducing the vulnera-bility of crop yields to inadequate or excessive rainfall.76
The timing of these campaigns coincides with the pattern ofseasonal idleness reported by Buck for the years 1929-33. Buck
75. New China's First Quarter-Century (Peking: Foreign Languages Press, 1975),p. 182.
76. James E. Nickum, Hydraulic Engineering and Water Resources in the People'sRepublic of China (Stanford, Calif: U.S.-China Relations Program, 1977), p. 28.
LABOR ABSORPTION IN AGRICULTURE, 1957-75 111
TABLE 4-9. WATER MANAGEMENT STATISTICS, 1930s TO 1977
Winter works campaign
Participants Earth and stone- Irrigated area Number of powered(millions work (billions of Millions of Percentage of tubewells
Year of persons) cubic meters) hectares arable land (thousands)
Note: Data for the winter works campaign of 1964/65 appear in the row labeled 1965, andsimilarly for other years.
n.a. Not available.- Negligible.a. Figure of 900,000 electrically powered wells in North China is from Robert Scalapino,
"Trip Notes," (unpublished, 1972).b. Annual average for the four campaigns from 1971/72 to 1974/75 reported in jMjp, October
21, 1975.c. Based on average annual increase of 1.6 million hectares of irrigated land achieved dur-
ing the campaigns of 1971/72 to 1974175 (BBC, no. w881 (1976), p. Al). Total arable land isassumed to remain constant.
d. James E. Nickum, Hydraulic Engineering and Water Resources in the People's Republic of Olina(Stanford, Calif.: U.S.-China Relations Program, 1977), p. 28.
e. BBc, no. w955 (1977), p. A2.f. Bureau of Foreign Affairs, "Briefing on China's Agriculture," pp. 3-4.Sources (except as noted): Estimates for winter works campaigns from James E. Nickum, "A
Collective Approach to Water Resources Development: The Chinese Commune System, 1962-1972" (Ph.D. dissertation, University of California, Berkeley, 1974), pp. 279 and 290-291; esti-mates for other categories, from Perkins, "Constraints Influencing China's Agricultural Perform-ance," in U.S. Congress, Joint Economic Committee, China: A Reassessment of the Economy(Washington, D.C.: U.S. Govemment Printing Office, 1975), p. 360.
found that rural male workers were idle for an average of 1.7months annually, with 80 percent of the idle time coming in thewinter months November through February (see Table 4-1). In
112 ECONOMIC GROWTH AND EMPLOYMENT IN CHINA
studying the winter works campaigns during 1962-72, JamesNickum found that this "distribution of idle time correspondsclosely to the recent winter-spring water conservancy activities" inwhich "the average participant . . . is active for 1V/2 to 2 monthsduring an active campaign." 77
It therefore appears that even before the increase in scale sug-gested by the participation data for the 1970s, winter works cam-paigns have reduced or eliminated traditional slack periods in thefarming calendar of a substantial segment of China's rural popu-lace, particularly in the north.
Nickum's findings are consistent with Chinese reports that dur-ing the mid-1960s construction consumed about 20 percent of thetime of the rural labor force.7 8 The share of winter works in totallabor input may have risen during the 1970s. This is suggestedboth by the participation data in Table 4-9 and by the findings ofthe American Wheat Delegation at advanced communes that hadpassed beyond the most intensive phase of construction: "Duringthe initial construction phase, which seems to have been com-pleted everywhere in two or three years, the communes invested... as much as 40-50 percent of their entire workdays. Even now,however, when what remains to be done is maintenance and im-provement of the facilities, the communes visited reported alloca-tions of 6-30 percent of their workdays to basic construction, theunweighted average being 20 percent." The delegation also ob-served, however, that "much if not most of the arable land ofNorth and Central China has been leveled and is being irrigated asof now," which indicates that whole regions may be workingmainly on maintaining and improving rather than constructingwater-control facilities.7 9
Focus on maintenance and upgrading is not inconsistent withthe rising participation shown in Table 4-9. This is because exten-sion of water-control and irrigation facilities creates major new la-bor demands. A rising water supply and, equally important, a re-
77. James E. Nickum, "A Collective Approach to Water Resources Develop-ment: The Chinese Commune System, 1962-1972," (Ph.D. dissertation, Universityof California, Berkeley, 1974), pp. 172 and 293.
78. The 20 percent figure is from a 1966 report cited in ibid., p. 280.79. Johnson and Beemer, eds., Wheat, p. 110.
LABOR ABSORPTION IN AGRICULTURE, 1957-75 113
duction in its variability raise yields and permit intensification ofthe cropping cycle (it has been seen how these changes increasethe demand for labor). In addition, the irrigation system itself ab-sorbs quantities of manpower for management and repair work.
The extent to which available water supplies actually fulfill theneeds of crops in the fields depends heavily upon the constructionand maintenance of ditches and gates, perfect leveling of fields,and other auxiliary projects. One survey found that the absence ofauxiliary projects could lower the use of water supplies by as muchas 40 percent. 80 Maintenance of water-control facilities necessi-tates frequent repair work, especially since most ditches are notlined or equipped with drainage tubing. The labor intensity ofmaintenance and repair work can be seen from the following sug-gestions for limiting leakage from irrigation channels: "looseningthe dirt of the bottom and side slopes before releasing water, thususing the dirt to seal holes and crevices; tamping the soil withpackers; covering the channels with clay; the use of small rocksand pebbles [that is, to seal holes] .. . and adding a certainamount of clay to the water to seal the crevices."'8
Overall Results: The Supply of, and Demandfor, Agricultural Labor
This chapter has surveyed various mechanisms for absorption oflabor that have operated in China's farm economy during the pasttwo decades. Any summary of the overall effect of these mecha-nisms on the balance between supply and demand for rural labormust recognize the mutual influence of the various componentsthat create demand for labor. The following passage gives someindication of these relations: "Agricultural development, in theChinese scheme, begins with water management and land im-provement. . . . With the provision of timely and adequate sup-plies of water, it becomes possible to introduce fertilizer-respon-
sive plant varieties together with the fertilizer needed to achievehigh yields for these varieties. Effective water management may
80. Nickum, "Water Resources Development," p. 296.81. JPRS, no. 44,050 (1968), p. 47.
114 ECONOMIC GROWTH AND EMPLOYMENT IN CHINA
also make it possible to increase the cropping index . . . and thisincrease will in turn require more fertilizer as well. All of theabove steps raise the demand for rural labor."8 2
Rural industry can provide the tools and construction materialsneeded for water-control and land-development projects, which inturn stimulate local demand for pumps, fertilizer, threshers, elec-tricity, and other industrial goods. Increased consumption of in-dustrial products stimulates nonindustrial components of thefarming cycle. Assured water supplies raise the returns to labor-intensive construction projects such as leveling of land, terracing,and construction of feeder ditches; and rising consumption ofchemical fertilizers improves not only the crop yield, but also theyield and nutrient content of green manures and plant wastes thatprovide the raw material for organic fertilizers.
The dynamic process of rural development stemming from theintroduction of collective organization and industrial inputs hasenabled China's farm economy to support a growing population atlow but modestly rising living standards with no increase in culti-vated acreage. Vigorous reclamation efforts have barely managedto match the steady alienation of arable land for housing, industri-al construction, irrigation projects, and roadbuilding. The growthof output recorded in Table 4-8 has come entirely from more in-tensive use of an essentially fixed land base.
The conclusion of this chapter is that during the past two de-cades collectivization and industrialization have modified theframework of China's rural economy in directions that have per-mitted rural labor as well as land to be used with increasing in-tensity. Intensification of cropping practices and of the croppingcycle, increasing adoption of labor-using plant and animal prod-ucts, and massive farmland construction campaigns have contrib-uted to agricultural development by a simultaneous raising of out-put and absorption of rural labor. The effect of these changes onthe labor market is summarized by the data in Table 4-10, whichcontains estimates of the supply and demand for agricultural laborin 1957 and 1975.
Construction of estimates of labor demand for 1975 must avoidprojecting conditions from atypical model units onto national to-
82. Perkins and others, Rural ... Industry, p. 194.
LABOR ABSORPTION IN AGRICULTURE, 1957-75 115
TABLE 4-10. SUPPLY OF, AND DEMAND FOR, AGRICULTURAL LABOR,
1957 AND 1975(billions of man-days)
1975
Category 1957 Estimate A Estimate B
1. Labor supply assuming 275 man-days ofwork a year
A. Low population base 63.0 86.0 86.0B. High population base 63.7 90.4 90.4
2. Labor demand, total 36.9 89.4 67.9A. Farm work 27.4n 71.2 49.7
B. Subsidiary work 6.2"1 9.9a 9.9"C. Construction 2.3' 8.3 8.3
(i). Winter works campaign n.a. 5 0 5.0(ii). Other n.a. 3.3' 3.3'
D. Other 0.9' 0 03. Degree of full employment
A. Low population base(i). Total labor demand - total supply 0.58' 1.03" 0.78h(ii). Annual workdays per worker 160 284 215
B. High population base(i). Total labor demand - total supply 0.58 0.99 0.75
n.a. Not available.Note: Column totals may not add because of rounding.a. Derived using the high estimate (line 1.B) of agricultural labor force.b. Based on revised calculations of total labor demand using the low estimate (line I.A) of
agricultural labor force in deriving entries for lines 2.B and 2.C (ii). These adjustments reducetotal labor demand by 0.3 and 0.6 billion man-days in 1957 and 1975, respectively.
Sources: For 1957; labor force totals are from Table 2-9. Number of man-days contributed byeach worker in each category is calculated from Peter Schran, The Development of Chinese Agricul-ture, 1950-1959 (Urbana: University of Illinois Press, 1969), pp. 64 and 75. Labor demand is theproduct of labor force and average days contributed in each category. Labor supply is theproduct of labor force and the assumed full-employment figure of 275 annual man-days. For1975; Line 1, product of agricultural labor force from Table 2-9, version A (for line l.A) orversion B (for line l.B) and the assumed full employment total of 275 annual workdays. Line 2.A,based on 1975 sown area of 165.7 million hectares. This is the product of estimated cultivatedarea of 107 million hectares (Perkins, "Constraints," p. 353) and a 1975 multicropping estimateof 1.549 sowings per cultivated hectare provided by Anthony M. Tang and Thomas Gotts-chang. Line 2.A (i), 165.7 million sown hectares times estimated labor input of 300 (Estimate A)or 200 (Estimate B) man-days per sown hectare. Line 2.A (ii), 165.7 million sown hectares timesestimated labor input of 130 (Estimate A) or 100 (Estimate B) man-days per sown hectare. Line2.B, product of agricultural labor force and assumed labor input of 30 annual man-days. Line 2.C(i), product of 100 million participants (Table 4-9) and average of 50 days' work per participant(based on lames Nickum's finding that "the average participant ... is active for 1.5 to 2months," ["Water Resource Development," p. 293]. Line 2.C (ii), product of agricultural laborforce and assumed labor input of 10 annual man-days. Line 3.A (i), line 2 (adjusted downwardas explained in note b, above) divided by line 1.A. Line 3.A (ii), line 3.A (i) multiplied by theassumed full-employment total of 275 annual man-days. Line 3. B (i), line 2 divided by line l.B.Line 3.B (ii), line 3.B (i) multiplied by the assumed full-employment total of 275 annual man-days.
116 ECONOMIC GROWTH AND EMPLOYMENT IN CHINA
tals. The critical assumption here concerns the number of man-days devoted to fertilizing and cultivating each hectare of sownarea (line 2.A). In the report of the Wheat Studies Delegation, themost common observation for cultivation is 300 man-days persown hectare, and use of organic fertilizer clusters around 75tons per sown hectare, implying a labor requirement of from 75 to188 man-days per sown hectare for fertilizing.8 3 These observa-tions are from advanced units, but most of these were located innortheast and north China, and not in the south, where labor in-puts tend to be higher than in the north.
It is therefore not implausible that the national average laborinput for cultivating and fertilizing each hectare of sown area isnow as high as 430 man-days-300 for cultivating and 130 (themidpoint of the range cited above) for fertilizing. Labor inputsexceeding this level, which is equivalent to 29 man-days per mou,have been reported for dryland cultivation; in irrigated areas, re-ported labor inputs range as high as 765 or more man-days.8 4 Thefigure of 430 man-days per sown hectare is used to derive the fig-ures shown in estimate A for 1975 in Table 4-10. The table alsoincludes an alternative calculation, estimate B, in which averagelabor input is reduced from 300 to 200 man-days for cultivatingand from 130 to 100 man-days for fertilizing each sown hectare ofland. The resulting estimates, in which the national average laborinput for cultivation and fertilizing is assumed to rise from 196 to300 man-days per sown hectare between 1957 and 1975, surely un-derstate the spread of intensive farm practices.8 5
Other assumptions built into Table 4-10 do not exaggerate thegrowth of employment. In line 2.B each worker is assumed tospend thirty days annually in subsidiary tasks such as forestry,horticulture, pisciculture, household crafts, dairying, tendingpoultry, hogs, or draft animals, and marketing; comparable fig-ures for 1957-59 were 26.9, 29.8, and 25.9 days.8 6 Constructionactivity outside the winter campaign period (line 2.C (ii)) is as-
83. Johnson and Beemer, eds., Wheat, p. 111.84. For dryland areas, see Table 4-6, above. For irrigated areas, see Johnson and
Beemer eds., Wheat, p. 162.85. The figure for 1957 is calculated from Peter Schran, The Development of Chi-
nese Agriculture, 2950-1959 (Urbana: University of Illinois Press, 1969), p. 107.86. Ibid., pp. 64 and 75.
LABOR ABSORPTION IN AGRICULTURE, 1957-75 117
sumed unchanged from the level of 1957: ten days a year for eachworker. 87 These assumptions yield shares of construction activityin total workdays considerably below the level of 20 percent re-ported for advanced units.8 8
In addition to allowing the different assumptions about the la-bor intensity of cultivation and manuring activities in 1975 thatare incorporated in estimates A and B, the employment estimatesderived in Table 4-10 allow also for the variations in the assumedsize of China's population and labor force that were discussed inChapter Two. Estimates assuming a low population base are de-rived from version A of the agricultural labor force estimatesshown in Table 2-9; these in turn are based on the low nationalpopulation figures published in Chinese sources and reproducedin Table 2-1. Estimates assuming a high population base are de-rived from version B of the agricultural labor force figures shownin Table 2-9, which is in turn based on John Aird's estimated pop-ulation figures shown in Table 2-1. Aird's higher population fig-ures appear more realistic than the low figures given by Chinesesources. Therefore, the estimates in Table 4-10 constructed on alow population base should overstate both the annual work-daysper agricultural worker and the ratio of labor demand to labor sup-ply in the farm sector during 1975.
In his study of Chinese farming during the 1950s, Peter Schranconcluded that the average agricultural laborer worked only 159days during 1957. Regardless of whether the estimates based onhigh or low population figures are found more reasonable, the re-sults derived in Table 4-10 indicate that, between 1957 and 1975,China's farm sector not only absorbed close to 100 million newworkers, equivalent to about 40 percent of the agricultural workforce in 1957, but also raised the average number of days workedconsiderably above the levels observed before 1960.
The data in Table 4-10 show that, at the very least, the numberof annual workdays in 1975 surpassed the estimated average of175-190 achieved during the tumultuous early years of the com-munes in the late 1950s.8 9 If the intensive cultivation practices ob-served by the Wheat Studies Delegation can be taken as represen-
87. Ibid.88. Johnson and Beemer, eds., Wheat, p. 110.89. Schran, Chinese Agriculture, p. 75.
118 ECONOMIC GROWTH AND EMPLOYMENT IN CHINA
tative of national averages (estimate A for 1975 in Table 4-10), theaverage number of workdays for each farm laborer is estimated atfrom 272 to 284 for 1975. This result would imply that China's ruraldevelopment program has removed most of the seasonal idlenessobserved during the 1950s and has brought the agricultural laborforce, with approximately 275 annual workdays a person, to a po-sition of virtually full employment.
If labor input per sown hectare in advanced agricultural bri-gades stands well above the national average, as is assumed inestimate B for 1975 in Table 4-10, a rise is found in the annualnumber of workdays for each agricultural laborer, with the esti-mate for 1975 falling between 207 and 215 annual workdays. Thisalternative represents progress toward full employment, but it im-plies that seasonal idleness continues in most areas of China.
All factors being taken into consideration, it seems most likelythat the nationwide average for 1975 is around 250 days. An aver-age of less than 250 days would be difficult to reconcile with thecertainty that leading communes in many areas of the country ob-tain 300 or more days of collective labor from their able-bodiedmembers. Recent demands that rusticated urban youths spend aminimum of 250 days a year in collective work suggest that theaverage may not exceed 250, for despite their lack of farming skillthese young men and unmarried women should be able to con-tribute more labor time than the average member of the commune.
Overall Results: Productivity Trends in Agriculture
At several points in the foregoing discussion there has been thesuggestion that agricultural reforms that absorb labor may fail toincrease or perhaps may even reduce total output. It is now pos-sible to analyze the behavior of partial labor productivity betweenthe benchmark years 1957 and 1975 and to probe more speculative-ly into trends in overall factor productivity in Chinese farmingsince 1957.90
90. All quantitative statements in the remainder of this chapter use the popu-lation, labor force, and employment estimates based on Aird's population figurescompiled in Table 2-1.
LABOR ABSORPTION IN AGRICULTURE, 1957-75 119
Table 4-11 presents estimates of agricultural labor productivityfor 1957 and 1975 in terms of gross value. Since, as is notedabove, the rate of value added in agriculture has declined overtime, these figures provide a more favorable view of productivitytrends than would emerge from calculations using agricultural val-ue added; the difference, however, appears small. 91
The figures in Table 4-11 show that agricultural output per man-year increased by 10 percent between 1957 and 1975. Conversionof the results to a value-added basis, if possible, would eliminatesome and perhaps most of this increase. It does appear safe toconclude, however, that annual output of the average member ofChina's rural work force did not decrease between 1957 and 1975even though nearly 100 million workers were added to a laborforce that already faced an extremely unfavorable man-land ratio.Absorption of this enormous incremental farm population with-out lowering average annual labor productivity must count as animportant and impressive achievement of China's rural economy.
When productivity is measured in output value per man-day,the results are equally clear: output per man-day declined sharplybetween 1957 and 1975, with the fall ranging from 15 to 36 percentdepending upon which assumptions are chosen with regard to thelabor intensity of cultivation and fertilizer preparation. Since man-days provide a much better measure of labor use than man-years,these unambiguous results point to diminishing returns as a seri-ous problem facing Chinese agriculture both during 1957-75 and,as population growth continues to enlarge the farm labor force, inthe future.
The effect of diminishing returns can be seen in further detailthrough the highly tentative estimates of overall factor productiv-ity in Chinese agriculture presented in Table 4-12. These calcu-lations distinguish four categories of inputs: land, measured by
91. If the survey results cited in note 73, above, were typical of China's entirefarm sector and if the net output ratio of 0.763 reported for 1957 were valid for 1965as well, the rate of value added in 1976 would be 0.732, or 96 percent of the initiallevel. This suggests that the use of gross value to measure farm output may inflate alabor productivity index linking 1957 with 1975 by something of the order of 5 to 10percent. Net output ratio for 1957 is reported in Shigeru Ishikawa, National Incomeand Capital Formation in Mainland China (Tokyo: Institute of Asian Economic Affairs,1965), p. 56.
120 ECONOMIC GROWTH AND EMPLOYMENT IN CHINA
TABLE 4-11. LABOR PRODUCTIVITY IN AGRICULTURE, 1957 AND 1975
1975
Category 1957 Estimate A Estimate B
1. Gross value of agricultural output(billions of 1957 yuan) 53.700 83.907
2. Labor inputMillions of man-years 231.5 328.8Billions of man-days 36.9 89.4 67.9
3. Labor productivity in gross valueYuan per man-year 232.0 255.2Yuan per man-day 1.46 0.94 1.24
Sources: Line 1, Table 4-8; the 1975 estimate is based on a I percent output increase during1974/75 as shown in U.S. National Foreign Assessment Center, China: Economic Indicators(Washington, D.C.: Central Intelligence Agency, 1977), p. 3. Line 2, Table 2-9 and 4-10; thesefigures are based on the high population base described in the notes to Table 4-10.
TABLE 4-12. ESTIMATED FACTOR PRODUCTIVITY IN AGRICULTURE,
a. Anthony M. Tang, "Input-Output Relations in the Agriculture of Communist China,1952-1965," in Agrarian Policies and Problems in Communist and Non-Communist Countries, ed.W. A. Douglas Jackson (Seattle: University of Washington Press, 1971), p. 287.
b. Index of total labor demand in man-days, from Table 4-10, line 2.c. Index of sown area. Data for 1957 are from Nai-ruenn Chen, Chinese Economic Statistics,
(Chicago: Aldine, 1967), p. 285; for 1975, see the notes to Table 4-10.d. Index of total nutrient assumed to grow throughout 1957-75 at the annual rate of 4.0
percent shown for 1957-71 in Table 4-5.e. Index is the weighted average of the stock of large animals (weight 0.9), which grew at
an annual rate of 0.9 percent after 1957 (Table 4-7) and aggregate horsepower of irrigation anddrainage equipment, tractors and power tillers (weight 0.1), which grew at an annual rate of 25percent during 1957-75 (Table 4-3).
f. Table 4-11.
LABOR ABSORPTION IN AGRICULTURE, 1957-75 121
sown area; labor, measured in man-days; current inputs, mea-sured by total nutrients provided by organic and chemical fertil-izers; and capital, measured by the stock of large animals (weight0.9) and the stock in horsepower of tractors, power tillers, andirrigation machinery (weight 0.1). The weights used to aggregatethese inputs are those proposed by Anthony Tang for calculationscovering the period 1952-65.
The resulting index of farm inputs for 1975 is, if anything, toolow. Plausible changes that would increase the growth of inputinclude (a) enlarging the list of current inputs to include pesticidesand other fast-growing manufactured items, which would lowerthe weight of organic fertilizer in the total and hence raise theindex for this input; (b) assigning a larger share of the capital cate-gory to machinery, which would sharply increase the index forthis input; and, most important, (c) shifting the weights in favorof current and capital inputs to reflect their growing importance inChina's farm economy.
Even with a low index of input growth, the figures in Table 4-12reveal a distinct downward trend in agricultural factor productiv-ity during the years 1957-75. If output were measured by valueadded rather than gross value of output, the decline would beslightly steeper. In the present version, the annual rate of declineranges between 1.7 and 2.4 percent depending upon the assump-tion made regarding the labor intensity of cultivation and fertiliza-tion in the terminal year. These calculations, though tentative,show convincingly that agricultural factor productivity declinedafter 1957 and suggest that the decrease was at least from one-quarter to one-third between 1957 and 1975.
On the basis of similar though more detailed estimates for1952-65 published by Anthony Tang, it can be seen that decliningfactor productivity has been a regular feature of China's farmeconomy since 1952:92
92. Estimates for 1952-65 are from Anthony M. Tang, "Input-Output Relationsin the Agriculture of Communist China, 1952-1965," in Agrarian Policies and Prob-lems in Communist and Non-Communist Countries, ed. W. A. Douglas Jackson (Seattle:University of Washington Press, 1971), pp. 289 and 295. Data for 1975 are fromTable 4-12.
122 ECONOMIC GROWTH AND EMPLOYMENT IN CHINA
Estimated factorproductivity Harvest
Year (1957 = 100) conditions
1952 107.0 Good1957 100.0 Average1965 91.4 Average1975 64-74 Average
The rather smooth pattern of decline shown by Tang's results for1952-65 suggest a Malthusian explanation focusing on diminish-ing returns to a growing farm labor force rather than one whichemphasizes problems associated with rural collectivization.The seeming acceleration of the decline in productivity after 1965raises several possibilities, including an intensification of dimin-ishing returns as farm employment rises, as well as continuingorganizational deficiencies in China's system of rural collectives.These issues will be explored further in the following chapter.
Chapter Five
Retrospect and Prospect
This study has shown that the People's Republic of China hasmade major strides in the direction of full employment for itsenormous labor force, numbering well above 400 million men andwomen. Although the absence of regular statistical publicationshampers quantitative investigation of the relation between eco-nomic growth and the supply of and demand for labor in China,available materials do allow a detailed comparison of labor marketconditions in the benchmark years of 1957 and 1975.
Employment and Unemployment in China
On the basis of John Aird's relatively high estimates of China'spopulation, which, as was shown in Chapter Two, appear to pro-vide the most realistic picture of current demographic conditions,the results of this study may be summarized as follows.'
Growth of the laborforce
China's labor force expanded during 1957-75 at an estimatedannual rate of 2.4 percent, which slightly exceeds the estimatedannual population growth rate of 2.2 percent. By 1975 the labor
1. Quantitative statements in this chapter are based on labor force and employ-ment figures derived from John Aird's population estimates shown in Table 2-1.Substitution of lower population figures would reduce the estimated growth of theagricultural work force and improve the balance between the supply of, and de-mand for, agricultural labor in the benchmark year of 1975.
123
124 ECONOMIC GROWTH AND EMPLOYMENT IN CHINA
force comprised an estimated 430 million persons, or 46 percent ofthe entire population.
Demand for labor outside agriculture
Both the urban labor force (growing at 4.8 percent annually) andnonagricultural employment (growing at 4.9 percent annually)rose more rapidly than the labor force as a whole during 1957-75.Although the absolute increment in nonagricultural employmentamounted to nearly 60 million persons, representing an increase of150 percent above the employment level in 1957, the growth rate ofnonfarm employment remained well below the growth rate ofnonagricultural output, which Perkins estimates at 7.3 percent ayear during the period 1957-74.2
The modest growth of nonagricultural employment relative tooutput stems largely from official policies and institutional ar-rangements that have moved industry, the sector of China's econ-omy with the largest contribution to aggregate output, in the di-rection of increased capital intensity and rising labor productivity.The low priority attached to industrial labor absorption is evidentfrom the relative growth rates of industrial output (9.7 percent an-nually, including handicrafts) and industrial employment (5.7 per-cent annually, including handicrafts), and also from the low anddeclining share of labor-intensive consumer manufacturers in theindustrial output total.3
The factors underlying industry's relatively slow absorption oflabor were discussed in Chapter Three. They include a develop-ment strategy that emphasizes the promotion of basic industries atthe national and regional levels, resource allocation rules that leadenterprises to favor the use of capital rather than labor to expand
2. Dwight H. Perkins, "Estimating China's Gross Domestic Product," CurrentScene, vol. 15, no. 3 (1976), p. 16.
3. Ibid., p. 15; Table 2-8; and Thomas G. Rawski, China's Transition to Industrial-ism: Producer Goods and Economic Development in the Twentieth Century (Ann Arbor:University of Michigan Press, forthcoming), chap. 4. The declining share of con-sumer products in industrial output is a result of their low priority in China'sinvestment planning. The share of light industry in state budgetary investmentwas only 5.4 percent in 1978; for 1979 an increase to 5.8 percent is anticipated. See"China's National Economy (1978-79)," Beijing Review, no. 26 (1979), p. 9.
RETROSPECT AND PROSPECT 125
output, specific technological conditions at various types of enter-prises, and a general reliance on foreign technologies that arebased on relatively high ratios of capital to labor.
This last point is worth some emphasis. China has developedindividual manufacturing processes, such as the production ofammonium bicarbonate fertilizer, that are not found in othercountries. China has also achieved a certain degree of success incombining labor-intensive ancillary operations with capital-in-tensive core technologies to produce sophisticated commoditieswith relatively low capital inputs. In the main, however, China'sindustrial products, materials, and processes are familiar to West-ern engineers. Automation is limited and labor intensity is muchhigher in China than in the advanced industrial nations, but thedirection of movement is unquestionably toward technical ar-rangements resembling those in the industrial West.
Labor absorption in agriculture
Limited creation of employment outside agriculture has forcedmuch of labor absorption onto the farm sector, which is broadlydefined to include water conservancy and land improvement, aswell as farming and animal husbandry. Agriculture is estimated tohave absorbed 97.3 million workers between 1957 and 1975, orabout two-thirds of the overall labor force increase during thoseyears (Table 2-9). Even though the 2 percent annual growth rate ofChina's farm labor force during 1957-75 was high by internationalstandards-World Bank estimates place the average growth rate ofthe farm labor force in South Asia at only 1 percent a year during1950-70-China's farm sector seems to have experienced relativelylittle difficulty in absorbing an enlarged labor force of this magni-tude.4
Agricultural labor absorption was facilitated by two principalchanges in China's rural economy. The first has been the collec-tivization of agriculture, which was begun with the formation ofcooperatives in 1956 and was taken a step further with the creationof communes in 1958. China's rural communes have rebounded
4. World Bank, "Rural Enterprise and Non-Farm Employment," World BankSector Policy Paper (Washington, D.C., January 1978), Table A-1.
126 ECONOMIC GROWTH AND EMPLOYMENT IN CHINA
from early difficulties to become reasonably effective managerialunits. In recent years communes have succeeded in mobilizinglabor to implement projects in water conservancy, land improve-ment, roadbuilding, and irrigation without severing the indis-pensable link between individual (or household) effort and in-come.
The second fundamental change has been the growth, begin-ning in the mid-1960s, of industrial support for agriculture, muchof it from plants located in county seats, market towns, or withinthe communes themselves. Such small-scale industry brings to-gether growing technical skills and a more intimate understandingof rural needs than is often present in large urban factories.
A review of the past two decades of rural development showsthat the direction and the labor mobilization provided by the com-munes has complemented the growing availability of industrialproducts and skills, and that together they have promoted a multi-faceted intensification of China's farm economy. More widespreaduse of organic as well as chemical fertilizers, intensive tilling, ex-panded multiple cropping, water conservancy and land improve-ment projects, and other measures described in Chapter Four notonly absorbed nearly 100 million new entrants into the rural workforce, but also substantially raised the average number of days ofemployment for the entire farm labor force of more than 300 mil-lion men and women.
Progress towardfull employment
China has made long strides toward full employment duringthe past two decades. In this area, as in such fields as health, edu-cation, housing, and regional development China's achievementscompare favorably with those in other large and populous devel-oping nations.
Involuntary unemployment in China's cities is limited by con-trols over peasant migration that include a system of travel permitsand location-specific grain rations. Most peasants are expected toparticipate in winter construction projects in the countryside.Those who travel in search of seasonal nonfarm jobs often mustpay substantial monthly fees to their home units while they are
RETROSPECT AND PROSPECT 727
gone, thus removing the economic motive for seasonal migrationby those with little prospect of finding regular work.5
The only sizable urban group who could be described as unem-ployed consists of young men and women who have abandonedrural assignments without permission. Thomas Bernstein's carefulstudy concludes that "judging from various estimates that havebeen made, there may be several hundred thousand" of theseyouths "living a kind of semilegal life between town and coun-try." Some of these youths manage to obtain regular urban jobs;others "sustain themselves by engaging in petty crime or in blackmarket activities."6 Even if, as some observers believe, the num-ber of returnees who have become "unemployed" by abandoningtheir rural jobs includes several million of the 12 million youngpeople transferred from urban to rural locations since 1966, theresulting scale of unemployment among an urban labor force ofclose to 100 million persons is not severe when compared withconditions in other large and populous low-income countries.
In the rural sector there can be no doubt of a general increase inthe availability of work. The national average of annual workdaysper agricultural worker has risen from fewer than 200 days duringthe 1950s to approximately 250 days in the mid-1970s. Althoughthere are no aggregate data to confirm this hypothesis, it appearsthat rural incomes have risen as well. The estimates of populationand of gross domestic product shown in Table 1-1 imply an in-crease of 50 percent in per capita output between 1957 and 1974.Part of this increased output has been used to raise the share oftotal output devoted to investment and to military spending. But aportion has remained available for supporting rising levels of per-sonal consumption. Since the real income levels of urban workers,although substantially above farm incomes, did not increase andmay even have fallen slightly between 1957 and 1974, these aggre-gate data suggest a perceptible rise in per capita consumption inthe countryside between 1957 and 1975. Part of this increase may
5. William L. Parish and Martin King Whyte, Village and Family in Conternporary
China (Chicago: University of Chicago Press, 1978), p. 120.6. Thomas P. Bernstein, Up to the Mountains and Down to the Villages (New
Haven: Yale University Press, 1977), pp. 93 and 261.
128 ECONOMIC GROWTH AND EMPLOYMENT IN CHINA
have come from the small rise in farm output per agriculturalworker recorded in Table 4-11. Additional contributions havecome from relative price shifts favoring the agricultural sector andfrom governmental fiscal policies intended to reduce regionalinequality in the distribution of health, education, and welfarebenefits. 7
Costs and benefits
These significant achievements have not been without cost. Aswas noted in Chapter Four, the modest rise in the average value ofoutput per man-year in agriculture occurred only because the in-crease in the number of days worked by commune members offsetthe reduction in the average value of output per man-day in agri-culture. In addition, available data show that overall factor pro-ductivity dropped substantially between 1957 and 1975 in China'sagricultural sector.
The finding that the average level of gross output value perman-day in agriculture declined by from 15 to 36 percent between1957 and 1975 (see Table 4-11) provides clear-cut evidence of Mal-thusian diminishing returns. Chinese sources confirm this result:a survey of 2,162 production teams in several provinces found thatthe average value of a labor-day declined by 20 percent, from 0.7 to0.56 yuan, between 1965 and 1976.8 Indeed, with the total numberof man-days lavished on a fixed land base rising since 1957 at near-ly 4.6 percent annually from a high initial level, it is perhaps sur-
7. Christopher Howe, China's Economy: A Basic Guide (New York: Basic Books,1978), pp. 174-76, estimates that consumption per capita at the national level in-creased at an annual rate of 1.66 percent between 1952 and 1974; among urbanworkers, real wages declined by an estimated 12 percent between 1957 and 1974. Intheir detailed study of Kwangtung province, Parish and Whyte identify a variety ofindicators that "point toward increasing output and slowly improving living stan-dards" in the countryside (see Village and Family, p. 124). Terms of trade and fiscalpolicies are discussed in Nicholas R. Lardy, Economic Growth and Distribution inChina (Cambridge, England: Cambridge University Press, 1978), chaps. 4 and 5.
8. "Strengthen Scientific Research on the Farm Economy," Kuang-ming jih-pao[Kuang-ming Daily], December 7, 1978. These figures are smaller than those inTable 4-11 because the former represent cash income per labor-day and are net oftaxes, input costs, and other charges deducted from total output before distributingincome to team members.
RETROSPECT AND PROSPECT 129
prising that the average output per man-day did not decline morerapidly. 9
If an increase of roughly 125 percent in the aggregate number ofman-days devoted to agricultural labor between 1957 and 1975forced the nationwide level of average productivity down by from15 to 36 percent, the marginal productivity of agricultural labor inmany farming regions must be far below the reduced level of aver-age productivity recorded in 1975. This inference is reinforced byobservations of visitors. Surely, the effect on current output of themarginal bucket of earth moved on construction projects, the mar-ginal seedlings planted for afforestation, the marginal silt collectedas organic fertilizer, or the marginal effort of plowing, weeding, orpruning is often extremely small.
What significance should be attached to the indubitable fact oflow marginal labor productivity in agriculture? One possibility isthat low marginal labor productivity in farming reveals a seriouserror in China's economic strategy. Instead of "manicuring thecountryside" with labor-intensive farming techniques that addlittle to total output, new entrants to the work force could havebeen assigned more productively to labor-intensive consumer in-dustries producing for export. Recent policy changes show thatmany Chinese would agree that the foreign sector can contributemore to China's development than it did during the years 1957-75.But even leaving aside limitations on the demand side, expansionof industrial exports is narrowly constrained by capacity limita-tions and by the slow growth in supplies of agricultural raw mate-rials used to produce the textile products and processed foodstuffsthat account for a large proportion of China's manufactured ex-ports. Although it is easily possible to imagine alternative policiesthat might have enabled consumer manufacturing to absorb sever-al million additional workers, no industrial strategy could havespared China's farm sector from the task of absorbing nearly 100million new workers during 1957-75 or from the consequentdownward trend in average and marginal labor productivity.
For most new entrants into China's labor force, agriculture was
9. Annual increase of 4.6 percent in labor-days between 1957 and 1975 is calcu-lated from the agricultural labor force figures in Table 2-9 by assuming 159 work-days per person for 1957 (Table 4-10) and 250 days for 1975.
130 ECONOMIC GROWTH AND EMPLOYMENT IN CHINA
the only possible source of employment. Under these conditions,the government faced the choice of using available farm labor ei-ther more or less intensively. On the one hand, fuller employmentraises farm output and contributes to external balance of trade byreducing net food imports. On the other hand, intensive use oflabor lowers the marginal product of labor and curtails peasantleisure. Since the government places a low value on leisure relativeto higher farm output, the decision to mobilize available labor fortasks with a low and declining-but positive-effect on farm out-put was probably not difficult to reach. From the peasants' view-point, the falling value of each workday brought about by a risingman-land ratio meant that, with migration and private plots close-ly restricted, increased collective labor was the only way to protectexisting living standards; to attain higher incomes, further extrawork was unavoidable. Resistance arose only when the peasantsperceived that extra work would not lead to higher real incomesbecause of shortages of consumer goods in rural fairs and salesoutlets. 10
Despite the increased availability of employment, it would bepremature to claim that China's agricultural labor force is fully em-ployed. This is because nationwide figures conceal important re-gional variations. In areas with long growing seasons and abun-dant supplies of water and organic manures the average numberof workdays per man-year certainly exceeds 300. These conditionswere observed in north and central China by the Wheat StudiesDelegation; they must also exist over substantial areas of southand southwest China as well.
These regions of high labor demand probably coincide with theregions that Benedict Stavis has identified as the beneficiaries ofcomplete packages of modern farm inputs. Stavis estimates that asof the late 1960s these areas of high and stable yields, widespreadmechanization, and high multiple cropping indexes included 20percent of China's cultivated land." These areas have undoubt-edly expanded in the past decade. Since they also include some of
10. See, for example, Ross H. Munro, "Why China's Peasants Don't Want toWork," San Francisco Chronicle (July 29, 1977), p. 12.
11. Benedict Stavis, Making Green Revolution (Ithaca: Cornell University RuralDevelopment Program, 1974), pp. 1-3.
RETROSPECT AND PROSPECT 131
China's most densely populated regions, up to one-quarter ofChina's agricultural population may live in regions in which farmworkers are expected to work for 300 or more days each year.
If the demand for labor substantially exceeds the estimated av-erage of 250 annual workdays in large areas of the country, it fol-lows that "there may still be absorption problems in the northernplains" where the agricultural environment includes both a rela-tively short growing season and limited and uncertain water sup-plies. 12
Despite these remaining problems of seasonal idleness, Chinaduring the past two decades has unquestionably made majorgains in overcoming rural underemployment. The spread of mod-ern farm inputs, which has caused serious employment problemselsewhere, has been accompanied in China by a general increasein labor demand large enough to boost labor input per worker byapproximately 50 percent in two decades.
Gains in employment opportunities and the resulting growth inincome have benefited poor as well as prosperous farming re-gions. Furthermore, universal collectivization of farming meansthat underemployed agricultural workers are not cut off from theland. Adverse conditions may prevent certain localities from join-ing in the general rise in farm output, but all households continueto enjoy a share in the income of their commune, brigade andproduction team.
In conclusion, the situation of employment in China may besummarized as follows: Open unemployment appears limitedlargely to illegal urban residents. Many of these are voluntarilyidle, having chosen to abandon rural employment that would haveallowed them to support themselves. In the countryside there hasbeen a general rise in the availability of work over the past twodecades. Seasonal idleness still exists in some areas, but its extentand duration are much reduced in comparison with the 1950s. Re-cent news reports suggest new problems of voluntary rural idle-ness, but these may be localized and are in any case amenable tosolution by administrative changes or improved supplies of con-sumer goods. Despite these problems, the improved availability
12. Peter Schran, "Farm Labor and Living in China," (Champaign: Universityof Illinois, 1976; processed), p. 11.
132 ECONOMIC GROWTH AND EMPLOYMENT IN CHINA
of work is an impressive achievement for a densely populatedcountry with a fixed land base, substantial labor force growth, andan average annual income of about US$400 (at 1977 prices) percapita. 13
Prospects for China's Labor Market
The uncertainty surrounding existing estimates of the size and agestructure of China's population makes it difficult to attempt a fore-cast of future trends in the supply of, and demand for, labor.Nonetheless, it is possible to draw some broad inferences regard-ing probable trends in the size and structure of the labor force andin the balance between supply and demand.
Labor force projections
Table 5-1 contains projections based on the simplest of assump-tions. China's labor force is projected from 1975 to 1990 using anannual growth rate of 2.7 percent. Even though the rate of popu-lation growth may soon fall below 2 percent, the present age struc-ture is dominated by young people; as the share of economicallyactive age cohorts in the population total rises, the growth rate ofthe labor force may be expected to accelerate until around 1990,after which it will slow down. The assumed annual growth rate forthe labor force is identical with the average growth rate of theworking age cohorts (16 to 60 years for males, 16 to 55 years forfemales) in John Aird's intermediate model of China's populationduring the years 1975-90.14
Nonagricultural employment increased at an annual rate of 4.9
13. U.S. National Foreign Assessment Center, China: Economic Indicators (Wash-ington, D.C.: Central Intelligence Agency, 1978), p. 1.
14. In his intermediate population model, John S. Aird projects average growthrates for the working-age population at 2.6 percent for 1970-80, 2.9 percent for1980-90, and 1.3 percent for 1990-2000. See his "Population Growth in the People'sRepublic of China," in U.S. Congress, Joint Economic Committee, OCinese EconomyPost-Mao (Washington, D.C.: U.S. Government Printing Office, 1978), vol. 1, p.472. The figures for 1975 were provided separately by Dr. Aird.
RETROSPECT AND PROSPECT 133
TABLE 5-1. LABOR FORCE PROJECTIONS, 1975-90
Total Nonagricultural Urban AgriculturalYear laborforce employment unemployment labor force
Version A 16.9 9.9 0 7.0Version B 16.9 20.7 0 -3.8
Note: The basis for projections is explained in the text.Source: Table 2-9.
percent between 1957 and 1975. Future employment expansion inthis area depends largely on trends in industrial employment,which expanded at an average rate of 5.7 percent over the sameperiod. It is likely that the need to increase supplies of consumergoods to bolster incentives among both urban and rural workerswill lead the government to step up investment in relatively labor-using consumer manufactures. Rising imports may spur expan-sion of consumer industries directed toward foreign markets aswell. These developments suggest that the growth of industrialemployment may accelerate. But recent policy statements empha-sizing modernization and increased technological sophisticationsuggest a continuing emphasis on deepening of capital to raiseproductivity. Imports of whole plants, equipment, and designsfrom Western suppliers point in the same direction.
Given this uncertainty and the absence of information on de-mand for employment in other nonfarm sectors, nonagriculturalemployment is projected forward to 1990 under two assumptions:first, a 5 percent growth rate reflecting continuation of past trends;
134 ECONOMIC GROWTH AND EMPLOYMENT IN CHINA
and, second, a growth rate of 7.5 percent that may be taken as anupper limit for growth in employment outside agriculture. 15
Under the additional assumption of constant urban unemploy-ment, the projected agricultural labor force may be derived as aresidual. These projections are simple but not implausible. Theyshow that, with nonagricultural employment rising at an annualrate of 5 percent, China's agricultural labor force will continue torise until 1990. If the growth of nonfarm employment accelerates to7.5 percent, the farm labor force will peak five years sooner. Moreimportant is the implication that accelerated employment growthoutside agriculture could reduce the eventual maximum size of thefarm labor force by approximately 80 million workers. Thus, it isevident that the magnitude of the labor absorption requirementsfacing agriculture during the coming decade depends heavily onthe growth rate of nonfarm employment. Small changes in the lat-ter will raise or lower the influx of new farm workers (or, alterna-tively, of jobless urban dwellers) by tens of millions.
The data on agricultural productivity that are summarized inTables 4-11 and 4-12 emphasize the importance of lowering the an-nual increments to the agricultural work force-and eventually itssize-as quickly as possible. Growing supplies of modern inputs,intensification of the farming system, and rising numbers of labor-days per worker have jointly maintained the average annual valueof output per agricultural worker betwen 1957 and 1975. But withfew remaining opportunities to intensify peasant work schedules,further growth of the farm labor force may reduce the average levelof output per worker in agriculture. Further relative price changesfavoring agriculture, such as those announced early in 1979, cansupport farm incomes. If, however, the urban prices of farm prod-ucts are not increased, the resulting subsidies to urban residentswill repiesent a drain on the state budget and act to reduce invest-ment and, as a result, the growth of nonagricultural employ-ment. 1 6
Therefore, it is reasonable to expect that China's agricultural
15. If nonagricultural employment were to rise by more than 7.5 percent annu-ally, the investment requirements for capital widening in industry alone wouldtake up an inordinate proportion of total capital formation.
16. "Communique of the Third Plenary Session of the 11th Central Committeeof the Communist Party of China," Peking Review, no. 52 (1978), p. 13.
RETROSPECT AND PROSPECT 135
labor force will continue to grow at least during the late 1970s andearly 1980s. Whether this growth will raise the eventual peak levelof the agricultural work force by 10 million or 100 million abovethe estimated 1975 total of 329 million farm workers depends onwhether the annual growth of nonagricultural employment re-mains near the historic level of 5 percent a year or accelerates to anannual rate of 7.5 percent. It is not possible to predict which ofthese rates is most likely to approximate the actual growth of non-agricultural employment opportunities. In either case, the mostpressing questions concerning labor market conditions in Chinawill continue to center on the effect of employment growth on themarginal product of labor in agriculture. Can the marginal productof farm labor be raised enough to reverse the recent downwardtrend in average output and earnings per labor-day?
The income prospects of China's farming population are in-extricably linked with'the fate of China's current drive to raise theannual growth rate of agricultural output from the rate of approxi-mately 2.6 percent achieved between 1957 and 1974 (Table 4-7) to-ward an unprecedented target level of between 4 and 5 percent ayear between now and 1985. Even if nonfarm employment fails togrow more rapidly than the 5 percent annual rate achieved during1957-75, a 4 percent annual growth of gross agricultural outputwould ensure modest growth in the net value of the farm workdayeven with a 1.8 percent annual increase in farm labor (Table 5-1),further increases in annual workdays, and a falling ratio of valueadded to the gross value of agricultural output. Continued outputgrowth in the 2.5 percent range recorded during 1957-74 (Table4-7), however, is likely to cause incomes to fall unless the growthof nonfarm employment is rapid. Since growth in nonfarm employ-ment depends on investment outlays whose import component islimited by China's trade balance in farm products, a weak agricul-tural performance and a spectacular nonfarm growth represent anextremely unlikely combination.
Prospects for rapid growth of agricultural output
Can China push the annual growth rate of agricultural outputabove 4 percent in the near future? Several foreign specialists haveexpressed reservations about the prospects for accelerated agricul-
136 ECONOMIC GROWTH AND EMPLOYMENT IN CHINA
tural growth.' 7 Nicholas Lardy disagrees, arguing that "becauseof the large investments that have already been made in irrigationsystems and the ability of the Chinese to diffuse rapidly higheryielding seed varieties, the average rate of agricultural growthmay approach 4 percent per year, given average weather condi-tions."'8 This controversy need not be reviewed in detail, but fac-tors can be described that are likely to push the farm economyeither toward or away from the ambitious target of from 4 to 5percent annual growth in agricultural output.
On the positive side, large regions of China have not yet begunto reap the full benefits from an integrated package of modemfarm inputs. Continuing increases in the supply of fertilizer, ma-chinery, and other manufactured producer goods may pave theway for intensification of cropping patterns, rising demand for la-bor, and increased output in these regions, of which the northChina plain is the largest. Of particular importance is the immi-nent jump in supplies of chemical fertilizers as new plants incor-porating Western technology begin to operate. Since foreign ob-servers agree that the "level of fertilization is still far from ade-quate," expanded fertilizer use may permit growing numbers ofcommunes to imitate the pattern of expanded double and triplecropping heretofore confined to model units with preferential ac-cess to scarce resources. 19 Continued growth in the output of farmmachinery, another objective receiving high priority in currenteconomic plans, may have a similarly beneficial effect.
The prospects for agricultural intensification may become con-strained, however, by the difficulty of attaining large increases in
17. Authors stressing the difficulty of accelerating the growth of farm outputinclude Dwight H. Perkins, "Constraints Influencing China's Agricultural Per-formance," in U.S. Congress, Joint Economic Committee, China: A Reassessmentof the Economy (Washington, D.C.: U.S. Government Printing Office, 1975), pp.350-65; Walter P. Falcon and Gerald C. Nelson, "Prospects for China's Agricul-ture," (unpublished draft, 1978); and Robert F. Dernberger and David Fasenfest,"China's Post-Mao Economic Future," in U.S. Congress, Joint Economic Com-mittee, Chinese Economy Post-Mao (Washington, D.C.: U.S. Government PrintingOffice, 1978), vol. 1, pp. 21-26.
18. Nicholas R. Lardy, "Recent Chinese Economic Performance and Prospectsfor the Ten-Year Plan," ibid., p. 61.
19. Schran, "Farm Labor and Living," p. 13.
RETROSPECT AND PROSPECT 137
the supply of water. Two decades of effort may have enabled theChinese to tap most readily available water sources; in many local-ities the returns to construction of additional small- or medium-scale water conservancy projects may now be quite low. If so, ma-jor improvements in availability of water must await progress in
such massive and long-term endeavors as control of silting in theYellow River and diversion of Yangtze River waters to the north.In the meantime, as one specialist observed, "[I]mproving watermanagement in China would get very little increase in produc-tion" because "the level of water management in China is ex-ceptionally high" already.2 0
Another potentially positive contribution may come from im-provements in farm-oriented scientific work. In contrast to theirfavorable evaluations of other economic sectors, visiting expertshave criticized China's agricultural research establishmentseverely:
One gets the impression that much Chinese agricultural re-search is currently stagnant.... In general scientists were
not aware of work in other provinces.... China's scientists
have been, and still are, out of contact with the mainstreamof international scientific activity.... Consequently, we
found scientists generally unaware of advances occurringelsewhere, many that could be of great benefit to Chineseagriculture.... [T]he absence of active field and laboratory
work on some of the major agronomic problems was notice-able at all institutions visited.2 '
The question here is how quickly Chinese scientific institutionscan reverse the weak state of the agricultural sciences noted byforeign visitors in 1974 and 1976.22 Recent emphasis on scienceand technology has swept away one obstacle noted by visitors in1974, the "lack of conviction of central authorities that more funda-
20. Dwight H. Perkins, "A Conference on Agriculture," China Quarterly, no. 67(1976), p. 605. Preliminary plans for one major project are sketched in Kao Hsia,"Yangtze Waters Diverted to North China," Peking Review, no. 38 (1978), pp. 6-9.
21. Plant Studies in the People's Republic of China (Washington, D.C.: NationalAcademy of Sciences, 1975), pp. 119-21.
22. Ibid., and Ramon H. Myers, "Wheat in China-Past, Present and Future,"China Quarterly, no. 74 (1978), pp. 317-18.
138 ECONOMIC GROWTH AND EMPLOYMENT IN CHINA
mental research is important." 2 3 Peking is now keenly aware ofthe vital role of research in supporting agriculture as well as othersectors of the economy. If official encouragement, enlarged fund-ing, and foreign contacts can quickly stimulate a flow of usefulinnovation, agricultural science could contribute substantially toboth growth of output and absorption of labor:
Soil classification studies are still unknown at the communelevel, but when this new information becomes available itshould be possible for production teams to use the newchemical fertilizers more efficiently. Hydrological work tomeasure the proper amount of irrigation for different soils isstill in its infancy at the commune level. As this developmentprogresses, communes gradually should be able to make op-timal application of water to wheat and other crops whenapplications of chemical fertilizer are used. Such scientificdevelopments will most certainly continue to raise wheatyields in even the advanced farming areas, and most as-suredly in the backward farming areas if the present wheatscience research system can be encouraged to producethem. 2 4
The rapidity with which China's farm sector can take advantageof existing opportunities to raise output depends not only ontechnical conditions but also on the analytic capabilities of policy-makers and the rationality of farm management. Reports of dimin-ishing returns appear as early as 1964, whenmone group of authorspointed out that "what needs attention is that some productionunits, though raising output through a change in the croppingrotation system, have had to invest excessively, with the resultthat per unit cost of product and labor productivity are [adversely]affected." 2 5 As Marxists, however, Chinese economists found itdifficult to recognize the extent of diminishing returns:
The general tendency is that with continued advancementmade in science and technology and with more fertilizer and
23. Plant Studies, p. 119.24. Myers, "Wheat in China," p. 330.25. Liu Chih-cheng et al, "The Relations Between the Four Transformations
other investment put into each unit area of land, the outputwill also increase gradually. This is where we fundamentallydiffer from the pseudo-scientists of the bourgeoisie con-cerning the law of "diminishing returns from land." But un-der given conditions of science and technology, when othermeasures for increase of production fail to catch up, eachunit of investment in fertilizer will yield lower results.2 6
This commentator, also writing in 1964, admits that the marginalproduct of individual inputs may decline as their application isincreased, but he expects that returns from packages of com-plementary inputs will not decline under conditions of "continuedadvancement made in science and technology."
A decade of strongly diminishing returns and a change of lead-ership have encouraged Chinese social scientists to subject theseproblems to objective empirical study:
Today, our country's agricultural mechanization shows greatdevelopment, but there are many problems. For instance ...[there is] the problem of raising output and incomes. Accord-ing to a multi-province survey of 2,162 production teams, av-erage yield of six grains rose from 232 chin per mou in 1965 to316 chin in 1976, an increase of 36 percent. But costs per mourose from 26.2 yuan per mou to 40.5 yuan, an increase of 54percent, and the value of one labor-day declined from 0.7 to0.56 yuan. The main reason why these problems arise is be-cause in the course of farm mechanization we have -ignoredobjective laws, failed to clarify economic accounting, andfailed to improve economic efficiency. These conditions aredirectly linked to the long-term interruption of research onagricultural technology and economics.27
If this type of blunt, factually based analysis maintains its currentpopularity, China's agricultural growth will not be retarded byfailure to recognize the extent and significance of current prob-lems.
The question of managerial rationality at the microeconomic
26. Yen Jui-chen, "Several Questions on Increasing the Economic Benefits ofFertilizers," Oiing-dhi yen-chiu [Economic Research], no. 6 (1964), translated- inECMM, no. 429 (1964), p. 20.
27. "Strengthen Scientific Research." One chin equals 0.5 kilograms.
140 ECONOMIC GROWTH AND EMPLOYMENT IN CHINA
level, however, is more difficult. Most foreign analysts, includingthe present author, have assumed that the return of control overproduction and distribution decisions to small production teamsremoved the chief element of economic irrationality from China'scommune system during the early 1960s. Pessimistic foreign ap-praisals of China's agricultural prospects do not refer to manage-rial incompetence as a reason for expecting a low growth rate foroutput. If incentives are inadequate, higher farm prices and in-creased allocation of consumer products to rural areas are cited asappropriate policy responses.
Recent criticism of agricultural operations appearing in the Chi-nese press suggests, however, that foreign appraisals of the com-mune management system may be overoptimistic. Numerous in-stances are cited of counterproductive management practices:farm machines in disrepair, afforestation projects nullified be-cause seedlings are not tended, ill-conceived irrigation projectscreating alkaline soil, seeds and livestock imported from distantregions without preliminary experimentation, irresponsible andcorrupt financial administration, forced shifts to double croppingdespite inadequate resources, prosperous units burdened withceilings on personal incomes, peasants denied monthly holidays,and so on.2 5 Do these reports, which recall the excesses of theGreat Leap Forward, merely reflect the inevitable weak points in asystem whose decisionmaking units number in the millions? Or isit possible that a high incidence of defective management in agri-culture has significantly retarded China's agricultural growth?
A review of available evidence tends to support the first view.Despite the difficulties caused by managerial incompetence, high-er-level interference, and internal strife in some units, collectiveorganization does not appear to pose a major obstacle to agricul-tural growth. Since peasants participate in the selection of produc-tion team leaders and "have some fairly effective means of ex-pressing dissatisfaction" with decisions made at the lowest ad-ministrative level, the general orientation of production teamefforts would be expected to coincide with the income-seeking as-
28. Examples of critical reports on these topics appear in FBIS, February 10,1978, E11-12, and November 30, 1978, G-5; China Nezvs Analysts, no. 1,124 (1978),
no. 1,135 (1978), and no. 1,141 (1978); and Peking Review, no. 48 (1978), pp. 21-22.
RETROSPECT AND PROSPECT 141
pirations of peasant households.2 9 Unless shackled by contraryinstructions from above, production teams should push for rapidgrowth of output. An extensive and detailed inquiry by Parishand Whyte confirms this expectation: "In the Kwangtung country-side the emphasis on . . . rewarding the most productive . .. andon efficiency (retaining flexibility and initiative in the hands ofthose making the daily farming decisions) have clearly been fore-most in the minds of Chinese planners." 3 0
Transferability of China's Experienceto Other Countries
The success China has had in raising the levels of employment forgrowing urban and rural populations naturally brings to the forethe question of how this experience is relevant to the problems ofcountries whose political, social, and economic systems may differwidely from China's.
Several fundamental features of China's political economy doappear to stand in the way of wholesale application of Chinesemethods to problems confronting other developing countries.China's climate, topography, farm technology, and agriculturalpopulation are all well suited to the system of intensive agriculturebuilt up over the centuries and further developed over the pastseveral decades. China's farming technology, and especially thewet-rice culture of the south, proved its ability to adjust to largeincreases in population density centuries before 1949. Recent re-forms in cultivation practices consist to a large extent of in-troducing the technology of rice culture-with its transplanting,irrigation, heavy fertilization, and intensive plant care-into thenorthern and central regions in which irrigation was previouslythe exception rather than the rule.
Pursuit of intensive farming pattems presupposes a farm laborforce that is prepared to devote long hours to careful tillage during
29. Parish and Whyte, Village and Family, p. 109; see also John P. Bums, "TheElection of Production Team Cadres in Rural China, 1958-74," China Quarterly, no.74 (1978), pp. 273-96.
30. Parish and Whyte, Village and Family, p. 117.
142 ECONOMIC GROWTH AND EMPLOYMENT IN CHINA
the growing season and to composting, land leveling, and mainte-nance of irrigation works in the off-season. Progressive in-tensification of farming also requires widespread entrepreneur-ship among the farm populace. Even a casual acquaintance withconditions in various regions of the Third World provides fre-quent instances in which socioeconomic conditions make it diffi-cult to foresee the calculating and aggressive response to economicopportunity that seems typical of both urban and rural popu-lations not only in China but throughout East Asia.
Effective administration at all levels of government is anotherinheritance from China's past that provides an essential link in thecurrent economic system. In the countryside, substantial male lit-eracy, a tradition of reporting local price and output data for majorcrops, and keeping of records in connection with irrigation andmarketing networks formed a foundation upon which communeadministration could be built.3 ' The strength of rural administra-tive capacity was evident soon after 1949, when the new govern-ment succeeded in establishing a wide array of financial and mar-keting organizations operated by non-elite rural dwellers whowere not among the victims of the extensive and violent campaignfor land reform.3 2
The communes that succeeded these early cooperatives have oc-cupied a significant role in the process of labor absorption de-scribed in the previous chapters. Water conservancy and greaterattention to animal husbandry, horticulture, and forestry are as-pects of agricultural intensification that owe their existence to ru-ral collectivization. Local industry requires administration and or-ganization of both production and distribution-and, for machin-ery, of maintenance and repair work as well. This industry isanother component of China's rural development program that ap-pears virtually inseparable from collectivization.
Some features of recent agricultural reforms such as increasedinputs per acre of organic fertilizer and manpower could easilyhave developed under a system of family farming. But others rang-
31. Thomas G. Rawski, "On the Reliability of Chinese Economic Data," Journalof Development Studies, vol. 12, no. 4 (1976), p. 439.
32. Vivienne Shue, "Reorganizing Rural Trade," Modern China, vol. 2, no. 1(1976), pp. 104-34.
RETROSPECT AND PROSPECT 143
ing from livestock insurance and road building to rural powergrids and canal systems could hardly have developed as rapidlyin a market economy as under the present system of socializedfarming.
More generally, China has benefited from a tradition of socialcontrol that has been reshaped to meet the goals of a new lead-ership. Social control enables the Chinese government to imple-ment policies that might be difficult or impossible elsewhere: forexample, steeply rising investment proportions; restriction ofpeasant migration to the cities; enforced migration of educatedurban youth to agricultural communities; and intense propagandaefforts directed at training local leaders to adhere to central policyguidelines without close supervision. A whole series of programswith the goal of reducing rural-urban differences has helped Chinato achieve a well-integrated administrative system in which thecombined bureaucratic and practical skills of local officials contrib-ute to effective policy implementation at the grass-roots level.
An unusually large, well-established, and widely distributedindustrial sector is a final feature of China's economic life that isnot often duplicated in other low-income countries. Industry re-placed agriculture as the largest contributor to China's aggregateproduct during the 1960s, and economists agree that this is not astatistical illusion caused by price distortions. The scale of indus-try is large by any standard. Industry is no longer concentrated ina few coastal centers, but is widely dispersed throughout China'sprovinces, counties, and even communes. This change has far-reaching implications:
A hand tractor imported from Japan would have the samephysical productivity as one made in China, but it will cer-tainly not have the same impact as one made in a Brigade orCommune machine shop where every peasant knows some-one who helped built it. By pushing the production of partic-ular agricultural machinery all the way to the Brigade level,China has removed the "foreignness" from new technology.Not only will this speed adoption of the technology, but thepresence of the factory and machine shop locally means spareparts and repairs are readily available. The level of utilizationof machinery locally produced is thus likely to be far higher
144 ECONOMIC GROWTH AND EMPLOYMENT IN CHINA
than of machinery imported from higher levels or abroad forwhich no such capability exists.3 3
Finally, decades of experience both before and after 1949 led toan accumulation of problem-solving capabilities within industry.These skills are in part the fruit of China's isolation from trade andoutside aid. They represent another crucial ingredient in recenteconomic gains that will be difficult for many developing coun-tries to match.
These observations underline Donald Keesing's view that theunique features and integrated nature of China's socioeconomicsystem make it difficult to envision wholesale transfers of the strat-egies and mechanisms that have contributed to China's economicachievements into the economic milieu of other developing coun-tries.3 4 Even so, China's relatively successful experience in ab-sorbing large new labor force cohorts despite limited non-agricultural employment opportunities and an unchanged stock offarmland suggests a variety of opportunities for other countriesfacing similar combinations of circumstances.
Recent developments in Chinese agriculture show that an ini-tially labor-intensive system of farming can be modified in direc-tions that facilitate the absorption of additional labor. Althoughsome of the labor-using methods advocated by Chinese officialshave turned out to be counterproductive, there can be no doubt ofthe beneficial effects on both output and employment of increasedapplication of organic manures, the northward spread of trans-planting and multiple cropping, more intensive tillage, the shifttoward labor-using farm activities, vast efforts to improve the net-work of water control and irrigation facilities, and other measuresdescribed in Chapter Four.
In China growing supplies of manufactured farm inputs, bothchemical and mechanical, appear to have contributed to a growingdemand for farm labor. Although rural industry occupies only asmall fraction of the rural work force, the indirect contribution ofits output of fertilizer, cement, and machinery to the growth of
33. Dwight Perkins and others, Rural Small-Scale Industry in the People's Republicof China (Berkeley: University of California Press, 1977), p. 73.
34. Donald B. Keesing, "Economic Lessons from China," Journal of Development
Economics, vol 2 (1975), pp. 1-32.
RETROSPECT AND PROSPECT 145
rural employment opportunities has been substantial. In contrastto the pessimistic view of mechanization expressed by some ob-servers, the influx of tractors, power tillers, irrigation equipment,and other types of labor-saving machinery into China's farm econ-omy has stimulated rather than curtailed the overall demand foragricultural labor.
Finally, China's experience illustrates the potential of a multi-layered system of economic administration. Although China'seconomy includes strong elements of central planning and control,the past two decades have witnessed a considerable expansion ofeconomic authority at the provincial, county, municipal, com-mune, brigade, and even production team level. Central officialscertainly retain the power to constrain, review, and countermandpolicies determined at lower levels, but there are substantive areasin which economic policy in the countryside is determined andimplemented by rural people.
It is possible, of course, that some of the elements that in thepast have contributed to China's achievements in providing in-creased employment opportunities to a growing labor force mayno longer do so in the future. Further progress toward agriculturalmechanization, for example, may reduce rather than raise the de-mand for farm labor. Recent reports suggest that relaxation ofpressures obliging urban school graduates to settle in rural areasmay lead to new problems of joblessness among urban youth.Other elements of China's successful employment record may belinked with social or economic conditions established before 1949,with the existence of effectively managed agricultural collectives orwith other aspects of the Chinese scene that may find no counter-parts in other developing countries.
On the other hand, John Mellor's proposed strategy for India'seconomy illustrates the potential value of Chinese experience as aguide to policy elsewhere. Although Mellor's analysis does notconsider the Chinese case, his suggestions for an agriculturallybased, employment-oriented development policy closely parallelmany of the Chinese programs described in the presentstudy.3 5 This shows that, despite the unique aspects of China's
35. John W. Mellor, The New Economics of Growth (Ithaca, N.Y.: Cornell Universi-ty Press, 1976). The long list of proposals that resemble actual Chinese programs
146 ECONOMIC GROWTH AND EMPLOYMENT IN CHINA
social, political, and economic arrangements, China's success inenlarging employment opportunities for the world's largest na-tional labor force can offer an instructive as well as an encouragingexample to those persons concerned with employment problemsthroughout the developing world.
includes rural infrastructure investment in health, education, electrification, com-munication, transport, water control, and agricultural research; increased suppliesof chemical fertilizer, water, credit, and risk-sharing arrangements for farm house-holds; diversification of agriculture in the direction of labor-using activities; ex-pansion of rural industry centered on light engineering; indirect taxation of risingfarm incomes; and administrative decentralization to foster local resource mobili-zation. Mellor's principal deviations from Chinese methods are his advocacy oflower foodgrain prices and his suggestion that investment in capital-intensive ur-ban industries should be curtailed, at least in the short run, to free resources forrural investment.
Appendix A
Chinese Economic Statistics
ANY STUDY THAT SETS OUT to provide a detailed quantitative analy-sis of China's economy must consider the accuracy, veracity, andinternational comparability of Chinese economic data. The pur-pose of this brief discussion is to acquaint nonspecialist readerswith the major issues and to explain why, despite undeniable dif-ficulties of compilation and interpretation, available data do per-mit construction of meaningful estimates that provide broadly ac-curate quantitative information about the size, structure, and evo-lution of China's economy.'
Statistical Capacity
The statistical capacity of the present Chinese government com-pares favorably with the achievements of other nations with simi-lar levels of per capita income. This is not a recent phenomenon,but stems in part from the high level (relative to other non-industrial societies) of administrative and statistical competenceinherited from the period before 1949. As a bureaucratic state, theChinese imperial government maintained statistical records ofpopulation, prices, and fiscal information long before the twenti-eth century. The Republican period (1912-49) produced a rich vari-ety of statistical materials at all levels of government and in the
1. This discussion is based on Thomas G. Rawski, "On the Reliability of Chi-nese Economic Data," Journal of Development Studies, vol. 12, no. 4 (1976), pp.438-41.
147
148 ECONOMIC GROWTH AND EMPLOYMENT IN CHINA
private sector as well. These include detailed farm survey investi-gations, a competent and comprehensive industrial census, andattempts to construct estimates of national income and its com-ponents.2 Statistical work after 1949 benefited from this data baseand from the experience of the individuals and organizations thathad created it.
The tradition of gathering and recording quantitative informa-tion extended into rural as well as urban areas. Evelyn Rawski hasshown that male literacy in imperial China approximated the highlevels found in Japan at the end of the Tokugawa period (1600-1868); this tradition continued into the twentieth century, whenrural surveys found that 45 percent of all males above seven yearsof age had received some schooling and 30 percent were liter-ate.3 Before 1949 widespread literacy facilitated regular reportingof local price and output data for the principal crops and mainte-nance of records in connection with irrigation systems and mar-keting networks.4
To these foundations the new communist government added itsown program of recruiting and training statistical personnel, stan-dardizing the format for recording and reporting economic dataand developing a national system of communicating, compiling,and checking quantitative information. Again, this effort was notlimited to a few cities. The regime's concern with rural develop-ment and the presence of widely dispersed literacy and adminis-
2. Many of these studies are described and evaluated in Ta-chung Liu andKung-chia Yeh, The Economy of the Chinese Mainland (Princeton, N.J.: Princeton Uni-versity Press, 1965).
3. Evelyn S. Rawski, Education and Popular Literacy in Ch'ing China (Ann Arbor:
University of Michigan Press, 1979), pp. 151-52, and Dwight H. Perkins, "In-troduction: The Persistence of the Past," in China's Modern Economy in Historical
Perspective, ed. Dwight H. Perkins (Stanford, Calif.: Stanford University Press,1975), p. 4.
4. Han-sheng Chuan and Richard A. Kraus, Mid-Ch'ing Rice Markets and Trade(Cambridge, Mass.: Harvard University Press, 1975), chap. 1; Endymion P. Wilkin-son, "Studies in Chinese Price History," (Ph.D. dissertation, Princeton University,1971); and Ramon H. Myers, "Economic Organization and Cooperation in ModernChina: Irrigation Management in Xing-tai County, Ho-bei Province," in Chagokuno seiji to keizai [The Polity and Economy of China], ed. The Late Professor YujiMuramatsu Commemoration Board (Tokyo: T6y6 keizai shimp6 sha, 1975), pp.199-204.
CHINESE ECONOMIC STATISTICS 149
trative skills meant that, even without the participation of formerelite households who had been stripped of property and authoritysoon after the communist takeover, the regime could find person-nel capable of implementing land reform, collecting taxes, enforc-ing compulsory quotas for grain delivery, and administering in-creasingly complex cooperative and collective arrangements forproducing and marketing farm products. The same personnel andskills made it possible to obtain increasingly serviceable agricul-tural statistics.
As a result of these efforts, the end of the First Five-Year Planperiod (1953-57) found China in possession of a national statisticalsystem that could be classed as quite respectable by the standardsof other low-income nations. 5 There were, of course, wide varia-tions in the quality of data for different localities, sectors, andfunctional areas. Statistics relating to the physical output of large-scale urban industries, for example, were vastly superior to dataon production costs, labor requirements, or even physical outputin the farm sector.
The Great Leap Forward years (1958-60) brought an abrupt re-versal of the trend toward growing statistical competence. Withthe politicization of statistical work, plans became dreams, andthe latter were reported as achievements to superiors who wereeitnier too credulous or too frightened to resist false reporting. Thisepisode culminated in the publication of vastly exaggerated na-tional harvest figures that later had to be retracted-at consid-erable political cost.
The collapse of the Great Leap Forward brought strenuous ef-forts to rebuild and later to develop China's statistical system fur-ther. In the urban sector, where resistance to the erosion of profes-sionalism continued throughout the Great Leap Forward, rein-statement of specialist personnel soon restored the statisticalsystem to its former level of competence, which then became abase for further improvements. In the countryside the people'scommunes have since the policy reversals of the early 1960s expe-rienced strong and continuous pressure to produce comprehen-
5. For a detailed evaluation of China's statistical system between 1949 and 1960,see Choh-ming Li, The Statistical System of Communist China (Berkeley: University ofCalifornia Press, 1962).
150 ECONOMIC GROWTH AND EMPLOYMENT IN CHINA
sive and reliable statistics. At that time, China's nationwide foodshortage made accurate measurement of farm output a task of theutmost importance. Units suspected of statistical malpractice weresubjected to searching investigations in both rural and urbanareas.6 Isolated instances of statistical anarchism during the Cul-tural Revolution (1966-68) drew sharp criticism, and the 1970shave seen a steady flow of articles stressing the importance of ac-counting and excoriating political interference in harsh terms.7
These incentives have been matched by a steady increase in thecompetence of statistical workers, especially in rural areas. Thespread of peasant literacy, migration of an estimated 12 millionurban graduates to the countryside, creation of training coursesfor rural accountants, expansion of telephone and other communi-cation links, and the government's increased awareness of agricul-ture's central place in China's economy all point to a vastly im-proved apparatus for monitoring the rural sector.8
As a result of these developments, there is no longer any seri-ous doubt of the Chinese government's ability to collect reason-ably accurate data on commodity output, production costs, em-ployment, investment, and other magnitudes used in the presentstudy. Even in the case of population, an area in which China'sstatistical capability is notoriously weak, the gap between officialstatements and the most plausible outside estimate is less than 5
6. An example involving the famous Tachai brigade is in New China's First Quar-ter-Century (Peking: Foreign Languages Press, 1975), pp. 169-70. More generally,see Michel Oksenberg, "Methods of Communication Within the Chinese Bureau-cracy," China Quarterly, no. 57 (1974), pp. 21-28.
7. For example: "We often encounter . . . comrades . . . who chant slogansabout giving prominence to proletarian politics and speeding up socialist construc-tion. But they could not give an answer when asked how much money a certainproject would require, when the project would be completed for production, and
how its economic effect could be developed to the fullest extent" (scMp, no. 4,949[1971], p. 61).
8. For details on some of these areas, see Leo A. Orleans, "China's Science andTechnology: Continuity and Innovation," in U.S. Congress, Joint Economic Com-mittee, People's Republic of China: An Economic Assessment (Washington, D.C.: U.S.Government Printing Office, 1972), pp. 216-19; Jack Craig, "China: Domestic andInternational Telecommunications, 1949-74," in U.S. Congress, Joint EconomicCommittee, China: A Reassessment of the Economy (Washington, D.C.: U.S. Govern-ment Printing Office, 1975); and sCMP, no. 5,310 (1973), pp. 76-79.
CHINESE ECONOMIC STATISTICS 151
percent of the total (see Table 2-1). Chinese statistical competenceis visible at the microeconomic level, at which technical and man-agerial personnel impress well-informed foreign guests with de-tailed and precise accounts of their units' affairs, as well as at themacroeconomic level, at which consistency checks regularly con-firm the internal coherence of Chinese statements about produc-tion, acreage, yields, consumption, and trade. 9
Statistical Veracity
There is absolutely no evidence that Chinese government officesor economic enterprises maintain separate books for internal ad-ministration and for external publicity. Consistency between na-tional and regional figures for industrial and agricultural outputvalue, grain output, cultivated area, and other magnitudes meansthat, if falsification exists, it cannot be confined to a few offices inthe capital but must permeate the entire statistical network. Tensof thousands would know if published information were false, aninference that underlines the significance of Perkins' observationthat "of all the people who daily go in and out of China, not onehas produced evidence of the existence of two sets of books."10
Many of Peking's recent economic claims imply trends in percapita commodity supplies that can be verified by any reader.China's numerous bookstores are filled with cheap pamphlets thatoften contain time series data on grain yields, fertilizer input,mechanization, food consumption and reserves, household andper capita incomes, personal savings, and other magnitudes at theprovincial, county, commune, brigade, team, or even householdlevels. Given the corrosive effect of exaggeratedly optimistic eco-nomic claims on public opinion during and after the Great Leap, itis inconceivable that the Peking government would knowingly re-lease false data of this sort. Since information obtained by foreign-ers either comes from, or is repeated in, domestic Chinese-lan-
9. Many of these consistency tests are mentioned in Nai-ruenn Chen, "An As-sessment of Chinese Economic Data: Availability, Reliability and Usability," inU.S. Congress, Joint Economic Committee, China: A Reassessment, pp. 57-60.
10. Dwight H. Perkins, Market Control and Planning in Communist China (Cam-bridge, Mass.: Harvard University Press, 1966), p. 222.
152 ECONOMIC GROWTH AND EMPLOYMENT IN CHINA
guage sources, confidence in the veracity of Chinese statisticalstatements extends to materials directed at foreign as well as do-mestic audiences.
International Comparability
Even if it is agreed that available economic data represent thefruits of Peking's increasingly successful efforts to measure vari-ous aspects of economic activity, it is not always easy to fit Chi-nese data into a format suitable for international comparison. Chi-nese statistics are often incomplete. The Chinese may not collect ormay choose not to publish certain types of information. Publisheddata may be difficult to interpret because of the possibility of unre-ported changes in statistical concepts: "industry," "foodgrains,""chemical fertilizers," and "sown acreage" are some of the manystatistical categories for which the exact meaning of the data isuncertain for this reason.
A third difficulty arises from China's adherence to statisticalprocedures derived from Marxist economic theory and Soviet sta-tistical conventions. Output data, for example, normally refer onlyto commodity production and exclude services. Value totals arepresented in gross (or global) figures that include the value of in-terindustry purchases. This means that the measured growth rateof output value is affected not only by changes in physical outputand prices, but by changes in the average degree of vertical in-tegration as well. Increased specialization and division of laboramong producing units will artificially inflate, and increased verti-calization will artificially deflate, an index of gross value of output.
In trying to overcome these difficulties, foreign specialists havebenefited from certain features of China's economy that simplifythe task of measurement. Low per capita income and the associat-ed simplicity of economic structure permit the analyst to track theperformance of important segments of China's economy by use ofonly a few variables. Thus, output figures for grain and cotton canbe used to project farm output; cotton production and imports de-termine the output of cotton textiles; until the recent expansion inthe manufacture of man-made fiber, output of food and cotton tex-tiles largely determined the level of personal consumption as well
CHINESE ECONOMIC STATISTICS 153
as output of manufactured consumer goods. The output mix inproducer industries is less homogeneous than in the consumersector, but here there are relatively plentiful output data in Chinesesources.
Some of the difficulties encountered in quantitative studies ofsocialist economies in the Soviet Union and Eastern Europe ap-pear muted or absent in China. Changes in the degree of verticalintegration that, as noted above, can distort time series of grossvalue of output, and have done so in the Soviet Union, do notappear as a significant influence in the Chinese data. As a result,data on gross value give good approximations to the growth ofvalue added in industry."1 Artificial inflation of industrial outputfigures because of overpricing of new products is another dis-tortion encountered in Soviet, but not in Chinese, figures for in-dustrial output.12 Although Chinese prices are largely adminis-tered by the govemment and are not immediately responsive tomarket forces, price changes have moved the structure of relativevalues in the directions indicated by scarcity relations, with therelative (and sometimes absolute) prices of fast-growing manufac-tures declining while farmgate prices increase.13
Aided by these favorable circumstances, specialists willing toimmerse themselves in the intricacies of reconstructing Chineseeconomic magnitudes from scattered fragments of informationhave produced estimates that stand up well to tests of consistency;they frequently anticipate reports from Chinese sources or visitoraccounts. Gradual accumulation of both data and experience have
11. Thomas G. Rawski, "China's Industrial Performance, 1949-1973," inQuantitative Measures of China's Economic Output, ed. Alexander Eckstein (AnnArbor: University of Michigan Press, forthcoming); and U.S. National ForeignAssessment Center, China: Economic Indicators (Washington, D.C.: Central Intelli-gence Agency, 1978), p. 17.
12. Thomas G. Rawski, "Chinese Industrial Production, 1952-71," Review ofEconomics and Statistics, vol. 55, no. 2 (1973), pp. 173-75; and "Industrial Per-formance," in Quantitative Measures.
13. Dwight H. Perkins, "Growth and Changing Structure of China's Twenti-eth-Century Economy," in China's Modern Economy in Historical Perspective, ed.Dwight H. Perkins (Stanford, Calif.: Stanford University Press, 1975), pp. 128-47,and "Issues in the Estimation of China's National Product," in Quantitative Mea-sures of China's Economic Output.
154 ECONOMIC GROWTH AND EMPLOYMENT IN CHINA
narrowed conceptual and empirical disagreements, resulting in abroad consensus among specialists regarding the quantitative di-mensions of growth and structural change in China's economysince 1949.14
The evolution of the field of Chinese economic studies showsthat, despite problems of collecting, compiling, and assessing sta-tistical information, detailed empirical studies of China's econo-my can produce meaningful results. This does not mean that stud-ies such as the present one are free of statistical error. Error canarise from deficiencies in China's statistical system, from gaps inpublished information, and from the assumptions required toconstruct reasonably complete sets of data. Readers familiar withstudies of other countries will recognize that these problems arenot unique to studies of China, but arise in all empirical studies ofeconomic development. For China, as for India, Indonesia, MeijiJapan, or preindustrial Europe, careful research can and does pro-duce results that are not guesses but estimates of actual economicmagnitude.
14. This change can be seen by comparing the broad agreement within theQuantitative Measures volume with the sharp controversy evident in the discussioninspired by Ta-chung Liu, "Economic Development of the Chinese Mainland,1949-1965," in China in Crisis, eds. Ping-ti Ho and Tang Tsou (Chicago: Universityof Chicago Press, 1968), vol. 1, bk. 2, pp. 609-90.
Appendix B
Derivation of EstimatedNonagricultural Employment,
1957 and 1975
SECTORAL ESTIMATES FOR NONAGRICULTURAL EMPLOYMENT weresummarized in Table 2-8. A more detailed compilation, in whichnonagricultural employment in various sectors is divided betweenworkers and employees and other laborers, appears in Table B-1.The Chinese concept of workers and employees "implies a con-tractual relationship between the employed person and his em-ployer and payment of cash wages in return for labor."1 Althoughit is possible that unannounced changes have occurred since 1960in this definition, the availability of a statement giving a total of 90million workers and employees in 1978 provides a standardagainst which to evaluate the estimates of nonagricultural employ-ment in 1975.2 Since the total for 1975 comes to 88.8 million work-ers and employees, or within 2 percent of the reported total (whichprobably refers to 1977), the present estimate does appear to ap-proximate the order of magnitude of actual employment condi-tions for 1975.
1. John P. Emerson, Nonagricultural Employment in Mainland China: 1949-1958(Washington, D.C.: U.S. Government Printing Office, 1965), p. 3. Further informa-tion on this concept may be found in the translations included in ibid.,Appendix C.
2. FBIS, October 24, 1978, p. E2.
155
156 ECONOMIC GROWTH AND EMPLOYMENT IN CHINA
TABLE B-1. NONAGRICULTURAL EMPLOYMENT BY SECTOR, 1957 AND 1975
(millions of workers)
1957 1975
Workers Workersand and
Sector employees Other Total employees Other Total
employment 23.5 18.8 42.3 66.8 33.5 100.3State farms, forestry and
water conservancy 0.9 0 0.9 22.0 0 22.0Total nonagricultural
employment plus workersand employees in farming,forestry, and water conservancy 24.4 18.8 43.2 88.8 33.5 122.3
a. Includes large-scale utilities.b. Excludes employment in farmland improvement and water conservancy.c. Assumed to have grown at the 4.3 percent annual rate derived for workers and employ-
ees in trade, food and drink, and finance.Sources: For 1957, see Table 2-8. For 1975, see text.
Nonagricultural Employment in 1957
There are three separate studies of nonagricultural employmentfor 1957. Their authors estimate civilian nonagricultural employ-ment for that year as follows: John P. Emerson, 39.7 million; Ta-chung Liu and Kung-chia Yeh, 60.6 million; and Chi-ming Hou,
DERIVATION OF ESTIMATED NONAGRICULTURAL EMPLOYMENT 157
47.7 million.3 The present study relies on Emerson's results fortwo reasons. First, Emerson's is the most detailed, careful, andcomprehensive review of available information on nonagriculturalemployment during the 1950s. Second, Emerson's compilation ex-cludes part-time workers, and his results are therefore more con-sistent with the present estimates of full-time nonagricultural em-ployment in 1975 than the results of the studies by Liu and Yehand by Hou. The differences between the three estimates of non-agricultural employment for 1957 arise primarily from the follow-ing factors:
First, Liu and Yeh include 5.6 million members of work bri-gades in their total.4 These workers are excluded from Table B-1because most of them are farm workers who are recruited intowork brigades for short periods of time. Both Emerson and Houexclude these workers from their estimates of nonagricultural em-ployment.
Second, Hou's estimate of handicraft employment exceedsEmerson's by 1.4 million because Hou attempts to estimate thenumber of craftsmen who joined advanced producer cooperativesin 1956. His procedure leads to double counting because some ofthese craftsmen joined industrial enterprises and thus appear inboth industrial and handicraft employment. The Liu and Yeh esti-mate for handicrafts includes both craftsmen who joined coopera-tives and an additional 4.6 million workers as an estimate of thefull-time equivalent of part-time craftsmen.5
Third, employment in nonmodern transport is extremely diffi-cult to quantify because of the paucity of detailed information ei-ther before or after 1949. Emerson's figure of 2.5 million workers issmaller than Hou's estimate of 4.8 million or the Liu and Yeh fig-
3. Employment estimates from Emerson, Nonagricultural Employment, p. 128;Ta-chung Liu and Kung-chia Yeh, The Economy of the Chinese Mainland (Princeton,N.J.: Princeton University Press, 1965), p. 208; and Chi-ming Hou, "Manpower,Employment and Unemployment," in Economic Trends in Communist China, eds. Al-exander Eckstein, Walter Galenson, and Ta-chung Liu (Chicago: Aldine, 1968), p.362.
4. Liu and Yeh, The Economy, p. 206.5. Chi-ming Hou, "Manpower," pp. 356 and 384-86; Liu and Yeh, The Economy,
pp. 193-96.
158 ECONOMIC GROWTH AND EMPLOYMENT IN CHINA
ure (again, including a full-time equivalent of part-time workers)of 10.0 million.6
Fourth, trade, food, and drink is another problematic sector be-cause of the difficulty of estimating numbers of rural peddlers.Emerson's employment total for this sector includes 6.7 millionworkers in trade and 1.1 million in food and drink. Liu and Yehestimate employment in these categories at 5.0 and 6.4 million,respectively.7 Hou's figures are ambiguous because he lists em-ployment in trade, food, and drink at 5.374 million for 1957 butalso identifies this as an estimate for the traditional segment ofthese activities alone, with another 5.245 million workers allocatedto the modern segment of trade, food, and drink. 8
Fifth, the number of domestic servants is assumed by Liu andYeh to have remained at the 1933 level of 2.3 million; Hou uses thesame figure.9 The present study follows Emerson in omitting thiscategory because there are no data whatsoever.
Handicrafts, trade, and transport, each of which includes largenumbers of unorganized rural workers whose numbers are diffi-cult to estimate, form the weakest segment of the estimates for1957. In each case Emerson's figures, which are used here, fall be-low alternative totals suggested by Hou and by Liu and Yeh. Ac-cordingly, it is possible that the total of 42.3 million personsshown in Tables 2-8 and B-1 underestimates full-time non-agricultural employment in 1957. The actual total could be as highas the figure of 50 million implied by Hou's results (47.7 millioncivilians plus 3 million military personnel). The figure of 50 mil-lion appears, however, to provide an upper limit to the level offull-time nonagricultural employment in 1957. The remaining dif-ference between this and the higher Liu and Yeh figures arisesfrom their inclusion of part-time workers in the total. Any tenden-cy for the present estimates to understate the level of nonfarm em-ployment in 1957 would lead to an overestimate of the subsequentabsorption of labor outside agriculture, which in turn would result
6. Liu and Yeh, The Economy, pp. 198-99; Chi-ming Hou, "Manpower," pp. 356and 387-89.
7. Liu and Yeh, The Economy, p. 200.8. Chi-ming Hou, "Manpower," pp. 356 and 366.9. Liu and Yeh, The Economy, pp. 203 and 608; Chi-ming Hou, "Manpower." p.
356.
DERIVATION OF ESTIMATED NONAGRICULTURAL EMPLOYMENT 159
in a small downward bias in the estimate of labor absorption inthe agricultural sector between 1957 and 1975.
Nonagricultural Employment in 1975
The point of departure for the present estimates of nonagriculturalemployment for 1975 is an article by Gunter Kohrt, former am-bassador to China from the German Democratic Republic, whichrefers to "the workers in industry, construction and transporta-tion-about 55 million in a total population of 800 million."1 0 Thisstatement, together with independent estimates of employment intransportation and construction, leads to an estimate of the level ofindustrial employment in 1975.
Transport, post, and communications
An index of freight transport by rail, water, and highway com-piled in Table B-2 shows an annual average growth rate of 5.4 per-cent a year between 1957 and 1973. Assuming that other transportmodes grew at a similar pace and making some allowance for ris-ing productivity as a result of improved highways, more powerfullocomotives, substitution of motor for sailing vessels, and so on,employment in this sector can be assumed to have expanded at anannual rate of 4 percent after 1957. This assumption results in theemployment figure of 8.9 million workers in 1975 shown in TableB-1. It is assumed that all incremental workers in this sector areregular wage-earners, all of whom are classified as workers andemployees.
Construction, excludingfarmland improvementand water conservancy
The present estimate of growth of employment in this sector isbased on an index of construction activity developed by U.S. gov-ernment analysts. This index shows that construction activity in1975 was 4.04 times the level in 1957, implying an average annual
10. Giinter Kohrt, "Maoism's Permanent Crisis and Growing Threat," Horizont,vol. 9, nos. 33-37 (1976), translated in JpRs, no. 68,303 (1976), p. 94.
160 ECONOMIC GROWTH AND EMPLOYMENT IN CHINA
TABLE B-2. GROWTH OF DOMESTIC TRANSPORT, 1949-73
Index of Freight turnoverfreight volume in 1957
(millions of ton-Transport mode 1949 1957 1973 kilometers)
a. Weighted average of indexes for three transport modes, using 1957 freight turnoverstatistics as weights.
Sources: For 1949 and 1957: Nai-ruenn Chen, Chinese Economic Statishcs (Chicago: Aldine,1967), pp. 373-76. For 1973: Cheng Shih, A Glance At China's Economy (Peking: Foreign Lan-guages Press, 1974), p. 35. The figure for highway transport compares 1973 with the peak yearbefore 1949.
increase during 1957-75 of 8.1 percent." With some allowancemade for possible increases in labor productivity, an annualgrowth rate for construction employment of 7 percent can be as-sumed for the period 1957-75. This results in an employment esti-mate for 1975 of 6.5 million for the construction sector. It is as-sumed that, as in 1957, workers in this sector are all classified asworkers and employees.
Industry
With an employment figure of 55 million for industry, trans-port, and construction, industrial employment may be derived asa residual total of 55 - (8.9 + 6.5) = 39.6 million workers. Accord-ing to the formerly prominent Chang Ch'un-ch'iao, now disgracedas a member of the "Gang of Four": "Industry under ownershipby the whole people accounted for 97 percent of the fixed assets ofindustry as a whole, 63 percent of the industrial population, and86 percent of the value of total industrial output [for 1973]. Besidesthese, individual handicraftsmen made up 0.8 percent of the in-dustrial population." 12
11. U.S. National Foreign Assessment Center, China: Economic Indicators (Wash-ington, D.C.: Central Intelligence Agency, 1977), p. 5.
12. Chang Ch'un-ch'iao, "On Exercising All-Round Dictatorship over the Bour-geoisie," Peking Review, no. 14 (1975), p. 6.
DERIVATION OF ESTIMATED NONAGRICULTURAL EMPLOYMENT 161
Application of these figures to the estimate of industrial em-ployment yields the following results:
State-owned industry 39.6 0.63 = 25.0 million employees(approximately)
Collective industry 39.6 0.362 = 14.3 million employeesIndividual craftsmen 39.6 0.008 = 0.3 million craftsmen
It is assumed that, as in the 1950s, only the personnel of state-owned industry are classified as workers and employees.13
The state sector includes plants that derive their fixed assetsfrom, and return most of their profits to, the state. This categoryincludes enterprises administered by offices of the central, provin-cial, municipal, and county governments. Collective industry ismade up of enterprises that derive their assets from the saving of adistinct community: an agricultural commune, one of the constitu-ent brigades or teams of a commune, or an urban neighborhood.Collective enterprises retain most of their profits.14
The significance of the employment figure for collective indus-try is not entirely clear because many employees of rural collectiveindustry are described as "both workers and peasants," whichsuggests the possibility that the present estimate considerablyoverstates the level of full-time employment in collective industry.But a subsequent report that commune members who work in en-terprises operated by brigades, communes, or townships "work inthe small factories most of the year and go to the fields in the busyfarming season" indicates that most employees of collective indus-
13. Ch'en Chih-ho, "The Question of Groups Included in Labor Force Statis-tics," Chi-hua yu t'ung-chi, no. 11 (1959), translated in Emerson, Nonagricultural Em-ployment, states that all personnel of state enterprises are "workers and employees"and ridicules the suggestion that laborers in commune industry should be includedin this category (pp. 195 and 197).
14. The borderline between collective and state-owned urban industries is notdistinct. Peking Review, no. 20 (1976), p. 22, gives examples of urban factoriesswitching from collective status into the state sector. Visitors to the Peking WestDistrict Optical Meter Plant, a unit employing 520 workers that shifted into thestate sector in 1969, were told that the distinction between the two types of units isnot great because urban collective units may receive partial support from the statesector through grants of equipment, material, and other resources (Rawski TripNotes).
162 ECONOMIC GROWTH AND EMPLOYMENT IN CHINA
try can fairly be described as fuilly employed in the industrial sec-tor. 15
A report stating in 1978 that the rapidly growing industrial ac-tivity associated with China's rural communes and brigades em-ploys a total of 17 million people fits well with the figure of 14.3million workers in collective industry in 1975. This suggests thatthe estimates in Table B-1 capture the order of magnitude of em-ployment changes in industry. In view of the circuitous derivationof these results, however, further substantiation of their order ofmagnitude is desirable; it can be found by investigating industrialemployment and output figures for Shanghai and for Liaoningprovince.
Data in Table B-3 show that industrial labor productivity inthese two regions averaged 23,235 yuan per man-year for 1975 in1957 prices. If this figure is applied to the gross value of nationalindustrial output in 1975, 378.480 billion 1957 yuan, overall em-ployment in industry and handicrafts for 1975 would appear to be16.3 million, far less than the total of 39.6 million derived above. 16
But Shanghai and Liaoning are China's most advanced indus-trial regions. Dividing national gross value of output by averagelabor productivity in these two regions is certain to understatetotal employment because of the implicit assumption that laborproductivity in these two regions approximates the national aver-age. In fact, the advanced state of factory industry and the smallshare of low-productivity handicraft activity in the industrial out-put of these regions means that the productivity figures shown inTable B-3 must exceed the national average by a large margin.
The extent of this deviation is calculated for 1955 in Table B-4,which shows that with industry defined to include handicrafts, ashas been the case since 1958, industrial labor productivity inShanghai and Liaoning was 2.40 times the national average. If thisdifferential has persisted over the subsequent two decades, thenational employment figure for industry (including handicrafts) in1975 would be 378.480 * 2.40 . 109/23.235 .103, or 39.1 million work-
15. FBIS, January 6, 1978, E17.16. Robert M. Field, Nicholas R. Lardy, and John P. Emerson, Provincial Indus-
trial Output in the People's Republic of China: 1949-75 (Washington, D.C.: U.S. Depart-ment of Commerce, 1976), p. 17.
DERIVATION OF ESTIMATED NONAGRICULTURAL EMPLOYMENT 163
TABLE B-3. INDUSTRIAL OUTPUT, EMPLOYMENT, AND PRODUCTIVITY,
IN SHANGHAI AND LIAONING PROVINCE, 1975
Gross value of Industrial Gross valueindustrial output employment per worker
Region (billions of 1957 yuan) (millions of workers) (yuan)
a. Robert M. Field, Nicholas R. Lardy, and John P. Emerson, Provincial Industrial Output inthePeople'sRepublicofChina: 1949-75 (Washington, D.C.: U.S. DepartmentofCommerce, 1976),p. 11.
b. There are 3 million employees in Shanghai city (sBc, no. W825 [19751, pp. Al-2). Refer-ences to 2 million industrial workers therefore appear to include the entire municipality, notjust the city proper. Peking Review, no. 27 (1975), p. 17, states that "in Shanghai ... the numberof female industrial workers has increased from 180,000 in 1949 . . . to over 800,000 or 35 per-cent of that metropolis' total work force today." Assuming that "work force" refers to industryalone, Shanghai industrial employment becomes 800,000 + 0.35, or about 2.3 million.
C. BsC, no. W825 (1975), p. Al.
TABLE B-4. INDUSTRIAL LABOR PRODUCTIVITY FOR 1955, SHANGHAI,LIAONING PROVINCE, AND NATIONWIDE
Gross value
Gross value of output Employment of ou tpu t per(billions of 1952 yuan) (thousands of workers) worker for
____________________________________________all industryRegion Factories Handicrafts Total Factories Handicrafts Total (yuan)
a. Robert M. Field, Nicholas R. Lardy, and John P. Emerson, A Reconstruction of the GrossValue of Industrial Output by Province in the People's Republic of China: 1949-73 (Washington, D.C.:U.S. Department of Commerce, 1975), pp. 20-21.
b. Calculated from data in ibid. by assuming that the ratio of handicraft to factory outputwas the same in 1955 as in 1956 (for Shanghai) or 1957 (for Liaoning).
c. Calculated from the gross value of handicraft output and from average productivity pergainfully occupied handicraftsman in 1954: 1,677 yuan (Shanghai) and 1,642 yuan (Liaoning).Productivity data from Peter Schran, "Handicrafts in Communist China," China Quarterly, no.21 (1964), p. 172.
d. Arithmetic average of 1954 and 1956 figures shown in Thomas G. Rawski, "RegionalDistribution of Industrial Production," (unpublished, 1971; available from the author).
e. John P. Emerson, Nonagricultural Employment in Mainland China, 1949-1958 (Washington,D.C.: U.S. Government Printing Office, 1965), p. 128.
Source: Except as noted, Nai-ruenn Chen, Chinese Economic Statistics (Chicago: Aldine, 1967),pp. 210 and 483.
164 ECONOMIC GROWTH AND EMPLOYMENT IN CHINA
ers, a figure that is within 2 percent of the comparable figure re-ported in Table B-1.
Although it is not possible to check the validity of the assump-tion that interregional productivity differentials have persistedthrough a period that has seen major shifts in the level, structure,and regional distribution of industrial activity, the close agree-ment between employment figures derived from entirely differentsources suggests that the results shown in Table B-1 give a broadlyaccurate picture of employment trends in industry, construction,and transport. 17
Trade, food and drink, finance, banking, and insurance
There is relatively little quantitative information regarding thegrowth of China's service sector. In July 1978, however, it wasstated that the work force in commerce, the service trades, foreigntrade, and banking amounted to 12 million persons.' 8 This figureis 1.35 times the (possibly low) 1957 employment total for thesesectors shown in Table B-1 and 2.14 times the figure of workersand employees in these activities for 1957.
It is known that the volume of transactions in commerce andfinance has risen rapidly since 1957. "China's total retail sales ofcommodities in 1973 rose more than sevenfold compared with theearly post-Liberation days."' 9 This statement apparently com-pares 1973 with 1950 or 1951 (no retail sales figures for 1949 wereever published). If retail sales for 1973 are 8 times the 1950 level,then with 1957=100, retail volume for 1973 is 239-289, depending
17. In an article entitled "Observe Economic Laws, Speed Up the Four Modern-
izations," Peking Review, no. 46 (1978), p. 22, Hu Ch'iao-mu, president of the Chi-nese Academy of Social Sciences, presents information on labor productivity thatcan be used to estimate industrial employment for 1977. Although the exact cate-gories underlying Hu's statement cannot be determined, his figures appear to im-ply an industrial labor force in 1977 of about 51 million workers, or 12 million morethan the present estimate for 1975. Since it is doubtful that industrial employmentrose by as much as 12 million persons in only two years, these figures suggest thatthe present estimate of 1975 industrial employment may be too low. Further in-quiry must await clarification of the calculations on which Hu's statement is based.
18. Peking Review, no. 30 (1978), p. 1.
19. Chi Ti, "Stable Prices and the Reasons-Part 1," Peking Review, no. 19
(1975), p. 17.
DERIVATION OF ESTIMATED NONAGRICULTURAL EMPLOYMENT 165
on which of two trade indicators is used. If 1951 is the base, tradevolume in 1973 becomes 341-395 with 1957=100.20 The annualgrowth rate for domestic retail sales implied by these comparisonsfalls between 5.6 and 9.0 percent. Foreign trade flows rose at anannual rate of 5.4 percent between 1957 and 1974 (Table 1-1). Scat-tered data on savings deposits show even faster increases in tum-over at bank branches:
Increase in deposits Annualgrowth rateProvince Period (percent) (percent)
Sources do not indicate whether the foregoing figures refer tostocks or flows. Chekiang data compare increases recorded during1966-75 with comparable figures for 1956-65.21
In the absence of information suggesting implementation ofproductivity-enhancing innovation in these service trades, itseems reasonable to assume substantial increases in employment.Accordingly, the figure of 12 million persons has been taken as anestimate of the number of workers and employees in trade, foodand drink, finance, banking, and insurance during 1975. This as-sumption implies an annual growth rate of 4.3 percent for thiscategory of employment during 1957-75. The number of personnelin these activities who are not classified as workers and employeesis assumed to have grown at the same 4.3 percent annual rate dur-ing 1957-75, leading to an overall total of 18.0 million persons inthis sector in 1975.
20. The trade series for 1949-57 covering total retail volume and retail volume ofcommercial organizations are shown in Nai-ruenn Chen, Chinese Economic Statistics(Chicago: Aldine, 1967), pp. 394-95.
21. Data for Fukien, referring to reserves and savings of cities and villages, arefrom BBC, no. W873 (1976), p. Al; the remaining figures are from BBC, no. W867(1976), p. A3.
166 ECONOMIC GROWTH AND EMPLOYMENT IN CHINA
Personal services
Employment in this sector, which includes such personal ser-vices as barbering, is assumed to have grown during 1957-75 atthe same rate of 4.3 percent derived for workers and employees intrade, food and drink, finance, banking, and insurance.
Health
Employment for health care in 1975 is derived from the follow-ing statement: "The rural medical network has six million medicalpersonnel, including 1.5 million barefoot doctors [paramedics]and 3 million spare time public health workers who work in thefields an average of 100 days/year. In addition, 1.1 million urbanmedical personnel visit rural areas in mobile teams."2 2 It is as-sumed that the 4.5 million paramedics and part-time public healthworkers are not counted as workers and employees, but that theremaining 1.5 million rural medical personnel are full-time wage-earners who are so classified, along with 1.1 million urban medicalpersonnel who visit rural areas and an additional (assumed) cate-gory of 0.5 million urban medical personnel who do not visit ruralareas in mobile teams. The estimate of employment in health carefor 1975 thus includes 3.1 million workers and employees and, as-suming that the typical part-time public health worker spendstwo-thirds time in medical activities, 3.5 million other personnel,for a sectoral total of 6.6 million workers.
Education and culture
The number of teachers is estimated from school enrollment fig-ures by assuming constant class size:
1957 data 1977 data and estimates
Students Teachers Students TeachersType of school (millions) (thousands) (millions) (thousands)
DERIVATION OF ESTIMATED NONAGRICULTURAL EMPLOYMENT 167
The number of teachers at each level is assumed in the foregoingtabulation to have risen in proportion to the number of stu-dents.2 3 It is also assumed that the number of teachers did notchange between 1975 and 1977. Under the further assumption thatthe share of teachers in total employment in education and cultureremained at the 1957 level of 84.8 percent, employment in thisfield in 1975 may be estimated at 7.6 million persons, all of whomare assumed to be classified as workers and employees.2 4
Government administration and mass organizations
Employment in this category is assumed to have increased dur-ing 1957-75 at the 4.3 percent annual rate established for workersand employees in trade, food and drink, finance, banking, andinsurance. This may prove controversial, but in view of the rapidgrowth of state revenue and the proliferation of economic plan-ning and administrative activities at the provincial, county, andcommune levels, it is difficult to doubt that employment in thisarea is now substantially above the level reached in 1957.
Total state revenue and expenditure have grown as follows:2 5
23. Data for 1957 are from Ten Great Years (reprint edition, Bellingham: WesternWashington State College, 1974), p. 133. Recently published enrollment figures,which are assumed to relate to 1977, are from Peking Review, no. 36 (1978), p. 15, andFBIS, July 20, 1978, p. E14.
24. Data on the number and composition of employees in education and cul-ture for 1957 appear in Emerson, Nonagricultural Employment, pp. 93 and 128.
25. Data for 1950 and 1957 are from Chen, Chinese Economic Statistics, pp. 441and 446; 1973 data, expressed as multiples of 1949 that are applied to the figures for1950, are from Cheng-chih ching-chi-hs0el dci-ch'u chih-shih [Basic Knowledge aboutPolitical Economy] (Shanghai: Shanghai jen-min ch'u-pan she, 1975), p. 406. Datafor 1977 and 1978 are from "China's National Economy (1978-79)," Beijing Review,no. 26 (1979), p. 12.
168 ECONOMIC GROWTH AND EMPLOYMENT IN CHINA
Both revenue and expenditure have risen at an annual rate of from6 to 7 percent since 1957.
The spread of government activity is not as easy to documentas the growth of fiscal aggregates. It is certainly a mistake, how-ever, to take literally the statements made during the CulturalRevolution about reductions in the number of central governmentofficials, which Subraminian Swamy uses to argue that "the totaleffect of the Cultural Revolution was a sharp decline in the netvalue added of the trade and services sector."2 6 Merely listingsome of the areas into which government administration and massorganizations have penetrated during the past two decades isperhaps enough to justify an assumption of substantial employ-ment growth: rural communes, rural and urban small-scale in-dustry, delegation of planning authority to provinical and countygovernments, formation of new administrative bodies within in-dustrial units, expansion of the "down to the countryside" move-ment, and increased foreign contacts. As in the 1950s, all per-sonnel in this sector are assumed to be classified as workers andemployees.
Salt
China's output of salt increased from 8.3 million tons in 1957 to
19.5 million tons in 1978, implying an average annual growth rateof 4.2 percent. 27 A 4.2 percent annual increase in employment is
assumed for 1957-75, which leads to an employment estimate of1.1 million persons in 1975. As in the 1950s, these personnel areassumed to be excluded from the category of "workers and em-ployees."
Fishing
The employment figure for this sector in 1975 is taken from alecture by Robert Hart, chief adviser to the International Fisheries
26. Subraminian Swamy, "Economic Growth in India and China 1952-1970: A
Comparative Appraisal," Economic Development and Cultural Change, vol. 21, no. 4,
part 2 (1973), p. 58.
27. Output figures are from Chen, Chinese Economic Statistics, p. 189, and "Com-
munique on Fulfillment of China's 1978 National Economic Plan," Beijing Review,
no. 27 (1979), p. 38.
DERIVATION OF ESTIMATED NONAGRICULTURAL EMPLOYMENT 169
and Marine Directorate, Canadian Department of the Environ-ment. In addition to these full-time fishermen, there are also 4.25million part-time fishermen. As in the 1950s, fishermen are as-sumed to be excluded from the category of "workers and em-ployees."
Military
China's regular armed forces were reported to consist of 3.5 mil-lion men in 1976. This figure is used for 1975, and it is assumedthat, as in the 1950s, military personnel are not classified as work-ers and employees.28
Statefarms, forestry, and water conservancy
In 1978, China's state farms employed 5 million agriculturalworkers. 2 9 Data from 18 of China's 29 province-level unitsshowed that 17 million workers were occupied in 1977 in full-timeprojects "involving building water conservancy projects, terracinghillsides, improving the soil and other basic measures for ex-panding the cultivated area and increasing per hectareyields."3 0 It is thus assumed that these categories, together withforestry, employed a total of 22 million persons in 1975, and that,as in the 1950s, full-time members of state farms and rural con-struction brigades continued to be classified as workers and em-ployees.
28. Personnel total is drawn from Drew Middleton, "Visit to China's Forces:Big But Poor in New Arms," New York Times, December 1, 1976, p. 1. Ch'en Chih-ho, "Labor Force Statistics," p. 196, states that military workers are "not includedin the worker and employee universe."
29. "Briefing on China's Agriculture," distributed by the Bureau of ForeignAffairs, Ministry of Agriculture and Forestry, September 18, 1978.
30. Chou Chin, "A Year of Advance Amid Storms," Peking Review, no. 7 (1977),P. 9.
Appendix C
Employment in Leading Small-ScaleProducer-Goods Industries, 1975
THE ESTIMATES OF LEVEL OF EMPLOYMENT for 1975 in Table C-1 cov-er small-scale plants and mines in the following industries: ce-ment, chemical fertilizer, coal, ferrous metallurgy, machinery, andelectric power. Chinese sources combine coal and power underthe rubric of energy and refer to these sectors as the "five smallindustries." The purpose of this appendix is to explain the deriva-tion of the figures in Table C-1.
Cement
Estimates based on Chinese sources indicate that China produced47.1 million tons of cement in 1975, of which 27.7 million tonscame from small plants.' Visits to three leading plants in thesmall-scale cement sector in 1975 elicited productivity figures aver-aging 145.0 tons per man-year. 2 Employment in the small-scalecement industry may therefore be estimated at 27.7 million tons .145 tons per man-year, or approximately 191,000 workers. If, as is
1. U.S. National Foreign Assessment Center, China: Economic Indicators (Wash-ington, D.C.: Central Intelligence Agency, 1977), p. 23.
2. Dwight H. Perkins and others, Rural Small-Scale Industry in the People's Repub-lic of China (Berkeley: University of California Press, 1977), p. 88. Labor productiv-ity is the quotient of the combined 1974 output and combined 1975 employment
totals at the three plants.
170
EMPLOYMENT IN SMALL PRODUCER-GOODS INDUSTRIES 171
TABLE C-1. ESTIMATED EMPLOYMENT IN SMALL-SCALE PRODUCER-GOODSINDUSTRIES, 1975
likely, productivity at the plants visited was above average, thisfigure understates actual employment.
Chemical Fertilizer
The output of chemical fertilizers in 1975 is estimated at 27.875million tons, of which 10.276 million tons of nitrogenous fertil-izers and 6.471 million tons of phosphates came from smallplants.3 Small plant output of 10.276 million tons of nitrogenousfertilizers containing 20 percent nitrogen is equivalent to 2.055million tons of nitrogen. Pooled output and employment data forthree plants visited in 1975 indicate average labor productivity of18.3 tons of ammonia per man-year or, using a conversion factor of0.82, 15.0 tons of nitrogen per man-year. 4 If these plants are repre-sentative, small-scale nitrogenous fertilizer production appears tohave occupied approximately 2.055 . 101 + 15.0, or 137,000 workersin 1975.
In the absence of detailed information, employment in small-scale manufacture of phosphate fertilizers is estimated by assum-ing that employment per ton of standard product in 1975 was thesame as in small nitrogenous fertilizer plants. The latter group ac-
3. U.S. National Foreign Assessment Center, China: Economic Indicators (1977),p. 22.
4. Perkins and others, Rural . .. Industry, p. 96. Labor productivity is the quo-tient of pooled 1974 output and 1975 employment totals at the three plants.
172 ECONOMIC GROWTH AND EMPLOYMENT IN CHINA
counted for 36.9 percent of standard product weight in 1975,whereas small phosphate plants produced 23.2 percent of standardproduct weight. It can therefore be estimated that employment insmall phosphate plants was 137,000 * (23.2 - 36.9), or 86,135 work-ers in 1975.
Potassium fertilizers, which contributed only 1.8 percent of1975 fertilizer output, are ignored. The estimate of employment for1975 in small-scale production of chemical fertilizers is therefore223,135, or 223,000 wcorkers in round figures.
Coal
Production of coal in 1975 is estimated at 480 million tons, ofwhich approximately 149 million tons came from small mines and331 million tons from large mines. 5 A report in 1976 stated that"there are 3,000,000 staff and workers in China's coal industry," afigure that can be taken as valid for 1975 as well.6
Labor productivity at the large K'ai-lan mine complex in Hopeiprovince, a model industrial unit, may be calculated as follows:Output obtained by K'ai-lan's 100,000 miners from January 1 toDecember 23, 1975, amounted to 25.2 million tons.7 Labor pro-ductivity for 1975 is thus 25.2 * 10 . (365 + 357), or 257.6 tons per
man-year. Assuming 300 annual days of work, average daily out-put is 0.859 tons per worker, which is less than the figure of 0.978tons per man-day for the entire coal industry in 1957.8
If K'ai-lan's performance may be taken as typical of large mines,employment at large mines may be estimated at 331 million tons -
257.6 tons per man-year, or 1.28 million workers. This leaves atotal of about 1.72 million workers associated with small mines.Productivity at small mines then becomes approximately 149 mil-lion tons . 1.72 million workers, or 86.6 tons per man-year. Thisimplies that the bulk of the output from small coal mines comes
5. U.S. National Foreign Assessment Center, China: Economic Indicators (1978),p. 22.
6. BBc, no. W906 (1976), p. Al, repeated in Peking Review, no. 49 (1976), p. 10.7. BBC, no. W870 (1976), p. A9, and no. W882 (1976), p. A7.8. The figure for 1957 is from Nai-ruenn Chen, Chinese Economic Statistics (Chi-
cago: Aldine, 1967), p. 263.
EMPLOYMENT IN SMALL PRODUCER-GOODS INDUSTRIES 173
from county units that are better equipped than the primitivecommune facility visited by Ward Morehouse, at which labor pro-ductivity appeared to be approximately 31.8 tons per man-year. 9
Iron and Steel
In 1973 small and medium-size plants produced an estimated 28percent of pig iron and 13 percent of crude steel output. ' 0 It can beassumed that in 1975 small plants accounted for 20 percent of grossvalue of output in ferrous metallurgy. Gross value of output in thisindustry for 1974 is estimated at 23.170 billion 1952 yuan. If thistotal rose in proportion to the 14.3 percent rise in crude steel out-put estimated for 1974/75, the gross output for 1975 becomes26.483 billion 1952 yuan, or, since steel prices for 1975 are esti-mated at 60.9 percent of the 1952 levels, 16.128 billion 1975 yuan,of which 20 percent, or 3.226 billion yuan, is linked to smallplants. 11
Labor productivity is estimated on the basis of a single observa-tion: a Wu-hsi (Kiangsu) county plant whose 805 workers pro-duced steel ingots, reinforcing rods, and angle irons valued at over9 million yuan during 1974.12 Estimated labor productivity is thus9 million - 805, or 11,180 yuan per man-year. Estimated employ-ment in small-scale iron and steel plants is therefore approximate-ly 280,000 workers.
Machinery
Estimating employment in small-scale machinery plants is noteasy. Most small plants concentrate on producing farm machines,
9. Ward Morehouse, "Notes on Hua-tung Commune," China Quarterly, no. 67(1976), p. 588.
10. U.S. National Foreign Assessment Center, China: Economic Indicators (1978),p. 23.
11. Estimated steel output is from ibid. Gross output and price estimates arefrom Thomas G. Rawski, "China's Industrial Performance, 1949-1973," in Quan-titative Measures of China's Economic Output, ed. Alexander Eckstein (Ann Arbor:University of Michigan Press, forthcoming), Tables 27 and H-1.
12. Perkins and others, Rural . .. Industry, p. 103.
174 ECONOMIC GROWTH AND EMPLOYMENT IN CHINA
making parts for farm machines, or performing repair work. Thepresent estimate is compiled by assuming that small machineryplants devote themselves exclusively to these activities. Agricul-tural machinery and equipment accounted for from 6 to 7 percentof overall machinery output in 1956.13 This share has risen consid-erably since then. It is assumed that the share of farm equipmentin machinery output in 1975 was 15 percent. Two-thirds of farmmachinery produced in China came from small plants in 1966; it isassumed that the relevant proportion had risen to 75 percent by1975.14
Chinese statements indicate that total output of all types of ma-chinery in 1972 was 86.725 billion 1952 yuan. If output in 1975 was45.4 percent above the 1972 level, the figure for 1975 becomes126.098 billion 1952 yuan for all machinery, 15 percent of thisamount, or 18.915 billion yuan, for farm machinery, and 75 per-cent of this latter amount, or 14.186 billion 1952 yuan, for smallplant output of farm machinery-which can be equated with totalmachinery output from small plants. I5
Labor productivity is estimated on the basis of information ob-tained from ten agricultural machinery enterprises in 1975; thesedata appear in Table C-2. Productivity at the Shanghai FengshouTractor Plant is far above the levels observed elsewhere; the per-formance of this large enterprise has no relation to average pro-ductivity at small plants. If this plant is excluded, average outputvalue per man-year is 6,374 yuan. Even this is a high figure; itmust be assumed that the inclusion of data from model units andregions often shown to foreign visitors (for example, Red StarCommune and Hsi-yang and Lin counties) and of enterprises inChina's most advanced industrial region (Shanghai and Wu-hsi)results in productivity figures that substantially exceed the nation-al average.
Accordingly, average labor productivity for 1975 is placed
13. Chao 1-wen, Hsin Chung-kuo ti kung-yeh [Industry of New China] (Peking:T'ung-chi ch'u-pan she, 1957), p. 43.
14. The figure for 1966 is from Carl Riskin, "Small Industry and the ChineseModel of Development," China Quarterly, no. 46 (1971), p. 271.
15. Gross output and price estimates are from Rawski, "Industrial Perfor-mance," in Quantitative Measures, Tables 7 and H-1. Estimated growth of machineryproduction during 1972-75 is from U.S. National Foreign Assessment Center,China: Economic Indicators (1978), p. 1.
EMPLOYMENT IN SMALL PRODUCER-GOODS INDUSTRIES 175.
TABLE C-2. LABOR PRODUCTIVITY AT SELECTED FARM MACHINERY PLANTS
Gross output,1974 Labor
(thousands Employment, productivityPlant and location of yuan) 1975 (yuan)
Municipal plants1. Hsinhsiang fertilizer equipmento 1,300 330 3,9392. Hsinhsiang water pump 7,100 680 L0,4413. Shanghai Feng-shou tractor 80,000 1,300 il,538
County plants4. Hsiyang (Shansi) tractor 1,044 310 3,3685. Lin (Honan) Tung-fang-hung 1,000+ 300 3,333+6. Shanghai Chia-tung county 1,800 450 4,0007. Wuhsi (Kiangsu) tractor 6,000 661 9,077
Commune plants8. Red Star (Peking) 575 261 2,2039. Yang-shih (Wuhsi, Kiangsu) 1,600 192 8,333
10. Yao-ts'un (Lin, Honan) 450 90 5,000
Total 100,869 4,574 22,053
Total excluding plant 3 20,869 3,274 6,374
a. Administered by Hsinhsiang prefecture, Honan.Source: Dwight H. Perkins and others, Rural Small-Scale Industry in the People's Republic of
ahina (Berkeley: University of California Press, 1977), pp. 6469.
arbitrarily at 4,000 yuan, and employment for 1975 in small-scalemachinery plants is estimated at 8.185 billion . 4,000, or 2.046million workers.
Power
Small hydroelectric stations account for 20 percent of China's hy-dropower capacity, which in turn produced an estimated 25 per-cent of total output of 121 billion kilowatt-hours of electricity in1975.16 Of the hydroelectric output of 30 billion kilowatt-hours in1975, 20 percent, or 6 billion kilowatt-hours, is attributed to smallplants.
In 1975 visitors to a county power station in Lin county (Honan)were told that the 2,500 kilowatt installation employed 43 persons
16. Capacity figure is from Peking Review, no. 21 (1975), pp. 30-31; the outputestimates, which appear to be considerably below actual performance, are fromU.S. National Foreign Assessment Center, China: Economic Indicators (1978), p. 22.
176 ECONOMIC GROWTH AND EMPLOYMENT IN CHINA
and produced an annual total of 9 million kilowatt-hours of elec-tricity.17 If the implied labor productivity figure of 209,302 kilo-watt-hours per man-year is typical of all small hydroelectric plants,employment in these plants for 1975 can be estimated at approxi-mately 29,000 persons.
17. Perkins and others, Rural . .. Industry, p. 109.
Bibliography
Note: Titles of Chinese- and Japanese-language articles are given in trans-lation only. Chine'e language materials written by corporate authors areidentified by their titles only.
Aird, John S. Population Estimates for the Provinces of the People's Republic ofChina: 1953 to 1974. Intemational Population Reports, Series P-95, no.73. Washington, D.C.: U.S. Department of Commerce, 1974.
. "Population Growth and Distribution in Mainland China." In U.S.Congress, Joint Economic Committee, An Economic Profile of MainlandChina, vol. 2, pp. 341-401. 2 vols. Washington, D.C.: U.S. GovernmentPrinting Office, 1967.
. "Population Growth in the People's Republic of China." In U.S.Congress, Joint Economic Committee, Chinese Economy Post-Mao, vol.1, pp. 439-75. Washington, D.C.: U.S. Government Printing Office,1978.
. "Recent Provincial Population Figures," China Quarterly, no. 73(1978), pp. 1-44.
Banister, Judith. "China's Demographic Transition in the Asian Con-text." From "The Current Vital Rates and Population Size of thePeople's Republic of China and its Provinces." Ph.D. dissertation,Food Research Institute, Stanford University, 1977.
Barnett, A. Doak. Uncertain Passage: China's Transition to the Post-Mao Era.Washington, D.C.: Brookings Institution, 1974.
Beijing Review (weekly). Formerly Peking Review. Peking.Bernstein, Thomas P. Up to the Mountains and Down to the Villages. New
Haven, Conn.: Yale University Press, 1977."Briefing on China's Agriculture." Distributed by the Bureau of Foreign
Affairs, Ministry of Agriculture and Forestry, Peking, September 18,1978.
177
178 ECONOMIC GROWTH AND EMPLOYMENT IN CHINA
British Broadcasting Corporation (BBC). Summary of World Broadcasts:Part 3, The Far East, Weekly Economic Report.
Buck, John L. Land Utilization in China. Nanking: University of Nanking,1937.
Burki, Shahid Javed. A Study of Chinese Communes, 1965. Cambridge,Mass.: East Asian Research Center, Harvard University, 1969.
Burns, John P. "The Election of Production Team Cadres in Rural China:1958-74." China Quarterly, no. 74 (1978), pp. 273-96.
Chang Ch'un-ch'iao. "On Exercising All-Round Dictatorship over theBourgeoisie." Peking Review, no. 14 (1975), pp. 5-11.
Chao 1-wen. Hsin Chung-kuo ti kung-yeh [Industry of New China]. Peking:T'ung-chi ch'u-pan she, 1957.
Chao, Kang. Agricultural Production in Communist China. Madison: Univer-sity of Wisconsin Press, 1970.
Ch'en Chih-ho. "The Question of Groups Included in Labor Force Statis-tics." Chi-hua yu t'ung-chi [Planning and Statistics], no. 11 (1959). Trans-lated in John P. Emerson, Nonagricultural Employment in Mainland China:1949-1958 (q.v.), pp. 195-99.
Chen, Nai-ruenn. "An Assessment of Chinese Economic Data: Availabili-ty, Reliability, and Usability." In U.S. Congress, Joint Economic Com-mittee, China: A Reassessment of the Economy, pp. 52-68. Washington,D.C.: U.S. Government Printing Office, 1975.
_ . Chinese Economic Statistics. Chicago: Aldine, 1967.
Chen, Pi-chao. "Overurbanization, Rustication of Urban-EducatedYouths, and Politics of Rural Transformation." Comparative Politics,April 1972, pp. 361-86.
Ch'eng Chin-chieh. "The Way Liuchi Commune Wins Its Higher Grainand Cotton Yields." Ching-cii yen-chiu [Economic Research], no. 4(1965). Translated in ECMM, no. 473 (1965), pp. 1-7.
Cheng Shih. A Glance at China's Economy. Peking: Foreign LanguagesPress, 1974.
Chi I-chai. "A Study of Food Output in Mainland China III." Fei-ch'ingyueh-pao [Chinese Communist Affairs] vol. 10, no. 9 (1967). Translatedin JPRS, no. 43,937 (1968), pp. 17-24.
Chi-lin jih-pao [Kirin Daily]. Ch'angch'un.
Chi Ti. "Stable Prices and the Reasons-Part 1." Peking Review, no. 19(1975), pp. 17-20.
BIBLIOGRAPHY 179
Chieh-fang jih-pao [Liberation Daily]. Shanghai.
China Business Review (bimonthly). Washington.
China News Analysis (weekly). Hong Kong.
China Reconstructs (monthly). Peking."China's National Economy (1978-79)," Beijing Review, no. 26 (1979),
pp. 8-12.Ching-chi tao-pao [The Economic Reporter] (weekly). Hong Kong.
Chou Chin. "A Year of Advance Amid Storms." Peking Review, no. 7(1977), pp. 6-10.
Chu Li and Tien Chieh-yun. Inside a People's Commune. Peking: ForeignLanguages Press, 1974.
Chuan, Han-sheng, and Richard A. Kraus. Mid-Ch'ing Rice Markets andTrade. Cambridge, Mass.: Harvard University Press, 1975.
Chu-goku kagaku gijutsu no genjo bunseki [Analysis of the Current State ofChina's Science and Technology]. Tokyo: Shokoku kagaku gijutsu ken-kyfikai, 1965.
Chung-kung yen-chiu [Studies on Chinese Communism] (monthly). Taipei.
"Communique of the Third Plenary Session of the 11th Central Com-mittee of the Communist Party of China." Peking Review, no. 52 (1978),pp. 6-16.
"Communique on Fulfillment of China's 1978 National Economic Plan,"Beijing Review, no. 27 (1979), pp. 37-41.
Craig, Jack. "China: Domestic and Intemational Telecommunications,1949-74." In U.S. Congress, Joint Economic Committee, China: A Reas-sessment of the Economy, pp. 289-310. Washington, D.C.: U.S. Govem-ment Printing Office, 1975.
Crook, Frederick W. "The Commune System in the People's Republic ofChina, 1963-74." In U.S. Congress, Joint Economic Committee, China:A Reassessment of the Economy, pp. 366-410. Washington, D.C.: U.S.Govemment Printing Office, 1975.
Demberger, Robert F. and David Fasenfest. "China's Post-Mao EconomicFuture." In U.S. Congress, Joint Economic Committee, Chinese Econo-my Post-Mao, vol. 1, pp. 3-47. Washington, D.C.: U.S. GovernmentPrinting Office, 1978.
Donnithome, Audrey. China's Economic System. London: Allen and Un-win, 1967.
Emerson, John Philip. Nonagricultural Employment in Mainland China: 1949-1958. International Population Statistics Reports, Series P-90, no. 21.Washington, D.C.: U.S. Department of Commerce, 1965.
"Evolution and Development of the Paddy Crop Situation in the LakeDistrict." Chung-kuo nung-pao [China Agricultural Bulletin], no. 8(1964), pp. 27-30.
Falcon, Walter P., and Gerald C. Nelson. "Prospects for China's Agricul-ture." Unpublished draft, 1978.
Far Eastern Economic Review (weekly). Hong Kong.
1967 Fei-ch'ing nien-pao [1967 Yearbook of Chinese Communism]. Taipei:Fei-ch'ing yen-chiu tsa-chih she, 1967.
Field, Robert Michael. "Civilian Industrial Production in the People'sRepublic of China: 1949-74." In U.S. Congress, Joint Economic Com-mittee, China: A Reassessment of the Economy, pp. 146-74. Washington,D.C.: U.S. Government Printing Office, 1975.
_ . "Real Capital Formation in the People's Republic of China, 1952-1973." In Quantitative Measures of China's Economic Output. Edited byAlexander Eckstein. Ann Arbor: University of Michigan Press, forth-coming.
,_ and James A. Kilpatrick. "Chinese Grain Production: An Inter-pretation of the Data." China Quarterly, no. 74 (1978), pp. 369-84.
- Nicholas R. Lardy, and John Philip Emerson. Provincial IndustrialOutput in the People's Republic of China: 1949-75. Foreign Economic Re-port no. 12. Washington, D.C.: U.S. Department of Commerce, 1976.
_ . A Reconstruction of the Gross Value of Industrial Output by Province in thePeople's Republic of China: 1949-75. Foreign Economic Report no. 7.Washington, D.C.: U.S. Department of Commerce, 1975.
First Five-Year Plan for Development of the National Economy of the People'sRepublic of China in 1953-1957. Peking: Foreign Language Press, 1956.
Furui, Yoshimi, and others. Hochui shoken [A Visit to China]. Tokyo: n.p.,1959.
Geertz, Clifford. Agricultural Involution. Berkeley: University of CaliforniaPress, 1966.
Hayami, Yujiro, and Vernon W. Ruttan. Agricultural Development. Balti-more: Johns Hopkins Press, 1971.
BIBLIOGRAPHY 181
Hou, Chi-ming. "Manpower, Employment and Unemployment." In Eco-nomic Trends in Communist China, pp. 329-96. Edited by Alexander Eck-stein, Walter Galenson, and Ta-chung Liu. Chicago: Aldine, 1968.
Howe, Christopher. China's Economy: A Basic Guide. New York: BasicBooks, 1978.
. Employment and Economic Growth in Urban China, 1949-1957. Cam-bridge, England: Cambridge University Press, 1971.
Hsiang Lin. "How to Implement the Principle of Frugal National Con-struction." Chi-hsieh kung-yeh [Machinery Industry], no. 11 (1957), pp.18-21 and 23.
Hsiao Han. "Developing Coal Industry at High Speed." Peking Review, no.8 (1978), pp. 5-7.
Hsin Hu-nan pao [New Hunan News] (daily). Ch'angsha.
Hu Ch'iao-mu. "Observe Economic Laws, Speed Up the Four Modern-izations." Peking Review, no. 45 (1978), pp. 7-12, no. 46 (1978), pp. 15-23, and no. 47 (1978), pp. 13-21.
Hu-pei jih-pao [Hupei Daily]. Hankow.
Huang Ching [Chairman, National Technological Commission]. "On Ag-ricultural Mechanization in China." Chi-hsieh kung-yeh [Machinery In-dustry] no. 21 (1957). Translated in ECMM, no. 120 (1958), pp. 3443.
I Ts'ai and Wang P'i-chang. "Ways of Improving the Economic Effect ofFertilization." Ching-chi yen-chiu [Economic Research], no. 4 (1965).Translated in ECMM, no. 475 (1965), pp. 23-31.
Ishikawa, Shigeru. National Income and Capital Formation in Mainland China.Tokyo: Institute of Asian Economic Affairs, 1965.
len-min jih-pao [People's Daily]. Peking.
Johnson, Virgil A., and Halsey L. Beemer, Jr., eds. Wheat in the People'sRepublic of China. Washington, D.C.: National Academy of Sciences,1977.
Kao Hsia. "Yangtze Waters Diverted to North China." Peking Review, no.38 (1978), pp. 6-9.
Keesing, Donald B. "Economic Lessons From China." Journal of Develop-ment Economics, no. 2 (1975), pp. 1-32.
King, F. H. Farmers of Forty Centuries. Emmaus, Pa.: Organic GardeningPress, n.d.
Kohrt, Giinter. "Maoism's Permanent Crisis and Growing Threat." Hori-zont, vol. 9, no. 33-37 (1976). Partially translated in JPRS, no. 68,303(1976), pp. 62-96.
Kuang-ming jih-pao [Kuang-ming Daily]. Peking.
182 ECONOMIC GROWTH AND EMPLOYMENT IN CHINA
Kuo, Leslie T. C. Agriculture in the People's Republic of China. New York:Praeger, 1976.
Lardy, Nicholas R. "Centralization and Decentralization in China's FiscalManagement." China Quarterly, no. 61 (1975), pp. 25-60.
_ . Economic Growth and Distribution in China. Cambridge, England:Cambridge University Press, 1978.
_. "Recent Chinese Economic Performance and Prospects for the Ten-Year Plan." In U.S. Congress, Joint Economic Committee, Chinese Econ-omy Post-Mao, vol. 1; pp. 48-62. Washington, D.C.: U.S. GovernmentPrinting Office, 1978.
Li, Choh-ming. 7The Statistical System of Communist China. Berkeley: Uni-
Liu Chih-cheng and others. "The Relations Between the Four Transforma-tions and Economic Effects." Ching-chi yen-chiu [Economic Research],no. 2 (1964). Translated in ECMM, no. 424 (1964), pp. 1-15.
Liu, Ta-chung. "Economic Development of the Chinese Mainland, 1949-1965." In China in Crisis, vol. 1, bk. 2, pp. 605-90. Edited by Ping-ti Hoand Tang Tsou. 2 vols. Chicago: University of Chicago Press, 1968.
_ and Kung-chia Yeh. The Economy of the Chinese Mainland. Princeton,N.J.: Princeton University Press, 1965.
MacFarlane, Ian H. "Construction Trends in China, 1949-74." In U.S.Congress, Joint Economic Committee, China: A Reassessment of the Econ-omy, pp. 311-23. Washington, D.C.: U.S. Government Printing Office,1975.
Mellor, John W. The New Economics of Growth. Ithaca, N.Y.: Cornell Uni-versity Press, 1976.
Meng Chih-chien. "On Mechanization of Casting Shops." Chi-hsieh kung-yeh [Machinery Industry], no. 13 (1957), pp. 5-8.
Middleton, Drew. "Visit to China's Forces: Big but Poor in New Arms."New York Times, December 1, 1976.
Morawetz, David. Twenty-five Years of Economic Development, 1950 to 1975.Baltimore and London: Johns Hopkins University Press, 1977.
Morehouse, Ward. "Notes on Hua-tung Commune." China Quarterly, no.67 (1976), pp. 582-95.
Munro, Ross H. "Why China's Peasants Don't Want to Work." San Fran-cisco Chronicle, July 29, 1977.
Myers, Ramon H. "Economic Organization and Cooperation in ModemChina: Irrigation Management in Xing-tai County, Ho-bei Province."In Chagoku no seiji to keizai [The Polity and Economy of China] pp. 189-212. Edited by The Late Professor Yuji Muramatsu CommemorationBoard. Tokyo: T6y6 keizai shimp6sha, 1975.
_. "Wheat in China-Past, Present and Future." China Quarterly, no.74 (1978), pp. 297-333.
Nan-fang jih-pao [Southern Daily]. Canton.
New China's First Quarter-Century. Peking: Foreign Languages Press, 1975.
Nickum, James E. "A Collective Approach to Water Resource Develop-ment: The Chinese Commune System, 1962-1972." Ph.D. dissertation.University of California, Berkeley, 1974.
_ . Hydraulic Engineering and Water Resources in the People's Republic ofChina. Stanford, Calif.: U.S.-China Relations Program, 1977.
Nung-yeh ch'ang-yung shu-tzu shou-ts'e [Handbook of Common AgriculturalData]. Peking: Jen-min ch'u-pan she, 1975.
Oksenberg, Michel. "Methods of Communication within the Chinese Bu-reaucracy." China Quarterly, no. 57 (1974), pp. 1-39.
Orleans, Leo A. "China's Population: Can the Contradictions be Re-solved?" In U.S. Congress, Joint Economic Committee, China: A Reas-sessment of the Economy, pp. 69-80. Washington, D.C.: U.S. Govern-ment Printing Office, 1975.
_ . "China's Science and Technology: Continuity and Innovation." InU.S. Congress, Joint Economic Committee, People's Republic of China:An Economic Assessment, pp. 185-219. Washington, D.C.: U.S. Govern-ment Printing Office, 1972.
. Every Fifth Child: The Population of China. Stanford, Calif.: StanfordUniversity Press, 1972.
Ozaki Shotar6. "Visit to Mukden No. 1 Machine Tool Plant." Ajia keizaijumpo [Asian Economic Weekly], no. 475 (1960). Translated in JPRS, no.10,434 (1961), pp. 8-12.
Pai Ou. "Brief Discussion of the Direction and Tasks of the MachineryIndustry." Chi-hsieh kung-yeh [MachinQry Industry], no. 12 (1957), pp.2-8.
P'an Kuang-chi. "Opinions on the Development of Basic Chemical Indus-tries." Hua-hsueh kung-yeh [Chemical Industry], no. 8 (1957), pp. 33-35.
184 ECONOMIC GROWTH AND EMPLOYMENT IN CHINA
Parish, William L., and Martin King Whyte. Village and Family in Contem-porary China. Chicago: University of Chicago Press, 1978.
Peking Review (weekly). Now Beijing Review. Peking.
Perkins, Dwight H. Agricultural Development in China, 1368-1968. Chicago:Aldine, 1969.
_. "A Conference on Agriculture." China Quarterly, no. 67 (1976), pp.596-610.
. "Constraints Influencing China's Agricultural Performance." InU.S. Congress, Joint Economic Committee, China: A Reassessment of theEconomy, pp. 350-65. Washington, D.C.: U.S. Government PrintingOffice, 1975.
. "Estimating China's Gross Domestic Product." Current Scene, vol.15, no. 3 (1976), pp. 12-19.
-. "Growth and Changing Structure of China's Twentieth-CenturyEconomy." In China's Modern Economy in Historical Perspective, pp. 115-65. Edited by Dwight H. Perkins. Stanford, Calif.: Stanford UniversityPress, 1975.
_. "Introduction: The Persistence of the Past." In China's Modern Econ-omy in Historical Perspective, pp. 1-18. Edited by Dwight H. Perkins.Stanford, Calif.: Stanford University Press, 1975.
_ . "Issues in the Estimation of China's National Product." In Quan-titative Measures of China's Economic Output. Edited by Alexander Eck-stein. Ann Arbor: University of Michigan Press, forthcoming.
_ . Market Control and Planning in Communist China. Cambridge, Mass.:Harvard University Press, 1966.
_, and others. Rural Small-Scale Industry in the People's Republic of China.Berkeley: University of California Press, 1977.
Plant Studies in the People's Republic of China. Washington, D.C.: NationalAcademy of Sciences, 1975.
Rawski, Evelyn Sakakida. Education and Popular Literacy in Ch'ing China.Ann Arbor: University of Michigan Press, 1979.
Rawski, Thomas G. "China's Industrial Performance, 1949-1973." InQuantitative Measures of China's Economic Output. Edited by AlexanderEckstein. Ann Arbor: University of Michigan Press, forthcoming.
- China's Transition to Industrialism: Producer Goods and Economic De-velopment in the Twentieth Century. Ann Arbor: University of MichiganPress, forthcoming.
_. "Chinese Industrial Production, 1952-1971. Review of Economics andStatistics, vol. 55, no. 2 (1973), pp. 169-81.
BIBLIOGRAPHY 185
"Choice of Technology and Technological Innovation in China'sEconomic Development." In The Relevance of China's Experience for theOther Developing Countries, Edited by Robert F. Dernberger. Forthcom-ing.
_ . "The Growth of Producer Industries, 1900-1971." In China's ModernEconomy in Historical Perspective, pp. 203-34. Edited by Dwight H. Perk-ins. Stanford, Calif.: Stanford University Press, 1975.
. "Regional Distribution of Industrial Production." Toronto: Univer-sity of Toronto, processed, 1971.
_. "On the Reliability of Chinese Economic Data." Journal of Develop-ment Studies, vol. 12, no. 4 (1976), pp. 438-41.
_ . "The Role of China in the World Energy Situation." Unpublished,1973.
Rawski Trip Notes. Author's notes as a member of the Rural Small-ScaleIndustries Delegation sponsored by the Committee on Scholarly Com-munication with the People's Republic of China. This group visitedChina for four weeks during June and July 1975.
Report of the Canadian Electrical Power Mission to the People's Republic of China,August 29 to September 18, 1973, Ottawa: Ministry of Industry, Tradeand Commerce, 1973.
"Report of SMMT Trade Mission to the People's Republic of China, 2-17November 1973." Unpublished report by the Society of Motor Manu-facturers and Traders Limited. London, 1974.
Reynolds, Harold. "Chinese Insect Control Integrates Old and New."Chemical and Engineering News, March 15, 1976, pp. 30-32.
Richman, Barry M. Industrial Society in Communist China. New York: Ran-dom House, 1969.
Riskin, Carl. "Small Industry and the Chinese Model of Development."China Quarterly, no. 46 (1971), pp. 245-73.
Scalapino, Robert. "Trip Notes." Berkeley: University of California, pro-cessed, 1972.
Schran, Peter. The Development of Chinese Agriculture, 1950-1959. Urbana:University of Illinois Press, 1969.
_ . "Farm Labor and Living in China." Champaign: University of Illi-nois, 1976. Processed.
_ . "Handicrafts in Communist China." China Quarterly, no. 21 (1964),pp. 151-73.
Scott, David. "China Opens Doors for Rare View of Auto Production."Automotive Engineering, vol. 82, no. 8 (1974), pp. 30-33.
186 ECONOMIC GROWTH AND EMPLOYMENT IN CHINA
"Several Points About Mechanized Irrigation in Kiangsu." Chung-kuoshui-li [Chinese Water Control], no. 1 (1957), pp. 49-52.
Seybolt, Peter J., ed. The Rustication of Urban Youth in China. White Plains,N.Y.: M. E. Sharpe, 1975.
Shue, Vivienne. "Reorganizing Rural Trade." Modern China, vol. 2, no. 1,(1976), pp. 104-34.
Sigurdson, Jon. "Rural Industrialization in China." In U.S. Congress,Joint Economic Committee, China: A Reassessment of the Economy, pp.411-35. Washington, D.C.: U.S. Government Printing Office, 1975.
"Some Problems in Speeding Up Industrial Development." Translated inIssues and Studies, vol. 13, no. 7 (1977), pp. 90-113.
Sprague, G. F. "Agriculture in China." Science, vol. 188, no. 4 (May 9,1975), pp. 549-55.
Stavis, Benedict, Making Green Revolution. Rural Development Monographno. 1. Ithaca, N.Y.: Cornell University Rural Development Program,1974.
_ . The Politics of Agricultural Mechanization in China. Ithaca, N.Y.: Cor-nell University Press, 1978.
Stepanek, James B. "Planning of Urban Small-Scale Industry in China."Paper presented at a conference sponsored by the Subcommittee onResearch on the Chinese Economy, Social Science Research Council,on "Regionalism and Economic Development in China: Historical andSouth Asian Comparative Perspectives," Philadelphia, January 20-21,1978.
"Strengthen Scientific Research on the Farm Economy." Kuang-ming jih-pao [Kuang-ming Daily], December 7, 1978.
Swamy, Subraminian. "Economic Growth in India and China, 1952-1970:A Comparative Appraisal." Economic Development and Cultural Change,vol. 21, no. 4, pt. 2, pp. 1-83.
Ta-chung jzh-pao [Mass Daily]. Chinan.
Ta-kung pao [Impartial Daily]. Hong Kong.
Tang, Anthony M. "Input-Output Relations in the Agriculture of Com-munist China, 1952-1965." In Agrarian Policies and Problems in Commu-nist and Non-Communist Countries, pp. 280-301. Edited by W. A. Doug-las Jackson. Seattle: University of Washington Press, 1971.
BIBLIOGRAPHY 187
Ten Great Years. English translation of Wei-ta ti shih-nien (Peking, 1959).Occasional paper no. 5. Bellingham: Western Washington State Col-lege Program in East Asian Studies, 1974.
Terrill, Ross. Flowers on an Iron Tree. Boston: Atlantic-Little, Brown, 1975.
Thorborg, Marina. "Chinese Employment Policy 1949-78 With SpecialEmphasis on Women in Rural Production." In U.S. Congress, JointEconomic Committee, Chinese Economy Post-Mao, pp. 535-604. Wash-ington, D.C.: U.S. Government Printing Office, 1978.
Tien, H. Yuan. China's Population Struggle. Columbus: Ohio State Univer-sity Press, 1973.
Tsu-kuo hsin-kuang ch'eng-shih [Newly Brilliant Cities of the Fatherland].Shanghai: Shang-hai jen-min ch'u-pan she, 1974.
Tsuchiya, Keizo. "Economics of Mechanization in Small-Scale Agricul-ture. " In Agriculture and Economic Growth: Japan's Experience, pp. 155-72.Edited by Kazushi Ohkawa, Bruce F. Johnston, and Hiromitsu Ka-neda. Princeton, N.J.: Princeton University Press, 1969.
Ullman, Morris B. Cities of Mainland China: 1953 and 1958. InternationalPopulation Reports, Series P-95, no. 59. Washington, D.C.: U.S. De-partment of Commerce, 1961.
U.S. Central Intelligence Agency. China: Agricultural Performance in 7975.Research Aid ER 76-10149. Washington, D.C., 1976.
_. China: Role of Small Plants in Economic Development. Research AidA(ER)74-60. Washington, D.C., 1974.
. People's Republic of China: Handbook of Economic Indicators. ResearchAid ER 76-10540. Washington, D.C., 1976.
U.S. Consulate General, Hong Kong. Extracts from Oiina Mainland Maga-zines.
-. Survey of the China Mainland Press.
U.S. Foreign Broadcast Information Service (FBIS). Daily Report, People'sRepublic of China.
U.S. Joint Publications Research Service (jRs), Washington, D.C.
U.S. National Foreign Assessment Center. China: Economic Indicators. Ref-erence Aid ER77-10508. Washington, D.C., 1977.
_ . China: Economic Indicators. Research Aid ER78-10750. Washington,D.C., 1978.
_ . China: In Pursuit of Economic Modernization. Research Paper ER78-10680. Washington, D.C., 1978.
Wang Hu-sheng. "Several Problems of Classifying Heavy and Light In-dustry." Ching-chi yen-chiu [Economic Research], no. 4 (1963), pp. 22-25.
188 ECONOMIC GROWTH AND EMPLOYMENT IN CHINA
Wang Kuang-wei. "How to Organize Agricultural Labor Power." Chi-huaching-chi [Planned Economy], no. 8 (1957). Translated in ECMM, no. 100(1958), pp. 11-15.
Wang Te-yuan. "Perceive the Conditions of Steel Supply, Dig Up LatentSources of Domestic Supply." Chi-hsieh kung-yeh [Machinery Industry],no. 9 (1957), pp. 29 and 13.
Wen-hui pao [Wen-hui News]. Hong Kong.
Whyte, Martin King. "Inequality and Stratification in China." China Quar-terly, no. 64 (1975), pp. 684-711.
Wiens, Thomas B. "Agricultural Statistics in the People's Republic ofChina." In Quantitative Measures of China's Economic Output. Edited byAlexander Eckstein. Ann Arbor: University of Michigan Press, forth-coming.
Wilkinson, Endymion P. "Studies in Chinese Price History." Ph.D. dis-sertation, Princeton University, 1971.
World Bank. Rural Enterprise and Non-farm Employment. A World Bank Sec-tor Policy Paper. Washington, D.C., 1978.
Wu Yung-hsiang. "Appraisal of the Economic Effect of Dryland CottonCultivation in Wu-kung County." Ching-chi yen-chiu [Economic Re-search], no. 10 (1963), pp. 27-36.
Yamamoto Hideo. Chuigoku nogyo gijutsu taikei no tenkai [Development ofChina's System of Agricultural Technology]. Tokyo: Ajia keizai ken-kydjo, 1965.
Yen Jui-chen. "Several Questions on Increasing the Economic Benefits ofFertilizers." Ching-chi yen-chiu [Economic Research], no. 6 (1964).Translated in ECMM, no. 429 (1964), pp. 13-25.
Yiu Ch'iu-li. "Summation Report on Agricultural Mechanization." Trans-lated in FBIS, January 31, 1978, pp. E6-25.
Yung Ta-chai ching-shen kao nung-yeh chi-hsieh-hua [Use the Ta-chai Spirit toRaise Farm Mechanization]. T'aiyuan: Shan-hsi jen-min ch'u-pan she,1974.
Index
Academy of Social Sciences, 23 Biological control agents, 101Administrative system, rural, 142-43, Brown, David M., 29n
123-32; projections for, 133-35 Bums, John P., 141nAgriculture: Chinese system of, 73-74,
141-46; collectivization and, 75-79; Capital deepening, 44, 45, 47-48crop management in, 97-102; crop- Capital intensity, 46-50, 55ping cycle in, 102-06; cropping prac- Cement manufacture, 80-82, 170-71tices in, 91-102; as defined in this Census of 1953, 20, 22study, 71; diminishing returns in, Chang Ch'un-ch'iao, 62n, 160138-39; factor productivity of, 118-22; Chao 1-wen, 174nincrease of labor use in, 106-09; in- Chao, Kang, 95ndustrial inputs to, 82-91; inter- Chekiang, 165cropping system of, 105-06; invento- Chemical fertilizers. See Fertilizersry data on, 82-83; labor absorption Ch'en Chih-ho, 37n, 161n, 169nin, 71-122; labor supply-demand bal- Chen, Nai-ruenn, 68n, 92n, 94n, 102n,ance in, 113-18; land improvement 151n, 165n, 167n, 168n, 172nfor, 109-13; land preparation for, 91- Chen, Pi-chao, 26n96; management of, 139-41; marginal Ch'eng Chin-chieh, 96n, 104n, 105nlabor productivity in, 129-30; mecha- Chi 1-chai, 108nnization of, 82-91; multiple cropping Chi Ti, 164nsystem of, 102-05; output growth of, China: economic growth in, 3-6; eco-106-09, 135-41; planting and trans- nomic statistics on, 14-16, 147-54;planting in, 96-97; productivity farming system of, 73-74; as modeltrends in, 118-22; research on, 137- for other developing countries, 141-38; water conservancy for, 109-13; 46; population of, 19-29; socioeco-and winter works campaigns, 109-13 nomic system of, 141-46
Armed forces, 169 Collectivization: of farming, 7-9, 75-79;of industry, 38, 61-64, 161-62; and ru-
Banister, Judith, 20n ral labor absorption, 75-79. See alsoBanking, 165 CommunesBarnett, A. Doak, 20n Communes: administration of, 142;Beemer, Halsey L., Jr., lOn, 33n, 91n, farming by, 76-79; fringe benefits to
97n, 98n, 103n, 105n, 112n, 116n members of, 67-68; industrial em-Bernstein, Thomas P., 13n, 127 ployment in, 161-62; labor force of,
189
190 INDEX
32; management of, 140-41; winter Economic system, and China's success,works by, 112. See also Collec- 141-46tivization Electrification, 83-85
Conscription for rural labor, 12-13, 25, Emerson, John P., 38n, 64n, 155n, 156-127, 145 58, 162n, 167n
Construction, employment in, 159-60 Employees: state-sector, 67-68; -and-Construction campaigns, rural, 109-13 workers concept, 155Consumer goods, 133 Employment: average annual growthConsumption, and investment, 67-69 in, 45; bureaucratic obstacles to, 69;Cotton: close planting of, 96; labor re- diminishing returns in, 128-31; in
quirements in cultivation of, 98-100; education, 166-67; evidence of highmechanization in cultivation of, 101; levels of, 9-14; factors in raising levelraised yields of, 99, 100 of, 8-9; female, 29, 33-34, 49; full, 13-
Cotton gin, 86-87 14, 126-28; in handicrafts, 157-63; asCrafts, 64, 157-63 indicator of economic growth, 3; in-Crook, Frederick W., 76n-78n, 84n dustrial, 41-70, 170-76; and laborCropping: fertilizer use in, 91-%; hu- force growth, 123-24; and mechaniza-
man labor inputs per crop, 97, 106; tion, 82-91; in 1957, 156-59; in 1975,intensification of cycle and, 102-06; 159-69; nonagricultural, 36-38, 124-intensification of practices and, 91- 25, 155-69; problems and goals of the102; intercropping, 105-06; manage- 1950s, 6-7; prospects for future, 132-ment of, 97-102; and mechanization, 41; regional variations in, 130-31; ru-86-87; multiple, 102-06 ral, 30-38; rural industrialization
Cultivation, man-days needed for, 115- and, 64-65; seasonal variations in, 6-16 7, 75, 103-04, 110-12, 118, 131; by sec-
Cultural Revolution, 17-18, 150, 168 tor, 155-69; in small-scale industry,170-76; summary of, 123-32; urban,
Data reliability, 14-16, 147-54 10, 29-30, 133; and voluntary idle-Demand-supply for labor, 74-75, 113- ness, 131; of women, 29-30, 33-34,
18, 132-41 49. See also Agricultural employment;Dernberger, Robert F., 57n, 136n Industrial employment; Labor force;Developing countries, transfer of Nonagricultural employment;
China's experience to, 141-46 UnemploymentDiminishing returns, 128-31, 138-39 Enterprises inherited from RepublicanDonnithorne, Audrey, 76n era, 55-60
Eckstein, Alexander, 3n, 16n, 69n Factor productivity in agrnculture, 118-Economic growth: and absorption of la- 22
bor in agriculture, 71-122; and agri- Falcon, Walter P., 136ncultural output, 106-09, 135-41; and Farm equipment: inventory data on,capital deepening, 44-48; and capital 82-83; production of, 173-75. See alsointensity, 46-50, 55; in China since Mechanization1949, 3-6; and China's socioeconomic Farming: Chinese system of, 73-74,system, 14146; indicators of, 3-5; 14146; collectivization and, 75-79;and industrial employment, 41-70; crop management and, 97-102; byand industrial inputs into agricul- families, 75-76; industrial suppliesture, 82-91; and labor force growth, for, 9; intensive, 73-74; mechaniza-123-24; political initiatives on, 16-18; tion of, 82-91; regions, 73-74; rota-prospects for future, 132-41; and self- tion cycles in, 103-04. See also Agri-reliance policy, 46-47; of Soviet-as- culturesisted plants, 53-55 Fasenfest, David, 136n
Economic planning: and employment, Female employment, 29, 33-34, 4968; and First Five-Year Plan, 54-55 Fengshou Tractor Plant, 174
Economic policy of self-reliance, 46 Fertilizers: chemical, 80-82, 101, 171-Economic statistics, reliability of, 14- 72; employment in manufacture of,
16, 147-54 171-72; equipment produced by old-
INDEX 191
er firms, 58-59; growth in use of, 136; of, 42-45; in rural areas, 64-65; ininvestment in Soviet-assisted plants small-scale industries, 60-67, 170-76;for, 54; man-days involved in use of, in Soviet-assisted projects, 51-55;115-16; organic, 91-96; sources of, technology and, 50-67; in three types91-92; supply of, 92; use in land prep- of units, 50-67. See also Non-aration, 91-96. See also Manure agricultural employment
FFYP. See First Five-Year Plan Industrial inputs to agriculture, 9, 80-91Field, Robert Michael, 53n, 64n, 162n Industry: capital intensity and, 48; col-Firms, three types of, 50-67 lective, 61-64, 161-62; estimated 1957First Five-Year Plan, 6, 51-55 and 1975 employment in, 160-64; la-Fishing, 168-69 bor productivity in, 44-45; mechani-"Five small industries," 62-64, 170-76 zation of, 54-55; from RepublicanForestry, 169 era, 55-60; small-scale, 60-67; Soviet-Freight transport, 159, 160 assisted, 51-55; state-owned, 62, 161;Future growth, projections on, 132-35 three types of units in, 50-67
Intensification of cropping, 91-106; in
"Gang of Four," 160 cotton, 98-100; crop managementGeertz, Clifford, 73 and, 97-102; in cropping cycle, 102-Gottschang, Thomas, 94n 06; explanation of, 91; by inter-Government administration, 142-43, cropping, 105-06; and land prepara-
167-68 tion, 91-96; by multiple cropping,Grain: output, 106-09; processing of 102-05; and planting, 96-97; and
Gross volume of agricultural output, Inventory data on farm equipment, 80-108-09 83
Investment policy: and consumption,67-69; and economic self-reliance,
Hart, Robert, 168 46-47; of First Five-Year Plan, 51-55;Hayami, Yujiro, 83n and rural industry, 61Health care, 166 Irrigation: mechanization of, 84-86, 90;Hou, Chi-ming, 156-58 and winter works campaigns, 110-13.Howe, Christopher, 3n, 29n, 54n, 78n, See also Water conservancy
128n Iron production, 173Hsiang Lin, 54n Ishikawa, Shigeru, 119nHsiao Han, 50nHsin-hui Farm Machinery Works, 60 Jackson, W. A. Douglas, 121nHu Ch'iao-mu, 23, 164n Johnson, Virgil A., 10n, 33n, 91n, 97n,Huang Ching, lln 98n, 103n, 105nHydroelectric plants, 175-76
K'ai-lan mine, 172I Ts'ai, 93, 96n, 101n Keesing, Donald B., 144Idleness: seasonal, 6-7, 74-75, 110-12, King, F. H., 73n
118, 131; voluntary, 131 Kohrt, Gunter, 159Import substitution, 46, 54 Kraus, Richard A., 148nIndia, economic strategy for, 145 Kung-chia Yeh, 87n, 148n, 157n, 158nIndustrial employment, 41-70, 155-76; Kuo, Leslie T. C., 7n, 89n, 100n, 103n
and capital intensity, 46-50; con-clusions on, 69-70; derivation of esti- Labor: absorption in agriculture, 71-mates on, 155-69; economic objec- 122; effect of mechanization on, 11-tives and, 45-50; in enterprises from 12; input in manure preparation, 92-Republican era, 55-60; institutional 96; prospects for future use of, 132-determinants of, 67-69; labor de- 41; requirements of crops, 97-102;mand and, 124-25; 1957-75 patterns seasonal shortages of, 10, 74-75, 103-
192 INDEX
04; supply-demand for, 74, 113-18, Mechanization of industry, 54-55132-41; underutilization of, 31 Mellor, John W., 145, 146n
Labor force: agricultural, 38-40, 71, Meng Chih-chien, 55n113-18; average work year for, 14; Methodological problems of this study,definition of, 31; female participation 14-18; and influence of politicalin, 33-34; growth of, 36, 123-24; events, 16-18; and reliability of eco-prime, 14; projections for, 132-35; ru- nomic statistics, 14-16ral, 30-34; seasonal idleness of, 74- Middleton, Drew, 169n75, 110-12, 118, 131; seasonal short- Migration: of peasants to cities, 6-7; re-ages in, 10, 74-75, 103-04; secondary, strictions on, 126-27; seasonal, 126-14; sectoral distribution of, 19-40; 27; of urban youths to countryside,size of, 19-40; total, 34-36; under- 12-13, 25, 127, 145utilization of, 31; urban, 29-30, 124- Military personnel, 16925. See also Employment Mining, 50, 172-73
in industry, 44-45, 170-76; marginal, Multiple cropping, 102-05129-30, 135; in small-scale industries, Municipalities, population of, 25-26170-76 Munro, Ross H., 130n
Land preparation, 87, 91-96 Myers, Ramon H., 137n, 138n, 148nLand-improvement projects, 109-13Lardy, Nicholas R., 64n, 128n, 136, 162n Nelson, Gerald C., 136nLi Hsien-nien, 20 Nickum, James E., 110n, 112, 113nLi, Choh-ming, 149n Nonagricultural employment, 155-69;Liaoning province, 162-63 estimates for 1957, 156-59; estimatesLiteracy, 148 for 1975, 159-69; in industry, 41-70;Liu Chih-cheng, 138n and labor demand, 124-25; projec-Liu Shao-ch'i, 18 tions for future, 132-34; rural, 36-38;Liu, Ta-chung, 87n, 148n, 154n, 156-58 by sector, 155-69; in small-scale pro-Loyang Bearing Works, 55 ducer industries, 170-76. See also In-
dustrial employmentMachinery plants, 173-75Ma-lu Commune, 89 Oksenberg, Michel, 150Management: agricultural, 139-41; Chi- Orleans, Leo A., 19n, 22, 23, 25n, 150n
nese system of, 141-46; of crops, 97_ Ossala, Renaldo, 22102 Output: agricultural, 106-09, 119-22,
Man-days: in crop management, 97, 128-29, 135-41; data on, 152; invest-106; for cultivating and fertilizing a ment and growth of, 45-50; per man-hectare, 115-16; in manure prepara- day, 128-29. See also Productivitytion, 93, 94; and value of agriculturaloutput, 128-29 Pai Ou, 54n, 55n
135 Peasant migration to cities, 6-7Mechanization of agriculture, 80-91; in People's Communes, 76
crop processing, 86-87; effects of, 10- Perkins, Dwight H., 3n, 12n, 41n-43n,11, 47-48, 89, 90; in grain processing, 57n, 60n, 65n, 74n, 82n, 86n-89n,83-84; inventory data on, 80-83; irri- 91n, 105n, 108-09, llOn-lln, 124,gation and, 84-86; and labor require- 136n, 137n, 144n, 148n, 151, 153n,ments, 74, 88-90; in multiple crop- 170n-73n, 176nping, 104-05; popularity of, 12; and Personal services, 166power tilling, 87; in spinning, 84; in Petroleum equipment, 58threshing, 86; in transplanting, 89 Plant protection, 101
INDEX 193
Plant variety development, 103 ployment pattems and, 64-65; "fivePlanting practices, 96-97 small industries," 62-64; investmentPlants, industrial: employment in, 170- in, 61; labor intensity in, 43; size of,
76; inherited from Republican era, 61-63; small-scale, 60-67; state-55-60; for producer goods, 170-76; owned sector of, 62; uneven distribu-small-scale, 60-67, 170-76; Soviet-as- tion of, 61. See also Small-scale indus-sisted, 51-55; three types of, 50-67 try
Plowing, mechanized, 87 Rural labor absorption, 71-122; andPolitics, and economic developments, Chinese farming system, 73-74; and
16-18 collectivization, 75-79; and crop man-Population, 19-28; age distribution in, agement, 97-102; and factor produc-
22-23; conflicting statistics on, 19-24; tivity, 118-22; and growth of agricul-and grain supply, 23, 24; urban, 24- tural output, 106-09; and increased28 use of labor, 106-09; and industrial
Power consumption, 80-82 inputs to farming, 80-91; and in-Power plants, 175-76 tensification of cropping cycles, 102-Power tillers, 87 06; and intensification of croppingPrice changes, 153 practices, 91-102; in intercropping,Private plots, 78 105-06; in land management, 109-13;Producer-goods industries, 170-76 in land preparation, 91-96; andProduct flows, in agriculture, 82 mechanization, 80-91; in multipleProduction brigades, 76-77 cropping, 102-05; in planting, 96-97;Production teams, 76-79, 140-41 and supply-demand balance, 113-18;Productivity: agricultural, 118-22; in in transplanting, 97; in winter con-
five small-scale industries, 170-76; of struction campaigns, 109-13industrial labor, 42-44, 162-63; and Rural Small-Scale Industry Delegation,marginal labor, 129-30, 135. See also 32, 44, 65, 83Output Rustication program, 12-13, 25, 127, 145
Prospects for labor market, 132-41; and Ruttan, Vernon W., 83ngrowth of agricultural output, 135-41;and labor force projections, 132-35 Sales, retail, 164-65
Salt production, 168Rawski, Evelyn S., 148 Savings deposits, 165Rawski, Thomas G., 41n, 44n, 57n, 59n, School enrollments, 166-67
sector of, 61-64; employment in pro- Unemployment: during the 1950s, 6-7;ducer-goods sector of, 170-76; em- involuntary, 126-27; open, 34-36;ployment patterns in, 64-65; invest- seasonal idleness and, 74-75, 110-12,ment in, 61; as labor intensive, 44; 118, 131; summary of, 123-32; urban,primitive plants of, 65-66; size of, 61- 6-8, 29-30, 34-35, 127; voluntary, 131.63; state-owned sector of, 62. See also See also EmploymentRural industry Urban areas, defined, 25
Small-Scale Industry Delegation. See Urban employment, 10, 29-31, 124, 133Rural Small-Scale Industry Delega- Urban population, 24-29tion Urban unemployment, 6-8, 29-30, 34-
Social control, 143 35, 127Socioeconomic system, 141-46 Urban youth migration, 12-13, 25, 127,Soviet-assisted industry, 51-55 145Spinning, mechanized, 84Sprague, G. F., 97n Vertical integration, 69, 153State farms, 169 Voluntary idleness, 131State-owned industry, 62, 161State revenue and expenditure, 167-68 Wages, of agricultural and industrialState-sector employees, 67-68 workers, 67Statistics, Chinese, 147-54; capacity of, Wang Hu-sheng, 46n
147-51; international comparability Wang Jen-chung, 78of, 152-54; veracity of, 14-16, 151-52 Wang Kuang-wei, 36n
Stavis, Benedict, lln, 103n, 130 Wang P'i-chang, 93, 96n, lOlnSteel production, 173 Wang Te-yuan, 55nSupply-demand for labor, 74, 113-18, Water conservancy: and agricultural
132-41 growth, 136-37; employment in, 169;Swamy, Subraminian, 168 irrigation and, 84-86, 90; winterSzechwan, population of, 20 works campaigns for, 109-13
Weaving, 84Ta-lung Machinery Works, 57-58 Wheat: crop management of, 97-98;Tang. Anthony M., 94n, 121-22 threshing of, 86Teachers, 166-67 Wheat Studies Delegation. See Ameri-Technology: decomposition of, 48-49; can Wheat Studies Delegation
and employment in three types of in- Whyte, Martin King, 67n, 78n, 127n,dustrial units, 50-67; mastery and 128n, 141spread of, 6 Wiens, Thomas B., 91-92, lOOn, 109n
Teng Hsiao-p'ing, 16, 18, 22, 50 Wilkinson, Endymion P., 148nTeng Ying-ch'ao, 37n Winter works campaigns, 109-13Third National Conference on Agricul- Women, employment of, 29, 33-34, 49
tural Mechanization, 12 Work year, 14Thorborg, Marina, 34n Workers: -and-employees concept, 155;Threshing, mechanized, 86 part-time, 31, 157-58; pay differentialTien Chieh-yun, 84n, 96n between agricultural and industrial,Tien, H. Yuan, 20n 67; welfare of, 68Tilling, 87 Work-point system, 77Towns, population of, 25-26 Wuhan Heavy Machinery Plant, 54Trade, 164-65Transplanting, 89, 96-97 Yeh, Kung-chia, 156-58Transport: employment in, 159, 160; Yen Jui-chen, 95n, 139n
THE PRESENT DECADE has seen much soul-searching about employment policiesin developing countries. Several aspects have been the subjects of intensivedebate: appropriate technology, small-scale enterprise, rural industries, farmmechanization, and the employment and distributive aspects of small-scalefarming and agrarian reform. In some instances the debate is of long standing,but it continues with as much intensity as before. Whatever the benefits ofindustrial exports for growth and employment may be in general, in the morepopulous developing countries the main market for industry is the domesticone, and it is iikely to remain so for some time. Since, in addition, the laborforce is preponderantly rural, agricultural development strategy has a criticalbearing on the pattern, location, and pace of industrial development.
In writings on these matters, it is common to find some reference to China'sexperience. But despite the rapid growth of the literature, few studies haveattempted to map out China's policies on employment and, in particular, tomake a quantitative assessment of what most observers agree to have been con-siderable achievements during the past two decades. The World Bank askedthat such a study be undertaken; this book was commissioned to help the Bankin its understanding of urban and rural development, rural enterprise and non-farm employment, and the development of small enterprise.
China's emphasis on labor-intensive methods of raising agricultural output,supported by its rural industries program, and tbe resulting effects on the re-gional dispersion of industry provide valuable insight, both for countries thathave not opted for this as one of the elements of an employment and growthpolicy and for others that have or are in the throes of doing so. As the authorconcludes, even if China's political, social, and economic system is radicallydifferent, there are many examples of how knowledge of its experience can en-rich the understanding of those concerned with employment policy elsewhere.
Thomas G. Rawski is associate professor of economics at the University of To-ronto and a consultant to the World Bank.


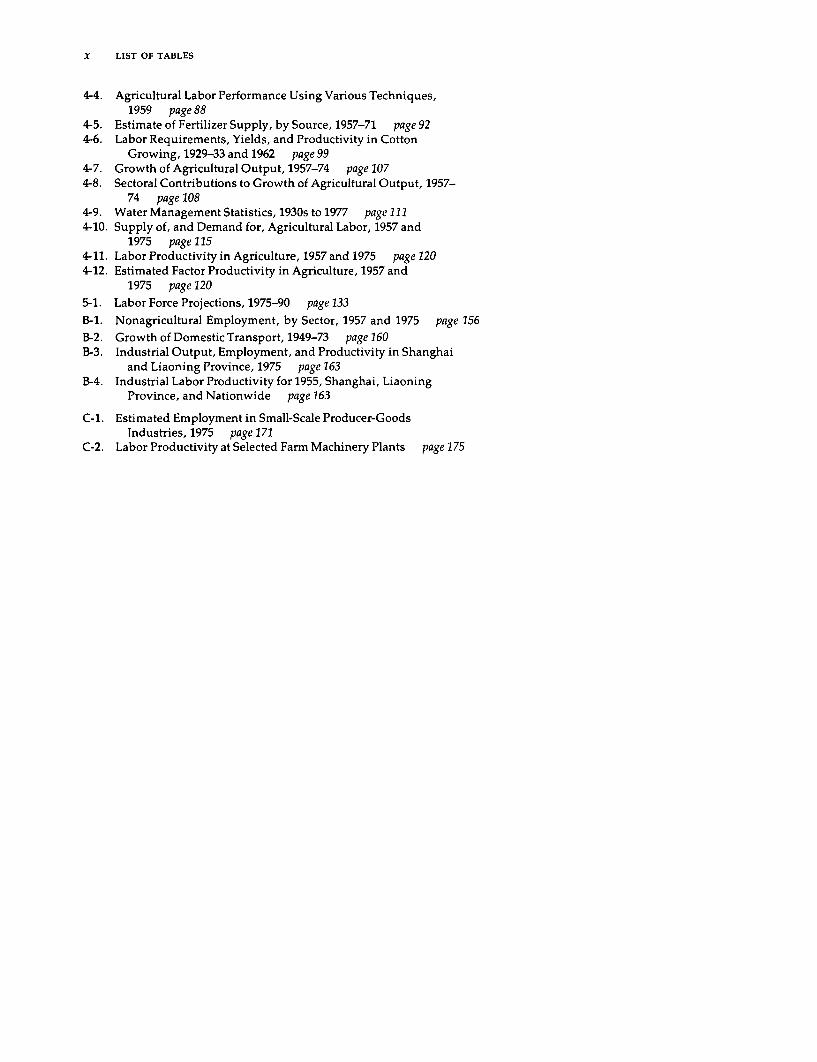


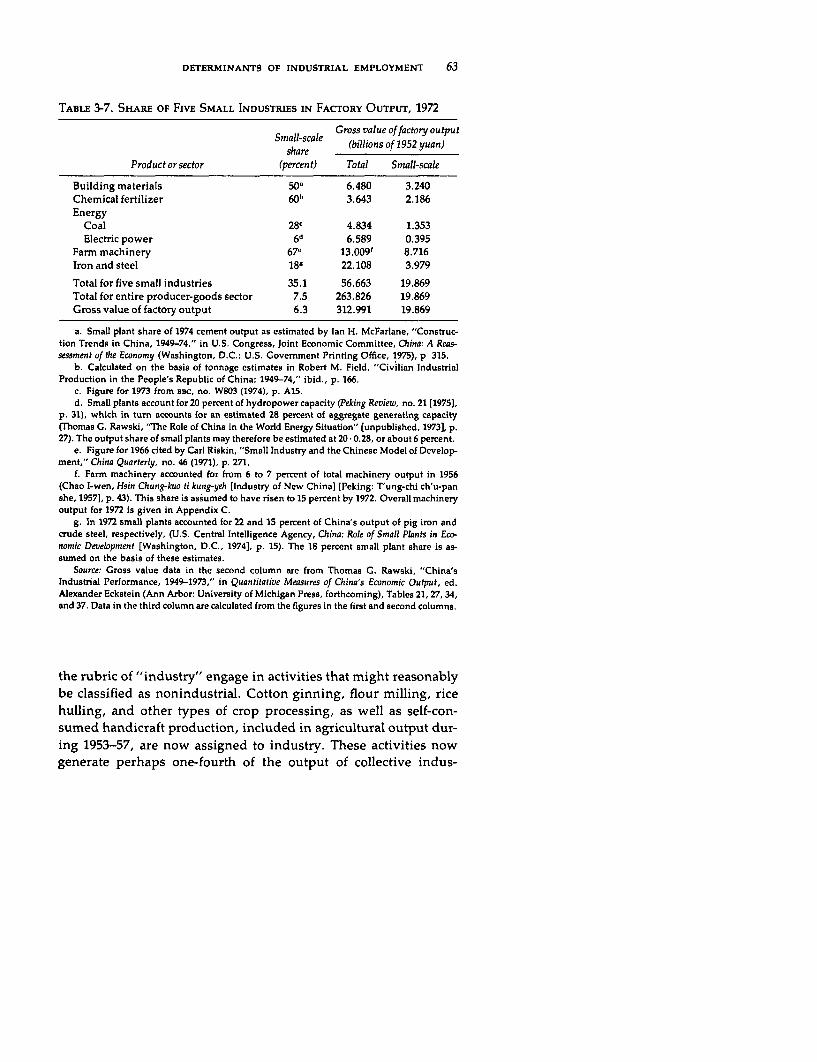


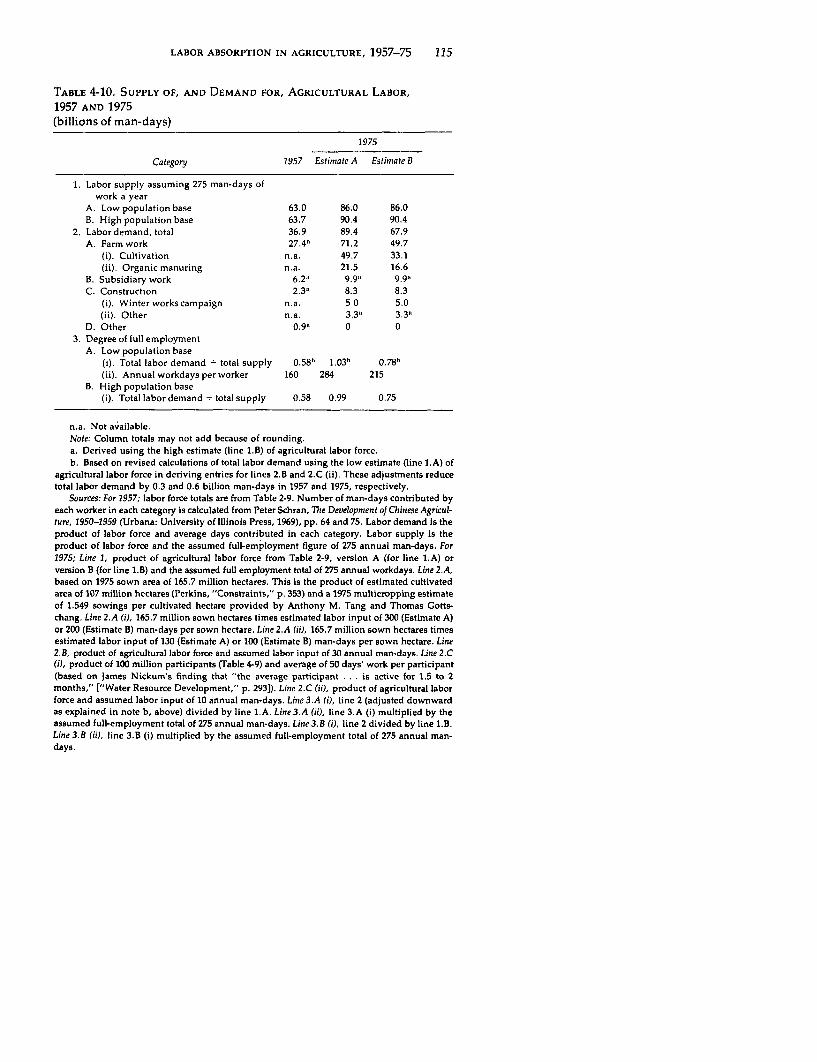


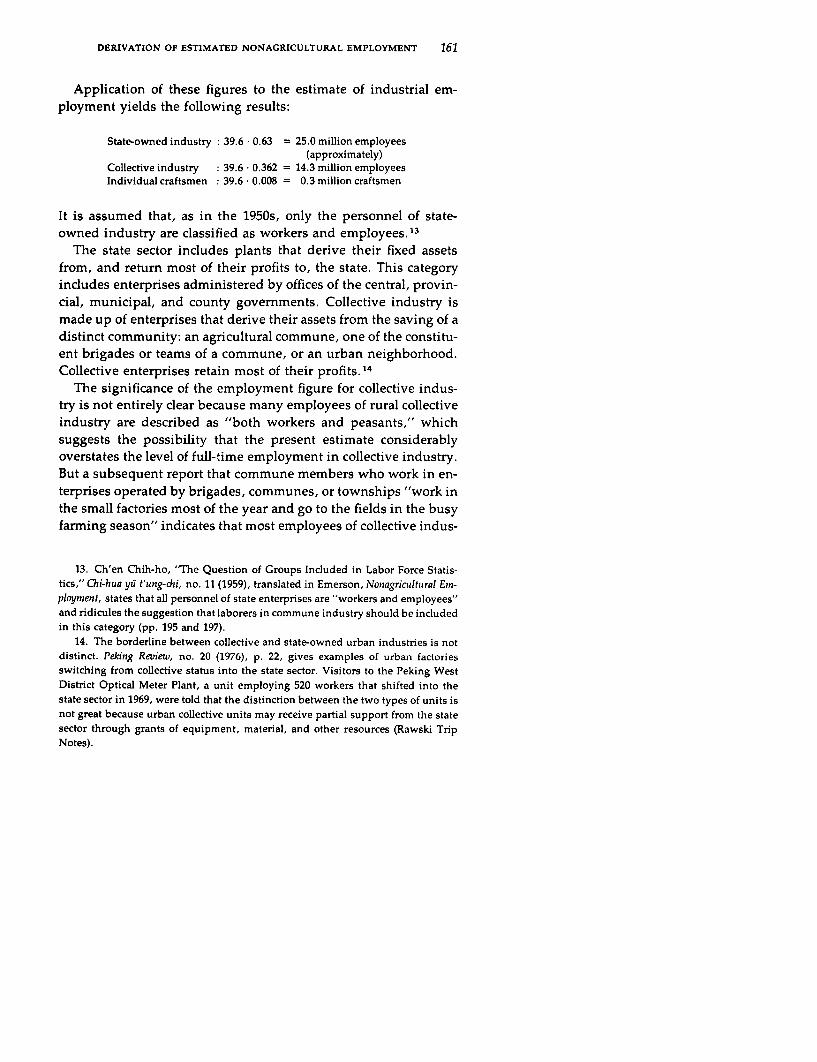


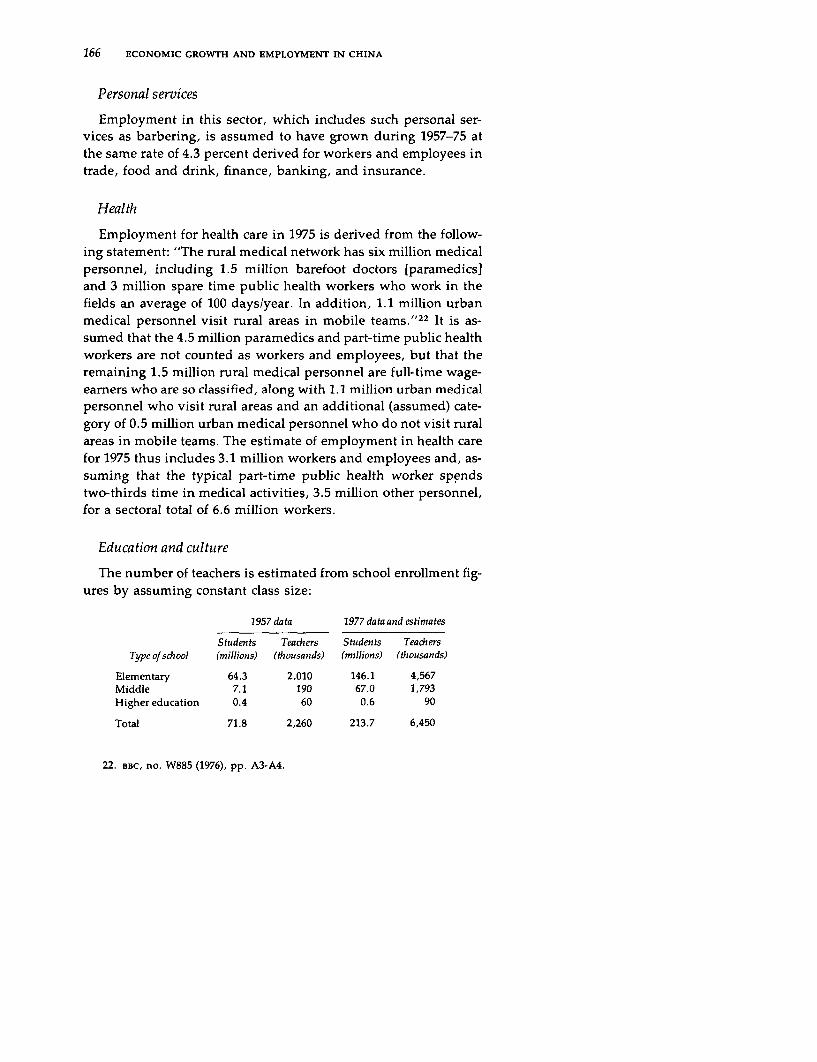


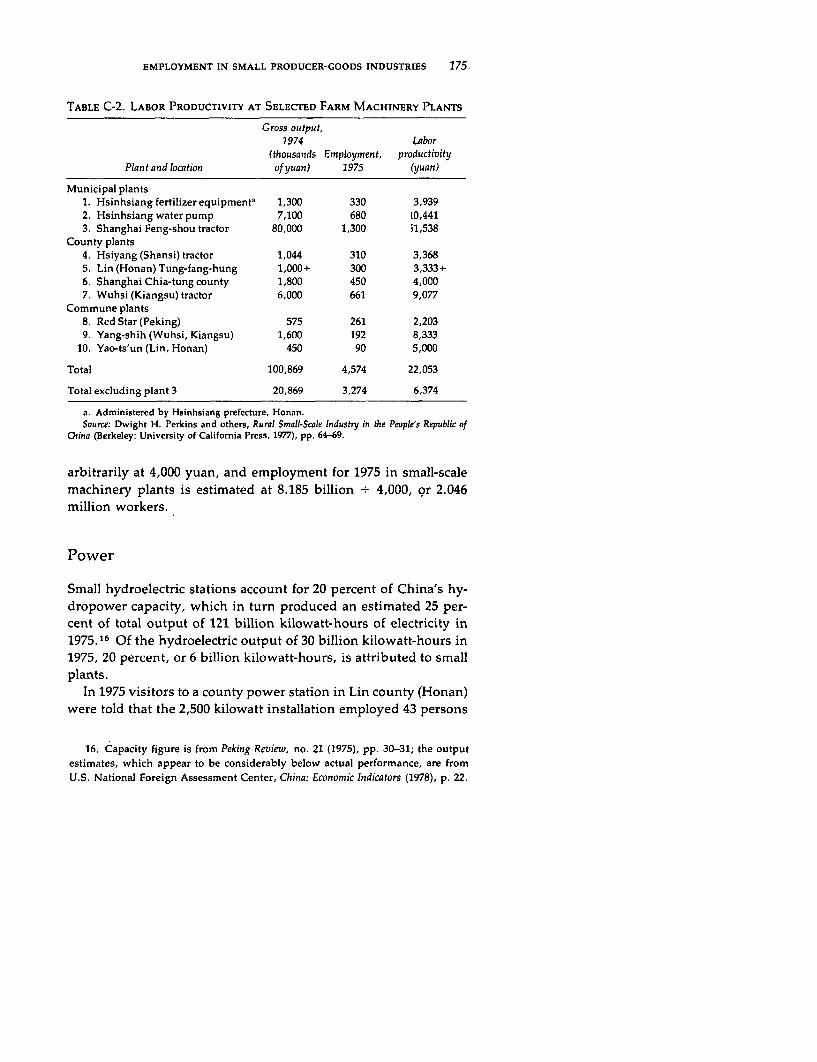


![New Zealand By Ploy [55030091]](https://static.documents.pub/doc/80x56/54056c9a8d7f729e768b4c47/new-zealand-by-ploy-55030091.jpg)


