Ilities Tradespace and Affordability Analysis Barry Boehm, USC GSAW/INCOSE‐LA/SPIN talk Feb 26, 2014 02‐26‐2014 1 Copyright 2014 by USC‐CSSE. Published by The Aerospace Corporation with Permission
Transcript
Ilities Tradespace and Affordability Analysis
Barry Boehm, USC
GSAW/INCOSE‐LA/SPIN talk Feb 26, 2014
02‐26‐2014 1Copyright 2014 by USC‐CSSE. Published by The Aerospace Corporation with Permission
Outline
• Context: DoD‐Stevens‐USC SERC Ilities Tradespaceand Affordability Analysis Program (iTAP)
• Ilities Tradespace and Affordability Analysis
• Affordability and Cost Analysis
• Cost‐Schedule Tradespace Analysis
02‐26‐2014 2
Context: SERC iTAP Initiative Elements
• Tradespace and affordability analysis foundations– More precise ility definitions and relationships– Stakeholder value‐based, means‐ends relationships– Ility strategy effects, synergies, conflicts– U. Virginia, MIT, USC
• Next‐generation system cost‐schedule estimation models– Initially for full‐coverage space systems (COSATMO)– Extendable to other domains– USC, AFIT, GaTech, NPS
• Applied iTAP methods, processes, and tools (MPTs)– For concurrent cyber‐physical‐human systems– Experimental MPT piloting, evolution, improvement– Wayne State, AFIT, GaTech, NPS, Penn State, USC
02‐26‐2014 3
GaTech – FACT Tradespace ToolBeing used by Marine Corps
4
Configure vehicles from the “bottom up”Quickly assess impacts on performance
02‐26‐2014 4
MIT: ilities in Tradespace ExplorationBased on SEAri research
*Angular moments of the CG about axes of rotation** By crew station and compartment02‐26‐2014 6
Outline
• Context: DoD‐Stevens‐USC SERC Ilities Tradespaceand Affordability Analysis Program (iTAP)
• Ilities Tradespace and Affordability Analysis
• Affordability and Cost Analysis
• Cost‐Schedule Tradespace Analysis
02‐26‐2014 7
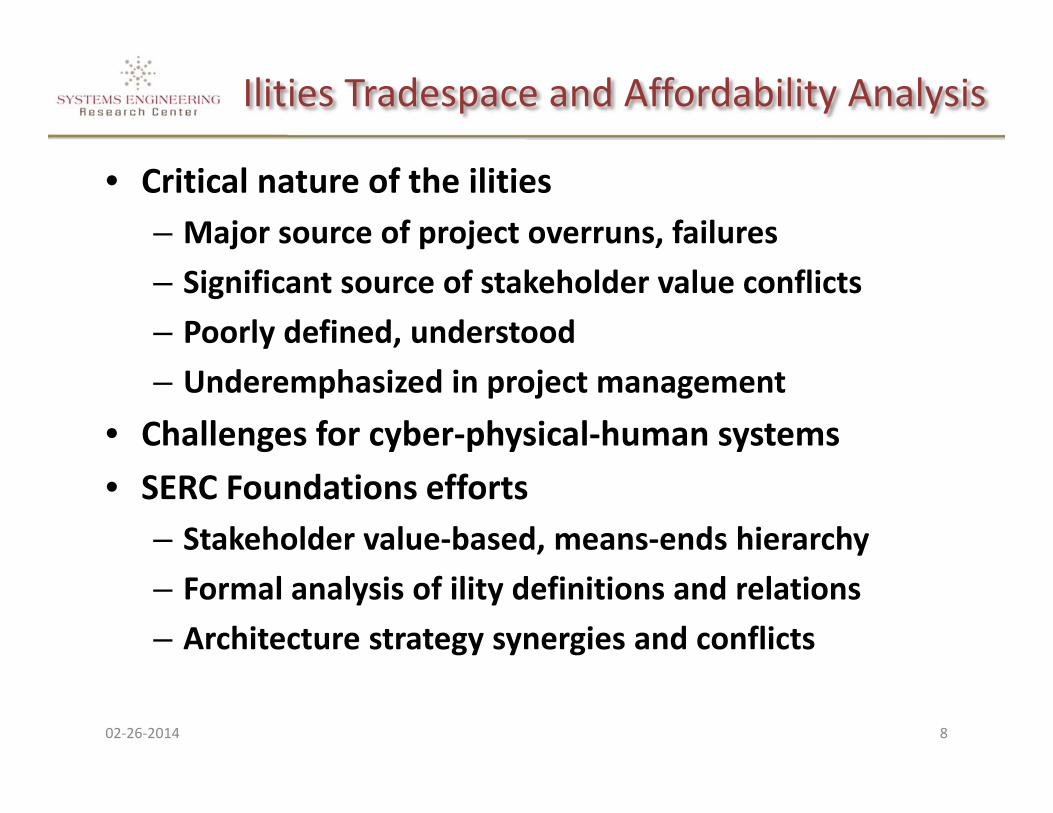
Ilities Tradespace and Affordability Analysis
• Critical nature of the ilities– Major source of project overruns, failures– Significant source of stakeholder value conflicts– Poorly defined, understood– Underemphasized in project management
• Challenges for cyber‐physical‐human systems• SERC Foundations efforts
– Stakeholder value‐based, means‐ends hierarchy– Formal analysis of ility definitions and relations– Architecture strategy synergies and conflicts
02‐26‐2014 8
Importance of ility TradeoffsMajor source of DoD system overruns
• System ilities have systemwide impact– System elements generally just have local impact
• ilities often exhibit asymptotic behavior– Watch out for the knee of the curve
• Best architecture is a discontinuous function of ility level– “Build it quickly, tune or fix it later” highly risky– Large system example below
902‐26‐2014
Role-Based Ilities Value DiversityBank of America Master Net
1002‐26‐2014
Example of Current Practice
• “The system shall have a Mean Time Between Failures of 10,000 hours”
• What is a “failure?”– 10,000 hours on liveness– But several dropped or garbled messages per hour?
• What is the operational context?– Base operations? Field operations? Conflict operations?
• Most management practices focused on functions– Requirements, design reviews; traceability matrices; work
breakdown structures; data item descriptions; earned value management
• What are the effects on other –ilities?– Cost, schedule, performance, maintainability?
02‐26‐2014 11
02‐26‐2014
USC: COCOMO II-Based Tradeoff AnalysisBetter, Cheaper, Faster: Pick Any Two?
0123456789
0 10 20 30 40 50
Cos
t ($M
)
Development Time (Months)
(VL, 1)
(L, 10)
(N, 300)
(H, 10K)
(VH, 300K)
-- Cost/Schedule/RELY:
“pick any two” points
(RELY, MTBF (hours))
•For 100-KSLOC set of features•Can “pick all three” with 77-KSLOC set of features
12
Ilities Tradespace and Affordability Analysis
• Critical nature of the ilities– Major source of project overruns, failures– Significant source of stakeholder value conflicts– Poorly defined, understood– Underemphasized in project management
• Challenges for cyber‐physical‐human systems• SERC Foundations efforts
– Stakeholder value‐based, means‐ends hierarchy– Formal analysis of ility definitions and relations– Architecture strategy synergies and conflicts
02‐26‐2014 13
Importance of Cyber‐Physical Systems Major gap in tradespace analysis capabilities
• Current ERS, DARPA tradespace research focused on physical system tradeoffs– Range, payload, size, weight, lethality, power and fuel
consumption, communications bandwidth, etc.– Some focus on physical modularity, composability
• Current cyber tradespace research focused on software, computing, human factors tradeoffs– security, safety, interoperability, usability, flexibility,
adaptability, dependability, response time, throughput, etc.
• Gaps in capabilities for co‐design of hardware, software, and human factors; integration of tradespace analyses
02‐26‐2014 14
Prioritized JCIDS ilitiesUser View by Combatant Commands: Top priority first
• Net‐Centric: Information Transport– Accessible Capacity Accurate Timely Throughput Expeditionary Latency
02‐26‐2014 15
Ilities Tradespace and Affordability Analysis
• Critical nature of the ilities– Major source of project overruns, failures– Significant source of stakeholder value conflicts– Poorly defined, understood– Underemphasized in project management
• Challenges for cyber‐physical‐human systems• SERC Foundations efforts
– Stakeholder value‐based, means‐ends hierarchy– Formal analysis of ility definitions and relations– Architecture strategy synergies and conflicts
02‐26‐2014 16
SERC Value‐Based ilities HierarchyBased on ISO/IEC 9126, 25030; JCIDS; previous SERC research
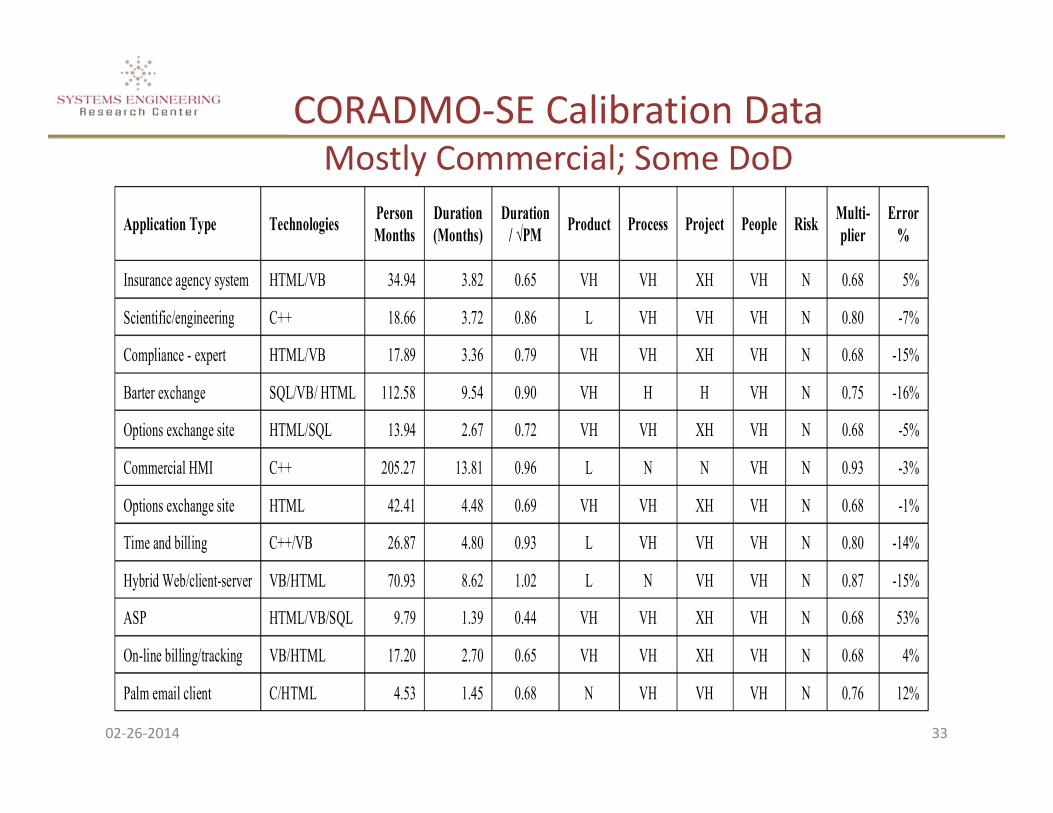
Palm email client C/HTML 4.53 1.45 0.68 N VH VH VH N 0.76 12%
CORADMO‐SE Calibration DataMostly Commercial; Some DoD
02‐26‐2014 33
Accelerators/Ratings VL L N H VH XH Product Factors 1.09 1.05 1.0 0.96 0.92 0.87 Simplicity X Element Reuse X Low-Priority Deferrals X Models vs Documents X
Multi-domain MMPTs X People Factors 1.13 1.06 1.0 0.94 0.89 0.84
General SE KSAs (Knowledge, Skills, Agility)
X
Single-Domain KSAs X Multi-Domain KSAs X Team Compatibility X Risk Acceptance Factor 1.13 1.06 1.0 0.94 0.89 0.84 X
Schedule Acceleration Case Study: From Plan‐Driven to Agile
02‐26‐2014 34
Accelerators/Ratings VL L N H VH XH Product Factors 1.09 1.05 1.0 0.96 0.92 0.87 Simplicity X Element Reuse X Low-Priority Deferrals X Models vs Documents X
Multi-domain MMPTs X People Factors 1.13 1.06 1.0 0.94 0.89 0.84
General SE KSAs (Knowledge, Skills, Agility)
X
Single-Domain KSAs X Multi-Domain KSAs X Team Compatibility X Risk Acceptance Factor 1.13 1.06 1.0 0.94 0.89 0.84 X
02‐26‐2014 35
Case Study: From Plan‐Driven to AgileInitial Project: Focus on Concurrent SE
Expected schedule reduction of 1.09/0.96 = 0.88 (green arrow)Actual schedule delay of 15% due to side effects (red arrows)Model prediction: 0.88*1.09*1.04*1.06*1.06 = 1.13
Accelerators/Ratings VL L N H VH XH Product Factors 1.09 1.05 1.0 0.96 0.92 0.87 Simplicity X Element Reuse X Low-Priority Deferrals X Models vs Documents X