99
Illinois Air Quality Report 2019 State of Illinois Illinois Environmental Protec�on Agency

Illinois Air Quality Report
2019
State of IllinoisIllinois Environmental Protec�on Agency
ILLINOIS ANNUAL
AIR QUALITY REPORT
2019
Illinois Environmental Protection Agency
Bureau of Air
1021 North Grand Avenue, East
P.O. Box 19276
Springfield, IL 62794-9276
Printed on recycled paper

2
For additional information on air pollution, please see the Illinois EPA website,
http://www.epa.illinois.gov/, or write to:
Illinois Environmental Protection Agency
Bureau of Air
1021 N. Grand Ave., East
PO Box 19276
Springfield, IL 62794-9276
Acknowledgements
This document is produced by the Illinois Environmental Protection Agency; John Kim, Director.
Illinois EPA Bureau of Air personnel contributed their time and expertise to the development of this
publication.

3
4
Illinois Annual Air Quality Report 2019
Contents
Tables .............................................................................................................................................. 5 Figures ............................................................................................................................................. 6 Executive Summary ........................................................................................................................ 8 Section 1: Air Pollutants: Sources, Health & Welfare Effects .................................................... 10 Section 2: Statewide Summary of Air Quality ............................................................................. 16 Section 3: Air Quality Index ........................................................................................................ 21 Section 4: Statewide Summary of Point Source Emissions ......................................................... 28
Appendices
Appendix A: Air Sampling Network ..................................................................................... 34-46 Sampling Schedule ................................................................................................ 35 Distribution of Air Monitoring Equipment ........................................................... 38 Statewide Air Monitoring Locations ..................................................................... 39
Appendix B: Air Quality Data Summary Tables ................................................................... 47-87 Air Quality Data Interpretation ............................................................................. 47 Ozone Data ........................................................................................................... 49
Particulate Matter (PM2.5) Data ............................................................................ 56 Particulate Matter (PM10) Data ............................................................................ 64 Carbon Monoxide Data ........................................................................................ 68 Sulfur Dioxide Data ............................................................................................. 72 Nitrogen Dioxide Data ......................................................................................... 76 Lead Data ............................................................................................................. 81 Filter Analysis Data ............................................................................................... 84 Toxic Compounds Data ......................................................................................... 87 Appendix C: Point Source Emission Inventory Summary Tables .............................................. 88 Appendix D: Website Links ........................................................................................................ 98

5
Tables
Table 1: Summary of National and Illinois Ambient Air Quality Standards .............................. 15 Table 2: Illinois Air Pollution Episode Levels ............................................................................ 15 Table 3: Air Quality Index Categories ........................................................................................ 22 Table 4: Air Quality Index Health Concerns .............................................................................. 22 Table 5: Air Quality Index Sectors in Illinois ............................................................................. 23 Table 6: Distribution of Volatile Organic Material Emissions ................................................... 29 Table 7: Distribution of Particulate Matter Emissions ................................................................ 30 Table 8: Distribution of Carbon Monoxide Emissions ............................................................... 31 Table 9: Distribution of Sulfur Dioxide Emissions ..................................................................... 32 Table 10: Distribution of Nitrogen Oxide Emissions .................................................................. 33 Table A1: Non-Continuous Sampling Schedule .......................................................................... 35 Table A2: Distribution of Air Monitoring Equipment ................................................................. 38 Table A3: Site Directory .............................................................................................................. 40 Table A4: Monitoring Directory .................................................................................................. 43 Table B1: 1-Hour Ozone Exceedances ........................................................................................ 50 Table B2: 8-Hour Ozone Exceedances ........................................................................................ 51 Table B3: Ozone Highs ................................................................................................................ 52 Table B4: Ozone Design Values .................................................................................................. 54 Table B5: PM2.5 24-Hour Exceedances ........................................................................................ 57 Table B6: PM2.5 Highs ................................................................................................................. 58 Table B7: PM2.5 24-Hour Design Values ..................................................................................... 60 Table B8: PM2.5 Annual Design Values ....................................................................................... 62 Table B9: PM10 24-Hour Exceedances ......................................................................................... 65 Table B10: PM10 24-Hour Highs and Design Values .................................................................. 66 Table B11: PM10 Annual Design Values ..................................................................................... 67 Table B12: Carbon Monoxide Exceedances ................................................................................ 69 Table B13: Carbon Monoxide Highs ........................................................................................... 70 Table B14: Carbon Monoxide 1-Hour and 8-Hour Design Values.............................................. 71 Table B15: Sulfur Dioxide Exceedances ..................................................................................... 73 Table B16: Sulfur Dioxide Highs ................................................................................................. 74 Table B17: Sulfur Dioxide 1-Hour Design Values ...................................................................... 75 Table B18: Nitrogen Dioxide 1-Hour Exceedances ..................................................................... 77 Table B19: Nitrogen Dioxide Highs ............................................................................................ 78 Table B20: Nitrogen Dioxide 1-Hour Design Values .................................................................. 79 Table B21: Nitrogen Dioxide Annual Design Values .................................................................. 80 Table B22: Lead Highs ................................................................................................................ 82 Table B23: Lead Design Values ................................................................................................... 83 Table B24: Filter Analysis Data ................................................................................................... 84 Table B25: Toxic Compounds ..................................................................................................... 87 Table C1: Carbon Monoxide Point Source Emission Distribution .............................................. 88 Table C2: Nitrogen Oxides Point Source Emission Distribution ................................................. 89 Table C3: PM10 Point Source Emission Distribution ................................................................... 90 Table C4: Sulfur Dioxide Point Source Emission Distribution ................................................... 91 Table C5: Volatile Organic Material Point Source Emission Distribution .................................. 92 Table C6: Estimated County Stationary Point Source Emissions ................................................ 94 Table C7: Annual Estimated Emissions Trends ........................................................................... 96 Table C8: Annual Source Reported Emissions Trends ................................................................ 97

6
Figures
Figure 1: Average 1-Hour Ozone Maximum .............................................................................. 16 Figure 2: Average 8-Hour Ozone 4th High ................................................................................. 16 Figure 3: Particulate Matter (PM2.5) Annual Trends ................................................................... 17 Figure 4: Particulate Matter (PM10) 24-hour Trends ................................................................... 17 Figure 5: Carbon Monoxide Trends ............................................................................................ 18 Figure 6: Sulfur Dioxide 24-hour Trends .................................................................................... 18 Figure 7: Nitrogen Dioxide Annual Trend .................................................................................. 19 Figure 8: Lead Rolling 3-Month Maximum Trend ..................................................................... 19 Figure 9: Air Quality Index Summaries by Sector... ................................................................... 25 Figure 10: Estimated Volatile Organic Material Emissions Trend ............................................... 29 Figure 11: Estimated Particulate Emissions Trend ....................................................................... 30 Figure 12: Estimated Carbon Monoxide Emissions Trend ........................................................... 31 Figure 13: Estimated Sulfur Dioxide Emissions Trend................................................................. 32 Figure 14: Estimated Nitrogen Oxide Emissions Trend ............................................................... 33

7
8
Executive Summary
This report presents a summary of air quality data collected throughout the State of Illinois during
calendar year 2019. Data is presented for the six criteria pollutants (those for which air quality
standards have been developed – particulate matter (PM10 and PM2.5), ozone, sulfur dioxide, nitrogen
dioxide, carbon monoxide, and lead – along with some heavy metals, volatile organic compounds and
toxic compounds. Monitoring was conducted at 64 different site locations collecting data from 145
instruments.
In terms of the Air Quality Index (AQI) air quality during 2019 was either good or moderate 96% of
the time throughout Illinois. There were three days when air quality was considered unhealthy
(category red). This compares with seven unhealthy days in 2018. The unhealthy days were due to
elevated ozone concentrations in July and August. There were 13 days (12 for ozone and one for a
combination of fine particulates and ozone) when air quality in some part of Illinois was considered
Unhealthy for Sensitive Groups (category orange). This compares with 22 Unhealthy for Sensitive
Groups days reported in 2018. Air quality trends for most of the criteria pollutants are continuing to
show downward or stable trends below the level of the standards.
Stationary point source emission data has again been included. The data in the report reflects
information contained in Illinois EPA’s Integrated Comprehensive Environmental Management
System (ICEMAN) as of December 31, 2019. Emission estimates are for the calendar year 2019 and
are for the pollutants: particulate matter, volatile organic material, sulfur dioxide, nitrogen oxides,
and carbon monoxide. Emission trends of these pollutants have been given for the years 1998 to the
present. Emissions reported with the Annual Emissions Report have been provided starting with 1998
and are currently available through 2018. There has been a trend toward decreasing emissions over
this time period.

9

Section 1: Air Pollutants – Sources, Health, and Welfare Effects
10
Ozone (O3) Photochemical oxidants result from a complex series of atmospheric reactions initiated by sunlight. When reactive (non-methane) hydrocarbons and nitrogen oxides accumulate in the atmosphere and are exposed to the ultraviolet component of sunlight, the formation of new compounds, including ozone and peroxyacetylnitrate, takes place. Absorption of ultraviolet light energy by nitrogen dioxide results in its dissociation into nitric oxide and an oxygen atom. The oxygen atoms, for the most part, react with atmospheric molecular oxygen (O2) to form ozone (O3). In general, nitric oxide will react with ozone to re-form nitrogen dioxide, completing the cycle. A build-up of ozone above the equilibrium concentration, which is defined by the reaction cycle, results when nitrogen oxide reacts with non-methane hydrocarbons. Oxygen atoms from the hydrocarbon radical oxidize nitric oxide to nitrogen dioxide without ozone being used up. Thus, ozone concentrations are not depleted and can build up quickly. Ozone can also be formed naturally in the atmosphere by electrical discharge and in the stratosphere by solar radiation. The former process is not capable of producing significant urban concentrations of this pollutant; however, there is some belief that incursion of ozone from the stratosphere can contribute significantly to elevated ground level concentrations of ozone under certain meteorological conditions. Injury to vegetation is one of the earliest manifestations of photochemical air pollution, and sensitive plants are useful biological indicators of this type of pollution. The visible symptoms of photochemical oxidant produced injury to plants may be classified as: • Acute injury, identified by cell collapse
with subsequent development of necrotic patterns.
• Chronic injury, identified by necrotic
patterns or with other pigmented patterns.
• Physiological effects, identified by growth alterations, reduced yields, and changes in the quality of plant products. The acute symptoms are generally characteristic of a specific photochemical oxidant, though chronic injury patterns are not. Ozone injury to leaves is identified as a stripling or flecking. Adverse effects on sensitive vegetation have been observed from exposure to photochemical oxidant concentrations of about 100 micrograms per cubic meter (0.05 parts per million) for 4 hours.
Adverse effects on materials (rubber products and fabrics) from exposure to photochemical oxidants have not been precisely quantified, but have been observed at the levels presently occurring in many urban atmospheres. Ozone accelerates the aging of many materials, resulting in rubber cracking, dye fading, and paint erosion. These effects are linearly related to the total dose of ozone and can occur at very low levels, given long duration exposures. Ozone is a pulmonary irritant that affects the respiratory mucous membranes, other lung tissues, and respiratory functions. Clinical and epidemiological studies have demonstrated that ozone impairs the normal mechanical function of the lung, causing alterations in respiration – the most characteristic of which are shallow, rapid breathing and a decrease in pulmonary compliance. Exposure to ozone results in clinical symptoms such as chest tightness, coughing, and wheezing. Alterations in airway resistance can occur, especially to those with respiratory diseases (asthma, bronchitis, emphysema). These effects may occur in sensitive individuals, as well as in healthy exercising persons, at short-term ozone concentrations between 0.15 and 0.25 ppm. Ozone exposure increases the sensitivity of the lung to bronchoconstrictive agents such as histamine, acetylcholine, and allergens, as well as increasing the individual's susceptibility to bacterial infection. Simultaneous exposure to ozone and sulfur dioxide can produce larger changes in pulmonary function than exposure to either pollutant alone.

Section 1: Air Pollutants – Sources, Health, and Welfare Effects
11
Peroxyacetylnitrate (PAN) is an eye irritant, and its effects often occur in conjunction with the effects of ozone. Two characteristics of ozone and photochemical oxidant exposures should be cited: • Ozone itself is a primary cause of most
of the health effects reported in toxicological and experimental human studies and the evidence for attributing many health effects to this substance alone is very compelling.
• Atmospheric photochemical substances
are known to produce health effects, some of which are not attributable to pure ozone but may be caused by other photochemical substances in combination with ozone.
Particulate Matter (PM) Not all air pollutants are in the gaseous form. Small solid particles and liquid droplets, collectively called particulates or aerosols, are also present in the air in great numbers and may constitute a pollution problem. Particulates entering the atmosphere differ in size and chemical composition. The effects of particulates on health and welfare are directly related to their size and chemical composition. Particulate matter in the atmosphere consists of solids, liquids, and liquids-solids in combination. Suspended particulates generally refer to particles less than 100 micrometers in diameter (human hair is typically 100 micrometers thick). Particles larger than 100 micrometers will settle out of the air under the influence of gravity in a short period of time. Typical sources emitting particles into the atmosphere are combustion of fossil fuels (ash and soot), industrial processes (metals, fibers, etc.), fugitive dust (wind and mechanical erosion of local soil), and photochemically produced particles (complex chain reactions between sunlight and gaseous pollutants). Combustion and photochemical products tend to be smaller in size (less than 1 micrometer);
fugitive dust and industrial products are typically larger in size (greater than 1 micrometer). Particles which cause the most health and visibility difficulties are those less than 1.0 micrometer in size. These particles are also the most difficult to reduce in numbers by the various industrial removal techniques. Rainfall accounts for the major removal of these smaller particles from the air. One of the major problems associated with high concentrations of particulates is that the interaction between the particles, sunlight, and atmospheric moisture can potentially result in the climatic effects and diminished visibility (haze). Particles play a key role in the formation of clouds, and emissions of large numbers of particles can, in some instances, result in local increases in cloud formation and, possibly, precipitation. Particles in the size range of 0.1 to 1.0 micrometers are the most efficient in scattering visible light (wave length 0.4 to 0.7 micrometers) thereby reducing visibility. Particles combined with high humidity can result in the formation of haze which can cause hazardous conditions for the operation of motor vehicles and aircraft. Particulate pollutants enter the human body by way of the respiratory system and their most immediate effects are upon this system. The size of the particle determines its depth of penetration into the respiratory system. Particles over 5 micrometers are generally deposited in the nose and throat. Those that do penetrate deeper in the respiratory system to the air ducts (bronchi) are often removed by ciliary action. Particles ranging in size from 0.5 - 5.0 micrometers in diameter can be deposited in the bronchi, with few reaching the air sacs (alveoli). Most particles deposited in the bronchi are removed by the cilia within hours. Particles less than 0.5 micrometer in diameter reach and may settle in the alveoli. The removal of particles from the alveoli is much less rapid and complete than from the larger passages. Some of the particles retained in the alveoli are absorbed into the blood. Besides particulate size, the oxidation state, chemical composition, concentration, and length of time in the respiratory system
Section 1: Air Pollutants – Sources, Health, and Welfare Effects
12
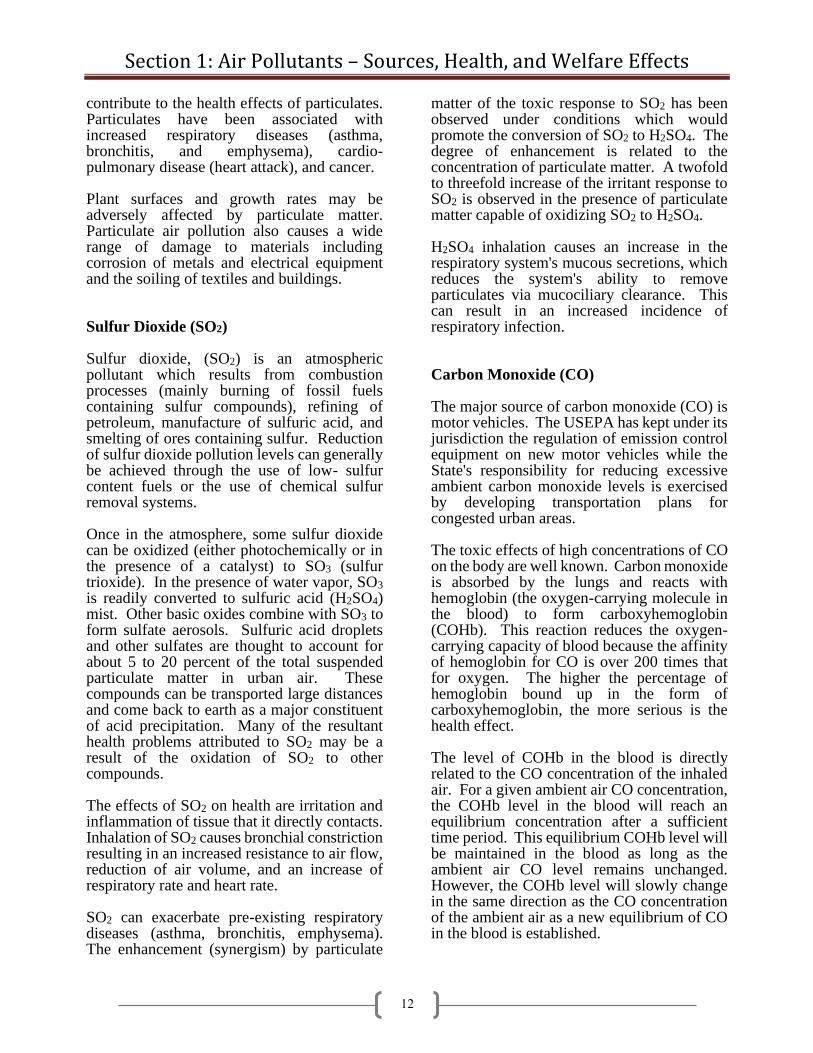
contribute to the health effects of particulates. Particulates have been associated with increased respiratory diseases (asthma, bronchitis, and emphysema), cardio-pulmonary disease (heart attack), and cancer. Plant surfaces and growth rates may be adversely affected by particulate matter. Particulate air pollution also causes a wide range of damage to materials including corrosion of metals and electrical equipment and the soiling of textiles and buildings. Sulfur Dioxide (SO2) Sulfur dioxide, (SO2) is an atmospheric pollutant which results from combustion processes (mainly burning of fossil fuels containing sulfur compounds), refining of petroleum, manufacture of sulfuric acid, and smelting of ores containing sulfur. Reduction of sulfur dioxide pollution levels can generally be achieved through the use of low- sulfur content fuels or the use of chemical sulfur removal systems. Once in the atmosphere, some sulfur dioxide can be oxidized (either photochemically or in the presence of a catalyst) to SO3 (sulfur trioxide). In the presence of water vapor, SO3 is readily converted to sulfuric acid (H2SO4) mist. Other basic oxides combine with SO3 to form sulfate aerosols. Sulfuric acid droplets and other sulfates are thought to account for about 5 to 20 percent of the total suspended particulate matter in urban air. These compounds can be transported large distances and come back to earth as a major constituent of acid precipitation. Many of the resultant health problems attributed to SO2 may be a result of the oxidation of SO2 to other compounds. The effects of SO2 on health are irritation and inflammation of tissue that it directly contacts. Inhalation of SO2 causes bronchial constriction resulting in an increased resistance to air flow, reduction of air volume, and an increase of respiratory rate and heart rate. SO2 can exacerbate pre-existing respiratory diseases (asthma, bronchitis, emphysema). The enhancement (synergism) by particulate
matter of the toxic response to SO2 has been observed under conditions which would promote the conversion of SO2 to H2SO4. The degree of enhancement is related to the concentration of particulate matter. A twofold to threefold increase of the irritant response to SO2 is observed in the presence of particulate matter capable of oxidizing SO2 to H2SO4. H2SO4 inhalation causes an increase in the respiratory system's mucous secretions, which reduces the system's ability to remove particulates via mucociliary clearance. This can result in an increased incidence of respiratory infection. Carbon Monoxide (CO) The major source of carbon monoxide (CO) is motor vehicles. The USEPA has kept under its jurisdiction the regulation of emission control equipment on new motor vehicles while the State's responsibility for reducing excessive ambient carbon monoxide levels is exercised by developing transportation plans for congested urban areas. The toxic effects of high concentrations of CO on the body are well known. Carbon monoxide is absorbed by the lungs and reacts with hemoglobin (the oxygen-carrying molecule in the blood) to form carboxyhemoglobin (COHb). This reaction reduces the oxygen-carrying capacity of blood because the affinity of hemoglobin for CO is over 200 times that for oxygen. The higher the percentage of hemoglobin bound up in the form of carboxyhemoglobin, the more serious is the health effect. The level of COHb in the blood is directly related to the CO concentration of the inhaled air. For a given ambient air CO concentration, the COHb level in the blood will reach an equilibrium concentration after a sufficient time period. This equilibrium COHb level will be maintained in the blood as long as the ambient air CO level remains unchanged. However, the COHb level will slowly change in the same direction as the CO concentration of the ambient air as a new equilibrium of CO in the blood is established.

Section 1: Air Pollutants – Sources, Health, and Welfare Effects
13
The lowest CO concentrations shown to produce adverse health effects result in aggravation of cardiovascular disease. Studies demonstrate that these concentrations have resulted in decreased exercise time before the onset of pain in the chest and extremities of individuals with heart or circulatory disease. Slightly higher CO levels have been associated with decreases in vigilance, the ability to discriminate time intervals, and exercise performance. Evidence also exists indicating a possible relationship between CO and heart attacks, the development of cardiovascular disease, and irregular fetal development. Studies on the existing ambient levels of CO do not indicate any adverse effects on vegetation, materials, or other aspects of human welfare. Nitrogen Dioxide (NO2) Nitrogen gas (N2) is an abundant and inert gas which makes up almost 80 percent of the Earth's atmosphere. In this form, it is harmless to humans and essential to plant metabolism. Due to its abundance in the air, it is a frequent reactant in many combustion processes. When combustion temperatures are extremely high, as in the burning of coal, oil, natural gas, and gasoline, atmospheric nitrogen gas may combine with molecular oxygen (O2) to form various oxides of nitrogen (NOx). Of these, nitric oxide (NO) and nitrogen dioxide (NO2) are the most important contributors to air pollution; NOx generally is used to represent these. Nitric oxide is a colorless and odorless gas. It is the primary form of NOx resulting from the combustion process. NOx contributes to haze and visibility reduction. NOx is also known to cause deterioration and fading of certain fabrics and damage to vegetation. Depending on concentration and extent of exposure, plants may suffer leaf lesions and reduced crop yield. Sensitivity of plants to NOx depends on a variety of factors including species, time of day, light, stage of maturity, and the presence or absence of other air pollutants such as sulfur dioxide and ozone.
There is a lack of strong evidence associating health effects with most NOx compounds. NO2, a secondary derivative of atmospheric nitric oxide, however, has been clearly established as exerting detrimental effects on human health and welfare. NO2 can cause eye irritation at concentrations as low as 0.07 ppm. NO2 can cause an increase in airway resistance, an increase in respiratory rate, an increase in sensitivity to bronchoconstrictors, a decrease in lung compliance, and an enhanced susceptibility to respiratory infections. NO2 is a deep lung irritant capable of producing pulmonary edema if inhaled in sufficient concentrations. When NO2 is inhaled in concentrations with other pollutants, the effects are additive. NOx may also react with water to form corrosive nitric acids, a major component of acid precipitation. Additionally, NOx and various other pollutants (e.g., hydrocarbons) may react in the presence of sunlight to product photochemical oxidants. Lead (Pb) Historically, atmospheric lead came primarily from combustion of leaded gasoline. However, the use of unleaded gas since 1975 has reduced mobile source lead emissions by over 90%. Currently stationary sources, such as lead smelters, battery manufacturers, and iron and steel producers can contribute significant amounts of lead to their immediate vicinity. Lead is a stable compound which persists and accumulates both in the environment and in the human body. Lead enters the human body through ingestion and inhalation with consequent absorption into the blood stream and distribution to all body tissues. No safe level of lead in the blood has been identified. Clinical, epidemiological and toxicological studies have demonstrated exposure to lead has a broad range of health effects. Since 1990, over 6,000 new health studies have been conducted. These studies have shown that children are the most susceptible to the

Section 1: Air Pollutants – Sources, Health, and Welfare Effects
14
damaging effects of lead because they are more likely to ingest lead due to hand-to-mouth activity and early body development. Lead exposure has been found to interfere with the developing nervous system including the brain. This can potentially lead to intelligence quotient loss, poor academic achievement, permanent learning disabilities, and behavioral problems. These effects can persist into early adulthood. Kidney and neurological cell damage has also been associated with lead exposure. Animal studies have demonstrated that lead can contribute to reduced fertility and birth defects. Other potential effects from lead exposure are weakened immune systems, restlessness, headaches, increased blood pressure, and cardiovascular disease. Illinois Ambient Air Quality Standards and Episode Levels Consistent with the intent of the Environmental Protection Act of the State of Illinois, Illinois has adopted ambient air quality and episode standards that specify maximum permissible short-term and long-term concentrations of various contaminants in the atmosphere. Ambient air quality and episode standards are limits on atmospheric concentrations of air contaminants established for the purpose of protecting the public health and welfare. The Illinois and National Ambient Air Quality Standards (NAAQS) consist of a primary and secondary standard for each pollutant (contaminant) as presented in Table 1. The Illinois Air Pollution Episode Levels are presented in Table 2. The primary standard and episode criterion represents the level of air quality which is necessary to protect the public health. Air entering the respiratory tract must not jeopardize health. Therefore, the air quality standards must, as a minimum, provide air which will not adversely affect, through acute or chronic symptoms, the public health. The secondary standard defines the level of air quality which is necessary to protect the public welfare. This includes, among other things,
effects on crops, vegetation, wildlife, visibility, and climate, as well as effects on materials, economic values, and on personal comfort and well-being. The standards are legally enforceable limitations, and any person causing or contributing to a violation of the standards is subject to enforcement proceedings under the Environmental Protection Act. The standards have also been designed for use as a basis for the development of implementation plans by State and local agencies for the abatement and control of pollutant emissions from existing sources, and for the determination of air contaminant emission limitations to ensure that population, industry, and economic growth trends do not add to the region's air pollution problems.
Section 1: Air Pollutants – Sources, Health, and Welfare Effects
15
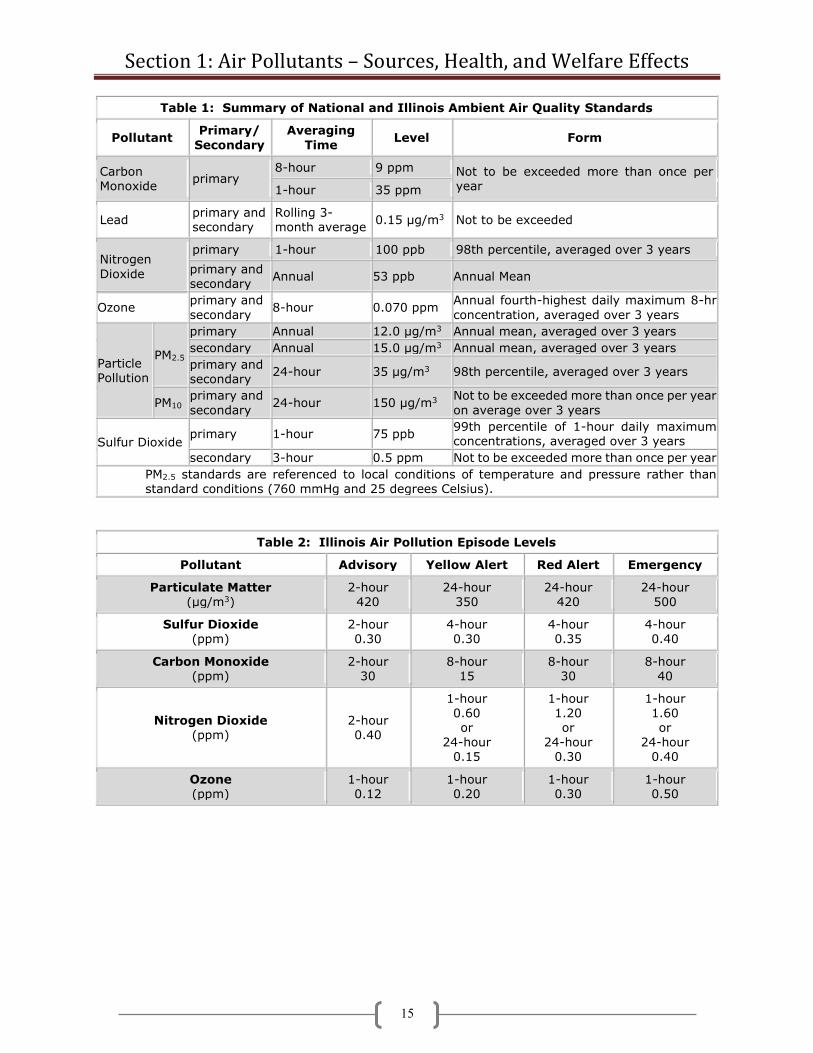
Table 1: Summary of National and Illinois Ambient Air Quality Standards
Pollutant Primary/
Secondary
Averaging
Time Level Form
Carbon Monoxide
primary 8-hour 9 ppm Not to be exceeded more than once per
year 1-hour 35 ppm
Lead primary and secondary
Rolling 3-month average
0.15 μg/m3 Not to be exceeded
Nitrogen
Dioxide
primary 1-hour 100 ppb 98th percentile, averaged over 3 years
primary and secondary
Annual 53 ppb Annual Mean
Ozone primary and
secondary 8-hour 0.070 ppm
Annual fourth-highest daily maximum 8-hr
concentration, averaged over 3 years
Particle Pollution
PM2.5
primary Annual 12.0 μg/m3 Annual mean, averaged over 3 years
secondary Annual 15.0 μg/m3 Annual mean, averaged over 3 years
primary and secondary
24-hour 35 μg/m3 98th percentile, averaged over 3 years
PM10 primary and
secondary 24-hour 150 μg/m3
Not to be exceeded more than once per year
on average over 3 years
Sulfur Dioxide primary 1-hour 75 ppb
99th percentile of 1-hour daily maximum concentrations, averaged over 3 years
secondary 3-hour 0.5 ppm Not to be exceeded more than once per year
PM2.5 standards are referenced to local conditions of temperature and pressure rather than standard conditions (760 mmHg and 25 degrees Celsius).
Table 2: Illinois Air Pollution Episode Levels
Pollutant Advisory Yellow Alert Red Alert Emergency
Particulate Matter (μg/m3)
2-hour 420
24-hour 350
24-hour 420
24-hour 500
Sulfur Dioxide (ppm)
2-hour 0.30
4-hour 0.30
4-hour 0.35
4-hour 0.40
Carbon Monoxide (ppm)
2-hour 30
8-hour 15
8-hour 30
8-hour 40
Nitrogen Dioxide (ppm)
2-hour 0.40
1-hour 0.60 or
24-hour 0.15
1-hour 1.20 or
24-hour 0.30
1-hour 1.60 or
24-hour 0.40
Ozone (ppm)
1-hour 0.12
1-hour 0.20
1-hour 0.30
1-hour 0.50
Section 2: Statewide Summary of Air Quality
16
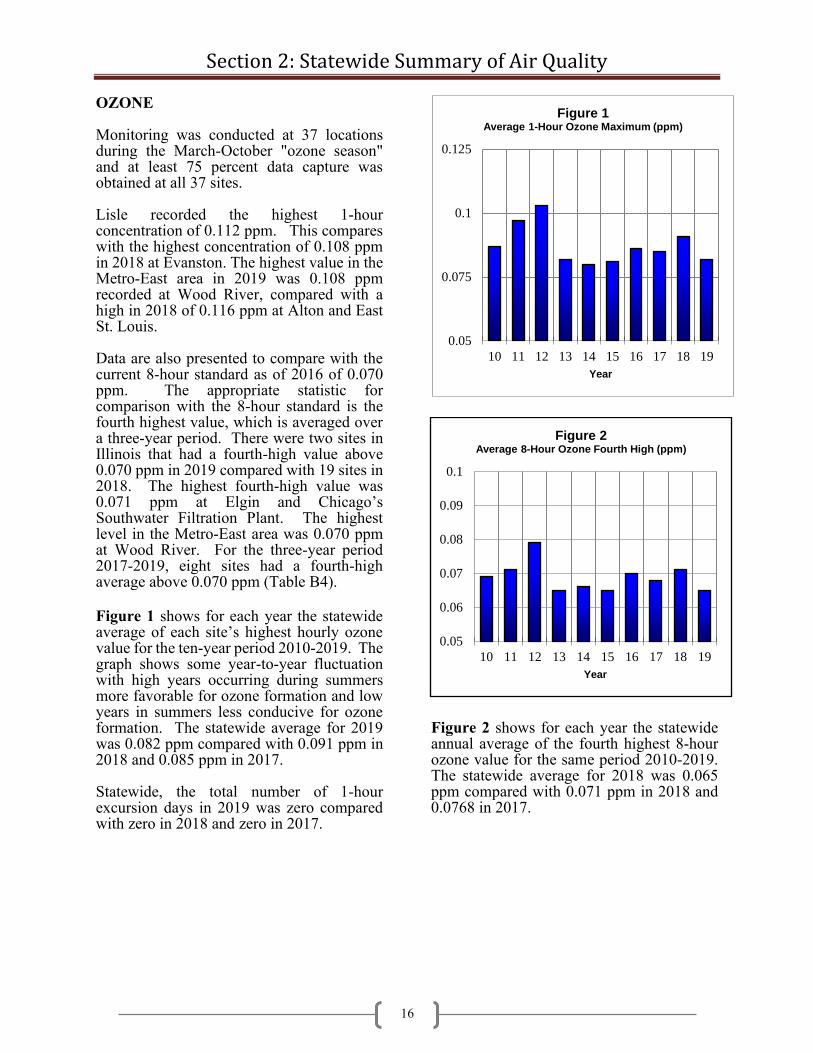
OZONE Monitoring was conducted at 37 locations during the March-October "ozone season" and at least 75 percent data capture was obtained at all 37 sites. Lisle recorded the highest 1-hour concentration of 0.112 ppm. This compares with the highest concentration of 0.108 ppm in 2018 at Evanston. The highest value in the Metro-East area in 2019 was 0.108 ppm recorded at Wood River, compared with a high in 2018 of 0.116 ppm at Alton and East St. Louis. Data are also presented to compare with the current 8-hour standard as of 2016 of 0.070 ppm. The appropriate statistic for comparison with the 8-hour standard is the fourth highest value, which is averaged over a three-year period. There were two sites in Illinois that had a fourth-high value above 0.070 ppm in 2019 compared with 19 sites in 2018. The highest fourth-high value was 0.071 ppm at Elgin and Chicago’s Southwater Filtration Plant. The highest level in the Metro-East area was 0.070 ppm at Wood River. For the three-year period 2017-2019, eight sites had a fourth-high average above 0.070 ppm (Table B4). Figure 1 shows for each year the statewide average of each site’s highest hourly ozone value for the ten-year period 2010-2019. The graph shows some year-to-year fluctuation with high years occurring during summers more favorable for ozone formation and low years in summers less conducive for ozone formation. The statewide average for 2019 was 0.082 ppm compared with 0.091 ppm in 2018 and 0.085 ppm in 2017. Statewide, the total number of 1-hour excursion days in 2019 was zero compared with zero in 2018 and zero in 2017.
Figure 2 shows for each year the statewide annual average of the fourth highest 8-hour ozone value for the same period 2010-2019. The statewide average for 2018 was 0.065 ppm compared with 0.071 ppm in 2018 and 0.0768 in 2017.
0.05
0.075
0.1
0.125
10 11 12 13 14 15 16 17 18 19
Year
Figure 1Average 1-Hour Ozone Maximum (ppm)
0.05
0.06
0.07
0.08
0.09
0.1
10 11 12 13 14 15 16 17 18 19
Year
Figure 2Average 8-Hour Ozone Fourth High (ppm)

Section 2: Statewide Summary of Air Quality
17
PARTICULATE MATTER Monitoring was conducted at 34 sites for PM2.5. In 2019, no sites recorded an average above 12.0 ug/m3, the level of the annual standard. The statewide average of the annual averages was 9.0 ug/m3 in 2018 compared to 9.3 ug/m3 in 2018. Figure 3 shows the trend of the statewide annual averages for PM2.5 for the period 2010-2019. There was one exceedance of the 24-hour standard of 35 ug/m3 in 2019 compared with two exceedances in 2018 and two exceedances in 2017. The statewide peak of 35.9 ug/m3 was recorded at Rockford. In 2019, the statewide 24-hour average was 21.4 ug/m3. This compares with 21.3 ug/m3 in 2018 and 20.1 ug/m3 in 2017. In 2019 there were four sites monitoring PM10. The statewide annual average was 27 ug/m3 compared with 24 ug/m3 in 2018 and 23 ug/m3 in 2017. The highest annual average was 35 ug/m3 in Granite City. The lowest annual was 14 ug/m3 at Northbrook. For PM10, the statewide average of the maximum 24-hour averages in 2019 was 77 ug/m3 compared with 81 ug/m3 in 2018 and 81 ug/m3 in 2017. Figure 4 depicts this information for the period 2010-2019. There were no exceedances of the 24-hour primary standard of 150 ug/m3. The highest 24-hour average was recorded in Granite City with a value of 104 ug/m3 compared with a high 24-hour value of 103 ug/m3 in Granite City in 2018.
0
5
10
15
10 11 12 13 14 15 16 17 18 19
Year
Figure 3Particulate Matter (PM2.5) Annual Trends
(ug/m3)
0
25
50
75
100
125
150
10 11 12 13 14 15 16 17 18 19
Year
Figure 4Particulate Matter (PM10) 24-Hour Trends
(ug/m3)
Section 2: Statewide Summary of Air Quality
18
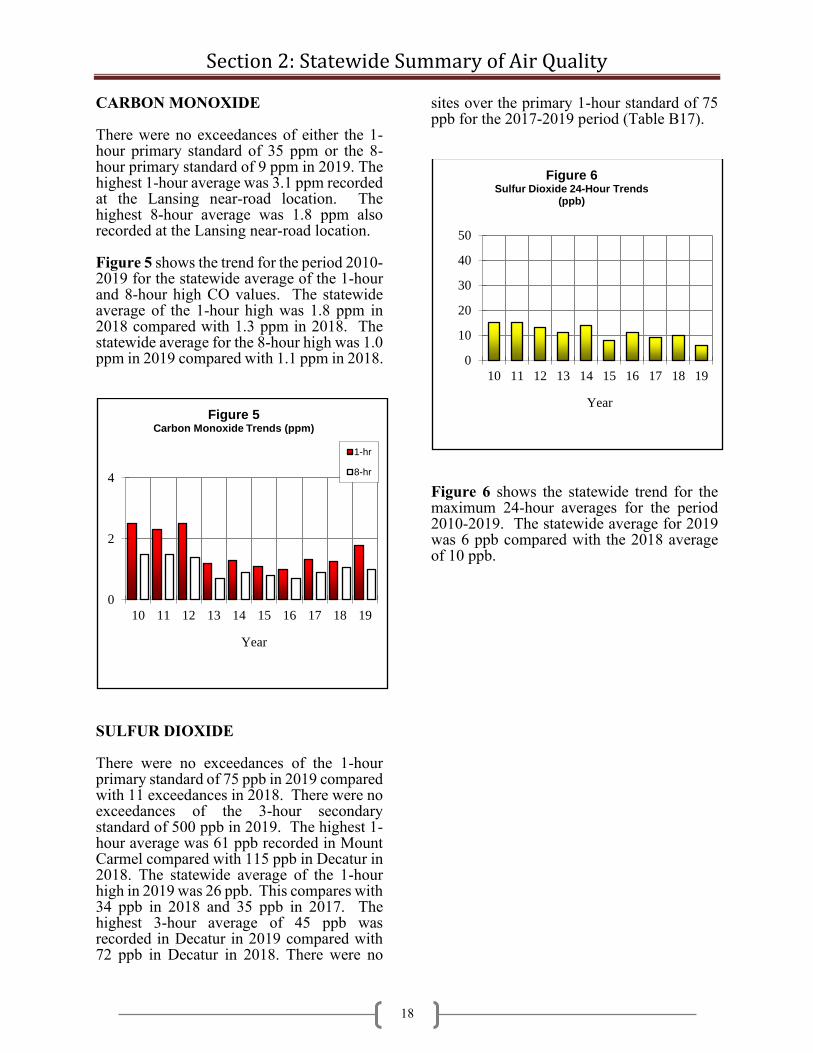
CARBON MONOXIDE There were no exceedances of either the 1-hour primary standard of 35 ppm or the 8-hour primary standard of 9 ppm in 2019. The highest 1-hour average was 3.1 ppm recorded at the Lansing near-road location. The highest 8-hour average was 1.8 ppm also recorded at the Lansing near-road location. Figure 5 shows the trend for the period 2010-2019 for the statewide average of the 1-hour and 8-hour high CO values. The statewide average of the 1-hour high was 1.8 ppm in 2018 compared with 1.3 ppm in 2018. The statewide average for the 8-hour high was 1.0 ppm in 2019 compared with 1.1 ppm in 2018.
SULFUR DIOXIDE There were no exceedances of the 1-hour primary standard of 75 ppb in 2019 compared with 11 exceedances in 2018. There were no exceedances of the 3-hour secondary standard of 500 ppb in 2019. The highest 1-hour average was 61 ppb recorded in Mount Carmel compared with 115 ppb in Decatur in 2018. The statewide average of the 1-hour high in 2019 was 26 ppb. This compares with 34 ppb in 2018 and 35 ppb in 2017. The highest 3-hour average of 45 ppb was recorded in Decatur in 2019 compared with 72 ppb in Decatur in 2018. There were no
sites over the primary 1-hour standard of 75 ppb for the 2017-2019 period (Table B17).
Figure 6 shows the statewide trend for the maximum 24-hour averages for the period 2010-2019. The statewide average for 2019 was 6 ppb compared with the 2018 average of 10 ppb.
0
2
4
10 11 12 13 14 15 16 17 18 19
Year
Figure 5Carbon Monoxide Trends (ppm)
1-hr
8-hr
0
10
20
30
40
50
10 11 12 13 14 15 16 17 18 19
Year
Figure 6Sulfur Dioxide 24-Hour Trends
(ppb)

Section 2: Statewide Summary of Air Quality
19
NITROGEN DIOXIDE There were no violations of the annual primary standard of 53 ppb recorded in Illinois during 2019. The highest annual average of 17 ppb was recorded at Schiller Park. The statewide average for 2019 was 12.5 ppb compared with 12.2 ppb in 2018 and 13.7 ppb in 2017. There were no violations of the 1-hour primary standard, and there were also no violations in 2018. There were no sites over the 1-hour primary standard of 100 ppb for the 2017-2019 period compared to zero sites for the 2016-2018 period (Table B20). Figure 7 depicts the trend of statewide averages from 2010-2019. There have been no violations of the annual standard since 1980.
LEAD Perhaps the greatest success story in controlling criteria pollutants is lead. As a direct result of the federal motor vehicle control program, which has required the use of unleaded gas in automobiles since 1975, lead levels have decreased by more than 90 percent statewide. Based on health studies, the lead standard was revised in 2008 from a quarterly mean of 1.5 ug/m3 to a rolling three-month maximum mean of 0.15 ug/m3.
There were no violations of the rolling three-month maximum mean standard for the 2017 to 2019 period (Table B23).
Figure 8 shows the trend of the statewide maximum rolling three-month averages from 2010-2019. The decrease in 2013 was due to various controls having been implemented at facilities that have source-oriented monitors. The increase in 2019 was due to lead emission control problems at one facility in Granite City. The problems were discussed with the facility and corrective actions taken. All monitoring locations in the State have three-year maximum averages under the national standard for lead (Table B23). The statewide average for all sites was 0.057 ug/m3 in 2019 compared to 0.027 ug/m3 in 2018 and 0.025 ug/m3 in 2017.
0
5
10
15
20
25
10 11 12 13 14 15 16 17 18 19
Year
Figure 7Nitrogen Dioxide Annual Trend
(ppm)
0.000
0.015
0.030
0.045
0.060
0.075
10 11 12 13 14 15 16 17 18 19
Year
Figure 8Lead Maximum Three-Month Trend (ug/m3)

Section 2: Statewide Summary of Air Quality
20
FILTER ANALYSIS RESULTS The total suspended particulate samples were analyzed, in addition to lead, for specific metals. Several of the metals analyzed (arsenic, beryllium, cadmium, chromium, manganese, and nickel) have known toxic properties. Other metals such as iron can be used as tracers to help identify sources of high particulate values. There are currently no state or federal ambient air quality standards for these parameters. The areas with the highest metals concentrations in Illinois are generally the heavily-industrialized areas of the Metro-East (Granite City and East St. Louis), south Chicago, and near source-oriented monitors. The highest 24-hour average for arsenic was 0.020 ug/m3 measured in Granite City. There were no measurable beryllium 24-hour averages recorded statewide. The monitor at Washington High School in Chicago recorded the highest cadmium concentrations with a 24-hour average of 0.011 ug/m3. The highest 24-hour chromium average was 0.031 ug/m3 recorded at Washington High School in Chicago. The highest iron, manganese, and nickel values were recorded in Granite City.. TOXIC COMPOUNDS Sampling for toxic compounds other than metals (see Filter Analysis Section, Table B24) was conducted at Northbrook and Schiller Park. Most compounds were below the method detection limits. Table B25 has a listing of various toxic compound maximums and annual averages.
Section 3: Air Quality Index
21
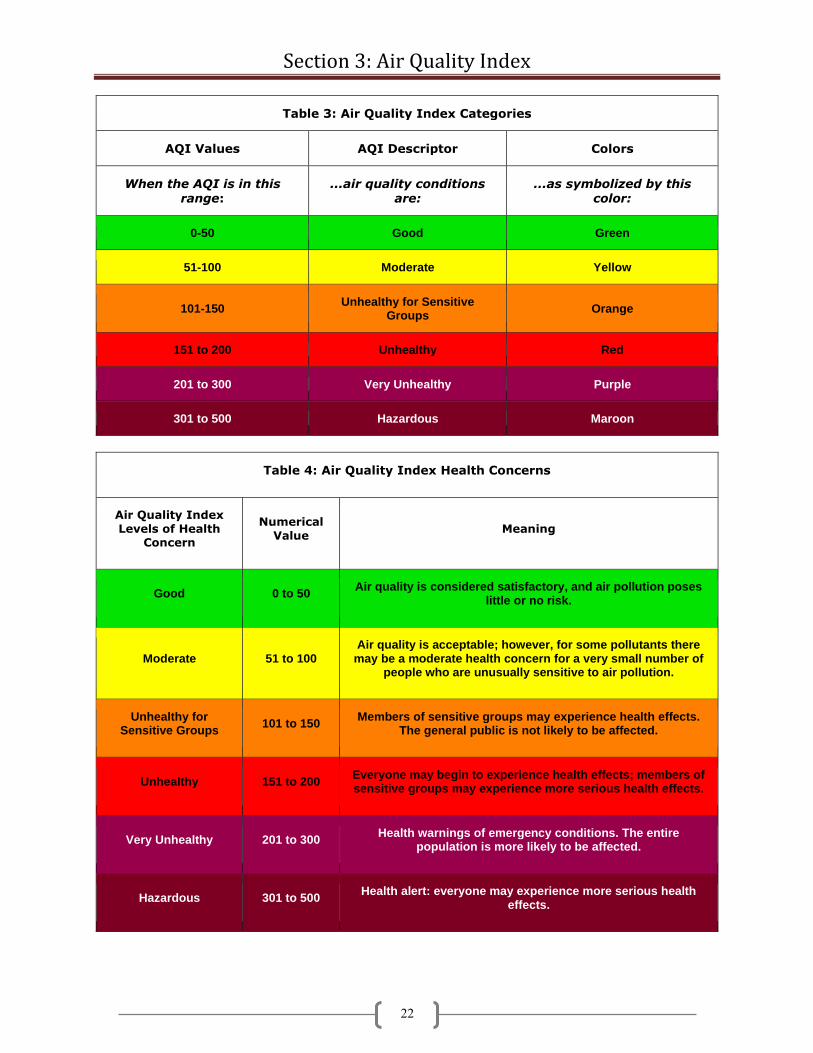
The Air Quality Index (AQI) is the national standard method for reporting air pollution levels to the public. An index such as the AQI is necessary because there are several air pollutants, each with different typical ambient concentrations and each with different levels of harm, and to report actual concentrations for all of them would be confusing. The AQI uses a single number and a short descriptor to define the air quality in an easy-to-remember and easy-to-understand way, taking all the pollutants into account. The AQI is based on the short-term federal National Ambient Air Quality Standards (NAAQS), for six of the criteria pollutants, namely: • Ozone (O3) • Sulfur dioxide (SO2) • Carbon monoxide (CO) • Particulate matter (PM10)
• Particulate matter (PM2.5) • Nitrogen dioxide (NO2)
In each case, the short-term primary NAAQS corresponds to 100 on the AQI scale – the top end of the Moderate category. The next concentration above the NAAQS would begin the Unhealthy for Sensitive Groups category at 101 on the AQI scale. Table 3 lists all the AQI ranges and their descriptor categories. Each category corresponds to a different level of health concern. Table 4 lists each AQI category and its corresponding meaning. Unhealthy for Sensitive Groups occurs on occasion for 8-hour ozone, PM2.5, and downwind of certain SO2 sources. Unhealthy air quality is uncommon in Illinois, and Very Unhealthful air quality is rare. There has never been an occurrence of Hazardous air quality in Illinois. The AQI is computed as follows: data from pollution monitors in an area are collected, and the AQI sub index for each pollutant is computed using formulas derived from the
index and concentration relations. Nomograms and tables are also available for this purpose. The data used are: • O3 estimate of the highest 8-hour
average for that calendar day • SO2 the highest 1-hour or most
recent 24-hour average • CO the highest 8-hour average so
far that calendar day • PM10 the most recent 24-hour
average • PM2.5 estimate of the 24-hour
average for that calendar day • NO2 the highest 1-hour average
Continuous monitors are utilized for all the pollutants, including PM10 and PM2.5. Once all the sub-indices for the various pollutants have been computed, the highest is chosen by inspection. That is the AQI for the area and the pollutant giving rise to it is the "critical pollutant." Thus if, for Anytown, Illinois, the following sub-indices were obtained:
O3 = 45
SO2 = 23
CO = 19
PM10 = 41
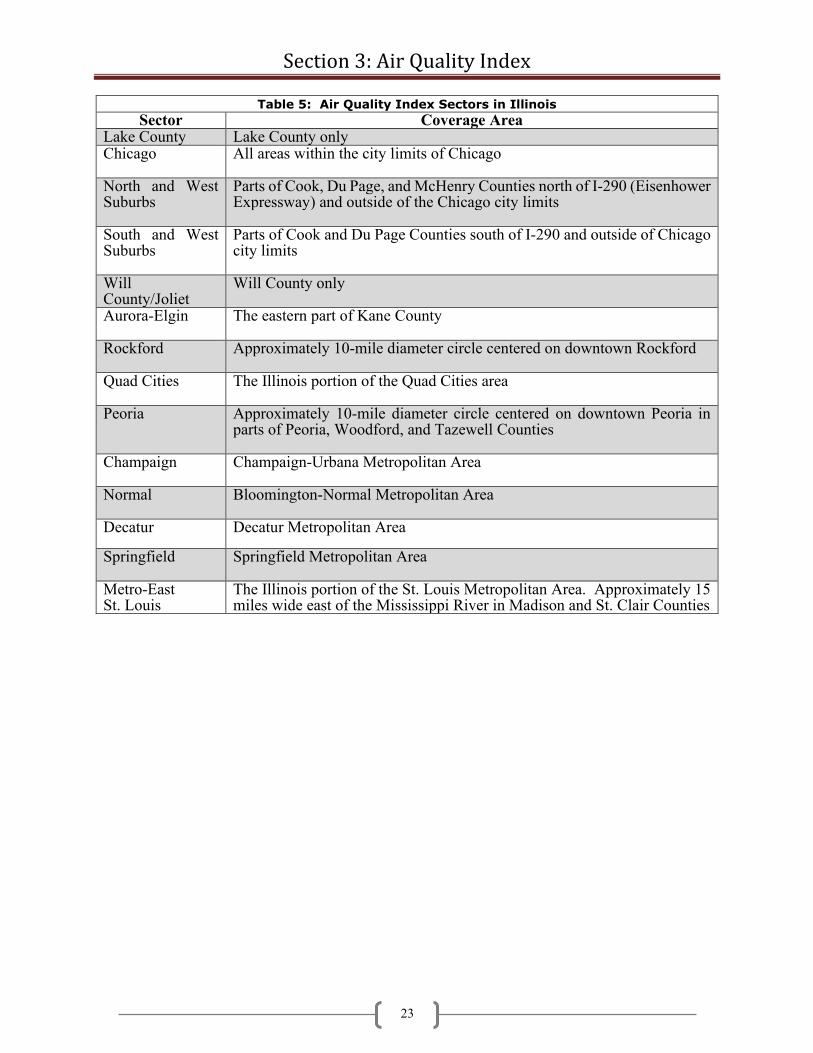
PM2.5 = 61 Anytown's AQI for that day would be 61, which is in the Moderate category, and the critical pollutant would be particulates (PM2.5). If data for one of the pollutants used in computing AQI is missing, the AQI is computed using the data available, ignoring the missing data. It occasionally happens that two pollutants have the same sub index; in such cases there are two critical pollutants. The Illinois EPA issues an AQI forecast for 14 areas, or sectors, in Illinois (Table 5). These correspond to metropolitan areas with populations greater than 100,000.
Section 3: Air Quality Index
22
Table 3: Air Quality Index Categories
AQI Values AQI Descriptor Colors
When the AQI is in this range:
...air quality conditions are:
...as symbolized by this color:
0-50 Good Green
51-100 Moderate Yellow
101-150 Unhealthy for Sensitive
Groups Orange
151 to 200 Unhealthy Red
201 to 300 Very Unhealthy Purple
301 to 500 Hazardous Maroon
Table 4: Air Quality Index Health Concerns
Air Quality Index
Levels of Health Concern
Numerical
Value Meaning
Good 0 to 50 Air quality is considered satisfactory, and air pollution poses
little or no risk.
Moderate 51 to 100 Air quality is acceptable; however, for some pollutants there
may be a moderate health concern for a very small number of people who are unusually sensitive to air pollution.
Unhealthy for Sensitive Groups
101 to 150 Members of sensitive groups may experience health effects.
The general public is not likely to be affected.
Unhealthy 151 to 200 Everyone may begin to experience health effects; members of sensitive groups may experience more serious health effects.
Very Unhealthy 201 to 300 Health warnings of emergency conditions. The entire
population is more likely to be affected.
Hazardous 301 to 500 Health alert: everyone may experience more serious health
effects.
Section 3: Air Quality Index
23
Table 5: Air Quality Index Sectors in Illinois
Sector Coverage Area Lake County Lake County only Chicago All areas within the city limits of Chicago
North and West Suburbs
Parts of Cook, Du Page, and McHenry Counties north of I-290 (Eisenhower Expressway) and outside of the Chicago city limits
South and West Suburbs
Parts of Cook and Du Page Counties south of I-290 and outside of Chicago city limits
Will County/Joliet
Will County only
Aurora-Elgin The eastern part of Kane County
Rockford Approximately 10-mile diameter circle centered on downtown Rockford
Quad Cities The Illinois portion of the Quad Cities area
Peoria Approximately 10-mile diameter circle centered on downtown Peoria in parts of Peoria, Woodford, and Tazewell Counties
Champaign Champaign-Urbana Metropolitan Area
Normal Bloomington-Normal Metropolitan Area
Decatur Decatur Metropolitan Area
Springfield Springfield Metropolitan Area
Metro-East St. Louis
The Illinois portion of the St. Louis Metropolitan Area. Approximately 15 miles wide east of the Mississippi River in Madison and St. Clair Counties
Section 3: Air Quality Index
24
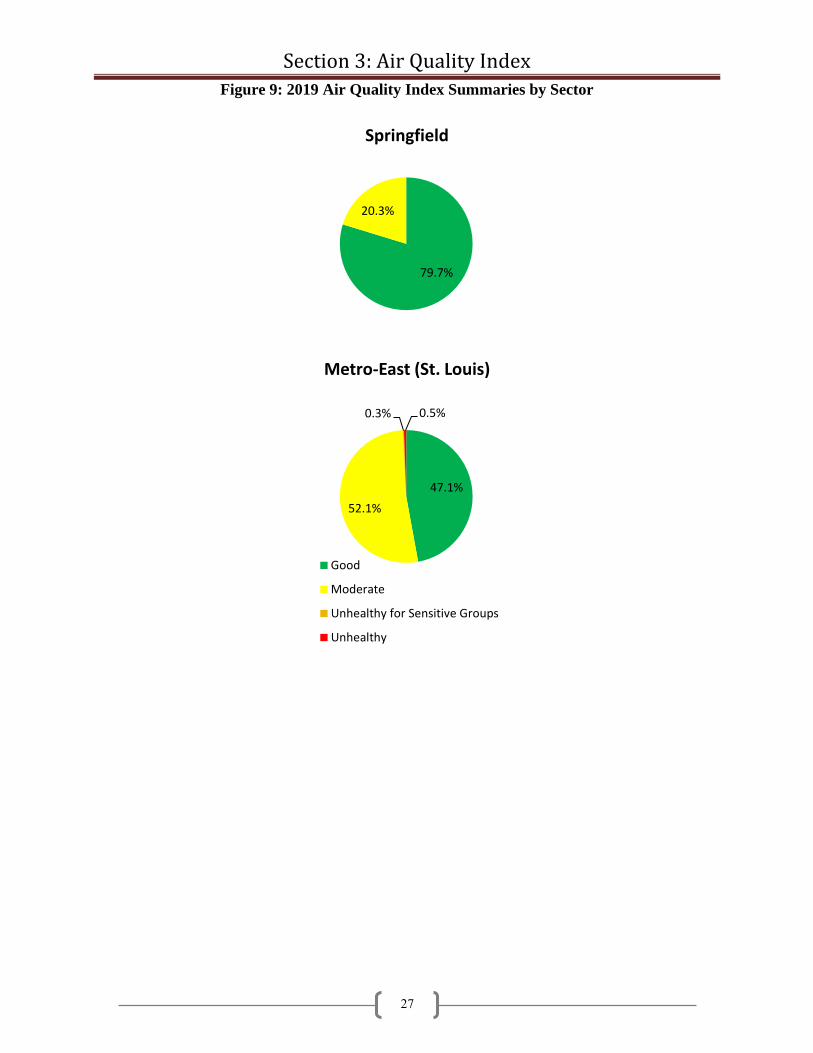
Illinois EPA AQI forecasts and AQI information can be obtained on EPA’s AirNow website at http://www.airnow.gov. The AirNow website shows estimated real-time AQI levels for all sectors in Illinois as well as other areas around the country. AQI information can further be obtained via e-mail and/or cell phones through the EnviroFlash program located at http://illinois.enviroflash.info/signup.cfm. The AirNow website and residents subscribed to EnviroFlash program can also receive alerts when high pollution levels are occurring or expected to occur. Additionally, Illinois AQI forecasts and current AQI levels are picked up and reported by various media outlets, weather websites, and electronic application programs. 2019 Illinois AQI Sector Summary In order to present a more representative AQI, 24-hour calendar day FRM PM2.5 and PM10 values from the total network were used to determine the percentages in Figure 9 even though some of these values were not available for issuing the daily AQI. Air quality was still in the "Good" and “Moderate” categories most often in 2019. Most sectors had a higher frequency of "Good" than "Moderate", and all sectors had a higher frequency of “Moderate” than "Unhealthy for Sensitive Groups." Lake County, Aurora-Elgin, Joliet/Will County, Quad Cities, Peoria, Champaign, Normal, Decatur, and Springfield sectors had 65 percent or more of the days in the "Good" category. Within AQI sectors there were 28 occurrences of “Unhealthy for Sensitive Groups” air quality and 3 occurrences of “Unhealthy” air quality in 2019. The sector breakdown for “Unhealthy for Sensitive Groups” was two in Lake County, five in Chicago, four in North & West Suburbs, four in South & West, four in Aurora-Elgin, three in Will County, one in Rockford, two in Quad Cities, two in Peoria and one in Metro-East. The sector breakdown for “Unhealthy” was one in South & West Suburbs and two in Metro-East. Figure 9 presents the AQI
statistics for each sector. The pie chart shows the percent of days each sector was in a particular category. In 2019, there were no ozone advisories issued in Illinois. An advisory is declared when ozone levels have reached the level of the former 1-hour standard (0.125 ppm) on a particular day. In the Chicago MSA there were zero Air Pollution Action Days issued in 2019. This compares with eight in 2018.

Section 3: Air Quality Index
Figure 9: 2019 Air Quality Index Summaries by Sector
25
70.2%
29.2%
0.6%
Chicago Sector - Lake County
56.4%
42.5%
1.1%
Chicago Sector - North & West Suburbs
67.9%
31.0%
1.1%
Aurora - Elgin
57.5%
41.1%
1.4%
Chicago Sector - Chicago
45.2%
53.4%
1.1% 0.3%
Chicago Sector - South & West Suburbs
68.5%
30.7%
0.8%
Joliet/Will County
Good
Moderate
Unhealthy for Sensitive Groups
Unhealthy

Section 3: Air Quality Index
Figure 9: 2019 Air Quality Index Summaries by Sector
26
62.6%
37.1%
0.3%
Rockford
78.0%
21.4%
0.5%
Peoria
70.3%
29.7%
Normal
77.8%
21.6%
0.6%
Quad Cities
77.0%
23.0%
Champaign
71.2%
28.8%
Decatur
Good
Moderate
Unhealthy for Sensitive Groups
Unhealthy
Section 3: Air Quality Index
Figure 9: 2019 Air Quality Index Summaries by Sector
27
79.7%
20.3%
Springfield
47.1%
52.1%
0.3% 0.5%
Metro-East (St. Louis)
Good
Moderate
Unhealthy for Sensitive Groups
Unhealthy

Section 4: Statewide Summary of Point Source Emissions
28
Since the late 1970s, the Illinois EPA’s Division of Air Pollution Control has maintained a database of stationary point source emissions for the entire State. 40 CFR 51.211 requires Illinois to include in its State Implementation Plan "... procedures for requiring owners or operators of stationary sources to maintain records of... a) Information on the nature and amount of emissions from the stationary source and b) other information as may be necessary..." The emission database maintained by the Division of Air Pollution Control has changed over time. The current emissions inventory is known as the Integrated Comprehensive Environmental Management System (ICEMAN) and includes emission data on approximately 6,200 active sources (including 3,631 in the Registration of Smaller Sources, or ROSS, program) throughout the State. The ICEMAN data includes source addresses; source emission totals; permit data such as expiration date and status; emission unit data such as name, hours of operation, operating rate, fuel parameters, and emissions; control equipment data such as control device name, type, and removal efficiencies; and stack parameters. Reported emissions and Agency-calculated emissions are stored separately. The group responsible for the entry of emission inventory data is the Inventory Unit of the Air Quality Planning Section, and uses permit applications, the issued permit, and data reported on annual emissions reports to compile the inventory. The following tables and graphs are an analysis of the emissions data contained in ICEMAN at the end of 2019. It is important to note emissions contained in the ICEMAN are not necessarily the actual emissions that entered the atmosphere. This is due to the fact that when an air pollution permit is applied for, the applicant provides maximum and average emission rates. The maximum emission rate reflects what the applicant believes the emission rate would be at maximum production. The average emission rate reflects emissions at the applicant's most probable production rate. The Inventory Unit
has been updating its estimated emissions to more accurately reflect the reported emissions. To calculate the distribution of emissions for the individual categories, the source classification code (SCC) field was used from the ICEMAN. The SCC is an eight-digit code that breaks emission units into logical categories. SCCs are provided by the USEPA. To produce the following tables, the first three digits of the SCC were used. Only categories that contributed significantly to the overall total are listed in the following sections. The complete category breakdown can be found in Appendix C.
Section 4: Statewide Summary of Point Source Emissions
29
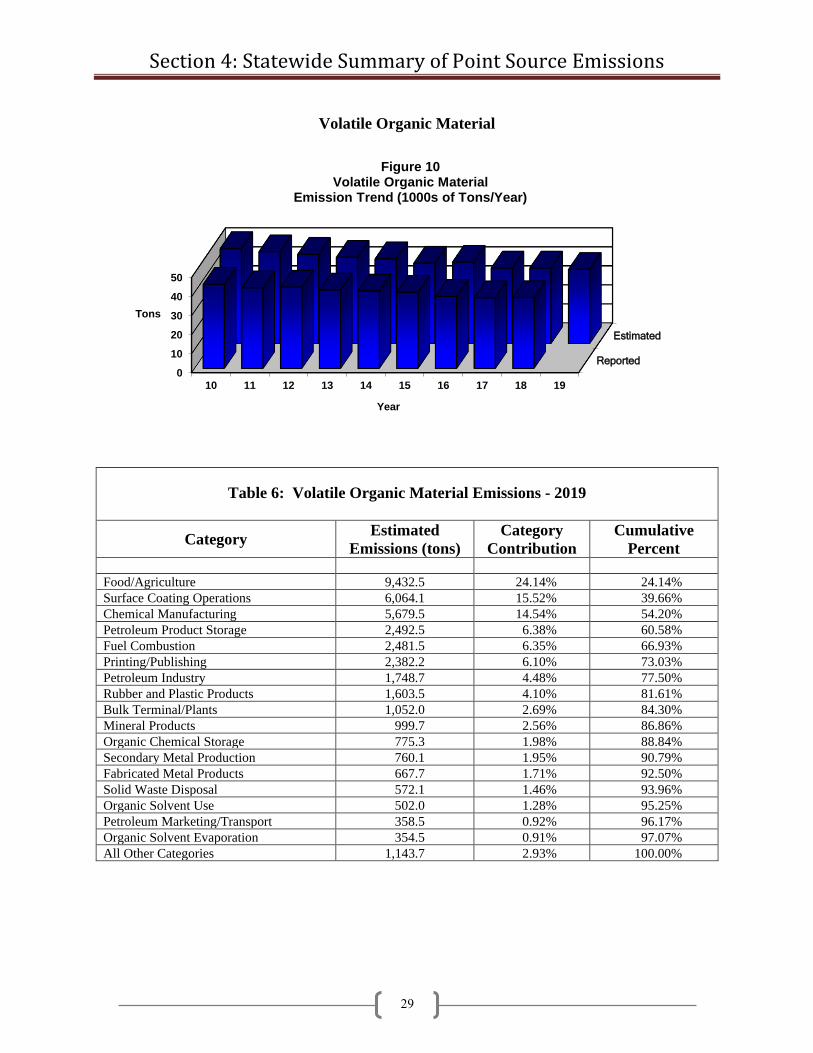
Volatile Organic Material
Table 6: Volatile Organic Material Emissions - 2019
Category Estimated
Emissions (tons)
Category
Contribution
Cumulative
Percent
Food/Agriculture 9,432.5 24.14% 24.14%
Surface Coating Operations 6,064.1 15.52% 39.66%
Chemical Manufacturing 5,679.5 14.54% 54.20%
Petroleum Product Storage 2,492.5 6.38% 60.58%
Fuel Combustion 2,481.5 6.35% 66.93%
Printing/Publishing 2,382.2 6.10% 73.03%
Petroleum Industry 1,748.7 4.48% 77.50%
Rubber and Plastic Products 1,603.5 4.10% 81.61%
Bulk Terminal/Plants 1,052.0 2.69% 84.30%
Mineral Products 999.7 2.56% 86.86%
Organic Chemical Storage 775.3 1.98% 88.84%
Secondary Metal Production 760.1 1.95% 90.79%
Fabricated Metal Products 667.7 1.71% 92.50%
Solid Waste Disposal 572.1 1.46% 93.96%
Organic Solvent Use 502.0 1.28% 95.25%
Petroleum Marketing/Transport 358.5 0.92% 96.17%
Organic Solvent Evaporation 354.5 0.91% 97.07%
All Other Categories 1,143.7 2.93% 100.00%
Reported
Estimated
0
10
20
30
40
50
10 11 12 13 14 15 16 17 18 19
Tons
Year
Figure 10Volatile Organic Material
Emission Trend (1000s of Tons/Year)

Section 4: Statewide Summary of Point Source Emissions
30
PM10
Table 7: Distribution of PM10 Emissions – 2019
Category Estimated
Emissions (tons)
Category
Contribution
Cumulative
Percent
Fuel Combustion 5,597.8 26.57% 26.57%
Food/Agriculture 5,497.3 26.10% 52.67%
Mineral Products 4,093.1 19.43% 72.10%
Petroleum Industry 1,234.2 5.86% 77.96%
Chemical Manufacturing 1,023.5 4.86% 82.81%
Primary Metal Production 882.7 4.19% 87.00%
Secondary Metal Production 869.2 4.13% 91.13%
Solid Waste Disposal 530.0 2.52% 93.65%
Fabricated Metal Products 270.0 1.28% 94.93%
Surface Coating Operations 239.9 1.14% 96.07%
Process Cooling 237.7 1.13% 97.19%
All Other Categories 591.0 2.81% 100.00%
Reported
Estimated
0
10
20
30
40
10 11 12 13 14 15 16 17 18 19
Tons
Year
Figure 11PM10 Emission Trend(1000s of Tons/Year)

Section 4: Statewide Summary of Point Source Emissions
31
Carbon Monoxide
Table 8: Distribution of Carbon Monoxide Emissions - 2019
Category Estimated
Emissions (tons)
Category
Contribution
Cumulative
Percent
Fuel Combustion 25,238.0 48.57% 48.57%
Primary Metal Production 12,408.3 23.88% 72.45%
Mineral Products 3,334.4 6.42% 78.87%
Petroleum Industry 2,477.7 4.77% 83.64%
Solid Waste Disposal 2,385.8 4.59% 88.23%
Secondary Metal Production 1,906.6 3.67% 91.90%
Chemical Manufacturing 1,827.2 3.52% 95.41%
Food/Agriculture 1,189.6 2.29% 97.70%
Oil and Gas Production 244.4 0.47% 98.17%
Surface Coating Operations 233.0 0.45% 98.62%
Fabricated Metal Products 191.7 0.37% 98.99%
All Other Categories 524.3 1.01% 100.00%
Reported
Estimated
0
20
40
60
80
10 11 12 13 14 15 16 17 18 19
Tons
Year
Figure 12Carbon Monoxide EmissionTrend (1000s of Tons/Year)

Section 4: Statewide Summary of Point Source Emissions
32
Sulfur Dioxide
Table 9: Distribution of Sulfur Dioxide Emissions - 2019
Category Estimated
Emissions (tons)
Category
Contribution
Cumulative
Percent
Fuel Combustion 72,361.7 84.02% 84.02%
Mineral Products 6,261.1 7.27% 91.29%
Primary Metal Production 2,533.5 2.94% 94.23%
Food/Agriculture 1,436.7 1.67% 95.90%
Petroleum Industry 1,299.7 1.51% 97.41%
Solid Waste Disposal 1,122.2 1.30% 98.71%
Chemical Manufacturing 912.3 1.06% 99.77%
All Other Categories 198.4 0.23% 100.00%
Reported
Estimated
0
100
200
300
400
10 11 12 13 14 15 16 17 18 19
Tons
Year
Figure 13Sulfur Dioxide Emission
Trend (1000s of Tons/Year)

Section 4: Statewide Summary of Point Source Emissions
33
Nitrogen Oxides
Table 10: Distribution of Nitrogen Oxide Emissions - 2019
Category Estimated
Emissions (tons)
Category
Contribution
Cumulative
Percent
Fuel Combustion 51,165.9 74.69% 74.69%
Mineral Products 6,699.2 9.78% 84.47%
Petroleum Industry 3,771.5 5.51% 89.97%
Chemical Manufacturing 1,468.9 2.14% 92.12%
Primary Metal Production 1,208.4 1.76% 93.88%
Food/Agriculture 1,137.9 1.66% 95.54%
Solid Waste Disposal 788.2 1.15% 96.69%
Secondary Metal Production 629.5 0.92% 97.61%
Oil and Gas Production 627.8 0.92% 98.53%
Surface Coating Operations 473.6 0.69% 99.22%
All Other Categories 536.1 0.78% 100.00%
Reported
Estimated
0
50
100
150
10 11 12 13 14 15 16 17 18 19
Tons
Year
Figure 14Nitrogen Oxide Emission
Trend (1000s of Tons/Year)

Appendix A: Air Sampling Network
34
Description of the Air Sampling Network
The Illinois air monitoring network is composed of instrumentation owned and operated by both the Illinois EPA and by cooperating local agencies. This network has been designed to measure ambient air quality levels throughout the State of Illinois following federal guidelines. The network contains both continuous and non-continuous instruments. The continuous instruments operate throughout the year, while non-continuous instruments operate intermittently based on the schedule shown in Table A1. This is the official non-continuous sampling schedule used by the Illinois EPA during 2019. The Illinois network is deployed along the lines described in the Illinois State Implementation Plan. An updated air monitoring plan is submitted to USEPA each year for review.
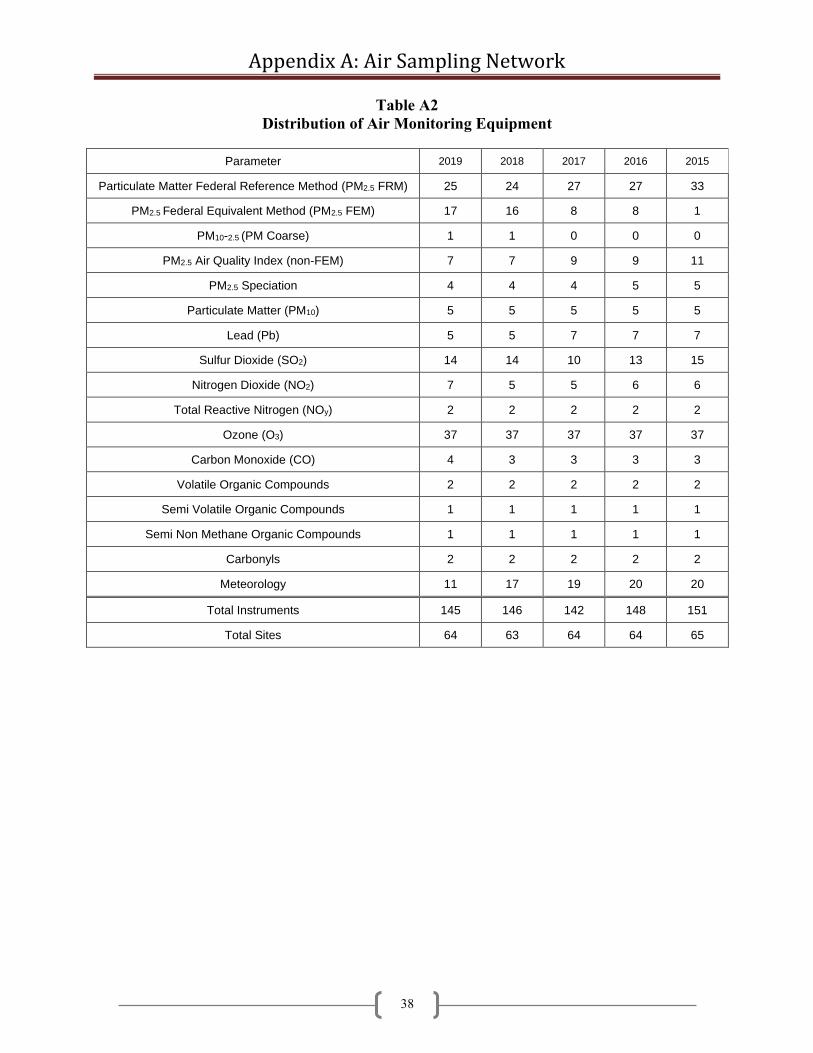
In accordance with USEPA air quality monitoring requirements as set forth in Title 40 of the Code of Federal Regulations, Part 58 (40 CFR 58), five types of monitoring stations are used to collect ambient air data. These include State and Local Air Monitoring Stations (SLAMS), National Air Monitoring Stations (NAMS), Photochemical Assessment Monitoring Stations (PAMS), Special Purpose Monitoring Stations (SPMS), and National Core Monitoring Stations (NCore). The types of stations are distinguished from one another on the basis of the general monitoring objectives they are designed to meet. The SLAMS, NAMS, PAMS, SPMS, and NCORE designations for the sites operated within the State of Illinois are provided in the Annual Network Plan, which can be found at epa.state.il.us/air/monitoring/index.html. All of the industrial sites are considered to be SPMS. Table A2 is a summary of the distribution of pollutants through the years along with the total number of instruments and the total number of sites. The site directory is listed in Table A3 and the monitoring directory is listed in Table A4

Table A1 2019 Noncontinuous Sampling Schedule
35
JANUARY
S M T W R F S
1 2 3 4 5
6 7 8 9 10 11 12
13 14 15 16 17 18 19
20 21 22 23 24 25 26
27 28 29 30 31
APRIL
S M T W R F S
1 2 3 4 5 6
7 8 9 10 11 12 13
14 15 16 17 18 19 20
21 22 23 24 25 26 27
28 29 30
JULY
S M T W R F S
1 2 3 4 5 6
7 8 9 10 11 12 13
14 15 16 17 18 19 20
21 22 23 24 25 26 27
28 29 30 31
OCTOBER
S M T W R F S
1 2 3 4 5
6 7 8 9 10 11 12
13 14 15 16 17 18 19
20 21 22 23 24 25 26
27 28 29 30 31
FEBRUARY
S M T W R F S
1 2
3 4 5 6 7 8 9
10 11 12 13 14 15 16
17 18 19 20 21 22 23
24 25 26 27 28
MAY
S M T W R F S
1 2 3 4
5 6 7 8 9 10 11
12 13 14 15 16 17 18
19 20 21 22 23 24 25
26 27 28 29 30 31
AUGUST
S M T W R F S
1 2 3
4 5 6 7 8 9 10
11 12 13 14 15 16 17
18 19 20 21 22 23 24
25 26 27 28 29 30 31
NOVEMBER
S M T W R F S
1 2
3 4 5 6 7 8 9
10 11 12 13 14 15 16
17 18 19 20 21 22 23
24 25 26 27 28 29 30
MARCH
S M T W R F S
1 2
3 4 5 6 7 8 9
10 11 12 13 14 15 16
17 18 19 20 21 22 23
24 25 26 27 28 29 30
31
JUNE
S M T W R F S
1
2 3 4 5 6 7 8
9 10 11 12 13 14 15
16 17 18 19 20 21 22
23 24 25 26 27 28 29
30
SEPTEMBER
S M T W R F S
1 2 3 4 5 6 7
8 9 10 11 12 13 14
15 16 17 18 19 20 21
22 23 24 25 26 27 28
29 30
DECEMBER
S M T W R F S
1 2 3 4 5 6 7
8 9 10 11 12 13 14
15 16 17 18 19 20 21
22 23 24 25 26 27 28
29 30 31
13 Every 6 Day Sampling Schedule 22 Every 3 Day Sampling Schedule

Appendix A: Air Sampling Network
36
1. State/Local Air Monitoring Station (SLAMS) Network - The SLAMS network is designed to meet a minimum of four basis monitoring objectives:
a. To determine the highest concentrations expected to occur in the area covered by
the network. b. To determine representative concentrations in areas of high population density. c. To determine the air quality impact of significant sources or source categories. d. To determine general background concentration levels. 2. National Air Monitoring Station (NAMS) Network - The NAMS network is a subset
of stations selected from the SLAMS network with emphasis given to urban and multisource areas. The primary objectives of the NAMS network are:
a. To measure expected maximum concentrations.
b. To measure concentrations in areas where poor air quality is combined with high population exposure.
c. To provide data useable for the determination of national trends. d. To provide data necessary to allow the development of nationwide control
strategies. 3. Photochemical Assessment Monitoring Station (PAMS) Network - The PAMS
network is required in serious, severe, and extreme ozone nonattainment areas to obtain detailed data for ozone, precursors (NOx and VOC), and meteorology. NOX and VOC sampling is required for the period June - August each year. Ozone sampling occurs during the ozone season, March - October. Network design is based on four monitoring types. In Illinois, PAMS are required in the Chicago metropolitan area only.
a. Type 1 sites are located upwind of the nonattainment area and are located to measure
background levels of ozone and precursors coming into the area b. Type 2 sites are located slightly downwind of the major source areas of ozone
precursors. c. Type 3 sites are located at the area of maximum ozone concentrations. d. Type 4 sites are located at the domain edge of the nonattainment area and measure
ozone and precursors leaving the area. 4. Special Purpose Monitoring Station (SPMS) Network - Any monitoring site that is not
a designated SLAMS or NAMS is considered a special purpose monitoring station. Some of the SPMS network objectives are as follows:
a. To provide data as a supplement to stations used in developing local control
strategies, including enforcement actions.

Appendix A: Air Sampling Network
37
b. To verify the maintenance of ambient standards in areas not covered by the SLAMS/NAMS network.
c. To provide data on non-criteria pollutants. 5. National Core Station (NCore) Network - NCore is a multi-pollutant network that
integrates several advanced measurement systems. In Illinois, Northbrook and Bondville are considered NCore sites. A few of the NCore network objectives are as follows:
a. Support for development of emission strategies and accountability of emission
strategy progress through tracking long-term trends of pollutants and their precursors. b. Support of long-term health assessments that contribute to review of national
standards.
c. Support to scientific studies ranging across technological, health, and atmospheric process disciplines.
d. Support to ecosystem assessments recognizing that national air quality networks
benefit ecosystems assessments.
Appendix A: Air Sampling Network
38
Table A2
Distribution of Air Monitoring Equipment
Parameter 2019 2018 2017 2016 2015
Particulate Matter Federal Reference Method (PM2.5 FRM) 25 24 27 27 33
PM2.5 Federal Equivalent Method (PM2.5 FEM) 17 16 8 8 1
PM10-2.5 (PM Coarse) 1 1 0 0 0
PM2.5 Air Quality Index (non-FEM) 7 7 9 9 11
PM2.5 Speciation 4 4 4 5 5
Particulate Matter (PM10) 5 5 5 5 5
Lead (Pb) 5 5 7 7 7
Sulfur Dioxide (SO2) 14 14 10 13 15
Nitrogen Dioxide (NO2) 7 5 5 6 6
Total Reactive Nitrogen (NOy) 2 2 2 2 2
Ozone (O3) 37 37 37 37 37
Carbon Monoxide (CO) 4 3 3 3 3
Volatile Organic Compounds 2 2 2 2 2
Semi Volatile Organic Compounds 1 1 1 1 1
Semi Non Methane Organic Compounds 1 1 1 1 1
Carbonyls 2 2 2 2 2
Meteorology 11 17 19 20 20
Total Instruments 145 146 142 148 151
Total Sites 64 63 64 64 65

Appendix A: Air Sampling Network
39

Table A3 Site Directory
40
Site Map ID
AQS ID County City Address Latitude
Longitude Owner /
Operator
1 17-001-0007 Adams Quincy John Wood Comm. College
1301 South 48th St. +39.91540937 -91.33586832
IL EPA
2 17-019-1001 Champaign Bondville State Water Survey
Township Rd. 500 E. +40.052780 -88.372510
IL EPA/US EPA
3 17-019-0006 Champaign Champaign Ameren Substation
904 N. Walnut +40.1237962 -88.229531
IL EPA
4 17-019-0007 Champaign Thomasboro North Thomas St. +40.244913 -88.188519
IL EPA
5 17-023-0001 Clark West Union 416 S. State Highway 1
& West Union +39.210883 -87.668416
Indiana DEP
6 17-031-0001 Cook Alsip Village Garage
4500 W. 123rd St. +41.6709919 -87.7324569
CCDES
7 17-031-0076 Cook Chicago Com Ed Maintenance Bldg.
7801 Lawndale +41.75139998 -87.71348815
CCDES
8 17-031-0219 Cook Chicago Kennedy Near-road #2
Kennedy Expy. & W. Webster Ave. +41.920681 -87.674425
IL EPA
9 17-031-0052 Cook Chicago Mayfair Pump Station
4850 Wilson Ave. +41.96548483 -87.74992806
CCDES
10 17-031-0110 Cook Chicago Perez Elementary School
1241 19th St. +41.855771 -87.657932
CCDES
11 17-031-0032 Cook Chicago South Water Filtration Plant
3300 E. Cheltenham Pl. +41.75583241 -87.54534967
CCDES
12 17-031-0057 Cook Chicago Springfield Pump Station 1745 N. Springfield Ave.
+41.912739 -87.722673
CCDES
13 17-031-1003 Cook Chicago Taft High School
6545 W. Hurlbut St +41.98433233 -87.7920017
CCDES
14 17-031-0022 Cook Chicago Washington High School
3535 E. 114th St. +41.68716544 -87.53931548
CCDES
15 17-031-4002 Cook Cicero Cook County Trailer
1820 S. 51st Ave +41.85524313 -87.7524697
CCDES
16 17-031-6005 Cook Cicero Liberty School
13th St. & 50th Ave. +41.86442642 -87.74890238
CCDES
17 17-031-4007 Cook Des Plaines Regional Office Building
9511 W. Harrison St +42.06028469 -87.86322543
IL EPA
18 17-031-7002 Cook Evanston Water Pumping Station
531 E. Lincoln +42.062053 -87.675254
IL EPA
19 17-031-0119 Cook Lansing Kingery Near-road #1
Kingery Expy. & Torrence Ave. +41.578603 -87.557392
IL EPA
20 17-031-1601 Cook Lemont Cook County Trailer
729 Houston +41.66812034 -87.99056969
CCDES
21 17-031-1016 Cook Lyons
Township Village Hall
50th St & Glencoe +41.801180 -87.832349
IL EPA
22 17-031-4201 Cook Northbrook Northbrook Water Plant
750 Dundee Rd. +42.13999619 -87.79922692
IL EPA
23 17-031-3103 Cook Schiller Park IEPA Trailer
4743 Mannheim Rd. +41.96519348 -87.87626473
IL EPA
24 17-031-3301 Cook Summit Graves Elementary School
60th St. & 74th Ave. +41.78276601 -87.80537679
CCDES

Table A3 Site Directory
41
Site Map ID
AQS ID County City Address Latitude
Longitude Owner /
Operator
25 17-043-6001 DuPage Lisle Morton Arboretum
Route 53 +41.81304939 -88.0728269
IL EPA
26 17-043-4002 DuPage Naperville City Hall
400 S. Eagle St. +41.77107094 -88.15253365
IL EPA
27 17-049-1001 Effingham Effingham Central Grade School 10421 N. US Hwy. 45
+39.06715932 -88.54893401
IL EPA
28 17-065-0002 Hamilton Knight Prairie
Ten Mile Creek DNR Office State Route 14
+38.08215516 -88.6249434
IL EPA
29 17-083-0117 Jerseyville Jerseyville 21965 Maple Summit Rd. +39.101439 -90.344494
IL EPA
30 17-085-9991 Jo Daviess Stockton 10952 E. Parker Rd. +42.2869 -89.9997
US EPA
31 17-089-0007 Kane Aurora Health Department 1240 N. Highland
+41.78471651 -88.32937361
IL EPA
32 17-089-0005 Kane Elgin Larsen Junior High School
665 Dundee Rd. +42.04914776 -88.27302929
IL EPA
33 17-089-0003 Kane Elgin McKinley School
258 Lovell St. +42.050403
-88.28001471 IL EPA
34 17-097-1007 Lake Zion Camp Logan
Illinois Beach State Park +42.4675733 -87.81004705
IL EPA
35 17-099-0007 La Salle Oglesby 308 Portland Ave. +41.29301454 -89.04942498
IL EPA
36 17-115-0013 Macon Decatur IEPA Trailer
2200 N. 22nd +39.866933 -88.925452
IL EPA
37 17-115-0117 Macon Decatur ADM
2550 N. Brush College Rd. +39.880404 -88.894488
ERM Inc.
38 17-115-0217 Macon Decatur Tate & Lyle North
899 N. Folk St. +39.850712 -88.933635
ERM Inc.
39 17-115-0317 Macon Decatur Tate & Lyle South
2200 E. El Dorado St. +39.846856 -88.923323
ERM Inc.
40 17-117-0002 Macoupin Nilwood IEPA Trailer
Heaton & Dubois +39.39607533 -89.80973892
IL EPA
41 17-119-0008 Madison Alton Clara Barton School
409 Main St. +38.89018605 -90.14803114
IL EPA
42 17-119-2009 Madison Alton SIU Dental Clinic 1700 Annex St.
+38.90308534 -90.14316803
IL EPA
43 17-119-0010 Madison Granite City Air Products
15th & Madison +38.69443831 -90.15395426
IL EPA
44 17-119-1007 Madison Granite City Fire Station #1 23rd & Madison
+38.70453426 -90.13967484
IL EPA
45 17-119-0024 Madison Granite City Gateway Medical Center
2100 Madison Ave. +38.7006315 -90.14476267
IL EPA
46 17-119-9991 Madison Highland 5403 State Rd. 160 +38.8690 -89.6228
US EPA
47 17-119-1009 Madison Maryville Southwest Cable TV
200 W. Division +38.72657262 -89.95996251
IL EPA
48 17-119-3007 Madison Wood River Water Treatment Plant
54 N. Walcott +38.86066947 -90.10585111
IL EPA
49 17-111-0001 McHenry Cary Cary Grove High School 1st St. & Three Oaks Rd.
+42.22144166 -88.24220734
IL EPA

Table A3 Site Directory
42
Site Map ID
AQS ID County City Address Latitude
Longitude Owner /
Operator
50 17-113-2003 McLean Normal ISU Physical Plant
Main & Gregory +40.51873537 -88.99689571
IL EPA
51 17-143-0037 Peoria Peoria City Office Building 613 N.E. Jefferson
+40.697326 -89.584084
IL EPA
52 17-143-0024 Peoria Peoria Fire Station #8
MacArthur & Hurlburt +40.68742038 -89.60694277
IL EPA
53 17-143-1001 Peoria Peoria Heights
Peoria Heights High School 508 E. Glen Ave.
+40.74550393 -89.58586902
IL EPA
54 17-157-0001 Randolph Houston IEPA Trailer
Hickory Grove & Fallview +38.17627761 -89.78845862
IL EPA
55 17-161-3002 Rock Island Rock Island Rock Island Arsenal
32 Rodman Ave. +41.51472697 -90.51735026
IL EPA
56 17-167-0012 Sangamon Springfield Agricultural Building State Fair Grounds
+39.83192087 -89.64416359
IL EPA
57 17-167-0014 Sangamon Springfield Illinois Building
State Fair Grounds +39.831522 -89.640926
IL EPA
58 17-163-0010 St. Clair East St. Louis
RAPS Trailer 13th & Tudor
+38.61203448 -90.16047663
IL EPA
59 17-179-0004 Tazewell Pekin Fire Station #3
272 Derby +40.55643203 -89.65402083
IL EPA
60 17-185-0001 Wabash Mount Carmel
Division St. +38.397276 -87.773631
Indiana DEP
61 17-197-1011 Will Braidwood Com Ed Training Center
36400 S. Essex Rd. +41.22153707 -88.19096718
IL EPA
62 17-197-1002 Will Joliet Pershing Elementary School
Midland & Campbell Sts. +41.52688509 -88.11647381
IL EPA
63 17-201-2001 Winnebago Loves Park Maple Elementary School
1405 Maple Ave. +42.33498222 -89.0377748
IL EPA
64 17-201-0118 Winnebago Rockford Fire Department
204 S. 1st St. +42.2670002 -89.089170
IL EPA

Table A4 Monitoring Directory
43
AQS ID City
CO
NO
y
NO
2
Ozo
ne
PM
10
PM
Co
ars
e
PM
2.5
FR
M
PM
2.5
FE
M
PM
2.5
AQ
I
PM
2.5
Sp
ecia
tio
n
SO
2
VO
C
To
xic
s
TS
P P
b, M
eta
ls
Me
teo
rolo
gic
al
17-001-0007 Quincy
17-019-0006 Champaign N. Walnut
17-019-0007 Thomasboro
17-019-1001 Bondville T T
17-023-0001 West Union
17-031-0001 Alsip
17-031-0022 Chicago
Washington High School
C
17-031-0032 Chicago South Water Filtration
17-031-0052 Chicago Mayfair Pump Station
17-031-0057 Chicago
Springfield Pump Station
17-031-0076 Chicago Com Ed Maintenance
17-031-0110 Chicago Perez Elementary
17-031-0119 Lansing Kingery near-road #1
17-031-0219 Chicago Kennedy near-road #2
17-031-1003 Chicago Taft High School
17-031-1016 Lyons Township C
17-031-1601 Lemont
17-031-3103 Schiller Park
17-031-3301 Summit
17-031-4002 Cicero Cook County Trailer
Active Monitor
Site/Monitor Installed
Site/Monitor Removed
C = Continuous PM10, T = Trace level

Table A4 Monitoring Directory
44
AQS ID City
CO
NO
y
NO
2
Ozo
ne
PM
10
PM
Co
ars
e
PM
2.5
FR
M
PM
2.5
FE
M
PM
2.5
AQ
I
PM
2.5
Sp
ecia
tio
n
SO
2
VO
C
To
xic
s
TS
P P
b, M
eta
ls
Me
teo
rolo
gic
al
17-031-4007 Des Plaines
17-031-4201 Northbrook T T
17-031-6005 Cicero Liberty School
17-031-7002 Evanston
17-043-4002 Naperville
17-043-6001 Lisle
17-049-1001 Effingham
17-065-0002 Knight Prairie
17-083-0117 Jerseyville
17-085-9991 Stockton
17-089-0003 Elgin McKinley School
17-089-0005 Elgin
Larsen Jr. High School
17-089-0007 Aurora
17-097-1007 Zion
17-099-0007 Oglesby
17-111-0001 Cary
17-113-2003 Normal
17-115-0013 Decatur IEPA Trailer
17-115-0117 Decatur ADM
17-115-0217 Decatur Tate & Lyle North
Active Monitor
Site/Monitor Installed
Site/Monitor Removed
T = Trace level

Table A4 Monitoring Directory
45
AQS ID City
CO
NO
y
NO
2
Ozo
ne
PM
10
PM
Co
ars
e
PM
2.5
FR
M
PM
2.5
FE
M
PM
2.5
AQ
I
PM
2.5
Sp
ecia
tio
n
SO
2
VO
C
To
xic
s
TS
P P
b, M
eta
ls
Me
teo
rolo
gic
al
17-115-0317 Decatur Tate & Lyle South
17-117-0002 Nilwood
17-119-0008 Alton
Clara Barton Elementary
17-119-2009 Alton SIU Dental Clinic
17-119-0010 Granite City Air Products
17-119-0024 Granite City
Gateway Medical Center
17-119-1007 Granite City Fire Station #1
17-119-1009 Maryville
17-119-3007 Wood River
17-119-9991 Highland
17-143-0024 Peoria Fire Station #8
17-143-0037 Peoria City Office Building
17-143-1001 Peoria Heights
17-157-0001 Houston
17-161-3002 Rock Island
17-163-0010 East St. Louis
17-167-0012 Springfield Agricultural Building
17-167-0014 Springfield Illinois Building
17-179-0004 Pekin
17-185-0001 Mount Carmel
Active Monitor
Site/Monitor Installed
Site/Monitor Removed

Table A4 Monitoring Directory
46
AQS ID City
CO
NO
y
NO
2
Ozo
ne
PM
10
PM
Co
ars
e
PM
2.5
FR
M
PM
2.5
FE
M
PM
2.5
AQ
I
PM
2.5
Sp
ecia
tio
n
SO
2
VO
C
To
xic
s
TS
P P
b, M
eta
ls
Me
teo
rolo
gic
al
17-197-1002 Joliet Pershing Elementary
17-197-1011 Braidwood
17-201-0118 Rockford Fire Department
17-201-2001 Loves Park
Active Monitor
Site/Monitor Installed
Site/Monitor Removed
Appendix B: Air Quality Data Summary Tables
47
Air Quality Data Interpretation
In order to provide a uniform procedure for determining whether a sufficient amount of air quality data has been collected by a sensor in a given time period (year, quarter, month, day, etc.) to accurately represent air quality during that time period, a minimum statistical selection criteria was developed. In order to calculate an annual average for non-continuous parameters, a minimum of 75% of the data that was scheduled to be collected must be available, i.e., 45 samples per year for an every-six-day schedule (total possible of 60 or 61 samples). Additionally, in order to have proper quarterly balance, each site on an every sixth day schedule should have at least 10 samples per calendar quarter. This provides for a 20% balance in each quarter if the minimum required annual sampling is achieved. PM10 and PM2.5 samplers operate on one of three sampling frequencies:
• Every-day sampling (68 samples required each quarter for 75% data capture)
• Every-third-day sampling (23 samples required each quarter for 75% data capture)
• Every-six-day sampling (12 samples required each quarter for 75% data capture).
To calculate an annual PM10 or PM2.5 mean, arithmetic means are calculated for each quarter in which valid data is recorded in at least 75% of the possible sampling periods. The annual mean is then the arithmetic average of the four quarterly means. To determine an annual average for continuous data 75% of the total possible yearly observations are necessary, i.e., a minimum of 6570 hours (75% of the hours available) are needed. In order to provide a balance between the respective quarters, each quarter should have at least 1300 hours which is 20% of the 75% minimum annual requirement. To calculate
quarterly averages at sites which do not meet the annual criteria, 75% of the total possible observations in a quarter are needed, i.e., a minimum of 1647 hours of 2200 hours available. Monthly averages also require 75% of the total possible observations in a month, i.e., 540 hours as a minimum. Additionally, for short-term running averages (24-hour, 8-hour, and 3-hour) 75% of the data during the particular time period is needed, i.e., 18 hours for a 24-hour average, six hours for an 8-hour average and three hours for a 3-hour average. For ozone, a valid 8-hour average has at least six valid 1-hour averages within the 8-hour period. The daily maximum 8-hour ozone concentration is based on 17 consecutive moving 8-hour periods in each day, beginning with the 8-hour period from 7:00 a.m. to 3:00 p.m. and ending with the 8-hour period from 11:00 p.m. to 7:00 a.m. The daily maximum value is considered valid if 8-hour averages are available for at least 13 of the 17 consecutive moving 8-hour periods, or if the daily maximum value is greater than the level of the NAAQS. Complete sampling over a three-year period requires an average of 90% valid days with each year having at least 75% valid days. Data listed as not meeting the minimum statistical selection criteria in this report were so noted after evaluation using the criteria above. Although short term averages (3, 8, 24 hours) have been computed for certain sites not meeting the annual criteria, these averages may not be representative of an entire year's air quality. In certain circumstances where even the 75% criteria is met, the number and/or magnitude of short-term averages may not be directly comparable from one year to the next because of seasonal distributional differences. For summary purposes, the data is expressed in the number of figures to which the raw data is validated. Extra figures may be carried in the averaging technique, but the result is rounded to the appropriate number of figures. For example, the values 9, 9, and 10 are

Appendix B: Air Quality Data Summary Tables
48
averaged to give 9; whereas the values 9.0, 9.0, and 10.0 are averaged to 9.3. The raw data itself should not be expressed to more significant figures than the sensitivity of the monitoring methodology allows. In comparing data to the various air quality standards, the data are implicitly rounded to the number of significant figures specified by that standard. For example, to exceed the 0.15 ug/m3 three-month lead standard, a three-month average value must be 0.155 ug/m3 or higher; to exceed the 9 ppm CO 8-hour standard, an 8-hour average must be 9.5 ppm or higher. Peak averages, though, will be expressed to the number of significant figures appropriate to that monitoring methodology. The NAAQS for CO has a short-term standard for ambient air concentrations not to be exceeded more than once per year. SO2 has a 1-hour standard which is the three-year average of each year’s 99th percentile values. NO2 has a 1-hour standard which is the three-year average of each year’s 98th percentile values. PM10 has a 24-hour standard which cannot average more than one exceedance over a three-year period (in three years). PM2.5 has a 24-hour standard which is a three-year average of each year's 98th percentile values. In the case of ozone, the 8-hour standard is concentration-based and as such is the average of the fourth highest value each year over a three-year period. The standards are promulgated in this manner in order to protect the public from excessive levels of pollution both in terms of acute and chronic health effects.
The following data tables detail and summarize air quality in Illinois. The tables of short-term exceedances list those sites which exceeded any of the short-term primary standards (24 hours or less). The detailed data tables list averages and peak concentrations for all monitoring sites in Illinois.
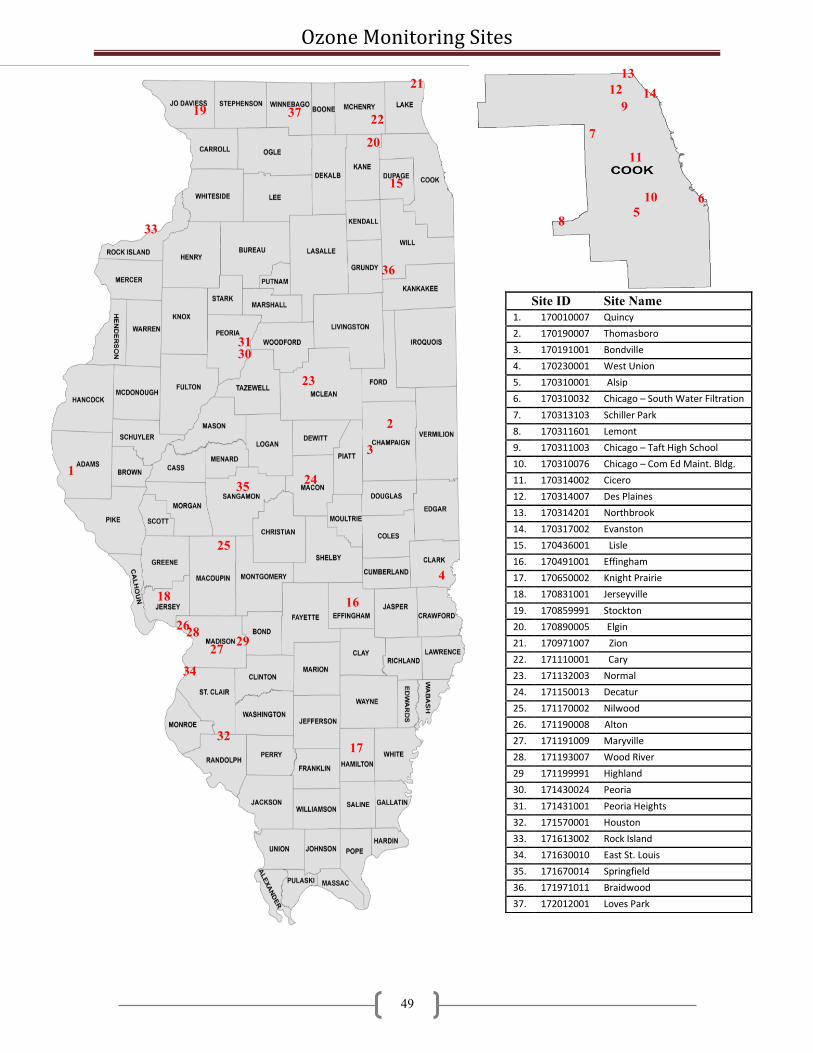
Ozone Monitoring Sites
49
Site ID Site Name
1. 170010007 Quincy
2. 170190007 Thomasboro
3. 170191001 Bondville
4. 170230001 West Union
5. 170310001 Alsip
6. 170310032 Chicago – South Water Filtration
7. 170313103 Schiller Park
8. 170311601 Lemont
9. 170311003 Chicago – Taft High School
10. 170310076 Chicago – Com Ed Maint. Bldg.
11. 170314002 Cicero
12. 170314007 Des Plaines
13. 170314201 Northbrook
14. 170317002 Evanston
15. 170436001 Lisle
16. 170491001 Effingham
17. 170650002 Knight Prairie
18. 170831001 Jerseyville
19. 170859991 Stockton
20. 170890005 Elgin
21. 170971007 Zion
22. 171110001 Cary
23. 171132003 Normal
24. 171150013 Decatur
25. 171170002 Nilwood
26. 171190008 Alton
27. 171191009 Maryville
28. 171193007 Wood River
29 171199991 Highland
30. 171430024 Peoria
31. 171431001 Peoria Heights
32. 171570001 Houston
33. 171613002 Rock Island
34. 171630010 East St. Louis
35. 171670014 Springfield
36. 171971011 Braidwood
37. 172012001 Loves Park
13
34
10
11
7
15
20
22
36
37
30 31
33
23
35
2
24
25
16 18
26 28
27
32 17
12 14 9
6 5
8
3
4
19
29
21
1

Table B1 1-Hour Ozone Exceedances
50
EXCEEDANCES OF THE FORMER 1-HOUR PRIMARY STANDARD OF 0.12 PPM
Date City Concentration
None None None
Total Over 0.12 ppm 0
Total Days Over 0.12 ppm 0
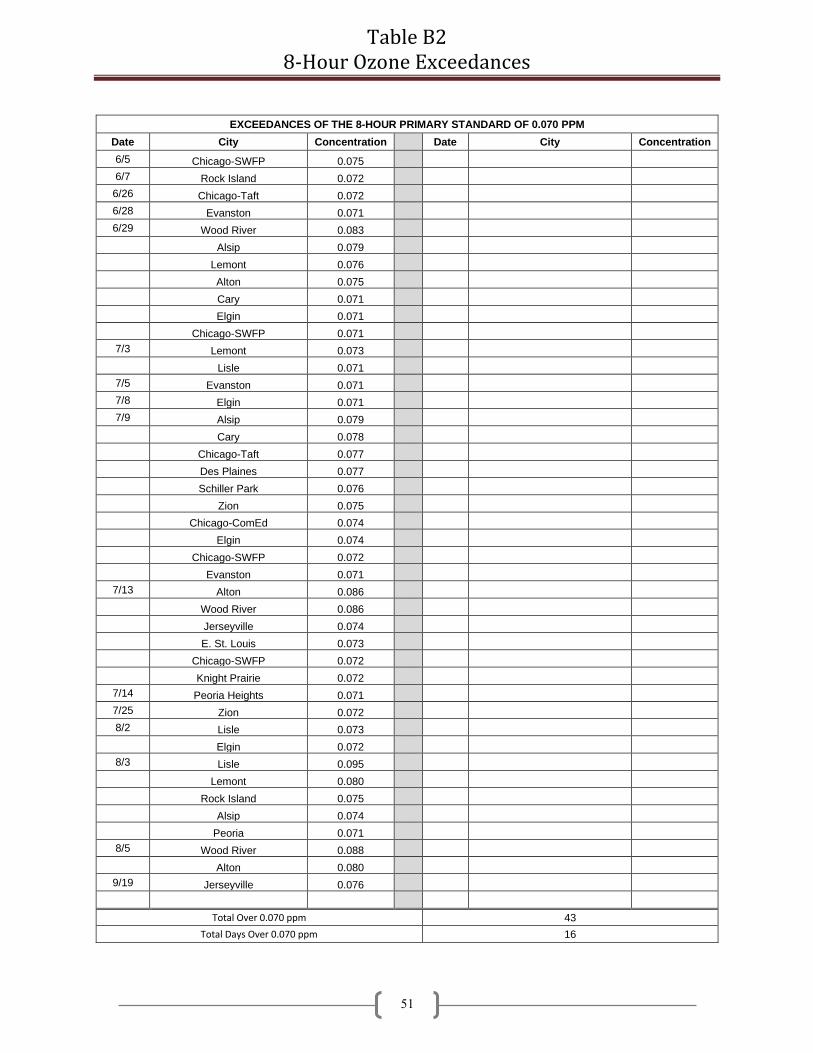
Table B2 8-Hour Ozone Exceedances
51
EXCEEDANCES OF THE 8-HOUR PRIMARY STANDARD OF 0.070 PPM
Date City Concentration Date City Concentration
6/5 Chicago-SWFP 0.075
6/7 Rock Island 0.072
6/26 Chicago-Taft 0.072
6/28 Evanston 0.071
6/29 Wood River 0.083
Alsip 0.079
Lemont 0.076
Alton 0.075
Cary 0.071
Elgin 0.071
Chicago-SWFP 0.071
7/3 Lemont 0.073
Lisle 0.071
7/5 Evanston 0.071
7/8 Elgin 0.071
7/9 Alsip 0.079
Cary 0.078
Chicago-Taft 0.077
Des Plaines 0.077
Schiller Park 0.076
Zion 0.075
Chicago-ComEd 0.074
Elgin 0.074
Chicago-SWFP 0.072
Evanston 0.071
7/13 Alton 0.086
Wood River 0.086
Jerseyville 0.074
E. St. Louis 0.073
Chicago-SWFP 0.072
Knight Prairie 0.072
7/14 Peoria Heights 0.071
7/25 Zion 0.072
8/2 Lisle 0.073
Elgin 0.072
8/3 Lisle 0.095
Lemont 0.080
Rock Island 0.075
Alsip 0.074
Peoria 0.071
8/5 Wood River 0.088
Alton 0.080
9/19 Jerseyville 0.076
Total Over 0.070 ppm 43
Total Days Over 0.070 ppm 16

Table B3 Ozone Highs
52
AQS ID City
Number Of Days 8-Hour Greater Than
0.070 ppm Fourth Highest Samples 1-Hour (ppm)
Fourth Highest Samples 8-Hour (ppm)
2019 2018 2017
17-001-0007 Quincy 0 0 1 0.074 0.068 0.068 0.067 0.068 0.066 0.064 0.062
17-019-0007 Thomasboro 0 4 0 0.079 0.073 0.070 0.069 0.070 0.068 0.066 0.062
17-019-1001 Bondville 0 1 1 0.065 0.065 0.063 0.063 0.062 0.060 0.059 0.058
17-023-0001 West Union 0 1 1 0.070 0.066 0.066 0.064 0.062 0.060 0.060 0.060
17-031-0001 Alsip 3 10 10 0.093 0.090 0.087 0.084 0.079 0.079 0.074 0.070
17-031-0032 Chicago
South Water Filtration
4 7 10 0.081 0.080 0.079 0.079 0.075 0.072 0.072 0.071
17-031-0076 Chicago
Com Ed Maintenance
1 8 11 0.082 0.081 0.080 0.074 0.074 0.069 0.066 0.065
17-031-1003 Chicago Taft High School
2 6 0 0.083 0.080 0.079 0.078 0.077 0.072 0.070 0.069
17-031-1601 Lemont 3 2 3 0.100 0.086 0.085 0.083 0.080 0.076 0.073 0.068
17-031-3103 Schiller Park 1 1 0 0.082 0.081 0.078 0.078 0.076 0.068 0.065 0.064
17-031-4002 Cicero Cook County Trailer
0 5 2 0.080 0.079 0.074 0.073 0.068 0.068 0.066 0.064
17-031-4007 Des Plaines 1 10 4 0.085 0.078 0.078 0.077 0.077 0.068 0.066 0.066
17-031-4201 Northbrook 0 10 3 0.082 0.079 0.077 0.075 0.070 0.070 0.069 0.069
17-031-7002 Evanston 3 12 9 0.083 0.079 0.079 0.077 0.071 0.071 0.071 0.069
17-043-6001 Lisle 3 6 2 0.112 0.086 0.084 0.084 0.095 0.073 0.071 0.070
17-049-1001 Effingham 0 1 3 0.075 0.071 0.069 0.069 0.065 0.065 0.065 0.063
17-065-0002 Knight Prairie 1 3 0 0.079 0.072 0.070 0.069 0.072 0.068 0.066 0.064
17-083-1001 Jerseyville 2 3 3 0.094 0.087 0.087 0.080 0.076 0.074 0.070 0.069
17-085-9991 Stockton 0 2 0 0.068 0.064 0.063 0.063 0.062 0.059 0.059 0.059
17-089-0005 Elgin
Larsen Jr. High School
4 5 1 0.082 0.082 0.080 0.077 0.074 0.072 0.071 0.071
17-097-1007 Zion 2 8 7 0.088 0.079 0.078 0.073 0.075 0.072 0.067 0.066
17-111-0001 Cary 2 8 3 0.084 0.082 0.079 0.078 0.078 0.071 0.070 0.070
17-113-2003 Normal 0 1 0 0.074 0.071 0.070 0.068 0.070 0.067 0.065 0.063
17-115-0013 Decatur IEPA Trailer
0 3 3 0.079 0.072 0.068 0.067 0.068 0.065 0.064 0.063
17-117-0002 Nilwood 0 3 0 0.076 0.074 0.073 0.070 0.066 0.064 0.063 0.063

Table B3 Ozone Highs
53
AQS ID City
Number Of Days 8-Hour Greater Than
0.070 ppm Fourth Highest Samples 1-Hour (ppm)
Fourth Highest Samples 8-Hour (ppm)
2019 2018 2017
17-119-0008 Alton Clara Barton School
3 5 2 0.098 0.097 0.084 0.077 0.086 0.080 0.075 0.067
17-119-1009 Maryville 0 6 7 0.081 0.075 0.074 0.074 0.070 0.068 0.064 0.064
17-119-3007 Wood River 3 4 3 0.108 0.095 0.090 0.084 0.088 0.086 0.083 0.070
17-119-9991 Highland 0 4 0 0.080 0.070 0.068 0.067 0.068 0.064 0.063 0.062
17-143-0024 Peoria Fire Station #8
1 2 3 0.076 0.073 0.069 0.067 0.071 0.067 0.065 0.062
17-143-1001 Peoria Heights 1 3 2 0.080 0.075 0.073 0.071 0.071 0.070 0.066 0.064
17-157-0001 Houston 0 1 1 0.076 0.076 0.068 0.067 0.069 0.065 0.061 0.060
17-161-3002 Rock Island 2 1 0 0.080 0.079 0.072 0.070 0.075 0.072 0.069 0.066
17-163-0010 East St. Louis 1 5 1 0.078 0.078 0.074 0.072 0.073 0.070 0.064 0.064
17-167-0014 Springfield 0 1 2 0.070 0.069 0.069 0.069 0.066 0.063 0.063 0.062
17-197-1011 Braidwood 0 4 0 0.079 0.072 0.069 0.068 0.065 0.063 0.062 0.060
17-201-2001 Loves Park 0 3 0 0.071 0.070 0.070 0.069 0.066 0.066 0.066 0.066
Statewide Average 0.082 0.077 0.075 0.073 0.072 0.069 0.067 0.065
Total Over 0.070 ppm 43 159 96
Total Days Over 0.070 ppm 16 26 27

Table B4 Ozone Design Values
54
AQS ID City
Fourth High 8-Hour Concentrations (ppm) Design Values* (ppm)
2019 2018 2017 2016 2015 2017-2019 2016-2018 2015-2017
17-001-0007 Quincy 0.062 0.063 0.065 0.061 0.064 0.063 0.063 0.063
17-019-0007 Thomasboro 0.062 0.072 0.067 0.066 0.062 0.067 0.068 0.065
17-019-1001 Bondville 0.058 0.064 0.067 0.066 0.065 0.063 0.065 0.066
17-023-0001 West Union 0.060 0.066 0.067 0.066 0.064 0.064 0.066 0.065
17-031-0001 Alsip 0.070 0.079 0.078 0.075 0.066 0.075 0.077 0.073
17-031-0032 Chicago South Water Filtration
0.071 0.076 0.074 0.077 0.066 0.073 0.075 0.072
17-031-0076 Chicago Com Ed Maintenance
0.065 0.074 0.078 0.075 0.065 0.072 0.075 0.072
17-031-1003 Chicago Taft High School
0.069 0.073 0.060 0.075 0.068 0.067 0.069 0.067
17-031-1601 Lemont 0.068 0.068 0.070 0.073 0.066 0.068 0.070 0.069
17-031-3103 Schiller Park 0.064 0.065 0.061 0.067 0.058 0.063 0.064 0.062
17-031-4002 Cicero Cook County Trailer
0.064 0.072 0.068 0.076 0.061 0.068 0.072 0.068
17-031-4007 Des Plaines 0.066 0.075 0.071 0.076 0.068 0.070 0.074 0.071
17-031-4201 Northbrook 0.069 0.083 0.070 0.079 0.068 0.074 0.077 0.072
17-031-7002 Evanston 0.069 0.084 0.073 0.076 0.070 0.075 0.077 0.073
17-043-6001 Lisle 0.070 0.071 0.069 0.074 0.067 0.070 0.071 0.070
17-049-1001 Effingham 0.063 0.066 0.070 0.066 0.064 0.066 0.067 0.066
17-065-0002 Knight Prairie 0.064 0.069 0.064 0.068 0.064 0.065 0.067 0.065
17-083-1001 Jerseyville 0.069 - 0.067 0.074 0.067 0.068 0.070 0.069
17-085-9991 Stockton 0.059 0.067 0.063 0.067 0.062 0.063 0.065 0.064
17-089-0005 Elgin Larsen Jr. High School
0.071 0.072 0.069 0.074 0.065 0.070 0.071 0.069
17-097-1007 Zion 0.066 0.074 0.074 0.077 0.070 0.071 0.075 0.073
17-111-0001 Cary 0.070 0.074 0.070 0.073 0.064 0.071 0.072 0.069
17-113-2003 Normal 0.063 0.068 0.064 0.065 0.063 0.065 0.065 0.064
17-115-0013 Decatur Illinois EPA Trailer
0.063 0.069 0.068 0.066 0.066 0.066 0.067 0.066
17-117-0002 Nilwood 0.063 0.066 0.066 0.067 0.064 0.065 0.066 0.065

Table B4 Ozone Design Values
55
AQS ID City
Fourth High 8-Hour Concentrations (ppm) Design Values* (ppm)
2019 2018 2017 2016 2015 2017-2019 2016-2018 2015-2017
17-119-0008 Alton Clara Barton Elementary
0.067 0.072 0.066 0.073 0.069 0.068 0.070 0.069
17-119-1009 Maryville 0.064 0.075 0.074 0.067 0.064 0.071 0.072 0.068
17-119-3007 Wood River 0.070 0.072 0.067 0.075 0.069 0.069 0.071 0.070
17-119-9991 Highland 0.062 0.071 0.067 0.068 0.067 0.066 0.068 0.065
17-143-0024 Peoria Fire Station #8
0.062 0.069 0.065 0.068 0.060 0.065 0.067 0.064
17-143-1001 Peoria Heights 0.064 0.070 0.066 0.066 0.064 0.066 0.067 0.065
17-157-0001 Houston 0.060 0.065 0.069 0.066 0.065 0.064 0.066 0.066
17-161-3002 Rock Island 0.066 0.067 0.066 0.064 0.060 0.066 0.065 0.063
17-163-0010 East St. Louis 0.064 0.073 0.067 0.073 0.066 0.068 0.071 0.068
17-167-0014 Springfield State Fairgrounds
0.062 0.069 0.069 0.068 0.064 0.066 0.068 0.067
17-197-1011 Braidwood 0.060 0.071 0.068 0.064 0.064 0.066 0.067 0.065
17-201-2001 Loves Park 0.066 0.070 0.064 0.070 0.066 0.066 0.068 0.066
Statewide Average 0.065 0.071 0.068 0.070 0.065 0.068 0.069 0.067
*The design value is the three-year average of the fourth high concentration. Design value greater than 0.070 ppm is a violation of the National Ambient Air Quality Standard.

PM2.5 FRM and FEM Monitoring Sites
56
Site ID Site Name
1. 170190006 Champaign
2. 170191001 Bondville
3. 170310022 Chicago – Washington High School
4. 170310052 Chicago – Mayfair Pump Station
5. 170310057 Chicago – Springfield Pump Station
6. 170310076 Chicago – Com Ed Maint. Bldg.
7. 170310001 Alsip
8. 170310119 Lansing – Kingery near-road
9. 170311016 Lyons Township
10. 170313103 Schiller Park
10. 170313301 Summit
12. 170314007 Des Plaines
13. 170314201 Northbrook
14. 170316005 Cicero
15. 170434002 Naperville
16. 170650002 Knight Prairie
17. 170831001 Jerseyville
18. 170890003 Elgin
19. 170890007 Aurora
20. 171110001 Cary
21. 171132003 Normal
22. 171150013 Decatur
23. 171190024 Granite City – Gateway Medical
24. 171191007 Granite City – 23rd and Madison
25. 171192009 Alton
26. 171193007 Wood River
27. 171430037 Peoria
28. 171570001 Houston
29. 171613002 Rock Island
30. 171630010 East St. Louis
31. 171670012 Springfield
32. 171971002 Joliet
33. 171971011 Braidwood
34. 172010118 Rockford
29
18
20
14
33
11
12
7 3
6
4
9
10 5
1
2
34
19 15
32
21
27
22 31
16
17
25 26
23/24
30
28
13
8

Table B5 PM2.5 24-Hour Exceedances
57
EXCEEDANCES OF THE 24-HOUR PRIMARY STANDARD OF 35 ug/m3
Date Location Concentration (ug/m3)
7/8/19 Rockford 35.9
Total Over 35 ug/m3 1
Total Days Over 35 ug/m3 1

Table B6 PM2.5 Highs
58
AQS ID City Total
Samples
Samples Greater Than 35 ug/m3
Highest Samples
2019 2018 2017 1st 2nd 3rd 4th 5th 6th 7th 8th
17-019-0006 Champaign 95 0 0 0 20.1 19.9 19.8 18.5 17.5 15.9 14.8 14.4
17-019-1001 Bondville 354 0 0 0 22.7 22.2 20.5 20.4 19.4 19.0 18.7 18.7
17-031-0001 Alsip 53 0 0 0 17.1 16.0 14.2 14.0 13.6 13.1 11.8 11.7
17-031-0022 Chicago Washington High School
99 0 1 0 33.4 25.0 24.8 23.9 23.5 21.5 21.0 19.7
17-031-0052 Chicago
Mayfair Pump Station
110 0 0 0 33.2 29.6 24.7 24.7 23.0 18.7 18.2 18.0
17-031-0057 Chicago Springfield
Pump Station
56 0 0 0 26.7 18.6 16.5 15.9 14.1 14.0 13.3 13.1
17-031-0076 Chicago
Com Ed Maintenance
58 0 0 0 25.4 24.9 24.7 18.0 16.7 13.6 13.5 13.1
17-031-0119 Lansing
Kingery near-road #1
304 0 0 0 26.8 25.9 24.8 24.0 24.0 23.2 21.6 21.4
17-031-1016 Lyons
Township 116 0 0 0 29.7 27.3 25.8 25.6 23.4 20.8 18.7 18.3
17-031-3103 Schiller
Park 114 0 0 0 33.9 29.4 26.3 26.3 24.1 20.8 20.7 19.8
17-031-3301 Summit 115 0 0 0 30.7 25.1 19.3 18.6 17.7 17.5 17.2 17.1
17-031-4007 Des
Plaines 176 0 0 1 30.5 29.7 29.5 29.0 25.2 23.1 21.7 21.5
17-031-4201 Northbrook 359 0 0 1 29.3 27.3 27.0 22.6 21.9 21.8 21.3 20.7
17-031-6005 Cicero Liberty School
59 0 0 0 26.5 19.3 16.9 16.8 15.7 15.7 14.7 14.5
17-043-4002 Naperville 261 0 0 0 29.6 27.4 26.2 25.7 25.1 22.8 22.1 21.6
17-065-0002 Knight Prairie
339 0 0 0 23.0 20.3 20.1 19.4 19.1 18.6 17.3 17.3
17-083-0117 Jerseyville 320 0 0 0 20.6 19.6 18.9 18.8 17.8 17.7 16.9 16.7
17-089-0003 Elgin
McKinley School
113 0 0 0 27.3 25.4 24.9 22.1 21.7 19.4 18.3 18.0
17-089-0007 Aurora 106 0 0 0 30.2 26.3 24.5 20.5 20.5 20.3 20.2 17.7
17-111-0001 Cary 59 0 0 0 25.2 18.6 16.6 15.6 13.6 13.5 11.2 11.1
17-113-2003 Normal 360 0 0 0 25.0 23.8 22.9 22.2 22.0 21.0 21.0 20.6
17-115-0013 Decatur Illinois EPA
Trailer 360 0 0 0 25.7 23.6 23.4 23.1 22.6 21.2 21.1 20.4
17-119-0024 Granite City
Gateway Medical Center
112 0 1 0 24.7 28.0 25.0 22.4 20.2 20.0 19.4 18.8
17-119-1007 Granite City Fire Station #1
61 0 0 0 29.1 23.8 20.8 18.3 18.2 18.2 17.4 16.3
17-119-2009 Alton
SIU Dental Clinic
110 0 0 0 22.6 22.2 19.2 19.0 18.5 17.9 16.3 16.1
17-119-3007 Wood River 112 0 0 0 28.5 26.0 22.7 19.5 17.7 17.4 15.7 15.3
17-143-0037 Peoria 351 0 0 0 23.6 23.5 21.8 21.5 20.8 20.1 19.7 19.3
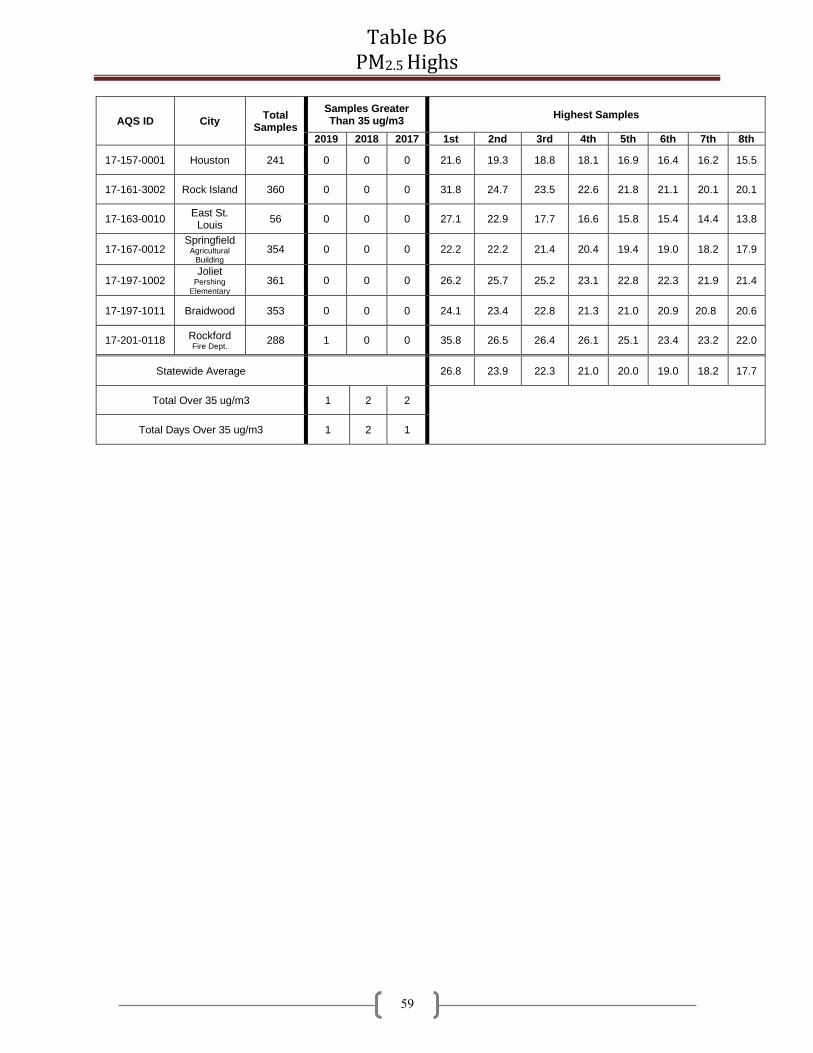
Table B6 PM2.5 Highs
59
AQS ID City Total
Samples
Samples Greater Than 35 ug/m3
Highest Samples
2019 2018 2017 1st 2nd 3rd 4th 5th 6th 7th 8th
17-157-0001 Houston 241 0 0 0 21.6 19.3 18.8 18.1 16.9 16.4 16.2 15.5
17-161-3002 Rock Island 360 0 0 0 31.8 24.7 23.5 22.6 21.8 21.1 20.1 20.1
17-163-0010 East St.
Louis 56 0 0 0 27.1 22.9 17.7 16.6 15.8 15.4 14.4 13.8
17-167-0012 Springfield
Agricultural Building
354 0 0 0 22.2 22.2 21.4 20.4 19.4 19.0 18.2 17.9
17-197-1002 Joliet
Pershing Elementary
361 0 0 0 26.2 25.7 25.2 23.1 22.8 22.3 21.9 21.4
17-197-1011 Braidwood 353 0 0 0 24.1 23.4 22.8 21.3 21.0 20.9 20.8 20.6
17-201-0118 Rockford Fire Dept.
288 1 0 0 35.8 26.5 26.4 26.1 25.1 23.4 23.2 22.0
Statewide Average 26.8 23.9 22.3 21.0 20.0 19.0 18.2 17.7
Total Over 35 ug/m3 1 2 2
Total Days Over 35 ug/m3 1 2 1

Table B7 PM2.5 24-Hour Design Values
60
AQS ID City
98th Percentile Concentrations (ug/m3) Design Values* (ug/m3)
2019 2018 2017 2016 2015 2017-2019 2016-2018 2015-2017
17-019-0006 Champaign 19.8 16.8 17.4 15.0 18.8 18.0 16.4 17.1
17-019-1001 Bondville 18.7 17.8 16.7 15.3 17.6 17.7 16.6 16.5
17-031-0001 Alsip 16.0 21.9 20.5 16.9 23.4 19.5 19.8 20.3
17-031-0022 Chicago Washington High School
24.8 27.0 18.3 17.7 24.8 23.4 21.0 20.3
17-031-0052 Chicago Mayfair Pump Station
24.7 25.2 23.3 17.9 24.0 24.4 22.1 21.7
17-031-0057 Chicago
Springfield Pump Station
18.6 25.3 20.9 17.5 37.1 21.6 21.2 25.2
17-031-0076 Chicago Com Ed Maintenance
24.9 17.8 23.0 19.0 24.7 21.9 19.9 22.2
17-031-0119 Lansing Kingery near-road #1
21.6 - - - - - - -
17-031-1016 Lyons Township 25.8 23.5 23.8 19.9 24.0 24.4 22.4 22.6
17-031-3103 Schiller Park 26.3 25.5 23.8 17.6 25.1 25.2 22.3 22.2
17-031-3301 Summit 19.3 22.5 25.1 17.0 27.1 22.3 21.5 23.1
17-031-4007 Des Plaines 29.0 25.7 22.9 18.9 25.3 25.9 22.5 22.4
17-031-4201 Northbrook 20.7 22.7 20.9 18.4 22.4 21.4 20.7 20.6
17-031-6005 Cicero Liberty School
19.3 22.8 23.6 18.8 30.1 21.9 21.7 24.2
17-043-4002 Naperville 22.8 23.6 22.0 14.8 22.5 22.8 20.1 19.8
17-065-0002 Knight Prairie 17.3 20.6 15.7 16.0 22.1 17.9 17.4 17.9
17-083-0117 Jerseyville 16.9 19.2 19.0 - 17.7 18.4 19.1 18.5
17-089-0003 Elgin McKinley School
24.9 19.5 20.5 15.7 19.6 21.6 18.6 18.6
17-089-0007 Aurora 24.5 21.3 19.8 17.4 18.8 21.9 19.5 18.7
17-111-0001 Cary 18.6 19.0 17.1 14.7 34.9 18.2 16.9 22.2
17-113-2003 Normal 20.6 19.5 18.5 16.3 18.3 19.5 18.1 17.7
17-115-0013 Decatur Illinois EPA Trailer
20.4 22.4 21.6 14.6 16.2 21.5 19.5 17.5
17-119-0024 Granite City Gateway Medical Center
25.0 20.9 16.9 24.7 24.8 20.9 20.8 22.1
17-119-1007 Granite City Fire Station #1
23.8 22.8 21.2 16.2 19.5 22.6 20.1 19.0
17-119-2009 Alton SIU Dental Clinic
19.2 21.8 18.9 20.3 19.0 20.0 20.3 19.4

Table B7 PM2.5 24-Hour Design Values
61
AQS ID City
98th Percentile Concentrations (ug/m3) Design Values* (ug/m3)
2019 2018 2017 2016 2015 2017-2019 2016-2018 2015-2017
17-119-3007 Wood River 22.7 22.2 17.6 20.7 23.0 20.8 20.2 20.4
17-143-0037 Peoria City Office Building
19.3 20.4 22.4 14.3 15.7 20.7 19.0 17.5
17-157-0001 Houston 16.9 19.1 17.7 18.4 17.3 17.9 19.9 17.8
17-161-3002 Rock Island 20.1 19.4 20.4 17.7 22.8 20.0 19.2 20.3
17-163-0010 East St. Louis 22.9 22.6 18.3 18.4 21.7 21.3 19.8 19.5
17-167-0012 Springfield Agricultural Building
17.9 19.8 20.6 19.1 21.0 19.4 19.8 20.2
17-197-1002 Joliet Pershing Elementary
21.4 20.9 19.6 16.6 19.6 20.6 19.0 18.6
17-197-1011 Braidwood 20.6 19.5 18.5 18.0 16.3 19.5 18.7 17.6
17-201-0118 Rockford Fire Department
23.4 10.6 - - - - - -
17-201-0013 Rockford Health Department
- 23.0 17.1 14.8 22.2 - 18.3 18.0
Statewide Average 21.4 21.3 20.1 17.5 22.3 21.0 19.8 20.0
*The design value is the three-year average of the 98th percentile concentration. Design value greater than or equal to 35.5 ug/m3 is a violation of the National Ambient Air Quality Standard.

Table B8 PM2.5 Annual Design Values
62
AQS ID City
Annual Arithmetic Mean Concentrations (ug/m3)
Design Values* (ug/m3)
2019 2018 2017 2016 2015 2017-2019 2016-2018 2015-2017
17-019-0006 Champaign 7.5 7.6 7.4 7.6 8.6 7.5 7.5 7.9
17-019-1001 Bondville 7.8 8.0 7.7 7.3 8.5 7.8 7.6 7.8
17-031-0001 Alsip 7.9 9.0 8.7 8.6 11.1 8.5 8.8 9.5
17-031-0022 Chicago Washington High School
10.3 9.6 8.4 8.4 11.0 9.4 8.8 9.3
17-031-0052 Chicago Mayfair Pump Station
9.2 9.8 8.7 8.7 10.0 9.2 9.1 9.1
17-031-0057 Chicago
Springfield Pump Station
8.8 9.6 8.9 9.2 12.5 9.1 9.2 10.2
17-031-0076 Chicago Com Ed Maintenance
8.3 9.0 8.4 9.0 11.1 8.6 8.8 9.5
17-031-0119 Lansing Kingery near-road #1
10.8 - - - - - - -
17-031-3103 Schiller Park 10.8 11.2 10.3 9.4 11.8 10.8 10.3 10.5
17-031-3301 Summit 9.3 10.2 8.9 9.1 11.0 9.5 9.4 9.7
17-031-4007 Des Plaines 10.3 11.4 9.3 8.9 9.9 10.3 9.9 9.4
17-031-4201 Northbrook 8.5 8.8 8.1 8.0 9.1 8.5 8.3 8.4
17-031-6005 Cicero Liberty School
9.0 10.0 8.6 8.9 12.5 9.2 9.2 10.0
17-043-4002 Naperville 10.3 10.5 8.2 7.8 9.0 9.7 8.8 8.3
17-065-0002 Knight Prairie 8.3 8.9 8.7 7.8 8.2 8.6 8.4 8.2
17-083-0117 Jerseyville 8.0 8.3 8.8 - 7.7 8.4 8.6 8.2
17-089-0003 Elgin McKinley School
8.5 8.7 8.0 7.9 8.9 8.4 8.2 8.3
17-089-0007 Aurora 8.7 9.0 8.1 8.0 8.9 8.6 8.4 8.3
17-111-0001 Cary 7.8 8.2 7.2 7.3 9.9 7.7 7.6 8.2
17-113-2003 Normal 9.2 9.7 8.8 7.6 7.6 9.5 8.7 8.0
17-115-0013 Decatur IEPA Trailer
9.5 10.4 8.7 7.8 8.7 9.5 9.0 8.4
17-119-1007 Granite City Fire Station #1
10.5 11.0 9.6 9.1 10.4 10.4 9.9 9.7
17-119-2009 Alton SIU Dental Clinic
9.1 9.3 8.7 8.8 9.0 9.0 8.9 8.8
17-119-3007 Wood River 9.1 9.2 8.3 8.7 9.1 8.9 8.7 8.7
17-143-0037 Peoria City Office Building
8.0 9.4 8.3 7.6 8.6 8.6 8.5 8.2

Table B8 PM2.5 Annual Design Values
63
AQS ID City
Annual Arithmetic Mean Concentrations (ug/m3)
Design Values* (ug/m3)
2019 2018 2017 2016 2015 2017-2019 2016-2018 2015-2017
17-157-0001 Houston 7.7 7.8 9.6 8.0 7.9 8.4 8.4 8.5
17-161-3002 Rock Island 8.6 8.9 7.9 7.2 9.1 8.5 8.0 8.1
17-163-0010 East St. Louis 9.1 10.3 8.8 10.0 10.7 9.4 9.7 9.8
17-167-0012 Springfield Agricultural Building
8.2 9.5 8.6 7.7 8.2 8.8 8.6 8.2
17-197-1002 Joliet Pershing Elementary
9.7 9.8 8.7 8.0 7.0 9.4 8.8 7.9
17-197-1011 Braidwood 8.8 7.9 7.8 7.5 8.4 8.2 7.7 7.9
17-201-0118 Rockford Fire Department
10.3 - - - - - - -
17-201-0013 Rockford Health Department
- 7.7 8.1 7.8 9.1 - 7.9 8.3
Statewide Average
9.0 9.3 8.5 8.2 9.5 9.0 8.7 8.8
*The design value is the three-year average of the annual arithmetic mean concentrations. Design value greater than 12.0 ug/m3 is a violation of the National Ambient Air Quality Standard. Shaded cells indicate completeness criteria were not met.
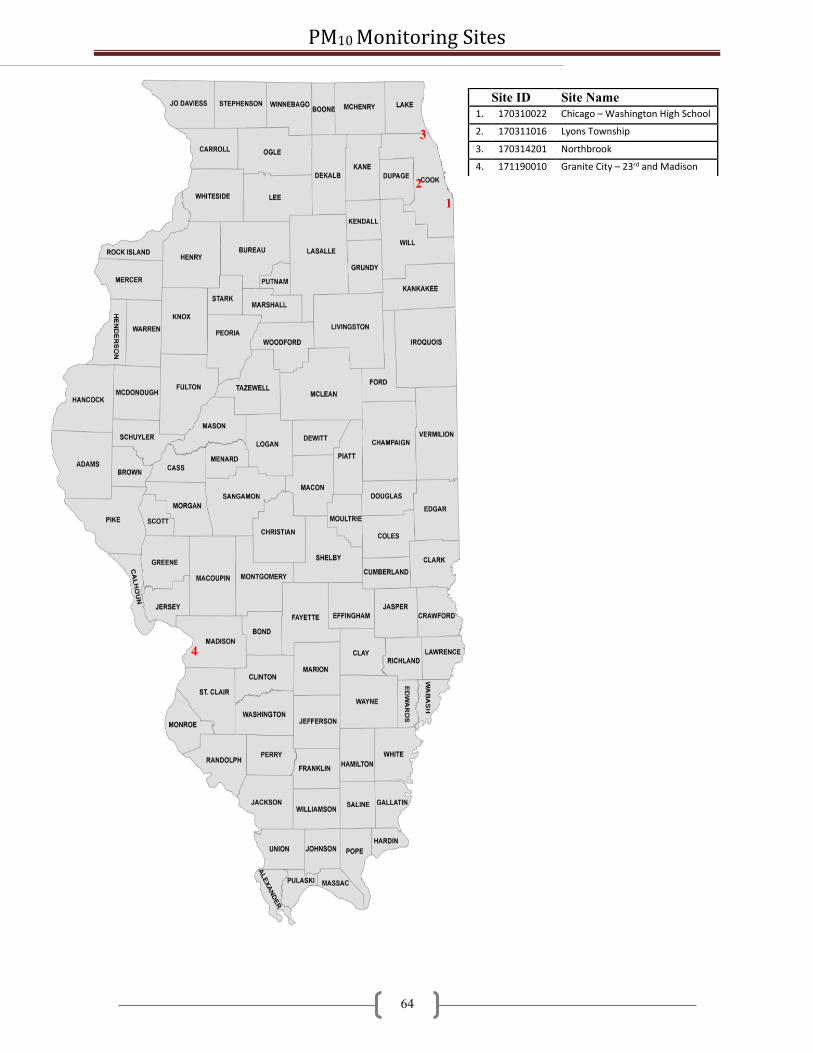
PM10 Monitoring Sites
64
Site ID Site Name
1. 170310022 Chicago – Washington High School
2. 170311016 Lyons Township
3. 170314201 Northbrook
4. 171190010 Granite City – 23rd and Madison
1
4
3
2

Table B9 PM10 24-Hour Exceedances
65
EXCEEDANCES OF THE 24-HOUR PRIMARY STANDARD OF 150 ug/m3
Date City Concentration (ug/m3)
None None None
Total Over 150 ug/m3 0
Total Days Over 150 ug/m3 0

Table B10 PM10 24-Hour Highs and Design Values
66
AQS ID City
To
tal
Sam
ple
s
Highest 24-Hour Samples Samples Greater Than
150 ug/m3 Three-year
Exceedance Average*
1st 2nd 3rd 4th 5th 6th 7th 8th 2019 2018 2017
17-031-0022 Chicago Washington High School
237 95 70 70 66 63 61 59 56 0 0 0 0.0
17-031-1016 Lyons
Township 270 82 70 69 66 66 62 60 60 0 0 0 0.0
17-031-4201 Northbrook 60 28 28 26 26 25 25 23 22 0 0 0 0.0
17-119-1007 Granite City Fire Station #1
59 104 99 99 76 68 62 56 54 0 0 0 0.0
Statewide Average 77 67 66 59 56 53 50 48
Total Over 150 ug/m3
0 0 0
Total Days Over 150 ug/m3 0 0 0
*The 24-hour PM10 standard is an exceedance-based standard set at 150 ug/m3. The level is not to be exceeded more than once per year on average over three years. Three-year averages more than one are a violation of the National Ambient Air Quality Standard.

Table B11 PM10 Annual Design Values
67
AQS ID City
Annual Arithmetic Mean Concentration (ug/m3) Design Values* (ug/m3)
2019 2018 2017 2016 2015 2017-2019 2016-2018 2015-2017
17-031-0022 Chicago
Washington High School
27 23 24 16 23 25 21 21
17-031-1016 Lyons
Township 30 24 25 27 36 26 25 29
17-031-4201 Northbrook 14 14 16 17 20 15 16 18
17-119-1007 Granite City Fire Station #1
35 33 26 28 30 31 29 28
Statewide Average 27 24 23 22 27 25 23 24
*The annual PM10 standard was revoked in 2007. Previously the standard was a three-year average of the annual means. Concentrations above 50 ug/m3 were a violation of the former National Ambient Air Quality Standard. Currently only the 24-hour PM10 standard is in place (see Table B10).
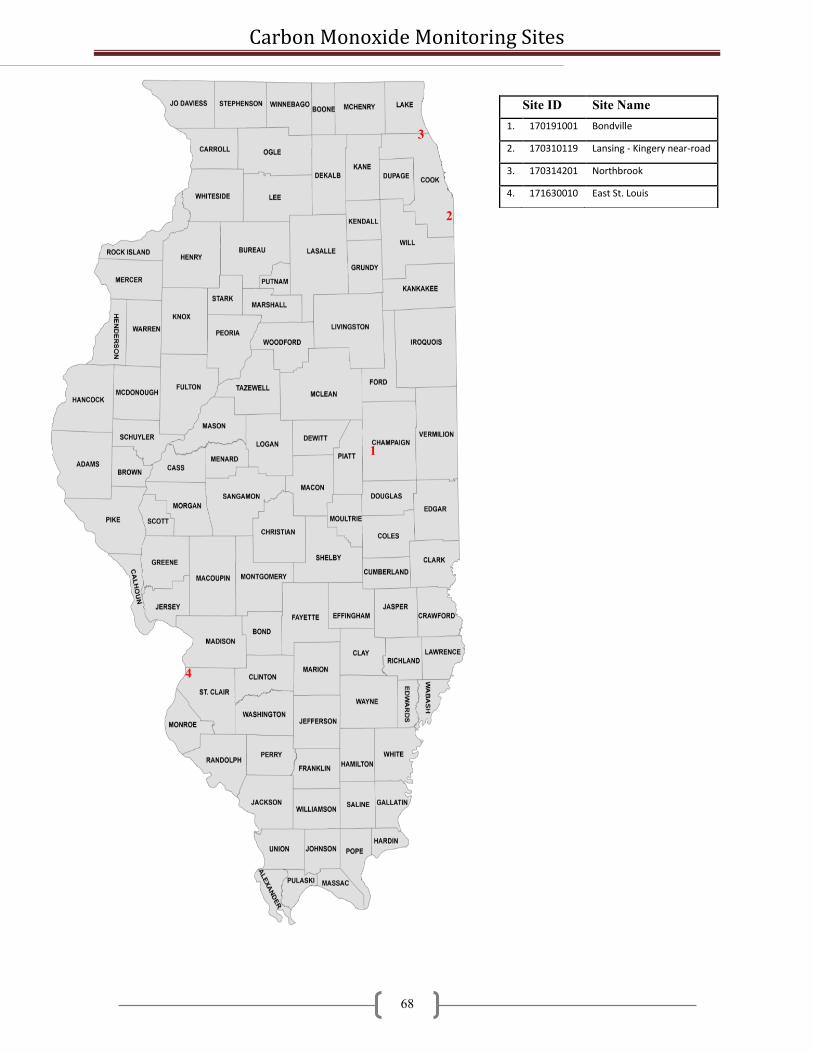
Carbon Monoxide Monitoring Sites
68
Site ID Site Name
1. 170191001 Bondville
2. 170310119 Lansing - Kingery near-road
3. 170314201 Northbrook
4. 171630010 East St. Louis
3
1
4
2

Table B12 Carbon Monoxide Exceedances
69
EXCEEDANCES OF EITHER THE 1-HOUR (35 PPM) OR 8-HOUR (9 PPM) PRIMARY STANDARDS
Date City Concentration Averaging Period
None None None None
Total 1-hour Over 35 ppm 0 Total 8-hour Over 9 ppm 0
Total Days 1-hour Over 35 ppm 0 Total Days 8-hour Over 9 ppm 0

Table B13 Carbon Monoxide Highs
70
AQS ID City Total Hourly
Samples Fourth Highest Daily Samples
1-Hour (ppm) Fourth Highest Samples
8-Hour (ppm)
17-019-1001 Bondville 618 0.17 0.14 0.14 0.10 0.1 0.1 0.1 0.1
17-031-0119 Lansing Kingery near-road #1
7025 3.1 2.7 2.3 2.2 1.8 1.5 1.2 1.2
17-031-4201 Northbrook 7668 1.55 1.20 1.10 1.08 0.9 0.9 0.8 0.7
17-163-0010 East St. Louis 5777 2.3 1.8 1.5 1.5 1.1 1.0 0.9 0.8
Statewide Average 1.78 1.46 1.26 1.22 0.98 0.88 0.75 0.70

Table B14 Carbon Monoxide 1-Hour and 8-Hour Design Values
71
AQS ID City
1-Hour Samples Greater than 35 (ppm) 8-Hour Samples Greater than 9 (ppm)
2019 2018 2017 2016 2015 2019 2018 2017 2016 2015
17-019-1001 Bondville 0 0 0 0 0 0 0 0 0 0
17-031-0119 Lansing Kingery near-road #1
0 - - - - 0 - - - -
17-031-4201 Northbrook 0 0 0 0 0 0 0 0 0 0
17-163-0010 East St. Louis 0 0 0 0 0 0 0 0 0 0
*The 1-hour and 8-hour carbon monoxide standard is an exceedance-based standard. The 1-hour standard is set at 35 ppm and is not to be exceeded more than once per year. The 8-hour standard is set at 9 ppm and is not to be exceeded more than once per year. More than one exceedance in a year is a violation of the National Ambient Air Quality Standard.
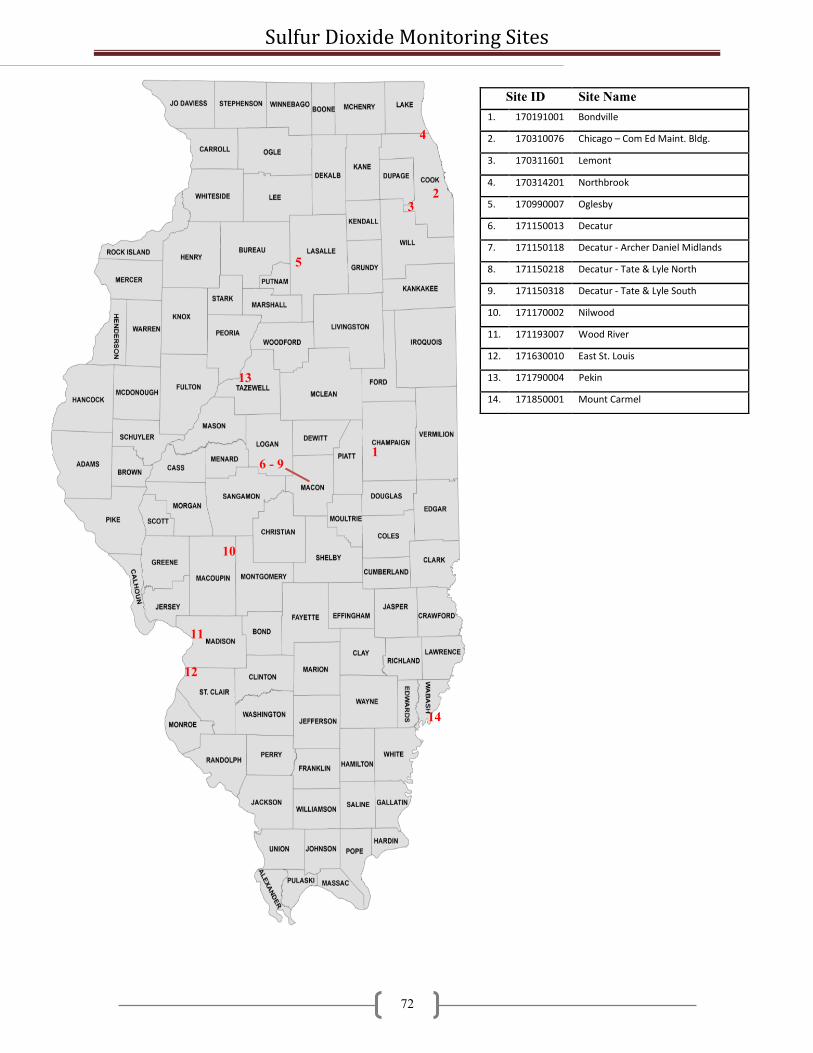
Sulfur Dioxide Monitoring Sites
72
Site ID Site Name
1. 170191001 Bondville
2. 170310076 Chicago – Com Ed Maint. Bldg.
3. 170311601 Lemont
4. 170314201 Northbrook
5. 170990007 Oglesby
6. 171150013 Decatur
7. 171150118 Decatur - Archer Daniel Midlands
8. 171150218 Decatur - Tate & Lyle North
9. 171150318 Decatur - Tate & Lyle South
10. 171170002 Nilwood
11. 171193007 Wood River
12. 171630010 East St. Louis
13. 171790004 Pekin
14. 171850001 Mount Carmel
4
2
12
11
3
13
5
6 - 9
10
14
1

Table B15 Sulfur Dioxide Exceedances
73
EXCEEDANCES OF THE 1-HOUR PRIMARY STANDARD OF 75 ppb
Date City Concentration (ppb)
None None None
Total Over 75 ppb 0
Total Days Over 75 ppb 0

Table B16 Sulfur Dioxide Highs
74
AQS ID City Total
Hourly Samples
Samples Greater Than 75 ppb
Highest Daily 1-Hour Samples (ppb)
Highest 3-Hour Block Averages (ppb)
2019 2018 2017 1st 2nd 3rd 4th 1st 2nd
17-019-1001 Bondville 7820 0 0 0 6.6 4.5 4.4 3.8 3.3 2.6
17-031-0076 Chicago Com Ed Maintenance
8675 0 0 0 19.9 14.6 10.5 9.1 15.0 7.9
17-031-1601 Lemont 8516 0 0 0 16.9 9.4 6.8 6.6 10.3 6.9
17-031-4201 Northbrook 8042 0 0 0 5.5 4.5 4.3 4.1 4.4 3.9
17-099-0007 Oglesby 8088 0 0 0 43.8 27.9 25.3 22.4 20.7 17.5
17-115-0013 Decatur Illinois EPA Trailer
8370 0 0 0 37.6 26.6 24.6 23.4 23.7 22.8
17-115-0117 Decatur ADM
8707 0 0 1 19.7 19.4 17.7 17.0 14.5 13.5
17-115-0217 Decatur Tate & Lyle North
8709 0 5 5 50.5 47.6 44.8 41.8 44.7 33.3
17-115-0317 Decatur Tate & Lyle South
8600 0 6 3 47.4 40.0 39.0 34.2 34.0 31.6
17-117-0002 Nilwood 8604 0 0 0 5.5 4.7 4.6 4.6 4.3 2.8
17-119-3007 Wood River 8624 0 0 0 14.6 10.2 9.5 9.3 6.2 5.9
17-163-0010 East St. Louis 8643 0 0 0 15.6 11.8 11.5 10.6 13.1 7.3
17-179-0004 Pekin 8367 0 0 0 25.1 20.6 18.7 17.3 16.0 14.5
17-185-0001 Mount Carmel 8359 0 0 0 61.3 37.7 37.3 30.5 38.5 30.4
Statewide Average 26.4 20.0 18.5 16.8 17.8 14.4
Total Over 75 ppb 0 11 9
Total Days Over 75 ppb 0 11 9

Table B17 Sulfur Dioxide 1-Hour Design Values
75
AQS ID City
99th Percentile Concentrations (ppb) Design Values* (ppb)
2019 2018 2017 2016 2015 2017-2019 2016-2018 2015-2017
17-019-1001 Bondville 3.8 3.3 3.6 3.7 12.0 4 4 6
17-031-0076 Chicago Com Ed Maintenance
10.5 11.0 11.5 9.3 13.2 11 11 11
17-031-1601 Lemont 6.6 6.3 5.3 12.3 20.3 6 8 13
17-031-4201 Northbrook 4.1 3.4 2.5 4.3 7.7 3 3 5
17-099-0007 Oglesby 22.4 27.4 12.5 14.7 7.0 21 18 11
17-115-0013 Decatur Illinois EPA Trailer
23.4 37.0 39.6 54.3 39.1 33 44 44
17-115-0117 Decatur ADM
17.0 20.8 27.8 - - 22 24 -
17-115-0217 Decatur Tate & Lyle North
41.8 83.9 76.6 - - 67 80 -
17-115-0317 Decatur Tate & Lyle South
34.2 89.0 74.3 - - 66 82 -
17-117-0002 Nilwood 4.6 4.5 3.8 5.2 6.8 4 5 5
17-119-1010 South Roxana - - - 12.9 12.6 - - -
17-119-3007 Wood River 9.3 9.7 10.9 24.2 20.4 10 15 19
17-143-0024 Peoria Fire Station #8
- - 18.5 27.1 22.2 - - 23
17-157-0001 Houston - - - - 11.6 - - -
17-163-0010 East St. Louis 10.6 15.9 8.8 19.1 18.9 12 15 16
17-167-0006 Springfield Sewage Treatment Plant
- - - - 7.1 - - -
17-179-0004 Pekin 17.3 11.8 - 125.8 116.1 15 69 95
17-185-0001 Mount Carmel 30.5 36.8 32.4 42.1 43.0 33 37 39
Statewide Average 16.9 25.8 24.4 27.3 23.9 21 30 24
*The design value is the three-year average of the 99th percentile concentration. Design value greater than 75 ppb is a violation of the National Ambient Air Quality Standard.

Nitrogen Dioxide Monitoring Sites
76
Site ID Site Name
1. 170310076 Chicago - Com Ed Maintenance
2. 170310216 Chicago - Kennedy near-road
3. 170310116 Lansing - Kingery near-road
4. 170313103 Schiller Park
5. 170314002 Cicero
6. 171170002 Nilwood
7. 171630010 East St. Louis
4
1
5
7
3
2
6

Table B18 Nitrogen Dioxide 1-Hour Exceedances
77
EXCEEDANCES OF THE 1-HOUR PRIMARY STANDARD OF 100 PPB
Date City Concentration (ppb)
None None None
Total Over 100 ppb 0
Total Days Over 100 ppb 0
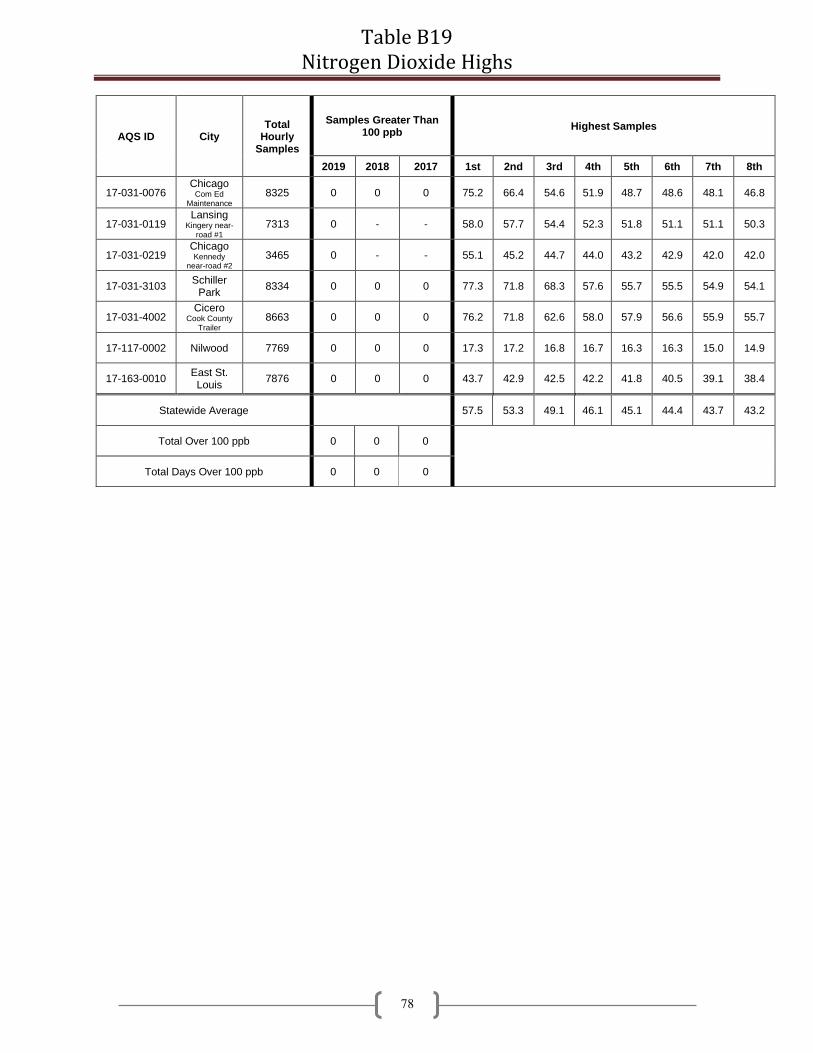
Table B19 Nitrogen Dioxide Highs
78
AQS ID City Total
Hourly Samples
Samples Greater Than 100 ppb
Highest Samples
2019 2018 2017 1st 2nd 3rd 4th 5th 6th 7th 8th
17-031-0076 Chicago
Com Ed Maintenance
8325 0 0 0 75.2 66.4 54.6 51.9 48.7 48.6 48.1 46.8
17-031-0119 Lansing
Kingery near-road #1
7313 0 - - 58.0 57.7 54.4 52.3 51.8 51.1 51.1 50.3
17-031-0219 Chicago Kennedy
near-road #2 3465 0 - - 55.1 45.2 44.7 44.0 43.2 42.9 42.0 42.0
17-031-3103 Schiller
Park 8334 0 0 0 77.3 71.8 68.3 57.6 55.7 55.5 54.9 54.1
17-031-4002 Cicero
Cook County Trailer
8663 0 0 0 76.2 71.8 62.6 58.0 57.9 56.6 55.9 55.7
17-117-0002 Nilwood 7769 0 0 0 17.3 17.2 16.8 16.7 16.3 16.3 15.0 14.9
17-163-0010 East St. Louis
7876 0 0 0 43.7 42.9 42.5 42.2 41.8 40.5 39.1 38.4
Statewide Average 57.5 53.3 49.1 46.1 45.1 44.4 43.7 43.2
Total Over 100 ppb 0 0 0
Total Days Over 100 ppb 0 0 0
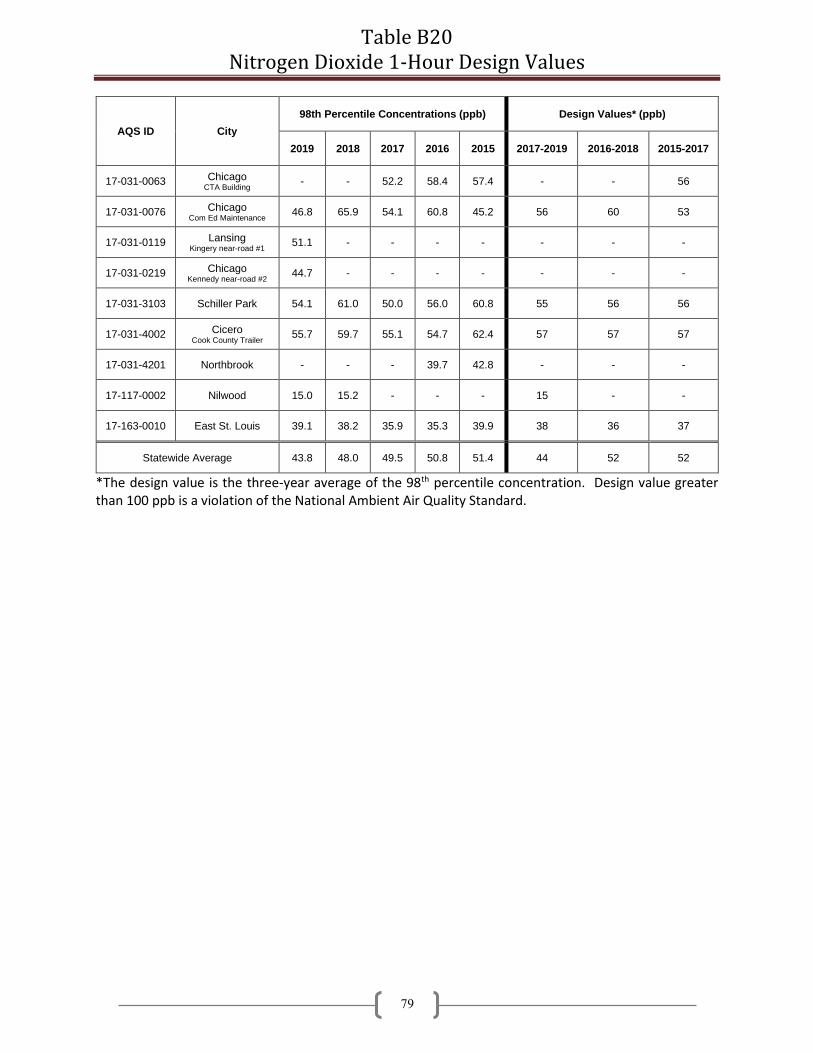
Table B20 Nitrogen Dioxide 1-Hour Design Values
79
AQS ID City
98th Percentile Concentrations (ppb) Design Values* (ppb)
2019 2018 2017 2016 2015 2017-2019 2016-2018 2015-2017
17-031-0063 Chicago CTA Building
- - 52.2 58.4 57.4 - - 56
17-031-0076 Chicago Com Ed Maintenance
46.8 65.9 54.1 60.8 45.2 56 60 53
17-031-0119 Lansing Kingery near-road #1
51.1 - - - - - - -
17-031-0219 Chicago Kennedy near-road #2
44.7 - - - - - - -
17-031-3103 Schiller Park 54.1 61.0 50.0 56.0 60.8 55 56 56
17-031-4002 Cicero Cook County Trailer
55.7 59.7 55.1 54.7 62.4 57 57 57
17-031-4201 Northbrook - - - 39.7 42.8 - - -
17-117-0002 Nilwood 15.0 15.2 - - - 15 - -
17-163-0010 East St. Louis 39.1 38.2 35.9 35.3 39.9 38 36 37
Statewide Average 43.8 48.0 49.5 50.8 51.4 44 52 52
*The design value is the three-year average of the 98th percentile concentration. Design value greater than 100 ppb is a violation of the National Ambient Air Quality Standard.

Table B21 Nitrogen Dioxide Annual Design Values
80
AQS ID City
Annual Arithmetic Mean Concentrations* (ppb)
2019 2018 2017 2016 2015
17-031-0063 Chicago CTA Building
- - 15.75 16.85 16.93
17-031-0076 Chicago Com Ed Maintenance
11.89 15.33 12.86 13.49 13.01
17-031-0119 Lansing Kingery near-road #1
16.64 - - - -
17-031-0219 Chicago Kennedy near-road #2
16.37 - - - -
17-031-3103 Schiller Park 17.43 17.91 15.79 17.08 18.20
17-031-4002 Cicero Cook County Trailer
14.14 15.89 15.63 14.07 16.74
17-031-4201 Northbrook - - - 12.10 9.69
17-117-0002 Nilwood 2.37 2.40 - - -
17-163-0010 East St. Louis 8.82 9.49 8.63 9.12 8.32
Statewide Average 12.52 12.20 13.73 13.95 13.82
*The design value is the highest annual average concentration during the most recent two years. Design value greater than 53 ppb is a violation of the National Ambient Air Quality Standard.

Lead Monitoring Sites
81
Site ID Site Name
1. 170310022 Chicago – Washington High School
2. 170310110 Chicago – Perez Elementary
3. 171190010 Granite City – 15th and Madison
1
3
2

Table B22 Lead Highs
82
AQS ID City Total
Sample Days
Highest Monthly Means Maximum Three-Month
Mean
1st 2nd 3rd 4th 5th
17-031-0022 Chicago
Washington High School
47 0.013 0.013 0.013 0.010 0.010 0.01
17-031-0110 Chicago Perez Elementary
65 0.015 0.015 0.012 0.012 0.010 0.01
17-119-0010 Granite City Air Products
61 0.344 0.328 0.107 0.081 0.065 0.15
Statewide Average 0.124 0.119 0.044 0.034 0.028 0.06

Table B23 Lead Design Values
83
AQS ID City
Maximum Three-Month Rolling Mean (ug/m3)
Design Values* (ug/m3)
2019 2018 2017 2016 2015 2017-2019 2016-2018 2015-2017
17-031-0022 Chicago Washington High School
0.01 0.01 0.02 0.02 0.04 0.02 0.02 0.04
17-031-0110 Chicago Perez Elementary
0.01 0.01 0.01 0.01 0.03 0.01 0.01 0.03
17-031-0113 Chicago ArcelorMittal Steel
- - - 0.01 0.01 - -
17-031-4201 Northbrook - - - 0.00 0.01 - -
17-089-0113 Geneva Johnson Controls
- - - 0.05 0.05 - -
17-115-0110 Decatur Mueller
- - 0.04 0.04 0.04 - 0.04
17-119-0010 Granite City Air Products
0.15 0.06 0.03 0.02 0.02 0.15 0.06 0.03
Statewide Average 0.06 0.03 0.03 0.02 0.03 0.06 0.03 0.04
*The design value is the maximum three-month rolling mean over the latest three-year period. Design value greater than 0.15 ug/m3 is a violation of the National Ambient Air Quality Standard.

Table B24 Filter Analysis Data
84
AQS ID City
To
tal
Sam
ple
s
Highs
An
nu
al
Me
an
To
tal
Sam
ple
s
Highs
An
nu
al
Me
an
To
tal
Sam
ple
s
Highs
An
nu
al
Me
an
1st 2nd 1st 2nd 1st 2nd
Arsenic Beryllium Cadmium
17-031-0022 Chicago
Washington High School
- - - - - - - - 47 0.011 0.006 0.001
17-031-0110 Chicago Perez Elementary
- - - - - - - - 56 0.001 0.001 0.000
17-119-0010 Granite City Air Products
56 0.020 0.010 0.001 56 0.000 0.000 0.000 56 0.000 0.000 0.000

Table B24 Filter Analysis Data
85
AQS ID City
To
tal
Sam
ple
s
Highs
An
nu
al
Me
an
To
tal
Sam
ple
s
Highs
An
nu
al
Me
an
To
tal
Sam
ple
s
Highs
An
nu
al
Me
an
1st 2nd 1st 2nd 1st 2nd
Chromium Iron Manganese
17-031-0022 Chicago
Washington High School
47 0.031 0.029 0.012 47 2.18 2.15 0.599 47 0.148 0.129 0.045
17-031-0110 Chicago Perez Elementary
56 0.023 0.022 0.009 56 1.09 0.91 0.344 56 0.055 0.050 0.015
17-119-0010 Granite City Air Products
56 0.024 0.018 0.005 56 5.70 4.94 1.43 56 0.313 0.276 0.082

Table B24 Filter Analysis Data
86
AQS ID City
To
tal
Sam
ple
s
Highs
An
nu
al
Me
an
To
tal
Sam
ple
s
Highs
An
nu
al
Me
an
To
tal
Sam
ple
s
Highs
An
nu
al
Me
an
1st 2nd 1st 2nd 1st 2nd
Nickel
17-031-0022 Chicago
Washington High School
47 0.015 0.009 0.004
17-031-0110 Chicago Perez Elementary
56 0.009 0.009 0.003
17-119-0010 Granite City Air Products
56 0.074 0.025 0.004
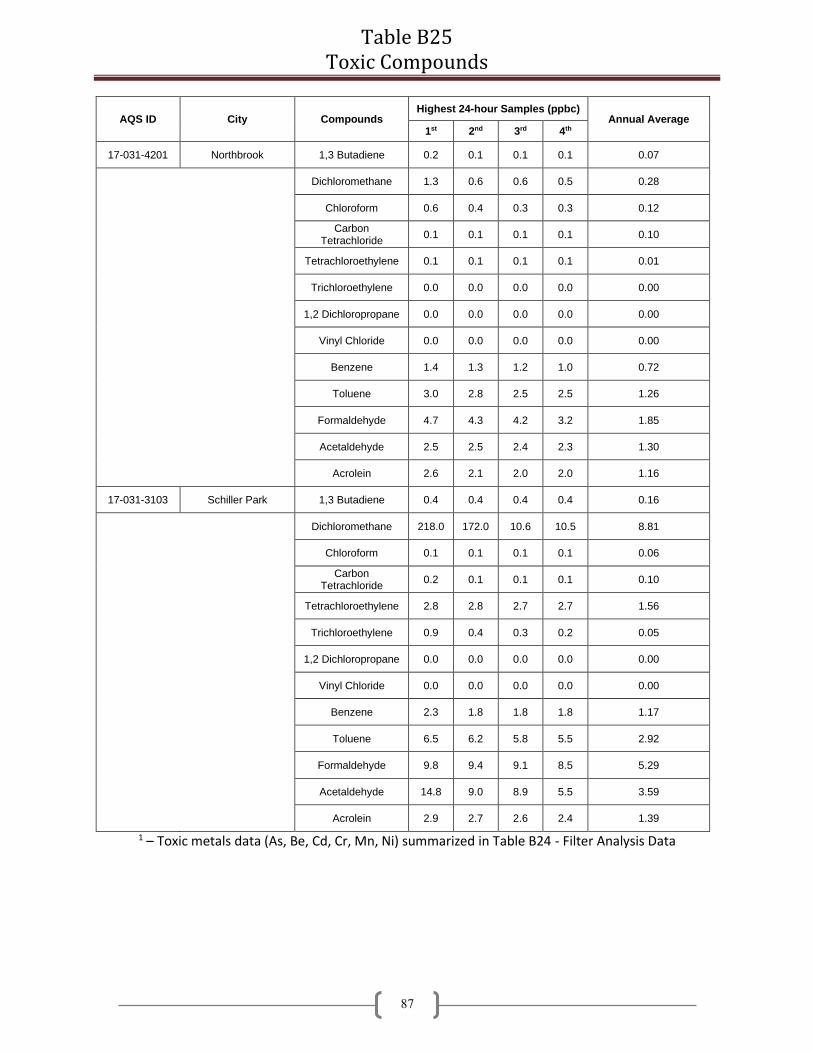
Table B25 Toxic Compounds
87
AQS ID City Compounds Highest 24-hour Samples (ppbc)
Annual Average 1st 2nd 3rd 4th
17-031-4201 Northbrook 1,3 Butadiene 0.2 0.1 0.1 0.1 0.07
Dichloromethane 1.3 0.6 0.6 0.5 0.28
Chloroform 0.6 0.4 0.3 0.3 0.12
Carbon Tetrachloride
0.1 0.1 0.1 0.1 0.10
Tetrachloroethylene 0.1 0.1 0.1 0.1 0.01
Trichloroethylene 0.0 0.0 0.0 0.0 0.00
1,2 Dichloropropane 0.0 0.0 0.0 0.0 0.00
Vinyl Chloride 0.0 0.0 0.0 0.0 0.00
Benzene 1.4 1.3 1.2 1.0 0.72
Toluene 3.0 2.8 2.5 2.5 1.26
Formaldehyde 4.7 4.3 4.2 3.2 1.85
Acetaldehyde 2.5 2.5 2.4 2.3 1.30
Acrolein 2.6 2.1 2.0 2.0 1.16
17-031-3103 Schiller Park 1,3 Butadiene 0.4 0.4 0.4 0.4 0.16
Dichloromethane 218.0 172.0 10.6 10.5 8.81
Chloroform 0.1 0.1 0.1 0.1 0.06
Carbon Tetrachloride
0.2 0.1 0.1 0.1 0.10
Tetrachloroethylene 2.8 2.8 2.7 2.7 1.56
Trichloroethylene 0.9 0.4 0.3 0.2 0.05
1,2 Dichloropropane 0.0 0.0 0.0 0.0 0.00
Vinyl Chloride 0.0 0.0 0.0 0.0 0.00
Benzene 2.3 1.8 1.8 1.8 1.17
Toluene 6.5 6.2 5.8 5.5 2.92
Formaldehyde 9.8 9.4 9.1 8.5 5.29
Acetaldehyde 14.8 9.0 8.9 5.5 3.59
Acrolein 2.9 2.7 2.6 2.4 1.39
1 – Toxic metals data (As, Be, Cd, Cr, Mn, Ni) summarized in Table B24 - Filter Analysis Data

Appendix C: Point Source Emission Inventory Summary
88
Table C1
Carbon Monoxide Point Source Emission Distribution (Tons/Year) Category 2015 2016 2017 2018 2019
External Fuel Combustion
Electric Generation 20,092.2 17,065.5 11,188.4 12,253.2 13,628.8
Industrial 5,781.1 5,345.5 5,005.5 4,674.7 4,559.1
Commercial/Institutional 1,498.3 1,493.7 1,345.6 1,433.4 1,445.3
Space Heating 38.9 21.3 16.7 17.7 21.4
Internal Fuel Combustion
Electric Generation 2,306.4 2,475.6 3,011.5 1,750.4 1,972.8
Industrial 4,684.8 3,552.2 2,847.7 2,648.3 3,188.1
Commercial/Institutional 190.6 226.8 187.8 179.0 213.8
Engine Testing 215.8 168.4 165.7 162.1 208.7
Industrial Processes
Chemical Manufacturing 1,814.1 1,591.6 1,603.8 1,832.6 1,827.2
Food/Agriculture 1,420.2 1,576.8 1,449.3 1,263.0 1,189.6
Primary Metal Production 15,855.7 13,226.3 10,165.9 9,912.7 12,408.3
Secondary Metal Production 2,041.5 2,492.9 2,105.9 2,103.6 1,906.6
Mineral Products 2,820.9 3,580.7 4,322.5 3,546.7 3,334.4
Petroleum Industry 3,085.2 3,245.9 2,615.6 2,669.7 2,477.7
Paper and Wood Products 1.5 0.5 0.5 0.5 0.5
Rubber and Plastic Products 26.3 24.5 21.5 18.5 21.9
Fabricated Metal Products 203.1 214.2 205.8 218.4 191.7
Oil and Gas Production 274.6 241.6 229.5 241.2 244.4
Miscellaneous Machinery 1.3 1.2 0.6 0.6 0.6
Electrical Equipment 2.0 2.0 1.4 1.4 1.4
Health Services 153.6 175.3 171.4 170.9 168.5
In-Process Fuel Use 946.8 403.2 12.0 10.1 112.9
Miscellaneous Manufacturing 59.5 37.5 52.2 55.0 59.6
Organic Solvent Emissions
Organic Solvent Use 0.0 0.2 0.1
Surface Coating Operations 271.2 232.0 235.9 213.4 233.0
Petroleum Product Storage 0.0 0.2 0.2 0.3 0.0
Bulk Terminals/Plants 32.9 26.0 9.9 10.9 17.5
Printing/Publishing 1.1 0.7 0.7 2.1
Petroleum Marketing/Transport 46.9 21.2 21.1 8.4 95.7
Organic Chemical Storage (large) 2.7 0.2 0.0
Organic Chemical Transportation 3.6
Organic Solvent Evaporation 9.8 9.0 53.6 20.4 39.8
Solid Waste Disposal
Government 1,562.0 1,758.0 1,545.9 1,661.5 1,757.6
Commercial/Institutional 25.0 40.9 41.0 11.8 11.8
Industrial 605.0 691.7 629.7 663.8 597.5
Site Remediation 1.2 2.2 2.2 2.2 3.3
Commercial 28.1 15.5
Institutional 0.1
Totals 66,072.1 59,944.8 49,267.3 47,785.6 51,961.0

Appendix C: Point Source Emission Inventory Summary
89
Table C2
Nitrogen Oxides Point Source Emission Distribution (Tons/Year) Category 2015 2016 2017 2018 2019
External Fuel Combustion
Electric Generation 45,242.2 33,102.0 27,023.2 28,127.4 29,824.7
Industrial 9,941.2 9,217.5 8,425.8 7,863.4 7,392.7
Commercial/Institutional 2,059.7 1,938.0 1,804.4 1,858.3 1,894.3
Space Heating 96.5 86.6 66.0 71.9 74.0
Internal Fuel Combustion
Electric Generation 2,229.8 2,409.4 3,531.8 2,046.9 2,522.1
Industrial 20,229.6 14,482.6 9,029.6 7,232.8 8,659.5
Commercial/Institutional 404.0 541.3 431.2 431.3 471.4
Engine Testing 439.4 563.8 476.6 344.5 327.2
Industrial Processes
Chemical Manufacturing 1,361.0 1,552.0 1,363.9 1,452.3 1,468.9
Food/Agriculture 1,449.6 1,504.3 1,346.0 1,299.1 1,137.9
Primary Metal Production 1,779.1 1,329.7 964.5 1,010.2 1,208.4
Secondary Metal Production 585.3 667.0 779.6 720.5 629.5
Mineral Products 6,275.5 5,410.1 7,619.5 6,405.3 6,699.2
Petroleum Industry 4,636.0 4,191.9 3,749.4 3,640.5 3,771.5
Paper and Wood Products 1.3 0.9 0.9 0.9 0.9
Rubber and Plastic Products 30.6 26.4 24.1 20.6 27.5
Fabricated Metal Products 236.3 269.8 245.9 266.1 244.2
Oil and Gas Production 706.3 620.6 688.7 691.2 627.8
Miscellaneous Machinery 1.8 0.6 0.8 0.8 0.8
Electrical Equipment 2.5 2.5 1.9 1.9 1.7
Health Services 4.0 6.6 6.6 6.6 7.0
Textile Products 0.9 0.9
In-Process Fuel Use 803.1 190.3 34.0 70.3 165.0
Miscellaneous Manufacturing 18.3 15.7 15.3 18.6 17.9
Organic Solvent Emissions
Organic Solvent Use 0.0 0.2 0.2
Surface Coating Operations 375.1 420.7 513.0 475.3 473.6
Petroleum Product Storage 0.2 0.0
Bulk Terminals/Plants 13.5 0.2 0.2 2.9 7.4
Printing/Publishing 1.5 13.3 4.0 0.8 4.0
Petroleum Marketing/Transport 20.1 8.8 0.8 3.5 38.2
Organic Chemical Storage (large) 1.6 8.7 0.2 0.0
Organic Chemical Transportation 1.5
Organic Solvent Evaporation 13.7 11.3 23.2 15.9 20.2
Solid Waste Disposal
Government 558.9 592.1 521.6 590.5 574.8
Commercial/Institutional 17.2 13.3 13.3 1.3 1.3
Industrial 214.4 245.7 198.4 201.4 195.2
Site Remediation 2.5 2.8 2.8 2.8 5.8
Commercial 11.9 11.0
Institutional 0.1
Totals 99,752.5 79,438.9 68,915.9 64,888.5 68,507.0

Appendix C: Point Source Emission Inventory Summary
90
Table C3
PM10 Point Source Emission Distribution (Tons/Year) Category 2015 2016 2017 2018 2019
External Fuel Combustion
Electric Generation 5,637.2 4,335.2 3,137.0 2,901.5 4,004.8
Industrial 1,304.5 1,180.1 972.9 734.0 715.8
Commercial/Institutional 193.9 186.6 172.4 179.4 180.8
Space Heating 6.6 3.4 2.8 3.0 3.2
Internal Fuel Combustion
Electric Generation 208.0 358.4 527.0 291.8 382.1
Industrial 303.3 238.0 218.9 228.7 269.3
Commercial/Institutional 25.2 35.2 23.8 21.9 26.3
Engine Testing 15.7 24.0 20.9 14.7 15.5
Industrial Processes
Chemical Manufacturing 836.6 1,031.2 978.8 985.4 1,023.5
Food/Agriculture 5,677.7 5,846.3 5,718.2 5,600.5 5,497.3
Primary Metal Production 1,233.1 872.1 627.0 634.5 882.7
Secondary Metal Production 1,034.4 955.0 858.6 885.4 869.2
Mineral Products 4,449.2 4,733.0 4,455.1 4,332.8 4,093.1
Petroleum Industry 1,239.5 1,189.0 1,283.0 1,153.0 1,234.2
Paper and Wood Products 93.1 112.7 121.5 130.5 140.9
Rubber and Plastic Products 113.7 168.2 164.6 140.8 162.1
Fabricated Metal Products 220.3 248.4 239.1 258.9 270.0
Oil and Gas Production 7.9 13.4 14.8 14.0 12.0
Building Construction 1.6 0.1 0.0 0.0 0.0
Miscellaneous Machinery 12.2 14.8 15.4 15.2 13.1
Electrical Equipment 4.4 5.1 5.0 5.0 5.1
Transportation Equipment 2.0 0.6 0.1 0.1 0.2
Health Services 63.9 76.9 75.1 79.2 79.0
Leather and Leather Products 2.7 9.7 9.7 11.9 11.9
Textile Products 0.2 0.1 0.0 0.0 0.0
Type Setting 0.5 0.5 0.5
Process Cooling 263.1 271.6 267.7 237.4 237.7
In-Process Fuel Use 181.2 81.4 0.4 2.9 26.0
Miscellaneous Manufacturing 20.1 19.2 19.0 19.0 51.7
Organic Solvent Emissions
Organic Solvent Use 0.1 2.9 2.7 23.0 21.4
Surface Coating Operations 176.9 257.4 310.1 250.8 239.9
Petroleum Product Storage 1.1 1.1 1.1 0.0
Bulk Terminals/Plants 0.4 1.1 2.5 4.1 1.2
Printing/Publishing 28.9 29.3 28.3 29.9 37.6
Petroleum Marketing/Transport 1.2 1.3 1.3 1.0 4.4
Organic Chemical Storage (large) 1.5 5.8 5.7 5.7 6.1
Dry Cleaning (petroleum based) 0.5 0.7 0.7 0.7 7.4
Organic Solvent Evaporation 3.5 5.7 6.3 3.7 10.4
Solid Waste Disposal
Government 424.7 355.2 351.8 382.7 426.3
Commercial/Institutional 7.5 7.9 7.4 1.3 0.0
Industrial 95.4 92.0 77.1 201.4 86.7
Site Remediation 14.7 14.2 135.5 2.8 13.7
Commercial 7.2 3.2
Institutional 0.1
Totals 23,959.2 22,820.2 20,778.6 19,725.7 21,066.4

Appendix C: Point Source Emission Inventory Summary
91
Table C4
Sulfur Dioxide Point Source Emission Distribution (Tons/Year) Category 2015 2016 2017 2018 2019
External Fuel Combustion
Electric Generation 136,043.9 89,806.2 61,147.3 54,066.6 57,192.8
Industrial 24,913.5 19,064.4 16,023.6 13,409.5 12,220.6
Commercial/Institutional 2,665.7 2,582.8 2,405.7 2,486.2 2,606.4
Space Heating 0.6 0.6 0.5 0.5 0.5
Internal Fuel Combustion
Electric Generation 237.5 223.0 271.9 268.5 248.8
Industrial 65.8 62.8 49.0 42.2 70.6
Commercial/Institutional 15.8 24.0 20.1 15.9 16.8
Engine Testing 3.2 8.1 6.7 4.3 5.2
Industrial Processes
Chemical Manufacturing 1,333.3 1,330.6 1,000.0 727.9 912.3
Food/Agriculture 1,238.6 1,192.5 1,097.2 1,440.8 1,436.7
Primary Metal Production 2,502.8 2,046.8 1,413.2 1,426.9 2,533.5
Secondary Metal Production 118.6 93.6 92.8 85.7 92.6
Mineral Products 8,183.3 4,816.4 7,806.9 9,107.2 6,261.1
Petroleum Industry 3,026.0 2,498.1 1,568.3 1,635.0 1,299.7
Paper and Wood Products 0.0 0.0 0.0 0.0 0.0
Rubber and Plastic Products 1.5 0.3 0.3 0.2 3.9
Fabricated Metal Products 11.8 15.6 15.1 14.7 12.8
Oil and Gas Production 3.3 1.3 1.2 0.8 0.6
Miscellaneous Machinery 0.0 0.0 0.0 0.0 0.0
Electrical Equipment 0.0 0.0
Health Services 5.1 7.5 7.5 7.5 7.5
Process Cooling 0.0 0.0 0.0 0.0 0.0
In-Process Fuel Use 419.0 175.4 5.7 5.9 61.7
Miscellaneous Manufacturing 17.1 0.5 0.5 0.4 0.4
Organic Solvent Emissions
Organic Solvent Use 0.0 0.2 0.0
Surface Coating Operations 3.6 9.6 4.5 4.5 4.9
Petroleum Product Storage 7.7 8.3 0.9 8.3 8.3
Bulk Terminals/Plants 0.5
Printing/Publishing 0.4 0.8 0.8 0.5 0.0
Petroleum Marketing/Transport 0.0 75.3 0.0 0.0 2.5
Organic Chemical Storage (large) 0.1 0.1 0.1 0.5
Organic Chemical Transportation 0.4 0.1 0.3 1.6
Organic Solvent Evaporation 25.1 3.5 0.7 0.6 0.9
Solid Waste Disposal
Government 914.8 949.8 729.9 1,063.8 900.8
Commercial/Institutional 0.4 2.6 2.5 1.5 1.5
Industrial 364.4 342.5 371.8 365.7 218.4
Site Remediation 1.8
Commercial 0.7
Institutional 0.0
Totals 182,200.0 125,421.1 94,095.4 86,245.4 86,125.6

Appendix C: Point Source Emission Inventory Summary
92
Table C5
Volatile Organic Material Point Source Emission Distribution (Tons/Year)
Category 2015 2016 2017 2018 2019
External Fuel Combustion
Electric Generation 1,383.4 1,095.4 973.2 1,111.1 1,128.9
Industrial 341.0 321.4 338.8 314.9 303.9
Commercial/Institutional 92.4 86.7 78.9 83.7 85.5
Space Heating 5.3 4.6 3.5 3.8 3.9
Internal Fuel Combustion
Electric Generation 256.3 387.6 528.2 352.7 172.2
Industrial 1,025.9 793.6 602.8 519.0 684.8
Commercial/Institutional 31.8 35.1 36.6 36.2 45.6
Engine Testing 77.9 39.1 35.3 45.0 56.7
Industrial Processes
Chemical Manufacturing 6,487.1 6,261.4 5,752.3 5,769.7 5,679.5
Food/Agriculture 8,855.2 9,461.8 8,917.4 9,316.2 9,432.5
Primary Metal Production 414.7 287.8 141.1 146.8 163.6
Secondary Metal Production 671.9 697.4 672.8 725.7 760.1
Mineral Products 925.9 1,163.9 1,257.7 1,100.6 999.7
Petroleum Industry 1,866.2 1,987.0 1,833.9 1,979.2 1,748.7
Paper and Wood Products 74.6 78.4 64.4 59.5 68.3
Rubber and Plastic Products 1,778.8 1,839.3 1,646.5 1,670.1 1,603.5
Fabricated Metal Products 638.6 689.8 790.5 648.2 667.7
Oil and Gas Production 374.5 327.4 351.3 303.7 288.9
Miscellaneous Machinery 81.5 83.4 83.5 74.2 31.1
Electrical Equipment 38.9 38.9 65.7 68.0 65.2
Transportation Equipment 21.8 18.5 18.5 18.5 18.2
Health Services 16.4 12.6 11.8 10.6 5.8
Photographic Film Manufacturing 1.7 1.7 0.8
Leather and Leather Products 16.2 16.9 16.9 17.9 17.9
Textile Products 2.0 2.3 2.3 2.3 2.3
Process Cooling 77.1 78.9 80.7 80.7 80.7
In-Process Fuel Use 32.7 9.6 6.7 6.7 10.6
Miscellaneous Manufacturing 158.3 139.3 136.2 104.7 67.4
Organic Solvent Emissions
Organic Solvent Use 386.2 394. 449.4 472.5 502.0
Surface Coating Operations 6,955.5 6,879.4 6,264.5 6,138.0 6,064.1
Petroleum Product Storage 2,487.0 2,524.1 2,482.5 2,517.0 2,492.5
Bulk Terminals/Plants 1,037.7 1,162.7 1,012.2 1,015.6 1,052.0
Printing/Publishing 3,217.7 3,081.6 2,451.1 2,467.7 2,382.2
Petroleum Marketing/Transport 325.1 434.5 450.4 354.7 358.5
Organic Chemical Storage (large) 489.4 705.5 514.01 578.7 775.3
Organic Chemical Transportation 144.8 102.5 101.4 60.6 41.6
Dry Cleaning (petroleum based) 377.3 374.8 318.0 283.5 280.8
Organic Chemical Storage (small) 0.0 0.2 0.2 0.2
Organic Solvent Evaporation 438.6 416.3 410.9 372.0 354.5
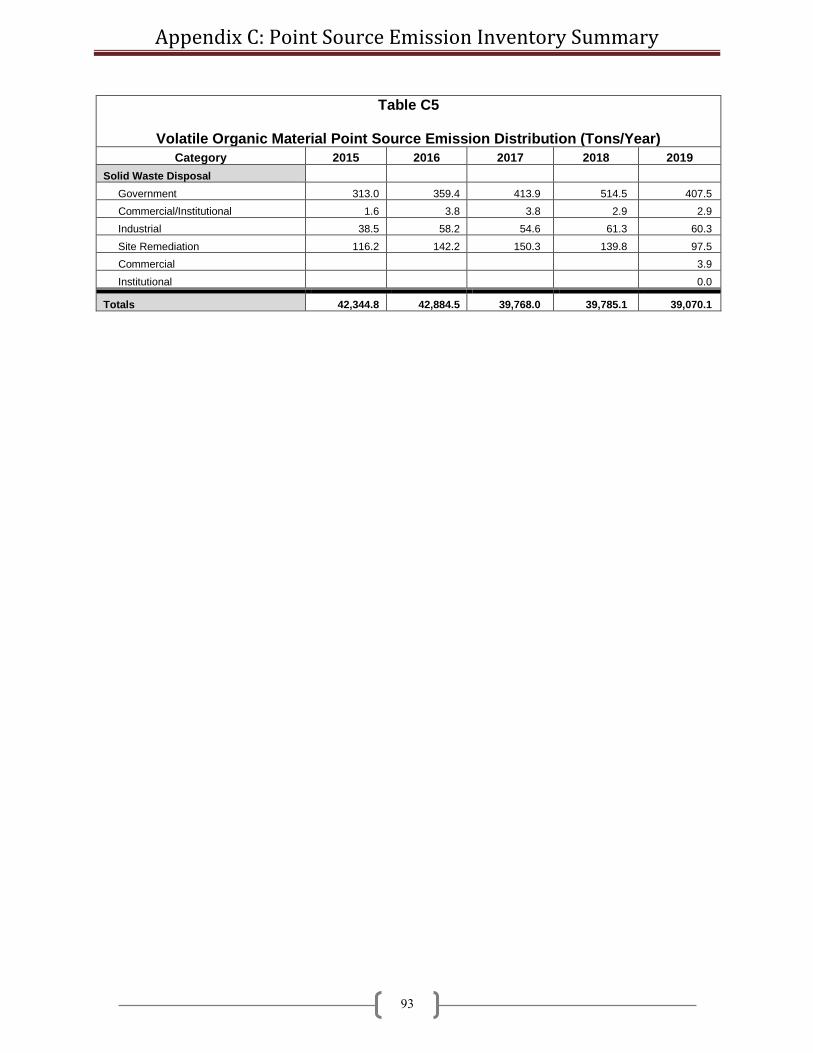
Appendix C: Point Source Emission Inventory Summary
93
Table C5
Volatile Organic Material Point Source Emission Distribution (Tons/Year)
Category 2015 2016 2017 2018 2019
Solid Waste Disposal
Government 313.0 359.4 413.9 514.5 407.5
Commercial/Institutional 1.6 3.8 3.8 2.9 2.9
Industrial 38.5 58.2 54.6 61.3 60.3
Site Remediation 116.2 142.2 150.3 139.8 97.5
Commercial 3.9
Institutional 0.0
Totals 42,344.8 42,884.5 39,768.0 39,785.1 39,070.1

Appendix C: Point Source Emission Inventory Summary
94
Table C6
2019 Estimated County Stationary Point Source Emissions (Tons/Year)
County Carbon
Monoxide Nitrogen Oxides
PM10 Sulfur Dioxide Volatile Organic Material
Adams 189.9 132.6 261.4 469.8 1,163.9
Alexander 58.9 44.9 43.2 0.6 526.9
Bond 18.9 13.0 11.7 1.9 24.4
Boone 55.3 67.5 79.5 1.0 526.6
Brown 0.0 0.0 2.8 0.0 0.0
Bureau 14.8 28.3 64.6 0.4 34.6
Calhoun 0.6 0.7 5.2 0.0 0.1
Carroll 27.9 28.1 29.6 1.1 15.2
Cass 32.9 37.9 44.6 27.1 13.1
Champaign 355.8 711.9 183.2 367.6 422.9
Christian 298.0 1,599.2 177.5 2,244.5 424.3
Clark 40.8 5.0 53.0 1.4 130.3
Clay 4.0 6.1 15.9 0.1 88.8
Clinton 216.3 700.9 65.9 287.0 60.9
Coles 81.9 80.8 83.7 6.7 388.8
Cook 11,681.5 4,511.0 2,421.1 2,177.6 6,663.3
Crawford 949.1 1,523.7 522.8 4,277.1 808.2
Cumberland 13.6 3.2 17.1 1.0 42.3
DeKalb 123.9 80.6 77.0 34.3 124.6
DeWitt 71.7 60.2 108.1 15.2 144.5
Douglas 953.1 1,744.9 104.4 1.3 511.3
DuPage 642.5 713.0 236.2 43.1 1,039.6
Edgar 12.4 19.4 66.2 0.1 86.7
Edwards 1.3 3.9 10.2 0.0 8.7
Effingham 10.0 24.2 51.9 1.7 264.6
Fayette 62.9 220.5 17.5 74.9 24.0
Ford 89.5 163.7 184.2 6.5 692.5
Franklin 47.5 17.5 27.7 0.4 18.3
Fulton 397.0 1,613.6 75.4 24.6 59.8
Gallatin 0.1 0.3 7.7 0.1 0.0
Greene 0.1 19.3 0.2
Grundy 682.0 1,069.3 190.9 36.3 538.6
Hamilton 0.3 0.5 208.7 0.0 0.9
Hancock 15.3 2.9 50.8 0.2 4.7
Hardin 1.6 1.9 13.1 0.0 1.9
Henderson 29.9
Henry 645.2 1,263.8 163.6 9.2 309.1
Iroquois 49.4 26.9 124.1 4.3 451.3
Jackson 300.1 272.0 46.1 238.5 104.2
Jasper 2,660.2 1,507.1 345.5 4,657.3 119.6
Jefferson 92.4 71.6 30.6 0.9 272.5
Jersey 0.1 6.1 10.3
Jo Daviess 260.7 445.5 127.8 9.6 80.5
Johnson 25.1 24.0 7.8 220.0 5.9
Kane 368.2 368.7 209.5 25.9 1,039.9
Kankakee 524.4 705.0 196.1 44.3 770.1
Kendall 302.6 764.9 263.2 24.4 132.9
Knox 33.2 24.2 59.4 2.0 77.3
Lake 1,883.7 1,731.0 553.0 1,319.3 449.0
La Salle 1,620.5 2,989.9 1,134.7 554.6 1,157.0
Lawrence 8.7 5.1 9.7 0.6 23.2
Lee 178.2 247.1 148.5 13.3 271.0

Appendix C: Point Source Emission Inventory Summary
95
Table C6
2019 Estimated County Stationary Point Source Emissions (Tons/Year)
County Carbon
Monoxide Nitrogen Oxides
PM10 Sulfur Dioxide Volatile Organic Material
Livingston 495.6 247.4 137.9 73.4 329.5
Logan 28.4 38.5 69.9 427.8 8.6
McDonough 39.8 76.9 24.5 4.5 70.2
McHenry 191.5 251.7 109.1 5.2 263.2
McLean 252.7 263.4 163.6 14.1 584.9
Macon 1,229.0 5,088.1 1,845.4 11,486.1 4,212.4
Macoupin 6.2 6.7 34.0 0.0 26.9
Madison 5,849.3 3,226.6 1,083.2 3,520.6 2,591.6
Marion 22.5 38.8 37.2 2.7 572.5
Marshall 30.6 78.2 139.3 265.7 337.9
Mason 414.5 1,128.6 63.7 1,067.4 54.1
Massac 3,862.9 3,611.2 643.4 12,293.7 119.2
Menard 15.1 3.3 16.4 0.0 35.7
Mercer 0.4 0.5 17.0 0.0 14.3
Monroe 2.8 4.1 12.0 0.1 8.2
Montgomery 262.7 2,856.2 145.1 37.6 205.8
Morgan 64.0 190.4 39.1 23.3 27.5
Moultrie 3.1 9.3 28.6 0.0 208.0
Ogle 469.5 360.5 308.0 230.6 359.6
Peoria 1,696.2 3,700.9 474.6 6,910.5 847.0
Perry 27.6 94.1 76.2 0.7 15.3
Piatt 66.8 713.3 52.3 0.2 43.5
Pike 108.6 144.9 80.5 2.3 56.8
Pope
Pulaski 77.7 15.0 36.5 4.1 7.8
Putnam 458.5 1,674.0 319.2 5,625.1 196.8
Randolph 1,078.7 3,233.6 143.4 2,995.5 239.3
Richland 0.6 2.6 8.3 0.0 9.1
Rock Island 392.5 245.3 132.1 14.0 546.0
St. Clair 406.3 353.4 269.8 179.7 534.5
Saline 76.0 23.9 40.5 3.0 7.7
Sangamon 898.2 1,563.5 240.7 1,807.1 204.3
Schuyler 0.0 0.0 9.3 0.0 20.5
Scott 30.9 27.8 27.6 6.5 3.0
Shelby 35.9 106.2 58.6 2.1 57.3
Stark 21.2 6.6
Stephenson 117.0 122.1 77.4 22.4 128.7
Tazewell 587.6 3,535.8 1,404.5 3,793.8 643.9
Union 40.3 50.1 35.6 713.5 1.8
Vermilion 335.7 486.0 177.6 10.1 1,779.1
Wabash 62.9 20.4 32.2 0.4 6.3
Warren 52.9 22.8 63.2 149.1 12.8
Washington 465.2 3,907.6 1,320.5 9,921.0 130.1
Wayne 30.6 74.5 10.2 4.1 14.5
White 5.4 11.2 2.3 2.6 38.9
Whiteside 828.5 187.1 142.4 22.9 73.1
Will 3,284.1 3,524.0 1,368.6 1,813.8 2,431.9
Williamson 1,086.8 1,083.9 132.3 5,106.3 249.5
Winnebago 357.6 411.6 360.1 255.7 679.0
Woodford 6.8 12.9 44.0 78.5 96.1
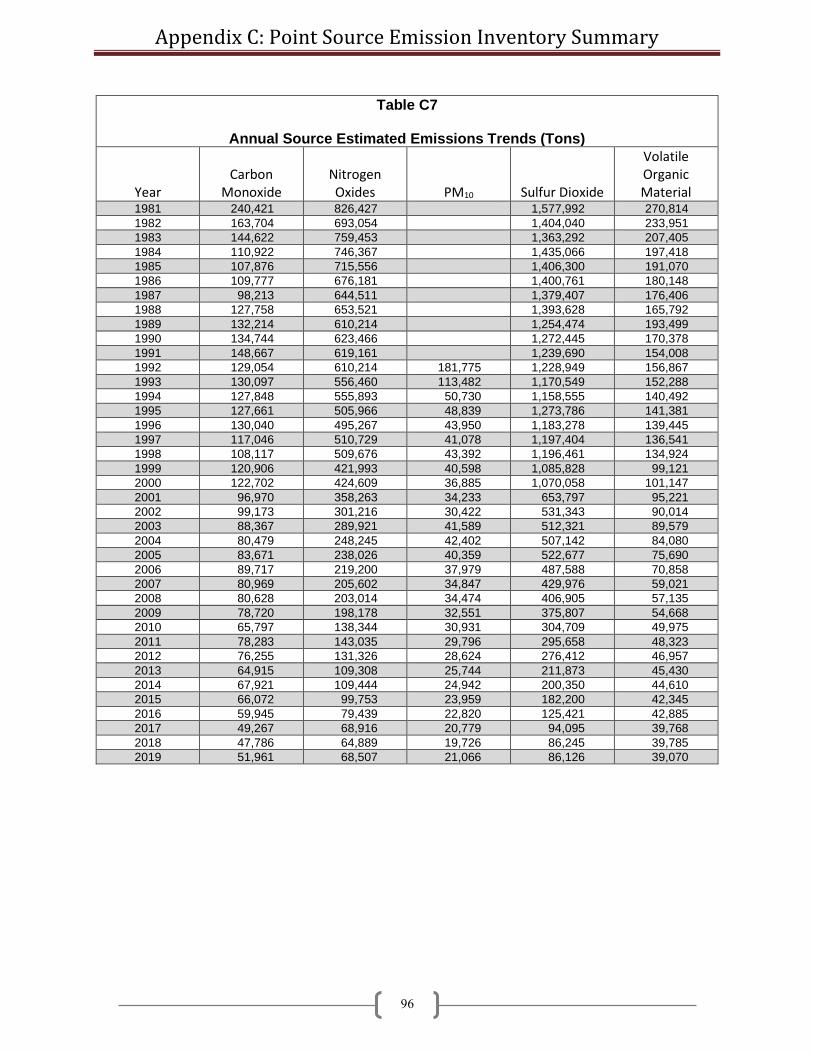
Appendix C: Point Source Emission Inventory Summary
96
Table C7
Annual Source Estimated Emissions Trends (Tons)
Year Carbon
Monoxide Nitrogen Oxides PM10 Sulfur Dioxide
Volatile Organic Material
1981 240,421 826,427 1,577,992 270,814
1982 163,704 693,054 1,404,040 233,951
1983 144,622 759,453 1,363,292 207,405
1984 110,922 746,367 1,435,066 197,418
1985 107,876 715,556 1,406,300 191,070
1986 109,777 676,181 1,400,761 180,148
1987 98,213 644,511 1,379,407 176,406
1988 127,758 653,521 1,393,628 165,792
1989 132,214 610,214 1,254,474 193,499
1990 134,744 623,466 1,272,445 170,378
1991 148,667 619,161 1,239,690 154,008
1992 129,054 610,214 181,775 1,228,949 156,867
1993 130,097 556,460 113,482 1,170,549 152,288
1994 127,848 555,893 50,730 1,158,555 140,492
1995 127,661 505,966 48,839 1,273,786 141,381
1996 130,040 495,267 43,950 1,183,278 139,445
1997 117,046 510,729 41,078 1,197,404 136,541
1998 108,117 509,676 43,392 1,196,461 134,924
1999 120,906 421,993 40,598 1,085,828 99,121
2000 122,702 424,609 36,885 1,070,058 101,147
2001 96,970 358,263 34,233 653,797 95,221
2002 99,173 301,216 30,422 531,343 90,014
2003 88,367 289,921 41,589 512,321 89,579
2004 80,479 248,245 42,402 507,142 84,080
2005 83,671 238,026 40,359 522,677 75,690
2006 89,717 219,200 37,979 487,588 70,858
2007 80,969 205,602 34,847 429,976 59,021
2008 80,628 203,014 34,474 406,905 57,135
2009 78,720 198,178 32,551 375,807 54,668
2010 65,797 138,344 30,931 304,709 49,975
2011 78,283 143,035 29,796 295,658 48,323
2012 76,255 131,326 28,624 276,412 46,957
2013 64,915 109,308 25,744 211,873 45,430
2014 67,921 109,444 24,942 200,350 44,610
2015 66,072 99,753 23,959 182,200 42,345
2016 59,945 79,439 22,820 125,421 42,885
2017 49,267 68,916 20,779 94,095 39,768
2018 47,786 64,889 19,726 86,245 39,785
2019 51,961 68,507 21,066 86,126 39,070

Appendix C: Point Source Emission Inventory Summary
97
Table C8
Annual Source Reported Emissions Trends (Tons)
Year Carbon
Monoxide Nitrogen Oxides PM10 Sulfur Dioxide
Volatile Organic Material
1992 112,403 381,938 49,377 1,045,113 143,853
1993 113,781 418,209 36,737 1,001,123 108,847
1994 116,192 404,486 34,086 967,213 108,897
1995 160,256 366,978 31,491 814,229 103,144
1996 84,258 407,683 30,850 914,295 87,271
1997 71,408 404,289 25,648 974,232 76,350
1998 79,147 377,191 31,828 964,262 77,952
1999 91,153 360,850 27,663 863,759 71,514
2000 90,315 329,141 30,482 620,592 71,063
2001 83,453 291,778 28,929 531,504 62,647
2002 83,795 261,202 26,900 498,754 70,703
2003 75,511 230,068 29,939 507,338 63,495
2004 77,847 229,127 31,896 521,808 64,594
2005 85,892 215,366 30,535 486,534 62,251
2006 77,099 200,832 29,367 429,573 53,791
2007 77,211 198,073 28,784 406,405 50,933
2008 75,183 193,637 28,194 376,627 49,112
2009 62,285 134,274 25,988 305,297 41,839
2010 75,277 139,508 25,993 297,254 44,245
2011 73,586 129,058 25,209 272,747 42,430
2012 64,253 109,298 22,631 220,143 42,735
2013 65,879 107,877 21,549 201,509 41,276
2014 65,865 99,230 21,962 182,337 40,767
2015 57,688 80,469 19,557 136,749 40,039
2016 46,864 68,441 17,560 99,907 37,593
2017 46,747 64,673 17,209 86,446 37,206
2018 50,727 68,632 18,316 87,437 37,265

Appendix D: Website Links
98
Illinois EPA’s Website Information To access the online version of the Annual Air Quality Report, various pollutant averages and exceedances, the monitoring network plan and emission trends:
• https://www2.illinois.gov/epa/topics/air-quality/Pages/default.aspx
Air Quality Index Information
To view current Air Quality Index numbers and forecasts across the country:
• http://www.airnow.gov
To sign up for air quality information such as forecasts and pollution alerts:
• http://www.illinois.enviroflash.info/signup.cfm
EnviroFlash on Twitter:
• http://www.illinois.enviroflash.info/EnviroFlashTwitter.cfm
Monitoring Data Access Information To access yearly Air Quality Index summaries, air quality statistics and monitoring concentrations:
• https://www.epa.gov/outdoor-air-quality-data
To access status and trends of key air pollutants:
• https://www.epa.gov/air-trends
To access historical Design Values (statistic to compare to the National Ambient Air Quality Standards):
• https://www.epa.gov/air-trends/air-quality-design-values
Nonattainment Areas and Designations (regions in violation of the various National Ambient Air Quality Standards):
• http://www.epa.gov/green-book
Other
• Ambient Monitoring Technology Information Center: https://www.epa.gov/amtic
• Toxic Release Inventory Search: http://www.epa.gov/enviro/tri-search
• Toxic Release Inventory Data and Tools: https://www.epa.gov/toxics-release-inventory-tri-
program/tri-data-and-tools


