ILLINOIS E CONOMIC REVIEW The Monthly Illinois Economic Review contains information on national, statewide, and local economic performance by measuring job growth, unemployment, and business activity. This information is compiled by IGPA Economist Geoffrey Hewings, director of the Regional Economics Applications Laboratory at the University of Illinois at Urbana-Champaign with assistance from Yizhou Zhang and Whayoung Jung APRIL 2017
Transcript
ILLINOIS E CONOMIC REVIEW
The Monthly Illinois Economic Review contains information on national, statewide, and local economic
performance by measuring job growth, unemployment, and business activity. This information is compiled by IGPA Economist Geoffrey Hewings, director of the Regional Economics Applications Laboratory at the
University of Illinois at Urbana-Champaign with assistance from Yizhou Zhang and Whayoung Jung
APRIL 2017
2
EMPLOYMENT EMPLOYMENT DATA SUMMARY
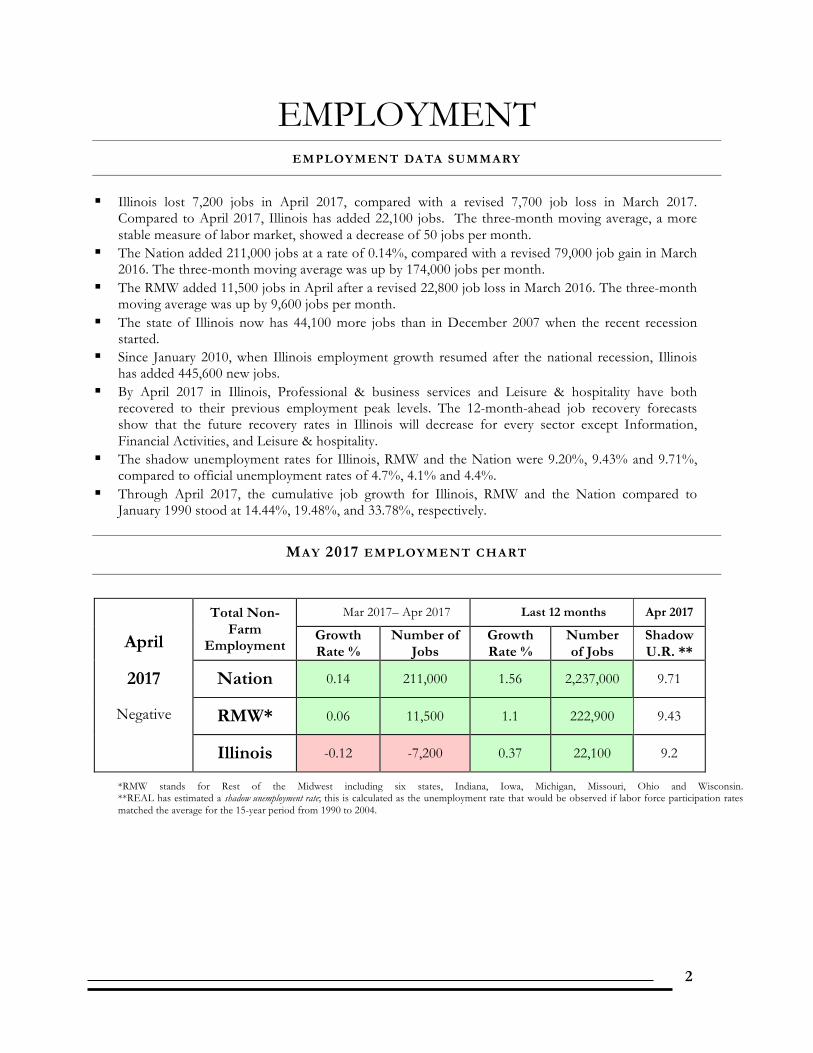
§ Illinois lost 7,200 jobs in April 2017, compared with a revised 7,700 job loss in March 2017. Compared to April 2017, Illinois has added 22,100 jobs. The three-month moving average, a more stable measure of labor market, showed a decrease of 50 jobs per month.
§ The Nation added 211,000 jobs at a rate of 0.14%, compared with a revised 79,000 job gain in March 2016. The three-month moving average was up by 174,000 jobs per month.
§ The RMW added 11,500 jobs in April after a revised 22,800 job loss in March 2016. The three-month moving average was up by 9,600 jobs per month.
§ The state of Illinois now has 44,100 more jobs than in December 2007 when the recent recession started.
§ Since January 2010, when Illinois employment growth resumed after the national recession, Illinois has added 445,600 new jobs.
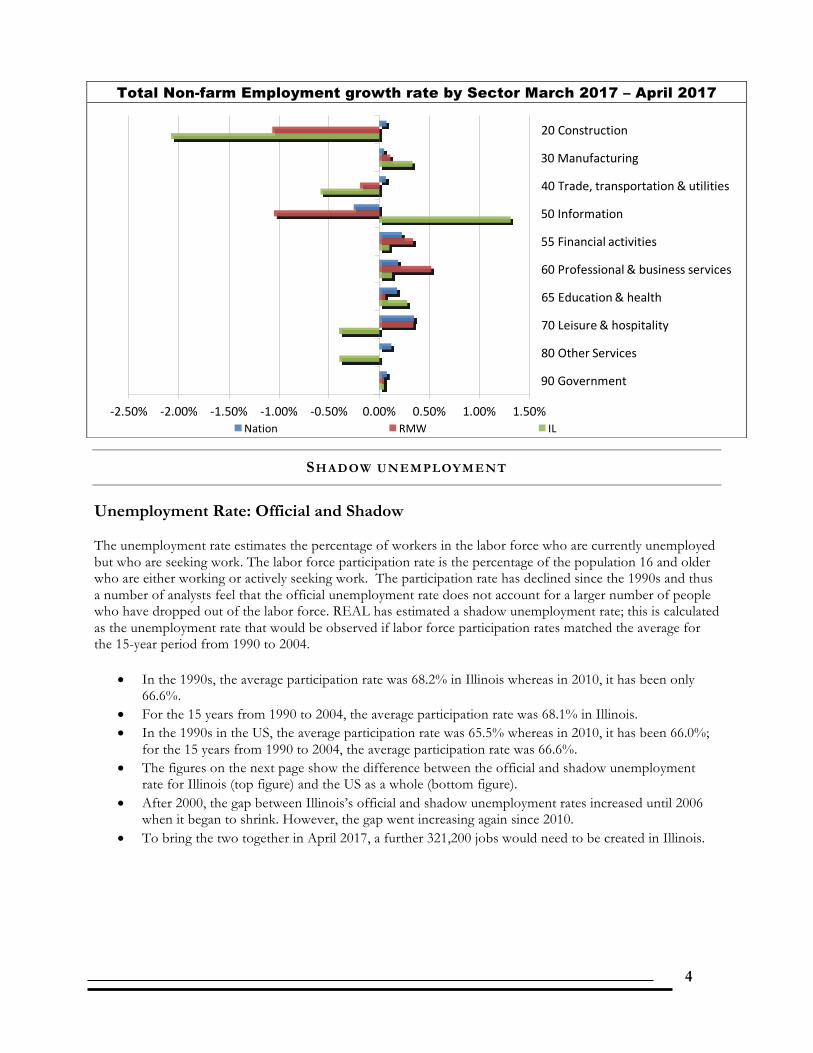
§ By April 2017 in Illinois, Professional & business services and Leisure & hospitality have both recovered to their previous employment peak levels. The 12-month-ahead job recovery forecasts show that the future recovery rates in Illinois will decrease for every sector except Information, Financial Activities, and Leisure & hospitality.
§ The shadow unemployment rates for Illinois, RMW and the Nation were 9.20%, 9.43% and 9.71%, compared to official unemployment rates of 4.7%, 4.1% and 4.4%.
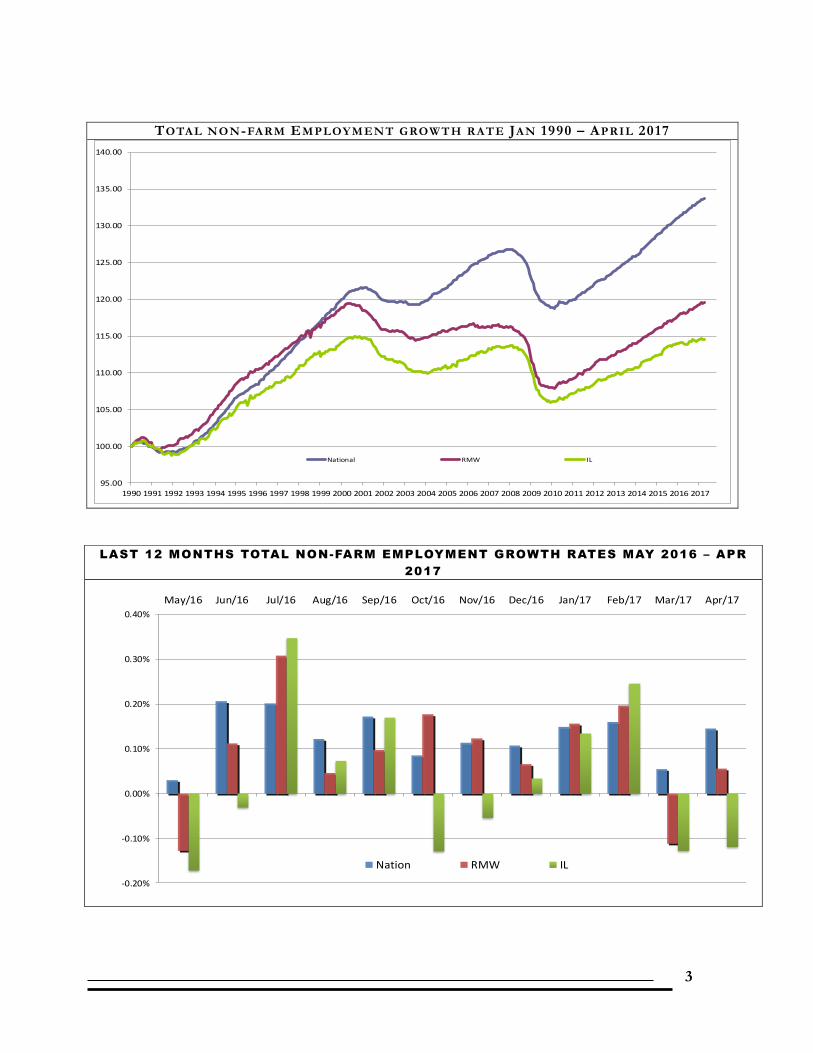
§ Through April 2017, the cumulative job growth for Illinois, RMW and the Nation compared to January 1990 stood at 14.44%, 19.48%, and 33.78%, respectively.
MAY 2017 EMPLOYMENT CHART
April
2017
Negative
Total Non-Farm
Employment
Mar 2017– Apr 2017 Last 12 months Apr 2017
Growth Rate %
Number of Jobs
Growth Rate %
Number of Jobs
Shadow U.R. **
Nation 0.14 211,000 1.56 2,237,000 9.71
RMW* 0.06 11,500 1.1 222,900 9.43
Illinois -0.12 -7,200 0.37 22,100 9.2
*RMW stands for Rest of the Midwest including six states, Indiana, Iowa, Michigan, Missouri, Ohio and Wisconsin. **REAL has estimated a shadow unemployment rate; this is calculated as the unemployment rate that would be observed if labor force participation rates matched the average for the 15-year period from 1990 to 2004.
3
TOTAL NON-FARM EMPLOYMENT GROWTH RATE JAN 1990 – APRIL 2017
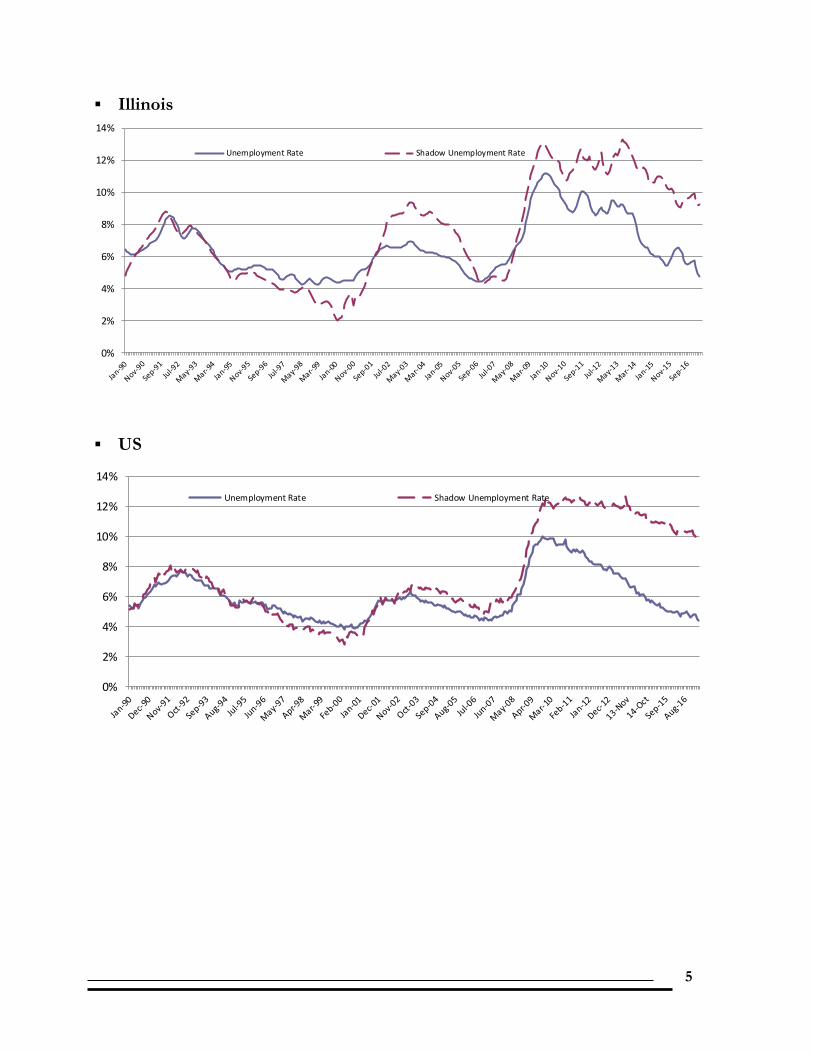
Unemployment Rate: Official and Shadow The unemployment rate estimates the percentage of workers in the labor force who are currently unemployed but who are seeking work. The labor force participation rate is the percentage of the population 16 and older who are either working or actively seeking work. The participation rate has declined since the 1990s and thus a number of analysts feel that the official unemployment rate does not account for a larger number of people who have dropped out of the labor force. REAL has estimated a shadow unemployment rate; this is calculated as the unemployment rate that would be observed if labor force participation rates matched the average for the 15-year period from 1990 to 2004.
• In the 1990s, the average participation rate was 68.2% in Illinois whereas in 2010, it has been only 66.6%.
• For the 15 years from 1990 to 2004, the average participation rate was 68.1% in Illinois. • In the 1990s in the US, the average participation rate was 65.5% whereas in 2010, it has been 66.0%;
for the 15 years from 1990 to 2004, the average participation rate was 66.6%. • The figures on the next page show the difference between the official and shadow unemployment
rate for Illinois (top figure) and the US as a whole (bottom figure). • After 2000, the gap between Illinois’s official and shadow unemployment rates increased until 2006
when it began to shrink. However, the gap went increasing again since 2010. • To bring the two together in April 2017, a further 321,200 jobs would need to be created in Illinois.
Total Non-farm Employment growth rate by Sector March 2017 – April 2017
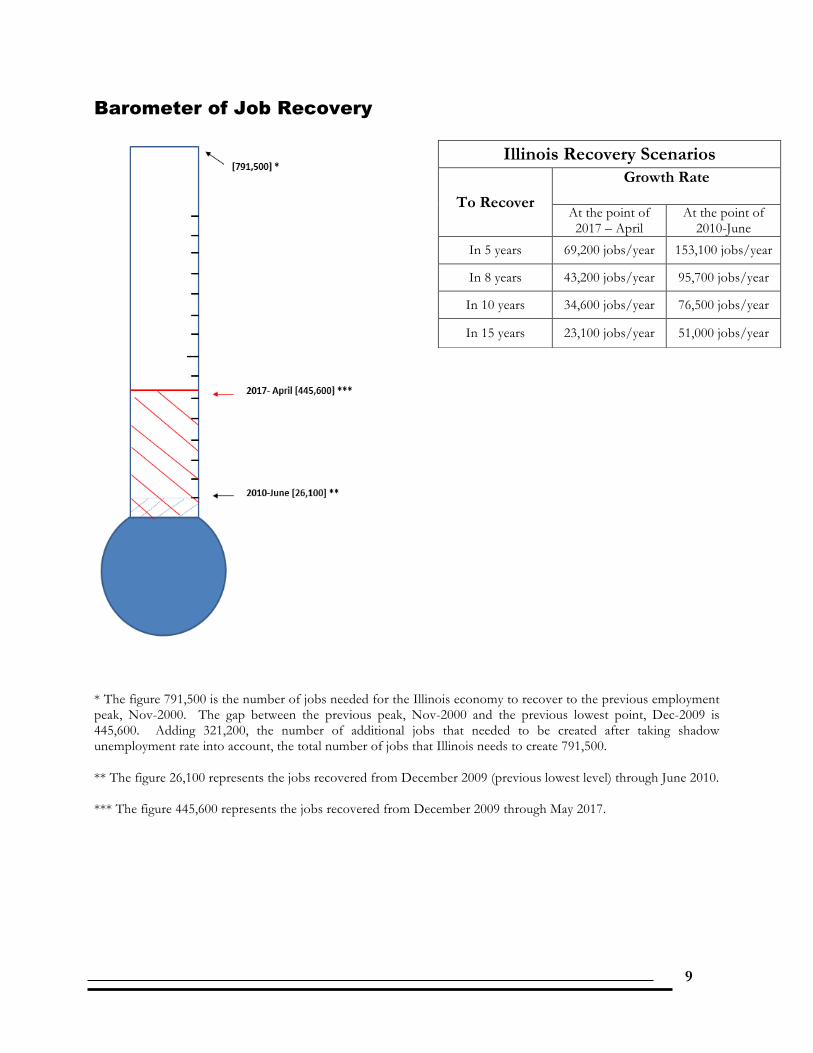
* The figure 791,500 is the number of jobs needed for the Illinois economy to recover to the previous employment peak, Nov-2000. The gap between the previous peak, Nov-2000 and the previous lowest point, Dec-2009 is 445,600. Adding 321,200, the number of additional jobs that needed to be created after taking shadow unemployment rate into account, the total number of jobs that Illinois needs to create 791,500. ** The figure 26,100 represents the jobs recovered from December 2009 (previous lowest level) through June 2010. *** The figure 445,600 represents the jobs recovered from December 2009 through May 2017.
Illinois Recovery Scenarios
To Recover Growth Rate
At the point of 2017 – April
At the point of 2010-June
In 5 years 69,200 jobs/year 153,100 jobs/year
In 8 years 43,200 jobs/year 95,700 jobs/year
In 10 years 34,600 jobs/year 76,500 jobs/year
In 15 years 23,100 jobs/year 51,000 jobs/year
10
ILLINOIS JOB RECOVERY BY SECTOR
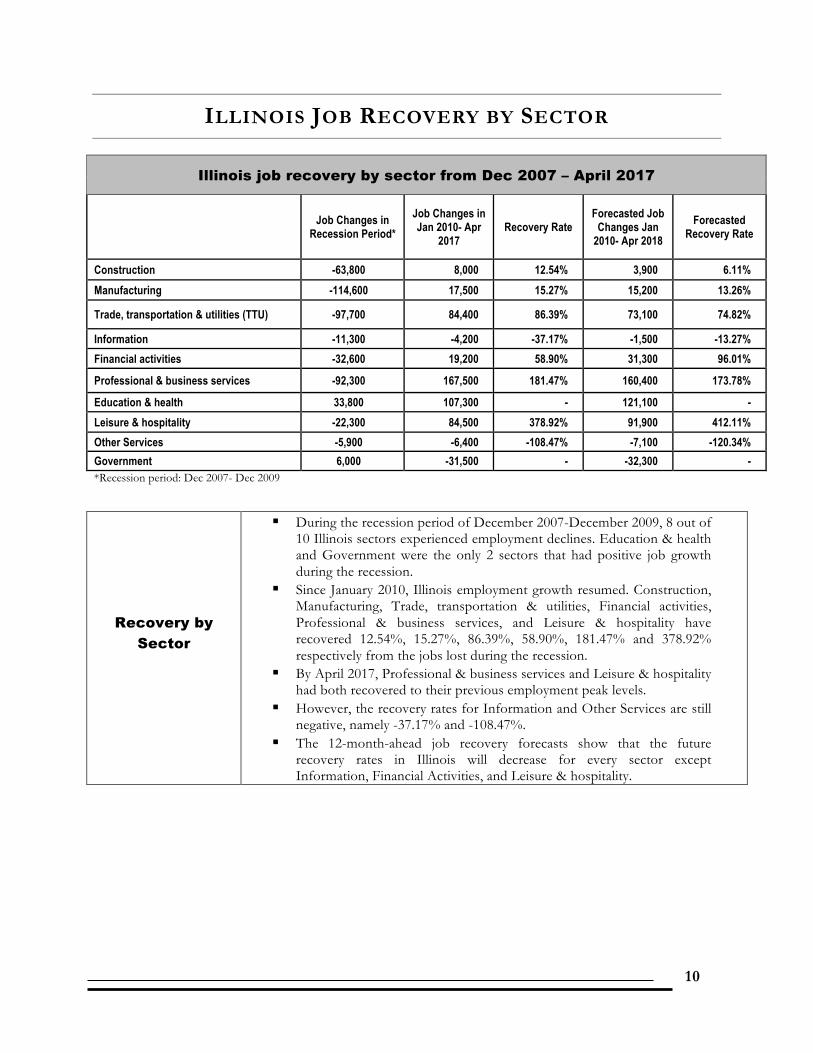
Illinois job recovery by sector from Dec 2007 – April 2017
Professional & business services -92,300 167,500 181.47% 160,400 173.78%
Education & health 33,800 107,300 - 121,100 - Leisure & hospitality -22,300 84,500 378.92% 91,900 412.11% Other Services -5,900 -6,400 -108.47% -7,100 -120.34% Government 6,000 -31,500 - -32,300 - *Recession period: Dec 2007- Dec 2009
Recovery by Sector
§ During the recession period of December 2007-December 2009, 8 out of 10 Illinois sectors experienced employment declines. Education & health and Government were the only 2 sectors that had positive job growth during the recession.
§ Since January 2010, Illinois employment growth resumed. Construction, Manufacturing, Trade, transportation & utilities, Financial activities, Professional & business services, and Leisure & hospitality have recovered 12.54%, 15.27%, 86.39%, 58.90%, 181.47% and 378.92% respectively from the jobs lost during the recession.
§ By April 2017, Professional & business services and Leisure & hospitality had both recovered to their previous employment peak levels.
§ However, the recovery rates for Information and Other Services are still negative, namely -37.17% and -108.47%.
§ The 12-month-ahead job recovery forecasts show that the future recovery rates in Illinois will decrease for every sector except Information, Financial Activities, and Leisure & hospitality.
11
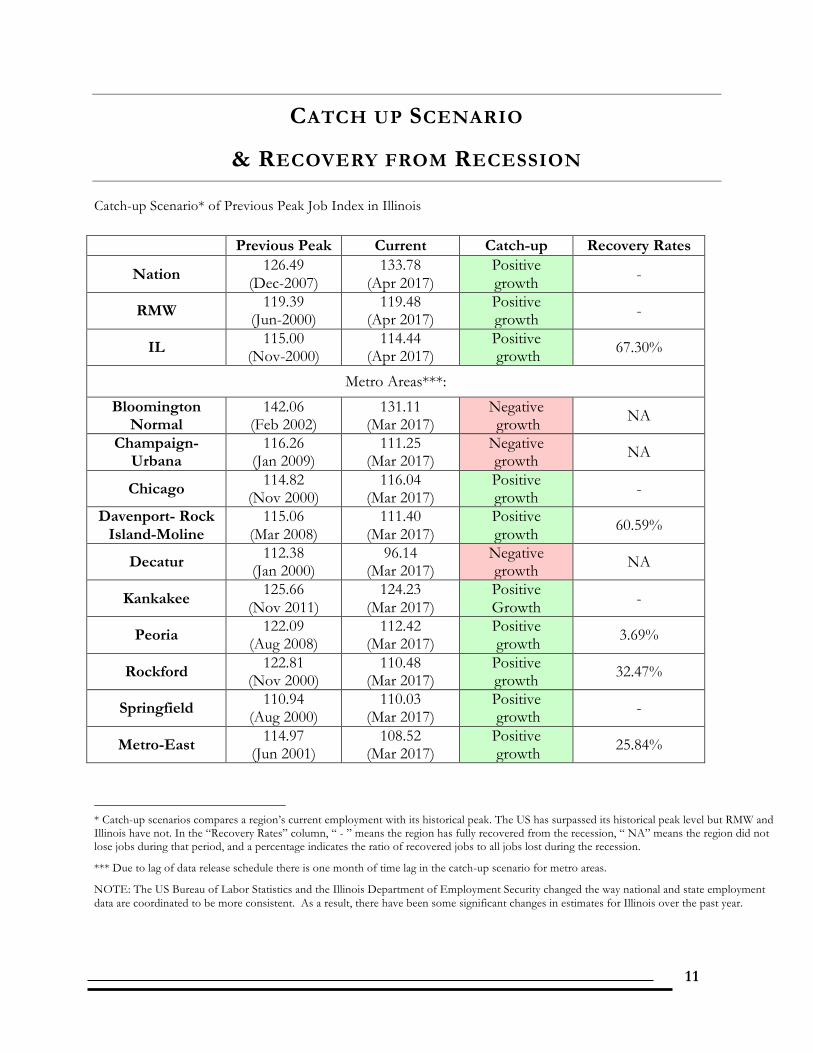
CATCH UP SCENARIO
& RECOVERY FROM RECESSION
Catch-up Scenario* of Previous Peak Job Index in Illinois
Previous Peak Current Catch-up Recovery Rates
Nation 126.49 (Dec-2007)
133.78 (Apr 2017)
Positive growth -
RMW 119.39 (Jun-2000)
119.48 (Apr 2017)
Positive growth -
IL 115.00 (Nov-2000)
114.44 (Apr 2017)
Positive growth 67.30%
Metro Areas***: Bloomington
Normal 142.06
(Feb 2002) 131.11
(Mar 2017) Negative growth NA
Champaign- Urbana
116.26 (Jan 2009)
111.25 (Mar 2017)
Negative growth NA
Chicago 114.82 (Nov 2000)
116.04 (Mar 2017)
Positive growth -
Davenport- Rock Island-Moline
115.06 (Mar 2008)
111.40 (Mar 2017)
Positive growth 60.59%
Decatur 112.38 (Jan 2000)
96.14 (Mar 2017)
Negative growth NA
Kankakee 125.66 (Nov 2011)
124.23 (Mar 2017)
Positive Growth -
Peoria 122.09 (Aug 2008)
112.42 (Mar 2017)
Positive growth 3.69%
Rockford 122.81 (Nov 2000)
110.48 (Mar 2017)
Positive growth 32.47%
Springfield 110.94 (Aug 2000)
110.03 (Mar 2017)
Positive growth -
Metro-East 114.97 (Jun 2001)
108.52 (Mar 2017)
Positive growth 25.84%
* Catch-up scenarios compares a region’s current employment with its historical peak. The US has surpassed its historical peak level but RMW and Illinois have not. In the “Recovery Rates” column, “ - ” means the region has fully recovered from the recession, “ NA” means the region did not lose jobs during that period, and a percentage indicates the ratio of recovered jobs to all jobs lost during the recession.
*** Due to lag of data release schedule there is one month of time lag in the catch-up scenario for metro areas.
NOTE: The US Bureau of Labor Statistics and the Illinois Department of Employment Security changed the way national and state employment data are coordinated to be more consistent. As a result, there have been some significant changes in estimates for Illinois over the past year.
12
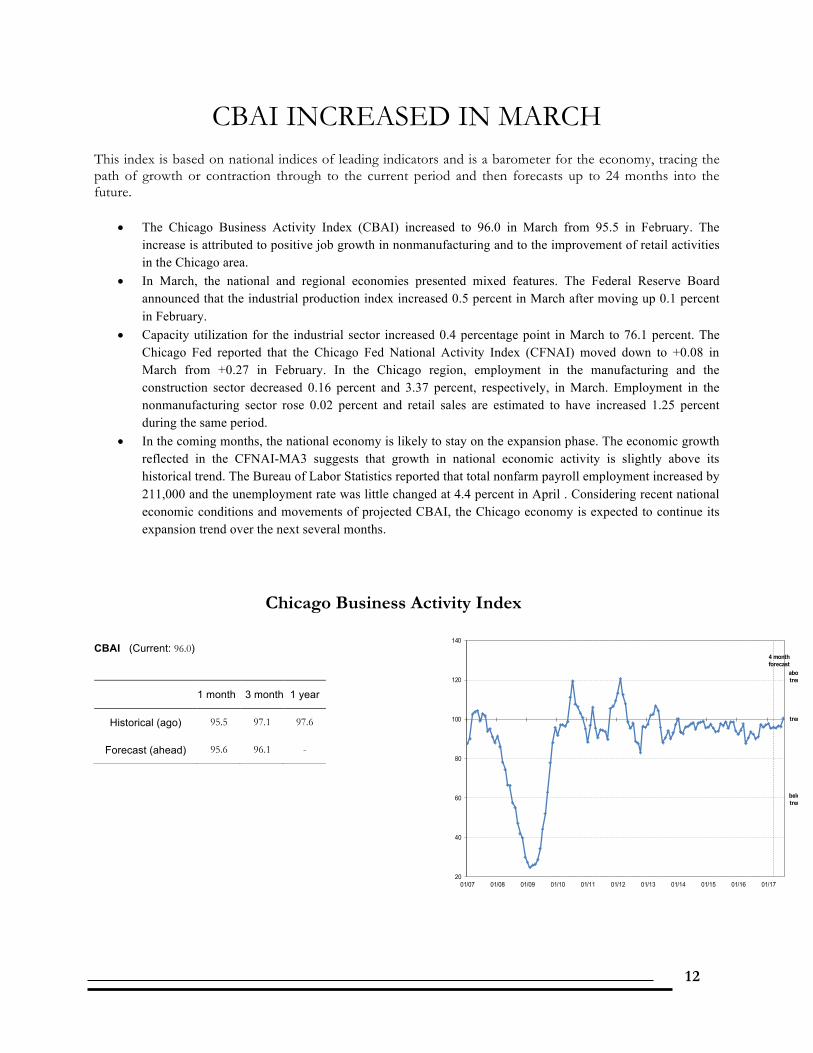
CBAI INCREASED IN MARCH This index is based on national indices of leading indicators and is a barometer for the economy, tracing the path of growth or contraction through to the current period and then forecasts up to 24 months into the future.
• The Chicago Business Activity Index (CBAI) increased to 96.0 in March from 95.5 in February. The increase is attributed to positive job growth in nonmanufacturing and to the improvement of retail activities in the Chicago area.
• In March, the national and regional economies presented mixed features. The Federal Reserve Board announced that the industrial production index increased 0.5 percent in March after moving up 0.1 percent in February.
• Capacity utilization for the industrial sector increased 0.4 percentage point in March to 76.1 percent. The Chicago Fed reported that the Chicago Fed National Activity Index (CFNAI) moved down to +0.08 in March from +0.27 in February. In the Chicago region, employment in the manufacturing and the construction sector decreased 0.16 percent and 3.37 percent, respectively, in March. Employment in the nonmanufacturing sector rose 0.02 percent and retail sales are estimated to have increased 1.25 percent during the same period.
• In the coming months, the national economy is likely to stay on the expansion phase. The economic growth reflected in the CFNAI-MA3 suggests that growth in national economic activity is slightly above its historical trend. The Bureau of Labor Statistics reported that total nonfarm payroll employment increased by 211,000 and the unemployment rate was little changed at 4.4 percent in April . Considering recent national economic conditions and movements of projected CBAI, the Chicago economy is expected to continue its expansion trend over the next several months.
§ Kankakee (3rd to 10th) experienced the deepest fall in March 2017.
§ Chicago (4th to 6th), Bloomington (1st to 7th), and Springfield (6th to 9th) also dropped in
terms of ranks from last month.
§ The most remarkable upward move in March was recorded for Davenport-Rock Island-
Moline (10th to 3rd).
§ In the 12-month growth league table, upward moves were recorded for Chicago (3rd to 2nd),
Champaign-Urbana-Rantoul (5th to 4th), Metro-East (7th to 6th), Decatur (8th to 7th) and
Peoria (10th to 9th).
§ Downward moves were recorded for Springfield (2nd to 3rd), Davenport-Rock Island-
Moline (4th to 5th), Bloomington-Normal (6th to 8th), and Rockford (9th to 10th).
§ In the 12-month growth league table, Rockford dropped to the last place while Kankakee
remained in the first place.
*NOTE: The US Bureau of Labor Statistics and the Illinois Department of Employment Security changed the way national and state employment data are coordinated to be more consistent. As a result, there have been some significant changes in estimates for Illinois over the past year.
14
MSA League Tables*: Non-farm Employment Growth Rate
* MSA League Tables are based on revised employment data. For instances of equal growth rate for multiple MSAs ranks are decided based on change of growth rate from previous month.