180
Illustrative disclosures for banks IAS 39 31 December 2016 year ends kpmg.com/ifrs

Illustrative disclosures for banksIAS 39
31 December 2016 year ends
kpmg.com/ifrs
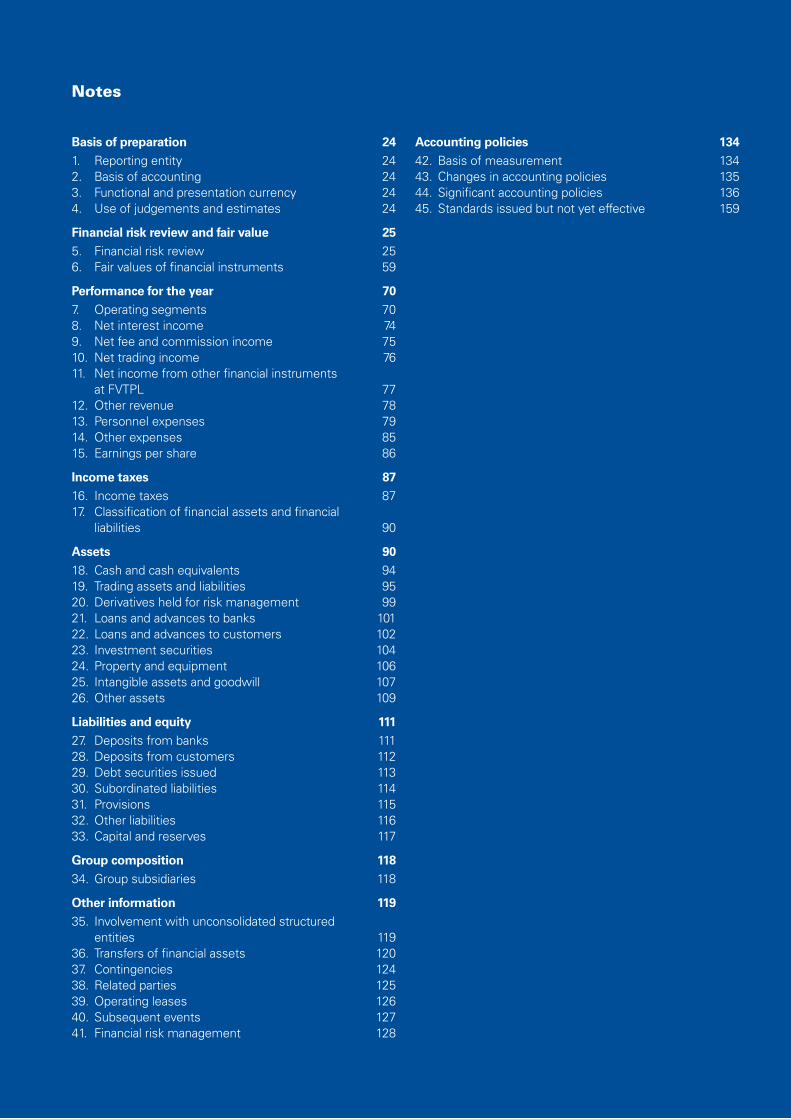
ContentsAbout this guide 2
Independent auditors’ report 6
Consolidated financial statements 12
Financial highlights 13
Consolidated statement of financial position 14
Consolidated statement of profit or loss and other comprehensive income 16
Consolidated statement of changes in equity 18
Consolidated statement of cash flows 22
Notes to the consolidated financial statements 24
Appendices 171
I New standards or amendments for 2016 and forthcoming requirements 171
II Presentation of comprehensive income – Two-statement approach 173
Acknowledgements 175
Keeping in touch 176
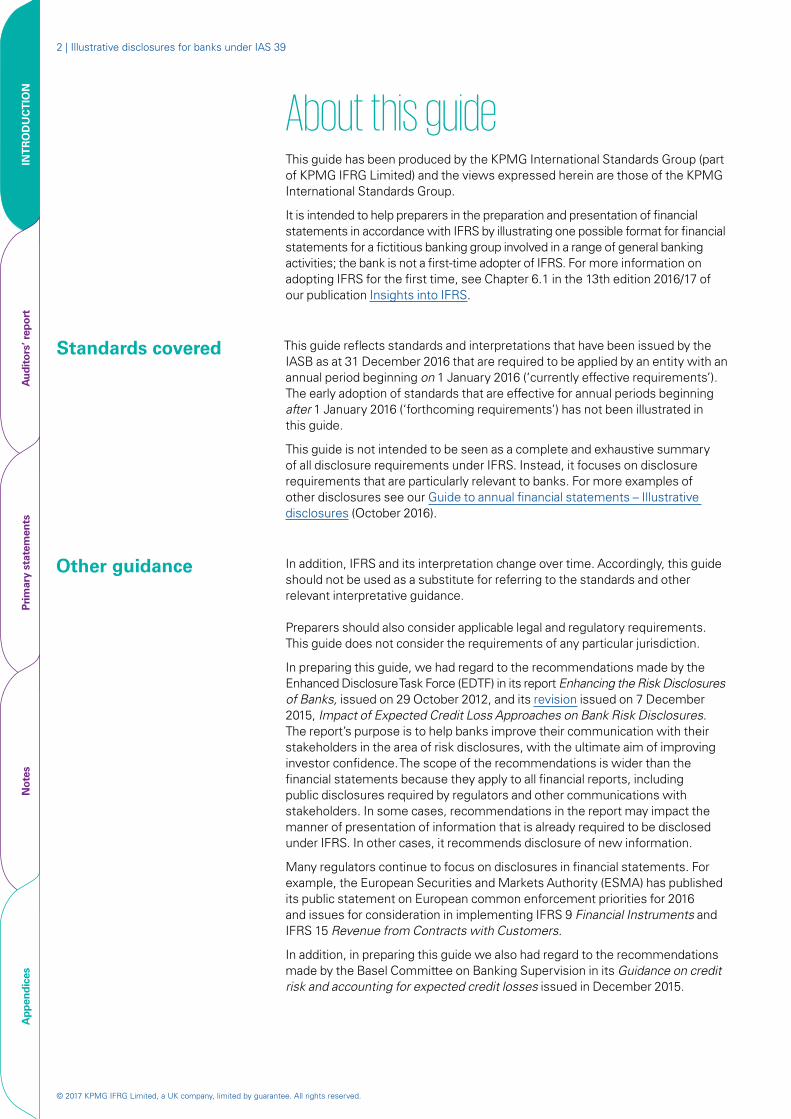
Notes
Basis of preparation 241. Reporting entity 242. Basis of accounting 243. Functional and presentation currency 244. Use of judgements and estimates 24
Financial risk review and fair value 255. Financial risk review 256. Fair values of financial instruments 59
Performance for the year 707. Operating segments 708. Net interest income 749. Net fee and commission income 7510. Net trading income 7611. Net income from other financial instruments
at FVTPL 7712. Other revenue 7813. Personnel expenses 7914. Other expenses 8515. Earnings per share 86
Income taxes 8716. Income taxes 8717. Classification of financial assets and financial
liabilities 90
Assets 9018. Cash and cash equivalents 9419. Trading assets and liabilities 9520. Derivatives held for risk management 9921. Loans and advances to banks 10122. Loans and advances to customers 10223. Investment securities 10424. Property and equipment 10625. Intangible assets and goodwill 10726. Other assets 109
Liabilities and equity 11127. Deposits from banks 11128. Deposits from customers 11229. Debt securities issued 11330. Subordinated liabilities 11431. Provisions 11532. Other liabilities 11633. Capital and reserves 117
Group composition 11834. Group subsidiaries 118
Other information 11935. Involvement with unconsolidated structured
entities 11936. Transfers of financial assets 12037. Contingencies 12438. Related parties 12539. Operating leases 12640. Subsequent events 12741. Financial risk management 128
Accounting policies 13442. Basis of measurement 13443. Changes in accounting policies 13544. Significant accounting policies 13645. Standards issued but not yet effective 159
© 2017 KPMG IFRG Limited, a UK company, limited by guarantee. All rights reserved.
2 | Illustrative disclosures for banks under IAS 39
INT
RO
DU
CT
ION
Aud
itor
s’ r
epor
tPr
imar
y st
atem
ents
Not
esA
ppen
dice
s
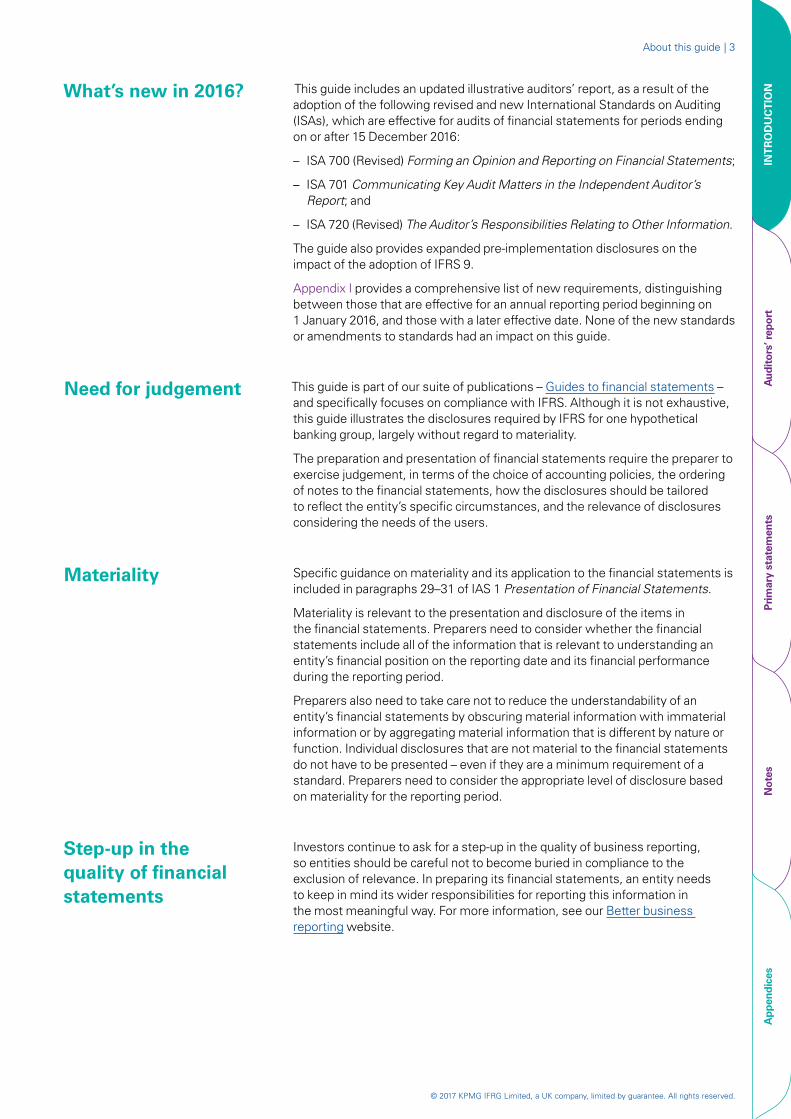
About this guideThis guide has been produced by the KPMG International Standards Group (part of KPMG IFRG Limited) and the views expressed herein are those of the KPMG International Standards Group.
It is intended to help preparers in the preparation and presentation of financial statements in accordance with IFRS by illustrating one possible format for financial statements for a fictitious banking group involved in a range of general banking activities; the bank is not a first-time adopter of IFRS. For more information on adopting IFRS for the first time, see Chapter 6.1 in the 13th edition 2016/17 of our publication Insights into IFRS.
This guide reflects standards and interpretations that have been issued by the IASB as at 31 December 2016 that are required to be applied by an entity with an annual period beginning on 1 January 2016 (‘currently effective requirements’). The early adoption of standards that are effective for annual periods beginning after 1 January 2016 (‘forthcoming requirements’) has not been illustrated in this guide.
This guide is not intended to be seen as a complete and exhaustive summary of all disclosure requirements under IFRS. Instead, it focuses on disclosure requirements that are particularly relevant to banks. For more examples of other disclosures see our Guide to annual financial statements – Illustrative disclosures (October 2016).
In addition, IFRS and its interpretation change over time. Accordingly, this guide should not be used as a substitute for referring to the standards and other relevant interpretative guidance.
Preparers should also consider applicable legal and regulatory requirements. This guide does not consider the requirements of any particular jurisdiction.
In preparing this guide, we had regard to the recommendations made by the Enhanced Disclosure Task Force (EDTF) in its report Enhancing the Risk Disclosures of Banks, issued on 29 October 2012, and its revision issued on 7 December 2015, Impact of Expected Credit Loss Approaches on Bank Risk Disclosures. The report’s purpose is to help banks improve their communication with their stakeholders in the area of risk disclosures, with the ultimate aim of improving investor confidence. The scope of the recommendations is wider than the financial statements because they apply to all financial reports, including public disclosures required by regulators and other communications with stakeholders. In some cases, recommendations in the report may impact the manner of presentation of information that is already required to be disclosed under IFRS. In other cases, it recommends disclosure of new information.
Many regulators continue to focus on disclosures in financial statements. For example, the European Securities and Markets Authority (ESMA) has published its public statement on European common enforcement priorities for 2016 and issues for consideration in implementing IFRS 9 Financial Instruments and IFRS 15 Revenue from Contracts with Customers.
In addition, in preparing this guide we also had regard to the recommendations made by the Basel Committee on Banking Supervision in its Guidance on credit risk and accounting for expected credit losses issued in December 2015.
Standards covered
Other guidance
© 2017 KPMG IFRG Limited, a UK company, limited by guarantee. All rights reserved.
| 3
INT
RO
DU
CT
ION
Aud
itor
s’ r
epor
tPr
imar
y st
atem
ents
Not
esA
ppen
dice
s
This guide includes an updated illustrative auditors’ report, as a result of the adoption of the following revised and new International Standards on Auditing (ISAs), which are effective for audits of financial statements for periods ending on or after 15 December 2016:
– ISA 700 (Revised) Forming an Opinion and Reporting on Financial Statements;
– ISA 701 Communicating Key Audit Matters in the Independent Auditor’s Report; and
– ISA 720 (Revised) The Auditor’s Responsibilities Relating to Other Information.
The guide also provides expanded pre-implementation disclosures on the impact of the adoption of IFRS 9.
Appendix I provides a comprehensive list of new requirements, distinguishing between those that are effective for an annual reporting period beginning on 1 January 2016, and those with a later effective date. None of the new standards or amendments to standards had an impact on this guide.
This guide is part of our suite of publications – Guides to financial statements – and specifically focuses on compliance with IFRS. Although it is not exhaustive, this guide illustrates the disclosures required by IFRS for one hypothetical banking group, largely without regard to materiality.
The preparation and presentation of financial statements require the preparer to exercise judgement, in terms of the choice of accounting policies, the ordering of notes to the financial statements, how the disclosures should be tailored to reflect the entity’s specific circumstances, and the relevance of disclosures considering the needs of the users.
Specific guidance on materiality and its application to the financial statements is included in paragraphs 29–31 of IAS 1 Presentation of Financial Statements.
Materiality is relevant to the presentation and disclosure of the items in the financial statements. Preparers need to consider whether the financial statements include all of the information that is relevant to understanding an entity’s financial position on the reporting date and its financial performance during the reporting period.
Preparers also need to take care not to reduce the understandability of an entity’s financial statements by obscuring material information with immaterial information or by aggregating material information that is different by nature or function. Individual disclosures that are not material to the financial statements do not have to be presented – even if they are a minimum requirement of a standard. Preparers need to consider the appropriate level of disclosure based on materiality for the reporting period.
Investors continue to ask for a step-up in the quality of business reporting, so entities should be careful not to become buried in compliance to the exclusion of relevance. In preparing its financial statements, an entity needs to keep in mind its wider responsibilities for reporting this information in the most meaningful way. For more information, see our Better business reporting website.
What’s new in 2016?
Need for judgement
Materiality
Step-up in the quality of financial statements
About this guide
© 2017 KPMG IFRG Limited, a UK company, limited by guarantee. All rights reserved.
4 | Illustrative disclosures for banks under IAS 39
INT
RO
DU
CT
ION
Aud
itor
s’ r
epor
tPr
imar
y st
atem
ents
Not
esA
ppen
dice
s
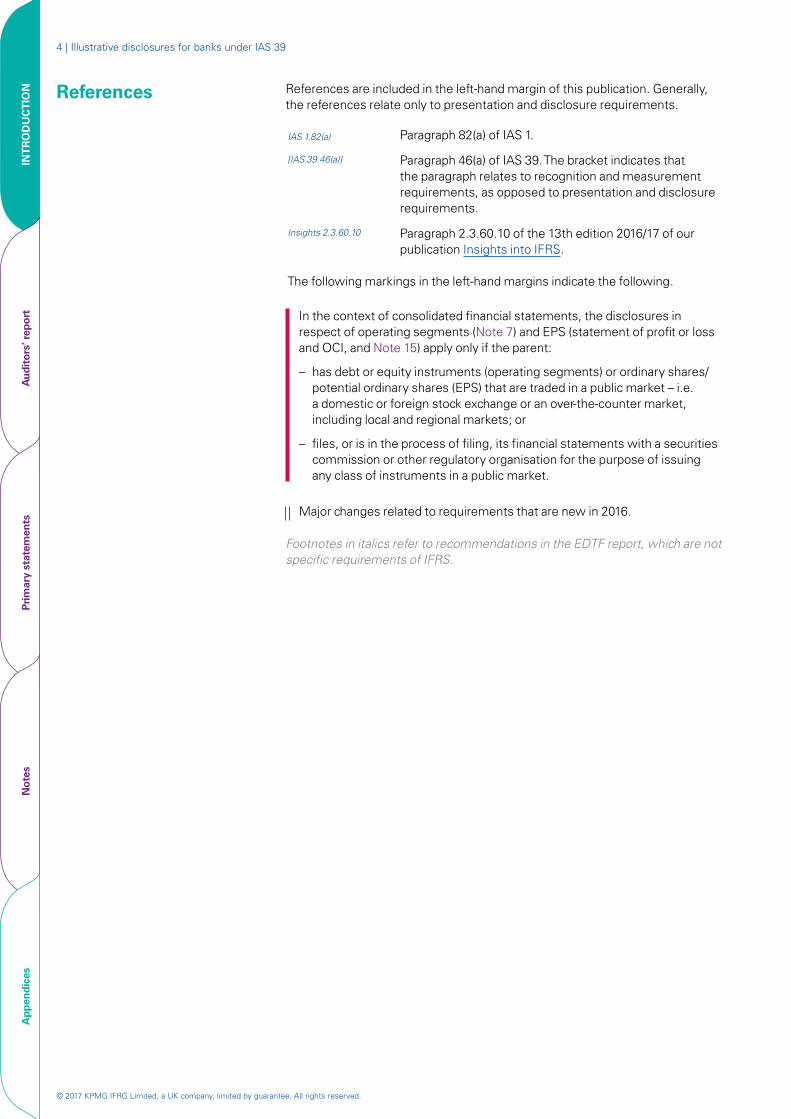
References References are included in the left-hand margin of this publication. Generally, the references relate only to presentation and disclosure requirements.
IAS 1.82(a) Paragraph 82(a) of IAS 1.
[IAS 39.46(a)] Paragraph 46(a) of IAS 39. The bracket indicates that the paragraph relates to recognition and measurement requirements, as opposed to presentation and disclosure requirements.
Insights 2.3.60.10 Paragraph 2.3.60.10 of the 13th edition 2016/17 of our publication Insights into IFRS.
The following markings in the left-hand margins indicate the following.
In the context of consolidated financial statements, the disclosures in respect of operating segments (Note 7) and EPS (statement of profit or loss and OCI, and Note 15) apply only if the parent:
– has debt or equity instruments (operating segments) or ordinary shares/potential ordinary shares (EPS) that are traded in a public market – i.e. a domestic or foreign stock exchange or an over-the-counter market, including local and regional markets; or
– files, or is in the process of filing, its financial statements with a securities commission or other regulatory organisation for the purpose of issuing any class of instruments in a public market.
Major changes related to requirements that are new in 2016.
Footnotes in italics refer to recommendations in the EDTF report, which are not specific requirements of IFRS.
© 2017 KPMG IFRG Limited, a UK company, limited by guarantee. All rights reserved.
| 5
INT
RO
DU
CT
ION
Aud
itor
s’ r
epor
tPr
imar
y st
atem
ents
Not
esA
ppen
dice
s
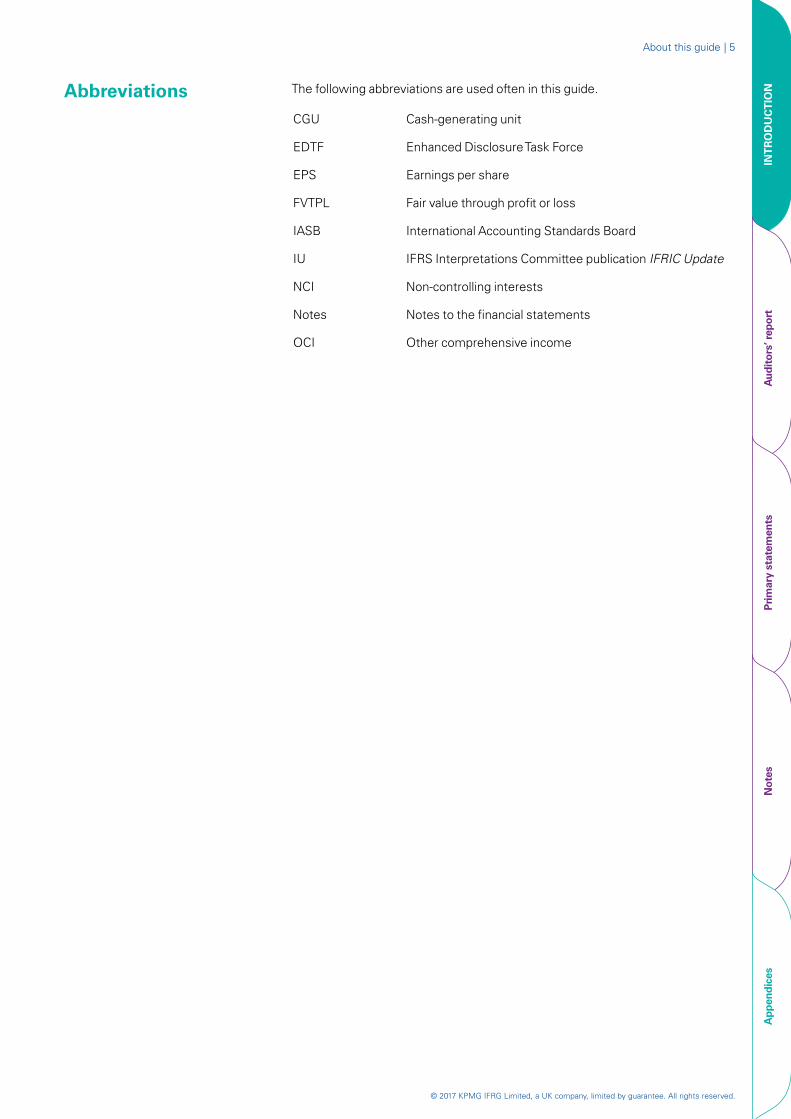
The following abbreviations are used often in this guide.
CGU Cash-generating unit
EDTF Enhanced Disclosure Task Force
EPS Earnings per share
FVTPL Fair value through profit or loss
IASB International Accounting Standards Board
IU IFRS Interpretations Committee publication IFRIC Update
NCI Non-controlling interests
Notes Notes to the financial statements
OCI Other comprehensive income
Abbreviations
About this guide

© 2017 KPMG IFRG Limited, a UK company, limited by guarantee. All rights reserved.
6 | Illustrative disclosures for banks under IAS 39
Intr
oduc
tion
AU
DIT
OR
S’ R
EP
OR
TPr
imar
y st
atem
ents
Not
esA
ppen
dice
s
[Name of bank]
Independent auditors’ report
© 2017 KPMG IFRG Limited, a UK company, limited by guarantee. All rights reserved.
Independent auditors’ report | 7
Intr
oduc
tion
AU
DIT
OR
S’ R
EP
OR
TPr
imar
y st
atem
ents
Not
esA
ppen
dice
s
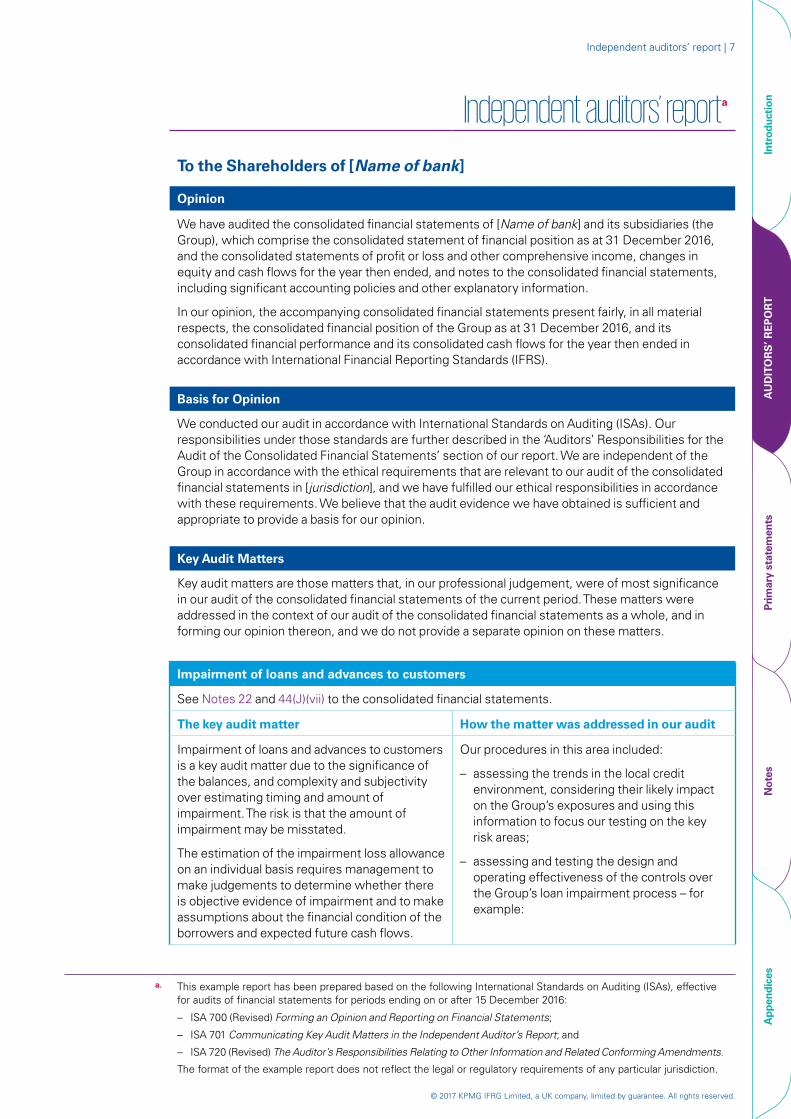
Independent auditors’ reporta
To the Shareholders of [Name of bank]
Opinion
We have audited the consolidated financial statements of [Name of bank] and its subsidiaries (the Group), which comprise the consolidated statement of financial position as at 31 December 2016, and the consolidated statements of profit or loss and other comprehensive income, changes in equity and cash flows for the year then ended, and notes to the consolidated financial statements, including significant accounting policies and other explanatory information.
In our opinion, the accompanying consolidated financial statements present fairly, in all material respects, the consolidated financial position of the Group as at 31 December 2016, and its consolidated financial performance and its consolidated cash flows for the year then ended in accordance with International Financial Reporting Standards (IFRS).
Basis for Opinion
We conducted our audit in accordance with International Standards on Auditing (ISAs). Our responsibilities under those standards are further described in the ‘Auditors’ Responsibilities for the Audit of the Consolidated Financial Statements’ section of our report. We are independent of the Group in accordance with the ethical requirements that are relevant to our audit of the consolidated financial statements in [jurisdiction], and we have fulfilled our ethical responsibilities in accordance with these requirements. We believe that the audit evidence we have obtained is sufficient and appropriate to provide a basis for our opinion.
Key Audit Matters
Key audit matters are those matters that, in our professional judgement, were of most significance in our audit of the consolidated financial statements of the current period. These matters were addressed in the context of our audit of the consolidated financial statements as a whole, and in forming our opinion thereon, and we do not provide a separate opinion on these matters.
Impairment of loans and advances to customers
See Notes 22 and 44(J)(vii) to the consolidated financial statements.
The key audit matter How the matter was addressed in our audit
Impairment of loans and advances to customers is a key audit matter due to the significance of the balances, and complexity and subjectivity over estimating timing and amount of impairment. The risk is that the amount of impairment may be misstated.
The estimation of the impairment loss allowance on an individual basis requires management to make judgements to determine whether there is objective evidence of impairment and to make assumptions about the financial condition of the borrowers and expected future cash flows.
Our procedures in this area included:
– assessing the trends in the local credit environment, considering their likely impact on the Group’s exposures and using this information to focus our testing on the key risk areas;
– assessing and testing the design and operating effectiveness of the controls over the Group’s loan impairment process – for example:
a. This example report has been prepared based on the following International Standards on Auditing (ISAs), effective for audits of financial statements for periods ending on or after 15 December 2016:
– ISA 700 (Revised) Forming an Opinion and Reporting on Financial Statements;
– ISA 701 Communicating Key Audit Matters in the Independent Auditor’s Report; and
– ISA 720 (Revised) The Auditor’s Responsibilities Relating to Other Information and Related Conforming Amendments.
The format of the example report does not reflect the legal or regulatory requirements of any particular jurisdiction.
© 2017 KPMG IFRG Limited, a UK company, limited by guarantee. All rights reserved.
8 | Illustrative disclosures for banks under IAS 39
Intr
oduc
tion
AU
DIT
OR
S’ R
EP
OR
TPr
imar
y st
atem
ents
Not
esA
ppen
dice
s
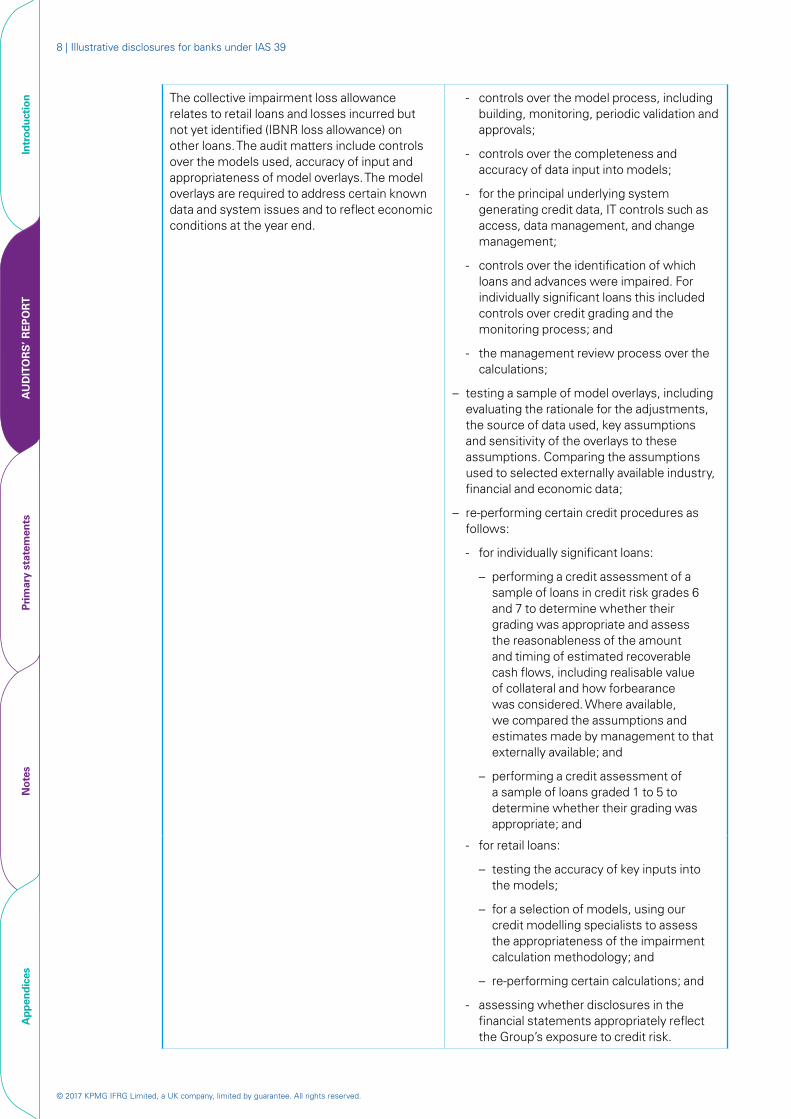
The collective impairment loss allowance relates to retail loans and losses incurred but not yet identified (IBNR loss allowance) on other loans. The audit matters include controls over the models used, accuracy of input and appropriateness of model overlays. The model overlays are required to address certain known data and system issues and to reflect economic conditions at the year end.
- controls over the model process, including building, monitoring, periodic validation and approvals;
- controls over the completeness and accuracy of data input into models;
- for the principal underlying system generating credit data, IT controls such as access, data management, and change management;
- controls over the identification of which loans and advances were impaired. For individually significant loans this included controls over credit grading and the monitoring process; and
- the management review process over the calculations;
– testing a sample of model overlays, including evaluating the rationale for the adjustments, the source of data used, key assumptions and sensitivity of the overlays to these assumptions. Comparing the assumptions used to selected externally available industry, financial and economic data;
– re-performing certain credit procedures as follows:
- for individually significant loans:
– performing a credit assessment of a sample of loans in credit risk grades 6 and 7 to determine whether their grading was appropriate and assess the reasonableness of the amount and timing of estimated recoverable cash flows, including realisable value of collateral and how forbearance was considered. Where available, we compared the assumptions and estimates made by management to that externally available; and
– performing a credit assessment of a sample of loans graded 1 to 5 to determine whether their grading was appropriate; and
- for retail loans:
– testing the accuracy of key inputs into the models;
– for a selection of models, using our credit modelling specialists to assess the appropriateness of the impairment calculation methodology; and
– re-performing certain calculations; and
- assessing whether disclosures in the financial statements appropriately reflect the Group’s exposure to credit risk.
© 2017 KPMG IFRG Limited, a UK company, limited by guarantee. All rights reserved.
Independent auditors’ report | 9
Intr
oduc
tion
AU
DIT
OR
S’ R
EP
OR
TPr
imar
y st
atem
ents
Not
esA
ppen
dice
s
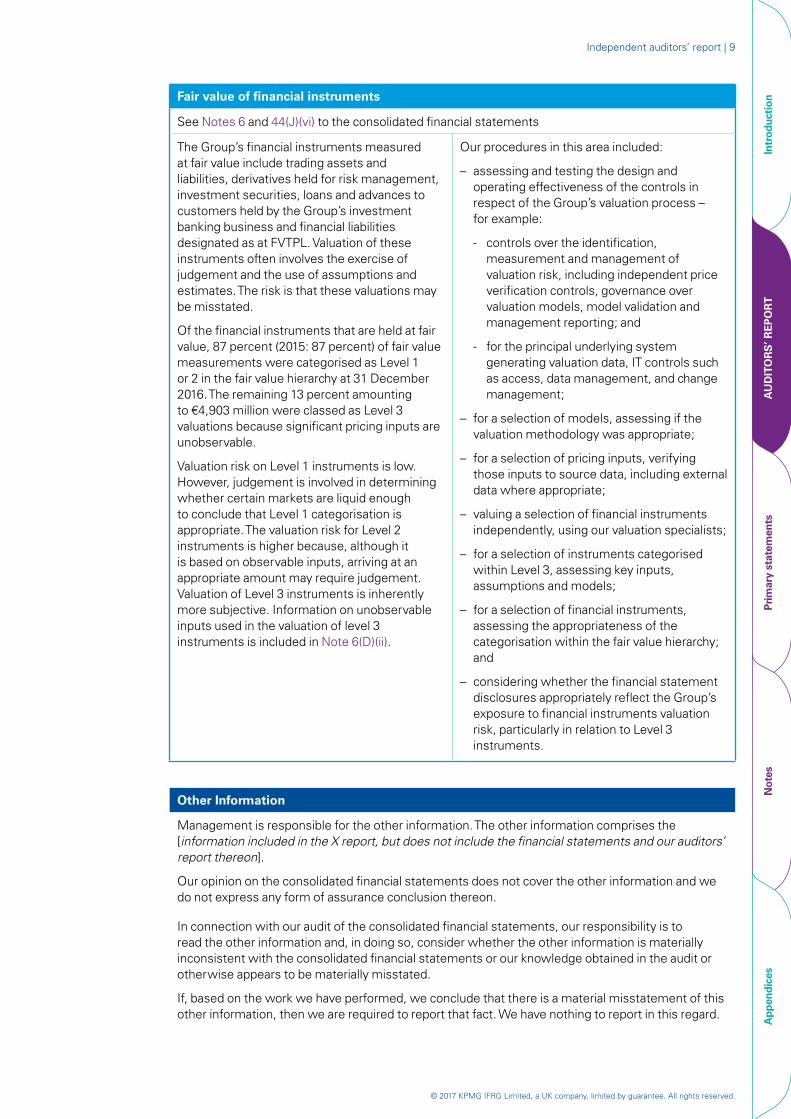
Fair value of financial instruments
See Notes 6 and 44(J)(vi) to the consolidated financial statements
The Group’s financial instruments measured at fair value include trading assets and liabilities, derivatives held for risk management, investment securities, loans and advances to customers held by the Group’s investment banking business and financial liabilities designated as at FVTPL. Valuation of these instruments often involves the exercise of judgement and the use of assumptions and estimates. The risk is that these valuations may be misstated.
Of the financial instruments that are held at fair value, 87 percent (2015: 87 percent) of fair value measurements were categorised as Level 1 or 2 in the fair value hierarchy at 31 December 2016. The remaining 13 percent amounting to €4,903 million were classed as Level 3 valuations because significant pricing inputs are unobservable.
Valuation risk on Level 1 instruments is low. However, judgement is involved in determining whether certain markets are liquid enough to conclude that Level 1 categorisation is appropriate. The valuation risk for Level 2 instruments is higher because, although it is based on observable inputs, arriving at an appropriate amount may require judgement. Valuation of Level 3 instruments is inherently more subjective. Information on unobservable inputs used in the valuation of level 3 instruments is included in Note 6(D)(ii).
Our procedures in this area included:
– assessing and testing the design and operating effectiveness of the controls in respect of the Group’s valuation process – for example:
- controls over the identification, measurement and management of valuation risk, including independent price verification controls, governance over valuation models, model validation and management reporting; and
- for the principal underlying system generating valuation data, IT controls such as access, data management, and change management;
– for a selection of models, assessing if the valuation methodology was appropriate;
– for a selection of pricing inputs, verifying those inputs to source data, including external data where appropriate;
– valuing a selection of financial instruments independently, using our valuation specialists;
– for a selection of instruments categorised within Level 3, assessing key inputs, assumptions and models;
– for a selection of financial instruments, assessing the appropriateness of the categorisation within the fair value hierarchy; and
– considering whether the financial statement disclosures appropriately reflect the Group’s exposure to financial instruments valuation risk, particularly in relation to Level 3 instruments.
Other Information
Management is responsible for the other information. The other information comprises the [information included in the X report, but does not include the financial statements and our auditors’ report thereon].
Our opinion on the consolidated financial statements does not cover the other information and we do not express any form of assurance conclusion thereon.
In connection with our audit of the consolidated financial statements, our responsibility is to read the other information and, in doing so, consider whether the other information is materially inconsistent with the consolidated financial statements or our knowledge obtained in the audit or otherwise appears to be materially misstated.
If, based on the work we have performed, we conclude that there is a material misstatement of this other information, then we are required to report that fact. We have nothing to report in this regard.
© 2017 KPMG IFRG Limited, a UK company, limited by guarantee. All rights reserved.
10 | Illustrative disclosures for banks under IAS 39
Intr
oduc
tion
AU
DIT
OR
S’ R
EP
OR
TPr
imar
y st
atem
ents
Not
esA
ppen
dice
s
Responsibilities of Management and Those Charged with Governance for the Consolidated Financial Statements
Management is responsible for the preparation and fair presentation of the consolidated financial statements in accordance with IFRS, and for such internal control as management determines is necessary to enable the preparation of consolidated financial statements that are free from material misstatement, whether due to fraud or error.
In preparing the consolidated financial statements, management is responsible for assessing the Group’s ability to continue as a going concern, disclosing, as applicable, matters related to going concern and using the going concern basis of accounting unless management either intends to liquidate the Group or to cease operations, or has no realistic alternative but to do so.
Those charged with governance are responsible for overseeing the Group’s financial reporting process.
Auditors’ Responsibilities for the Audit of the Consolidated Financial Statements
Our objectives are to obtain reasonable assurance about whether the consolidated financial statements as a whole are free from material misstatement, whether due to fraud or error, and to issue an auditors’ report that includes our opinion. Reasonable assurance is a high level of assurance, but is not a guarantee that an audit conducted in accordance with ISAs will always detect a material misstatement when it exists. Misstatements can arise from fraud or error and are considered material if, individually or in the aggregate, they could reasonably be expected to influence the economic decisions of users taken on the basis of these consolidated financial statements.
As part of an audit in accordance with ISAs, we exercise professional judgement and maintain professional scepticism throughout the audit. We also:
– Identify and assess the risks of material misstatement of the consolidated financial statements, whether due to fraud or error, design and perform audit procedures responsive to those risks, and obtain audit evidence that is sufficient and appropriate to provide a basis for our opinion. The risk of not detecting a material misstatement resulting from fraud is higher than for one resulting from error, as fraud may involve collusion, forgery, intentional omissions, misrepresentations, or the override of internal control.
– Obtain an understanding of internal control relevant to the audit in order to design audit procedures that are appropriate in the circumstances, but not for the purpose of expressing an opinion on the effectiveness of the Group’s internal control.
– Evaluate the appropriateness of accounting policies used and the reasonableness of accounting estimates and related disclosures made by management.
– Conclude on the appropriateness of management’s use of the going concern basis of accounting and, based on the audit evidence obtained, whether a material uncertainty exists related to events or conditions that may cast significant doubt on the Group’s ability to continue as a going concern. If we conclude that a material uncertainty exists, then we are required to draw attention in our auditors’ report to the related disclosures in the consolidated financial statements or, if such disclosures are inadequate, to modify our opinion. Our conclusions are based on the audit evidence obtained up to the date of our auditors’ report. However, future events or conditions may cause the Group to cease to continue as a going concern.
– Evaluate the overall presentation, structure and content of the consolidated financial statements, including the disclosures, and whether the consolidated financial statements represent the underlying transactions and events in a manner that achieves fair presentation.
– Obtain sufficient appropriate audit evidence regarding the financial information of the entities or business activities within the Group to express an opinion on the consolidated financial statements. We are responsible for the direction, supervision and performance of the Group audit. We remain solely responsible for our audit opinion.
© 2017 KPMG IFRG Limited, a UK company, limited by guarantee. All rights reserved.
Independent auditors’ report | 11
Intr
oduc
tion
AU
DIT
OR
S’ R
EP
OR
TPr
imar
y st
atem
ents
Not
esA
ppen
dice
s
We communicate with those charged with governance regarding, among other matters, the planned scope and timing of the audit and significant audit findings, including any significant deficiencies in internal control that we identify during our audit.
We also provide those charged with governance with a statement that we have complied with relevant ethical requirements regarding independence, and communicate with them all relationships and other matters that may reasonably be thought to bear on our independence and, where applicable, related safeguards.
From the matters communicated with those charged with governance, we determine those matters that were of most significance in the audit of the consolidated financial statements of the current period and are therefore the key audit matters. We describe these matters in our auditors’ report unless law or regulation precludes public disclosure about the matter or when, in extremely rare circumstances, we determine that a matter should not be communicated in our report because the adverse consequences of doing so would reasonably be expected to outweigh the public interest benefits of such communication.
The engagement partner on the audit resulting in this independent auditors’ report is [name].
[Signature as appropriate for the particular jurisdiction] [Auditors’ Address] [Date]
© 2017 KPMG IFRG Limited, a UK company, limited by guarantee. All rights reserved.
12 | Illustrative disclosures for banks under IAS 39
Intr
oduc
tion
Aud
itor
s’ r
epor
tP
RIM
AR
Y S
TAT
EM
EN
TS
Not
esA
ppen
dice
s
[Name of bank]
Consolidated financial statements
31 December 2016
© 2017 KPMG IFRG Limited, a UK company, limited by guarantee. All rights reserved.
Illustrative disclosures – Primary statements | 13
Intr
oduc
tion
Aud
itor
s’ r
epor
tP
RIM
AR
Y S
TAT
EM
EN
TS
Not
esA
ppen
dice
s
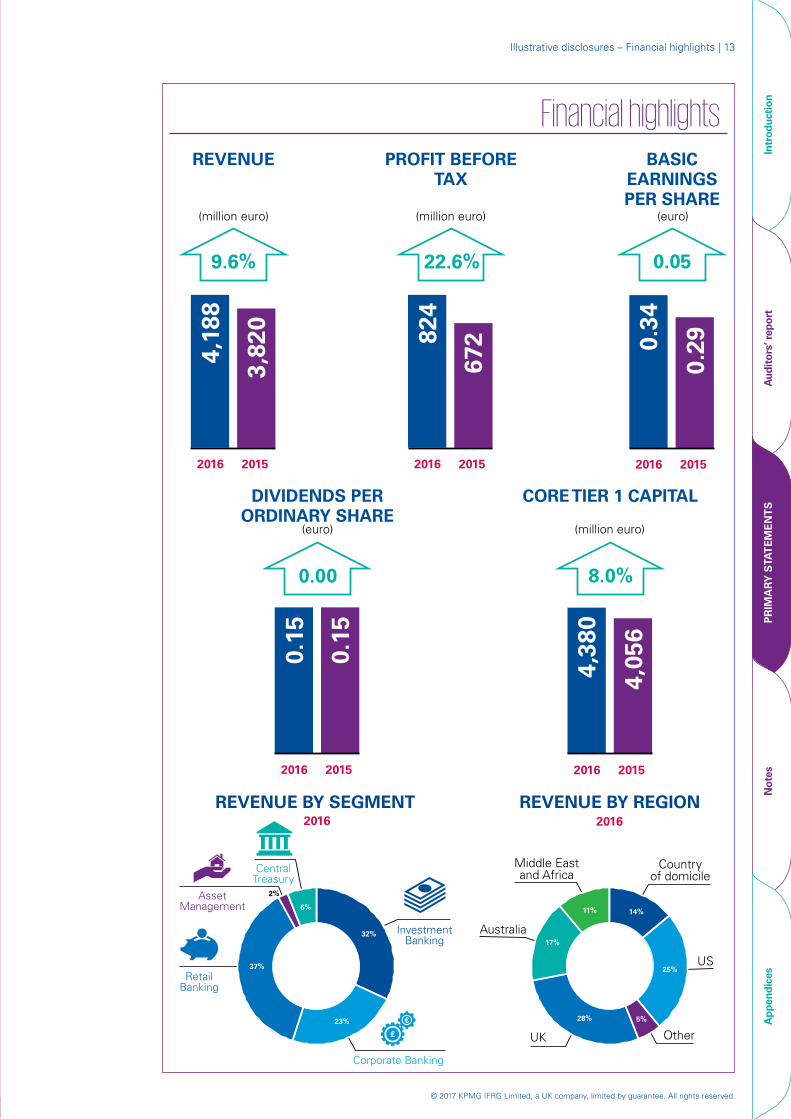
Financial highlights
Illustrative disclosures – Financial highlights
20152016
4,18
8
REVENUE
2015
3,82
0
2016
0.34
2015
0.29
2016
824
672
22.6%
PROFIT BEFORETAX
0.05
BASICEARNINGSPER SHARE
REVENUE BY SEGMENT REVENUE BY REGION
9.6%
2016
(million euro) (million euro) (euro)
DIVIDENDS PERORDINARY SHARE
8.0%
CORETIER 1 CAPITAL
0.00
(euro) (million euro)
0.15
0.15
4,38
0
4,05
6
2016
Countryof domicile
US
UK
Australia
Middle Eastand Africa
Other
20152016 20152016
5%
32%
23%
37%
2%
17%
11% 14%
25%
28%
6%
Corporate Banking
£
€
InvestmentBanking
RetailBanking
AssetManagement
CentralTreasury
© 2017 KPMG IFRG Limited, a UK company, limited by guarantee. All rights reserved.
14 | Illustrative disclosures for banks under IAS 39
Intr
oduc
tion
Aud
itor
s’ r
epor
tP
RIM
AR
Y S
TAT
EM
EN
TS
Not
esA
ppen
dice
s
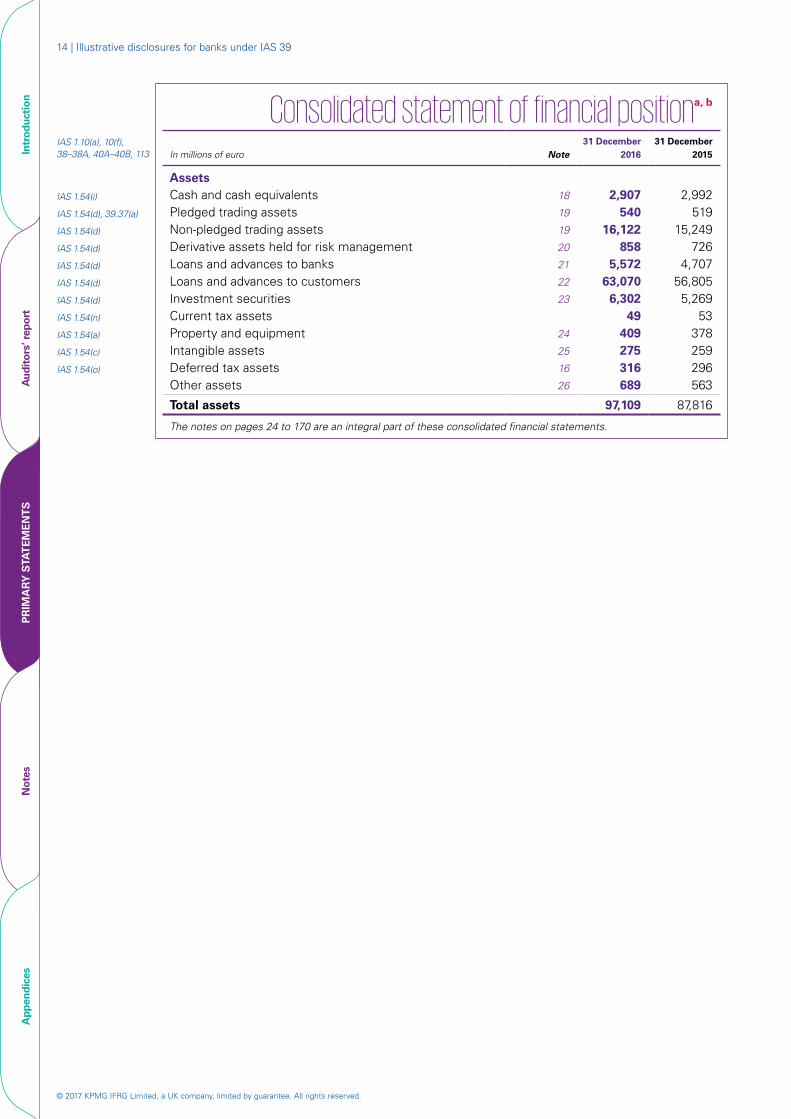
Consolidated statement of financial positiona, b IAS 1.10(a), 10(f), 38–38A, 40A–40B, 113 In millions of euro Note
31 December2016
31 December 2015
AssetsIAS 1.54(i) Cash and cash equivalents 18 2,907 2,992IAS 1.54(d), 39.37(a) Pledged trading assets 19 540 519 IAS 1.54(d) Non-pledged trading assets 19 16,122 15,249 IAS 1.54(d) Derivative assets held for risk management 20 858 726 IAS 1.54(d) Loans and advances to banks 21 5,572 4,707 IAS 1.54(d) Loans and advances to customers 22 63,070 56,805 IAS 1.54(d) Investment securities 23 6,302 5,269 IAS 1.54(n) Current tax assets 49 53 IAS 1.54(a) Property and equipment 24 409 378 IAS 1.54(c) Intangible assets 25 275 259 IAS 1.54(o) Deferred tax assets 16 316 296
Other assets 26 689 563
Total assets 97,109 87,816
The notes on pages 24 to 170 are an integral part of these consolidated financial statements.
© 2017 KPMG IFRG Limited, a UK company, limited by guarantee. All rights reserved.
Illustrative disclosures – Primary statements | 15
Intr
oduc
tion
Aud
itor
s’ r
epor
tP
RIM
AR
Y S
TAT
EM
EN
TS
Not
esA
ppen
dice
s
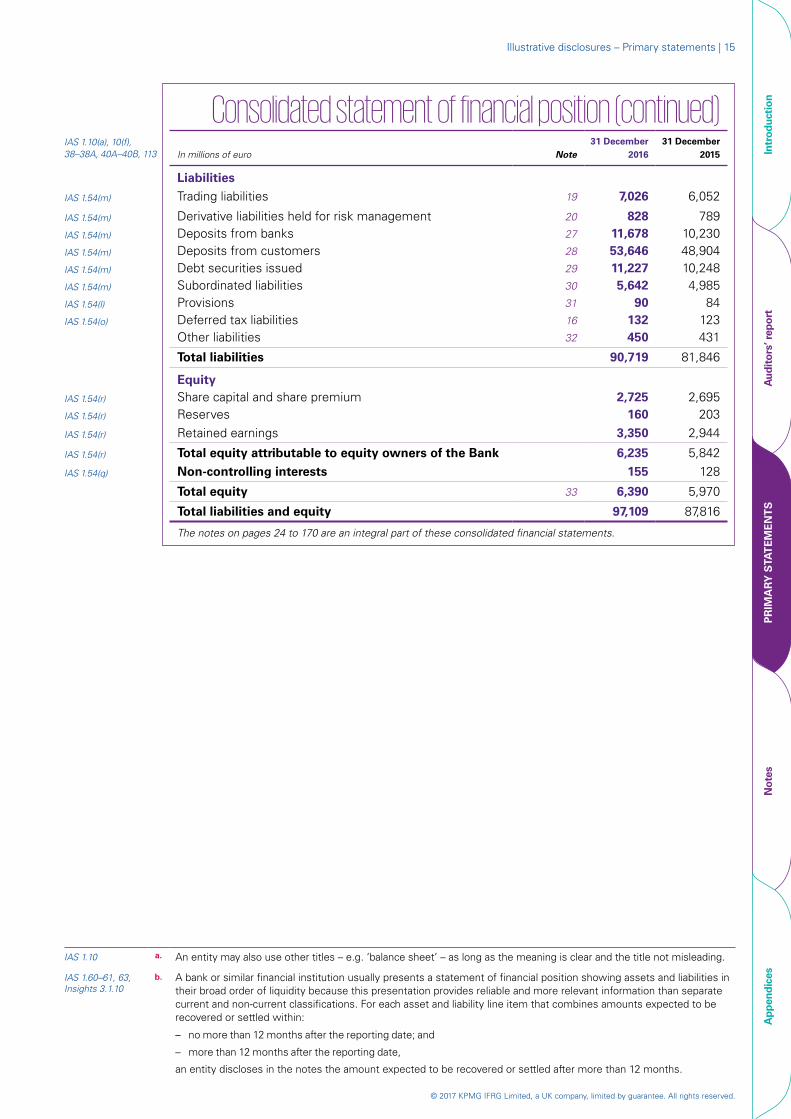
Consolidated statement of financial position (continued)IAS 1.10(a), 10(f), 38–38A, 40A–40B, 113 In millions of euro Note
31 December2016
31 December 2015
Liabilities
IAS 1.54(m) Trading liabilities 19 7,026 6,052
IAS 1.54(m) Derivative liabilities held for risk management 20 828 789 IAS 1.54(m) Deposits from banks 27 11,678 10,230 IAS 1.54(m) Deposits from customers 28 53,646 48,904 IAS 1.54(m) Debt securities issued 29 11,227 10,248 IAS 1.54(m) Subordinated liabilities 30 5,642 4,985 IAS 1.54(l) Provisions 31 90 84IAS 1.54(o) Deferred tax liabilities 16 132 123
Other liabilities 32 450 431
Total liabilities 90,719 81,846
EquityIAS 1.54(r) Share capital and share premium 2,725 2,695 IAS 1.54(r) Reserves 160 203
IAS 1.54(r) Retained earnings 3,350 2,944
IAS 1.54(r) Total equity attributable to equity owners of the Bank 6,235 5,842
IAS 1.54(q) Non-controlling interests 155 128
Total equity 33 6,390 5,970
Total liabilities and equity 97,109 87,816
The notes on pages 24 to 170 are an integral part of these consolidated financial statements.
IAS 1.10 a. An entity may also use other titles – e.g. ‘balance sheet’ – as long as the meaning is clear and the title not misleading.
IAS 1.60–61, 63, Insights 3.1.10
b. A bank or similar financial institution usually presents a statement of financial position showing assets and liabilities in their broad order of liquidity because this presentation provides reliable and more relevant information than separate current and non-current classifications. For each asset and liability line item that combines amounts expected to be recovered or settled within:
– no more than 12 months after the reporting date; and
– more than 12 months after the reporting date,
an entity discloses in the notes the amount expected to be recovered or settled after more than 12 months.
© 2017 KPMG IFRG Limited, a UK company, limited by guarantee. All rights reserved.
16 | Illustrative disclosures for banks under IAS 39
Intr
oduc
tion
Aud
itor
s’ r
epor
tP
RIM
AR
Y S
TAT
EM
EN
TS
Not
esA
ppen
dice
s
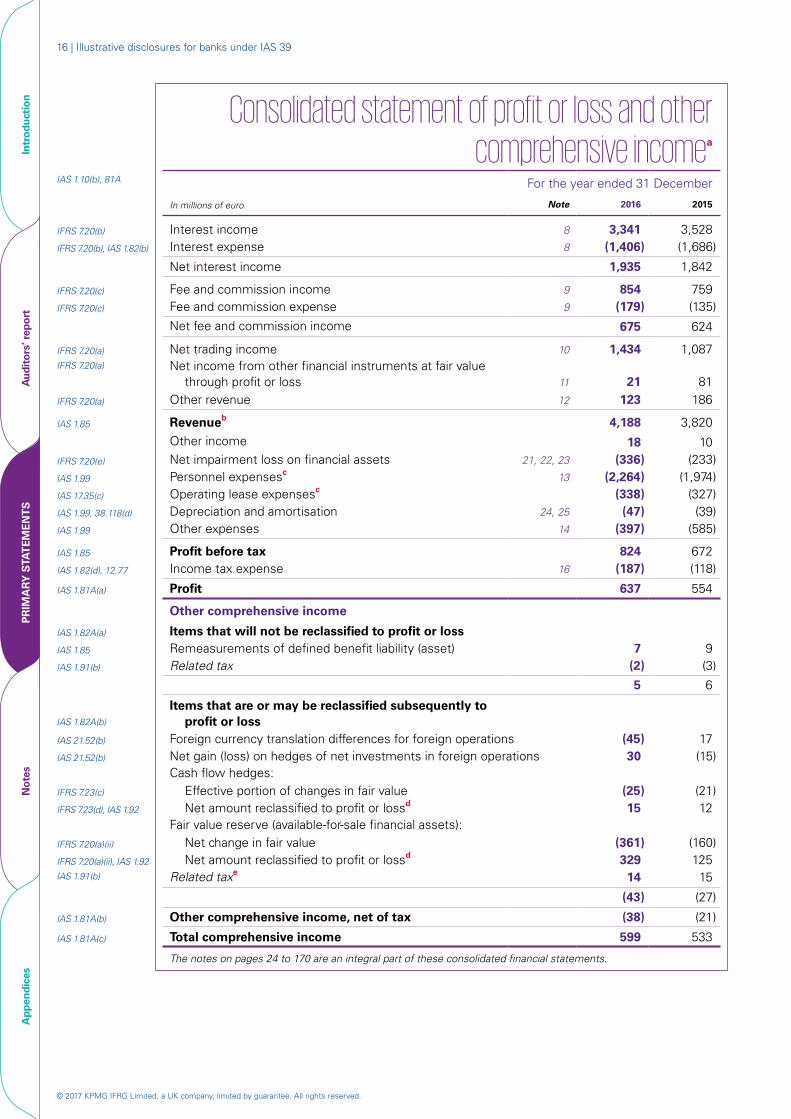
Consolidated statement of profit or loss and other comprehensive incomea
IAS 1.10(b), 81A For the year ended 31 December
In millions of euro Note 2016 2015
IFRS 7.20(b) Interest income 8 3,341 3,528 IFRS 7.20(b), IAS 1.82(b) Interest expense 8 (1,406) (1,686)
Net interest income 1,935 1,842
IFRS 7.20(c) Fee and commission income 9 854 759 IFRS 7.20(c) Fee and commission expense 9 (179) (135)
Net fee and commission income 675 624
IFRS 7.20(a) Net trading income 10 1,434 1,087 IFRS 7.20(a) Net income from other financial instruments at fair value
through profit or loss 11 21 81 IFRS 7.20(a) Other revenue 12 123 186
IAS 1.85 Revenueb 4,188 3,820 Other income 18 10
IFRS 7.20(e) Net impairment loss on financial assets 21, 22, 23 (336) (233)IAS 1.99 Personnel expensesc 13 (2,264) (1,974)IAS 17.35(c) Operating lease expensesc (338) (327)IAS 1.99, 38.118(d) Depreciation and amortisation 24, 25 (47) (39)IAS 1.99 Other expenses 14 (397) (585)
IAS 1.85 Profit before tax 824 672 IAS 1.82(d), 12.77 Income tax expense 16 (187) (118)
IAS 1.81A(a) Profit 637 554
Other comprehensive income
IAS 1.82A(a) Items that will not be reclassified to profit or lossIAS 1.85 Remeasurements of defined benefit liability (asset) 7 9IAS 1.91(b) Related tax (2) (3)
5 6
IAS 1.82A(b)
Items that are or may be reclassified subsequently to profit or loss
IAS 21.52(b) Foreign currency translation differences for foreign operations (45) 17 IAS 21.52(b) Net gain (loss) on hedges of net investments in foreign operations 30 (15)
Cash flow hedges:IFRS 7.23(c) Effective portion of changes in fair value (25) (21)IFRS 7.23(d), IAS 1.92 Net amount reclassified to profit or lossd 15 12
Fair value reserve (available-for-sale financial assets):IFRS 7.20(a)(ii) Net change in fair value (361) (160)IFRS 7.20(a)(ii), IAS 1.92 Net amount reclassified to profit or lossd 329 125IAS 1.91(b) Related taxe 14 15
(43) (27)
IAS 1.81A(b) Other comprehensive income, net of tax (38) (21)
IAS 1.81A(c) Total comprehensive income 599 533
The notes on pages 24 to 170 are an integral part of these consolidated financial statements.
© 2017 KPMG IFRG Limited, a UK company, limited by guarantee. All rights reserved.
Illustrative disclosures – Primary statements | 17
Intr
oduc
tion
Aud
itor
s’ r
epor
tP
RIM
AR
Y S
TAT
EM
EN
TS
Not
esA
ppen
dice
s
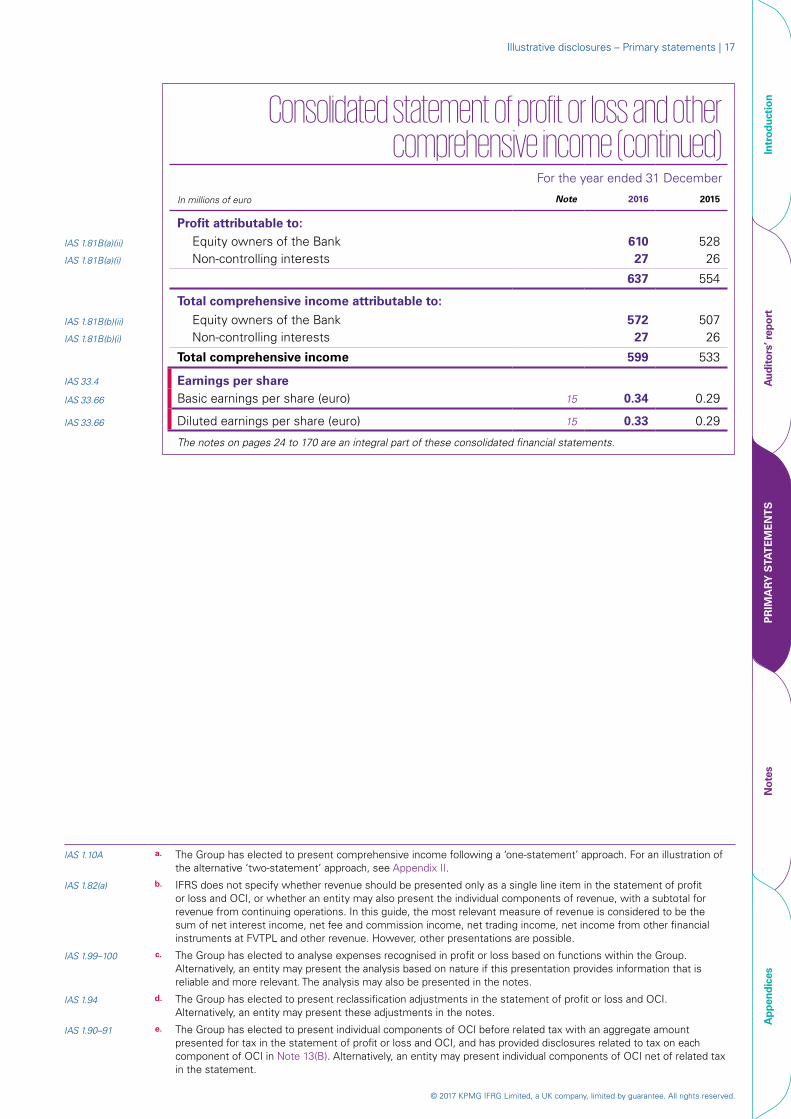
Consolidated statement of profit or loss and other comprehensive income (continued)
For the year ended 31 December
In millions of euro Note 2016 2015
Profit attributable to:
IAS 1.81B(a)(ii) Equity owners of the Bank 610 528 IAS 1.81B(a)(i) Non-controlling interests 27 26
637 554
Total comprehensive income attributable to:
IAS 1.81B(b)(ii) Equity owners of the Bank 572 507IAS 1.81B(b)(i) Non-controlling interests 27 26
Total comprehensive income 599 533
IAS 33.4 Earnings per shareIAS 33.66 Basic earnings per share (euro) 15 0.34 0.29
IAS 33.66 Diluted earnings per share (euro) 15 0.33 0.29
The notes on pages 24 to 170 are an integral part of these consolidated financial statements.
IAS 1.10A a. The Group has elected to present comprehensive income following a ‘one-statement’ approach. For an illustration of the alternative ‘two-statement’ approach, see Appendix II.
IAS 1.82(a) b. IFRS does not specify whether revenue should be presented only as a single line item in the statement of profit or loss and OCI, or whether an entity may also present the individual components of revenue, with a subtotal for revenue from continuing operations. In this guide, the most relevant measure of revenue is considered to be the sum of net interest income, net fee and commission income, net trading income, net income from other financial instruments at FVTPL and other revenue. However, other presentations are possible.
IAS 1.99–100 c. The Group has elected to analyse expenses recognised in profit or loss based on functions within the Group. Alternatively, an entity may present the analysis based on nature if this presentation provides information that is reliable and more relevant. The analysis may also be presented in the notes.
IAS 1.94 d. The Group has elected to present reclassification adjustments in the statement of profit or loss and OCI. Alternatively, an entity may present these adjustments in the notes.
IAS 1.90–91 e. The Group has elected to present individual components of OCI before related tax with an aggregate amount presented for tax in the statement of profit or loss and OCI, and has provided disclosures related to tax on each component of OCI in Note 13(B). Alternatively, an entity may present individual components of OCI net of related tax in the statement.
© 2017 KPMG IFRG Limited, a UK company, limited by guarantee. All rights reserved.
18 | Illustrative disclosures for banks under IAS 39
Intr
oduc
tion
Aud
itor
s’ r
epor
tP
RIM
AR
Y S
TAT
EM
EN
TS
Not
esA
ppen
dice
s
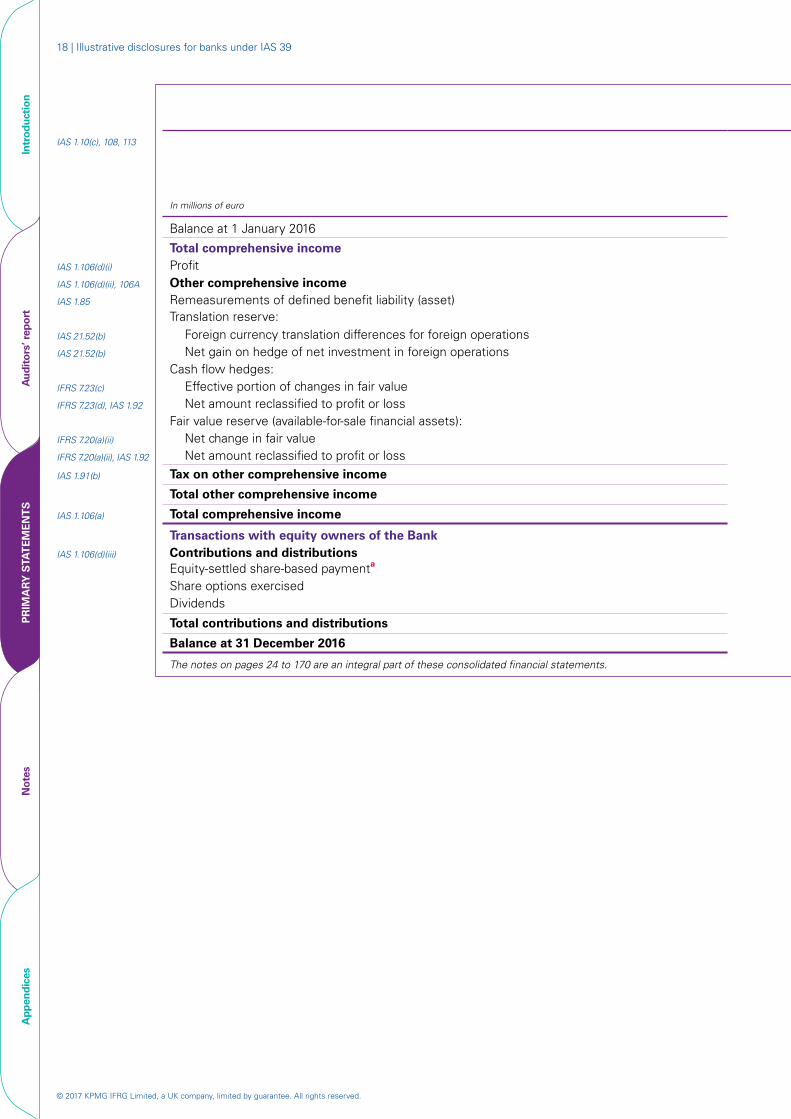
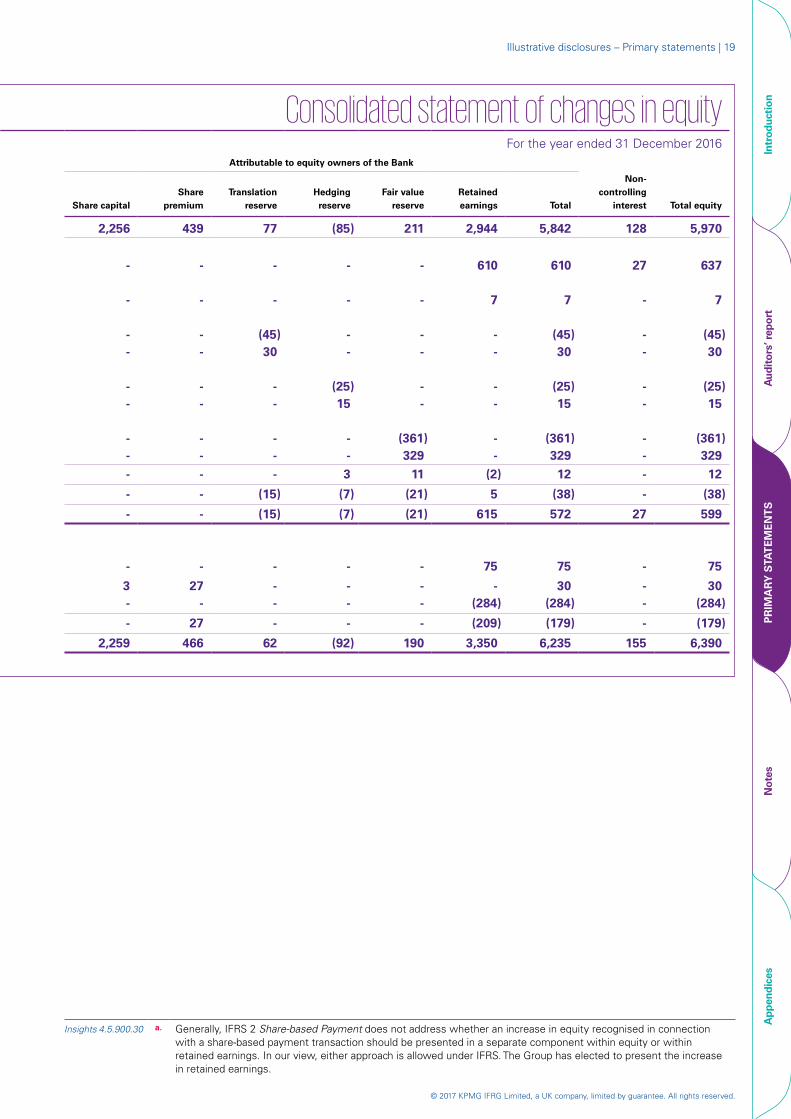
Consolidated statement of changes in equityIAS 1.10(c), 108, 113 For the year ended 31 December 2016
Attributable to equity owners of the Bank
In millions of euro Share capitalShare
premiumTranslation
reserveHedging reserve
Fair value reserve
Retained earnings Total
Non-controlling
interest Total equity
Balance at 1 January 2016 2,256 439 77 (85) 211 2,944 5,842 128 5,970
Total comprehensive income IAS 1.106(d)(i) Profit - - - - - 610 610 27 637IAS 1.106(d)(ii), 106A Other comprehensive incomeIAS 1.85 Remeasurements of defined benefit liability (asset) - - - - - 7 7 - 7
Translation reserve:IAS 21.52(b) Foreign currency translation differences for foreign operations - - (45) - - - (45) - (45)IAS 21.52(b) Net gain on hedge of net investment in foreign operations - - 30 - - - 30 - 30
Cash flow hedges:IFRS 7.23(c) Effective portion of changes in fair value - - - (25) - - (25) - (25)IFRS 7.23(d), IAS 1.92 Net amount reclassified to profit or loss - - - 15 - - 15 - 15
Fair value reserve (available-for-sale financial assets): IFRS 7.20(a)(ii) Net change in fair value - - - - (361) - (361) - (361)IFRS 7.20(a)(ii), IAS 1.92 Net amount reclassified to profit or loss - - - - 329 - 329 - 329
IAS 1.91(b) Tax on other comprehensive income - - - 3 11 (2) 12 - 12
Total other comprehensive income - - (15) (7) (21) 5 (38) - (38)
IAS 1.106(a) Total comprehensive income - - (15) (7) (21) 615 572 27 599
Transactions with equity owners of the BankIAS 1.106(d)(iii) Contributions and distributions
Equity-settled share-based paymenta - - - - - 75 75 - 75
Share options exercised 3 27 - - - - 30 - 30Dividends - - - - - (284) (284) - (284)
Total contributions and distributions - 27 - - - (209) (179) - (179)
Balance at 31 December 2016 2,259 466 62 (92) 190 3,350 6,235 155 6,390
The notes on pages 24 to 170 are an integral part of these consolidated financial statements.
Consolidated statement of changes in equity
© 2017 KPMG IFRG Limited, a UK company, limited by guarantee. All rights reserved.
Illustrative disclosures – Primary statements | 19
Intr
oduc
tion
Aud
itor
s’ r
epor
tP
RIM
AR
Y S
TAT
EM
EN
TS
Not
esA
ppen
dice
s
Consolidated statement of changes in equityFor the year ended 31 December 2016
Share capital
2,256
-
Share premium
439
-
Attributable to eq
Translation reserve
77
-
uity owners of the Bank
Hedging reserve
(85)
-
Fair value reserve
211
-
Retained earnings
2,944
610
Total
5,842
610
Non-controlling
interest
128
27
Total equity
5,970
637
- - - - - 7 7 - 7
--
- -
(45) 30
--
--
- -
(45)30
- -
(45)30
- -
--
- -
(25)15
- -
- -
(25)15
- -
(25)15
- - -
-
-
-
- --
-
-
-
- --
(15)
(15)
-
--3
(7)
(7)
-
(361)329
11
(21)
(21)
-
- -
(2)
5
615
75
(361)329
12
(38)
572
75
- - -
-
27
-
(361)32912
(38)
599
75
3 27 - - - - 30 - 30-
-
2,259
-
27
466
-
-
62
-
-
(92)
-
-
190
(284)
(209)
3,350
(284)
(179)
6,235
-
-
155
(284)
(179)
6,390
IAS 1.10(c), 108, 113
In millions of euro
Balance at 1 January 2016
Total comprehensive income IAS 1.106(d)(i) ProfitIAS 1.106(d)(ii), 106A Other comprehensive incomeIAS 1.85 Remeasurements of defined benefit liability (asset)
Translation reserve:IAS 21.52(b) Foreign currency translation differences for foreign operationsIAS 21.52(b) Net gain on hedge of net investment in foreign operations
Cash flow hedges:IFRS 7.23(c) Effective portion of changes in fair value IFRS 7.23(d), IAS 1.92 Net amount reclassified to profit or loss
Fair value reserve (available-for-sale financial assets): IFRS 7.20(a)(ii) Net change in fair valueIFRS 7.20(a)(ii), IAS 1.92 Net amount reclassified to profit or loss
IAS 1.91(b) Tax on other comprehensive income
Total other comprehensive income
IAS 1.106(a) Total comprehensive income
Transactions with equity owners of the BankIAS 1.106(d)(iii) Contributions and distributions
Equity-settled share-based paymenta
Share options exercisedDividends
Total contributions and distributions
Balance at 31 December 2016
The notes on pages 24 to 170 are an integral part of these consolidated financial statements.
Insights 4.5.900.30 a. Generally, IFRS 2 Share-based Payment does not address whether an increase in equity recognised in connection with a share-based payment transaction should be presented in a separate component within equity or within retained earnings. In our view, either approach is allowed under IFRS. The Group has elected to present the increase in retained earnings.
© 2017 KPMG IFRG Limited, a UK company, limited by guarantee. All rights reserved.
20 | Illustrative disclosures for banks under IAS 39
Intr
oduc
tion
Aud
itor
s’ r
epor
tP
RIM
AR
Y S
TAT
EM
EN
TS
Not
esA
ppen
dice
s
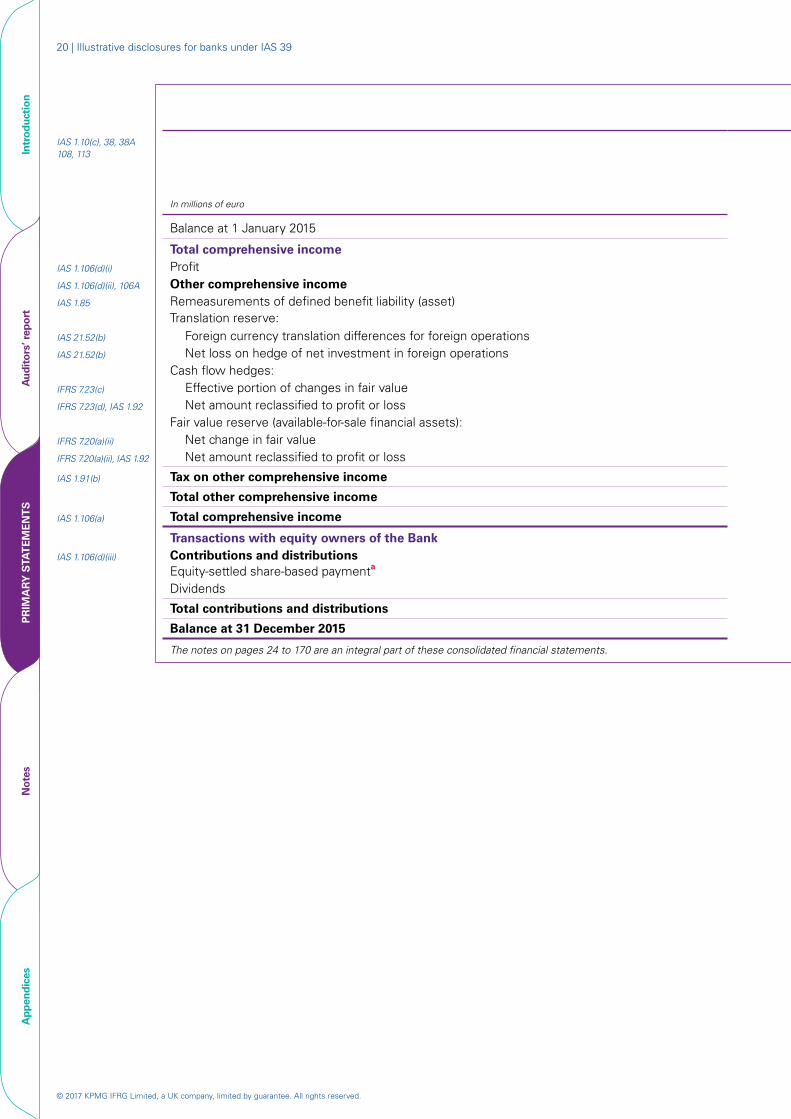
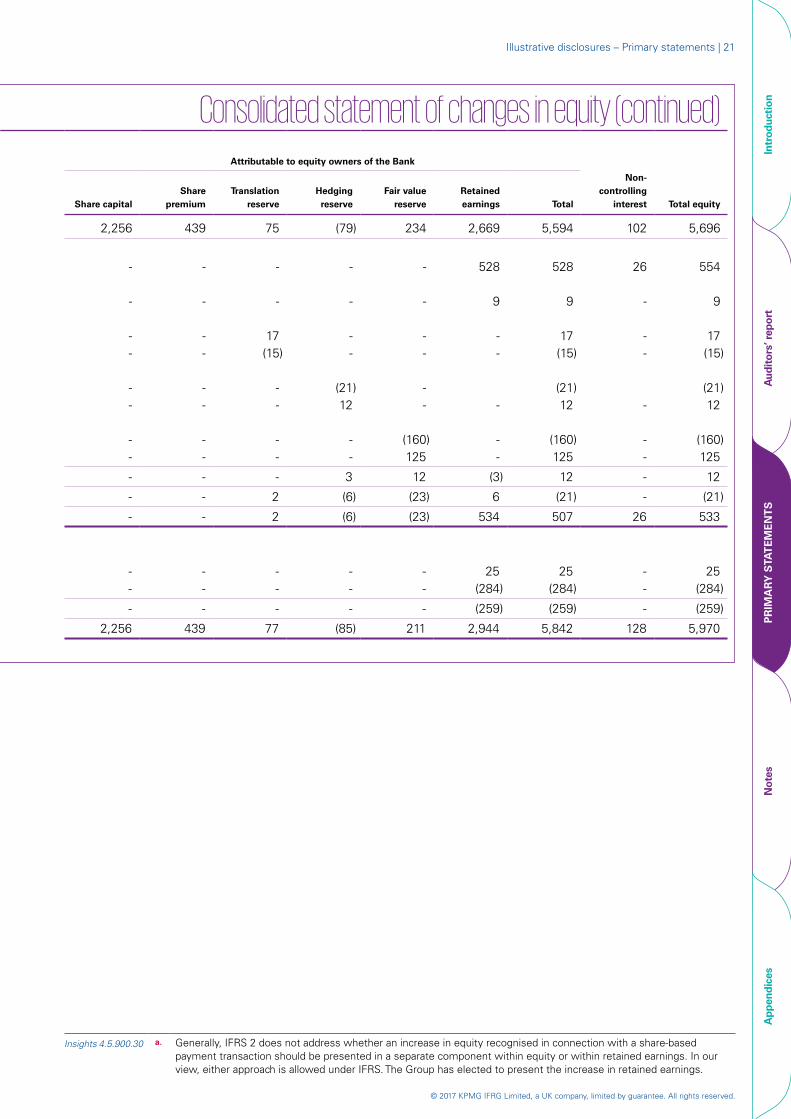
Consolidated statement of changes in equity (continued)IAS 1.10(c), 38, 38A 108, 113
Attributable to equity owners of the Bank
In millions of euro Share capitalShare
premiumTranslation
reserveHedging reserve
Fair value reserve
Retained earnings Total
Non-controlling
interest Total equity
Balance at 1 January 2015 2,256 439 75 (79) 234 2,669 5,594 102 5,696
Total comprehensive income IAS 1.106(d)(i) Profit - - - - - 528 528 26 554IAS 1.106(d)(ii), 106A Other comprehensive incomeIAS 1.85 Remeasurements of defined benefit liability (asset) - - - - - 9 9 - 9
Translation reserve:IAS 21.52(b) Foreign currency translation differences for foreign operations - - 17 - - - 17 - 17IAS 21.52(b) Net loss on hedge of net investment in foreign operations - - (15) - - - (15) - (15)
Cash flow hedges:IFRS 7.23(c) Effective portion of changes in fair value - - - (21) - (21) (21)IFRS 7.23(d), IAS 1.92 Net amount reclassified to profit or loss - - - 12 - - 12 - 12
Fair value reserve (available-for-sale financial assets):IFRS 7.20(a)(ii) Net change in fair value - - - - (160) - (160) - (160) IFRS 7.20(a)(ii), IAS 1.92 Net amount reclassified to profit or loss - - - - 125 - 125 - 125
IAS 1.91(b) Tax on other comprehensive income - - - 3 12 (3) 12 - 12
Total other comprehensive income - - 2 (6) (23) 6 (21) - (21)
IAS 1.106(a) Total comprehensive income - - 2 (6) (23) 534 507 26 533
Transactions with equity owners of the BankIAS 1.106(d)(iii) Contributions and distributions
Equity-settled share-based paymenta - - - - - 25 25 - 25Dividends - - - - - (284) (284) - (284)
Total contributions and distributions - - - - - (259) (259) - (259)
Balance at 31 December 2015 2,256 439 77 (85) 211 2,944 5,842 128 5,970
The notes on pages 24 to 170 are an integral part of these consolidated financial statements.
© 2017 KPMG IFRG Limited, a UK company, limited by guarantee. All rights reserved.
Illustrative disclosures – Primary statements | 21
Intr
oduc
tion
Aud
itor
s’ r
epor
tP
RIM
AR
Y S
TAT
EM
EN
TS
Not
esA
ppen
dice
s
Consolidated statement of changes in equity (continued)Attributable to equity owners of the Bank
Non-Share Translation Hedging Fair value Retained controlling
Share capital premium reserve reserve reserve earnings Total interest Total equity
2,256 439 75 (79) 234 2,669 5,594 102 5,696
- - - - - 528 528 26 554
- - - - - 9 9 - 9
- - 17 - - - 17 - 17- - (15) - - - (15) - (15)
- - - (21) - (21) (21) - - - 12 - - 12 - 12
- - - - (160) - (160) - (160) - - - - 125 - 125 - 125
- - - 3 12 (3) 12 - 12
- - 2 (6) (23) 6 (21) - (21)
- - 2 (6) (23) 534 507 26 533
- - - - - 25 25 - 25- - - - - (284) (284) - (284)
- - - - - (259) (259) - (259)
2,256 439 77 (85) 211 2,944 5,842 128 5,970
IAS 1.10(c), 38, 38A 108, 113
In millions of euro
Balance at 1 January 2015
Total comprehensive income IAS 1.106(d)(i) ProfitIAS 1.106(d)(ii), 106A Other comprehensive incomeIAS 1.85 Remeasurements of defined benefit liability (asset)
Translation reserve:IAS 21.52(b) Foreign currency translation differences for foreign operationsIAS 21.52(b) Net loss on hedge of net investment in foreign operations
Cash flow hedges:IFRS 7.23(c) Effective portion of changes in fair value IFRS 7.23(d), IAS 1.92 Net amount reclassified to profit or loss
Fair value reserve (available-for-sale financial assets):IFRS 7.20(a)(ii) Net change in fair valueIFRS 7.20(a)(ii), IAS 1.92 Net amount reclassified to profit or loss
IAS 1.91(b) Tax on other comprehensive income
Total other comprehensive income
IAS 1.106(a) Total comprehensive income
Transactions with equity owners of the BankIAS 1.106(d)(iii) Contributions and distributions
Equity-settled share-based paymenta
Dividends
Total contributions and distributions
Balance at 31 December 2015
The notes on pages 24 to 170 are an integral part of these consolidated financial statements.
Insights 4.5.900.30 a. Generally, IFRS 2 does not address whether an increase in equity recognised in connection with a share-based payment transaction should be presented in a separate component within equity or within retained earnings. In our view, either approach is allowed under IFRS. The Group has elected to present the increase in retained earnings.
© 2017 KPMG IFRG Limited, a UK company, limited by guarantee. All rights reserved.
22 | Illustrative disclosures for banks under IAS 39
Intr
oduc
tion
Aud
itor
s’ r
epor
tP
RIM
AR
Y S
TAT
EM
EN
TS
Not
esA
ppen
dice
s
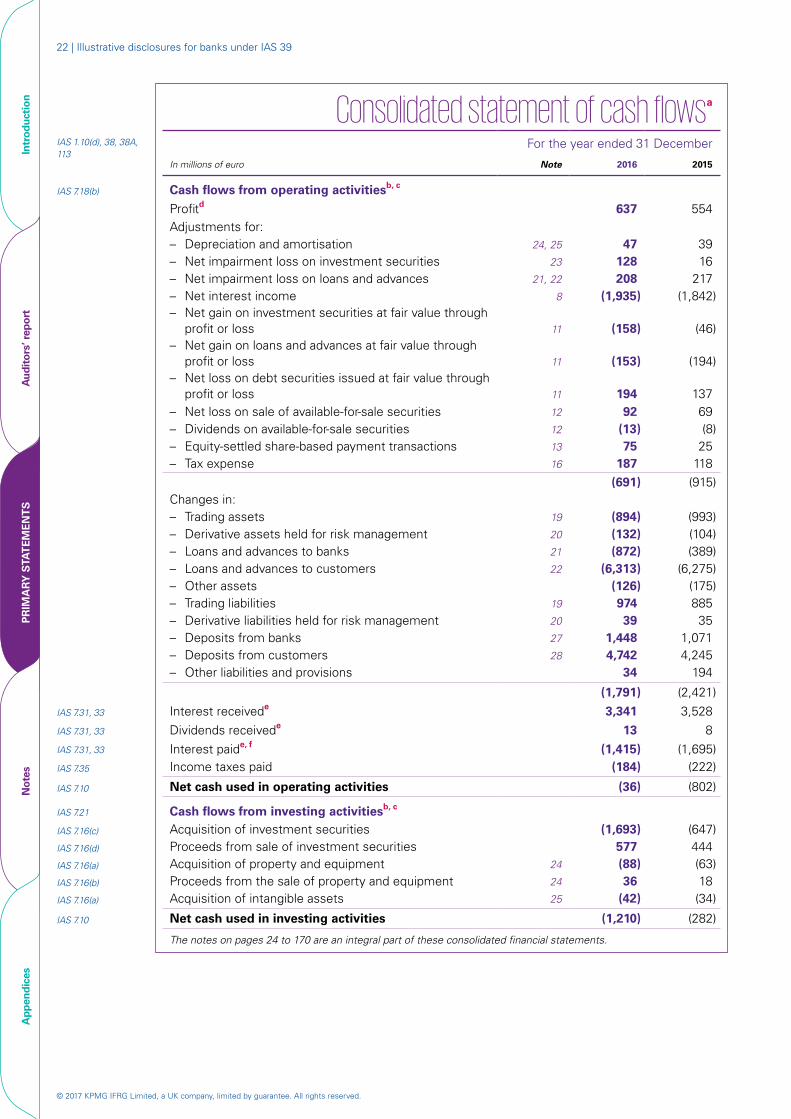
Consolidated statement of cash flowsa IAS 1.10(d), 38, 38A, 113
For the year ended 31 December
In millions of euro Note 2016 2015
IAS 7.18(b) Cash flows from operating activitiesb, c
Profitd 637 554 Adjustments for:– Depreciation and amortisation 24, 25 47 39 – Net impairment loss on investment securities 23 128 16 – Net impairment loss on loans and advances 21, 22 208 217 – Net interest income 8 (1,935) (1,842)– Net gain on investment securities at fair value through
profit or loss 11 (158) (46)– Net gain on loans and advances at fair value through
profit or loss 11 (153) (194)– Net loss on debt securities issued at fair value through
profit or loss 11 194 137– Net loss on sale of available-for-sale securities 12 92 69– Dividends on available-for-sale securities 12 (13) (8)– Equity-settled share-based payment transactions 13 75 25– Tax expense 16 187 118
(691) (915)Changes in:– Trading assets 19 (894) (993)– Derivative assets held for risk management 20 (132) (104)– Loans and advances to banks 21 (872) (389)– Loans and advances to customers 22 (6,313) (6,275)– Other assets (126) (175)– Trading liabilities 19 974 885 – Derivative liabilities held for risk management 20 39 35 – Deposits from banks 27 1,448 1,071 – Deposits from customers 28 4,742 4,245 – Other liabilities and provisions 34 194
(1,791) (2,421)
IAS 7.31, 33 Interest receivede 3,341 3,528 IAS 7.31, 33 Dividends receivede 13 8 IAS 7.31, 33 Interest paide, f (1,415) (1,695)IAS 7.35 Income taxes paid (184) (222)
IAS 7.10 Net cash used in operating activities (36) (802)
IAS 7.21 Cash flows from investing activitiesb, c
IAS 7.16(c) Acquisition of investment securities (1,693) (647)IAS 7.16(d) Proceeds from sale of investment securities 577 444IAS 7.16(a) Acquisition of property and equipment 24 (88) (63)IAS 7.16(b) Proceeds from the sale of property and equipment 24 36 18 IAS 7.16(a) Acquisition of intangible assets 25 (42) (34)
IAS 7.10 Net cash used in investing activities (1,210) (282)
The notes on pages 24 to 170 are an integral part of these consolidated financial statements.
© 2017 KPMG IFRG Limited, a UK company, limited by guarantee. All rights reserved.
Illustrative disclosures – Primary statements | 23
Intr
oduc
tion
Aud
itor
s’ r
epor
tP
RIM
AR
Y S
TAT
EM
EN
TS
Not
esA
ppen
dice
s
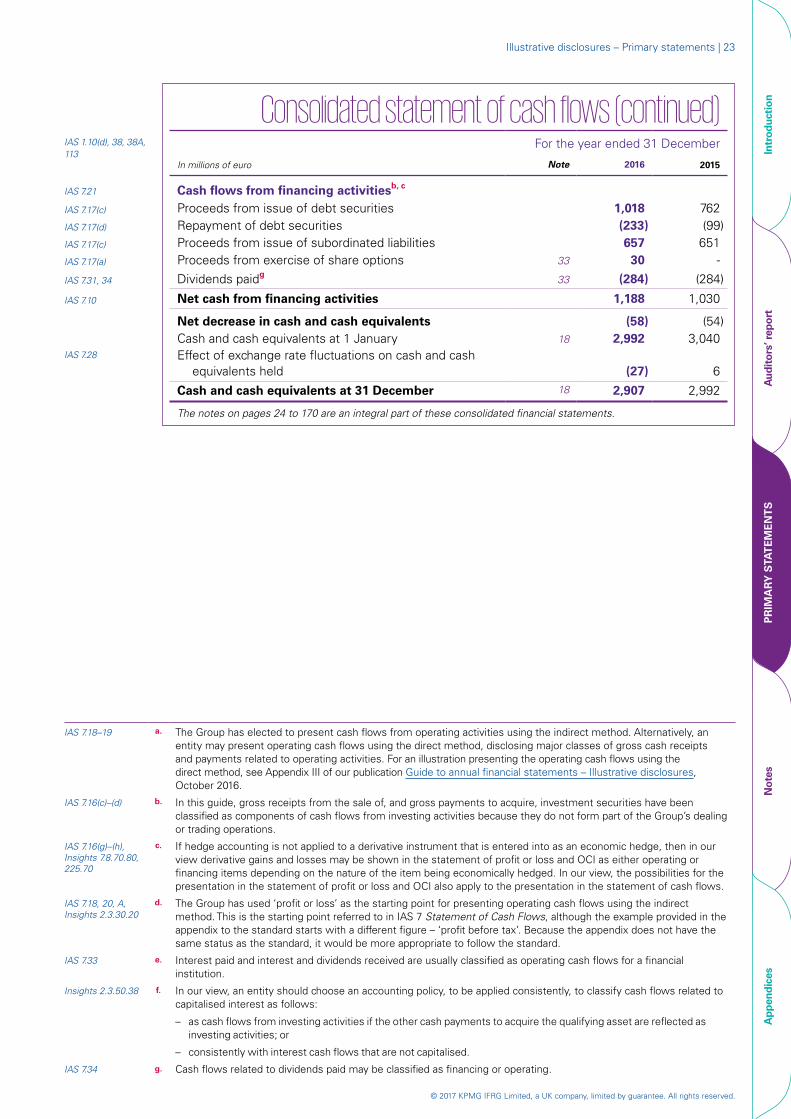
Consolidated statement of cash flows (continued)IAS 1.10(d), 38, 38A, 113
For the year ended 31 December
In millions of euro Note 2016 2015
IAS 7.21 Cash flows from financing activitiesb, c
IAS 7.17(c) Proceeds from issue of debt securities 1,018 762IAS 7.17(d) Repayment of debt securities (233) (99) IAS 7.17(c) Proceeds from issue of subordinated liabilities 657 651 IAS 7.17(a) Proceeds from exercise of share options 33 30 -
IAS 7.31, 34 Dividends paidg 33 (284) (284)
IAS 7.10 Net cash from financing activities 1,188 1,030
Net decrease in cash and cash equivalents (58) (54)Cash and cash equivalents at 1 January 18 2,992 3,040
IAS 7.28 Effect of exchange rate fluctuations on cash and cash equivalents held (27) 6
Cash and cash equivalents at 31 December 18 2,907 2,992
The notes on pages 24 to 170 are an integral part of these consolidated financial statements.
IAS 7.18–19 a. The Group has elected to present cash flows from operating activities using the indirect method. Alternatively, an entity may present operating cash flows using the direct method, disclosing major classes of gross cash receipts and payments related to operating activities. For an illustration presenting the operating cash flows using the direct method, see Appendix III of our publication Guide to annual financial statements – Illustrative disclosures, October 2016.
IAS 7.16(c)–(d) b. In this guide, gross receipts from the sale of, and gross payments to acquire, investment securities have been classified as components of cash flows from investing activities because they do not form part of the Group’s dealing or trading operations.
IAS 7.16(g)–(h), Insights 7.8.70.80, 225.70
c. If hedge accounting is not applied to a derivative instrument that is entered into as an economic hedge, then in our view derivative gains and losses may be shown in the statement of profit or loss and OCI as either operating or financing items depending on the nature of the item being economically hedged. In our view, the possibilities for the presentation in the statement of profit or loss and OCI also apply to the presentation in the statement of cash flows.
IAS 7.18, 20, A, Insights 2.3.30.20
d. The Group has used ‘profit or loss’ as the starting point for presenting operating cash flows using the indirect method. This is the starting point referred to in IAS 7 Statement of Cash Flows, although the example provided in the appendix to the standard starts with a different figure – ‘profit before tax’. Because the appendix does not have the same status as the standard, it would be more appropriate to follow the standard.
IAS 7.33 e. Interest paid and interest and dividends received are usually classified as operating cash flows for a financial institution.
Insights 2.3.50.38 f. In our view, an entity should choose an accounting policy, to be applied consistently, to classify cash flows related to capitalised interest as follows:
– as cash flows from investing activities if the other cash payments to acquire the qualifying asset are reflected as investing activities; or
– consistently with interest cash flows that are not capitalised.
IAS 7.34 g. Cash flows related to dividends paid may be classified as financing or operating.
© 2017 KPMG IFRG Limited, a UK company, limited by guarantee. All rights reserved.
24 | Illustrative disclosures for banks under IAS 39
Intr
oduc
tion
Aud
itor
s’ r
epor
tPr
imar
y st
atem
ents
NO
TE
SA
ppen
dice
s
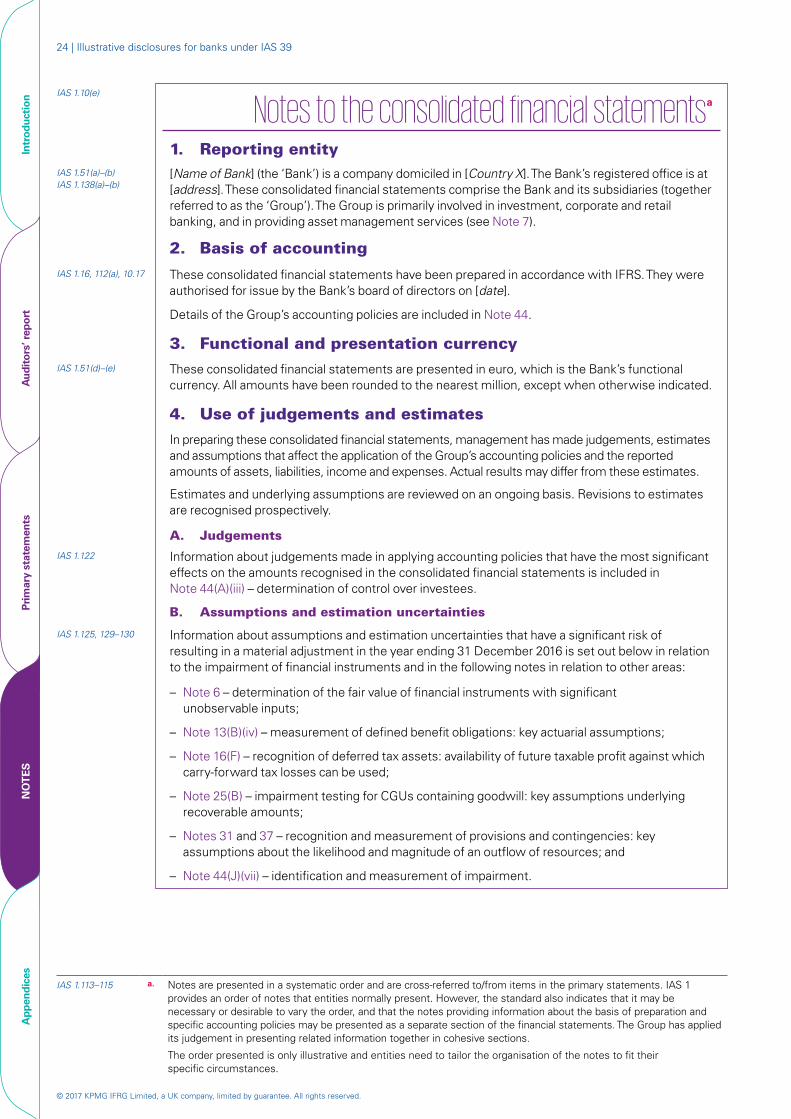
IAS 1.10(e)
Notes to the consolidated financial statementsa 1. Reporting entity
IAS 1.51(a)–(b) IAS 1.138(a)–(b)
[Name of Bank] (the ‘Bank’) is a company domiciled in [Country X]. The Bank’s registered office is at [address]. These consolidated financial statements comprise the Bank and its subsidiaries (together referred to as the ‘Group’). The Group is primarily involved in investment, corporate and retail banking, and in providing asset management services (see Note 7).
2. Basis of accountingIAS 1.16, 112(a), 10.17 These consolidated financial statements have been prepared in accordance with IFRS. They were
authorised for issue by the Bank’s board of directors on [date].
Details of the Group’s accounting policies are included in Note 44.
3. Functional and presentation currencyIAS 1.51(d)–(e) These consolidated financial statements are presented in euro, which is the Bank’s functional
currency. All amounts have been rounded to the nearest million, except when otherwise indicated.
4. Use of judgements and estimates
In preparing these consolidated financial statements, management has made judgements, estimates and assumptions that affect the application of the Group’s accounting policies and the reported amounts of assets, liabilities, income and expenses. Actual results may differ from these estimates.
Estimates and underlying assumptions are reviewed on an ongoing basis. Revisions to estimates are recognised prospectively.
A. Judgements
IAS 1.122 Information about judgements made in applying accounting policies that have the most significant effects on the amounts recognised in the consolidated financial statements is included in Note 44(A)(iii) – determination of control over investees.
B. Assumptions and estimation uncertainties
IAS 1.125, 129–130 Information about assumptions and estimation uncertainties that have a significant risk of resulting in a material adjustment in the year ending 31 December 2016 is set out below in relation to the impairment of financial instruments and in the following notes in relation to other areas:
– Note 6 – determination of the fair value of financial instruments with significant unobservable inputs;
– Note 13(B)(iv) – measurement of defined benefit obligations: key actuarial assumptions;
– Note 16(F) – recognition of deferred tax assets: availability of future taxable profit against which carry-forward tax losses can be used;
– Note 25(B) – impairment testing for CGUs containing goodwill: key assumptions underlying recoverable amounts;
– Notes 31 and 37 – recognition and measurement of provisions and contingencies: key assumptions about the likelihood and magnitude of an outflow of resources; and
– Note 44(J)(vii) – identification and measurement of impairment.
IAS 1.113–115 a. Notes are presented in a systematic order and are cross-referred to/from items in the primary statements. IAS 1 provides an order of notes that entities normally present. However, the standard also indicates that it may be necessary or desirable to vary the order, and that the notes providing information about the basis of preparation and specific accounting policies may be presented as a separate section of the financial statements. The Group has applied its judgement in presenting related information together in cohesive sections.
The order presented is only illustrative and entities need to tailor the organisation of the notes to fit their specific circumstances.
Illustrative disclosures – Notes 25Financial risk review and fair value
© 2017 KPMG IFRG Limited, a UK company, limited by guarantee. All rights reserved.
Intr
oduc
tion
Aud
itor
s’ r
epor
tPr
imar
y st
atem
ents
NO
TE
SA
ppen
dice
s
FINANCIAL RISK REVIEW AND FAIR VALUE
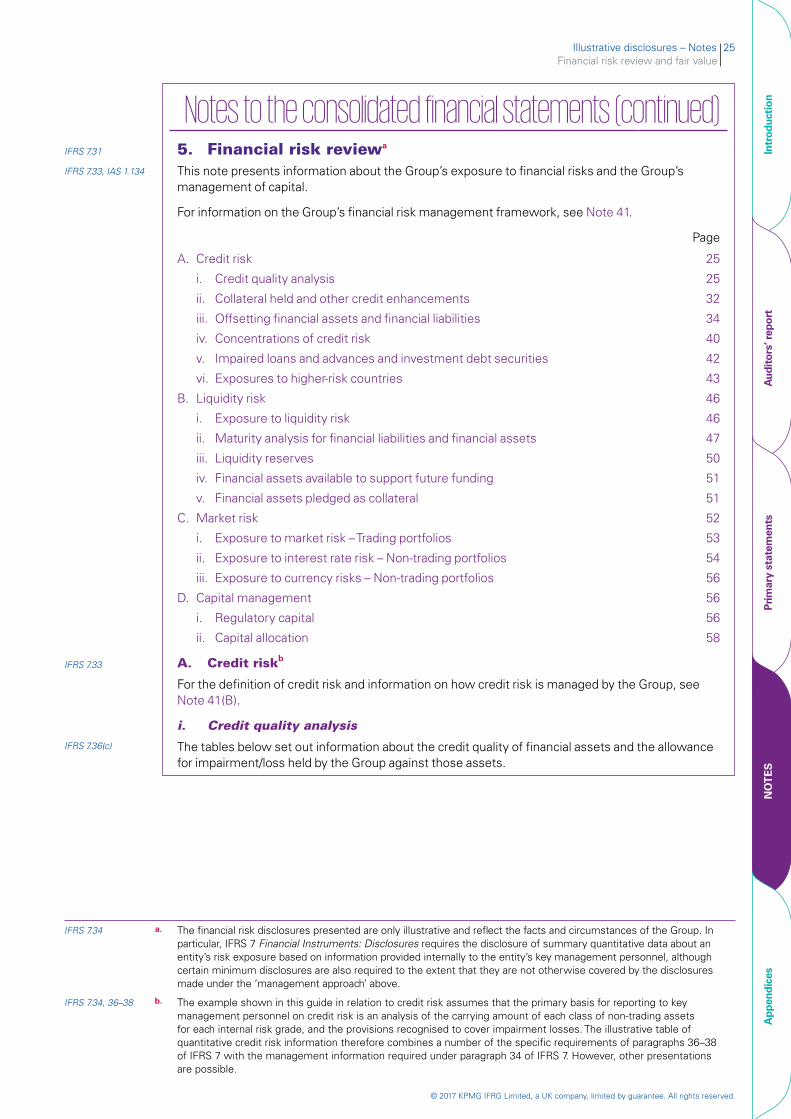
Notes to the consolidated financial statements (continued)IFRS 7.31 5. Financial risk reviewa IFRS 7.33, IAS 1.134 This note presents information about the Group’s exposure to financial risks and the Group’s
management of capital.
For information on the Group’s financial risk management framework, see Note 41.
Page
A. Credit risk 25
i. Credit quality analysis 25
ii. Collateral held and other credit enhancements 32
iii. Offsetting financial assets and financial liabilities 34
iv. Concentrations of credit risk 40
v. Impaired loans and advances and investment debt securities 42
vi. Exposures to higher-risk countries 43
B. Liquidity risk 46
i. Exposure to liquidity risk 46
ii. Maturity analysis for financial liabilities and financial assets 47
iii. Liquidity reserves 50
iv. Financial assets available to support future funding 51
v. Financial assets pledged as collateral 51
C. Market risk 52
i. Exposure to market risk – Trading portfolios 53
ii. Exposure to interest rate risk – Non-trading portfolios 54
iii. Exposure to currency risks – Non-trading portfolios 56
D. Capital management 56
i. Regulatory capital 56
ii. Capital allocation 58
IFRS 7.33 A. Credit riskb
For the definition of credit risk and information on how credit risk is managed by the Group, see Note 41(B).
i. Credit quality analysis
IFRS 7.36(c) The tables below set out information about the credit quality of financial assets and the allowance for impairment/loss held by the Group against those assets.
IFRS 7.34 a. The financial risk disclosures presented are only illustrative and reflect the facts and circumstances of the Group. In particular, IFRS 7 Financial Instruments: Disclosures requires the disclosure of summary quantitative data about an entity’s risk exposure based on information provided internally to the entity’s key management personnel, although certain minimum disclosures are also required to the extent that they are not otherwise covered by the disclosures made under the ‘management approach’ above.
IFRS 7.34, 36–38 b. The example shown in this guide in relation to credit risk assumes that the primary basis for reporting to key management personnel on credit risk is an analysis of the carrying amount of each class of non-trading assets for each internal risk grade, and the provisions recognised to cover impairment losses. The illustrative table of quantitative credit risk information therefore combines a number of the specific requirements of paragraphs 36–38 of IFRS 7 with the management information required under paragraph 34 of IFRS 7. However, other presentations are possible.
© 2017 KPMG IFRG Limited, a UK company, limited by guarantee. All rights reserved.
26 | Illustrative disclosures for banks under IAS 39
Intr
oduc
tion
Aud
itor
s’ r
epor
tPr
imar
y st
atem
ents
NO
TE
SA
ppen
dice
s
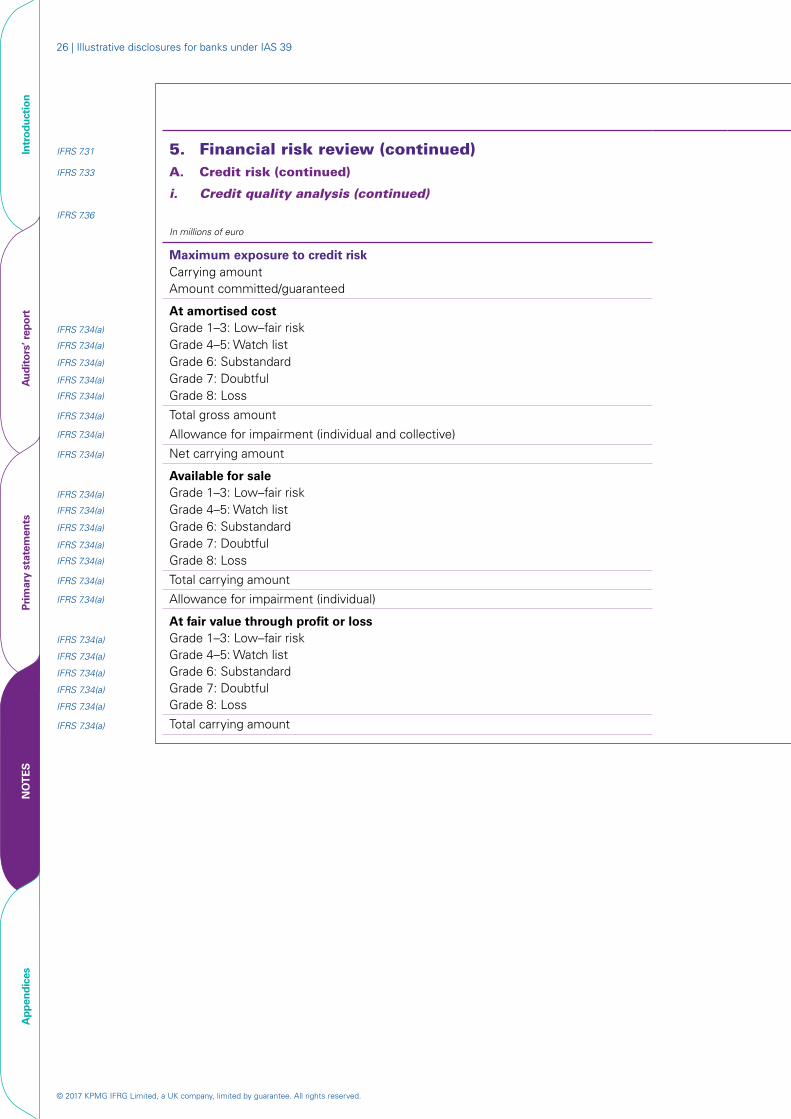
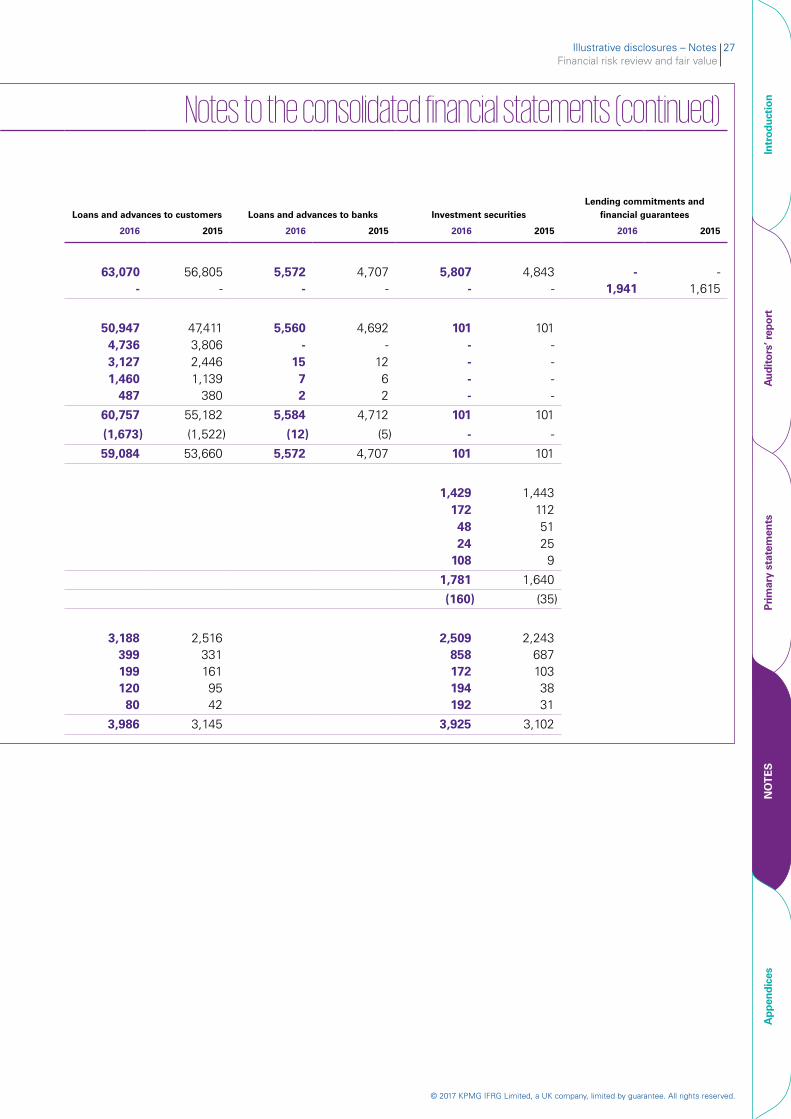
Notes to the consolidated financial statements (continued)IFRS 7.31 5. Financial risk review (continued)IFRS 7.33 A. Credit risk (continued)
i. Credit quality analysis (continued)
IFRS 7.36 Loans and advances to customers Loans and advances to banks Investment securities Lending commitments and
financial guarantees
In millions of euro 2016 2015 2016 2015 2016 2015 2016 2015
Maximum exposure to credit riskCarrying amount 63,070 56,805 5,572 4,707 5,807 4,843 - -Amount committed/guaranteed - - - - - - 1,941 1,615
At amortised cost IFRS 7.34(a) Grade 1–3: Low–fair risk 50,947 47,411 5,560 4,692 101 101IFRS 7.34(a) Grade 4–5: Watch list 4,736 3,806 - - - -IFRS 7.34(a) Grade 6: Substandard 3,127 2,446 15 12 - -IFRS 7.34(a) Grade 7: Doubtful 1,460 1,139 7 6 - -IFRS 7.34(a) Grade 8: Loss 487 380 2 2 - -
IFRS 7.34(a) Total gross amount 60,757 55,182 5,584 4,712 101 101IFRS 7.34(a) Allowance for impairment (individual and collective) (1,673) (1,522) (12) (5) - -
IFRS 7.34(a) Net carrying amount 59,084 53,660 5,572 4,707 101 101
Available for saleIFRS 7.34(a) Grade 1–3: Low–fair risk 1,429 1,443IFRS 7.34(a) Grade 4–5: Watch list 172 112IFRS 7.34(a) Grade 6: Substandard 48 51IFRS 7.34(a) Grade 7: Doubtful 24 25IFRS 7.34(a) Grade 8: Loss 108 9
IFRS 7.34(a) Total carrying amount 1,781 1,640IFRS 7.34(a) Allowance for impairment (individual) (160) (35)
At fair value through profit or lossIFRS 7.34(a) Grade 1–3: Low–fair risk 3,188 2,516 2,509 2,243IFRS 7.34(a) Grade 4–5: Watch list 399 331 858 687IFRS 7.34(a) Grade 6: Substandard 199 161 172 103IFRS 7.34(a) Grade 7: Doubtful 120 95 194 38IFRS 7.34(a) Grade 8: Loss 80 42 192 31
IFRS 7.34(a) Total carrying amount 3,986 3,145 3,925 3,102
Illustrative disclosures – Notes 27Financial risk review and fair value
© 2017 KPMG IFRG Limited, a UK company, limited by guarantee. All rights reserved.
Intr
oduc
tion
Aud
itor
s’ r
epor
tPr
imar
y st
atem
ents
NO
TE
SA
ppen
dice
s
Notes to the consolidated financial statements (continued)
Lending commitments and Loans and advances to customers Loans and advances to banks Investment securities financial guarantees
2016 2015 2016 2015 2016 2015 2016 2015
63,070 56,805 5,572 4,707 5,807 4,843 - -- - - - - - 1,941 1,615
50,947 47,411 5,560 4,692 101 1014,736 3,806 - - - -3,127 2,446 15 12 - -1,460 1,139 7 6 - -
487 380 2 2 - -
60,757 55,182 5,584 4,712 101 101
(1,673) (1,522) (12) (5) - -
59,084 53,660 5,572 4,707 101 101
1,429 1,443172 11248 5124 25
108 9
1,781 1,640
(160) (35)
3,188 2,516 2,509 2,243399 331 858 687199 161 172 103120 95 194 3880 42 192 31
3,986 3,145 3,925 3,102
IFRS 7.31 5. Financial risk review (continued)IFRS 7.33 A. Credit risk (continued)
i. Credit quality analysis (continued)
IFRS 7.36
In millions of euro
Maximum exposure to credit riskCarrying amountAmount committed/guaranteed
At amortised cost IFRS 7.34(a) Grade 1–3: Low–fair riskIFRS 7.34(a) Grade 4–5: Watch list IFRS 7.34(a) Grade 6: SubstandardIFRS 7.34(a) Grade 7: DoubtfulIFRS 7.34(a) Grade 8: Loss
IFRS 7.34(a) Total gross amountIFRS 7.34(a) Allowance for impairment (individual and collective)
IFRS 7.34(a) Net carrying amount
Available for saleIFRS 7.34(a) Grade 1–3: Low–fair riskIFRS 7.34(a) Grade 4–5: Watch list IFRS 7.34(a) Grade 6: SubstandardIFRS 7.34(a) Grade 7: DoubtfulIFRS 7.34(a) Grade 8: Loss
IFRS 7.34(a) Total carrying amount IFRS 7.34(a) Allowance for impairment (individual)
At fair value through profit or lossIFRS 7.34(a) Grade 1–3: Low–fair risk IFRS 7.34(a) Grade 4–5: Watch list IFRS 7.34(a) Grade 6: SubstandardIFRS 7.34(a) Grade 7: DoubtfulIFRS 7.34(a) Grade 8: Loss
IFRS 7.34(a) Total carrying amount
© 2017 KPMG IFRG Limited, a UK company, limited by guarantee. All rights reserved.
28 | Illustrative disclosures for banks under IAS 39
Intr
oduc
tion
Aud
itor
s’ r
epor
tPr
imar
y st
atem
ents
NO
TE
SA
ppen
dice
s
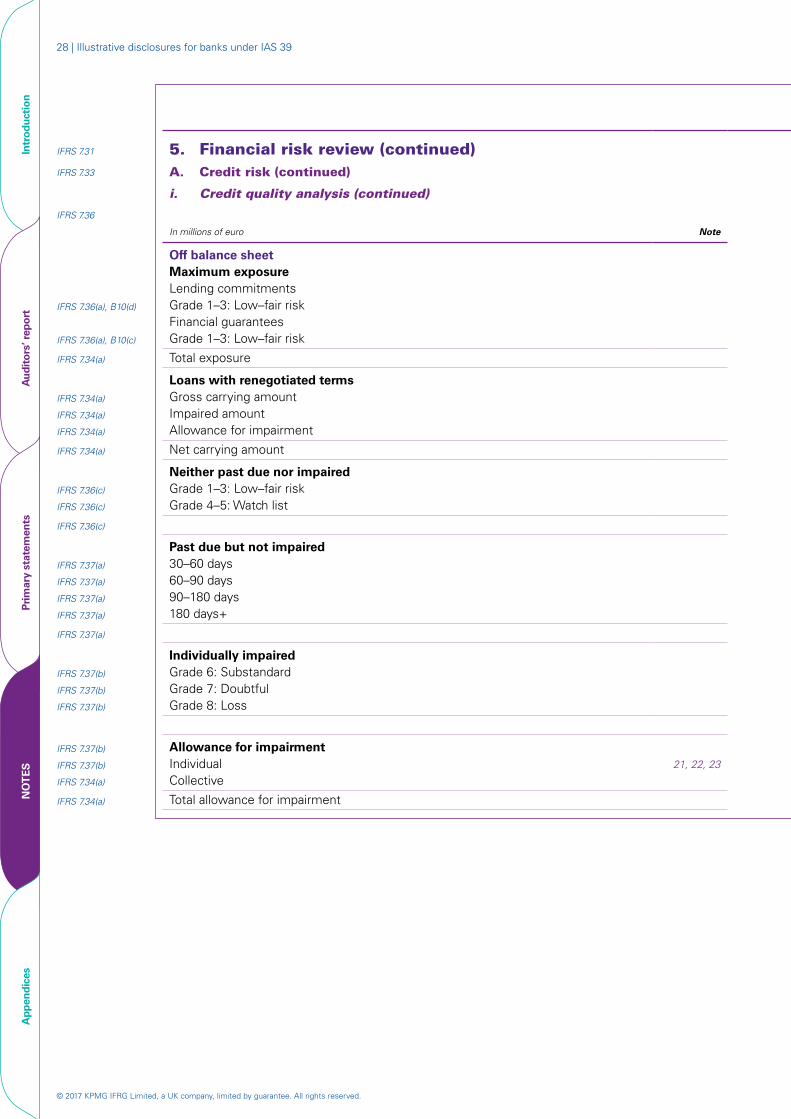
Notes to the consolidated financial statements (continued)IFRS 7.31 5. Financial risk review (continued)IFRS 7.33 A. Credit risk (continued)
i. Credit quality analysis (continued)
IFRS 7.36 Loans and advances to customers Loans and advances to banks Investment securities Lending commitments and
financial guarantees
In millions of euro Note 2016 2015 2016 2015 2016 2015 2016 2015
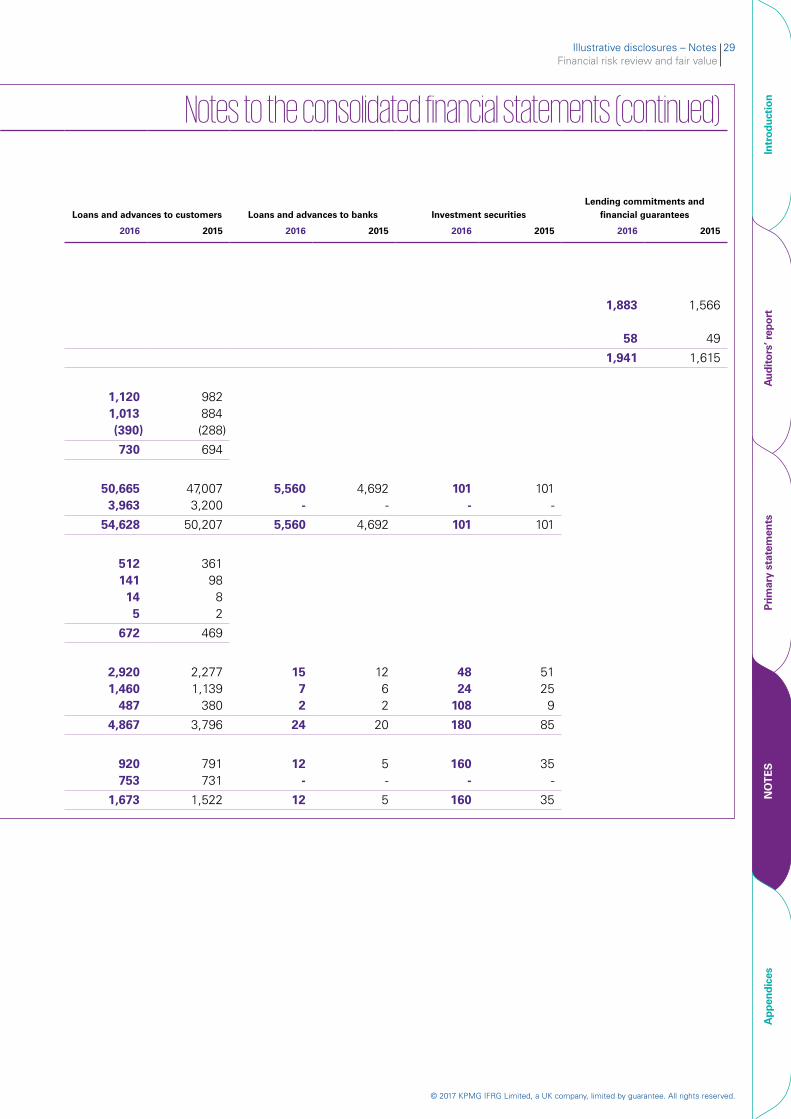
Off balance sheetMaximum exposureLending commitments
IFRS 7.36(a), B10(d) Grade 1–3: Low–fair risk 1,883 1,566Financial guarantees
IFRS 7.36(a), B10(c) Grade 1–3: Low–fair risk 58 49
IFRS 7.34(a) Total exposure 1,941 1,615
Loans with renegotiated termsIFRS 7.34(a) Gross carrying amount 1,120 982IFRS 7.34(a) Impaired amount 1,013 884IFRS 7.34(a) Allowance for impairment (390) (288)
IFRS 7.34(a) Net carrying amount 730 694
Neither past due nor impairedIFRS 7.36(c) Grade 1–3: Low–fair risk 50,665 47,007 5,560 4,692 101 101IFRS 7.36(c) Grade 4–5: Watch list 3,963 3,200 - - - -
IFRS 7.36(c) 54,628 50,207 5,560 4,692 101 101
Past due but not impairedIFRS 7.37(a) 30–60 days 512 361 IFRS 7.37(a) 60–90 days 141 98IFRS 7.37(a) 90–180 days 14 8IFRS 7.37(a) 180 days+ 5 2
IFRS 7.37(a) 672 469
Individually impairedIFRS 7.37(b) Grade 6: Substandard 2,920 2,277 15 12 48 51IFRS 7.37(b) Grade 7: Doubtful 1,460 1,139 7 6 24 25IFRS 7.37(b) Grade 8: Loss 487 380 2 2 108 9
4,867 3,796 24 20 180 85
IFRS 7.37(b) Allowance for impairmentIFRS 7.37(b) Individual 21, 22, 23 920 791 12 5 160 35IFRS 7.34(a) Collective 753 731 - - - -
IFRS 7.34(a) Total allowance for impairment 1,673 1,522 12 5 160 35
Illustrative disclosures – Notes 29Financial risk review and fair value
© 2017 KPMG IFRG Limited, a UK company, limited by guarantee. All rights reserved.
Intr
oduc
tion
Aud
itor
s’ r
epor
tPr
imar
y st
atem
ents
NO
TE
SA
ppen
dice
s
Notes to the consolidated financial statements (continued)
Loans and advances to customers Loans and advances to banks Investment securities Lending commitments and
financial guarantees
2016 2015 2016 2015 2016 2015 2016 2015
1,883 1,566
58 49
1,941 1,615
1,1201,013(390)
982884(288)
5,560 4,692- -
101-
101-
101
730 694
50,6653,963
47,007 3,200
54,628 50,207 5,560 4,692 101
512 361 141 9814 85 2
1572
1262
4824
108
5125
9
85
35
672 469
2,9201,460
487
2,2771,139
380
4,867 3,796 24 20 180
920 791 12 5 160753 731 - - - -
351,673 1,522 12 5 160
IFRS 7.31 5. Financial risk review (continued)IFRS 7.33 A. Credit risk (continued)
i. Credit quality analysis (continued)
IFRS 7.36
In millions of euro Note
Off balance sheetMaximum exposureLending commitments
IFRS 7.36(a), B10(d) Grade 1–3: Low–fair risk Financial guarantees
IFRS 7.36(a), B10(c) Grade 1–3: Low–fair risk
IFRS 7.34(a) Total exposure
Loans with renegotiated termsIFRS 7.34(a) Gross carrying amount IFRS 7.34(a) Impaired amountIFRS 7.34(a) Allowance for impairment
IFRS 7.34(a) Net carrying amount
Neither past due nor impairedIFRS 7.36(c) Grade 1–3: Low–fair riskIFRS 7.36(c) Grade 4–5: Watch list
IFRS 7.36(c)
Past due but not impairedIFRS 7.37(a) 30–60 daysIFRS 7.37(a) 60–90 daysIFRS 7.37(a) 90–180 daysIFRS 7.37(a) 180 days+
IFRS 7.37(a)
Individually impairedIFRS 7.37(b) Grade 6: SubstandardIFRS 7.37(b) Grade 7: DoubtfulIFRS 7.37(b) Grade 8: Loss
IFRS 7.37(b) Allowance for impairmentIFRS 7.37(b) Individual 21, 22, 23
IFRS 7.34(a) Collective
IFRS 7.34(a) Total allowance for impairment
© 2017 KPMG IFRG Limited, a UK company, limited by guarantee. All rights reserved.
30 | Illustrative disclosures for banks under IAS 39
Intr
oduc
tion
Aud
itor
s’ r
epor
tPr
imar
y st
atem
ents
NO
TE
SA
ppen
dice
s
Notes to the consolidated financial statements (continued)IFRS 7.31 5. Financial risk review (continued)IFRS 7.33 A. Credit risk (continued)
i. Credit quality analysis (continued)
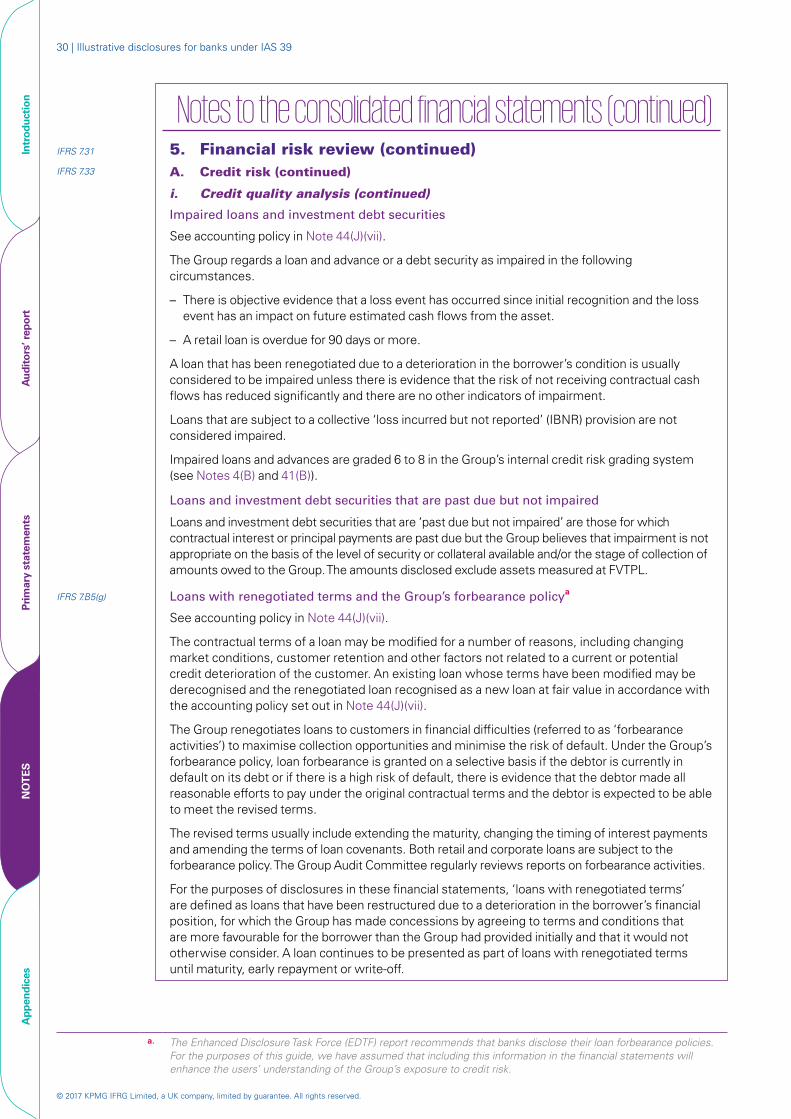
Impaired loans and investment debt securities
See accounting policy in Note 44(J)(vii).
The Group regards a loan and advance or a debt security as impaired in the following circumstances.
– There is objective evidence that a loss event has occurred since initial recognition and the loss event has an impact on future estimated cash flows from the asset.
– A retail loan is overdue for 90 days or more.
A loan that has been renegotiated due to a deterioration in the borrower’s condition is usually considered to be impaired unless there is evidence that the risk of not receiving contractual cash flows has reduced significantly and there are no other indicators of impairment.
Loans that are subject to a collective ‘loss incurred but not reported’ (IBNR) provision are not considered impaired.
Impaired loans and advances are graded 6 to 8 in the Group’s internal credit risk grading system (see Notes 4(B) and 41(B)).
Loans and investment debt securities that are past due but not impaired
Loans and investment debt securities that are ‘past due but not impaired’ are those for which contractual interest or principal payments are past due but the Group believes that impairment is not appropriate on the basis of the level of security or collateral available and/or the stage of collection of amounts owed to the Group. The amounts disclosed exclude assets measured at FVTPL.
IFRS 7.B5(g) Loans with renegotiated terms and the Group’s forbearance policya
See accounting policy in Note 44(J)(vii).
The contractual terms of a loan may be modified for a number of reasons, including changing market conditions, customer retention and other factors not related to a current or potential credit deterioration of the customer. An existing loan whose terms have been modified may be derecognised and the renegotiated loan recognised as a new loan at fair value in accordance with the accounting policy set out in Note 44(J)(vii).
The Group renegotiates loans to customers in financial difficulties (referred to as ‘forbearance activities’) to maximise collection opportunities and minimise the risk of default. Under the Group’s forbearance policy, loan forbearance is granted on a selective basis if the debtor is currently in default on its debt or if there is a high risk of default, there is evidence that the debtor made all reasonable efforts to pay under the original contractual terms and the debtor is expected to be able to meet the revised terms.
The revised terms usually include extending the maturity, changing the timing of interest payments and amending the terms of loan covenants. Both retail and corporate loans are subject to the forbearance policy. The Group Audit Committee regularly reviews reports on forbearance activities.
For the purposes of disclosures in these financial statements, ‘loans with renegotiated terms’ are defined as loans that have been restructured due to a deterioration in the borrower’s financial position, for which the Group has made concessions by agreeing to terms and conditions that are more favourable for the borrower than the Group had provided initially and that it would not otherwise consider. A loan continues to be presented as part of loans with renegotiated terms until maturity, early repayment or write-off.
a. The Enhanced Disclosure Task Force (EDTF) report recommends that banks disclose their loan forbearance policies. For the purposes of this guide, we have assumed that including this information in the financial statements will enhance the users’ understanding of the Group’s exposure to credit risk.
Illustrative disclosures – Notes 31Financial risk review and fair value
© 2017 KPMG IFRG Limited, a UK company, limited by guarantee. All rights reserved.
Intr
oduc
tion
Aud
itor
s’ r
epor
tPr
imar
y st
atem
ents
NO
TE
SA
ppen
dice
s
Notes to the consolidated financial statements (continued)IFRS 7.31 5. Financial risk review (continued)IFRS 7.33 A. Credit risk (continued)
i. Credit quality analysis (continued)
Loans with renegotiated terms and the Group’s forbearance policy (continued)
Irrespective of whether loans with renegotiated terms have been derecognised, they remain disclosed as impaired until there is sufficient evidence to demonstrate a significant reduction in the risk of non-payment of future cash flows and there are no other indicators of impairment.
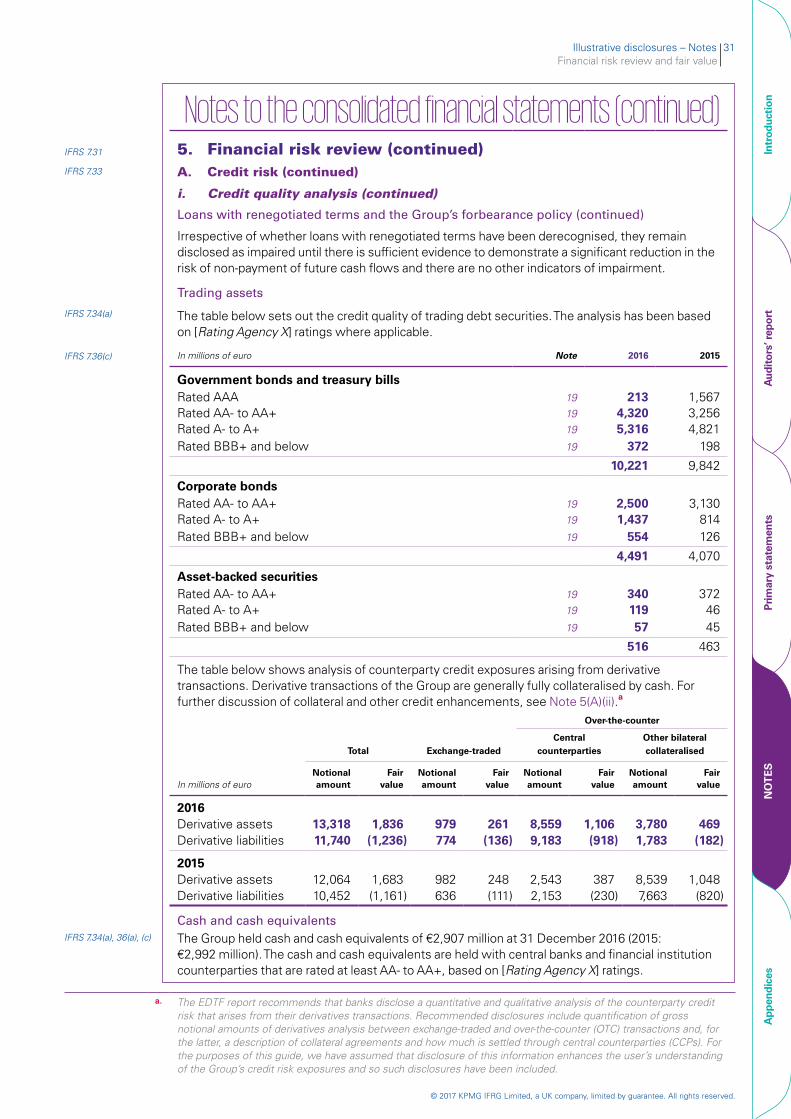
Trading assets
IFRS 7.34(a) The table below sets out the credit quality of trading debt securities. The analysis has been based on [Rating Agency X] ratings where applicable.
IFRS 7.36(c) In millions of euro Note 2016 2015
Government bonds and treasury billsRated AAA 19 213 1,567Rated AA- to AA+ 19 4,320 3,256Rated A- to A+ 19 5,316 4,821Rated BBB+ and below 19 372 198
10,221 9,842
Corporate bondsRated AA- to AA+ 19 2,500 3,130Rated A- to A+ 19 1,437 814Rated BBB+ and below 19 554 126
4,491 4,070
Asset-backed securitiesRated AA- to AA+ 19 340 372Rated A- to A+ 19 119 46Rated BBB+ and below 19 57 45
516 463
The table below shows analysis of counterparty credit exposures arising from derivative transactions. Derivative transactions of the Group are generally fully collateralised by cash. For further discussion of collateral and other credit enhancements, see Note 5(A)(ii).a
Over-the-counter
Total Exchange-tradedCentral
counterpartiesOther bilateral collateralised
In millions of euroNotionalamount
Fairvalue
Notionalamount
Fairvalue
Notionalamount
Fairvalue
Notionalamount
Fairvalue
2016Derivative assets 13,318 1,836 979 261 8,559 1,106 3,780 469Derivative liabilities 11,740 (1,236) 774 (136) 9,183 (918) 1,783 (182)
2015Derivative assets 12,064 1,683 982 248 2,543 387 8,539 1,048Derivative liabilities 10,452 (1,161) 636 (111) 2,153 (230) 7,663 (820)
Cash and cash equivalentsIFRS 7.34(a), 36(a), (c) The Group held cash and cash equivalents of €2,907 million at 31 December 2016 (2015:
€2,992 million). The cash and cash equivalents are held with central banks and financial institution counterparties that are rated at least AA- to AA+, based on [Rating Agency X] ratings.
a. The EDTF report recommends that banks disclose a quantitative and qualitative analysis of the counterparty credit risk that arises from their derivatives transactions. Recommended disclosures include quantification of gross notional amounts of derivatives analysis between exchange-traded and over-the-counter (OTC) transactions and, for the latter, a description of collateral agreements and how much is settled through central counterparties (CCPs). For the purposes of this guide, we have assumed that disclosure of this information enhances the user’s understanding of the Group’s credit risk exposures and so such disclosures have been included.
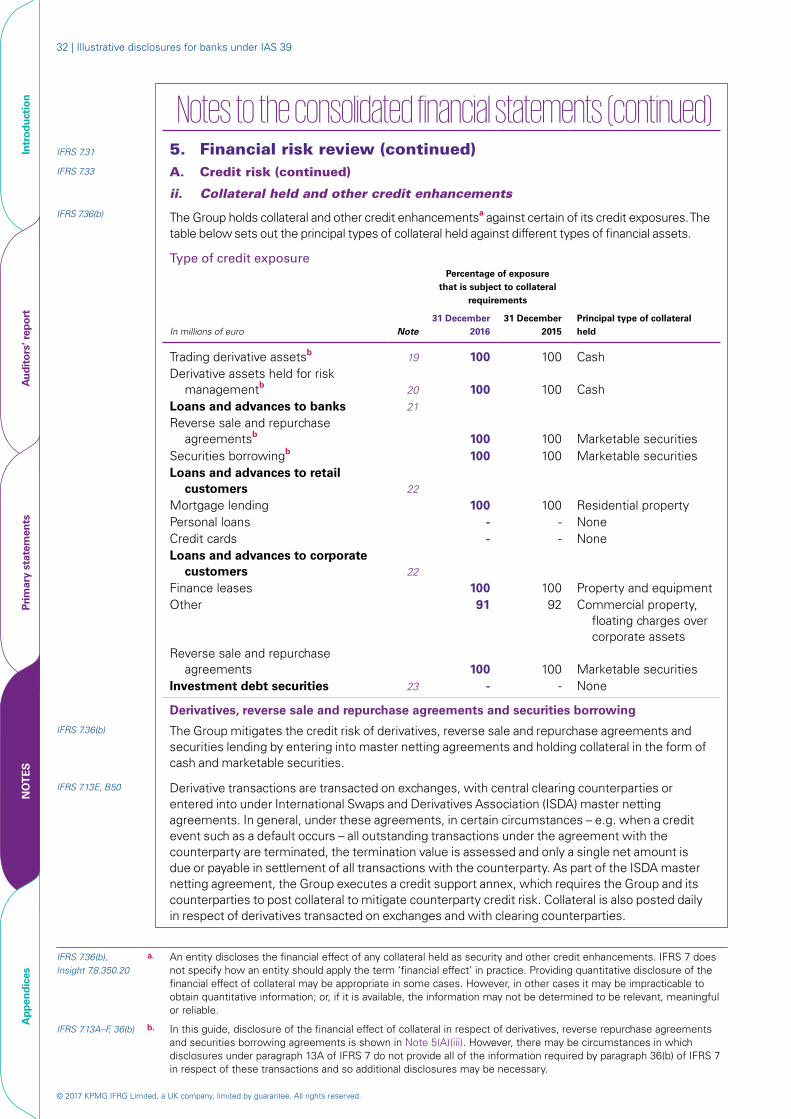
© 2017 KPMG IFRG Limited, a UK company, limited by guarantee. All rights reserved.
32 | Illustrative disclosures for banks under IAS 39
Intr
oduc
tion
Aud
itor
s’ r
epor
tPr
imar
y st
atem
ents
NO
TE
SA
ppen
dice
s
Notes to the consolidated financial statements (continued) IFRS 7.31 5. Financial risk review (continued)IFRS 7.33 A. Credit risk (continued)
ii. Collateral held and other credit enhancements
IFRS 7.36(b) The Group holds collateral and other credit enhancementsa against certain of its credit exposures. The table below sets out the principal types of collateral held against different types of financial assets.
Type of credit exposurePercentage of exposure
that is subject to collateral requirements
In millions of euroPrincipal type of collateral heldNote
31 December2016
31 December 2015
Trading derivative assetsb 19 100 100 Cash Derivative assets held for risk
managementb 20 100 100 Cash Loans and advances to banks 21
Reverse sale and repurchase agreementsb 100 100 Marketable securities
Securities borrowingb 100 100 Marketable securitiesLoans and advances to retail
customers 22
Mortgage lending 100 100 Residential propertyPersonal loans - - NoneCredit cards - - NoneLoans and advances to corporate
customers 22
Finance leases 100 100 Property and equipmentOther 91 92 Commercial property,
floating charges over corporate assets
Reverse sale and repurchase agreements 100 100 Marketable securities
Investment debt securities 23 - - None
Derivatives, reverse sale and repurchase agreements and securities borrowingIFRS 7.36(b) The Group mitigates the credit risk of derivatives, reverse sale and repurchase agreements and
securities lending by entering into master netting agreements and holding collateral in the form of cash and marketable securities.
IFRS 7.13E, B50 Derivative transactions are transacted on exchanges, with central clearing counterparties or entered into under International Swaps and Derivatives Association (ISDA) master netting agreements. In general, under these agreements, in certain circumstances – e.g. when a credit event such as a default occurs – all outstanding transactions under the agreement with the counterparty are terminated, the termination value is assessed and only a single net amount is due or payable in settlement of all transactions with the counterparty. As part of the ISDA master netting agreement, the Group executes a credit support annex, which requires the Group and its counterparties to post collateral to mitigate counterparty credit risk. Collateral is also posted daily in respect of derivatives transacted on exchanges and with clearing counterparties.
IFRS 7.36(b), Insight 7.8.350.20
a. An entity discloses the financial effect of any collateral held as security and other credit enhancements. IFRS 7 does not specify how an entity should apply the term ‘financial effect’ in practice. Providing quantitative disclosure of the financial effect of collateral may be appropriate in some cases. However, in other cases it may be impracticable to obtain quantitative information; or, if it is available, the information may not be determined to be relevant, meaningful or reliable.
IFRS 7.13A–F, 36(b) b. In this guide, disclosure of the financial effect of collateral in respect of derivatives, reverse repurchase agreements and securities borrowing agreements is shown in Note 5(A)(iii). However, there may be circumstances in which disclosures under paragraph 13A of IFRS 7 do not provide all of the information required by paragraph 36(b) of IFRS 7 in respect of these transactions and so additional disclosures may be necessary.
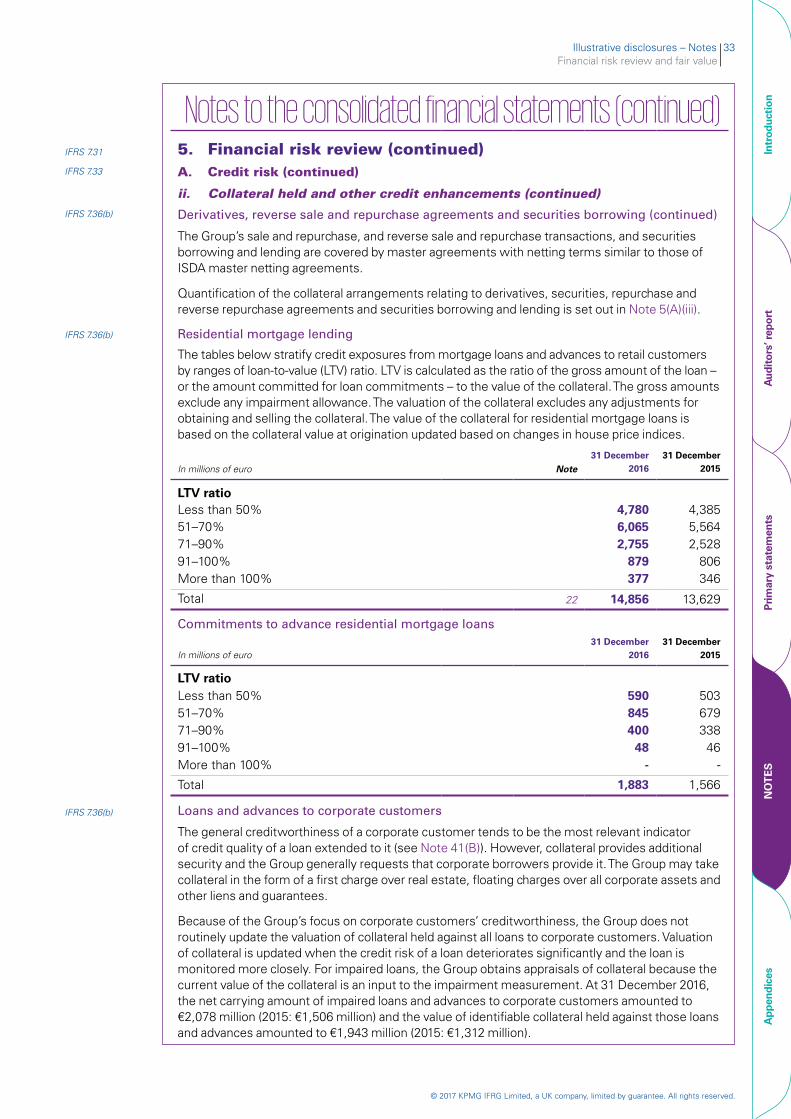
Illustrative disclosures – Notes 33Financial risk review and fair value
© 2017 KPMG IFRG Limited, a UK company, limited by guarantee. All rights reserved.
Intr
oduc
tion
Aud
itor
s’ r
epor
tPr
imar
y st
atem
ents
NO
TE
SA
ppen
dice
s
Notes to the consolidated financial statements (continued) IFRS 7.31 5. Financial risk review (continued)IFRS 7.33 A. Credit risk (continued)
ii. Collateral held and other credit enhancements (continued)
IFRS 7.36(b) Derivatives, reverse sale and repurchase agreements and securities borrowing (continued)
The Group’s sale and repurchase, and reverse sale and repurchase transactions, and securities borrowing and lending are covered by master agreements with netting terms similar to those of ISDA master netting agreements.
Quantification of the collateral arrangements relating to derivatives, securities, repurchase and reverse repurchase agreements and securities borrowing and lending is set out in Note 5(A)(iii).
IFRS 7.36(b) Residential mortgage lending
The tables below stratify credit exposures from mortgage loans and advances to retail customers by ranges of loan-to-value (LTV) ratio. LTV is calculated as the ratio of the gross amount of the loan – or the amount committed for loan commitments – to the value of the collateral. The gross amounts exclude any impairment allowance. The valuation of the collateral excludes any adjustments for obtaining and selling the collateral. The value of the collateral for residential mortgage loans is based on the collateral value at origination updated based on changes in house price indices.
In millions of euro
Note31 December
201631 December
2015
LTV ratioLess than 50% 4,780 4,38551–70% 6,065 5,56471–90% 2,755 2,52891–100% 879 806More than 100% 377 346
Total 22 14,856 13,629
Commitments to advance residential mortgage loans
In millions of euro31 December
201631 December
2015
LTV ratioLess than 50% 590 50351–70% 845 67971–90% 400 33891–100% 48 46More than 100% - -
Total 1,883 1,566
IFRS 7.36(b) Loans and advances to corporate customers
The general creditworthiness of a corporate customer tends to be the most relevant indicator of credit quality of a loan extended to it (see Note 41(B)). However, collateral provides additional security and the Group generally requests that corporate borrowers provide it. The Group may take collateral in the form of a first charge over real estate, floating charges over all corporate assets and other liens and guarantees.
Because of the Group’s focus on corporate customers’ creditworthiness, the Group does not routinely update the valuation of collateral held against all loans to corporate customers. Valuation of collateral is updated when the credit risk of a loan deteriorates significantly and the loan is monitored more closely. For impaired loans, the Group obtains appraisals of collateral because the current value of the collateral is an input to the impairment measurement. At 31 December 2016, the net carrying amount of impaired loans and advances to corporate customers amounted to €2,078 million (2015: €1,506 million) and the value of identifiable collateral held against those loans and advances amounted to €1,943 million (2015: €1,312 million).
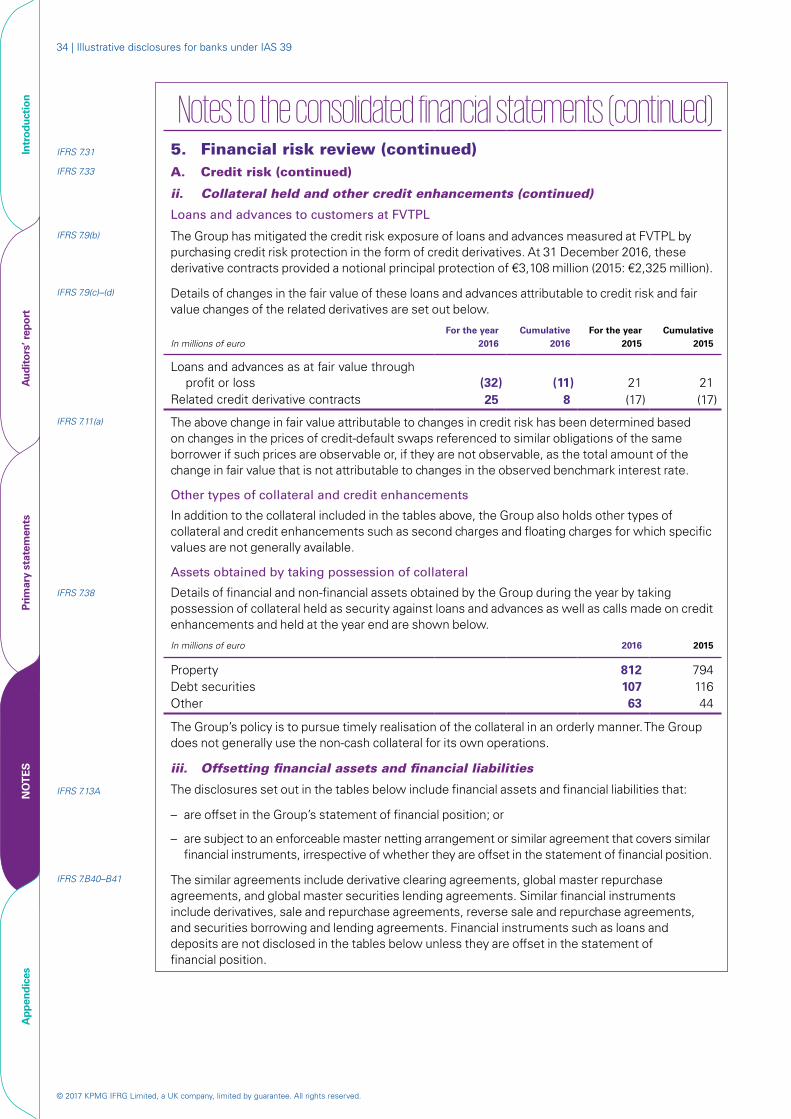
© 2017 KPMG IFRG Limited, a UK company, limited by guarantee. All rights reserved.
34 | Illustrative disclosures for banks under IAS 39
Intr
oduc
tion
Aud
itor
s’ r
epor
tPr
imar
y st
atem
ents
NO
TE
SA
ppen
dice
s
Notes to the consolidated financial statements (continued)IFRS 7.31 5. Financial risk review (continued)IFRS 7.33 A. Credit risk (continued)
ii. Collateral held and other credit enhancements (continued)
Loans and advances to customers at FVTPL
IFRS 7.9(b) The Group has mitigated the credit risk exposure of loans and advances measured at FVTPL by purchasing credit risk protection in the form of credit derivatives. At 31 December 2016, these derivative contracts provided a notional principal protection of €3,108 million (2015: €2,325 million).
IFRS 7.9(c)–(d) Details of changes in the fair value of these loans and advances attributable to credit risk and fair value changes of the related derivatives are set out below.
In millions of euroFor the year
2016Cumulative
2016For the year
2015Cumulative
2015
Loans and advances as at fair value through profit or loss (32) (11) 21 21
Related credit derivative contracts 25 8 (17) (17)
IFRS 7.11(a) The above change in fair value attributable to changes in credit risk has been determined based on changes in the prices of credit-default swaps referenced to similar obligations of the same borrower if such prices are observable or, if they are not observable, as the total amount of the change in fair value that is not attributable to changes in the observed benchmark interest rate.
Other types of collateral and credit enhancements
In addition to the collateral included in the tables above, the Group also holds other types of collateral and credit enhancements such as second charges and floating charges for which specific values are not generally available.
Assets obtained by taking possession of collateral
IFRS 7.38 Details of financial and non-financial assets obtained by the Group during the year by taking possession of collateral held as security against loans and advances as well as calls made on credit enhancements and held at the year end are shown below.
In millions of euro 2016 2015
Property 812 794Debt securities 107 116Other 63 44
The Group’s policy is to pursue timely realisation of the collateral in an orderly manner. The Group does not generally use the non-cash collateral for its own operations.
iii. Offsetting financial assets and financial liabilities
IFRS 7.13A The disclosures set out in the tables below include financial assets and financial liabilities that:
– are offset in the Group’s statement of financial position; or
– are subject to an enforceable master netting arrangement or similar agreement that covers similar financial instruments, irrespective of whether they are offset in the statement of financial position.
IFRS 7.B40–B41 The similar agreements include derivative clearing agreements, global master repurchase agreements, and global master securities lending agreements. Similar financial instruments include derivatives, sale and repurchase agreements, reverse sale and repurchase agreements, and securities borrowing and lending agreements. Financial instruments such as loans and deposits are not disclosed in the tables below unless they are offset in the statement of financial position.
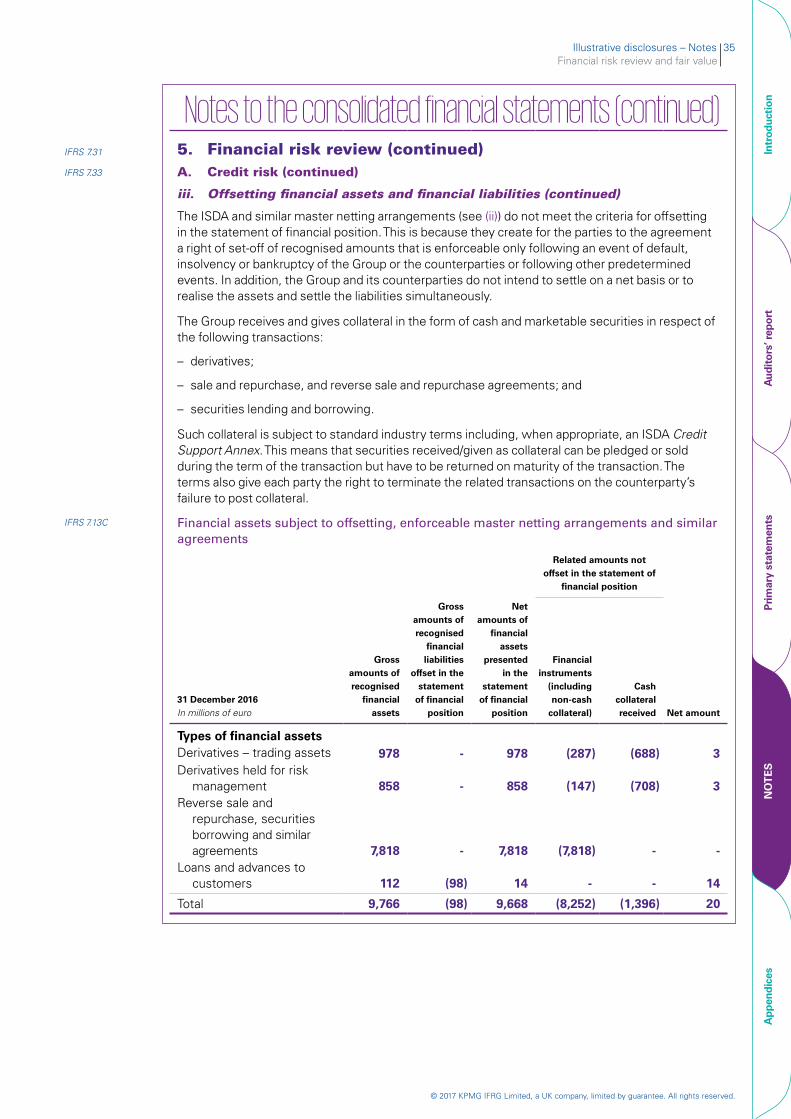
Illustrative disclosures – Notes 35Financial risk review and fair value
© 2017 KPMG IFRG Limited, a UK company, limited by guarantee. All rights reserved.
Intr
oduc
tion
Aud
itor
s’ r
epor
tPr
imar
y st
atem
ents
NO
TE
SA
ppen
dice
s
Notes to the consolidated financial statements (continued) IFRS 7.31 5. Financial risk review (continued)IFRS 7.33 A. Credit risk (continued)
iii. Offsetting financial assets and financial liabilities (continued)
The ISDA and similar master netting arrangements (see (ii)) do not meet the criteria for offsetting in the statement of financial position. This is because they create for the parties to the agreement a right of set-off of recognised amounts that is enforceable only following an event of default, insolvency or bankruptcy of the Group or the counterparties or following other predetermined events. In addition, the Group and its counterparties do not intend to settle on a net basis or to realise the assets and settle the liabilities simultaneously.
The Group receives and gives collateral in the form of cash and marketable securities in respect of the following transactions:
– derivatives;
– sale and repurchase, and reverse sale and repurchase agreements; and
– securities lending and borrowing.
Such collateral is subject to standard industry terms including, when appropriate, an ISDA Credit Support Annex. This means that securities received/given as collateral can be pledged or sold during the term of the transaction but have to be returned on maturity of the transaction. The terms also give each party the right to terminate the related transactions on the counterparty’s failure to post collateral.
IFRS 7.13C Financial assets subject to offsetting, enforceable master netting arrangements and similar agreements
Related amounts not offset in the statement of
financial position
31 December 2016 In millions of euro
Gross amounts of recognised
financial assets
Gross amounts of recognised
financial liabilities
offset in the statement
of financial position
Net amounts of
financial assets
presented in the
statement of financial
position
Financial instruments
(including non-cash
collateral)
Cash collateral received Net amount
Types of financial assetsDerivatives – trading assets 978 - 978 (287) (688) 3Derivatives held for risk
management 858 - 858 (147) (708) 3Reverse sale and
repurchase, securities borrowing and similar agreements 7,818 - 7,818 (7,818) - -
Loans and advances to customers 112 (98) 14 - - 14
Total 9,766 (98) 9,668 (8,252) (1,396) 20
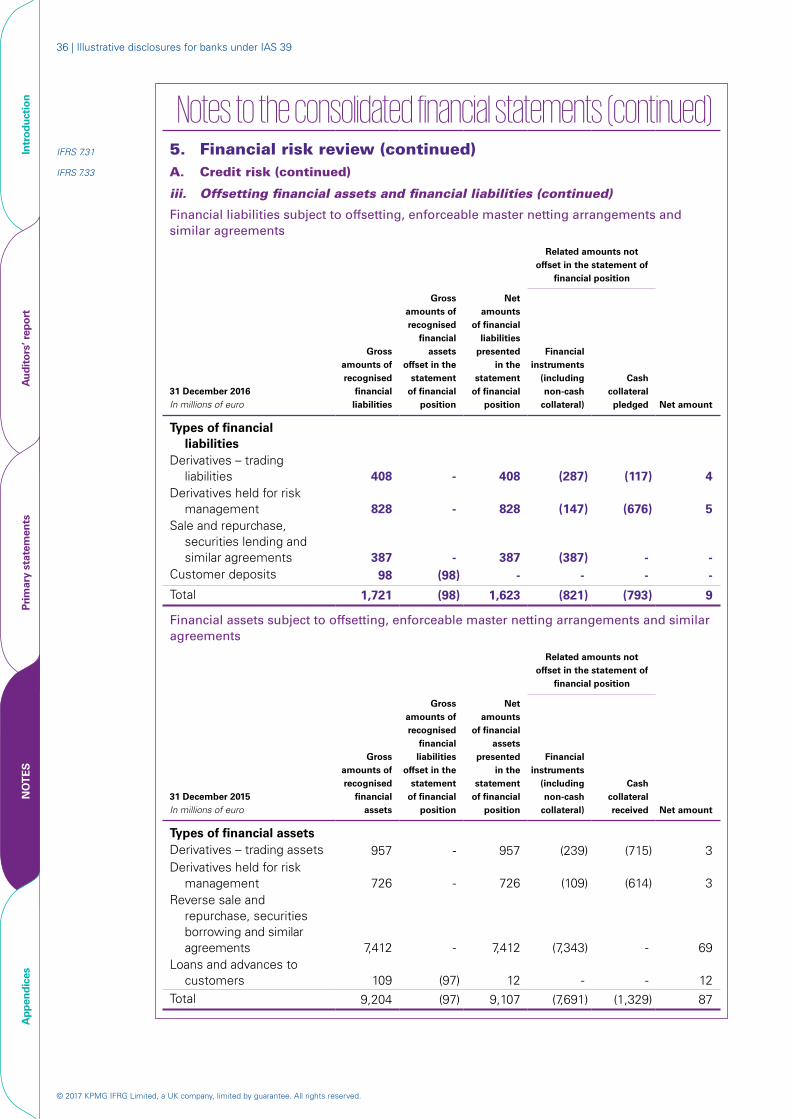
© 2017 KPMG IFRG Limited, a UK company, limited by guarantee. All rights reserved.
36 | Illustrative disclosures for banks under IAS 39
Intr
oduc
tion
Aud
itor
s’ r
epor
tPr
imar
y st
atem
ents
NO
TE
SA
ppen
dice
s
Notes to the consolidated financial statements (continued)IFRS 7.31 5. Financial risk review (continued)IFRS 7.33 A. Credit risk (continued)
iii. Offsetting financial assets and financial liabilities (continued)
Financial liabilities subject to offsetting, enforceable master netting arrangements and similar agreements
Related amounts not offset in the statement of
financial position
31 December 2016 In millions of euro
Gross amounts of recognised
financial liabilities
Gross amounts of recognised
financial assets
offset in the statement
of financial position
Net amounts
of financial liabilities
presented in the
statement of financial
position
Financial instruments
(including non-cash
collateral)
Cash collateral pledged Net amount
Types of financial liabilities
Derivatives – trading liabilities 408 - 408 (287) (117) 4
Derivatives held for risk management 828 - 828 (147) (676) 5
Sale and repurchase, securities lending and similar agreements 387 - 387 (387) - -
Customer deposits 98 (98) - - - -
Total 1,721 (98) 1,623 (821) (793) 9
Financial assets subject to offsetting, enforceable master netting arrangements and similar agreements
Related amounts not offset in the statement of
financial position
31 December 2015 In millions of euro
Gross amounts of recognised
financial assets
Gross amounts of recognised
financial liabilities
offset in the statement
of financial position
Net amounts
of financial assets
presented in the
statement of financial
position
Financial instruments
(including non-cash
collateral)
Cash collateral received Net amount
Types of financial assetsDerivatives – trading assets 957 - 957 (239) (715) 3 Derivatives held for risk
management 726 - 726 (109) (614) 3 Reverse sale and
repurchase, securities borrowing and similar agreements 7,412 - 7,412 (7,343) - 69
Loans and advances to customers 109 (97) 12 - - 12
Total 9,204 (97) 9,107 (7,691) (1,329) 87
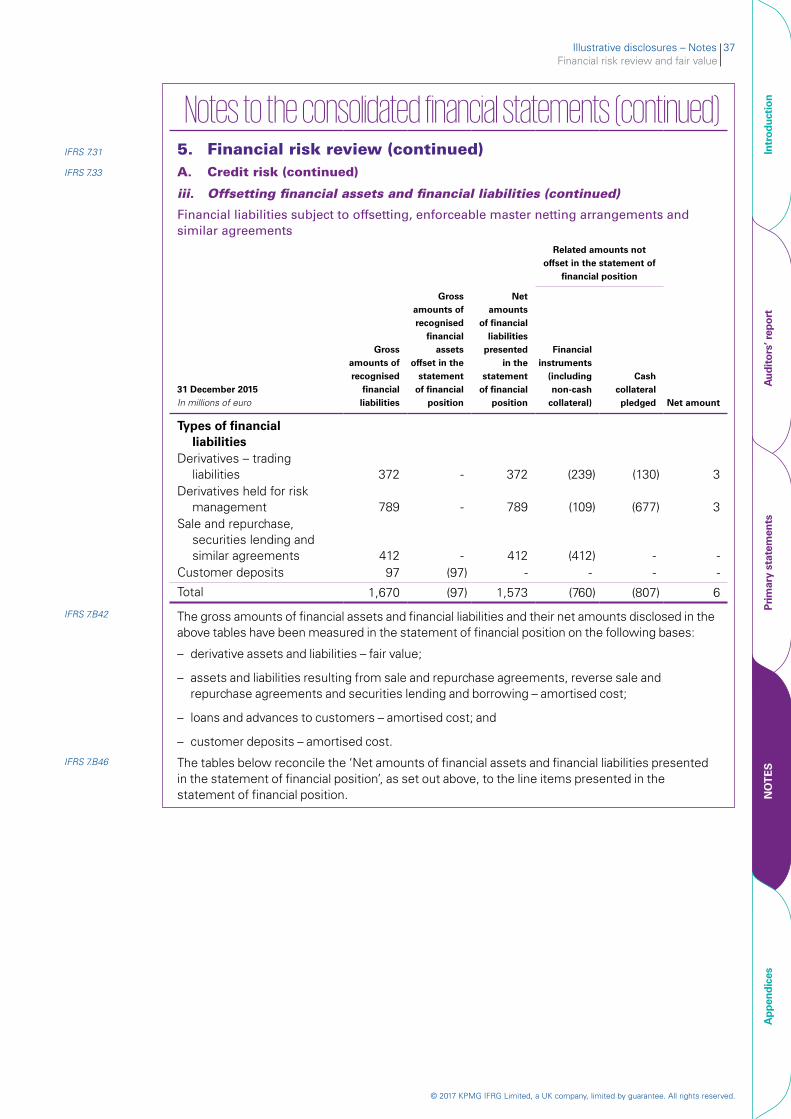
Illustrative disclosures – Notes 37Financial risk review and fair value
© 2017 KPMG IFRG Limited, a UK company, limited by guarantee. All rights reserved.
Intr
oduc
tion
Aud
itor
s’ r
epor
tPr
imar
y st
atem
ents
NO
TE
SA
ppen
dice
s
Notes to the consolidated financial statements (continued) IFRS 7.31 5. Financial risk review (continued)IFRS 7.33 A. Credit risk (continued)
iii. Offsetting financial assets and financial liabilities (continued)
Financial liabilities subject to offsetting, enforceable master netting arrangements and similar agreements
Related amounts not offset in the statement of
financial position
31 December 2015 In millions of euro
Gross amounts of recognised
financial liabilities
Gross amounts of recognised
financial assets
offset in the statement
of financial position
Net amounts
of financial liabilities
presented in the
statement of financial
position
Financial instruments
(including non-cash
collateral)
Cash collateral pledged Net amount
Types of financial liabilities
Derivatives – trading liabilities 372 - 372 (239) (130) 3
Derivatives held for risk management 789 - 789 (109) (677) 3
Sale and repurchase, securities lending and similar agreements 412 - 412 (412) - -
Customer deposits 97 (97) - - - -
Total 1,670 (97) 1,573 (760) (807) 6
IFRS 7.B42 The gross amounts of financial assets and financial liabilities and their net amounts disclosed in the above tables have been measured in the statement of financial position on the following bases:
– derivative assets and liabilities – fair value;
– assets and liabilities resulting from sale and repurchase agreements, reverse sale and repurchase agreements and securities lending and borrowing – amortised cost;
– loans and advances to customers – amortised cost; and
– customer deposits – amortised cost.
IFRS 7.B46 The tables below reconcile the ‘Net amounts of financial assets and financial liabilities presented in the statement of financial position’, as set out above, to the line items presented in the statement of financial position.
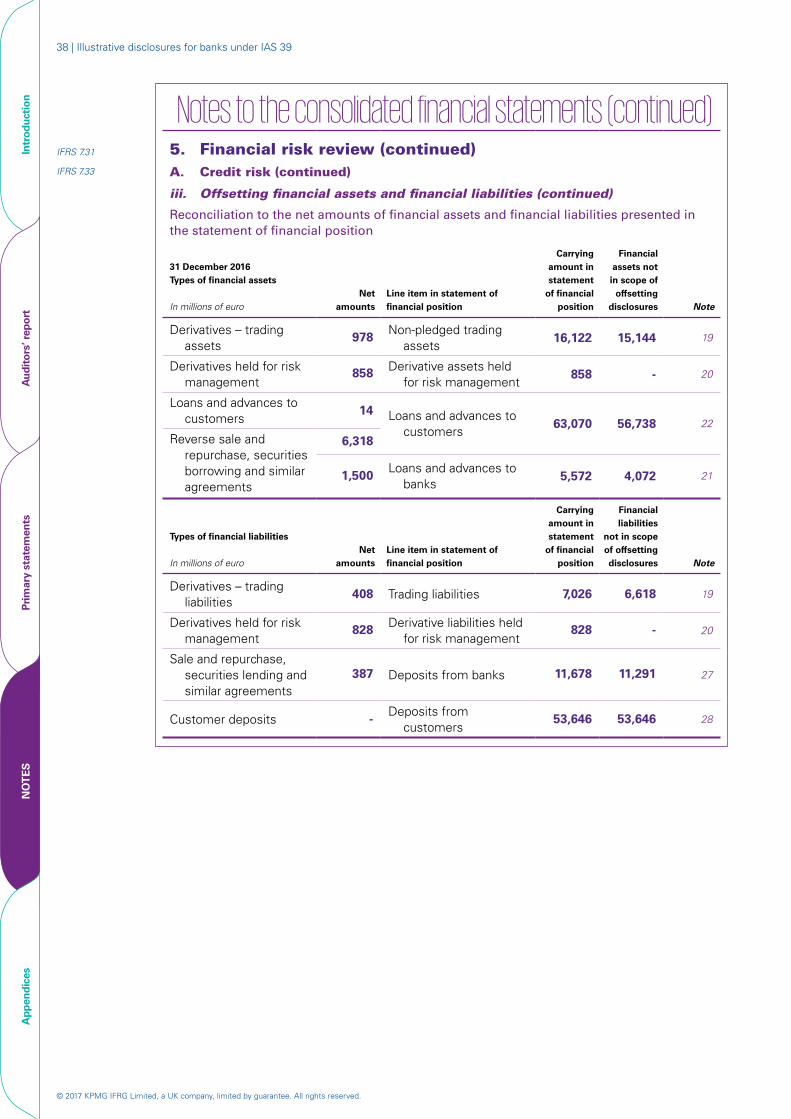
© 2017 KPMG IFRG Limited, a UK company, limited by guarantee. All rights reserved.
38 | Illustrative disclosures for banks under IAS 39
Intr
oduc
tion
Aud
itor
s’ r
epor
tPr
imar
y st
atem
ents
NO
TE
SA
ppen
dice
s
Notes to the consolidated financial statements (continued)IFRS 7.31 5. Financial risk review (continued)IFRS 7.33 A. Credit risk (continued)
iii. Offsetting financial assets and financial liabilities (continued)
Reconciliation to the net amounts of financial assets and financial liabilities presented in the statement of financial position
31 December 2016 Types of financial assets In millions of euro
Net amounts
Line item in statement of financial position
Carrying amount in statement
of financial position
Financial assets not in scope of
offsetting disclosures Note
Derivatives – trading assets
978 Non-pledged trading assets
16,122 15,144 19
Derivatives held for risk management
858 Derivative assets held for risk management
858 - 20
Loans and advances to customers
14 Loans and advances to customers
63,070 56,738 22Reverse sale and
repurchase, securities borrowing and similar agreements
6,318
1,500 Loans and advances to banks
5,572 4,072 21
Types of financial liabilities In millions of euro
Net amounts
Line item in statement of financial position
Carrying amount in statement
of financial position
Financial liabilities
not in scope of offsetting disclosures Note
Derivatives – trading liabilities
408 Trading liabilities 7,026 6,618 19
Derivatives held for risk management
828 Derivative liabilities held for risk management
828 - 20
Sale and repurchase, securities lending and similar agreements
387 Deposits from banks 11,678 11,291 27
Customer deposits - Deposits from customers
53,646 53,646 28
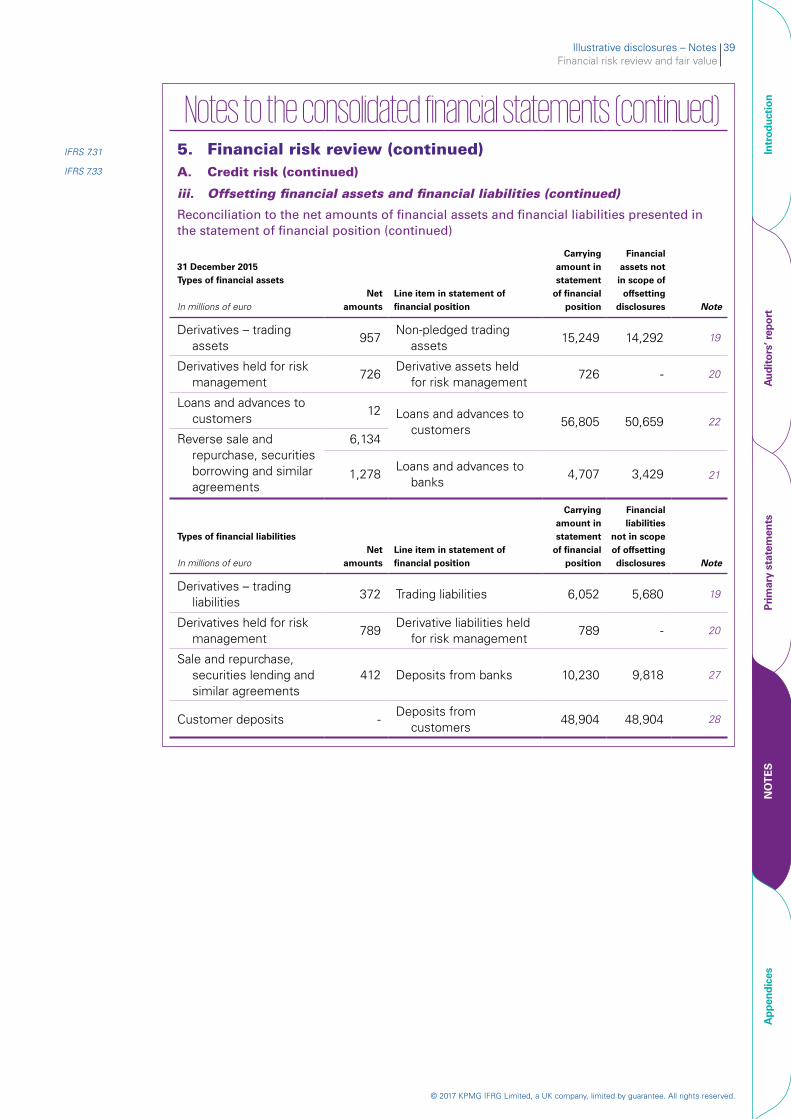
Illustrative disclosures – Notes 39Financial risk review and fair value
© 2017 KPMG IFRG Limited, a UK company, limited by guarantee. All rights reserved.
Intr
oduc
tion
Aud
itor
s’ r
epor
tPr
imar
y st
atem
ents
NO
TE
SA
ppen
dice
s
Notes to the consolidated financial statements (continued)IFRS 7.31 5. Financial risk review (continued)IFRS 7.33 A. Credit risk (continued)
iii. Offsetting financial assets and financial liabilities (continued)
Reconciliation to the net amounts of financial assets and financial liabilities presented in the statement of financial position (continued)
31 December 2015 Types of financial assets In millions of euro
Net amounts
Line item in statement of financial position
Carrying amount in statement
of financial position
Financial assets not in scope of
offsetting disclosures Note
Derivatives – trading assets
957Non-pledged trading
assets15,249 14,292 19
Derivatives held for risk management
726Derivative assets held
for risk management726 - 20
Loans and advances to customers
12 Loans and advances to customers
56,805 50,659 22
Reverse sale and repurchase, securities borrowing and similar agreements
6,134
1,278Loans and advances to
banks 4,707 3,429 21
Types of financial liabilities In millions of euro
Net amounts
Line item in statement of financial position
Carrying amount in statement
of financial position
Financial liabilities
not in scope of offsetting disclosures Note
Derivatives – trading liabilities
372 Trading liabilities 6,052 5,680 19
Derivatives held for risk management
789 Derivative liabilities held
for risk management 789 - 20
Sale and repurchase, securities lending and similar agreements
412 Deposits from banks 10,230 9,818 27
Customer deposits - Deposits from
customers48,904 48,904 28
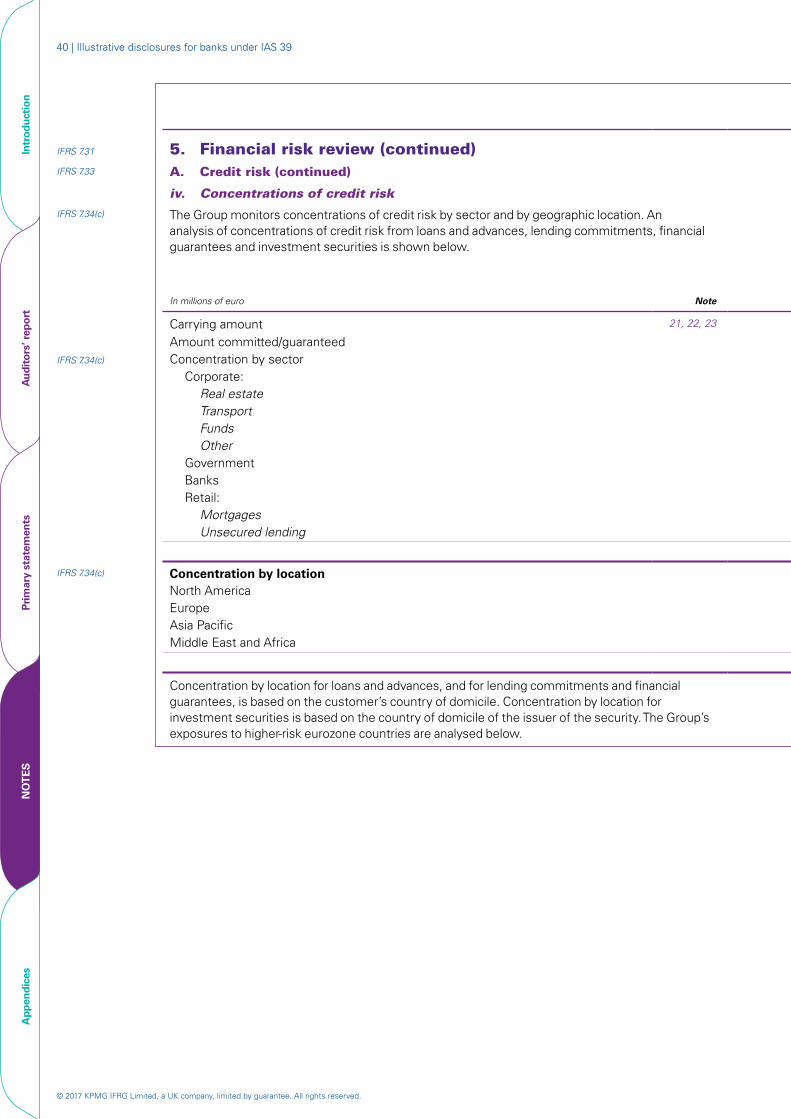
© 2017 KPMG IFRG Limited, a UK company, limited by guarantee. All rights reserved.
40 | Illustrative disclosures for banks under IAS 39
Intr
oduc
tion
Aud
itor
s’ r
epor
tPr
imar
y st
atem
ents
NO
TE
SA
ppen
dice
s
Notes to the consolidated financial statements (continued) IFRS 7.31 5. Financial risk review (continued)IFRS 7.33 A. Credit risk (continued)
iv. Concentrations of credit risk
IFRS 7.34(c) The Group monitors concentrations of credit risk by sector and by geographic location. An analysis of concentrations of credit risk from loans and advances, lending commitments, financial guarantees and investment securities is shown below.
Loans and advances to banks Loans and advances to customers Investment debt securitiesLending commitments and
financial guarantees
In millions of euro Note 2016 2015 2016 2015 2016 2015 2016 2015
Carrying amount 21, 22, 23 5,572 4,707 63,070 56,805 5,807 4,843 (32) (28)Amount committed/guaranteed 1,941 1,615
IFRS 7.34(c) Concentration by sectorCorporate: - - 42,414 37,987 4,885 4,047 1,288 1,071
Real estate - - 16,966 15,574 2,399 2,042 1,234 1,039Transport - - 12,724 10,636 2,421 1,843 54 32 Funds - - 9,331 8,737 - - Other - - 3,393 3,040 65 162
Government - - - - 824 709 Banks 5,572 4,707 - - - - Retail: - - 20,656 18,818 98 87 653 544
Mortgages - - 14,547 13,361 98 87 630 524 Unsecured lending - - 6,109 5,457 - - 23 20
5,572 4,707 63,070 56,805 5,807 4,843 1,941 1,615
IFRS 7.34(c) Concentration by locationNorth America 1,118 944 12,649 11,393 2,374 2,246 80 67Europe 3,139 2,652 36,238 32,656 2,443 1,761 1,803 1,499Asia Pacific 722 664 8,188 7,356 528 446 40 33Middle East and Africa 593 447 5,995 5,400 462 390 18 16
5,572 4,707 63,070 56,805 5,807 4,843 1,941 1,615
Concentration by location for loans and advances, and for lending commitments and financial guarantees, is based on the customer’s country of domicile. Concentration by location for investment securities is based on the country of domicile of the issuer of the security. The Group’s exposures to higher-risk eurozone countries are analysed below.
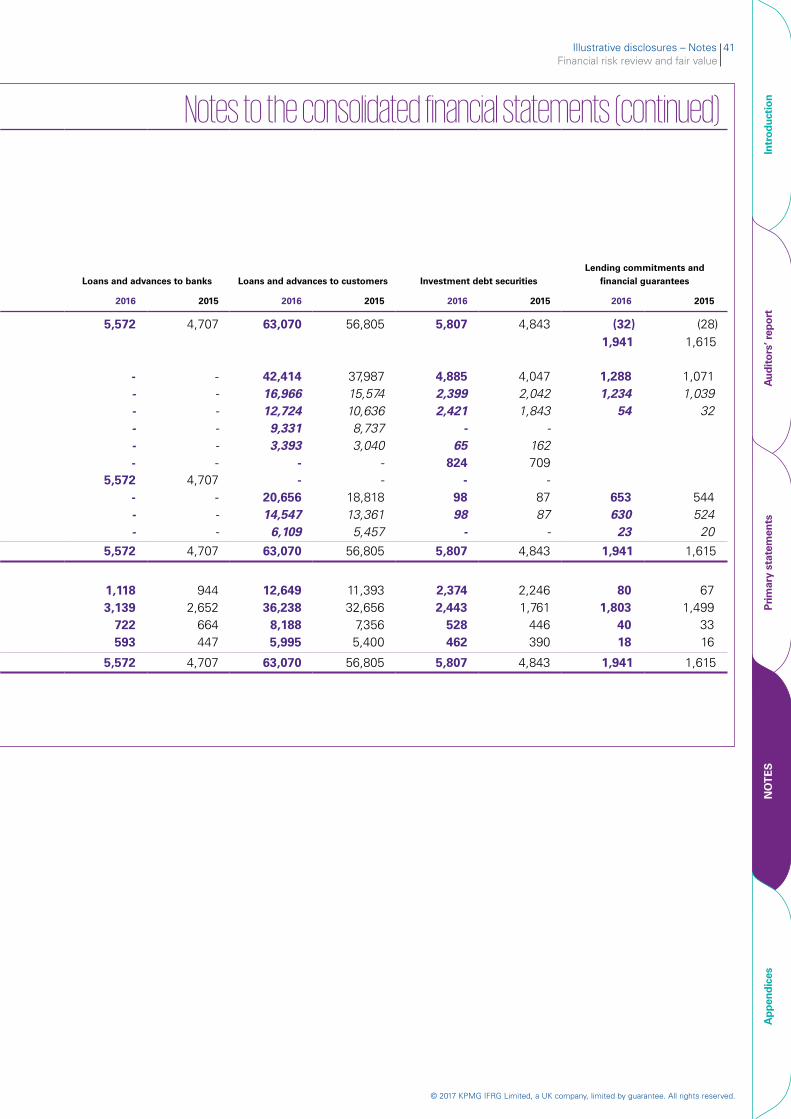
Illustrative disclosures – Notes 41Financial risk review and fair value
© 2017 KPMG IFRG Limited, a UK company, limited by guarantee. All rights reserved.
Intr
oduc
tion
Aud
itor
s’ r
epor
tPr
imar
y st
atem
ents
NO
TE
SA
ppen
dice
s
Notes to the consolidated financial statements (continued)
Loans and advances to banks Loans and advances to customers Investment debt securitiesLending commitments and
financial guarantees
2016 2015 2016 2015 2016 2015 2016 2015
5,572 4,707 63,070 56,805 5,807 4,843 (32)1,941
(28)1,615
- - - - - -
- - - - - -
42,414 16,966 12,724 9,331 3,393
-
37,987 15,574 10,636 8,737 3,040
-
4,885 2,399 2,421
- 65 824
4,047 2,042 1,843
- 162 709
1,2881,234
54
1,0711,039
32
5,572 - - -
4,707 - - -
- 20,656 14,547
6,109
- 18,818 13,361 5,457
- 98 98
-
- 87 87
-
653630
23
544524 20
5,572 4,707 63,070 56,805 5,807 4,843 1,941 1,615
1,118 3,139
722 593
944 2,652
664 447
12,649 36,238
8,188 5,995
11,393 32,656
7,356 5,400
2,374 2,443
528 462
2,246 1,761 446 390
801,803
4018
671,499
3316
5,572 4,707 63,070 56,805 5,807 4,843 1,941 1,615
IFRS 7.31 5. Financial risk review (continued)IFRS 7.33 A. Credit risk (continued)
iv. Concentrations of credit risk
IFRS 7.34(c) The Group monitors concentrations of credit risk by sector and by geographic location. An analysis of concentrations of credit risk from loans and advances, lending commitments, financial guarantees and investment securities is shown below.
In millions of euro Note
Carrying amount 21, 22, 23
Amount committed/guaranteedIFRS 7.34(c) Concentration by sector
Corporate:Real estateTransportFundsOther
GovernmentBanksRetail:
MortgagesUnsecured lending
IFRS 7.34(c) Concentration by locationNorth AmericaEuropeAsia PacificMiddle East and Africa
Concentration by location for loans and advances, and for lending commitments and financial guarantees, is based on the customer’s country of domicile. Concentration by location for investment securities is based on the country of domicile of the issuer of the security. The Group’s exposures to higher-risk eurozone countries are analysed below.
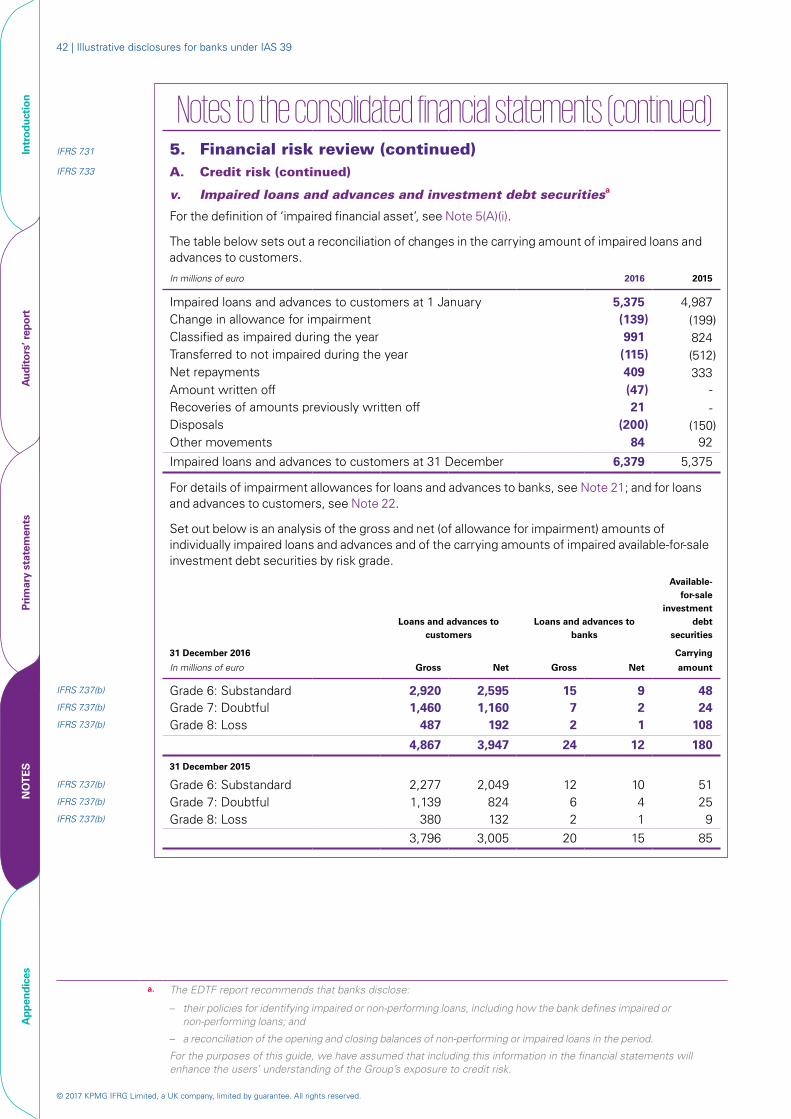
© 2017 KPMG IFRG Limited, a UK company, limited by guarantee. All rights reserved.
42 | Illustrative disclosures for banks under IAS 39
Intr
oduc
tion
Aud
itor
s’ r
epor
tPr
imar
y st
atem
ents
NO
TE
SA
ppen
dice
s
Notes to the consolidated financial statements (continued)IFRS 7.31 5. Financial risk review (continued)IFRS 7.33 A. Credit risk (continued)
v. Impaired loans and advances and investment debt securitiesa
For the definition of ‘impaired financial asset’, see Note 5(A)(i).
The table below sets out a reconciliation of changes in the carrying amount of impaired loans and advances to customers.
In millions of euro 2016 2015
Impaired loans and advances to customers at 1 January 5,375 4,987Change in allowance for impairment (139) (199)Classified as impaired during the year 991 824Transferred to not impaired during the year (115) (512)Net repayments 409 333Amount written off (47) -Recoveries of amounts previously written off 21 -Disposals (200) (150)Other movements 84 92
Impaired loans and advances to customers at 31 December 6,379 5,375
For details of impairment allowances for loans and advances to banks, see Note 21; and for loans and advances to customers, see Note 22.
Set out below is an analysis of the gross and net (of allowance for impairment) amounts of individually impaired loans and advances and of the carrying amounts of impaired available-for-sale investment debt securities by risk grade.
Loans and advances to customers
Loans and advances to banks
Available-for-sale
investment debt
securities
31 December 2016
In millions of euro Gross Net Gross Net
Carrying
amount
IFRS 7.37(b) Grade 6: Substandard 2,920 2,595 15 9 48 IFRS 7.37(b) Grade 7: Doubtful 1,460 1,160 7 2 24 IFRS 7.37(b) Grade 8: Loss 487 192 2 1 108
4,867 3,947 24 12 180
31 December 2015
IFRS 7.37(b) Grade 6: Substandard 2,277 2,049 12 10 51 IFRS 7.37(b) Grade 7: Doubtful 1,139 824 6 4 25 IFRS 7.37(b) Grade 8: Loss 380 132 2 1 9
3,796 3,005 20 15 85
a. The EDTF report recommends that banks disclose:
– their policies for identifying impaired or non-performing loans, including how the bank defines impaired or non-performing loans; and
– a reconciliation of the opening and closing balances of non-performing or impaired loans in the period.
For the purposes of this guide, we have assumed that including this information in the financial statements will enhance the users’ understanding of the Group’s exposure to credit risk.
Illustrative disclosures – Notes 43Financial risk review and fair value
© 2017 KPMG IFRG Limited, a UK company, limited by guarantee. All rights reserved.
Intr
oduc
tion
Aud
itor
s’ r
epor
tPr
imar
y st
atem
ents
NO
TE
SA
ppen
dice
s
Notes to the consolidated financial statements (continued) IFRS 7.31 5. Financial risk review (continued)IFRS 7.33 A. Credit risk (continued)
vi. Exposures to higher-risk countriesa, b
This note summarises the Group’s exposure to higher-risk countries. The Group regards a country as ‘higher-risk’ when the country exhibits higher vulnerability to economic and political uncertainties than other countries. The specific factors that are taken into account in making this assessment include the ratio of sovereign debt to GDP, seeking international financial assistance, credit ratings, levels of market yields and concentrations of maturities.
The Group regards the following countries as higher-risk: [Country A] and [Country B]. Both countries are subject to existing financial assistance plans from the International Monetary Fund. During 2016, there have been renewed concerns about the fiscal deficit of [Country A] and the impact of its austerity plan. [Country B] suffered additional credit downgrades and there has been renewed speculation about further restructuring of its debt. However, yields on sovereign bonds issued by both countries are significantly below their peak in 2015.
The Group believes that the economic data available continues to indicate that its exposure to sovereign bonds issued by [Country A] and [Country B] was not impaired at 31 December 2016 (see also Note 4(A)).
IFRS 7.B9–B10 The tables below set out the Group’s direct exposure to each higher-risk country based on the counterparty’s country of domicile. The maximum exposure to credit risk for loans, investment securities and derivatives is the carrying amount; for financial guarantees, the maximum amount the Group could have to pay if the guarantee were called on; for loan commitments, the full amount of the commitment; and for credit default swaps, the nominal amount of the contract. The government bonds comprise bonds issued by governments and quasi-government agencies.
The amounts in the tables below are gross exposures before taking into account the effect of credit mitigation. The Group’s collateral arrangements in respect of these amounts are as follows.
– No collateral or other credit enhancements are held against government bonds or loans and advances to banks.
– Corporate loans and advances are usually collateralised. Collateral is principally in the form of a charge over real estate or over the borrower’s floating assets and is generally located in the country of domicile of the borrower. Where the Group has received guarantees in respect of corporate loans, they are provided by guarantors located outside [Country A] and [Country B].
– Derivative exposures are subject to master netting agreements, which means that if a credit event occurs, such as a default, then all outstanding transactions under the agreement are terminated, the termination value is assessed and only a single net amount is due or payable in settlement of all transactions. At 31 December 2016 and 2015, in accordance with the collateral agreements, the net derivative asset positions for each counterparty located in [Country A] or [Country B] were fully covered by cash collateral received.
a. The disclosures under IFRS 7 may not be the same year-on-year because they reflect specific risks and uncertainties created by the conditions during the reporting period or at the reporting date.
IFRS 7.1, B3 b. The risk resulting from direct and indirect exposures to higher-risk countries, as well as the wider political and economic consequences of fiscal austerity programmes and other government actions, may be a focus area for banks. Each bank will have to determine, in light of its specific circumstances, what disclosures are appropriate. Factors to consider when updating disclosures of exposures related to higher-risk sovereign debt include the following.
– The countries or exposures for which disclosures are relevant for the periods presented. This may change over time and it would be helpful for an entity to disclose how the selection has been made.
– Whether it is helpful to provide an explanation of the basis used for selecting and identifying exposures for disclosure. In particular, the identification of indirect exposures may involve a high degree of judgement, or meaningful quantification of indirect exposures may not be possible; management might consider explaining how it identifies such exposures and its approach to managing indirect risk.
The example disclosures presented in this guide relate to a hypothetical scenario and may not be appropriate or sufficient in other circumstances.
Transparency may be improved if all disclosures related to sovereign debt are made in one location, or cross-referenced if they are made in different locations.
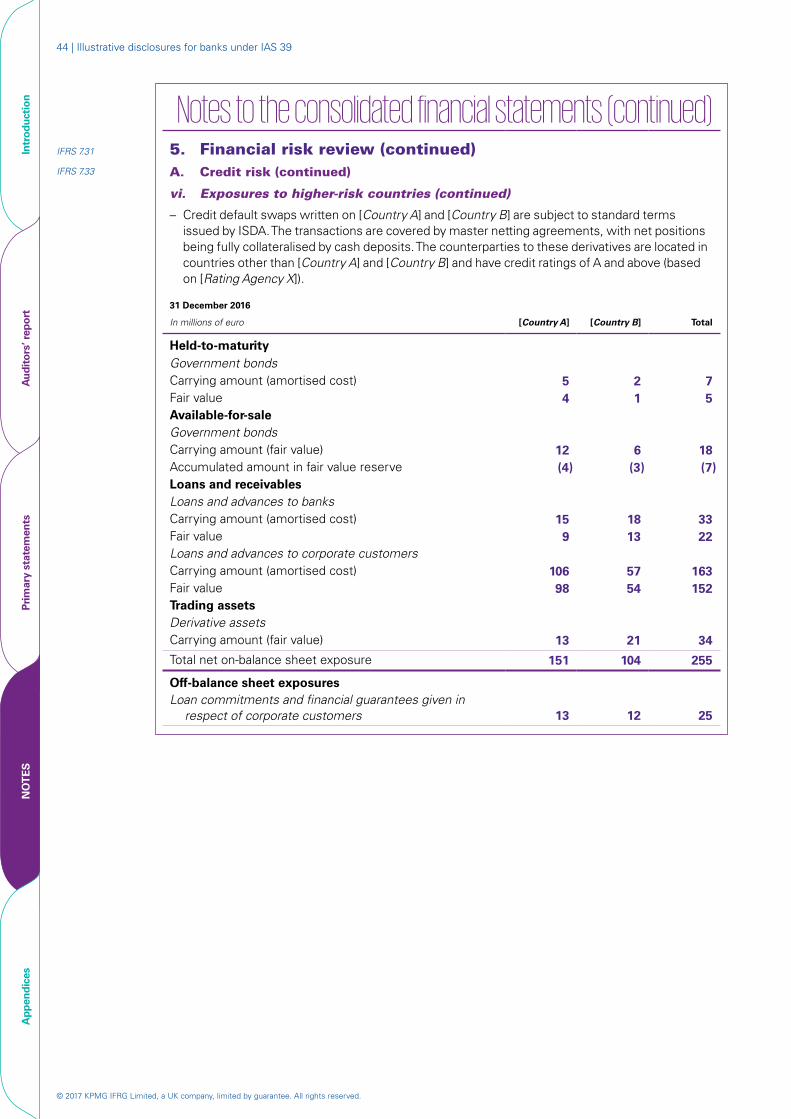
© 2017 KPMG IFRG Limited, a UK company, limited by guarantee. All rights reserved.
44 | Illustrative disclosures for banks under IAS 39
Intr
oduc
tion
Aud
itor
s’ r
epor
tPr
imar
y st
atem
ents
NO
TE
SA
ppen
dice
s
Notes to the consolidated financial statements (continued) IFRS 7.31 5. Financial risk review (continued)IFRS 7.33 A. Credit risk (continued)
vi. Exposures to higher-risk countries (continued)
– Credit default swaps written on [Country A] and [Country B] are subject to standard terms issued by ISDA. The transactions are covered by master netting agreements, with net positions being fully collateralised by cash deposits. The counterparties to these derivatives are located in countries other than [Country A] and [Country B] and have credit ratings of A and above (based on [Rating Agency X]).
31 December 2016
In millions of euro [Country A] [Country B] Total
Held-to-maturityGovernment bondsCarrying amount (amortised cost) 5 2 7Fair value 4 1 5Available-for-saleGovernment bondsCarrying amount (fair value) 12 6 18Accumulated amount in fair value reserve (4) (3) (7)Loans and receivablesLoans and advances to banksCarrying amount (amortised cost) 15 18 33Fair value 9 13 22Loans and advances to corporate customersCarrying amount (amortised cost) 106 57 163Fair value 98 54 152Trading assetsDerivative assetsCarrying amount (fair value) 13 21 34
Total net on-balance sheet exposure 151 104 255
Off-balance sheet exposuresLoan commitments and financial guarantees given in
respect of corporate customers 13 12 25
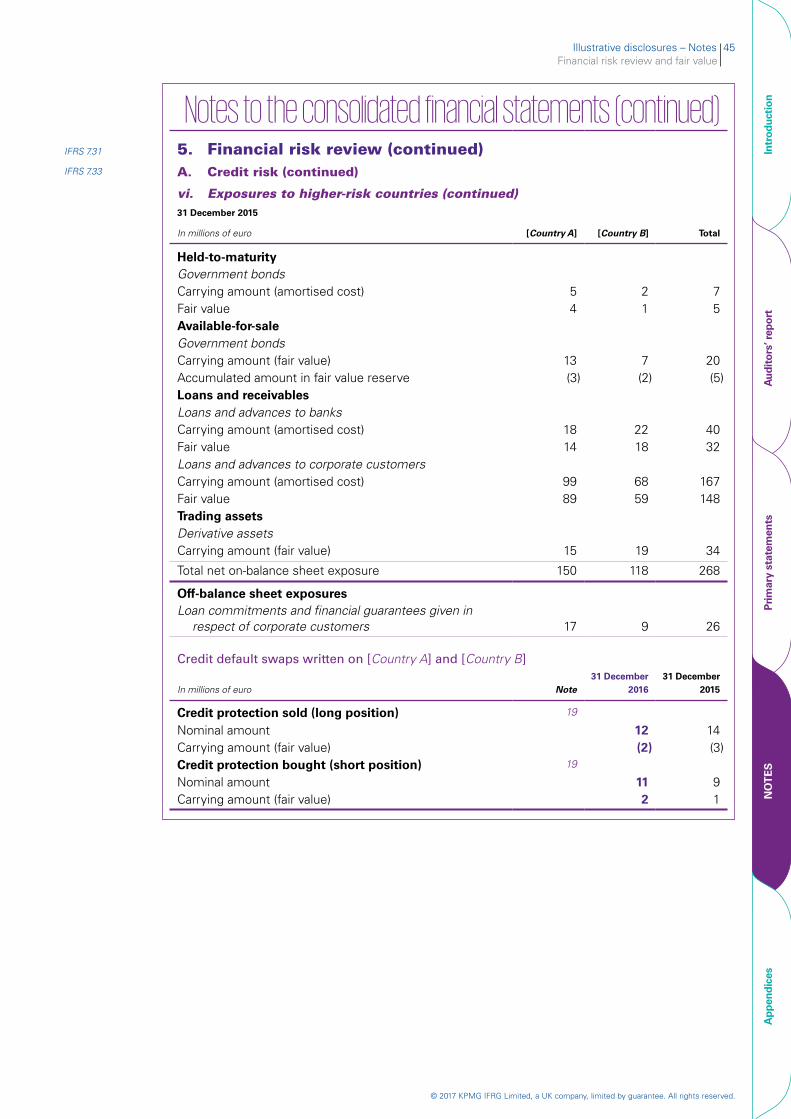
Illustrative disclosures – Notes 45Financial risk review and fair value
© 2017 KPMG IFRG Limited, a UK company, limited by guarantee. All rights reserved.
Intr
oduc
tion
Aud
itor
s’ r
epor
tPr
imar
y st
atem
ents
NO
TE
SA
ppen
dice
s
Notes to the consolidated financial statements (continued)IFRS 7.31 5. Financial risk review (continued)IFRS 7.33 A. Credit risk (continued)
vi. Exposures to higher-risk countries (continued)31 December 2015
In millions of euro [Country A] [Country B] Total
Held-to-maturityGovernment bondsCarrying amount (amortised cost) 5 2 7Fair value 4 1 5Available-for-saleGovernment bondsCarrying amount (fair value) 13 7 20Accumulated amount in fair value reserve (3) (2) (5)Loans and receivablesLoans and advances to banksCarrying amount (amortised cost) 18 22 40Fair value 14 18 32Loans and advances to corporate customersCarrying amount (amortised cost) 99 68 167Fair value 89 59 148Trading assetsDerivative assetsCarrying amount (fair value) 15 19 34
Total net on-balance sheet exposure 150 118 268
Off-balance sheet exposuresLoan commitments and financial guarantees given in
respect of corporate customers 17 9 26
Credit default swaps written on [Country A] and [Country B]
In millions of euro Note31 December
201631 December
2015
Credit protection sold (long position) 19
Nominal amount 12 14Carrying amount (fair value) (2) (3)Credit protection bought (short position) 19
Nominal amount 11 9Carrying amount (fair value) 2 1
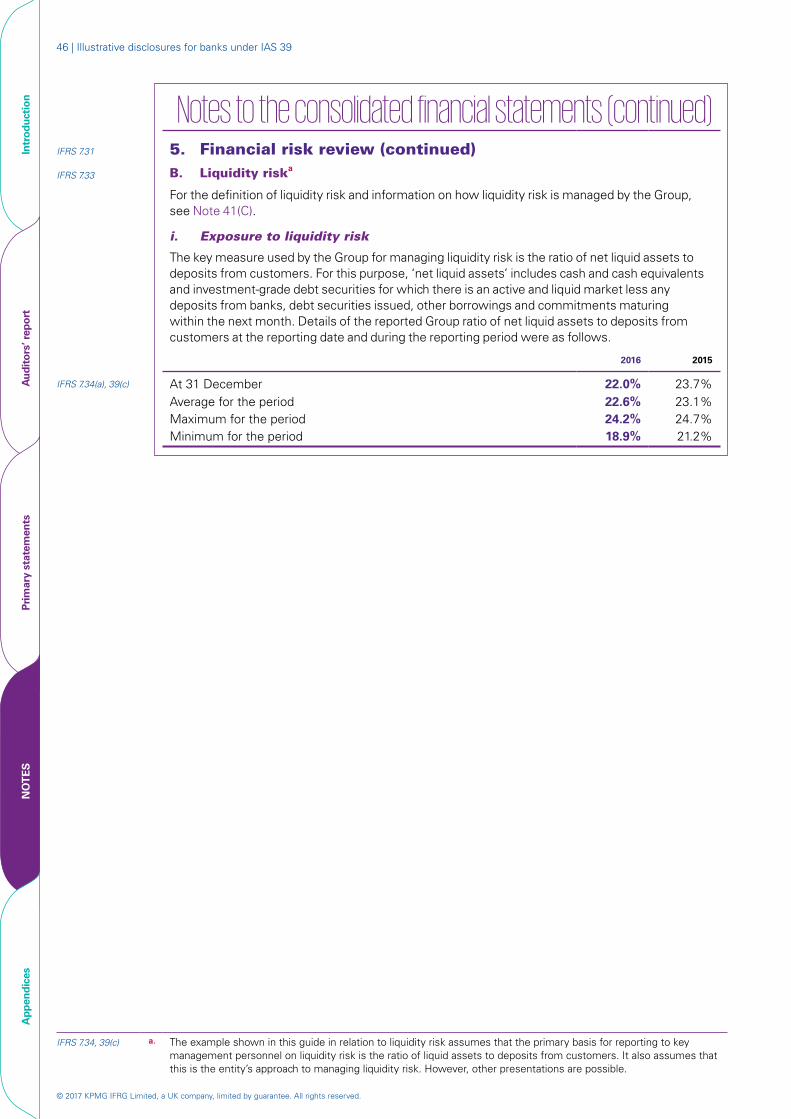
© 2017 KPMG IFRG Limited, a UK company, limited by guarantee. All rights reserved.
46 | Illustrative disclosures for banks under IAS 39
Intr
oduc
tion
Aud
itor
s’ r
epor
tPr
imar
y st
atem
ents
NO
TE
SA
ppen
dice
s
Notes to the consolidated financial statements (continued) IFRS 7.31 5. Financial risk review (continued)IFRS 7.33 B. Liquidity riska
For the definition of liquidity risk and information on how liquidity risk is managed by the Group, see Note 41(C).
i. Exposure to liquidity risk
The key measure used by the Group for managing liquidity risk is the ratio of net liquid assets to deposits from customers. For this purpose, ‘net liquid assets’ includes cash and cash equivalents and investment-grade debt securities for which there is an active and liquid market less any deposits from banks, debt securities issued, other borrowings and commitments maturing within the next month. Details of the reported Group ratio of net liquid assets to deposits from customers at the reporting date and during the reporting period were as follows.
2016 2015
IFRS 7.34(a), 39(c) At 31 December 22.0% 23.7%Average for the period 22.6% 23.1%Maximum for the period 24.2% 24.7%Minimum for the period 18.9% 21.2%
IFRS 7.34, 39(c) a. The example shown in this guide in relation to liquidity risk assumes that the primary basis for reporting to key management personnel on liquidity risk is the ratio of liquid assets to deposits from customers. It also assumes that this is the entity’s approach to managing liquidity risk. However, other presentations are possible.
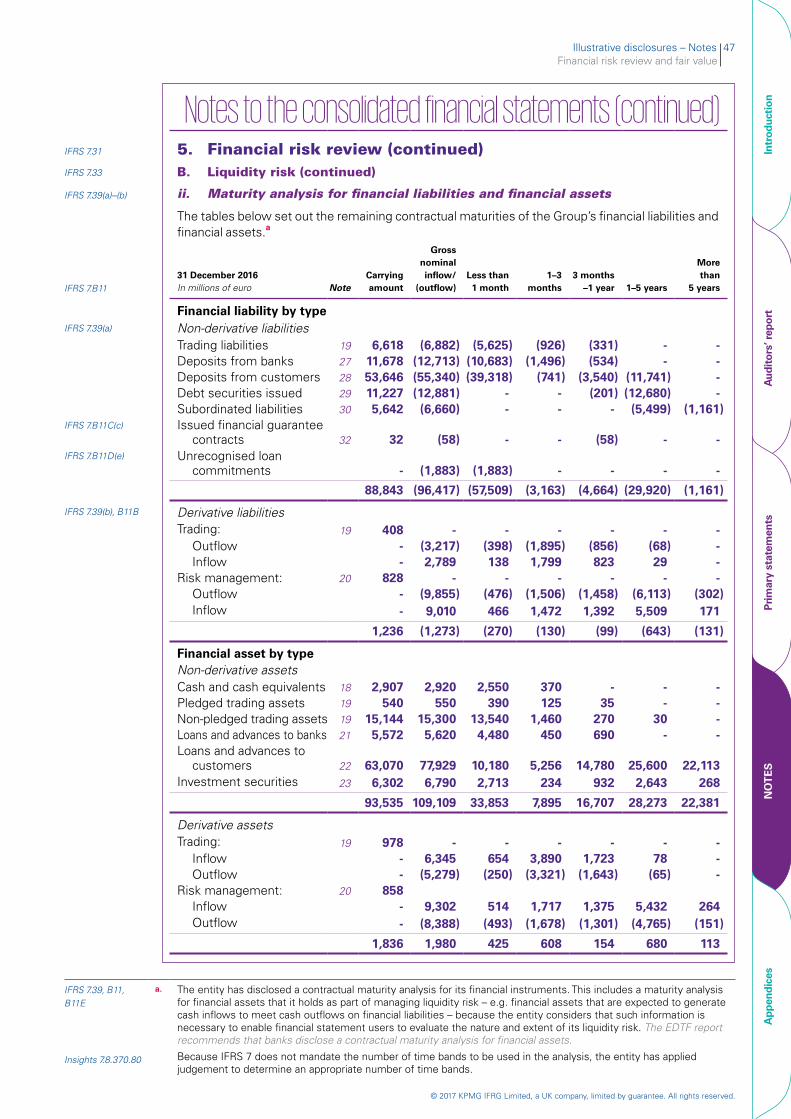
Illustrative disclosures – Notes 47Financial risk review and fair value
© 2017 KPMG IFRG Limited, a UK company, limited by guarantee. All rights reserved.
Intr
oduc
tion
Aud
itor
s’ r
epor
tPr
imar
y st
atem
ents
NO
TE
SA
ppen
dice
s
Notes to the consolidated financial statements (continued)
IFRS 7.31 5. Financial risk review (continued)IFRS 7.33 B. Liquidity risk (continued)
IFRS 7.39(a)–(b) ii. Maturity analysis for financial liabilities and financial assets
The tables below set out the remaining contractual maturities of the Group’s financial liabilities and financial assets.a
IFRS 7.B1131 December 2016 In millions of euro Note
Carrying amount
Gross nominal inflow/
(outflow) Less than
1 month1–3
months3 months
–1 year 1–5 years
More than
5 years
Financial liability by typeIFRS 7.39(a) Non-derivative liabilities
Trading liabilities 19 6,618 (6,882) (5,625) (926) (331) - - Deposits from banks 27 11,678 (12,713) (10,683) (1,496) (534) - -
Deposits from customers 28 53,646 (55,340) (39,318) (741) (3,540) (11,741) - Debt securities issued 29 11,227 (12,881) - - (201) (12,680) - Subordinated liabilities 30 5,642 (6,660) - - - (5,499) (1,161)
IFRS 7.B11C(c) Issued financial guarantee contracts 32 32 (58) - - (58) - -
IFRS 7.B11D(e) Unrecognised loan commitments - (1,883) (1,883) - - - -
88,843 (96,417) (57,509) (3,163) (4,664) (29,920) (1,161)
IFRS 7.39(b), B11B Derivative liabilitiesTrading: 19 408 - - - - - -
Outflow - (3,217) (398) (1,895) (856) (68) - Inflow - 2,789 138 1,799 823 29 -
Risk management: 20 828 - - - - - -Outflow - (9,855) (476) (1,506) (1,458) (6,113) (302)Inflow - 9,010 466 1,472 1,392 5,509 171
1,236 (1,273) (270) (130) (99) (643) (131)
Financial asset by typeNon-derivative assetsCash and cash equivalents 18 2,907 2,920 2,550 370 - - -Pledged trading assets 19 540 550 390 125 35 - -Non-pledged trading assets 19 15,144 15,300 13,540 1,460 270 30 -Loans and advances to banks 21 5,572 5,620 4,480 450 690 - -Loans and advances to
customers 22 63,070 77,929 10,180 5,256 14,780 25,600 22,113Investment securities 23 6,302 6,790 2,713 234 932 2,643 268
93,535 109,109 33,853 7,895 16,707 28,273 22,381
Derivative assetsTrading: 19 978 - - - - - -
Inflow - 6,345 654 3,890 1,723 78 -Outflow - (5,279) (250) (3,321) (1,643) (65) -
Risk management: 20 858Inflow - 9,302 514 1,717 1,375 5,432 264Outflow - (8,388) (493) (1,678) (1,301) (4,765) (151)
1,836 1,980 425 608 154 680 113
IFRS 7.39, B11, B11E
Insights 7.8.370.80
a. The entity has disclosed a contractual maturity analysis for its financial instruments. This includes a maturity analysis for financial assets that it holds as part of managing liquidity risk – e.g. financial assets that are expected to generate cash inflows to meet cash outflows on financial liabilities – because the entity considers that such information is necessary to enable financial statement users to evaluate the nature and extent of its liquidity risk. The EDTF report recommends that banks disclose a contractual maturity analysis for financial assets.
Because IFRS 7 does not mandate the number of time bands to be used in the analysis, the entity has applied judgement to determine an appropriate number of time bands.
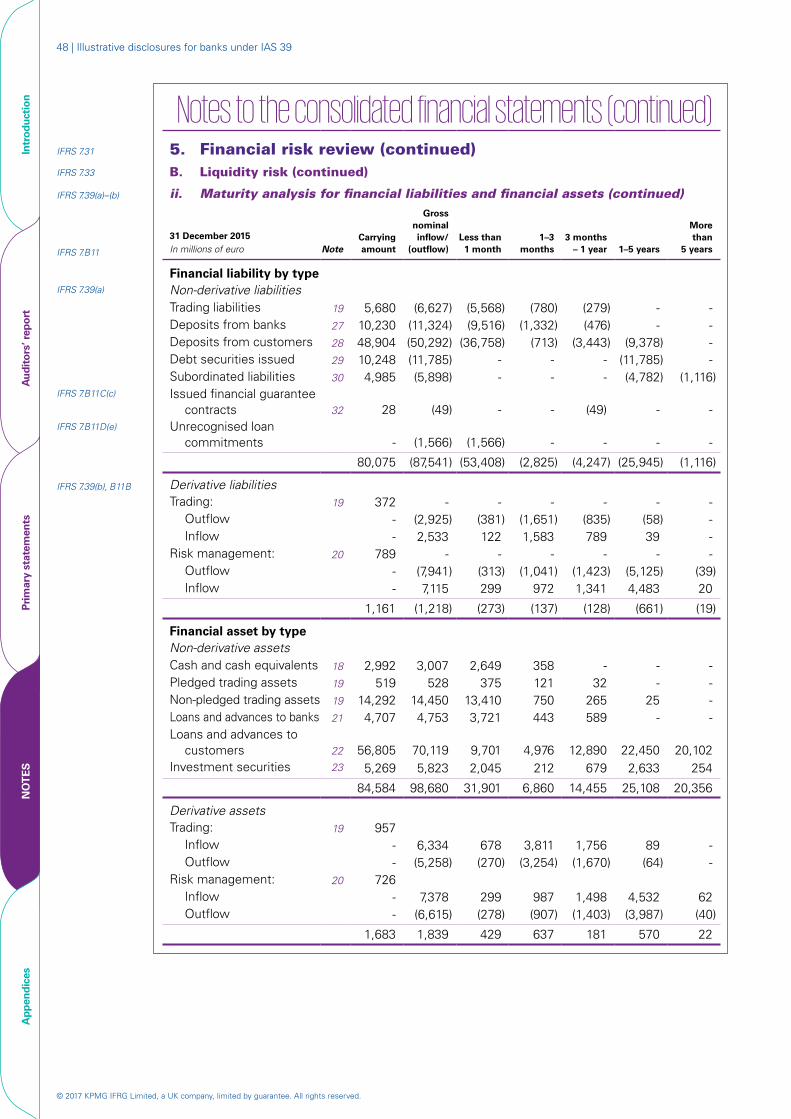
© 2017 KPMG IFRG Limited, a UK company, limited by guarantee. All rights reserved.
48 | Illustrative disclosures for banks under IAS 39
Intr
oduc
tion
Aud
itor
s’ r
epor
tPr
imar
y st
atem
ents
NO
TE
SA
ppen
dice
s
Notes to the consolidated financial statements (continued)
IFRS 7.31 5. Financial risk review (continued)IFRS 7.33 B. Liquidity risk (continued)
IFRS 7.39(a)–(b) ii. Maturity analysis for financial liabilities and financial assets (continued)
IFRS 7.B11
31 December 2015 In millions of euro Note
Carrying amount
Gross nominal inflow/
(outflow) Less than
1 month1–3
months3 months
– 1 year 1–5 years
More than
5 years
Financial liability by typeIFRS 7.39(a) Non-derivative liabilities
Trading liabilities 19 5,680 (6,627) (5,568) (780) (279) - - Deposits from banks 27 10,230 (11,324) (9,516) (1,332) (476) - - Deposits from customers 28 48,904 (50,292) (36,758) (713) (3,443) (9,378) - Debt securities issued 29 10,248 (11,785) - - - (11,785) - Subordinated liabilities 30 4,985 (5,898) - - - (4,782) (1,116)
IFRS 7.B11C(c) Issued financial guarantee contracts 32 28 (49) - - (49) - -
IFRS 7.B11D(e) Unrecognised loan commitments - (1,566) (1,566) - - - -
80,075 (87,541) (53,408) (2,825) (4,247) (25,945) (1,116)
IFRS 7.39(b), B11B Derivative liabilitiesTrading: 19 372 - - - - - -
Outflow - (2,925) (381) (1,651) (835) (58) - Inflow - 2,533 122 1,583 789 39 -
Risk management: 20 789 - - - - - -Outflow - (7,941) (313) (1,041) (1,423) (5,125) (39)Inflow - 7,115 299 972 1,341 4,483 20
1,161 (1,218) (273) (137) (128) (661) (19)
Financial asset by typeNon-derivative assetsCash and cash equivalents 18 2,992 3,007 2,649 358 - - -Pledged trading assets 19 519 528 375 121 32 - -Non-pledged trading assets 19 14,292 14,450 13,410 750 265 25 -Loans and advances to banks 21 4,707 4,753 3,721 443 589 - -Loans and advances to
customers 22 56,805 70,119 9,701 4,976 12,890 22,450 20,102Investment securities 23 5,269 5,823 2,045 212 679 2,633 254
84,584 98,680 31,901 6,860 14,455 25,108 20,356
Derivative assetsTrading: 19 957
Inflow - 6,334 678 3,811 1,756 89 -Outflow - (5,258) (270) (3,254) (1,670) (64) -
Risk management: 20 726Inflow - 7,378 299 987 1,498 4,532 62Outflow - (6,615) (278) (907) (1,403) (3,987) (40)
1,683 1,839 429 637 181 570 22
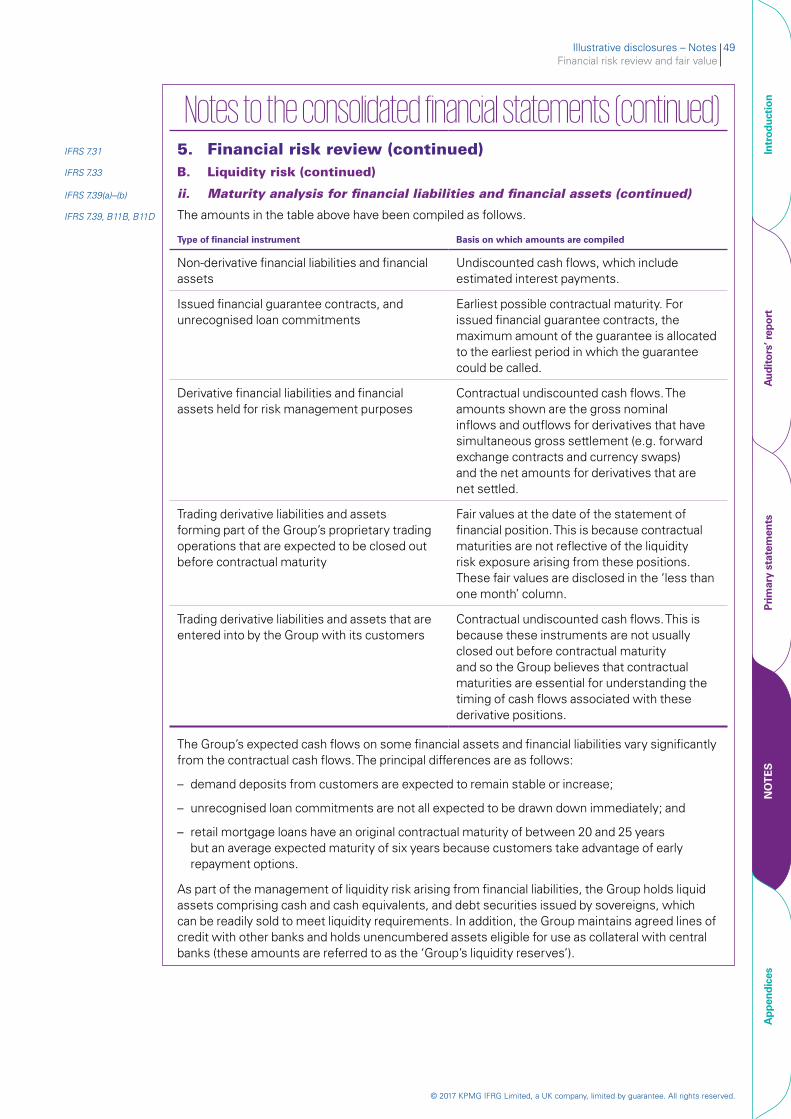
Illustrative disclosures – Notes 49Financial risk review and fair value
© 2017 KPMG IFRG Limited, a UK company, limited by guarantee. All rights reserved.
Intr
oduc
tion
Aud
itor
s’ r
epor
tPr
imar
y st
atem
ents
NO
TE
SA
ppen
dice
s
Notes to the consolidated financial statements (continued)IFRS 7.31 5. Financial risk review (continued)IFRS 7.33 B. Liquidity risk (continued)
IFRS 7.39(a)–(b) ii. Maturity analysis for financial liabilities and financial assets (continued)
IFRS 7.39, B11B, B11D The amounts in the table above have been compiled as follows.
Type of financial instrument Basis on which amounts are compiled
Non-derivative financial liabilities and financial assets
Undiscounted cash flows, which include estimated interest payments.
Issued financial guarantee contracts, and unrecognised loan commitments
Earliest possible contractual maturity. For issued financial guarantee contracts, the maximum amount of the guarantee is allocated to the earliest period in which the guarantee could be called.
Derivative financial liabilities and financial assets held for risk management purposes
Contractual undiscounted cash flows. The amounts shown are the gross nominal inflows and outflows for derivatives that have simultaneous gross settlement (e.g. forward exchange contracts and currency swaps) and the net amounts for derivatives that are net settled.
Trading derivative liabilities and assets forming part of the Group’s proprietary trading operations that are expected to be closed out before contractual maturity
Fair values at the date of the statement of financial position. This is because contractual maturities are not reflective of the liquidity risk exposure arising from these positions. These fair values are disclosed in the ‘less than one month’ column.
Trading derivative liabilities and assets that are entered into by the Group with its customers
Contractual undiscounted cash flows. This is because these instruments are not usually closed out before contractual maturity and so the Group believes that contractual maturities are essential for understanding the timing of cash flows associated with these derivative positions.
The Group’s expected cash flows on some financial assets and financial liabilities vary significantly from the contractual cash flows. The principal differences are as follows:
– demand deposits from customers are expected to remain stable or increase;
– unrecognised loan commitments are not all expected to be drawn down immediately; and
– retail mortgage loans have an original contractual maturity of between 20 and 25 years but an average expected maturity of six years because customers take advantage of early repayment options.
As part of the management of liquidity risk arising from financial liabilities, the Group holds liquid assets comprising cash and cash equivalents, and debt securities issued by sovereigns, which can be readily sold to meet liquidity requirements. In addition, the Group maintains agreed lines of credit with other banks and holds unencumbered assets eligible for use as collateral with central banks (these amounts are referred to as the ‘Group’s liquidity reserves’).

© 2017 KPMG IFRG Limited, a UK company, limited by guarantee. All rights reserved.
50 | Illustrative disclosures for banks under IAS 39
Intr
oduc
tion
Aud
itor
s’ r
epor
tPr
imar
y st
atem
ents
NO
TE
SA
ppen
dice
s
Notes to the consolidated financial statements (continued)
IFRS 7.31 5. Financial risk review (continued)IFRS 7.33 B. Liquidity risk (continued)
IFRS 7.39(a)–(b) ii. Maturity analysis for financial liabilities and financial assets (continued)
IAS 1.61 The table below sets out the carrying amounts of non-derivative financial assets and financial liabilities expected to be recovered or settled more than 12 months after the reporting date.
In millions of euro Note 2016 2015
Financial assetsLoans and advances to customers 22 34,215 31,002Investment securities 23 2,668 2,613
Financial liabilitiesDeposits from customers 28 40,808 35,789Debt securities issued 29 10,248 10,230Subordinated liabilities 30 5,642 4,985
iii. Liquidity reserves
The table below sets out the components of the Group’s liquidity reserves.a
IFRS 7.34(a), 39(c) Liquidity reserves
In millions of euro
2016Carryingamount
2016Fair
value
2015Carrying amount
2015Fair
value
Balances with central banks 118 118 128 128Cash and balances with other banks 256 256 184 184Other cash and cash equivalents 2,133 2,133 2,291 2,291Unencumbered debt securities issued by
sovereigns 10,657 10,657 10,178 10,178Undrawn credit lines granted by central
banks* 250 - 231 -Other assets eligible for use as collateral
with central banks 15,548 16,550 13,686 14,278
Total liquidity reserves 28,962 29,964 26,698 27,290
* The amount is the actual credit line available.
IAS 12.81(f), 87 a. The EDTF report recommends that banks provide a quantitative analysis of the components of the liquidity reserves
that they hold, ideally by providing averages as well as period-end balances. The description would be complemented by an explanation of possible limitations on the use of the liquidity reserves maintained in any material subsidiary or currency. For the purposes of this guide, we have assumed that including such information will enhance the users’ understanding of how the Group manages its liquidity risk.
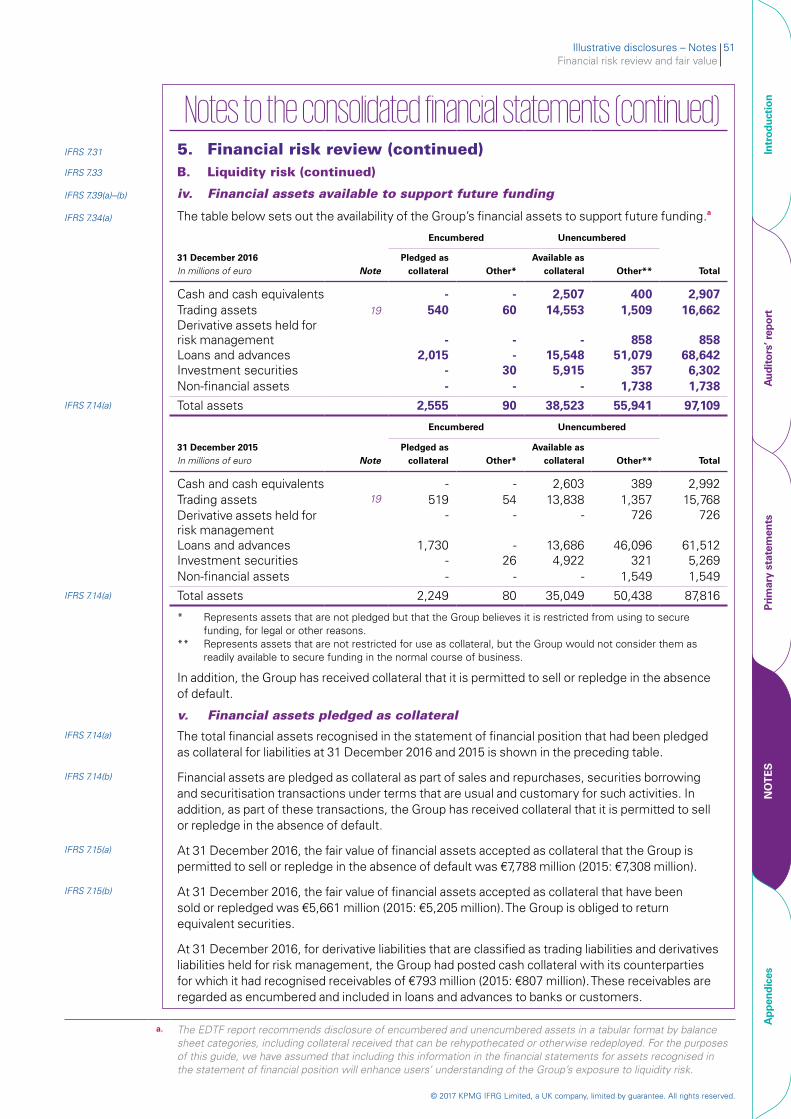
Illustrative disclosures – Notes 51Financial risk review and fair value
© 2017 KPMG IFRG Limited, a UK company, limited by guarantee. All rights reserved.
Intr
oduc
tion
Aud
itor
s’ r
epor
tPr
imar
y st
atem
ents
NO
TE
SA
ppen
dice
s
Notes to the consolidated financial statements (continued)
IFRS 7.31 5. Financial risk review (continued)IFRS 7.33 B. Liquidity risk (continued)
IFRS 7.39(a)–(b) iv. Financial assets available to support future funding
IFRS 7.34(a) The table below sets out the availability of the Group’s financial assets to support future funding.a
Encumbered Unencumbered
31 December 2016 In millions of euro Note
Pledged as collateral Other*
Available as collateral Other** Total
Cash and cash equivalents - - 2,507 400 2,907Trading assets 19 540 60 14,553 1,509 16,662Derivative assets held for risk management - - - 858 858Loans and advances 2,015 - 15,548 51,079 68,642Investment securities - 30 5,915 357 6,302Non-financial assets - - - 1,738 1,738
IFRS 7.14(a) Total assets 2,555 90 38,523 55,941 97,109
Encumbered Unencumbered
31 December 2015 In millions of euro Note
Pledged as collateral Other*
Available as collateral Other** Total
Cash and cash equivalents - - 2,603 389 2,992Trading assets 19 519 54 13,838 1,357 15,768Derivative assets held for risk management
- - - 726 726
Loans and advances 1,730 - 13,686 46,096 61,512Investment securities - 26 4,922 321 5,269Non-financial assets - - - 1,549 1,549
IFRS 7.14(a) Total assets 2,249 80 35,049 50,438 87,816
* Represents assets that are not pledged but that the Group believes it is restricted from using to secure funding, for legal or other reasons.
** Represents assets that are not restricted for use as collateral, but the Group would not consider them as readily available to secure funding in the normal course of business.
In addition, the Group has received collateral that it is permitted to sell or repledge in the absence of default.
v. Financial assets pledged as collateral IFRS 7.14(a) The total financial assets recognised in the statement of financial position that had been pledged
as collateral for liabilities at 31 December 2016 and 2015 is shown in the preceding table.
IFRS 7.14(b) Financial assets are pledged as collateral as part of sales and repurchases, securities borrowing and securitisation transactions under terms that are usual and customary for such activities. In addition, as part of these transactions, the Group has received collateral that it is permitted to sell or repledge in the absence of default.
IFRS 7.15(a) At 31 December 2016, the fair value of financial assets accepted as collateral that the Group is permitted to sell or repledge in the absence of default was €7,788 million (2015: €7,308 million).
IFRS 7.15(b) At 31 December 2016, the fair value of financial assets accepted as collateral that have been sold or repledged was €5,661 million (2015: €5,205 million). The Group is obliged to return equivalent securities.
At 31 December 2016, for derivative liabilities that are classified as trading liabilities and derivatives liabilities held for risk management, the Group had posted cash collateral with its counterparties for which it had recognised receivables of €793 million (2015: €807 million). These receivables are regarded as encumbered and included in loans and advances to banks or customers.
a. The EDTF report recommends disclosure of encumbered and unencumbered assets in a tabular format by balance sheet categories, including collateral received that can be rehypothecated or otherwise redeployed. For the purposes of this guide, we have assumed that including this information in the financial statements for assets recognised in the statement of financial position will enhance users’ understanding of the Group’s exposure to liquidity risk.
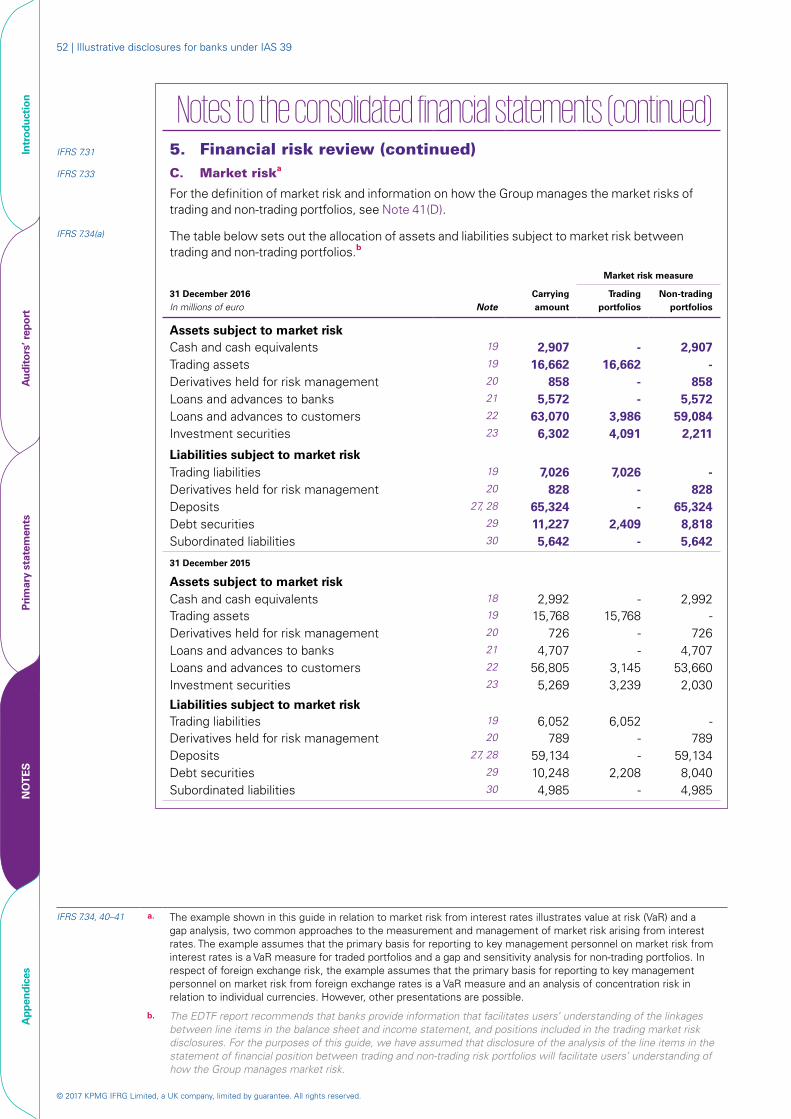
© 2017 KPMG IFRG Limited, a UK company, limited by guarantee. All rights reserved.
52 | Illustrative disclosures for banks under IAS 39
Intr
oduc
tion
Aud
itor
s’ r
epor
tPr
imar
y st
atem
ents
NO
TE
SA
ppen
dice
s
Notes to the consolidated financial statements (continued) IFRS 7.31 5. Financial risk review (continued)IFRS 7.33 C. Market riska
For the definition of market risk and information on how the Group manages the market risks of trading and non-trading portfolios, see Note 41(D).
IFRS 7.34(a) The table below sets out the allocation of assets and liabilities subject to market risk between trading and non-trading portfolios.b
Market risk measure
31 December 2016 In millions of euro Note
Carrying amount
Trading portfolios
Non-trading portfolios
Assets subject to market riskCash and cash equivalents 19 2,907 - 2,907Trading assets 19 16,662 16,662 -Derivatives held for risk management 20 858 - 858Loans and advances to banks 21 5,572 - 5,572Loans and advances to customers 22 63,070 3,986 59,084Investment securities 23 6,302 4,091 2,211
Liabilities subject to market riskTrading liabilities 19 7,026 7,026 -Derivatives held for risk management 20 828 - 828Deposits 27, 28 65,324 - 65,324Debt securities 29 11,227 2,409 8,818Subordinated liabilities 30 5,642 - 5,642
31 December 2015
Assets subject to market riskCash and cash equivalents 18 2,992 - 2,992Trading assets 19 15,768 15,768 -Derivatives held for risk management 20 726 - 726Loans and advances to banks 21 4,707 - 4,707Loans and advances to customers 22 56,805 3,145 53,660Investment securities 23 5,269 3,239 2,030
Liabilities subject to market riskTrading liabilities 19 6,052 6,052 -Derivatives held for risk management 20 789 - 789Deposits 27, 28 59,134 - 59,134Debt securities 29 10,248 2,208 8,040Subordinated liabilities 30 4,985 - 4,985
IFRS 7.34, 40–41 a. The example shown in this guide in relation to market risk from interest rates illustrates value at risk (VaR) and a gap analysis, two common approaches to the measurement and management of market risk arising from interest rates. The example assumes that the primary basis for reporting to key management personnel on market risk from interest rates is a VaR measure for traded portfolios and a gap and sensitivity analysis for non-trading portfolios. In respect of foreign exchange risk, the example assumes that the primary basis for reporting to key management personnel on market risk from foreign exchange rates is a VaR measure and an analysis of concentration risk in relation to individual currencies. However, other presentations are possible.
b. The EDTF report recommends that banks provide information that facilitates users’ understanding of the linkages between line items in the balance sheet and income statement, and positions included in the trading market risk disclosures. For the purposes of this guide, we have assumed that disclosure of the analysis of the line items in the statement of financial position between trading and non-trading risk portfolios will facilitate users’ understanding of how the Group manages market risk.
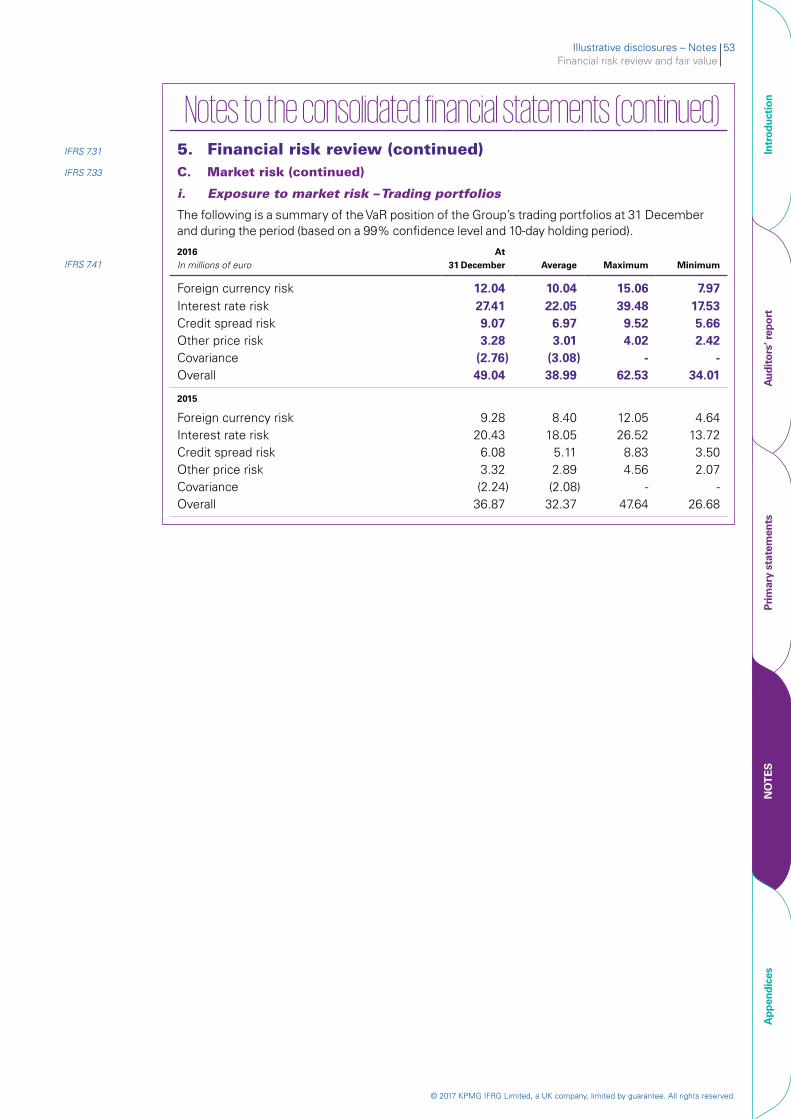
Illustrative disclosures – Notes 53Financial risk review and fair value
© 2017 KPMG IFRG Limited, a UK company, limited by guarantee. All rights reserved.
Intr
oduc
tion
Aud
itor
s’ r
epor
tPr
imar
y st
atem
ents
NO
TE
SA
ppen
dice
s
Notes to the consolidated financial statements (continued)IFRS 7.31 5. Financial risk review (continued)IFRS 7.33 C. Market risk (continued)
i. Exposure to market risk – Trading portfolios
The following is a summary of the VaR position of the Group’s trading portfolios at 31 December and during the period (based on a 99% confidence level and 10-day holding period).
IFRS 7.412016 In millions of euro
At 31 December Average Maximum Minimum
Foreign currency risk 12.04 10.04 15.06 7.97 Interest rate risk 27.41 22.05 39.48 17.53Credit spread risk 9.07 6.97 9.52 5.66Other price risk 3.28 3.01 4.02 2.42 Covariance (2.76) (3.08) - -Overall 49.04 38.99 62.53 34.01
2015
Foreign currency risk 9.28 8.40 12.05 4.64 Interest rate risk 20.43 18.05 26.52 13.72 Credit spread risk 6.08 5.11 8.83 3.50Other price risk 3.32 2.89 4.56 2.07 Covariance (2.24) (2.08) - -Overall 36.87 32.37 47.64 26.68

© 2017 KPMG IFRG Limited, a UK company, limited by guarantee. All rights reserved.
54 | Illustrative disclosures for banks under IAS 39
Intr
oduc
tion
Aud
itor
s’ r
epor
tPr
imar
y st
atem
ents
NO
TE
SA
ppen
dice
s
Notes to the consolidated financial statements (continued) IFRS 7.31 5. Financial risk review (continued)IFRS 7.33 C. Market risk (continued)
ii. Exposure to interest rate risk – Non-trading portfolios
The following is a summary of the Group’s interest rate gap position on non-trading portfolios.
IFRS 7.34(a)31 December 2016 In millions of euro Note
Carrying amount
Less than 3 months 3–6 months
6–12 months 1–5 years
More than 5 years
Cash and cash equivalents 18 2,907 2,907 - - - -
Loans and advances to banks 21 5,572 4,903 669 - - -
Loans and advances to customers 22 59,084 22,162 7,760 3,259 22,256 3,647
Investment securities 23 1,882 177 442 720 442 101
69,445 30,149 8,871 3,979 22,698 3,748
Deposits from banks 27 (11,678) (11,202) (476) - - - Deposits from customers 28 (53,646) (39,715) (1,584) (1,636) (10,711) - Debt securities issued 29 (8,818) (5,143) - (184) (3,491) - Subordinated liabilities 30 (5,642) - (4,782) - - (860)
(79,784) (56,060) (6,842) (1,820) (14,202) (860)
Effect of derivatives held for risk management 20 - 3,620 1,576 - (5,196) -
(10,339) (22,291) 3,605 2,159 3,300 2,888
IFRS 7.34(a) 31 December 2015
Cash and cash equivalents 18 2,992 2,992 - - - -
Loans and advances to banks 21 4,707 4,142 565 - - -
Loans and advances to customers 22 53,660 20,381 7,227 2,913 19,867 3,272
Investment securities 23 1,741 162 406 666 406 101
63,100 27,677 8,198 3,579 20,273 3,373
Deposits from banks 27 (10,230) (9,778) (452) - - - Deposits from customers 28 (48,904) (38,735) (1,493) (1,065) (7,611) - Debt securities issued 29 (8,040) (4,473) - (178) (3,389) -Subordinated liabilities 30 (4,985) - (4,158) - - (827)
(72,159) (52,986) (6,103) (1,243) (11,000) (827)
Effect of derivatives held for risk management 20 - 3,225 1,240 - (4,465) -
(9,059) (22,084) 3,335 2,436 4,808 2,546
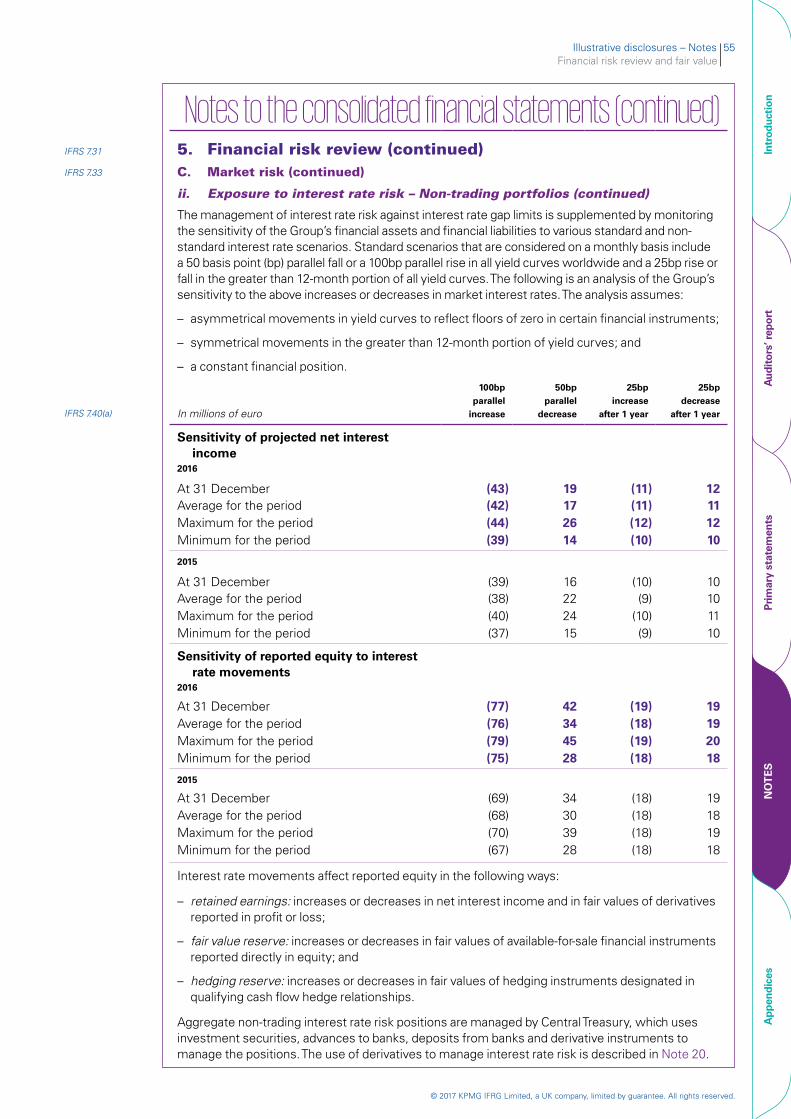
Illustrative disclosures – Notes 55Financial risk review and fair value
© 2017 KPMG IFRG Limited, a UK company, limited by guarantee. All rights reserved.
Intr
oduc
tion
Aud
itor
s’ r
epor
tPr
imar
y st
atem
ents
NO
TE
SA
ppen
dice
s
Notes to the consolidated financial statements (continued)IFRS 7.31 5. Financial risk review (continued)IFRS 7.33 C. Market risk (continued)
ii. Exposure to interest rate risk – Non-trading portfolios (continued)
The management of interest rate risk against interest rate gap limits is supplemented by monitoring the sensitivity of the Group’s financial assets and financial liabilities to various standard and non-standard interest rate scenarios. Standard scenarios that are considered on a monthly basis include a 50 basis point (bp) parallel fall or a 100bp parallel rise in all yield curves worldwide and a 25bp rise or fall in the greater than 12-month portion of all yield curves. The following is an analysis of the Group’s sensitivity to the above increases or decreases in market interest rates. The analysis assumes:
– asymmetrical movements in yield curves to reflect floors of zero in certain financial instruments;
– symmetrical movements in the greater than 12-month portion of yield curves; and
– a constant financial position.
IFRS 7.40(a) In millions of euro
100bp parallel
increase
50bpparallel
decrease
25bpincrease
after 1 year
25bp decrease
after 1 year
Sensitivity of projected net interest income
2016
At 31 December (43) 19 (11) 12Average for the period (42) 17 (11) 11Maximum for the period (44) 26 (12) 12Minimum for the period (39) 14 (10) 10
2015
At 31 December (39) 16 (10) 10 Average for the period (38) 22 (9) 10 Maximum for the period (40) 24 (10) 11 Minimum for the period (37) 15 (9) 10
Sensitivity of reported equity to interest rate movements
2016
At 31 December (77) 42 (19) 19 Average for the period (76) 34 (18) 19Maximum for the period (79) 45 (19) 20 Minimum for the period (75) 28 (18) 18
2015
At 31 December (69) 34 (18) 19Average for the period (68) 30 (18) 18Maximum for the period (70) 39 (18) 19 Minimum for the period (67) 28 (18) 18
Interest rate movements affect reported equity in the following ways:
– retained earnings: increases or decreases in net interest income and in fair values of derivatives reported in profit or loss;
– fair value reserve: increases or decreases in fair values of available-for-sale financial instruments reported directly in equity; and
– hedging reserve: increases or decreases in fair values of hedging instruments designated in qualifying cash flow hedge relationships.
Aggregate non-trading interest rate risk positions are managed by Central Treasury, which uses investment securities, advances to banks, deposits from banks and derivative instruments to manage the positions. The use of derivatives to manage interest rate risk is described in Note 20.
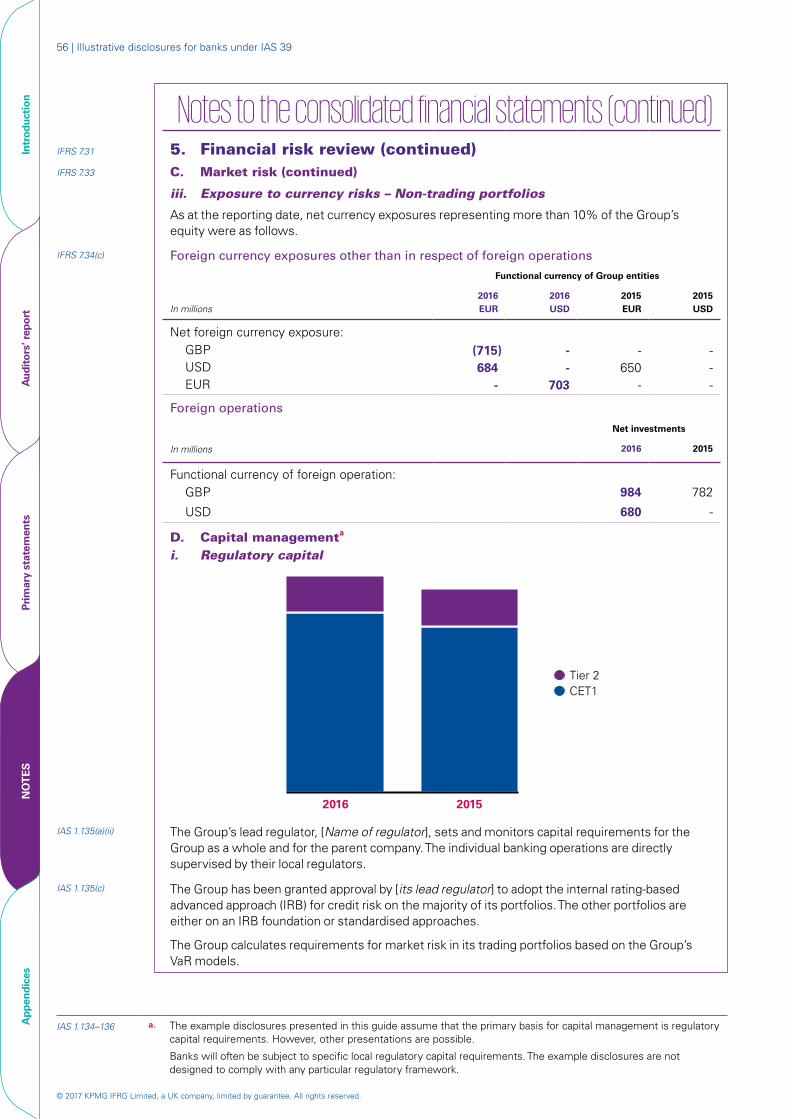
© 2017 KPMG IFRG Limited, a UK company, limited by guarantee. All rights reserved.
56 | Illustrative disclosures for banks under IAS 39
Intr
oduc
tion
Aud
itor
s’ r
epor
tPr
imar
y st
atem
ents
NO
TE
SA
ppen
dice
s
Notes to the consolidated financial statements (continued) IFRS 7.31 5. Financial risk review (continued)IFRS 7.33 C. Market risk (continued)
iii. Exposure to currency risks – Non-trading portfolios
As at the reporting date, net currency exposures representing more than 10% of the Group’s equity were as follows.
IFRS 7.34(c) Foreign currency exposures other than in respect of foreign operations
Functional currency of Group entities
In millions 2016EUR
2016USD
2015EUR
2015USD
Net foreign currency exposure:GBP (715) - - -USD 684 - 650 -EUR - 703 - -
Foreign operations
Net investments
In millions 2016 2015
Functional currency of foreign operation:GBP 984 782
USD 680 -
D. Capital managementa i. Regulatory capital
2016 2015
CET1Tier 2
IAS 1.135(a)(ii) The Group’s lead regulator, [Name of regulator], sets and monitors capital requirements for the Group as a whole and for the parent company. The individual banking operations are directly supervised by their local regulators.
IAS 1.135(c) The Group has been granted approval by [its lead regulator] to adopt the internal rating-based advanced approach (IRB) for credit risk on the majority of its portfolios. The other portfolios are either on an IRB foundation or standardised approaches.
The Group calculates requirements for market risk in its trading portfolios based on the Group’s VaR models.
IAS 1.134–136 a. The example disclosures presented in this guide assume that the primary basis for capital management is regulatory capital requirements. However, other presentations are possible.
Banks will often be subject to specific local regulatory capital requirements. The example disclosures are not designed to comply with any particular regulatory framework.
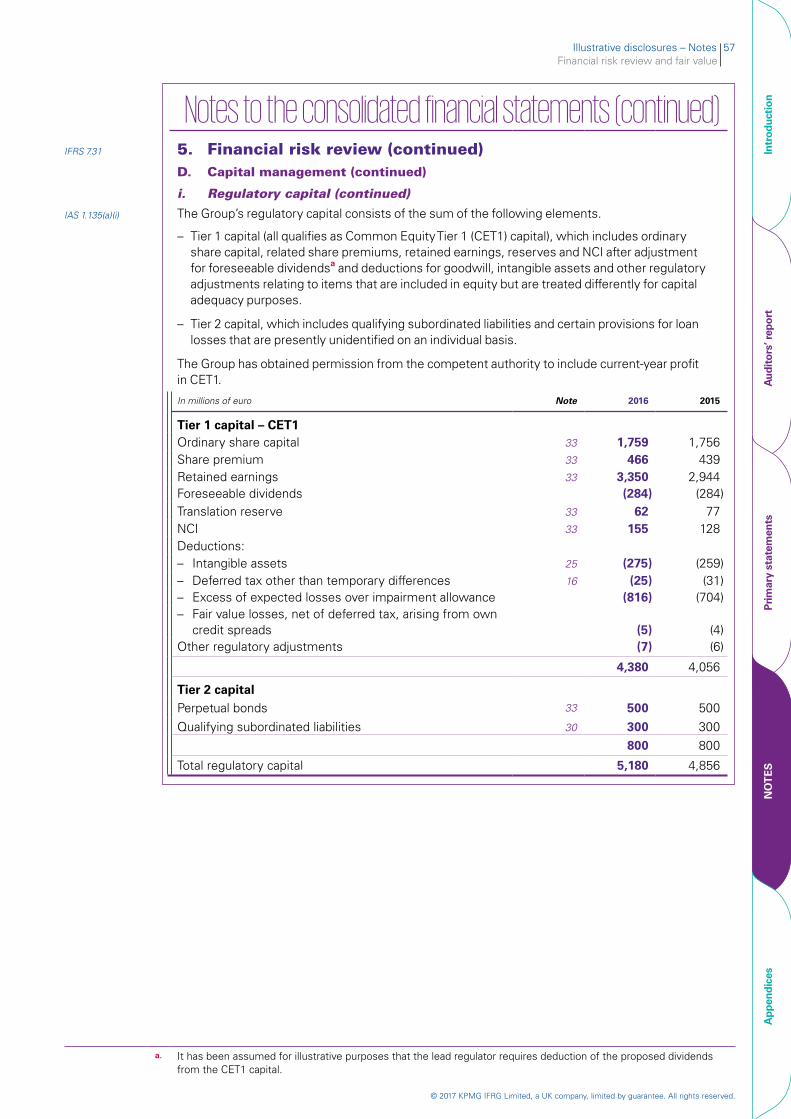
Illustrative disclosures – Notes 57Financial risk review and fair value
© 2017 KPMG IFRG Limited, a UK company, limited by guarantee. All rights reserved.
Intr
oduc
tion
Aud
itor
s’ r
epor
tPr
imar
y st
atem
ents
NO
TE
SA
ppen
dice
s
Notes to the consolidated financial statements (continued)IFRS 7.31 5. Financial risk review (continued)
D. Capital management (continued)
i. Regulatory capital (continued)
IAS 1.135(a)(i) The Group’s regulatory capital consists of the sum of the following elements.
– Tier 1 capital (all qualifies as Common Equity Tier 1 (CET1) capital), which includes ordinary share capital, related share premiums, retained earnings, reserves and NCI after adjustment for foreseeable dividendsa and deductions for goodwill, intangible assets and other regulatory adjustments relating to items that are included in equity but are treated differently for capital adequacy purposes.
– Tier 2 capital, which includes qualifying subordinated liabilities and certain provisions for loan losses that are presently unidentified on an individual basis.
The Group has obtained permission from the competent authority to include current-year profit in CET1.
In millions of euro Note 2016 2015
Tier 1 capital – CET1Ordinary share capital 33 1,759 1,756Share premium 33 466 439Retained earnings 33 3,350 2,944Foreseeable dividends (284) (284)Translation reserve 33 62 77NCI 33 155 128Deductions:– Intangible assets 25 (275) (259)– Deferred tax other than temporary differences 16 (25) (31)– Excess of expected losses over impairment allowance (816) (704)– Fair value losses, net of deferred tax, arising from own
credit spreads (5) (4)Other regulatory adjustments (7) (6)
4,380 4,056
Tier 2 capitalPerpetual bonds 33 500 500Qualifying subordinated liabilities 30 300 300
800 800
Total regulatory capital 5,180 4,856
a. It has been assumed for illustrative purposes that the lead regulator requires deduction of the proposed dividends from the CET1 capital.
© 2017 KPMG IFRG Limited, a UK company, limited by guarantee. All rights reserved.
58 | Illustrative disclosures for banks under IAS 39
Intr
oduc
tion
Aud
itor
s’ r
epor
tPr
imar
y st
atem
ents
NO
TE
SA
ppen
dice
s
Notes to the consolidated financial statements (continued)
IFRS 7.31 5. Financial risk review (continued)D. Capital management (continued)
i. Regulatory capital (continued)
IAS 1.135(a)(iii) The Group’s policy is to maintain a strong capital base to maintain investor, creditor and market confidence and to sustain the future development of the business. The impact of the level of capital on shareholders’ return is also recognised and the Group recognises the need to maintain a balance between the higher returns that might be possible with greater gearing and the advantages and security afforded by a sound capital position.
IAS 1.135(d) The Group and its individually regulated operations have complied with all externally imposed capital requirements.
The lead regulator’s approach to the measurement of capital adequacy is primarily based on monitoring the relationship of the capital resources requirement to available capital resources. The lead regulator sets individual capital guidance (ICG) for each bank and banking group in excess of the minimum capital resources requirement of 8%. A key input to the ICG-setting process is the Group’s internal capital assessment process (ICAP).
IAS 1.135(a) ii. Capital allocation
Management uses regulatory capital ratios to monitor its capital base. The allocation of capital between specific operations and activities is, to a large extent, driven by optimisation of the return achieved on the capital allocated. The amount of capital allocated to each operation or activity is based primarily on regulatory capital requirements, but in some cases the regulatory requirements do not fully reflect the varying degree of risk associated with different activities. In such cases, the capital requirements may be flexed to reflect differing risk profiles, subject to the overall level of capital to support a particular operation or activity not falling below the minimum required for regulatory purposes. The process of allocating capital to specific operations and activities is undertaken independently of those responsible for the operation by Group Risk and Group Credit, and is subject to review by the Group Asset and Liability Management Committee (ALCO).
Although maximisation of the return on risk-adjusted capital is the principal basis used in determining how capital is allocated within the Group to particular operations or activities, it is not the sole basis used for decision making. Account is also taken of synergies with other operations and activities, the availability of management and other resources, and the fit of the activity with the Group’s longer-term strategic objectives. The Group’s policies in respect of capital management and allocation are reviewed regularly by the board of directors.
Illustrative disclosures – Notes 59Financial risk review and fair value
© 2017 KPMG IFRG Limited, a UK company, limited by guarantee. All rights reserved.
Intr
oduc
tion
Aud
itor
s’ r
epor
tPr
imar
y st
atem
ents
NO
TE
SA
ppen
dice
s
Notes to the consolidated financial statements (continued)6. Fair values of financial instrumentsSee accounting policy in Note 44(J)(vi).
A. Valuation models
IFRS 13.72 The Group measures fair values using the following fair value hierarchy, which reflects the significance of the inputs used in making the measurements.
– Level 1: Inputs that are quoted market prices (unadjusted) in active markets for identical instruments.
– Level 2: Inputs other than quoted prices included within Level 1 that are observable either directly (i.e. as prices) or indirectly (i.e. derived from prices). This category includes instruments valued using: quoted market prices in active markets for similar instruments; quoted prices for identical or similar instruments in markets that are considered less than active; or other valuation techniques in which all significant inputs are directly or indirectly observable from market data.
– Level 3: Inputs that are unobservable. This category includes all instruments for which the valuation technique includes inputs not based on observable data and the unobservable inputs have a significant effect on the instrument’s valuation. This category includes instruments that are valued based on quoted prices for similar instruments for which significant unobservable adjustments or assumptions are required to reflect differences between the instruments.
IFRS 13.93(d) Valuation techniques include net present value and discounted cash flow models, comparison with similar instruments for which observable market prices exist, Black-Scholes and polynomial option pricing models and other valuation models. Assumptions and inputs used in valuation techniques include risk-free and benchmark interest rates, credit spreads and other premia used in estimating discount rates, bond and equity prices, foreign currency exchange rates, equity and equity index prices and expected price volatilities and correlations.
The objective of valuation techniques is to arrive at a fair value measurement that reflects the price that would be received to sell the asset or paid to transfer the liability in an orderly transaction between market participants at the measurement date.
The Group uses widely recognised valuation models for determining the fair value of common and simple financial instruments, such as interest rate and currency swaps that use only observable market data and require little management judgement and estimation. Observable prices or model inputs are usually available in the market for listed debt and equity securities, exchange-traded derivatives and simple OTC derivatives such as interest rate swaps. Availability of observable market prices and model inputs reduces the need for management judgement and estimation and also reduces the uncertainty associated with determining fair values. Availability of observable market prices and inputs varies depending on the products and markets and is prone to changes based on specific events and general conditions in the financial markets.
© 2017 KPMG IFRG Limited, a UK company, limited by guarantee. All rights reserved.
60 | Illustrative disclosures for banks under IAS 39
Intr
oduc
tion
Aud
itor
s’ r
epor
tPr
imar
y st
atem
ents
NO
TE
SA
ppen
dice
s
Notes to the consolidated financial statements (continued) 6. Fair values of financial instruments (continued)A. Valuation models (continued)
For more complex instruments, the Group uses proprietary valuation models, which are usually developed from recognised valuation models. Some or all of the significant inputs into these models may not be observable in the market, and are derived from market prices or rates or are estimated based on assumptions. Examples of instruments involving significant unobservable inputs include certain OTC structured derivatives, certain loans, securities for which there is no active market and retained interests in securitisations (as discussed below). Valuation models that employ significant unobservable inputs require a higher degree of management judgement and estimation in the determination of fair value. Management judgement and estimation are usually required for the selection of the appropriate valuation model to be used, determination of expected future cash flows on the financial instrument being valued, determination of the probability of counterparty default and prepayments, determination of expected volatilities and correlations and selection of appropriate discount rates.
Fair value estimates obtained from models are adjusted for any other factors, such as liquidity risk or model uncertainties, to the extent that the Group believes that a third party market participant would take them into account in pricing a transaction. Fair values reflect the credit risk of the instrument and include adjustments to take account of the credit risk of the Group entity and the counterparty where appropriate. For measuring derivatives that might change classification from being an asset to a liability or vice versa such as interest rate swaps, fair values take into account both credit valuation adjustment (CVA) and debit valuation adjustment (DVA) when market participants take this into consideration in pricing the derivatives.
Model inputs and values are calibrated against historical data and published forecasts and, where possible, against current or recent observed transactions in different instruments and against broker quotes. This calibration process is inherently subjective and it yields ranges of possible inputs and estimates of fair value, and management uses judgement to select the most appropriate point in the range.
During the current year, low trading volumes continued and there has not been sufficient trading volume to establish an active market for certain asset-backed securities and so the Group has determined the fair value for these asset-backed securities using other valuation techniques. These securities are backed primarily by static pools of residential mortgages and enjoy a senior claim on cash flows.
IFRS 13.93(d) The Group’s methodology for valuing these asset-backed securities uses a discounted cash flow technique that takes into account the probability of default and loss severity by considering the original underwriting criteria, vintage borrower attributes, LTV ratios, expected house price movements and expected prepayment rates. These features are used to estimate expected cash flows, which are then allocated using the ‘waterfall’ applicable to the security and discounted at a risk-adjusted rate. The discounted cash flow technique is often used by market participants to price asset-backed securities. However, this technique is subject to inherent limitations, such as estimation of the appropriate risk-adjusted discount rate, and different assumptions and inputs would yield different results.
As part of its trading activities, the Group enters into OTC structured derivatives – primarily options indexed to credit spreads, equity prices, foreign exchange rates and interest rates – with customers and other banks. Some of these instruments are valued using models with significant unobservable inputs, principally expected long-term volatilities and expected correlations between different underlyings.
Illustrative disclosures – Notes 61Financial risk review and fair value
© 2017 KPMG IFRG Limited, a UK company, limited by guarantee. All rights reserved.
Intr
oduc
tion
Aud
itor
s’ r
epor
tPr
imar
y st
atem
ents
NO
TE
SA
ppen
dice
s
Notes to the consolidated financial statements (continued) 6. Fair values of financial instruments (continued)A. Valuation models (continued)
If the Group measures portfolios of financial assets and financial liabilities on the basis of net exposures to market risks, then it applies judgement in determining appropriate portfolio-level adjustments such as bid-ask spreads. Such adjustments are derived from observable bid-ask spreads for similar instruments and adjusted for factors specific to the portfolio. Similarly, when the Group measures portfolios of financial assets and financial liabilities on the basis of net exposure to the credit risk of a particular counterparty, then it takes into account any existing arrangements that mitigate the credit risk exposure – e.g. master netting agreements with the counterparty.
B. Valuation framework
IFRS 13.93(g), IE65 The Group has an established control framework with respect to the measurement of fair values. This framework includes a Product Control function, which is independent of front office management and reports to the Chief Financial Officer, and which has overall responsibility for independently verifying the results of trading and investment operations and all significant fair value measurements. Specific controls include:
– verification of observable pricing;
– re-performance of model valuations;
– a review and approval process for new models and changes to models involving both Product Control and Group Market Risk;
– quarterly calibration and back-testing of models against observed market transactions;
– analysis and investigation of significant daily valuation movements; and
– review of significant unobservable inputs, valuation adjustments and significant changes to the fair value measurement of Level 3 instruments compared with the previous month, by a committee of senior Product Control and Group Market Risk personnel.
When third party information, such as broker quotes or pricing services, is used to measure fair value, Product Control assesses and documents the evidence obtained from the third parties to support the conclusion that such valuations meet the requirements of IFRS. This includes:
– verifying that the broker or pricing service is approved by the Group for use in pricing the relevant type of financial instrument;
– understanding how the fair value has been arrived at, the extent to which it represents actual market transactions and whether it represents a quoted price in an active market for an identical instrument;
– when prices for similar instruments are used to measure fair value, how these prices have been adjusted to reflect the characteristics of the instrument subject to measurement; and
– if a number of quotes for the same financial instrument have been obtained, then how fair value has been determined using those quotes.
Significant valuation issues are reported to the Group Audit Committee.
C. Financial instruments measured at fair value – Fair value hierarchy
IFRS 13.93(b) The following table analyses financial instruments measured at fair value at the reporting date, by the level in the fair value hierarchy into which the fair value measurement is categorised. The amounts are based on the values recognised in the statement of financial position. The fair values include any deferred differences between the transaction price and the fair value on initial recognition when the fair value is based on a valuation technique that uses unobservable inputs.
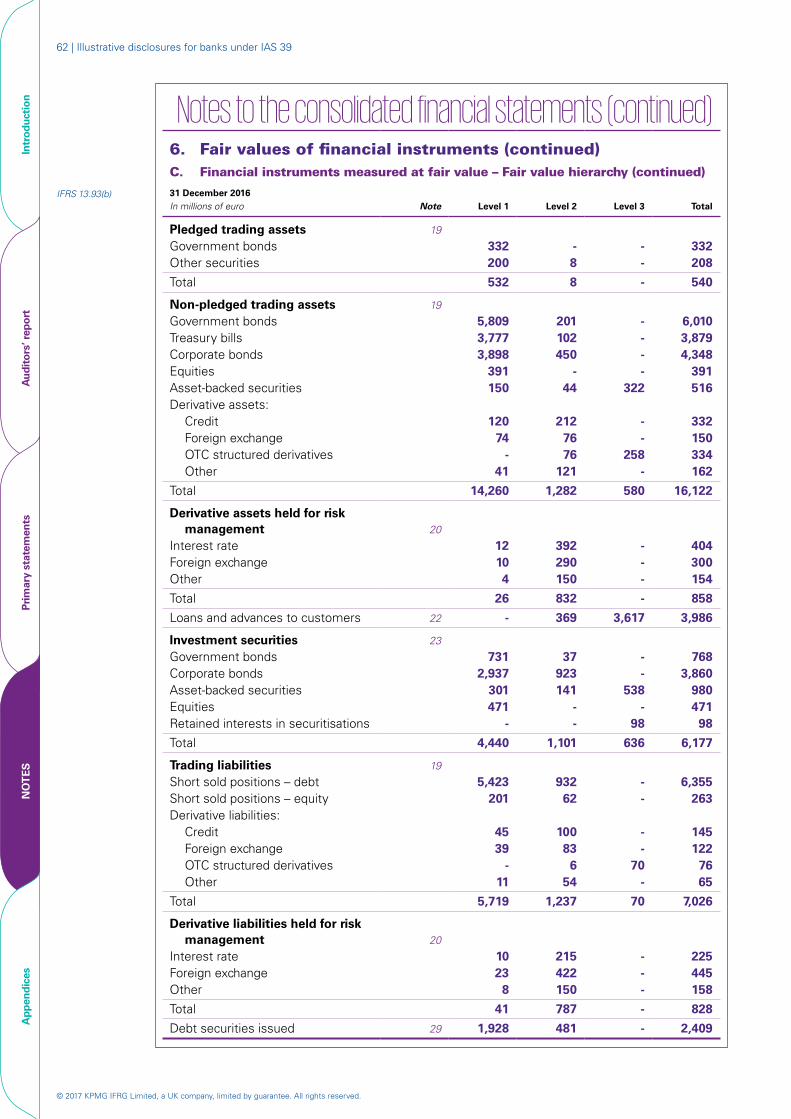
© 2017 KPMG IFRG Limited, a UK company, limited by guarantee. All rights reserved.
62 | Illustrative disclosures for banks under IAS 39
Intr
oduc
tion
Aud
itor
s’ r
epor
tPr
imar
y st
atem
ents
NO
TE
SA
ppen
dice
s
Notes to the consolidated financial statements (continued) 6. Fair values of financial instruments (continued)C. Financial instruments measured at fair value – Fair value hierarchy (continued)
IFRS 13.93(b) 31 December 2016 In millions of euro Note Level 1 Level 2 Level 3 Total
Pledged trading assets 19
Government bonds 332 - - 332Other securities 200 8 - 208
Total 532 8 - 540
Non-pledged trading assets 19
Government bonds 5,809 201 - 6,010Treasury bills 3,777 102 - 3,879Corporate bonds 3,898 450 - 4,348Equities 391 - - 391Asset-backed securities 150 44 322 516Derivative assets:
Credit 120 212 - 332Foreign exchange 74 76 - 150OTC structured derivatives - 76 258 334Other 41 121 - 162
Total 14,260 1,282 580 16,122
Derivative assets held for risk management 20
Interest rate 12 392 - 404Foreign exchange 10 290 - 300Other 4 150 - 154
Total 26 832 - 858
Loans and advances to customers 22 - 369 3,617 3,986
Investment securities 23
Government bonds 731 37 - 768Corporate bonds 2,937 923 - 3,860Asset-backed securities 301 141 538 980Equities 471 - - 471Retained interests in securitisations - - 98 98
Total 4,440 1,101 636 6,177
Trading liabilities 19
Short sold positions – debt 5,423 932 - 6,355Short sold positions – equity 201 62 - 263Derivative liabilities:
Credit 45 100 - 145Foreign exchange 39 83 - 122OTC structured derivatives - 6 70 76Other 11 54 - 65
Total 5,719 1,237 70 7,026
Derivative liabilities held for risk management 20
Interest rate 10 215 - 225Foreign exchange 23 422 - 445Other 8 150 - 158
Total 41 787 - 828
Debt securities issued 29 1,928 481 - 2,409
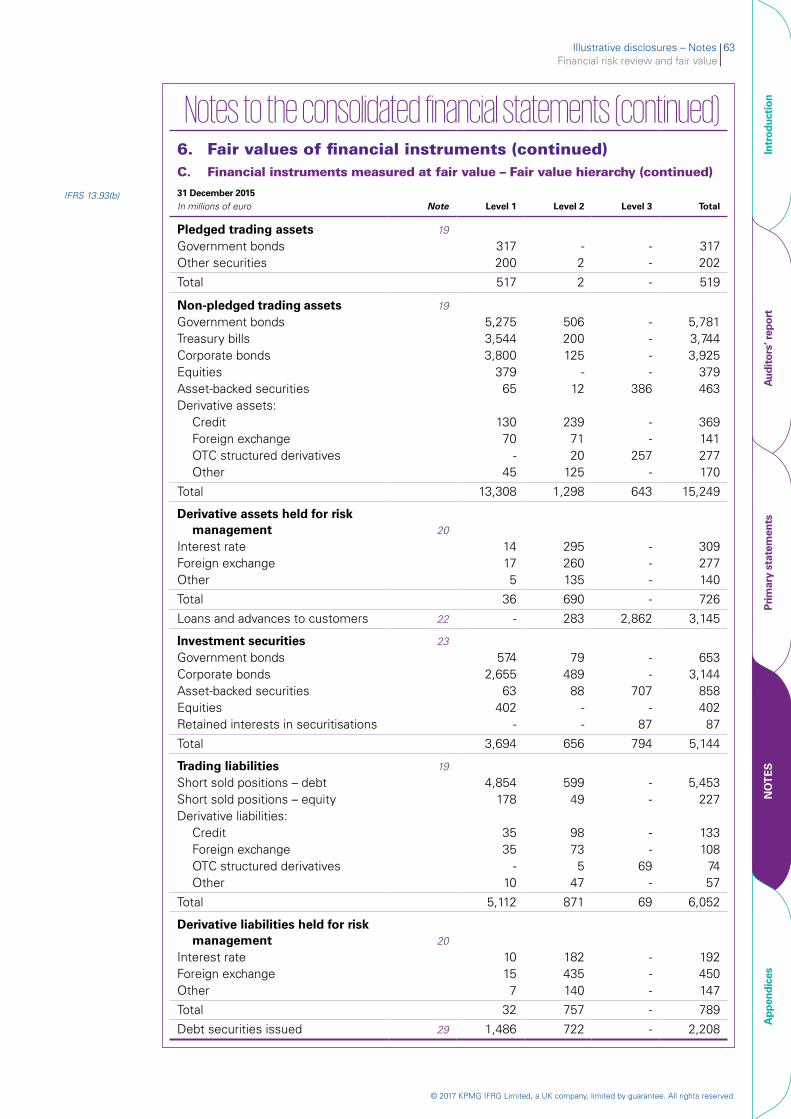
Illustrative disclosures – Notes 63Financial risk review and fair value
© 2017 KPMG IFRG Limited, a UK company, limited by guarantee. All rights reserved.
Intr
oduc
tion
Aud
itor
s’ r
epor
tPr
imar
y st
atem
ents
NO
TE
SA
ppen
dice
s
Notes to the consolidated financial statements (continued) 6. Fair values of financial instruments (continued)C. Financial instruments measured at fair value – Fair value hierarchy (continued)
IFRS 13.93(b) 31 December 2015 In millions of euro Note Level 1 Level 2 Level 3 Total
Pledged trading assets 19
Government bonds 317 - - 317Other securities 200 2 - 202
Total 517 2 - 519
Non-pledged trading assets 19
Government bonds 5,275 506 - 5,781Treasury bills 3,544 200 - 3,744Corporate bonds 3,800 125 - 3,925Equities 379 - - 379Asset-backed securities 65 12 386 463Derivative assets:
Credit 130 239 - 369Foreign exchange 70 71 - 141OTC structured derivatives - 20 257 277Other 45 125 - 170
Total 13,308 1,298 643 15,249
Derivative assets held for risk management 20
Interest rate 14 295 - 309Foreign exchange 17 260 - 277Other 5 135 - 140
Total 36 690 - 726
Loans and advances to customers 22 - 283 2,862 3,145
Investment securities 23
Government bonds 574 79 - 653Corporate bonds 2,655 489 - 3,144Asset-backed securities 63 88 707 858Equities 402 - - 402Retained interests in securitisations - - 87 87
Total 3,694 656 794 5,144
Trading liabilities 19
Short sold positions – debt 4,854 599 - 5,453Short sold positions – equity 178 49 - 227Derivative liabilities:
Credit 35 98 - 133Foreign exchange 35 73 - 108OTC structured derivatives - 5 69 74Other 10 47 - 57
Total 5,112 871 69 6,052
Derivative liabilities held for risk management 20
Interest rate 10 182 - 192Foreign exchange 15 435 - 450Other 7 140 - 147
Total 32 757 - 789
Debt securities issued 29 1,486 722 - 2,208
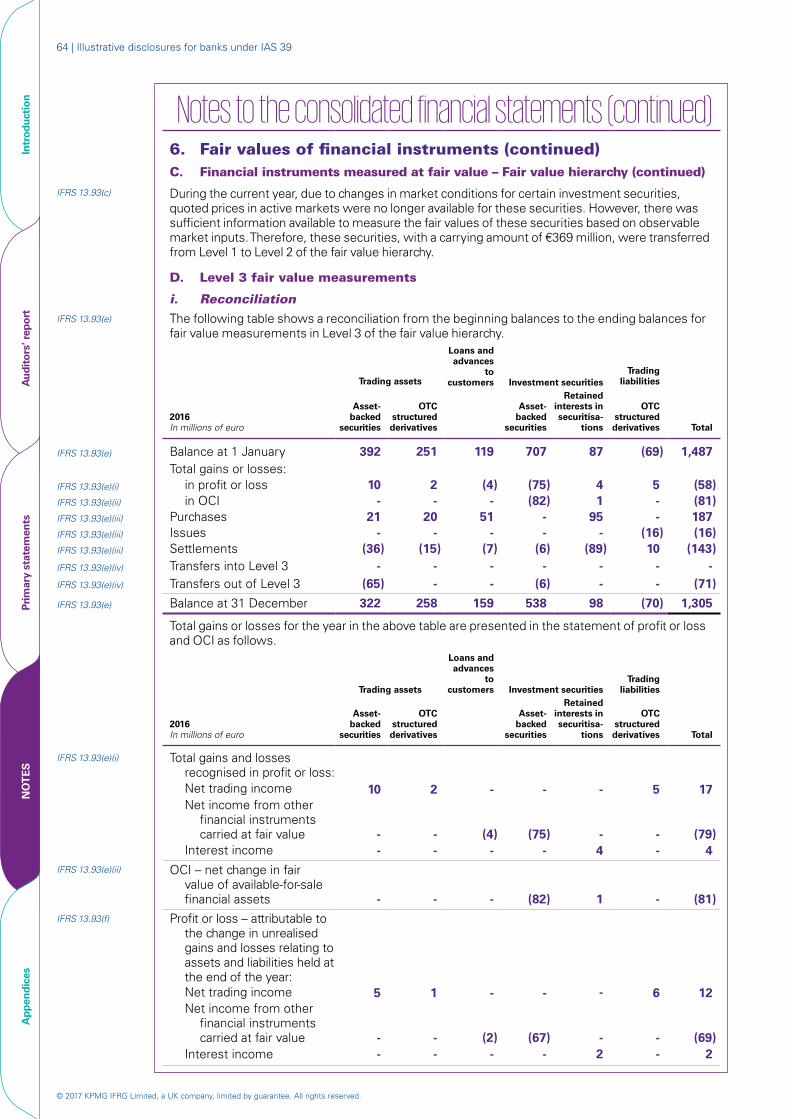
© 2017 KPMG IFRG Limited, a UK company, limited by guarantee. All rights reserved.
64 | Illustrative disclosures for banks under IAS 39
Intr
oduc
tion
Aud
itor
s’ r
epor
tPr
imar
y st
atem
ents
NO
TE
SA
ppen
dice
s
Notes to the consolidated financial statements (continued)6. Fair values of financial instruments (continued)C. Financial instruments measured at fair value – Fair value hierarchy (continued)
IFRS 13.93(c) During the current year, due to changes in market conditions for certain investment securities, quoted prices in active markets were no longer available for these securities. However, there was sufficient information available to measure the fair values of these securities based on observable market inputs. Therefore, these securities, with a carrying amount of €369 million, were transferred from Level 1 to Level 2 of the fair value hierarchy.
D. Level 3 fair value measurements
i. ReconciliationIFRS 13.93(e) The following table shows a reconciliation from the beginning balances to the ending balances for
fair value measurements in Level 3 of the fair value hierarchy.
Trading assets
Loans and advances
to customers Investment securities
Trading liabilities
2016 In millions of euro
Asset-backed
securities
OTC structured derivatives
Asset-backed
securities
Retained interests in securitisa-
tions
OTC structured derivatives Total
IFRS 13.93(e) Balance at 1 January 392 251 119 707 87 (69) 1,487 Total gains or losses:
IFRS 13.93(e)(i) in profit or loss 10 2 (4) (75) 4 5 (58)IFRS 13.93(e)(ii) in OCI - - - (82) 1 - (81)IFRS 13.93(e)(iii) Purchases 21 20 51 - 95 - 187 IFRS 13.93(e)(iii) Issues - - - - - (16) (16)IFRS 13.93(e)(iii) Settlements (36) (15) (7) (6) (89) 10 (143)IFRS 13.93(e)(iv) Transfers into Level 3 - - - - - - -IFRS 13.93(e)(iv) Transfers out of Level 3 (65) - - (6) - - (71)
IFRS 13.93(e) Balance at 31 December 322 258 159 538 98 (70) 1,305
Total gains or losses for the year in the above table are presented in the statement of profit or loss and OCI as follows.
Trading assets
Loans and advances
to customers Investment securities
Trading liabilities
2016 In millions of euro
Asset-backed
securities
OTC structured derivatives
Asset-backed
securities
Retained interests in securitisa-
tions
OTC structured derivatives Total
IFRS 13.93(e)(i) Total gains and losses recognised in profit or loss:Net trading income 10 2 - - - 5 17 Net income from other
financial instruments carried at fair value - - (4) (75) - - (79)
Interest income - - - - 4 - 4IFRS 13.93(e)(ii) OCI – net change in fair
value of available-for-sale financial assets - - - (82) 1 - (81)
IFRS 13.93(f) Profit or loss – attributable to the change in unrealised gains and losses relating to assets and liabilities held at the end of the year:
Net trading income 5 1 - - - 6 12 Net income from other
financial instruments carried at fair value - - (2) (67) - - (69)
Interest income - - - - 2 - 2
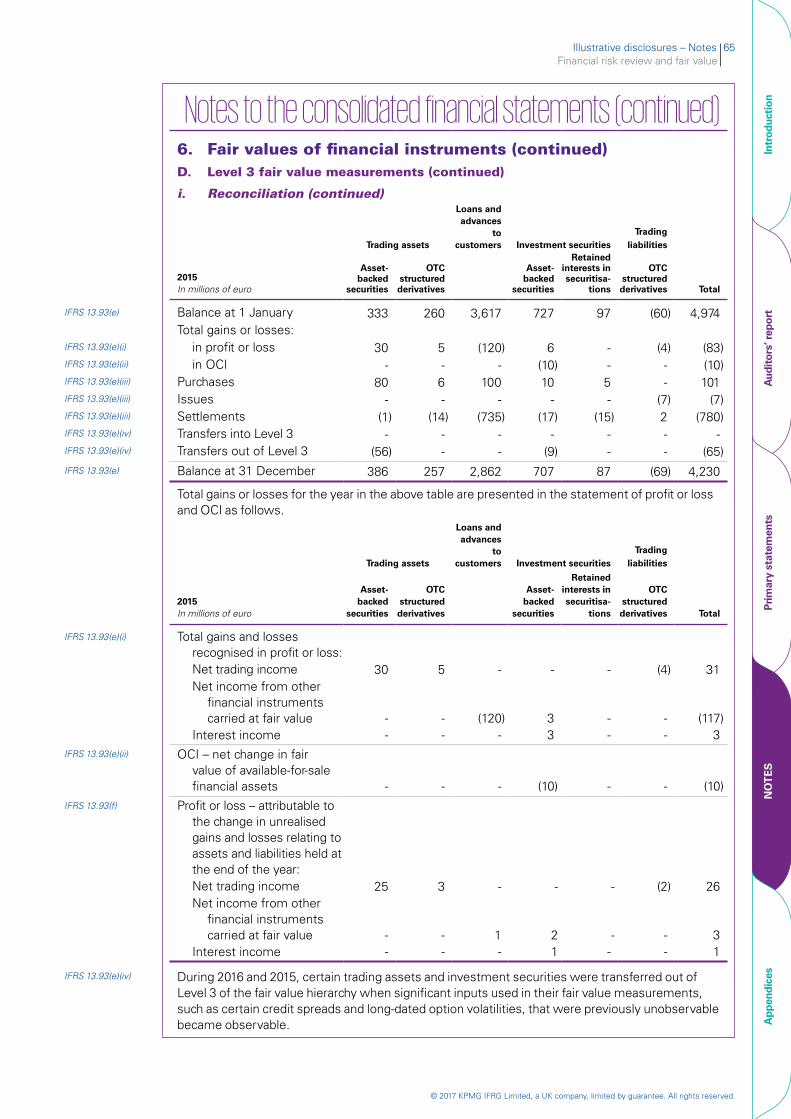
Illustrative disclosures – Notes 65Financial risk review and fair value
© 2017 KPMG IFRG Limited, a UK company, limited by guarantee. All rights reserved.
Intr
oduc
tion
Aud
itor
s’ r
epor
tPr
imar
y st
atem
ents
NO
TE
SA
ppen
dice
s
Notes to the consolidated financial statements (continued) 6. Fair values of financial instruments (continued)D. Level 3 fair value measurements (continued)
i. Reconciliation (continued)
Trading assets
Loans and advances
to customers Investment securities
Trading liabilities
2015 In millions of euro
Asset-backed
securities
OTC structured derivatives
Asset-backed
securities
Retained interests in securitisa-
tions
OTC structured derivatives Total
IFRS 13.93(e) Balance at 1 January 333 260 3,617 727 97 (60) 4,974Total gains or losses:
IFRS 13.93(e)(i) in profit or loss 30 5 (120) 6 - (4) (83)IFRS 13.93(e)(ii) in OCI - - - (10) - - (10)IFRS 13.93(e)(iii) Purchases 80 6 100 10 5 - 101 IFRS 13.93(e)(iii) Issues - - - - - (7) (7)IFRS 13.93(e)(iii) Settlements (1) (14) (735) (17) (15) 2 (780)IFRS 13.93(e)(iv) Transfers into Level 3 - - - - - - -IFRS 13.93(e)(iv) Transfers out of Level 3 (56) - - (9) - - (65)IFRS 13.93(e) Balance at 31 December 386 257 2,862 707 87 (69) 4,230
Total gains or losses for the year in the above table are presented in the statement of profit or loss and OCI as follows.
Trading assets
Loans and advances
to customers Investment securities
Trading liabilities
2015 In millions of euro
Asset-backed
securities
OTC structured derivatives
Asset-backed
securities
Retained interests in securitisa-
tions
OTC structured derivatives Total
IFRS 13.93(e)(i) Total gains and losses recognised in profit or loss:Net trading income 30 5 - - - (4) 31 Net income from other
financial instruments carried at fair value - - (120) 3 - - (117)
Interest income - - - 3 - - 3 IFRS 13.93(e)(ii) OCI – net change in fair
value of available-for-sale financial assets - - - (10) - - (10)
IFRS 13.93(f) Profit or loss – attributable to the change in unrealised gains and losses relating to assets and liabilities held at the end of the year:Net trading income 25 3 - - - (2) 26Net income from other
financial instruments carried at fair value - - 1 2 - - 3
Interest income - - - 1 - - 1
IFRS 13.93(e)(iv) During 2016 and 2015, certain trading assets and investment securities were transferred out of Level 3 of the fair value hierarchy when significant inputs used in their fair value measurements, such as certain credit spreads and long-dated option volatilities, that were previously unobservable became observable.
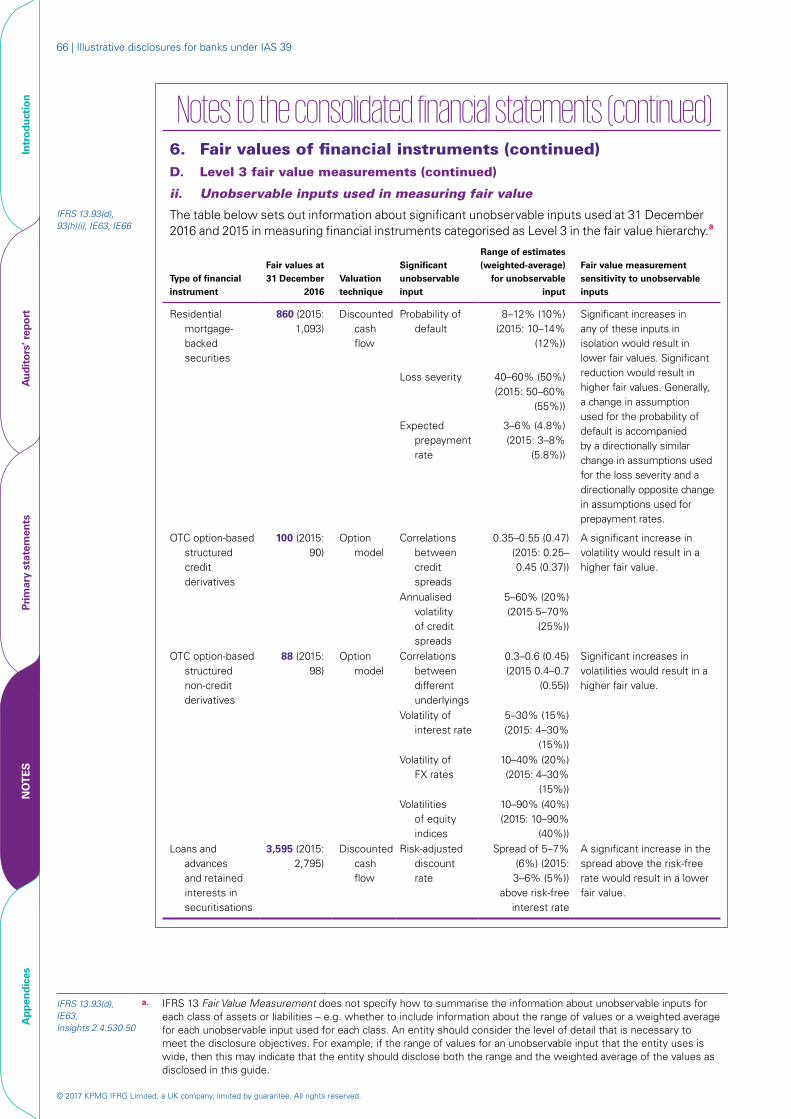
© 2017 KPMG IFRG Limited, a UK company, limited by guarantee. All rights reserved.
66 | Illustrative disclosures for banks under IAS 39
Intr
oduc
tion
Aud
itor
s’ r
epor
tPr
imar
y st
atem
ents
NO
TE
SA
ppen
dice
s
Notes to the consolidated financial statements (continued)6. Fair values of financial instruments (continued)D. Level 3 fair value measurements (continued)
ii. Unobservable inputs used in measuring fair value
IFRS 13.93(d), 93(h)(i), IE63, IE66
The table below sets out information about significant unobservable inputs used at 31 December 2016 and 2015 in measuring financial instruments categorised as Level 3 in the fair value hierarchy.a
Type of financial instrument
Fair values at 31 December
2016Valuation technique
Significant unobservable input
Range of estimates (weighted-average)
for unobservable input
Fair value measurement sensitivity to unobservable inputs
Residential mortgage-backed securities
860 (2015: 1,093)
Discounted cash flow
Probability of default
8–12% (10%) (2015: 10–14%
(12%))
Significant increases in any of these inputs in isolation would result in lower fair values. Significant reduction would result in higher fair values. Generally, a change in assumption used for the probability of default is accompanied by a directionally similar change in assumptions used for the loss severity and a directionally opposite change in assumptions used for prepayment rates.
Loss severity 40–60% (50%) (2015: 50–60%
(55%))
Expected prepayment rate
3–6% (4.8%) (2015: 3–8%
(5.8%))
OTC option-based structured credit derivatives
100 (2015: 90)
Option model
Correlations between credit spreads
0.35–0.55 (0.47) (2015: 0.25–0.45 (0.37))
A significant increase in volatility would result in a higher fair value.
Annualised volatility of credit spreads
5–60% (20%) (2015 5–70%
(25%))
OTC option-based structured non-credit derivatives
88 (2015: 98)
Option model
Correlations between different underlyings
0.3–0.6 (0.45) (2015 0.4–0.7
(0.55))
Significant increases in volatilities would result in a higher fair value.
Volatility of interest rate
5–30% (15%) (2015: 4–30%
(15%))Volatility of
FX rates10–40% (20%) (2015: 4–30%
(15%))Volatilities
of equity indices
10–90% (40%) (2015: 10–90%
(40%))Loans and
advances and retained interests in securitisations
3,595 (2015: 2,795)
Discounted cash flow
Risk-adjusted discount rate
Spread of 5–7% (6%) (2015: 3–6% (5%))
above risk-free interest rate
A significant increase in the spread above the risk-free rate would result in a lower fair value.
IFRS 13.93(d), IE63, Insights 2.4.530.50
a. IFRS 13 Fair Value Measurement does not specify how to summarise the information about unobservable inputs for each class of assets or liabilities – e.g. whether to include information about the range of values or a weighted average for each unobservable input used for each class. An entity should consider the level of detail that is necessary to meet the disclosure objectives. For example, if the range of values for an unobservable input that the entity uses is wide, then this may indicate that the entity should disclose both the range and the weighted average of the values as disclosed in this guide.
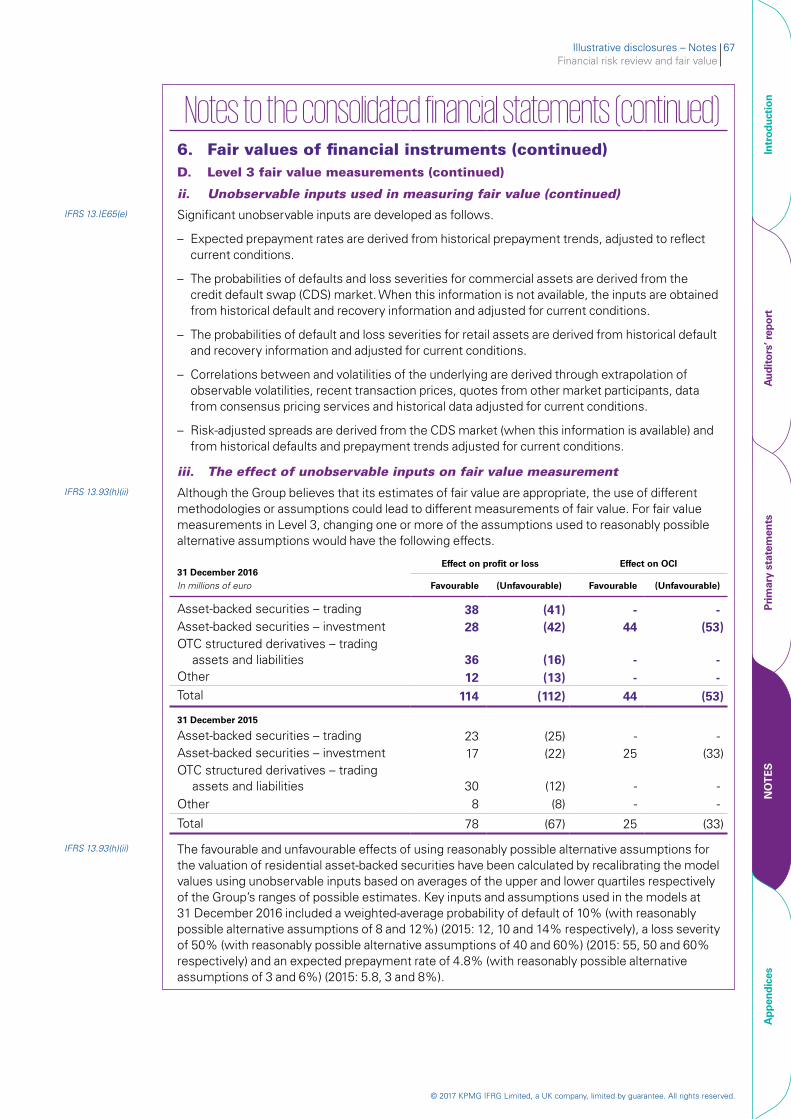
Illustrative disclosures – Notes 67Financial risk review and fair value
© 2017 KPMG IFRG Limited, a UK company, limited by guarantee. All rights reserved.
Intr
oduc
tion
Aud
itor
s’ r
epor
tPr
imar
y st
atem
ents
NO
TE
SA
ppen
dice
s
Notes to the consolidated financial statements (continued)6. Fair values of financial instruments (continued)D. Level 3 fair value measurements (continued)
ii. Unobservable inputs used in measuring fair value (continued)IFRS 13.IE65(e) Significant unobservable inputs are developed as follows.
– Expected prepayment rates are derived from historical prepayment trends, adjusted to reflect current conditions.
– The probabilities of defaults and loss severities for commercial assets are derived from the credit default swap (CDS) market. When this information is not available, the inputs are obtained from historical default and recovery information and adjusted for current conditions.
– The probabilities of default and loss severities for retail assets are derived from historical default and recovery information and adjusted for current conditions.
– Correlations between and volatilities of the underlying are derived through extrapolation of observable volatilities, recent transaction prices, quotes from other market participants, data from consensus pricing services and historical data adjusted for current conditions.
– Risk-adjusted spreads are derived from the CDS market (when this information is available) and from historical defaults and prepayment trends adjusted for current conditions.
iii. The effect of unobservable inputs on fair value measurement
IFRS 13.93(h)(ii) Although the Group believes that its estimates of fair value are appropriate, the use of different methodologies or assumptions could lead to different measurements of fair value. For fair value measurements in Level 3, changing one or more of the assumptions used to reasonably possible alternative assumptions would have the following effects.
31 December 2016 In millions of euro
Effect on profit or loss Effect on OCI
Favourable (Unfavourable) Favourable (Unfavourable)
Asset-backed securities – trading 38 (41) - - Asset-backed securities – investment 28 (42) 44 (53)OTC structured derivatives – trading
assets and liabilities 36 (16) - - Other 12 (13) - - Total 114 (112) 44 (53)
31 December 2015
Asset-backed securities – trading 23 (25) - - Asset-backed securities – investment 17 (22) 25 (33)OTC structured derivatives – trading
assets and liabilities 30 (12) - - Other 8 (8) - -
Total 78 (67) 25 (33)
IFRS 13.93(h)(ii) The favourable and unfavourable effects of using reasonably possible alternative assumptions for the valuation of residential asset-backed securities have been calculated by recalibrating the model values using unobservable inputs based on averages of the upper and lower quartiles respectively of the Group’s ranges of possible estimates. Key inputs and assumptions used in the models at 31 December 2016 included a weighted-average probability of default of 10% (with reasonably possible alternative assumptions of 8 and 12%) (2015: 12, 10 and 14% respectively), a loss severity of 50% (with reasonably possible alternative assumptions of 40 and 60%) (2015: 55, 50 and 60% respectively) and an expected prepayment rate of 4.8% (with reasonably possible alternative assumptions of 3 and 6%) (2015: 5.8, 3 and 8%).
© 2017 KPMG IFRG Limited, a UK company, limited by guarantee. All rights reserved.
68 | Illustrative disclosures for banks under IAS 39
Intr
oduc
tion
Aud
itor
s’ r
epor
tPr
imar
y st
atem
ents
NO
TE
SA
ppen
dice
s
Notes to the consolidated financial statements (continued)6. Fair values of financial instruments (continued)D. Level 3 fair value measurements (continued)
iii. The effect of unobservable inputs on fair value measurement (continued)
IFRS 13.93(h)(ii) The favourable and unfavourable effects of using reasonably possible alternative assumptions for the valuation of OTC structured derivatives have been calculated by adjusting unobservable model inputs to the averages of the upper and lower quartile of consensus pricing data (based on the past two years’ historical daily data). The most significant unobservable inputs relate to correlations of changes in prices between different underlyings and the volatilities of the underlyings. The weighted average of correlations used in the models at 31 December 2016 was 0.46 (with reasonably possible alternative assumptions of 0.26 and 0.61) (2015: 0.40, 0.28 and 0.49 respectively). The weighted average of the credit spread volatilities used in the models at 31 December 2016 was 20% (with reasonably possible alternative assumptions of 10 and 40%) (2015: 15, 8 and 35% respectively); interest rate volatilities: 15, 10 and 30% respectively (2015: 13, 9 and 25% respectively); FX volatilities: 20, 5 and 50% respectively (2015: 18, 5 and 45% respectively); and equity indices volatilities: 40, 10 and 70% respectively (2015: 35, 8 and 60% respectively).
IFRS 13.93(h)(ii) The favourable and unfavourable effects of using reasonably possible alternative assumptions for the valuation of loans and advances and retained interests in securitisations have been calculated by recalibrating the model values using unobservable inputs based on averages of the upper and lower quartiles respectively of the Group’s ranges of possible estimates. The most significant unobservable inputs relate to risk-adjusted discount rates. The weighted average of the risk-adjusted discount rates used in the model at 31 December 2016 was 6% above the risk-free interest rate (with reasonably possible alternative assumptions of 4 and 8%) (2015: 5, 3 and 7% respectively).
IFRS 13.93(d) The Group’s reporting systems and the nature of the instruments and the valuation models do not allow it accurately to analyse the total annual amounts of gains/losses reported above that are attributable to observable and unobservable inputs. However, the losses on asset-backed securities in 2016 are principally dependent on the unobservable inputs described above.a
Insights 2.4.535.10 a. This information is not required to be disclosed by IFRS 13 but it may be considered to be helpful to users of the financial statements.
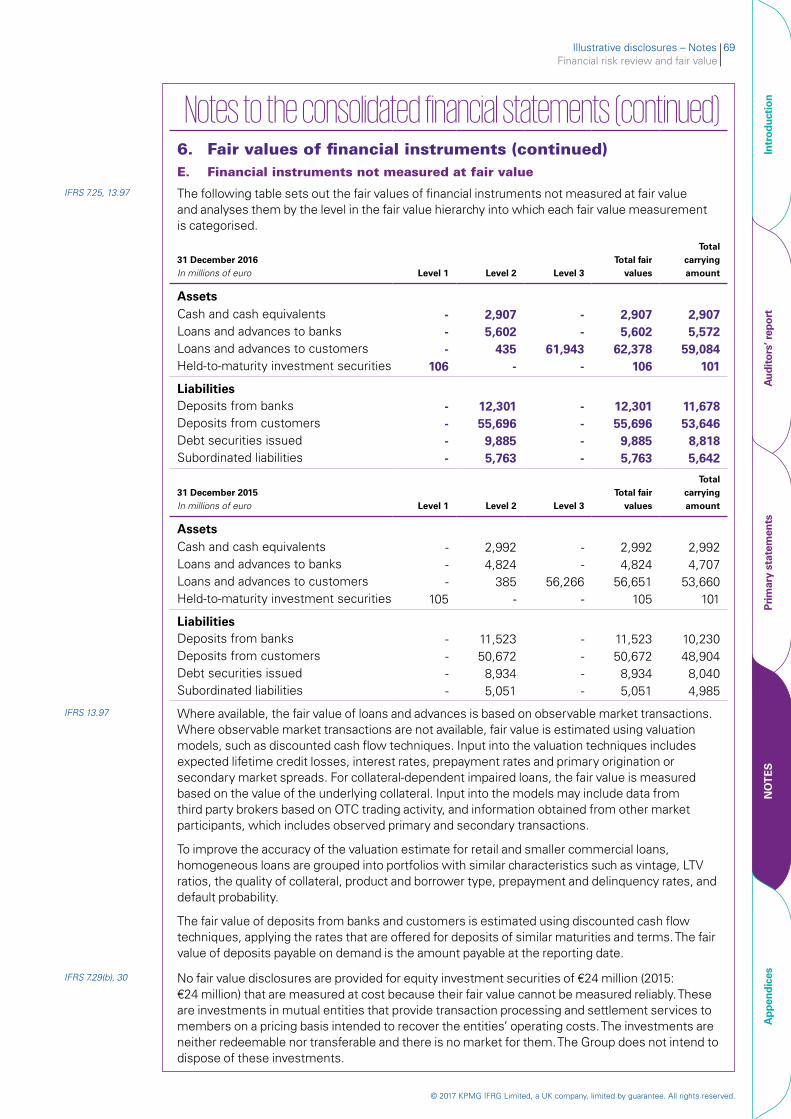
Illustrative disclosures – Notes 69Financial risk review and fair value
© 2017 KPMG IFRG Limited, a UK company, limited by guarantee. All rights reserved.
Intr
oduc
tion
Aud
itor
s’ r
epor
tPr
imar
y st
atem
ents
NO
TE
SA
ppen
dice
s
Notes to the consolidated financial statements (continued)6. Fair values of financial instruments (continued)E. Financial instruments not measured at fair value
IFRS 7.25, 13.97 The following table sets out the fair values of financial instruments not measured at fair value and analyses them by the level in the fair value hierarchy into which each fair value measurement is categorised.
31 December 2016 In millions of euro Level 1 Level 2 Level 3
Total fair values
Total carrying amount
AssetsCash and cash equivalents - 2,907 - 2,907 2,907Loans and advances to banks - 5,602 - 5,602 5,572Loans and advances to customers - 435 61,943 62,378 59,084Held-to-maturity investment securities 106 - - 106 101
LiabilitiesDeposits from banks - 12,301 - 12,301 11,678Deposits from customers - 55,696 - 55,696 53,646Debt securities issued - 9,885 - 9,885 8,818Subordinated liabilities - 5,763 - 5,763 5,642
31 December 2015 In millions of euro Level 1 Level 2 Level 3
Total fair values
Total carrying amount
AssetsCash and cash equivalents - 2,992 - 2,992 2,992Loans and advances to banks - 4,824 - 4,824 4,707Loans and advances to customers - 385 56,266 56,651 53,660Held-to-maturity investment securities 105 - - 105 101
LiabilitiesDeposits from banks - 11,523 - 11,523 10,230Deposits from customers - 50,672 - 50,672 48,904Debt securities issued - 8,934 - 8,934 8,040Subordinated liabilities - 5,051 - 5,051 4,985
IFRS 13.97 Where available, the fair value of loans and advances is based on observable market transactions. Where observable market transactions are not available, fair value is estimated using valuation models, such as discounted cash flow techniques. Input into the valuation techniques includes expected lifetime credit losses, interest rates, prepayment rates and primary origination or secondary market spreads. For collateral-dependent impaired loans, the fair value is measured based on the value of the underlying collateral. Input into the models may include data from third party brokers based on OTC trading activity, and information obtained from other market participants, which includes observed primary and secondary transactions.
To improve the accuracy of the valuation estimate for retail and smaller commercial loans, homogeneous loans are grouped into portfolios with similar characteristics such as vintage, LTV ratios, the quality of collateral, product and borrower type, prepayment and delinquency rates, and default probability.
The fair value of deposits from banks and customers is estimated using discounted cash flow techniques, applying the rates that are offered for deposits of similar maturities and terms. The fair value of deposits payable on demand is the amount payable at the reporting date.
IFRS 7.29(b), 30 No fair value disclosures are provided for equity investment securities of €24 million (2015: €24 million) that are measured at cost because their fair value cannot be measured reliably. These are investments in mutual entities that provide transaction processing and settlement services to members on a pricing basis intended to recover the entities’ operating costs. The investments are neither redeemable nor transferable and there is no market for them. The Group does not intend to dispose of these investments.
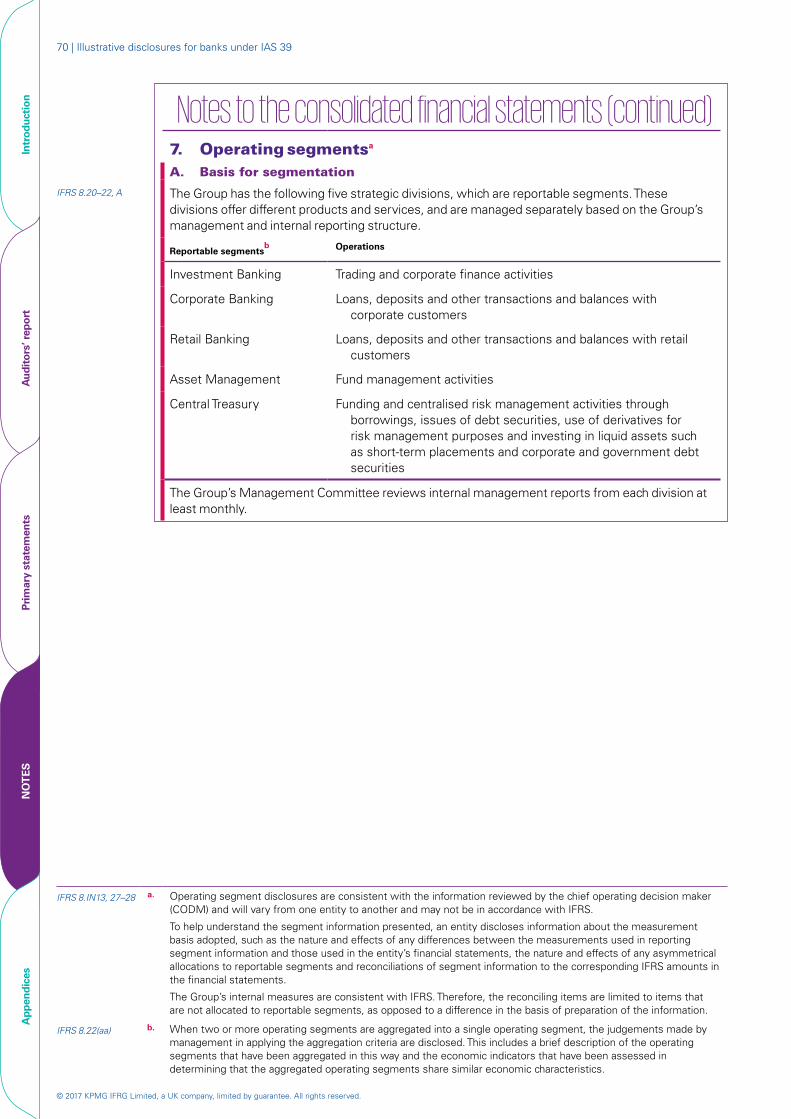
© 2017 KPMG IFRG Limited, a UK company, limited by guarantee. All rights reserved.
70 | Illustrative disclosures for banks under IAS 39
Intr
oduc
tion
Aud
itor
s’ r
epor
tPr
imar
y st
atem
ents
NO
TE
SA
ppen
dice
s
Notes to the consolidated financial statements (continued)7. Operating segmentsa A. Basis for segmentation
IFRS 8.20–22, A The Group has the following five strategic divisions, which are reportable segments. These divisions offer different products and services, and are managed separately based on the Group’s management and internal reporting structure.
Reportable segmentsb Operations
Investment Banking Trading and corporate finance activities
Corporate Banking Loans, deposits and other transactions and balances with corporate customers
Retail Banking Loans, deposits and other transactions and balances with retail customers
Asset Management Fund management activities
Central Treasury Funding and centralised risk management activities through borrowings, issues of debt securities, use of derivatives for risk management purposes and investing in liquid assets such as short-term placements and corporate and government debt securities
The Group’s Management Committee reviews internal management reports from each division at least monthly.
IFRS 8.IN13, 27–28 a. Operating segment disclosures are consistent with the information reviewed by the chief operating decision maker (CODM) and will vary from one entity to another and may not be in accordance with IFRS.
To help understand the segment information presented, an entity discloses information about the measurement basis adopted, such as the nature and effects of any differences between the measurements used in reporting segment information and those used in the entity’s financial statements, the nature and effects of any asymmetrical allocations to reportable segments and reconciliations of segment information to the corresponding IFRS amounts in the financial statements.
The Group’s internal measures are consistent with IFRS. Therefore, the reconciling items are limited to items that are not allocated to reportable segments, as opposed to a difference in the basis of preparation of the information.
IFRS 8.22(aa) b. When two or more operating segments are aggregated into a single operating segment, the judgements made by management in applying the aggregation criteria are disclosed. This includes a brief description of the operating segments that have been aggregated in this way and the economic indicators that have been assessed in determining that the aggregated operating segments share similar economic characteristics.
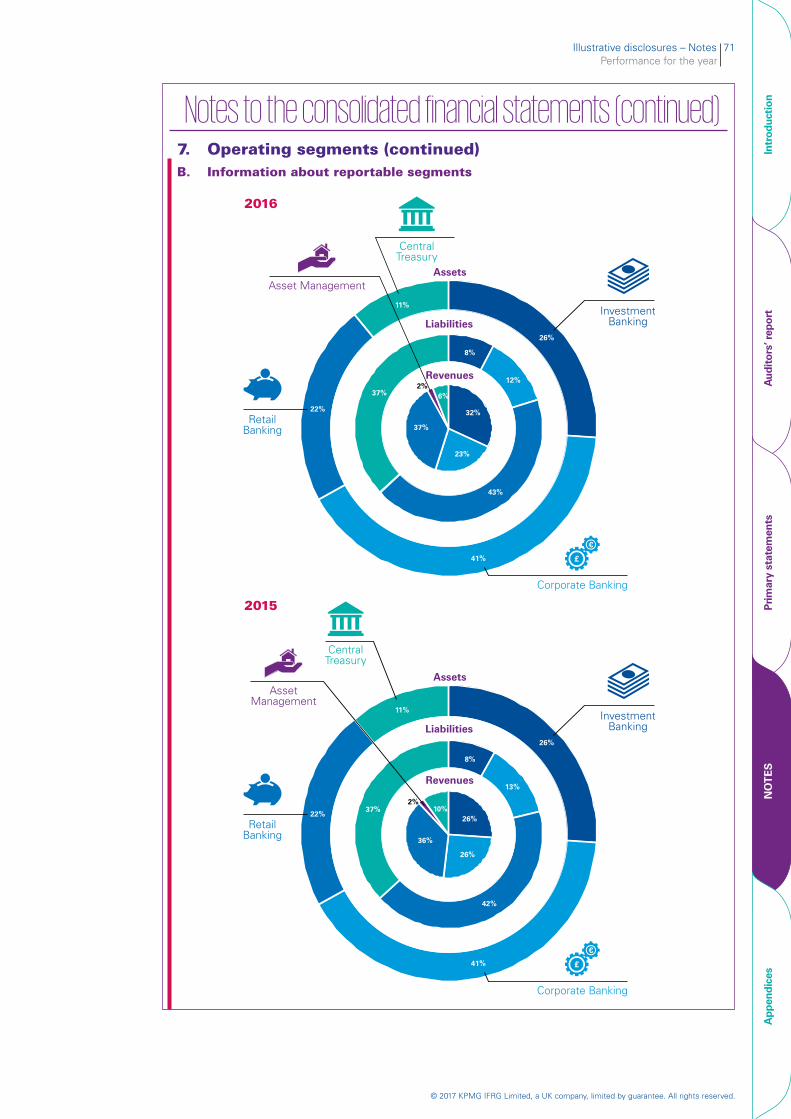
Illustrative disclosures – Notes 71Performance for the year
© 2017 KPMG IFRG Limited, a UK company, limited by guarantee. All rights reserved.
Intr
oduc
tion
Aud
itor
s’ r
epor
tPr
imar
y st
atem
ents
NO
TE
SA
ppen
dice
s
Notes to the consolidated financial statements (continued) 7. Operating segments (continued)B. Information about reportable segments
26%
41%
22%
11%Investment
Banking
Assets
2015
RetailBanking
CentralTreasury
AssetManagement
8%
13%
42%
37%
26%
41%
22%
11%
8%
12%
43%
37%
InvestmentBanking
Corporate Banking
Assets
Liabilities
Revenues
2016
32%
23%
37%
2%6%
RetailBanking
CentralTreasury
Asset Management
£
€
26%
26%
36%
10%2%
Corporate Banking
£
€
Liabilities
Revenues
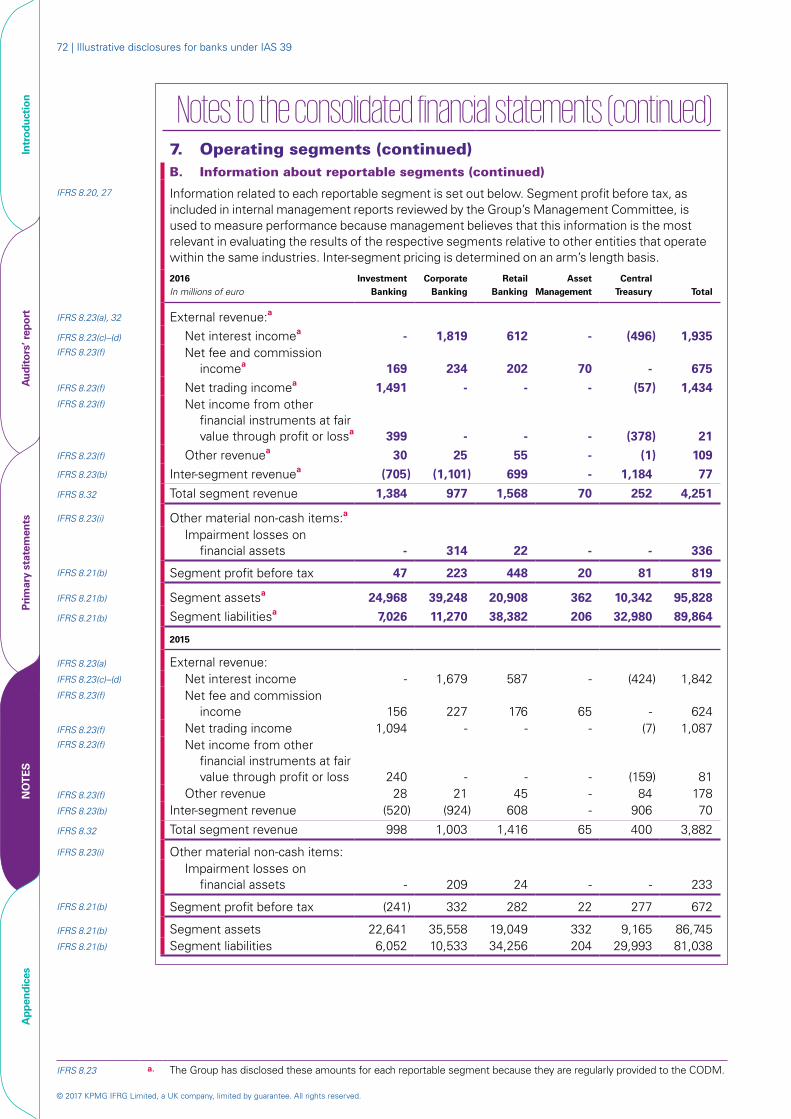
© 2017 KPMG IFRG Limited, a UK company, limited by guarantee. All rights reserved.
72 | Illustrative disclosures for banks under IAS 39
Intr
oduc
tion
Aud
itor
s’ r
epor
tPr
imar
y st
atem
ents
NO
TE
SA
ppen
dice
s
Notes to the consolidated financial statements (continued) 7. Operating segments (continued)B. Information about reportable segments (continued)
IFRS 8.20, 27 Information related to each reportable segment is set out below. Segment profit before tax, as included in internal management reports reviewed by the Group’s Management Committee, is used to measure performance because management believes that this information is the most relevant in evaluating the results of the respective segments relative to other entities that operate within the same industries. Inter-segment pricing is determined on an arm’s length basis.
2016 In millions of euro
Investment Banking
Corporate Banking
Retail Banking
Asset Management
Central Treasury Total
IFRS 8.23(a), 32 External revenue:a
IFRS 8.23(c)–(d) Net interest incomea - 1,819 612 - (496) 1,935 IFRS 8.23(f) Net fee and commission
incomea 169 234 202 70 - 675 IFRS 8.23(f) Net trading incomea 1,491 - - - (57) 1,434 IFRS 8.23(f) Net income from other
financial instruments at fair value through profit or lossa 399 - - - (378) 21
IFRS 8.23(f) Other revenuea 30 25 55 - (1) 109 IFRS 8.23(b) Inter-segment revenuea (705) (1,101) 699 - 1,184 77
IFRS 8.32 Total segment revenue 1,384 977 1,568 70 252 4,251
IFRS 8.23(i) Other material non-cash items:a
Impairment losses on financial assets - 314 22 - - 336
IFRS 8.21(b) Segment profit before tax 47 223 448 20 81 819
IFRS 8.21(b) Segment assetsa 24,968 39,248 20,908 362 10,342 95,828
IFRS 8.21(b) Segment liabilitiesa 7,026 11,270 38,382 206 32,980 89,864
2015
IFRS 8.23(a) External revenue:IFRS 8.23(c)–(d) Net interest income - 1,679 587 - (424) 1,842 IFRS 8.23(f) Net fee and commission
income 156 227 176 65 - 624 IFRS 8.23(f) Net trading income 1,094 - - - (7) 1,087IFRS 8.23(f) Net income from other
financial instruments at fair value through profit or loss 240 - - - (159) 81
IFRS 8.23(f) Other revenue 28 21 45 - 84 178 IFRS 8.23(b) Inter-segment revenue (520) (924) 608 - 906 70
IFRS 8.32 Total segment revenue 998 1,003 1,416 65 400 3,882
IFRS 8.23(i) Other material non-cash items:Impairment losses on
financial assets - 209 24 - - 233
IFRS 8.21(b) Segment profit before tax (241) 332 282 22 277 672
IFRS 8.21(b) Segment assets 22,641 35,558 19,049 332 9,165 86,745IFRS 8.21(b) Segment liabilities 6,052 10,533 34,256 204 29,993 81,038
IFRS 8.23 a. The Group has disclosed these amounts for each reportable segment because they are regularly provided to the CODM.
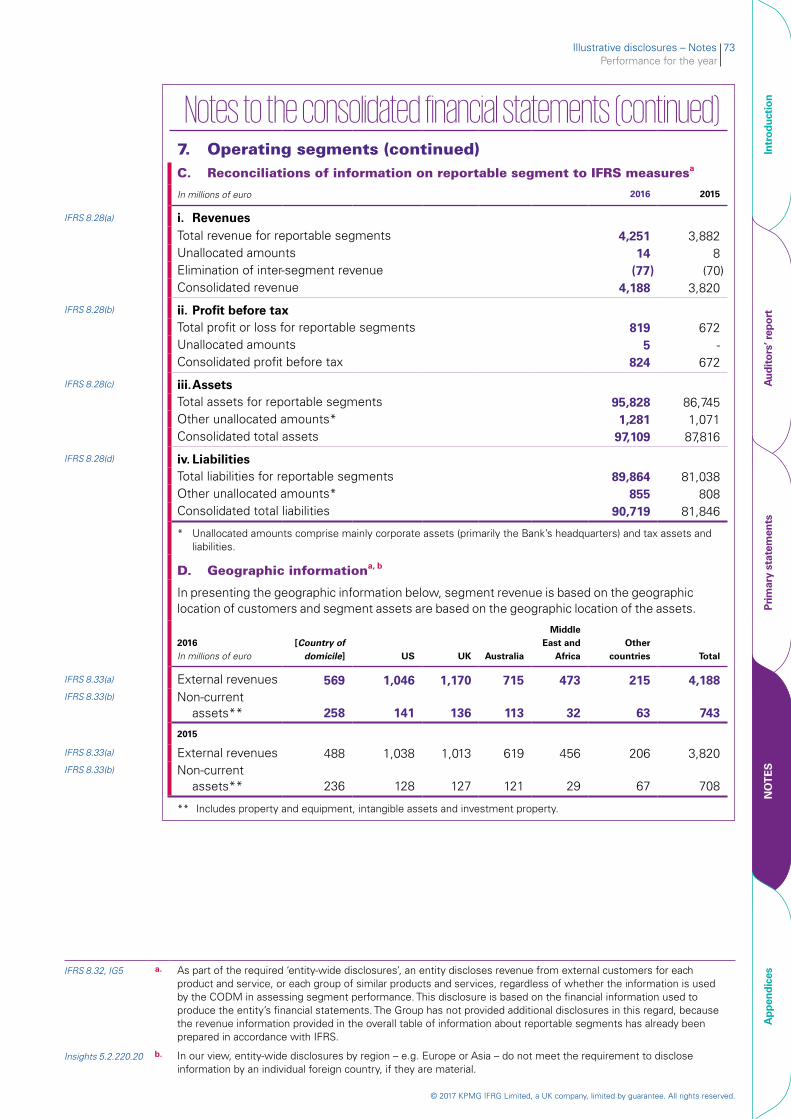
Illustrative disclosures – Notes 73Performance for the year
© 2017 KPMG IFRG Limited, a UK company, limited by guarantee. All rights reserved.
Intr
oduc
tion
Aud
itor
s’ r
epor
tPr
imar
y st
atem
ents
NO
TE
SA
ppen
dice
s
Notes to the consolidated financial statements (continued)
7. Operating segments (continued)C. Reconciliations of information on reportable segment to IFRS measuresa
In millions of euro 2016 2015
IFRS 8.28(a) i. RevenuesTotal revenue for reportable segments 4,251 3,882Unallocated amounts 14 8Elimination of inter-segment revenue (77) (70)Consolidated revenue 4,188 3,820
IFRS 8.28(b) ii. Profit before taxTotal profit or loss for reportable segments 819 672Unallocated amounts 5 -Consolidated profit before tax 824 672
IFRS 8.28(c) iii. AssetsTotal assets for reportable segments 95,828 86,745Other unallocated amounts* 1,281 1,071Consolidated total assets 97,109 87,816
IFRS 8.28(d) iv. LiabilitiesTotal liabilities for reportable segments 89,864 81,038Other unallocated amounts* 855 808Consolidated total liabilities 90,719 81,846
* Unallocated amounts comprise mainly corporate assets (primarily the Bank’s headquarters) and tax assets and liabilities.
D. Geographic informationa, b
In presenting the geographic information below, segment revenue is based on the geographic location of customers and segment assets are based on the geographic location of the assets.
2016 In millions of euro
[Country ofdomicile] US UK Australia
MiddleEast and
AfricaOther
countries Total
IFRS 8.33(a) External revenues 569 1,046 1,170 715 473 215 4,188 IFRS 8.33(b) Non-current
assets** 258 141 136 113 32 63 743
2015
IFRS 8.33(a) External revenues 488 1,038 1,013 619 456 206 3,820 IFRS 8.33(b) Non-current
assets** 236 128 127 121 29 67 708
** Includes property and equipment, intangible assets and investment property.
IFRS 8.32, IG5 a. As part of the required ‘entity-wide disclosures’, an entity discloses revenue from external customers for each product and service, or each group of similar products and services, regardless of whether the information is used by the CODM in assessing segment performance. This disclosure is based on the financial information used to produce the entity’s financial statements. The Group has not provided additional disclosures in this regard, because the revenue information provided in the overall table of information about reportable segments has already been prepared in accordance with IFRS.
Insights 5.2.220.20 b. In our view, entity-wide disclosures by region – e.g. Europe or Asia – do not meet the requirement to disclose information by an individual foreign country, if they are material.
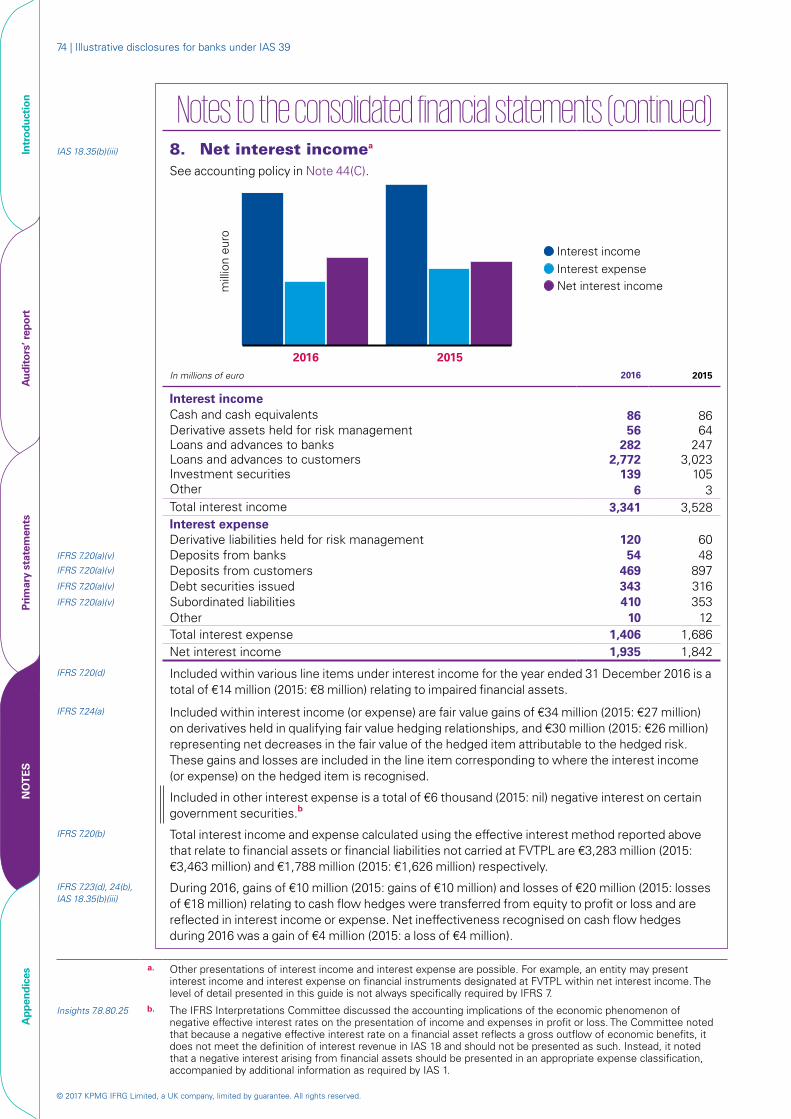
© 2017 KPMG IFRG Limited, a UK company, limited by guarantee. All rights reserved.
74 | Illustrative disclosures for banks under IAS 39
Intr
oduc
tion
Aud
itor
s’ r
epor
tPr
imar
y st
atem
ents
NO
TE
SA
ppen
dice
s
Notes to the consolidated financial statements (continued)
IAS 18.35(b)(iii) 8. Net interest incomea See accounting policy in Note 44(C).
2016 2015
mill
ion
euro
Interest incomeInterest expenseNet interest income
In millions of euro 2016 2015
Interest incomeCash and cash equivalents 86 86 Derivative assets held for risk management 56 64 Loans and advances to banks 282 247 Loans and advances to customers 2,772 3,023 Investment securities 139 105 Other 6 3 Total interest income 3,341 3,528 Interest expenseDerivative liabilities held for risk management 120 60
IFRS 7.20(a)(v) Deposits from banks 54 48 IFRS 7.20(a)(v) Deposits from customers 469 897 IFRS 7.20(a)(v) Debt securities issued 343 316 IFRS 7.20(a)(v) Subordinated liabilities 410 353
Other 10 12 Total interest expense 1,406 1,686Net interest income 1,935 1,842
IFRS 7.20(d) Included within various line items under interest income for the year ended 31 December 2016 is a total of €14 million (2015: €8 million) relating to impaired financial assets.
IFRS 7.24(a) Included within interest income (or expense) are fair value gains of €34 million (2015: €27 million) on derivatives held in qualifying fair value hedging relationships, and €30 million (2015: €26 million) representing net decreases in the fair value of the hedged item attributable to the hedged risk. These gains and losses are included in the line item corresponding to where the interest income (or expense) on the hedged item is recognised.
Included in other interest expense is a total of €6 thousand (2015: nil) negative interest on certain government securities.b
IFRS 7.20(b) Total interest income and expense calculated using the effective interest method reported above that relate to financial assets or financial liabilities not carried at FVTPL are €3,283 million (2015: €3,463 million) and €1,788 million (2015: €1,626 million) respectively.
IFRS 7.23(d), 24(b), IAS 18.35(b)(iii)
During 2016, gains of €10 million (2015: gains of €10 million) and losses of €20 million (2015: losses of €18 million) relating to cash flow hedges were transferred from equity to profit or loss and are reflected in interest income or expense. Net ineffectiveness recognised on cash flow hedges during 2016 was a gain of €4 million (2015: a loss of €4 million).
a. Other presentations of interest income and interest expense are possible. For example, an entity may present interest income and interest expense on financial instruments designated at FVTPL within net interest income. The level of detail presented in this guide is not always specifically required by IFRS 7.
Insights 7.8.80.25 b. The IFRS Interpretations Committee discussed the accounting implications of the economic phenomenon of negative effective interest rates on the presentation of income and expenses in profit or loss. The Committee noted that because a negative effective interest rate on a financial asset reflects a gross outflow of economic benefits, it does not meet the definition of interest revenue in IAS 18 and should not be presented as such. Instead, it noted that a negative interest arising from financial assets should be presented in an appropriate expense classification, accompanied by additional information as required by IAS 1.
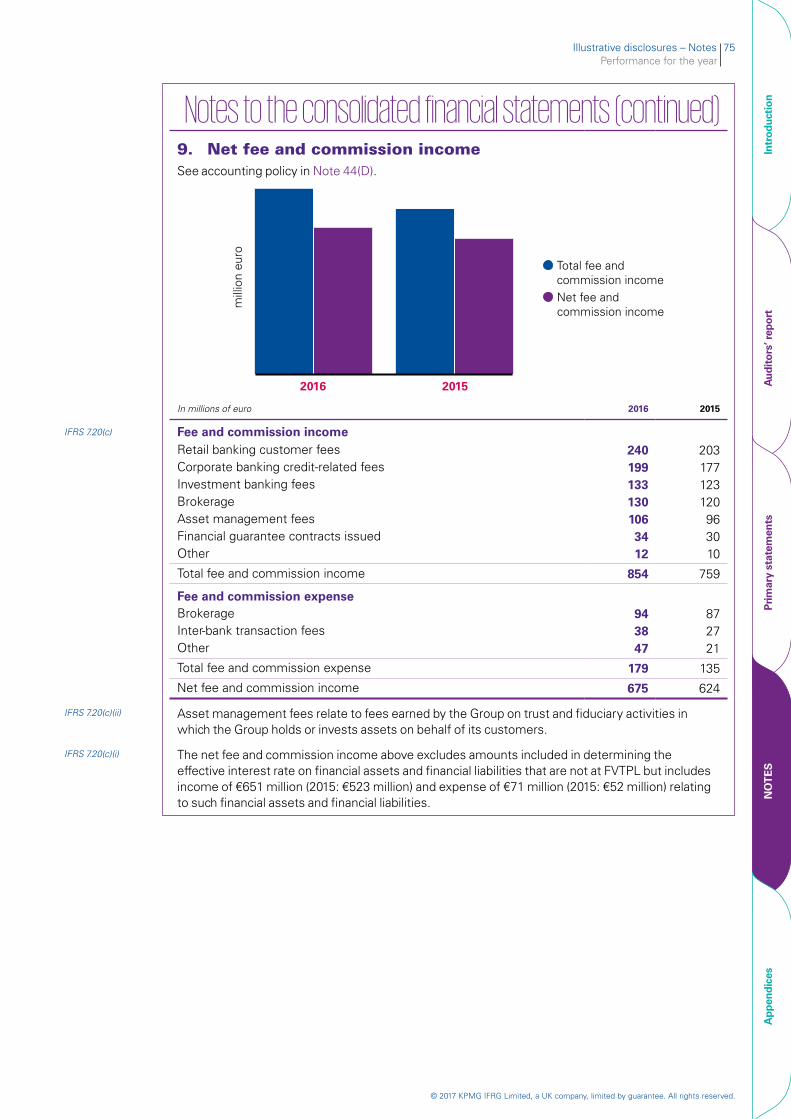
Illustrative disclosures – Notes 75Performance for the year
© 2017 KPMG IFRG Limited, a UK company, limited by guarantee. All rights reserved.
Intr
oduc
tion
Aud
itor
s’ r
epor
tPr
imar
y st
atem
ents
NO
TE
SA
ppen
dice
s
Notes to the consolidated financial statements (continued)
9. Net fee and commission incomeSee accounting policy in Note 44(D).
2016 2015
Total fee andcommission incomeNet fee andcommission income
mill
ion
euro
In millions of euro 2016 2015
IFRS 7.20(c) Fee and commission income Retail banking customer fees 240 203
Corporate banking credit-related fees 199 177 Investment banking fees 133 123 Brokerage 130 120 Asset management fees 106 96 Financial guarantee contracts issued 34 30 Other 12 10
Total fee and commission income 854 759
Fee and commission expense Brokerage 94 87
Inter-bank transaction fees 38 27 Other 47 21
Total fee and commission expense 179 135
Net fee and commission income 675 624
IFRS 7.20(c)(ii) Asset management fees relate to fees earned by the Group on trust and fiduciary activities in which the Group holds or invests assets on behalf of its customers.
IFRS 7.20(c)(i) The net fee and commission income above excludes amounts included in determining the effective interest rate on financial assets and financial liabilities that are not at FVTPL but includes income of €651 million (2015: €523 million) and expense of €71 million (2015: €52 million) relating to such financial assets and financial liabilities.
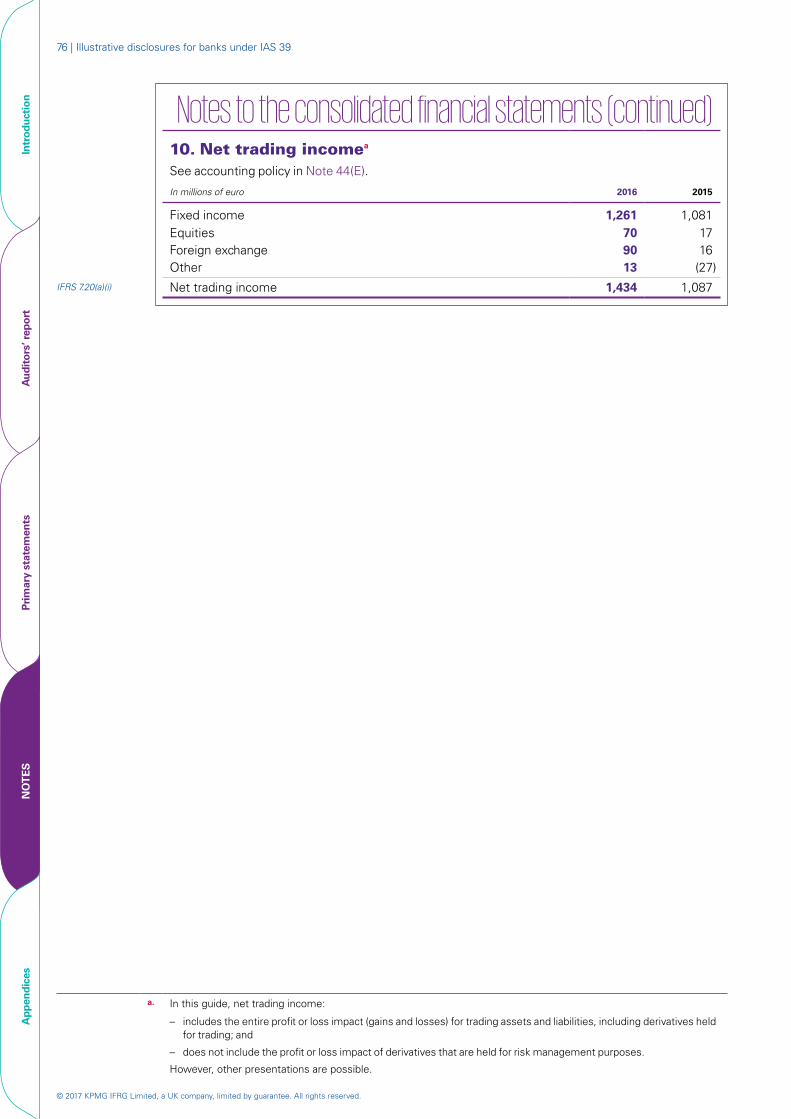
© 2017 KPMG IFRG Limited, a UK company, limited by guarantee. All rights reserved.
76 | Illustrative disclosures for banks under IAS 39
Intr
oduc
tion
Aud
itor
s’ r
epor
tPr
imar
y st
atem
ents
NO
TE
SA
ppen
dice
s
Notes to the consolidated financial statements (continued)
10. Net trading incomea See accounting policy in Note 44(E).
In millions of euro 2016 2015
Fixed income 1,261 1,081 Equities 70 17 Foreign exchange 90 16 Other 13 (27)
IFRS 7.20(a)(i) Net trading income 1,434 1,087
a. In this guide, net trading income:
– includes the entire profit or loss impact (gains and losses) for trading assets and liabilities, including derivatives held for trading; and
– does not include the profit or loss impact of derivatives that are held for risk management purposes.
However, other presentations are possible.
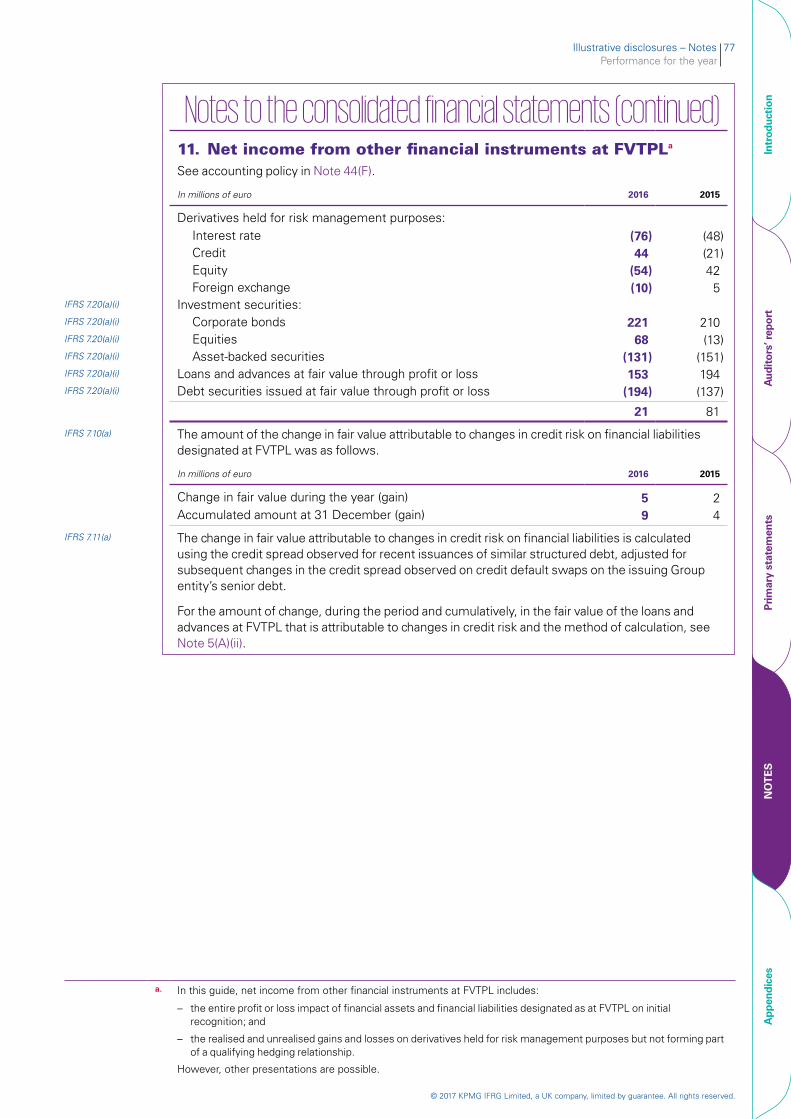
Illustrative disclosures – Notes 77Performance for the year
© 2017 KPMG IFRG Limited, a UK company, limited by guarantee. All rights reserved.
Intr
oduc
tion
Aud
itor
s’ r
epor
tPr
imar
y st
atem
ents
NO
TE
SA
ppen
dice
s
Notes to the consolidated financial statements (continued) 11. Net income from other financial instruments at FVTPLa See accounting policy in Note 44(F).
In millions of euro 2016 2015
Derivatives held for risk management purposes:Interest rate (76) (48)Credit 44 (21)Equity (54) 42 Foreign exchange (10) 5
IFRS 7.20(a)(i) Investment securities:IFRS 7.20(a)(i) Corporate bonds 221 210 IFRS 7.20(a)(i) Equities 68 (13)IFRS 7.20(a)(i) Asset-backed securities (131) (151)IFRS 7.20(a)(i) Loans and advances at fair value through profit or loss 153 194 IFRS 7.20(a)(i) Debt securities issued at fair value through profit or loss (194) (137)
21 81
IFRS 7.10(a) The amount of the change in fair value attributable to changes in credit risk on financial liabilities designated at FVTPL was as follows.
In millions of euro 2016 2015
Change in fair value during the year (gain) 5 2Accumulated amount at 31 December (gain) 9 4
IFRS 7.11(a) The change in fair value attributable to changes in credit risk on financial liabilities is calculated using the credit spread observed for recent issuances of similar structured debt, adjusted for subsequent changes in the credit spread observed on credit default swaps on the issuing Group entity’s senior debt.
For the amount of change, during the period and cumulatively, in the fair value of the loans and advances at FVTPL that is attributable to changes in credit risk and the method of calculation, see Note 5(A)(ii).
a. In this guide, net income from other financial instruments at FVTPL includes:
– the entire profit or loss impact of financial assets and financial liabilities designated as at FVTPL on initial recognition; and
– the realised and unrealised gains and losses on derivatives held for risk management purposes but not forming part of a qualifying hedging relationship.
However, other presentations are possible.

© 2017 KPMG IFRG Limited, a UK company, limited by guarantee. All rights reserved.
78 | Illustrative disclosures for banks under IAS 39
Intr
oduc
tion
Aud
itor
s’ r
epor
tPr
imar
y st
atem
ents
NO
TE
SA
ppen
dice
s
Notes to the consolidated financial statements (continued) 12. Other revenuea See accounting policies in Notes 44(B)(i), (J)(iii) and (O)(iii).
In millions of euro 2016 2015
IFRS 7.20(a)(ii), IAS 1.98(d)
Net loss on sale of available-for-sale securities:Government bonds (12) (9)Corporate bonds (60) (43)Equities (20) (17)
IFRS 7.20(a)(ii) Dividends on available-for-sale equity securities 13 8 IFRS 7.20(a)(iv) Gain on securitisation of loans and receivables 26 19 IAS 21.52(a) Foreign exchange gain 170 188
Other 6 40
123 186
IFRS 7.24(c) The net ineffectiveness recognised in profit or loss for net investment hedges during 2016 was a gain of €12 million (2015: a gain of €9 million).
IFRS 7.20(a)(ii), 20(a)(iv)
a. In this guide, dividends on available-for-sale equity securities and gains on sales/transfers of available-for-sale financial assets and loans and receivables have been included in other revenue. However, other presentations are possible.
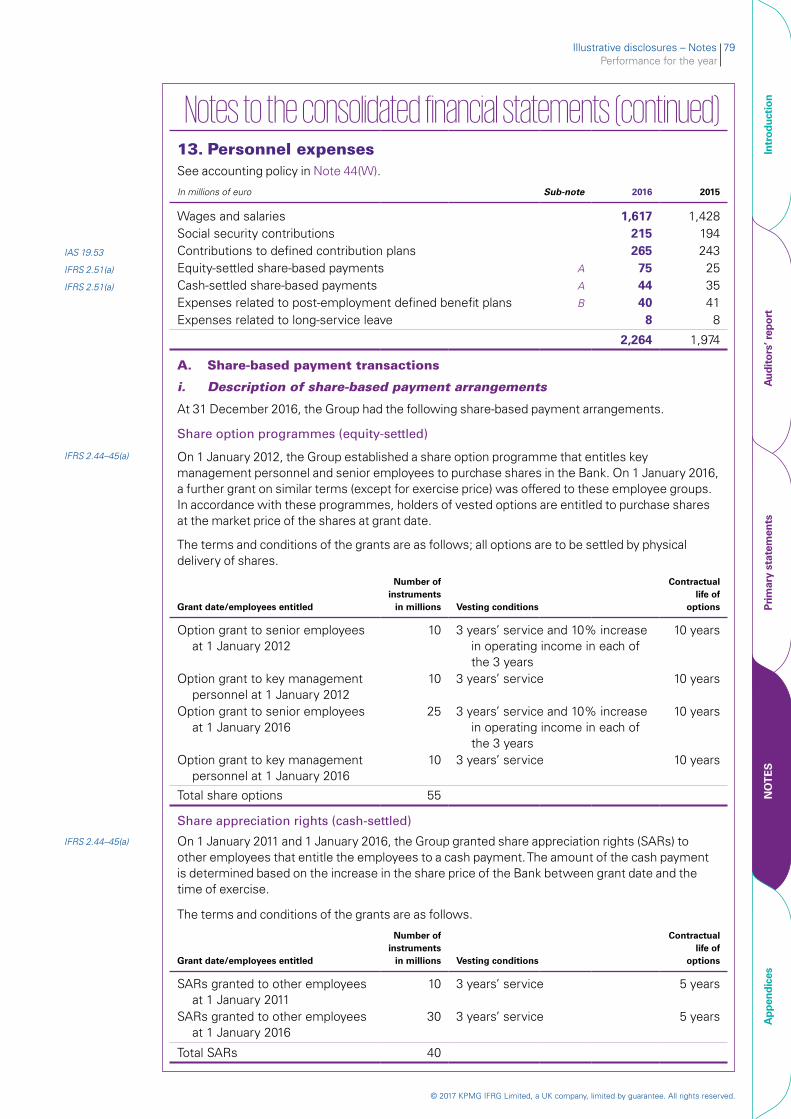
Illustrative disclosures – Notes 79Performance for the year
© 2017 KPMG IFRG Limited, a UK company, limited by guarantee. All rights reserved.
Intr
oduc
tion
Aud
itor
s’ r
epor
tPr
imar
y st
atem
ents
NO
TE
SA
ppen
dice
s
Notes to the consolidated financial statements (continued) 13. Personnel expensesSee accounting policy in Note 44(W).
In millions of euro Sub-note 2016 2015
Wages and salaries 1,617 1,428Social security contributions 215 194
IAS 19.53 Contributions to defined contribution plans 265 243IFRS 2.51(a) Equity-settled share-based payments A 75 25IFRS 2.51(a) Cash-settled share-based payments A 44 35
Expenses related to post-employment defined benefit plans B 40 41Expenses related to long-service leave 8 8
2,264 1,974
A. Share-based payment transactions
i. Description of share-based payment arrangements
At 31 December 2016, the Group had the following share-based payment arrangements.
Share option programmes (equity-settled)
IFRS 2.44–45(a) On 1 January 2012, the Group established a share option programme that entitles key management personnel and senior employees to purchase shares in the Bank. On 1 January 2016, a further grant on similar terms (except for exercise price) was offered to these employee groups. In accordance with these programmes, holders of vested options are entitled to purchase shares at the market price of the shares at grant date.
The terms and conditions of the grants are as follows; all options are to be settled by physical delivery of shares.
Grant date/employees entitled
Number of instruments
in millions Vesting conditions
Contractual life of
options
Option grant to senior employees at 1 January 2012
10 3 years’ service and 10% increase in operating income in each of the 3 years
10 years
Option grant to key management personnel at 1 January 2012
10 3 years’ service 10 years
Option grant to senior employees at 1 January 2016
25 3 years’ service and 10% increase in operating income in each of the 3 years
10 years
Option grant to key management personnel at 1 January 2016
10 3 years’ service 10 years
Total share options 55
Share appreciation rights (cash-settled)
IFRS 2.44–45(a) On 1 January 2011 and 1 January 2016, the Group granted share appreciation rights (SARs) to other employees that entitle the employees to a cash payment. The amount of the cash payment is determined based on the increase in the share price of the Bank between grant date and the time of exercise.
The terms and conditions of the grants are as follows.
Grant date/employees entitled
Number of instruments
in millions Vesting conditions
Contractual life of
options
SARs granted to other employees at 1 January 2011
10 3 years’ service 5 years
SARs granted to other employees at 1 January 2016
30 3 years’ service 5 years
Total SARs 40
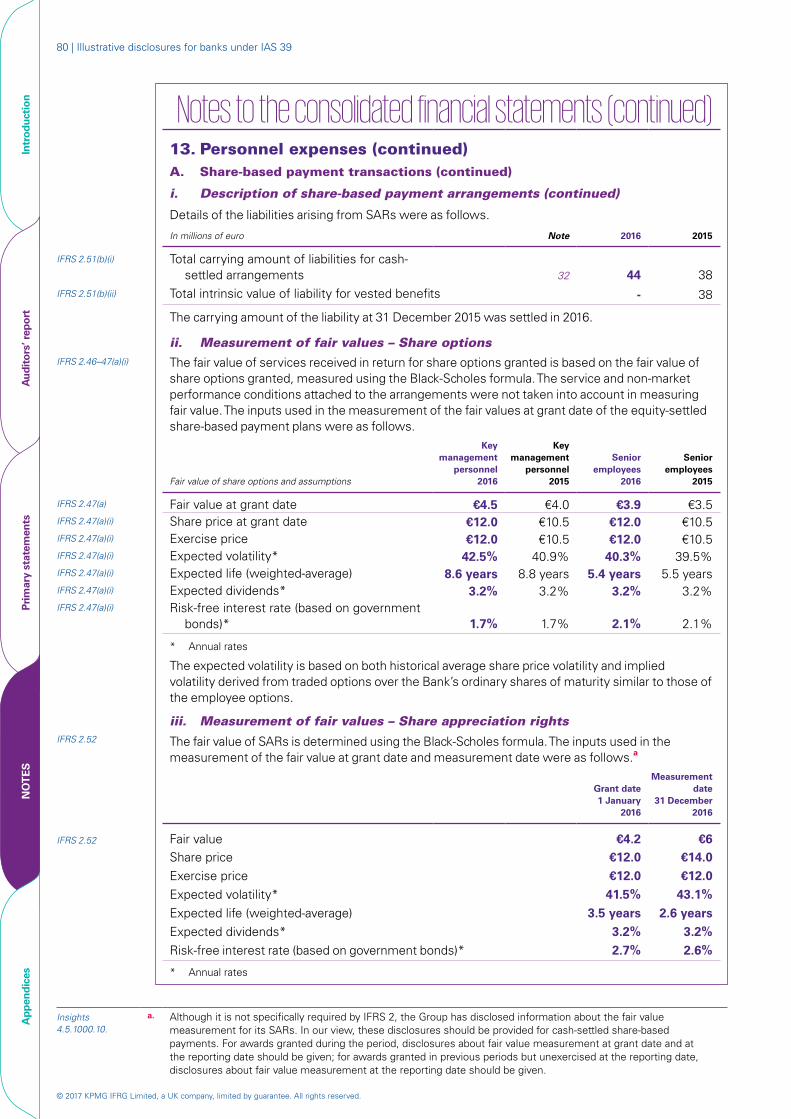
© 2017 KPMG IFRG Limited, a UK company, limited by guarantee. All rights reserved.
80 | Illustrative disclosures for banks under IAS 39
Intr
oduc
tion
Aud
itor
s’ r
epor
tPr
imar
y st
atem
ents
NO
TE
SA
ppen
dice
s
Notes to the consolidated financial statements (continued) 13. Personnel expenses (continued)A. Share-based payment transactions (continued)
i. Description of share-based payment arrangements (continued)
Details of the liabilities arising from SARs were as follows.
In millions of euro Note 2016 2015
IFRS 2.51(b)(i) Total carrying amount of liabilities for cash-settled arrangements 32 44 38
IFRS 2.51(b)(ii) Total intrinsic value of liability for vested benefits - 38
The carrying amount of the liability at 31 December 2015 was settled in 2016.
ii. Measurement of fair values – Share optionsIFRS 2.46–47(a)(i) The fair value of services received in return for share options granted is based on the fair value of
share options granted, measured using the Black-Scholes formula. The service and non-market performance conditions attached to the arrangements were not taken into account in measuring fair value. The inputs used in the measurement of the fair values at grant date of the equity-settled share-based payment plans were as follows.
Fair value of share options and assumptions
Key management
personnel2016
Key management
personnel2015
Senior employees
2016
Senior employees
2015
IFRS 2.47(a) Fair value at grant date €4.5 €4.0 €3.9 €3.5IFRS 2.47(a)(i) Share price at grant date €12.0 €10.5 €12.0 €10.5IFRS 2.47(a)(i) Exercise price €12.0 €10.5 €12.0 €10.5IFRS 2.47(a)(i) Expected volatility* 42.5% 40.9% 40.3% 39.5%IFRS 2.47(a)(i) Expected life (weighted-average) 8.6 years 8.8 years 5.4 years 5.5 yearsIFRS 2.47(a)(i) Expected dividends* 3.2% 3.2% 3.2% 3.2%IFRS 2.47(a)(i) Risk-free interest rate (based on government
bonds)* 1.7% 1.7% 2.1% 2.1%
* Annual rates
The expected volatility is based on both historical average share price volatility and implied volatility derived from traded options over the Bank’s ordinary shares of maturity similar to those of the employee options.
iii. Measurement of fair values – Share appreciation rightsIFRS 2.52 The fair value of SARs is determined using the Black-Scholes formula. The inputs used in the
measurement of the fair value at grant date and measurement date were as follows.a
Grant date 1 January
2016
Measurement date
31 December 2016
IFRS 2.52 Fair value €4.2 €6Share price €12.0 €14.0Exercise price €12.0 €12.0Expected volatility* 41.5% 43.1%Expected life (weighted-average) 3.5 years 2.6 yearsExpected dividends* 3.2% 3.2%Risk-free interest rate (based on government bonds)* 2.7% 2.6%
* Annual rates
Insights 4.5.1000.10.
a. Although it is not specifically required by IFRS 2, the Group has disclosed information about the fair value measurement for its SARs. In our view, these disclosures should be provided for cash-settled share-based payments. For awards granted during the period, disclosures about fair value measurement at grant date and at the reporting date should be given; for awards granted in previous periods but unexercised at the reporting date, disclosures about fair value measurement at the reporting date should be given.
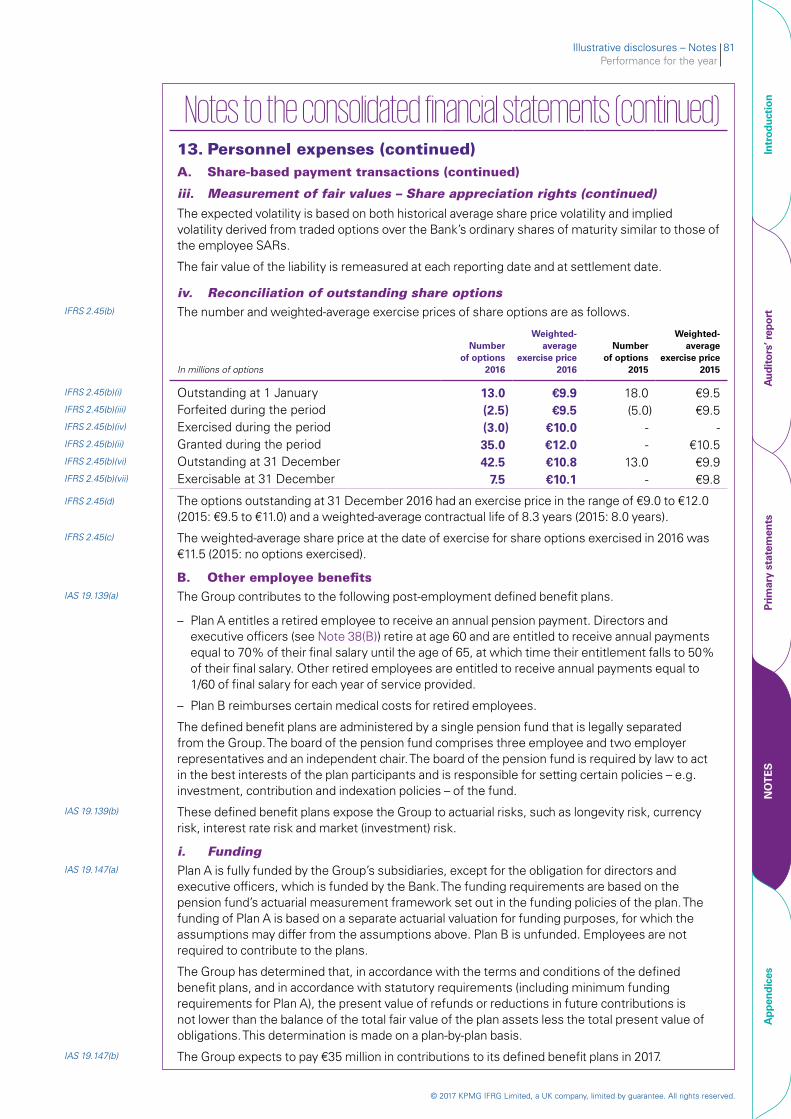
Illustrative disclosures – Notes 81Performance for the year
© 2017 KPMG IFRG Limited, a UK company, limited by guarantee. All rights reserved.
Intr
oduc
tion
Aud
itor
s’ r
epor
tPr
imar
y st
atem
ents
NO
TE
SA
ppen
dice
s
Notes to the consolidated financial statements (continued)13. Personnel expenses (continued)A. Share-based payment transactions (continued)
iii. Measurement of fair values – Share appreciation rights (continued)
The expected volatility is based on both historical average share price volatility and implied volatility derived from traded options over the Bank’s ordinary shares of maturity similar to those of the employee SARs.
The fair value of the liability is remeasured at each reporting date and at settlement date.
iv. Reconciliation of outstanding share optionsIFRS 2.45(b) The number and weighted-average exercise prices of share options are as follows.
In millions of options
Number of options
2016
Weighted-average
exercise price 2016
Number of options
2015
Weighted-average
exercise price 2015
IFRS 2.45(b)(i) Outstanding at 1 January 13.0 €9.9 18.0 €9.5IFRS 2.45(b)(iii) Forfeited during the period (2.5) €9.5 (5.0) €9.5IFRS 2.45(b)(iv) Exercised during the period (3.0) €10.0 - - IFRS 2.45(b)(ii) Granted during the period 35.0 €12.0 - €10.5IFRS 2.45(b)(vi) Outstanding at 31 December 42.5 €10.8 13.0 €9.9IFRS 2.45(b)(vii) Exercisable at 31 December 7.5 €10.1 - €9.8
IFRS 2.45(d) The options outstanding at 31 December 2016 had an exercise price in the range of €9.0 to €12.0 (2015: €9.5 to €11.0) and a weighted-average contractual life of 8.3 years (2015: 8.0 years).
IFRS 2.45(c) The weighted-average share price at the date of exercise for share options exercised in 2016 was €11.5 (2015: no options exercised).
B. Other employee benefitsIAS 19.139(a) The Group contributes to the following post-employment defined benefit plans.
– Plan A entitles a retired employee to receive an annual pension payment. Directors and executive officers (see Note 38(B)) retire at age 60 and are entitled to receive annual payments equal to 70% of their final salary until the age of 65, at which time their entitlement falls to 50% of their final salary. Other retired employees are entitled to receive annual payments equal to 1/60 of final salary for each year of service provided.
– Plan B reimburses certain medical costs for retired employees.
The defined benefit plans are administered by a single pension fund that is legally separated from the Group. The board of the pension fund comprises three employee and two employer representatives and an independent chair. The board of the pension fund is required by law to act in the best interests of the plan participants and is responsible for setting certain policies – e.g. investment, contribution and indexation policies – of the fund.
IAS 19.139(b) These defined benefit plans expose the Group to actuarial risks, such as longevity risk, currency risk, interest rate risk and market (investment) risk.
i. FundingIAS 19.147(a) Plan A is fully funded by the Group’s subsidiaries, except for the obligation for directors and
executive officers, which is funded by the Bank. The funding requirements are based on the pension fund’s actuarial measurement framework set out in the funding policies of the plan. The funding of Plan A is based on a separate actuarial valuation for funding purposes, for which the assumptions may differ from the assumptions above. Plan B is unfunded. Employees are not required to contribute to the plans.
The Group has determined that, in accordance with the terms and conditions of the defined benefit plans, and in accordance with statutory requirements (including minimum funding requirements for Plan A), the present value of refunds or reductions in future contributions is not lower than the balance of the total fair value of the plan assets less the total present value of obligations. This determination is made on a plan-by-plan basis.
IAS 19.147(b) The Group expects to pay €35 million in contributions to its defined benefit plans in 2017.
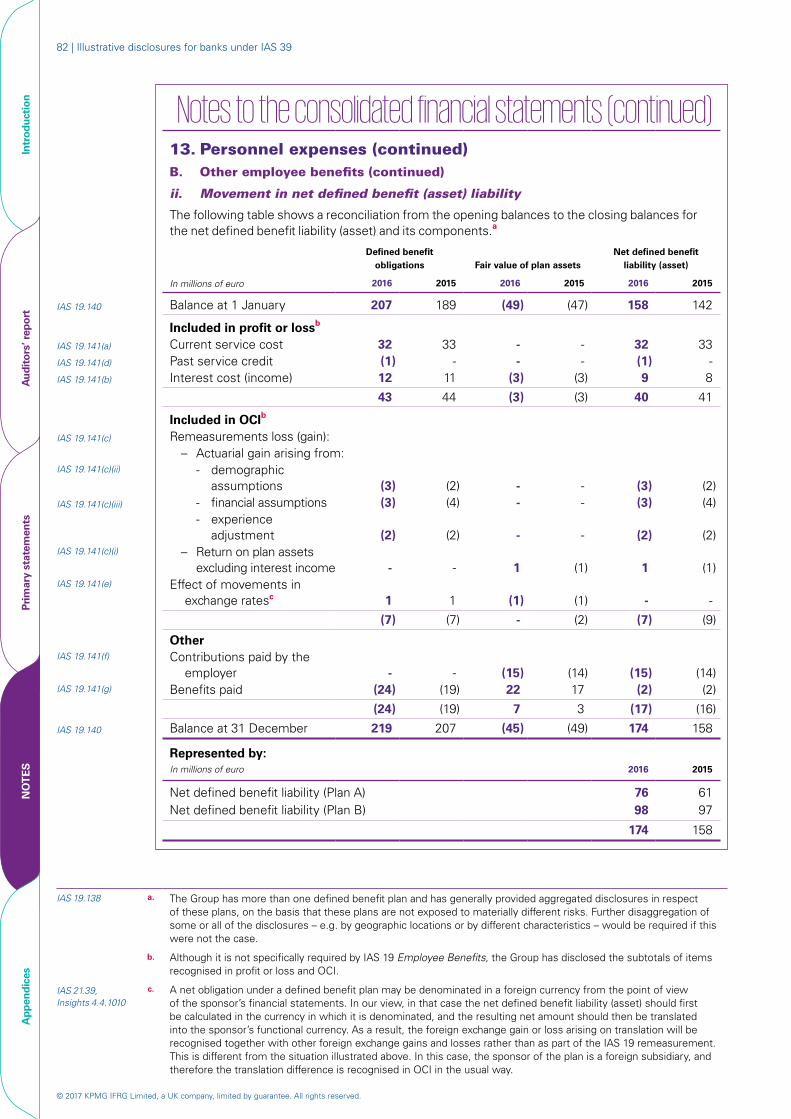
© 2017 KPMG IFRG Limited, a UK company, limited by guarantee. All rights reserved.
82 | Illustrative disclosures for banks under IAS 39
Intr
oduc
tion
Aud
itor
s’ r
epor
tPr
imar
y st
atem
ents
NO
TE
SA
ppen
dice
s
Notes to the consolidated financial statements (continued)13. Personnel expenses (continued)B. Other employee benefits (continued)
ii. Movement in net defined benefit (asset) liability
The following table shows a reconciliation from the opening balances to the closing balances for the net defined benefit liability (asset) and its components.a
Defined benefit obligations Fair value of plan assets
Net defined benefit liability (asset)
In millions of euro 2016 2015 2016 2015 2016 2015
IAS 19.140 Balance at 1 January 207 189 (49) (47) 158 142
Included in profit or lossb
IAS 19.141(a) Current service cost 32 33 - - 32 33IAS 19.141(d) Past service credit (1) - - - (1) -IAS 19.141(b) Interest cost (income) 12 11 (3) (3) 9 8
43 44 (3) (3) 40 41
Included in OCIb
IAS 19.141(c) Remeasurements loss (gain):– Actuarial gain arising from:
IAS 19.141(c)(ii) - demographic assumptions (3) (2) - - (3) (2)
IAS 19.141(c)(iii) - financial assumptions (3) (4) - - (3) (4)- experience
adjustment (2) (2) - - (2) (2)IAS 19.141(c)(i) – Return on plan assets
excluding interest income - - 1 (1) 1 (1)IAS 19.141(e) Effect of movements in
exchange ratesc 1 1 (1) (1) - -
(7) (7) - (2) (7) (9)
OtherIAS 19.141(f) Contributions paid by the
employer - - (15) (14) (15) (14)IAS 19.141(g) Benefits paid (24) (19) 22 17 (2) (2)
(24) (19) 7 3 (17) (16)
IAS 19.140 Balance at 31 December 219 207 (45) (49) 174 158
Represented by: In millions of euro 2016 2015
Net defined benefit liability (Plan A) 76 61Net defined benefit liability (Plan B) 98 97
174 158
IAS 19.138 a. The Group has more than one defined benefit plan and has generally provided aggregated disclosures in respect of these plans, on the basis that these plans are not exposed to materially different risks. Further disaggregation of some or all of the disclosures – e.g. by geographic locations or by different characteristics – would be required if this were not the case.
b. Although it is not specifically required by IAS 19 Employee Benefits, the Group has disclosed the subtotals of items recognised in profit or loss and OCI.
IAS 21.39, Insights 4.4.1010
c. A net obligation under a defined benefit plan may be denominated in a foreign currency from the point of view of the sponsor’s financial statements. In our view, in that case the net defined benefit liability (asset) should first be calculated in the currency in which it is denominated, and the resulting net amount should then be translated into the sponsor’s functional currency. As a result, the foreign exchange gain or loss arising on translation will be recognised together with other foreign exchange gains and losses rather than as part of the IAS 19 remeasurement. This is different from the situation illustrated above. In this case, the sponsor of the plan is a foreign subsidiary, and therefore the translation difference is recognised in OCI in the usual way.
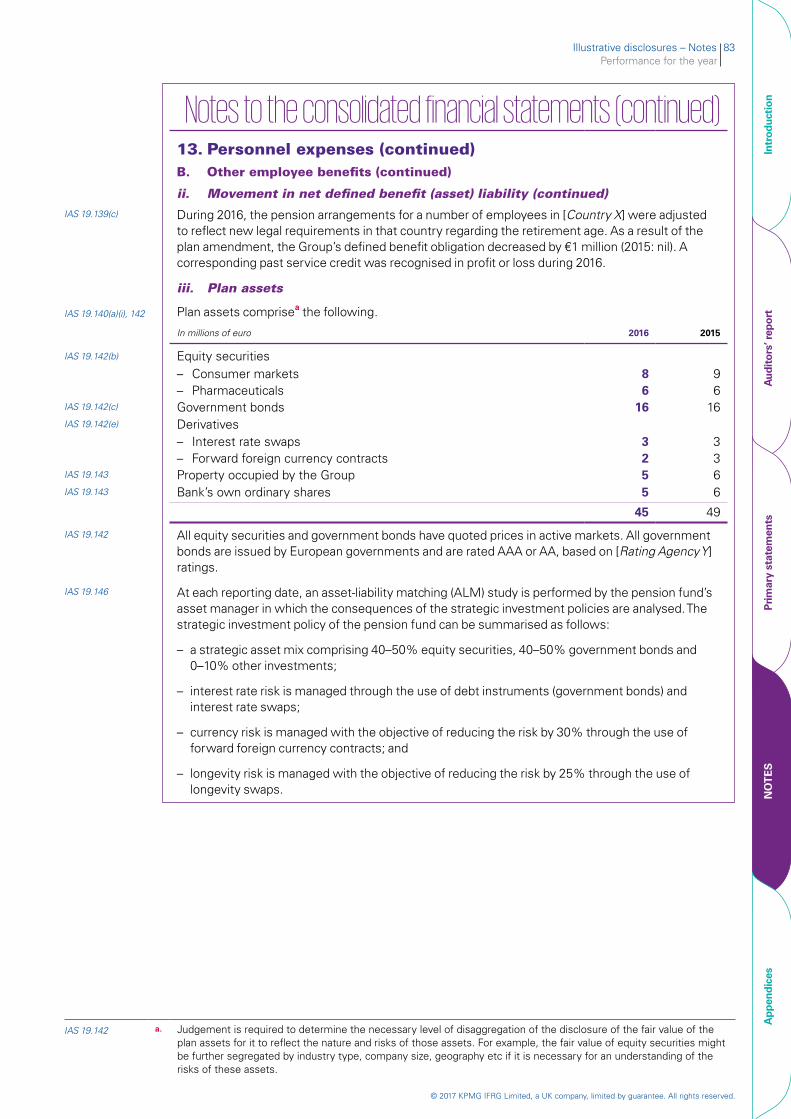
Illustrative disclosures – Notes 83Performance for the year
© 2017 KPMG IFRG Limited, a UK company, limited by guarantee. All rights reserved.
Intr
oduc
tion
Aud
itor
s’ r
epor
tPr
imar
y st
atem
ents
NO
TE
SA
ppen
dice
s
Notes to the consolidated financial statements (continued)13. Personnel expenses (continued)B. Other employee benefits (continued)
ii. Movement in net defined benefit (asset) liability (continued)
IAS 19.139(c) During 2016, the pension arrangements for a number of employees in [Country X] were adjusted to reflect new legal requirements in that country regarding the retirement age. As a result of the plan amendment, the Group’s defined benefit obligation decreased by €1 million (2015: nil). A corresponding past service credit was recognised in profit or loss during 2016.
iii. Plan assets
IAS 19.140(a)(i), 142 Plan assets comprisea the following.
In millions of euro 2016 2015
IAS 19.142(b) Equity securities– Consumer markets 8 9– Pharmaceuticals 6 6
IAS 19.142(c) Government bonds 16 16 IAS 19.142(e) Derivatives
– Interest rate swaps 3 3– Forward foreign currency contracts 2 3
IAS 19.143 Property occupied by the Group 5 6 IAS 19.143 Bank’s own ordinary shares 5 6
45 49
IAS 19.142 All equity securities and government bonds have quoted prices in active markets. All government bonds are issued by European governments and are rated AAA or AA, based on [Rating Agency Y] ratings.
IAS 19.146 At each reporting date, an asset-liability matching (ALM) study is performed by the pension fund’s asset manager in which the consequences of the strategic investment policies are analysed. The strategic investment policy of the pension fund can be summarised as follows:
– a strategic asset mix comprising 40–50% equity securities, 40–50% government bonds and 0–10% other investments;
– interest rate risk is managed through the use of debt instruments (government bonds) and interest rate swaps;
– currency risk is managed with the objective of reducing the risk by 30% through the use of forward foreign currency contracts; and
– longevity risk is managed with the objective of reducing the risk by 25% through the use of longevity swaps.
IAS 19.142 a. Judgement is required to determine the necessary level of disaggregation of the disclosure of the fair value of the plan assets for it to reflect the nature and risks of those assets. For example, the fair value of equity securities might be further segregated by industry type, company size, geography etc if it is necessary for an understanding of the risks of these assets.
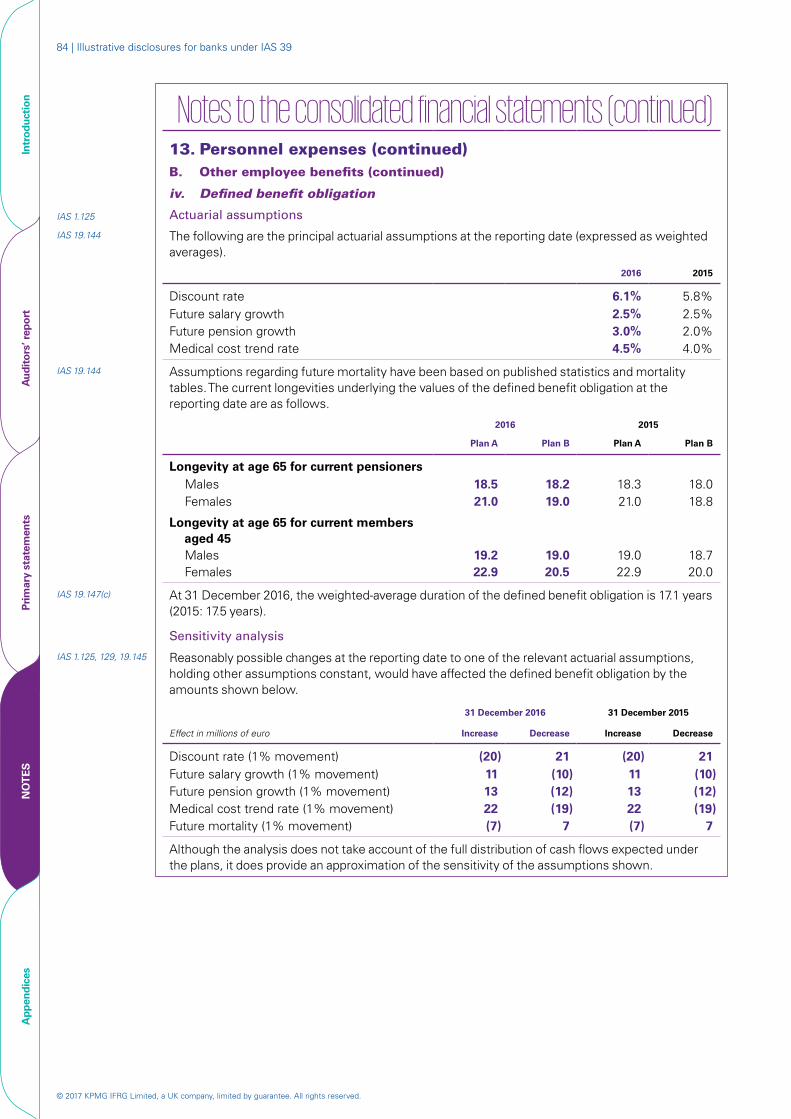
© 2017 KPMG IFRG Limited, a UK company, limited by guarantee. All rights reserved.
84 | Illustrative disclosures for banks under IAS 39
Intr
oduc
tion
Aud
itor
s’ r
epor
tPr
imar
y st
atem
ents
NO
TE
SA
ppen
dice
s
Notes to the consolidated financial statements (continued)13. Personnel expenses (continued)B. Other employee benefits (continued)
iv. Defined benefit obligation
IAS 1.125 Actuarial assumptions
IAS 19.144 The following are the principal actuarial assumptions at the reporting date (expressed as weighted averages).
2016 2015
Discount rate 6.1% 5.8%Future salary growth 2.5% 2.5%Future pension growth 3.0% 2.0%Medical cost trend rate 4.5% 4.0%
IAS 19.144 Assumptions regarding future mortality have been based on published statistics and mortality tables. The current longevities underlying the values of the defined benefit obligation at the reporting date are as follows.
2016 2015
Plan A Plan B Plan A Plan B
Longevity at age 65 for current pensionersMales 18.5 18.2 18.3 18.0Females 21.0 19.0 21.0 18.8
Longevity at age 65 for current members aged 45Males 19.2 19.0 19.0 18.7Females 22.9 20.5 22.9 20.0
IAS 19.147(c) At 31 December 2016, the weighted-average duration of the defined benefit obligation is 17.1 years (2015: 17.5 years).
Sensitivity analysis
IAS 1.125, 129, 19.145 Reasonably possible changes at the reporting date to one of the relevant actuarial assumptions, holding other assumptions constant, would have affected the defined benefit obligation by the amounts shown below.
31 December 2016 31 December 2015
Effect in millions of euro Increase Decrease Increase Decrease
Discount rate (1% movement) (20) 21 (20) 21Future salary growth (1% movement) 11 (10) 11 (10)Future pension growth (1% movement) 13 (12) 13 (12)Medical cost trend rate (1% movement) 22 (19) 22 (19)Future mortality (1% movement) (7) 7 (7) 7
Although the analysis does not take account of the full distribution of cash flows expected under the plans, it does provide an approximation of the sensitivity of the assumptions shown.
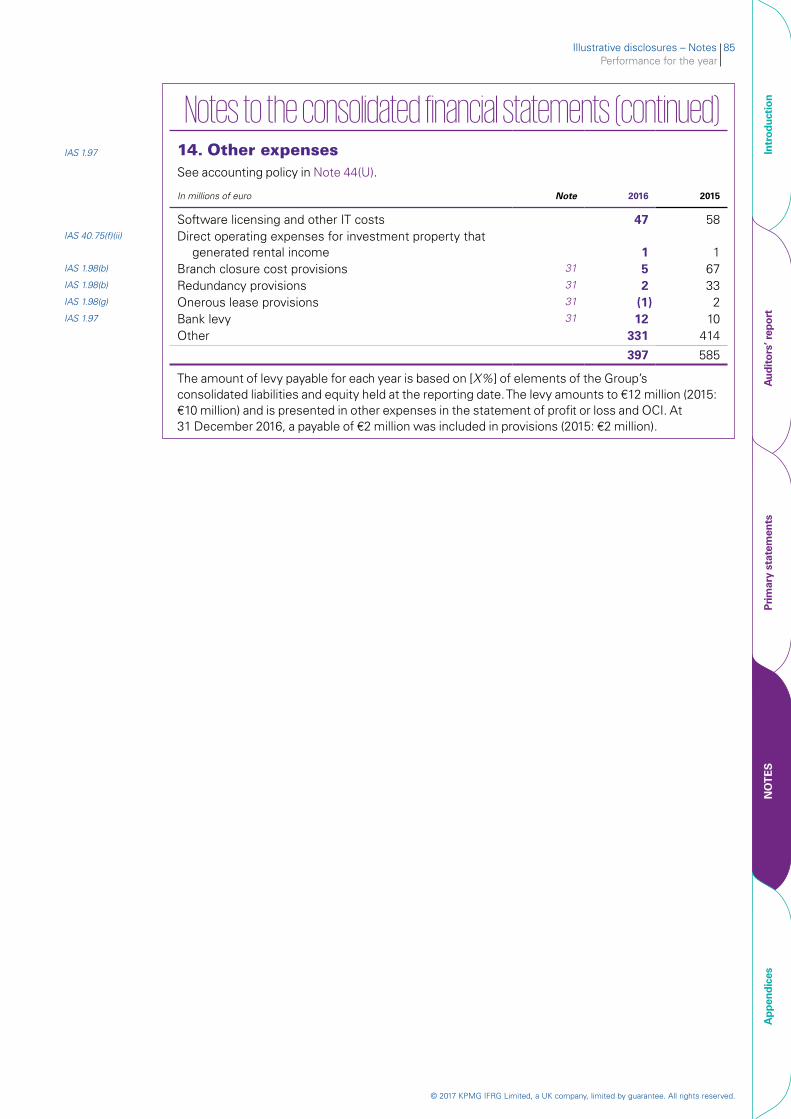
Illustrative disclosures – Notes 85Performance for the year
© 2017 KPMG IFRG Limited, a UK company, limited by guarantee. All rights reserved.
Intr
oduc
tion
Aud
itor
s’ r
epor
tPr
imar
y st
atem
ents
NO
TE
SA
ppen
dice
s
Notes to the consolidated financial statements (continued) IAS 1.97 14. Other expenses
See accounting policy in Note 44(U).
In millions of euro Note 2016 2015
Software licensing and other IT costs 47 58IAS 40.75(f)(ii) Direct operating expenses for investment property that
generated rental income 1 1IAS 1.98(b) Branch closure cost provisions 31 5 67 IAS 1.98(b) Redundancy provisions 31 2 33 IAS 1.98(g) Onerous lease provisions 31 (1) 2 IAS 1.97 Bank levy 31 12 10
Other 331 414
397 585
The amount of levy payable for each year is based on [X%] of elements of the Group’s consolidated liabilities and equity held at the reporting date. The levy amounts to €12 million (2015: €10 million) and is presented in other expenses in the statement of profit or loss and OCI. At 31 December 2016, a payable of €2 million was included in provisions (2015: €2 million).
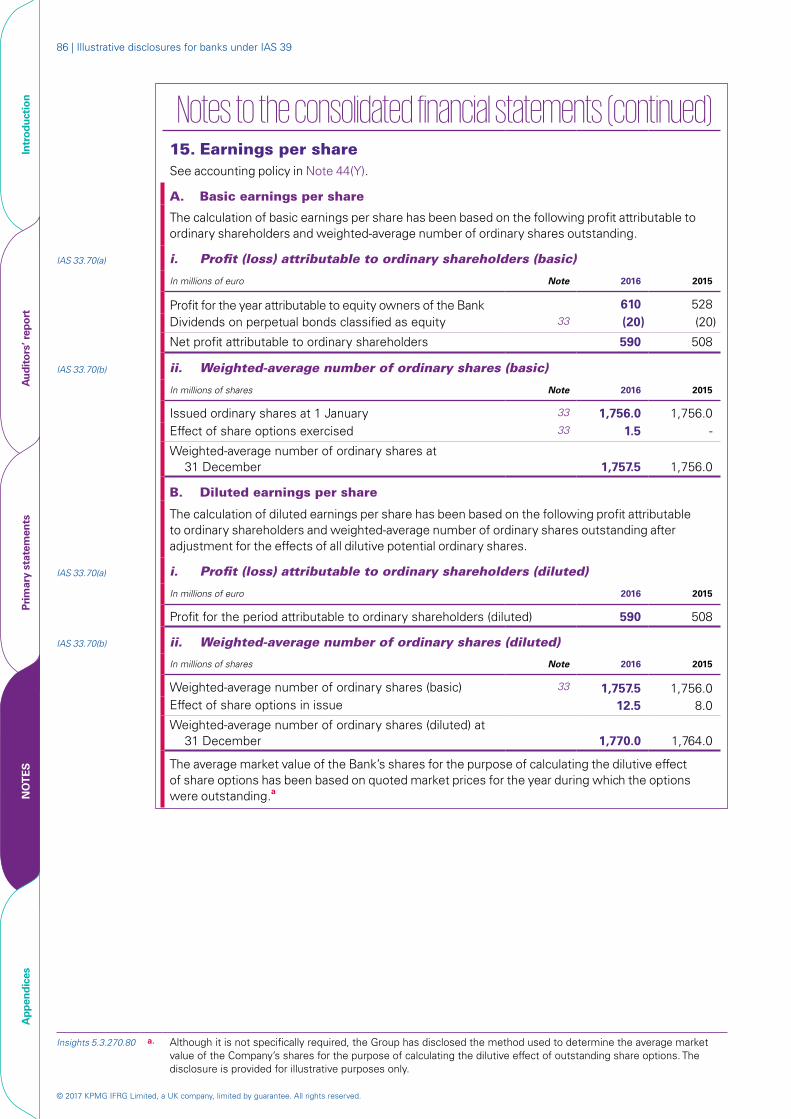
© 2017 KPMG IFRG Limited, a UK company, limited by guarantee. All rights reserved.
86 | Illustrative disclosures for banks under IAS 39
Intr
oduc
tion
Aud
itor
s’ r
epor
tPr
imar
y st
atem
ents
NO
TE
SA
ppen
dice
s
Notes to the consolidated financial statements (continued) 15. Earnings per share See accounting policy in Note 44(Y).
A. Basic earnings per share
The calculation of basic earnings per share has been based on the following profit attributable to ordinary shareholders and weighted-average number of ordinary shares outstanding.
IAS 33.70(a) i. Profit (loss) attributable to ordinary shareholders (basic)
In millions of euro Note 2016 2015
Profit for the year attributable to equity owners of the Bank 610 528 Dividends on perpetual bonds classified as equity 33 (20) (20)
Net profit attributable to ordinary shareholders 590 508
IAS 33.70(b) ii. Weighted-average number of ordinary shares (basic)
In millions of shares Note 2016 2015
Issued ordinary shares at 1 January 33 1,756.0 1,756.0 Effect of share options exercised 33 1.5 -
Weighted-average number of ordinary shares at 31 December 1,757.5 1,756.0
B. Diluted earnings per share
The calculation of diluted earnings per share has been based on the following profit attributable to ordinary shareholders and weighted-average number of ordinary shares outstanding after adjustment for the effects of all dilutive potential ordinary shares.
IAS 33.70(a) i. Profit (loss) attributable to ordinary shareholders (diluted)
In millions of euro 2016 2015
Profit for the period attributable to ordinary shareholders (diluted) 590 508
IAS 33.70(b) ii. Weighted-average number of ordinary shares (diluted)
In millions of shares Note 2016 2015
Weighted-average number of ordinary shares (basic) 33 1,757.5 1,756.0 Effect of share options in issue 12.5 8.0
Weighted-average number of ordinary shares (diluted) at 31 December 1,770.0 1,764.0
The average market value of the Bank’s shares for the purpose of calculating the dilutive effect of share options has been based on quoted market prices for the year during which the options were outstanding.a
Insights 5.3.270.80 a. Although it is not specifically required, the Group has disclosed the method used to determine the average market value of the Company’s shares for the purpose of calculating the dilutive effect of outstanding share options. The disclosure is provided for illustrative purposes only.
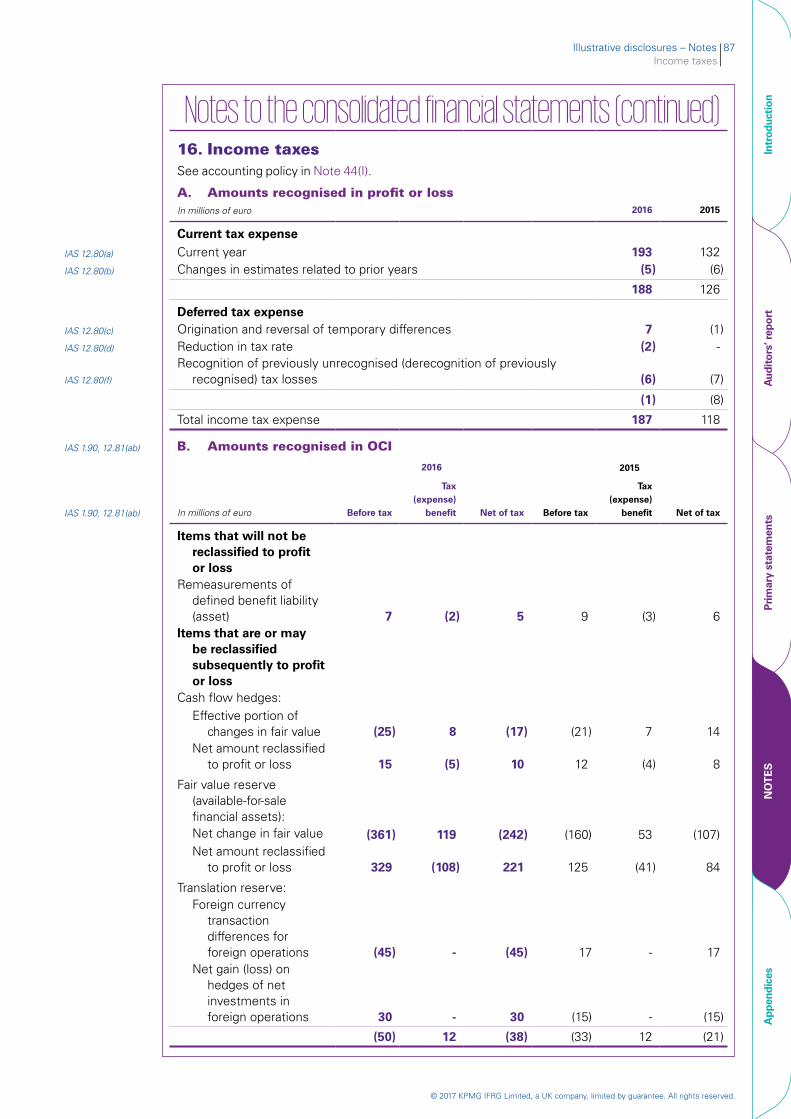
Illustrative disclosures – Notes 87Income taxes
© 2017 KPMG IFRG Limited, a UK company, limited by guarantee. All rights reserved.
Intr
oduc
tion
Aud
itor
s’ r
epor
tPr
imar
y st
atem
ents
NO
TE
SA
ppen
dice
s
Notes to the consolidated financial statements (continued)16. Income taxesSee accounting policy in Note 44(I).
A. Amounts recognised in profit or lossIn millions of euro 2016 2015
Current tax expense
IAS 12.80(a) Current year 193 132IAS 12.80(b) Changes in estimates related to prior years (5) (6)
188 126
Deferred tax expenseIAS 12.80(c) Origination and reversal of temporary differences 7 (1)IAS 12.80(d) Reduction in tax rate (2) -
IAS 12.80(f)
Recognition of previously unrecognised (derecognition of previously recognised) tax losses (6) (7)
(1) (8)
Total income tax expense 187 118
IAS 1.90, 12.81(ab) B. Amounts recognised in OCI
2016 2015
IAS 1.90, 12.81(ab) In millions of euro Before tax
Tax (expense)
benefit Net of tax Before tax
Tax (expense)
benefit Net of tax
Items that will not be reclassified to profit or loss
Remeasurements of defined benefit liability (asset) 7 (2) 5 9 (3) 6
Items that are or may be reclassified subsequently to profit or loss
Cash flow hedges:Effective portion of
changes in fair value (25) 8 (17) (21) 7 14Net amount reclassified
to profit or loss 15 (5) 10 12 (4) 8
Fair value reserve (available-for-sale financial assets):Net change in fair value (361) 119 (242) (160) 53 (107)Net amount reclassified
to profit or loss 329 (108) 221 125 (41) 84
Translation reserve:Foreign currency
transaction differences for foreign operations (45) - (45) 17 - 17
Net gain (loss) on hedges of net investments in foreign operations 30 - 30 (15) - (15)
(50) 12 (38) (33) 12 (21)
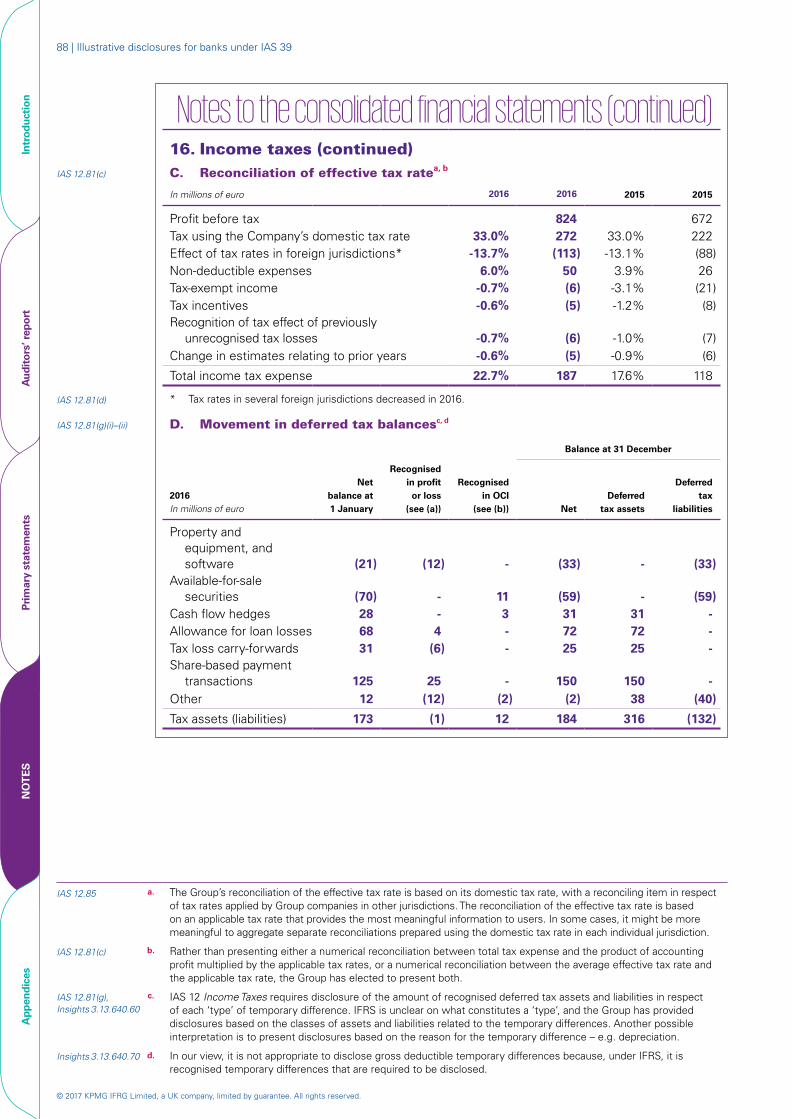
© 2017 KPMG IFRG Limited, a UK company, limited by guarantee. All rights reserved.
88 | Illustrative disclosures for banks under IAS 39
Intr
oduc
tion
Aud
itor
s’ r
epor
tPr
imar
y st
atem
ents
NO
TE
SA
ppen
dice
s
Notes to the consolidated financial statements (continued)16. Income taxes (continued)
IAS 12.81(c) C. Reconciliation of effective tax ratea, b
In millions of euro 2016 2016 2015 2015
Profit before tax 824 672Tax using the Company’s domestic tax rate 33.0% 272 33.0% 222Effect of tax rates in foreign jurisdictions* -13.7% (113) -13.1% (88)Non-deductible expenses 6.0% 50 3.9% 26Tax-exempt income -0.7% (6) -3.1% (21)Tax incentives -0.6% (5) -1.2% (8)Recognition of tax effect of previously
unrecognised tax losses -0.7% (6) -1.0% (7)Change in estimates relating to prior years -0.6% (5) -0.9% (6)
Total income tax expense 22.7% 187 17.6% 118
IAS 12.81(d) * Tax rates in several foreign jurisdictions decreased in 2016.
IAS 12.81(g)(i)–(ii) D. Movement in deferred tax balancesc, d
Balance at 31 December
2016 In millions of euro
Net balance at 1 January
Recognised in profit
or loss (see (a))
Recognised in OCI
(see (b)) NetDeferred
tax assets
Deferred tax
liabilities
Property and equipment, and software (21) (12) - (33) - (33)
Available-for-sale securities (70) - 11 (59) - (59)
Cash flow hedges 28 - 3 31 31 -Allowance for loan losses 68 4 - 72 72 -Tax loss carry-forwards 31 (6) - 25 25 -Share-based payment
transactions 125 25 - 150 150 -Other 12 (12) (2) (2) 38 (40)
Tax assets (liabilities) 173 (1) 12 184 316 (132)
IAS 12.85 a. The Group’s reconciliation of the effective tax rate is based on its domestic tax rate, with a reconciling item in respect of tax rates applied by Group companies in other jurisdictions. The reconciliation of the effective tax rate is based on an applicable tax rate that provides the most meaningful information to users. In some cases, it might be more meaningful to aggregate separate reconciliations prepared using the domestic tax rate in each individual jurisdiction.
IAS 12.81(c) b. Rather than presenting either a numerical reconciliation between total tax expense and the product of accounting profit multiplied by the applicable tax rates, or a numerical reconciliation between the average effective tax rate and the applicable tax rate, the Group has elected to present both.
IAS 12.81(g), Insights 3.13.640.60
c. IAS 12 Income Taxes requires disclosure of the amount of recognised deferred tax assets and liabilities in respect of each ‘type’ of temporary difference. IFRS is unclear on what constitutes a ‘type’, and the Group has provided disclosures based on the classes of assets and liabilities related to the temporary differences. Another possible interpretation is to present disclosures based on the reason for the temporary difference – e.g. depreciation.
Insights 3.13.640.70 d. In our view, it is not appropriate to disclose gross deductible temporary differences because, under IFRS, it is recognised temporary differences that are required to be disclosed.
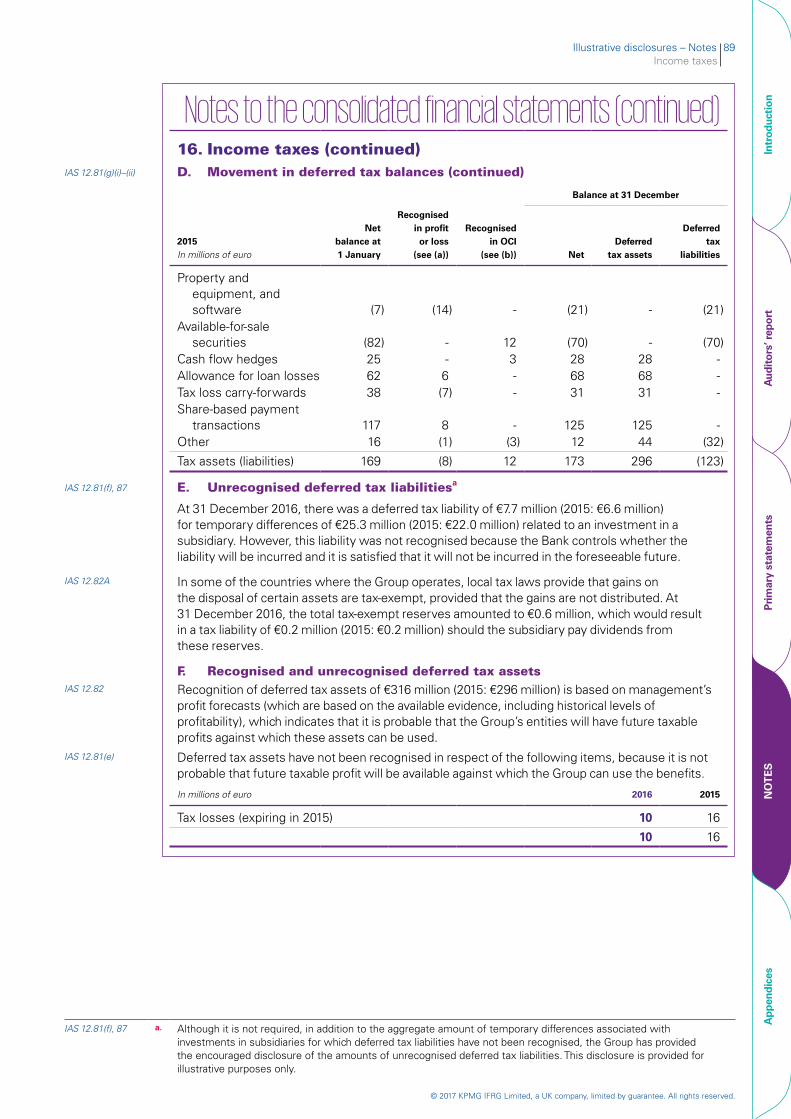
Illustrative disclosures – Notes 89Income taxes
© 2017 KPMG IFRG Limited, a UK company, limited by guarantee. All rights reserved.
Intr
oduc
tion
Aud
itor
s’ r
epor
tPr
imar
y st
atem
ents
NO
TE
SA
ppen
dice
s
Notes to the consolidated financial statements (continued)16. Income taxes (continued)
IAS 12.81(g)(i)–(ii) D. Movement in deferred tax balances (continued)
Balance at 31 December
2015 In millions of euro
Net balance at 1 January
Recognised in profit
or loss (see (a))
Recognised in OCI
(see (b)) NetDeferred
tax assets
Deferred tax
liabilities
Property and equipment, and software (7) (14) - (21) - (21)
Available-for-sale securities (82) - 12 (70) - (70)
Cash flow hedges 25 - 3 28 28 -Allowance for loan losses 62 6 - 68 68 -Tax loss carry-forwards 38 (7) - 31 31 -Share-based payment
transactions 117 8 - 125 125 -Other 16 (1) (3) 12 44 (32)
Tax assets (liabilities) 169 (8) 12 173 296 (123)
IAS 12.81(f), 87 E. Unrecognised deferred tax liabilitiesa
At 31 December 2016, there was a deferred tax liability of €7.7 million (2015: €6.6 million) for temporary differences of €25.3 million (2015: €22.0 million) related to an investment in a subsidiary. However, this liability was not recognised because the Bank controls whether the liability will be incurred and it is satisfied that it will not be incurred in the foreseeable future.
IAS 12.82A In some of the countries where the Group operates, local tax laws provide that gains on the disposal of certain assets are tax-exempt, provided that the gains are not distributed. At 31 December 2016, the total tax-exempt reserves amounted to €0.6 million, which would result in a tax liability of €0.2 million (2015: €0.2 million) should the subsidiary pay dividends from these reserves.
F. Recognised and unrecognised deferred tax assetsIAS 12.82 Recognition of deferred tax assets of €316 million (2015: €296 million) is based on management’s
profit forecasts (which are based on the available evidence, including historical levels of profitability), which indicates that it is probable that the Group’s entities will have future taxable profits against which these assets can be used.
IAS 12.81(e) Deferred tax assets have not been recognised in respect of the following items, because it is not probable that future taxable profit will be available against which the Group can use the benefits.
In millions of euro 2016 2015
Tax losses (expiring in 2015) 10 16
10 16
IAS 12.81(f), 87 a. Although it is not required, in addition to the aggregate amount of temporary differences associated with investments in subsidiaries for which deferred tax liabilities have not been recognised, the Group has provided the encouraged disclosure of the amounts of unrecognised deferred tax liabilities. This disclosure is provided for illustrative purposes only.
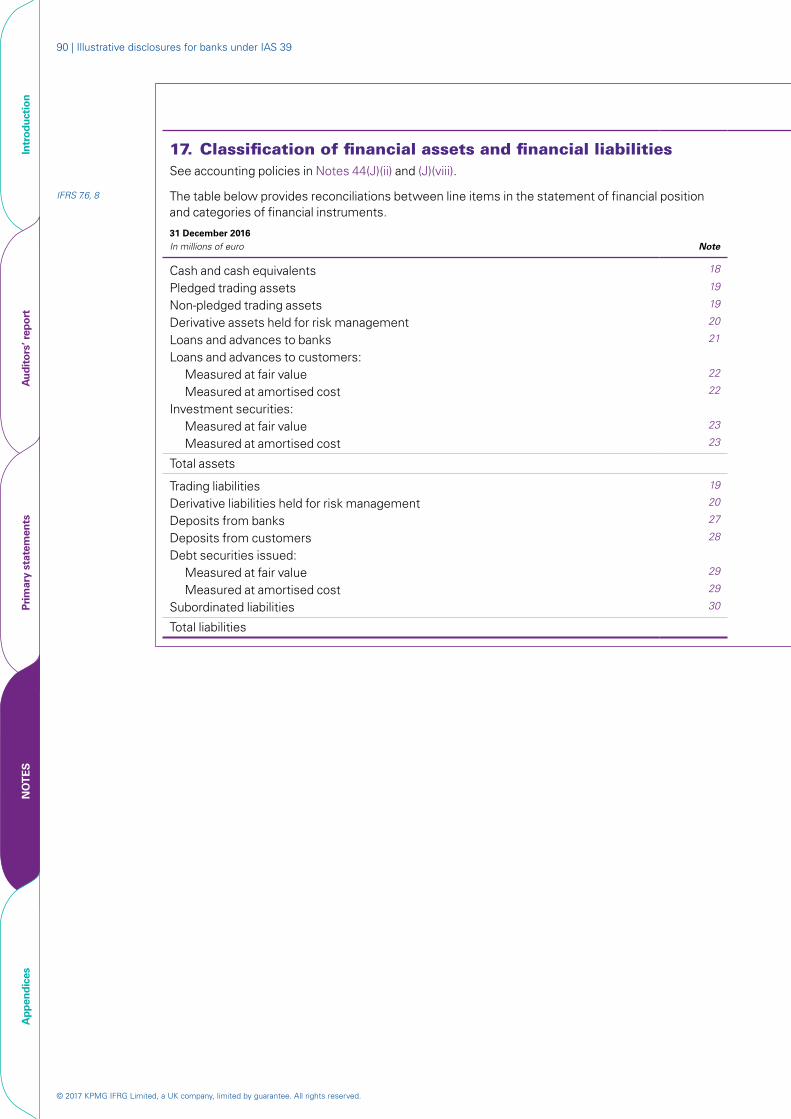
© 2017 KPMG IFRG Limited, a UK company, limited by guarantee. All rights reserved.
90 | Illustrative disclosures for banks under IAS 39
Intr
oduc
tion
Aud
itor
s’ r
epor
tPr
imar
y st
atem
ents
NO
TE
SA
ppen
dice
s
Notes to the consolidated financial statements (continued)
17. Classification of financial assets and financial liabilitiesSee accounting policies in Notes 44(J)(ii) and (J)(viii).
IFRS 7.6, 8 The table below provides reconciliations between line items in the statement of financial position and categories of financial instruments.
31 December 2016 In millions of euro Note Trading
Designated at fair value Held-to-maturity
Loans and receivables Available-for-sale
Other amortised cost
Total carrying amount
Cash and cash equivalents 18 - - - 2,907 - - 2,907Pledged trading assets 19 540 - - - - - 540Non-pledged trading assets 19 16,122 - - - - - 16,122Derivative assets held for risk management 20 858 - - - - - 858Loans and advances to banks 21 - - - 5,572 - - 5,572Loans and advances to customers:
Measured at fair value 22 - 3,986 - - - - 3,986Measured at amortised cost 22 - - - 59,084 - - 59,084
Investment securities:Measured at fair value 23 - 4,091 - - 2,110 - 6,201Measured at amortised cost 23 - - 101 - - - 101
Total assets 17,520 8,077 101 67,563 2,110 - 95,371
Trading liabilities 19 7,026 - - - - - 7,026Derivative liabilities held for risk management 20 828 - - - - - 828Deposits from banks 27 - - - - - 11,678 11,678Deposits from customers 28 - - - - - 53,646 53,646Debt securities issued:
Measured at fair value 29 - 2,409 - - - - 2,409Measured at amortised cost 29 - - - - - 8,818 8,818
Subordinated liabilities 30 - - - - - 5,642 5,642
Total liabilities 7,854 2,409 - - - 79,784 90,047
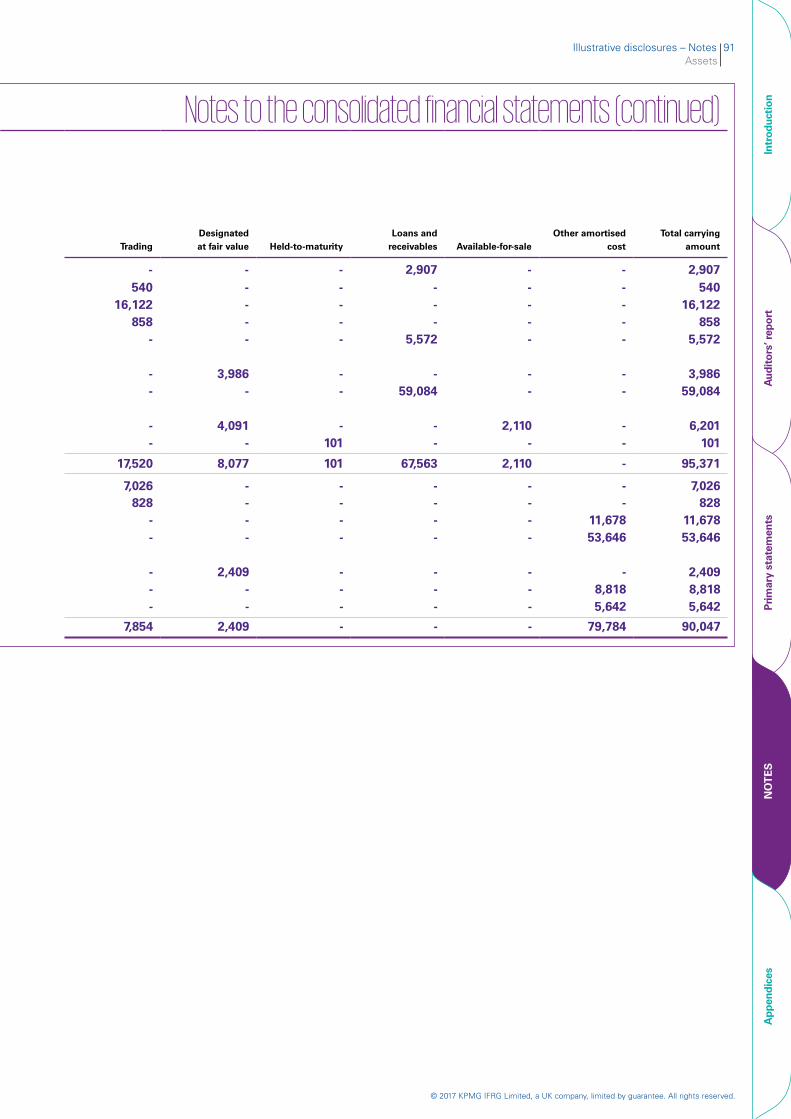
Illustrative disclosures – Notes 91Assets
© 2017 KPMG IFRG Limited, a UK company, limited by guarantee. All rights reserved.
Intr
oduc
tion
Aud
itor
s’ r
epor
tPr
imar
y st
atem
ents
NO
TE
SA
ppen
dice
s
Notes to the consolidated financial statements (continued)
TradingDesignated at fair value Held-to-maturity
Loans and receivables Available-for-sale
Other amortised cost
Total carrying amount
- - - 2,907 - - 2,907 540 - - - - - 540
16,122 - - - - - 16,122 858 - - - - - 858
- - - 5,572 - - 5,572
- 3,986 - - - - 3,986 - - - 59,084 - - 59,084
- 4,091 - - 2,110 - 6,201 - - 101 - - - 101
17,520 8,077 101 67,563 2,110 - 95,371
7,026 - - - - - 7,026 828 - - - - - 828
- - - - - 11,678 11,678 - - - - - 53,646 53,646
- 2,409 - - - - 2,409 - - - - - 8,818 8,818 - - - - - 5,642 5,642
7,854 2,409 - - - 79,784 90,047
17. Classification of financial assets and financial liabilitiesSee accounting policies in Notes 44(J)(ii) and (J)(viii).
IFRS 7.6, 8 The table below provides reconciliations between line items in the statement of financial position and categories of financial instruments.
31 December 2016 In millions of euro Note
Cash and cash equivalents 18
Pledged trading assets 19
Non-pledged trading assets 19
Derivative assets held for risk management 20
Loans and advances to banks 21
Loans and advances to customers:Measured at fair value 22
Measured at amortised cost 22
Investment securities:Measured at fair value 23
Measured at amortised cost 23
Total assets
Trading liabilities 19
Derivative liabilities held for risk management 20
Deposits from banks 27
Deposits from customers 28
Debt securities issued:Measured at fair value 29
Measured at amortised cost 29
Subordinated liabilities 30
Total liabilities
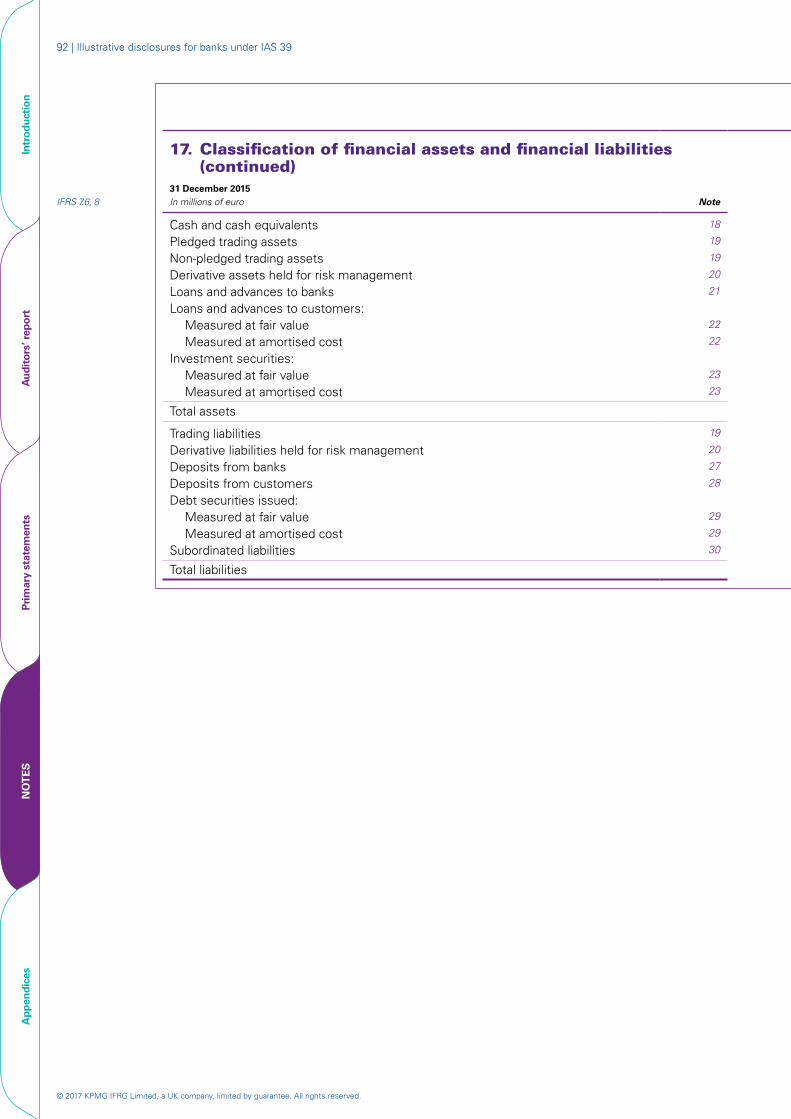
© 2017 KPMG IFRG Limited, a UK company, limited by guarantee. All rights reserved.
92 | Illustrative disclosures for banks under IAS 39
Intr
oduc
tion
Aud
itor
s’ r
epor
tPr
imar
y st
atem
ents
NO
TE
SA
ppen
dice
s
Notes to the consolidated financial statements (continued)17. Classification of financial assets and financial liabilities
(continued)
IFRS 7.6, 831 December 2015 In millions of euro Note Trading
Designated at fair value Held-to-maturity
Loans and receivables Available-for-sale
Other amortised cost
Total carrying amount
Cash and cash equivalents 18 - - - 2,992 - - 2,992 Pledged trading assets 19 519 - - - - - 519 Non-pledged trading assets 19 15,249 - - - - - 15,249 Derivative assets held for risk management 20 726 - - - - - 726Loans and advances to banks 21 - - - 4,707 - - 4,707Loans and advances to customers:
Measured at fair value 22 - 3,145 - - - - 3,145Measured at amortised cost 22 - - - 53,660 - - 53,660
Investment securities:Measured at fair value 23 - 3,239 - - 1,929 - 5,168Measured at amortised cost 23 - - 101 - - - 101
Total assets 16,494 6,384 101 61,359 1,929 - 86,267
Trading liabilities 19 6,052 - - - - - 6,052 Derivative liabilities held for risk management 20 789 - - - - - 789Deposits from banks 27 - - - - - 10,230 10,230Deposits from customers 28 - - - - - 48,904 48,904Debt securities issued:
Measured at fair value 29 - 2,208 - - - - 2,208Measured at amortised cost 29 - - - - - 8,040 8,040
Subordinated liabilities 30 - - - - - 4,985 4,985
Total liabilities 6,841 2,208 - - - 72,159 81,208
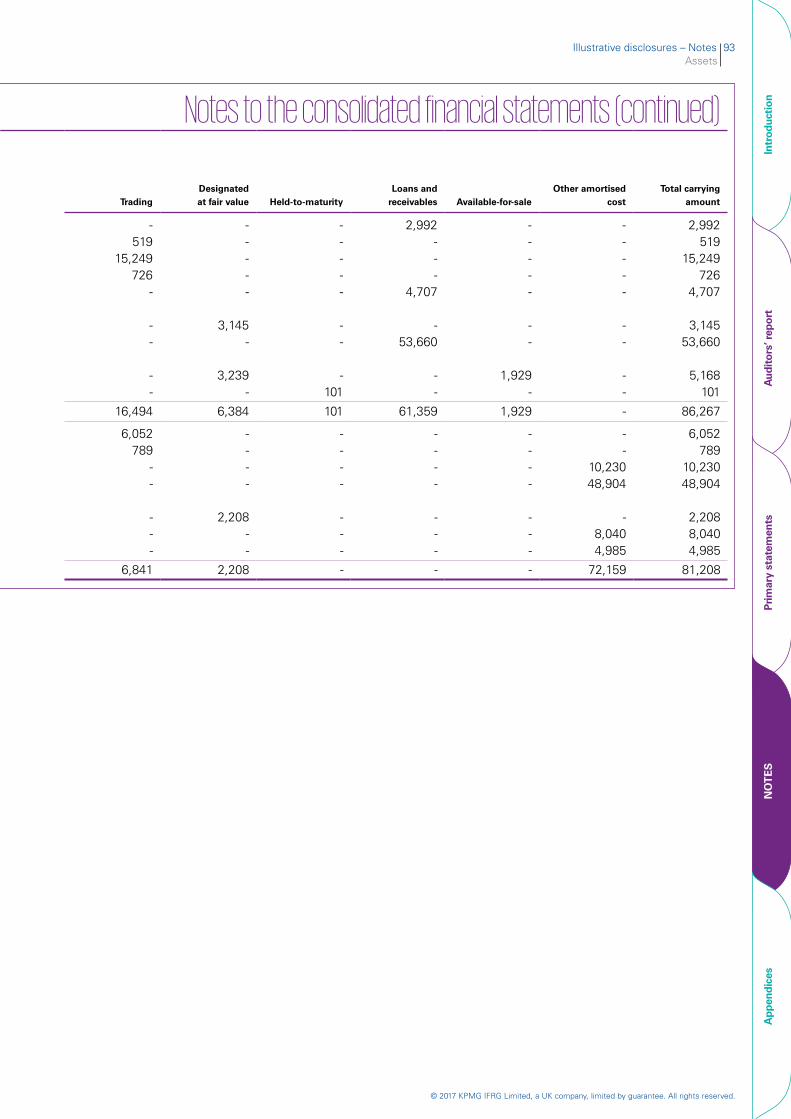
Illustrative disclosures – Notes 93Assets
© 2017 KPMG IFRG Limited, a UK company, limited by guarantee. All rights reserved.
Intr
oduc
tion
Aud
itor
s’ r
epor
tPr
imar
y st
atem
ents
NO
TE
SA
ppen
dice
s
Notes to the consolidated financial statements (continued)
TradingDesignated at fair value Held-to-maturity
Loans and receivables Available-for-sale
Other amortised cost
Total carrying amount
- - - 2,992 - - 2,992 519 - - - - - 519
15,249 - - - - - 15,249 726 - - - - - 726
- - - 4,707 - - 4,707
- 3,145 - - - - 3,145 - - - 53,660 - - 53,660
- 3,239 - - 1,929 - 5,168 - - 101 - - - 101
16,494 6,384 101 61,359 1,929 - 86,267
6,052 - - - - - 6,052 789 - - - - - 789
- - - - - 10,230 10,230 - - - - - 48,904 48,904
- 2,208 - - - - 2,208 - - - - - 8,040 8,040 - - - - - 4,985 4,985
6,841 2,208 - - - 72,159 81,208
17. Classification of financial assets and financial liabilities (continued)
IFRS 7.6, 831 December 2015 In millions of euro Note
Cash and cash equivalents 18
Pledged trading assets 19
Non-pledged trading assets 19
Derivative assets held for risk management 20
Loans and advances to banks 21
Loans and advances to customers:Measured at fair value 22
Measured at amortised cost 22
Investment securities:Measured at fair value 23
Measured at amortised cost 23
Total assets
Trading liabilities 19
Derivative liabilities held for risk management 20
Deposits from banks 27
Deposits from customers 28
Debt securities issued:Measured at fair value 29
Measured at amortised cost 29
Subordinated liabilities 30
Total liabilities
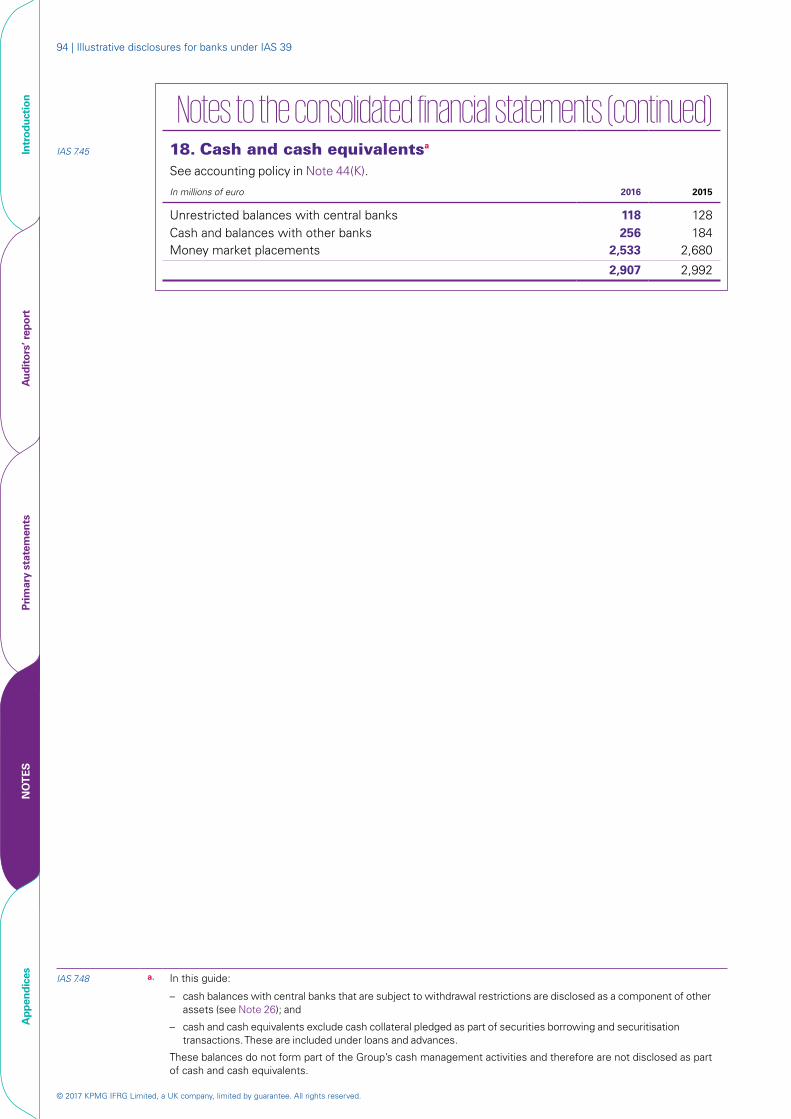
© 2017 KPMG IFRG Limited, a UK company, limited by guarantee. All rights reserved.
94 | Illustrative disclosures for banks under IAS 39
Intr
oduc
tion
Aud
itor
s’ r
epor
tPr
imar
y st
atem
ents
NO
TE
SA
ppen
dice
s
Notes to the consolidated financial statements (continued)IAS 7.45 18. Cash and cash equivalentsa
See accounting policy in Note 44(K).
In millions of euro 2016 2015
Unrestricted balances with central banks 118 128 Cash and balances with other banks 256 184 Money market placements 2,533 2,680
2,907 2,992
IAS 7.48 a. In this guide:
– cash balances with central banks that are subject to withdrawal restrictions are disclosed as a component of other assets (see Note 26); and
– cash and cash equivalents exclude cash collateral pledged as part of securities borrowing and securitisation transactions. These are included under loans and advances.
These balances do not form part of the Group’s cash management activities and therefore are not disclosed as part of cash and cash equivalents.
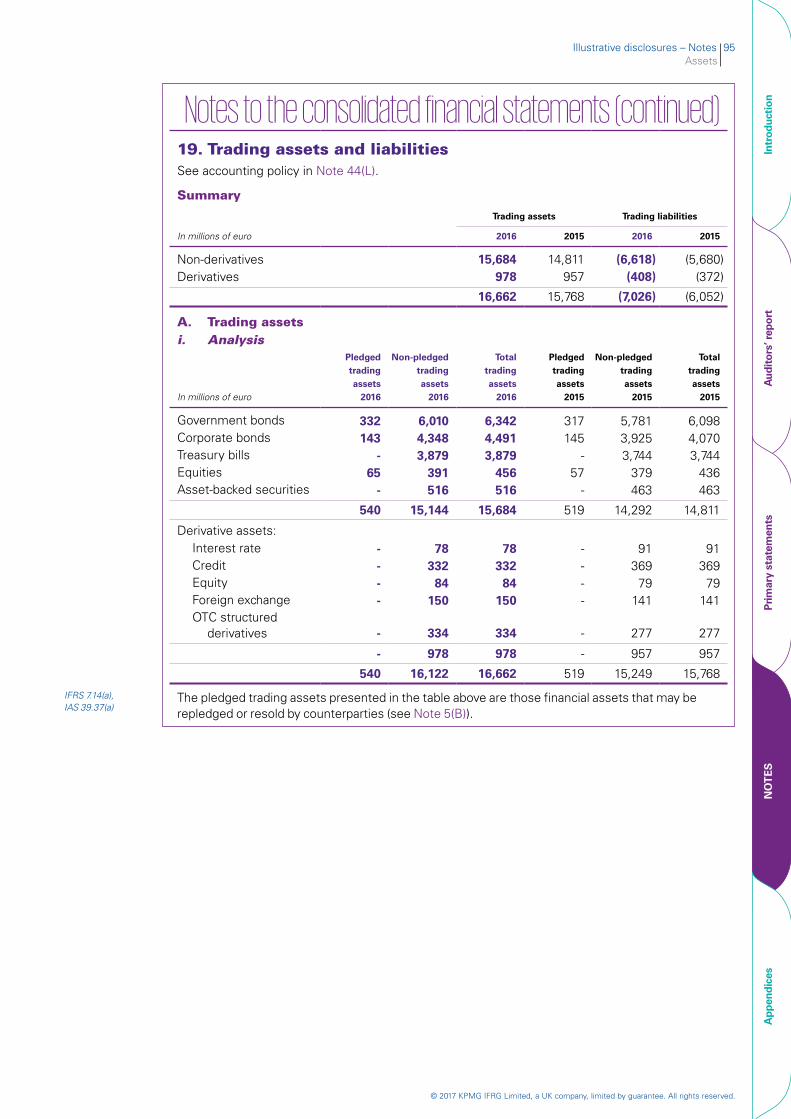
Illustrative disclosures – Notes 95Assets
© 2017 KPMG IFRG Limited, a UK company, limited by guarantee. All rights reserved.
Intr
oduc
tion
Aud
itor
s’ r
epor
tPr
imar
y st
atem
ents
NO
TE
SA
ppen
dice
s
Notes to the consolidated financial statements (continued)19. Trading assets and liabilities See accounting policy in Note 44(L).
Summary
Trading assets Trading liabilities
In millions of euro 2016 2015 2016 2015
Non-derivatives 15,684 14,811 (6,618) (5,680)Derivatives 978 957 (408) (372)
16,662 15,768 (7,026) (6,052)
A. Trading assetsi. Analysis
In millions of euro
Pledgedtradingassets
2016
Non-pledgedtradingassets
2016
Totaltradingassets
2016
Pledged tradingassets
2015
Non-pledgedtradingassets
2015
Totaltradingassets
2015
Government bonds 332 6,010 6,342 317 5,781 6,098Corporate bonds 143 4,348 4,491 145 3,925 4,070Treasury bills - 3,879 3,879 - 3,744 3,744 Equities 65 391 456 57 379 436 Asset-backed securities - 516 516 - 463 463
540 15,144 15,684 519 14,292 14,811
Derivative assets:Interest rate - 78 78 - 91 91 Credit - 332 332 - 369 369 Equity - 84 84 - 79 79 Foreign exchange - 150 150 - 141 141OTC structured
derivatives - 334 334 - 277 277
- 978 978 - 957 957
540 16,122 16,662 519 15,249 15,768
IFRS 7.14(a), IAS 39.37(a)
The pledged trading assets presented in the table above are those financial assets that may be repledged or resold by counterparties (see Note 5(B)).
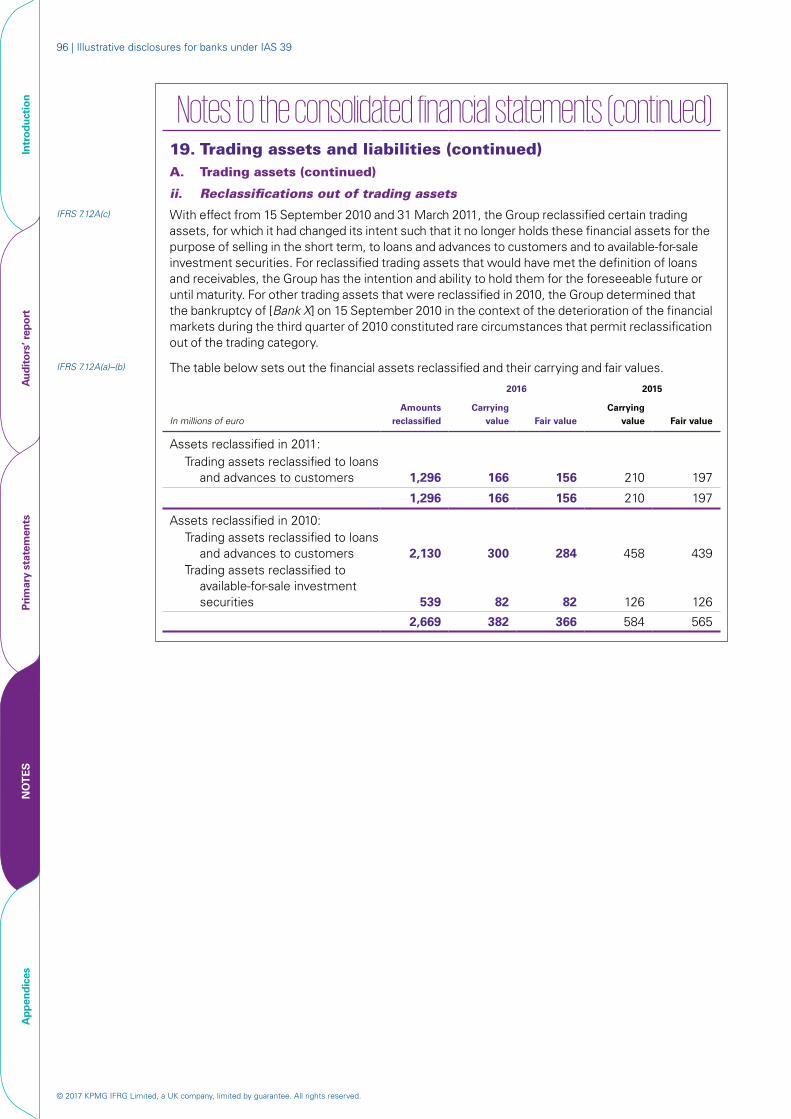
© 2017 KPMG IFRG Limited, a UK company, limited by guarantee. All rights reserved.
96 | Illustrative disclosures for banks under IAS 39
Intr
oduc
tion
Aud
itor
s’ r
epor
tPr
imar
y st
atem
ents
NO
TE
SA
ppen
dice
s
Notes to the consolidated financial statements (continued)19. Trading assets and liabilities (continued)A. Trading assets (continued)
ii. Reclassifications out of trading assets
IFRS 7.12A(c) With effect from 15 September 2010 and 31 March 2011, the Group reclassified certain trading assets, for which it had changed its intent such that it no longer holds these financial assets for the purpose of selling in the short term, to loans and advances to customers and to available-for-sale investment securities. For reclassified trading assets that would have met the definition of loans and receivables, the Group has the intention and ability to hold them for the foreseeable future or until maturity. For other trading assets that were reclassified in 2010, the Group determined that the bankruptcy of [Bank X] on 15 September 2010 in the context of the deterioration of the financial markets during the third quarter of 2010 constituted rare circumstances that permit reclassification out of the trading category.
IFRS 7.12A(a)–(b) The table below sets out the financial assets reclassified and their carrying and fair values.
2016 2015
In millions of euroAmounts
reclassifiedCarrying
value Fair valueCarrying
value Fair value
Assets reclassified in 2011:Trading assets reclassified to loans
and advances to customers 1,296 166 156 210 197
1,296 166 156 210 197
Assets reclassified in 2010:Trading assets reclassified to loans
and advances to customers 2,130 300 284 458 439Trading assets reclassified to
available-for-sale investment securities 539 82 82 126 126
2,669 382 366 584 565
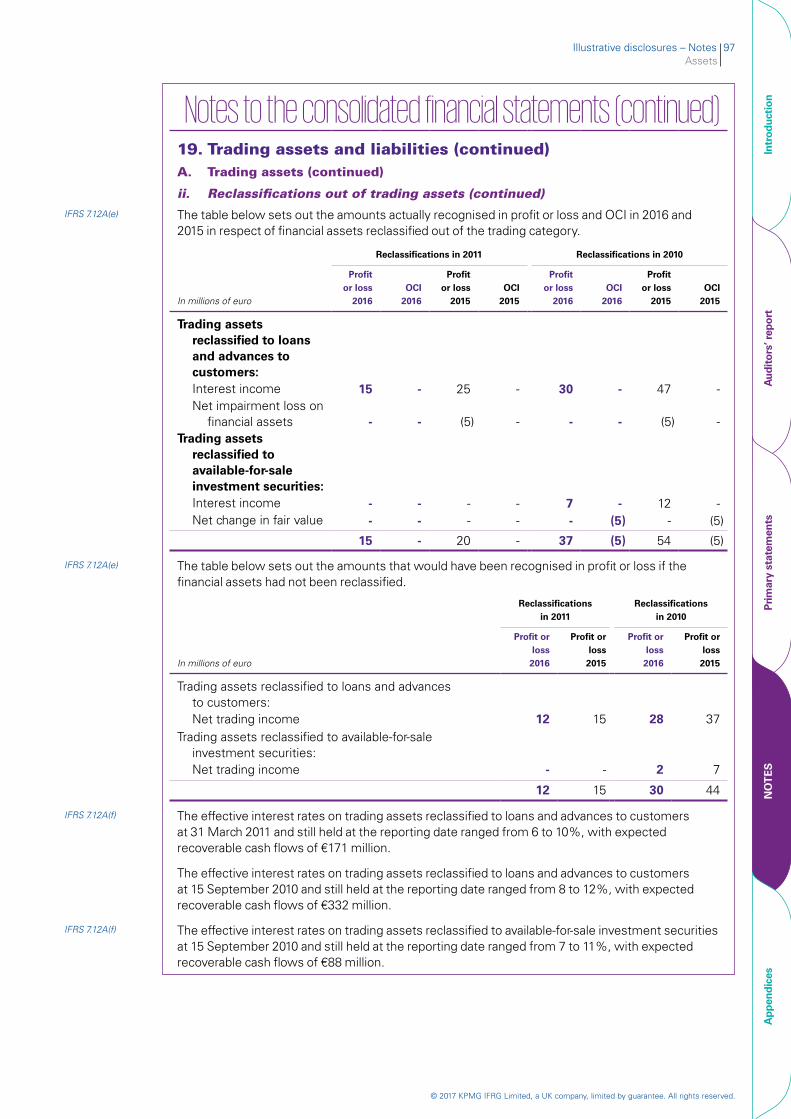
Illustrative disclosures – Notes 97Assets
© 2017 KPMG IFRG Limited, a UK company, limited by guarantee. All rights reserved.
Intr
oduc
tion
Aud
itor
s’ r
epor
tPr
imar
y st
atem
ents
NO
TE
SA
ppen
dice
s
Notes to the consolidated financial statements (continued)
19. Trading assets and liabilities (continued)A. Trading assets (continued)
ii. Reclassifications out of trading assets (continued)
IFRS 7.12A(e) The table below sets out the amounts actually recognised in profit or loss and OCI in 2016 and 2015 in respect of financial assets reclassified out of the trading category.
Reclassifications in 2011 Reclassifications in 2010
Profit or loss OCI
Profit or loss OCI
Profit or loss OCI
Profit or loss OCI
In millions of euro 2016 2016 2015 2015 2016 2016 2015 2015
Trading assets reclassified to loans and advances to customers:Interest income 15 - 25 - 30 - 47 - Net impairment loss on
financial assets - - (5) - - - (5) - Trading assets
reclassified to available-for-sale investment securities:Interest income - - - - 7 - 12 - Net change in fair value - - - - - (5) - (5)
15 - 20 - 37 (5) 54 (5)
IFRS 7.12A(e) The table below sets out the amounts that would have been recognised in profit or loss if the financial assets had not been reclassified.
Reclassifications in 2011
Reclassifications in 2010
In millions of euro
Profit or loss
2016
Profit or loss
2015
Profit or loss
2016
Profit or loss
2015
Trading assets reclassified to loans and advances to customers:
Net trading income 12 15 28 37Trading assets reclassified to available-for-sale
investment securities:Net trading income - - 2 7
12 15 30 44
IFRS 7.12A(f) The effective interest rates on trading assets reclassified to loans and advances to customers at 31 March 2011 and still held at the reporting date ranged from 6 to 10%, with expected recoverable cash flows of €171 million.
The effective interest rates on trading assets reclassified to loans and advances to customers at 15 September 2010 and still held at the reporting date ranged from 8 to 12%, with expected recoverable cash flows of €332 million.
IFRS 7.12A(f) The effective interest rates on trading assets reclassified to available-for-sale investment securities at 15 September 2010 and still held at the reporting date ranged from 7 to 11%, with expected recoverable cash flows of €88 million.
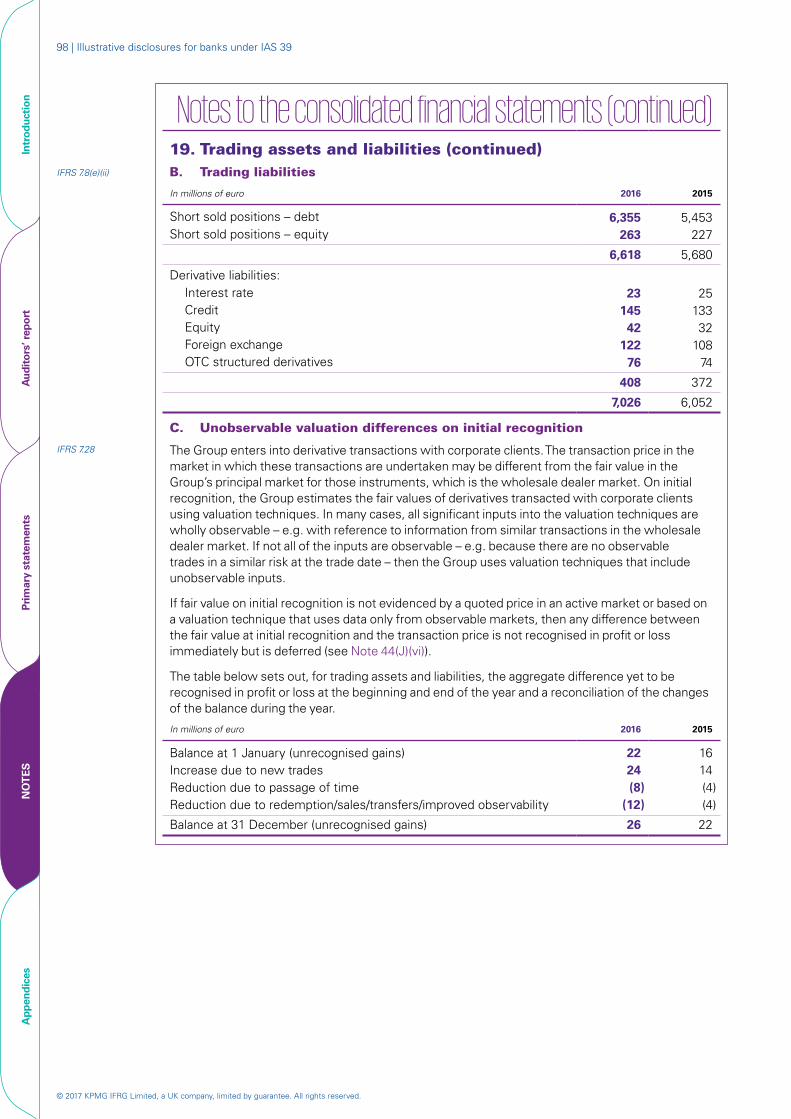
© 2017 KPMG IFRG Limited, a UK company, limited by guarantee. All rights reserved.
98 | Illustrative disclosures for banks under IAS 39
Intr
oduc
tion
Aud
itor
s’ r
epor
tPr
imar
y st
atem
ents
NO
TE
SA
ppen
dice
s
Notes to the consolidated financial statements (continued) 19. Trading assets and liabilities (continued)
IFRS 7.8(e)(ii) B. Trading liabilities
In millions of euro 2016 2015
Short sold positions – debt 6,355 5,453 Short sold positions – equity 263 227
6,618 5,680
Derivative liabilities:Interest rate 23 25 Credit 145 133 Equity 42 32 Foreign exchange 122 108 OTC structured derivatives 76 74
408 372
7,026 6,052
C. Unobservable valuation differences on initial recognition
IFRS 7.28 The Group enters into derivative transactions with corporate clients. The transaction price in the market in which these transactions are undertaken may be different from the fair value in the Group’s principal market for those instruments, which is the wholesale dealer market. On initial recognition, the Group estimates the fair values of derivatives transacted with corporate clients using valuation techniques. In many cases, all significant inputs into the valuation techniques are wholly observable – e.g. with reference to information from similar transactions in the wholesale dealer market. If not all of the inputs are observable – e.g. because there are no observable trades in a similar risk at the trade date – then the Group uses valuation techniques that include unobservable inputs.
If fair value on initial recognition is not evidenced by a quoted price in an active market or based on a valuation technique that uses data only from observable markets, then any difference between the fair value at initial recognition and the transaction price is not recognised in profit or loss immediately but is deferred (see Note 44(J)(vi)).
The table below sets out, for trading assets and liabilities, the aggregate difference yet to be recognised in profit or loss at the beginning and end of the year and a reconciliation of the changes of the balance during the year.
In millions of euro 2016 2015
Balance at 1 January (unrecognised gains) 22 16 Increase due to new trades 24 14 Reduction due to passage of time (8) (4)Reduction due to redemption/sales/transfers/improved observability (12) (4)
Balance at 31 December (unrecognised gains) 26 22
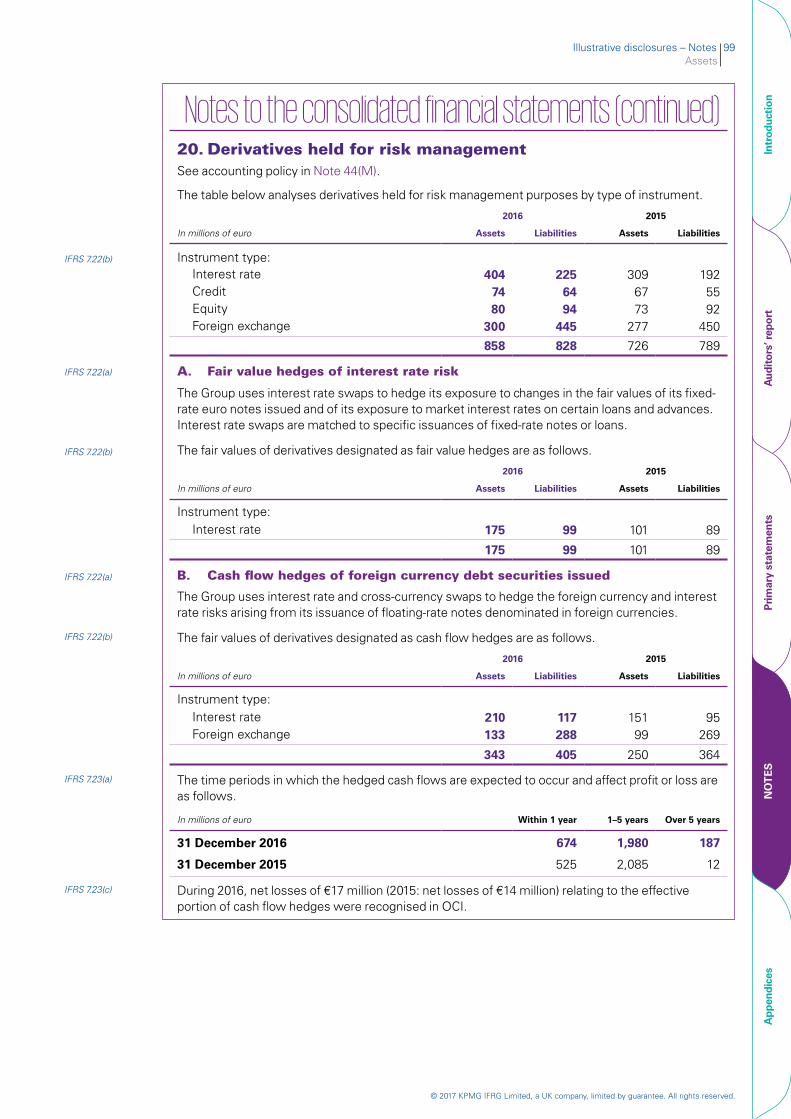
Illustrative disclosures – Notes 99Assets
© 2017 KPMG IFRG Limited, a UK company, limited by guarantee. All rights reserved.
Intr
oduc
tion
Aud
itor
s’ r
epor
tPr
imar
y st
atem
ents
NO
TE
SA
ppen
dice
s
Notes to the consolidated financial statements (continued) 20. Derivatives held for risk managementSee accounting policy in Note 44(M).
The table below analyses derivatives held for risk management purposes by type of instrument.
2016 2015
In millions of euro Assets Liabilities Assets Liabilities
IFRS 7.22(b) Instrument type:Interest rate 404 225 309 192 Credit 74 64 67 55 Equity 80 94 73 92 Foreign exchange 300 445 277 450
858 828 726 789
IFRS 7.22(a) A. Fair value hedges of interest rate risk
The Group uses interest rate swaps to hedge its exposure to changes in the fair values of its fixed-rate euro notes issued and of its exposure to market interest rates on certain loans and advances. Interest rate swaps are matched to specific issuances of fixed-rate notes or loans.
IFRS 7.22(b) The fair values of derivatives designated as fair value hedges are as follows.
2016 2015
In millions of euro Assets Liabilities Assets Liabilities
Instrument type:Interest rate 175 99 101 89
175 99 101 89
IFRS 7.22(a) B. Cash flow hedges of foreign currency debt securities issued
The Group uses interest rate and cross-currency swaps to hedge the foreign currency and interest rate risks arising from its issuance of floating-rate notes denominated in foreign currencies.
IFRS 7.22(b) The fair values of derivatives designated as cash flow hedges are as follows.
2016 2015
In millions of euro Assets Liabilities Assets Liabilities
Instrument type:Interest rate 210 117 151 95 Foreign exchange 133 288 99 269
343 405 250 364
IFRS 7.23(a) The time periods in which the hedged cash flows are expected to occur and affect profit or loss are as follows.
In millions of euro Within 1 year 1–5 years Over 5 years
31 December 2016 674 1,980 187
31 December 2015 525 2,085 12
IFRS 7.23(c) During 2016, net losses of €17 million (2015: net losses of €14 million) relating to the effective portion of cash flow hedges were recognised in OCI.
© 2017 KPMG IFRG Limited, a UK company, limited by guarantee. All rights reserved.
100 | Illustrative disclosures for banks under IAS 39
Intr
oduc
tion
Aud
itor
s’ r
epor
tPr
imar
y st
atem
ents
NO
TE
SA
ppen
dice
s
Notes to the consolidated financial statements (continued) 20. Derivatives held for risk management (continued)
IFRS 7.22(a) C. Net investment hedges
The Group uses a mixture of forward foreign exchange contracts and foreign currency-denominated debt to hedge the foreign currency translation risk on its net investment in foreign subsidiaries.
IFRS 7.22(b) The fair value of derivatives designated as net investment hedges is as follows.
2016 2015
In millions of euro Assets Liabilities Assets Liabilities
Instrument type:Foreign exchange 85 93 77 78
85 93 77 78
US dollar-denominated debt, which is included within debt securities issued (see Note 29), is used to hedge the net investment in the Group’s subsidiaries in the Americas with a US dollar functional currency and had a fair value of €965 million (2015: €831 million) at the reporting date.
D. Other derivatives held for risk management
The Group uses other derivatives, not designated in a qualifying hedge relationship, to manage its exposure to foreign currency, interest rate, equity market and credit risks. The instruments used include interest rate swaps, cross-currency swaps, forward contracts, futures, options, credit swaps and equity swaps.
Illustrative disclosures – Notes 101Assets
© 2017 KPMG IFRG Limited, a UK company, limited by guarantee. All rights reserved.
Intr
oduc
tion
Aud
itor
s’ r
epor
tPr
imar
y st
atem
ents
NO
TE
SA
ppen
dice
s
Notes to the consolidated financial statements (continued) 21. Loans and advances to banksSee accounting policy in Note 44(N).
In millions of euro 2016 2015
Reverse sale and repurchase agreements 1,500 1,278Other 4,084 3,434Less individual allowance for impairment (12) (5)
5,572 4,707
IFRS 7.16 Individual allowance for impairmentBalance at 1 January 5 -
IFRS 7.20(e) Charge for the year 7 5Effect of foreign currency movements 1 - Unwind of discount (1) -
Balance at 31 December 12 5
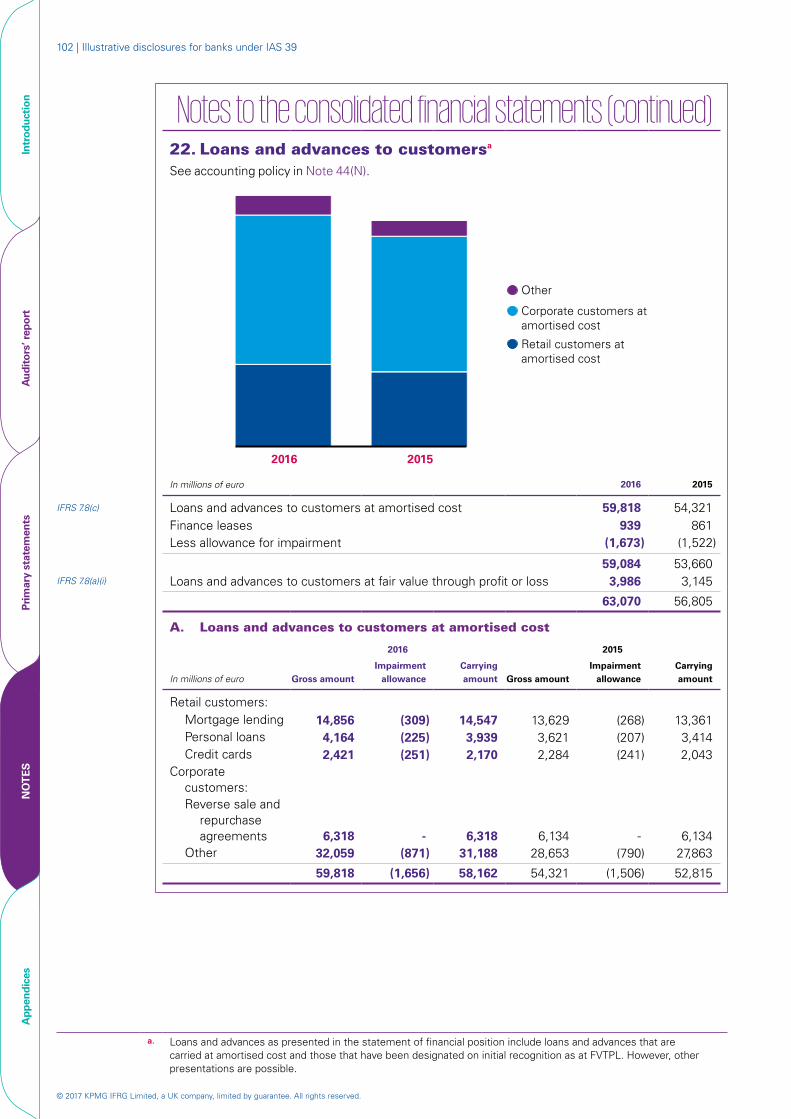
© 2017 KPMG IFRG Limited, a UK company, limited by guarantee. All rights reserved.
102 | Illustrative disclosures for banks under IAS 39
Intr
oduc
tion
Aud
itor
s’ r
epor
tPr
imar
y st
atem
ents
NO
TE
SA
ppen
dice
s
Notes to the consolidated financial statements (continued)22. Loans and advances to customersa See accounting policy in Note 44(N).
Corporate customers atamortised cost
Other
2016 2015
Retail customers atamortised cost
In millions of euro 2016 2015
IFRS 7.8(c) Loans and advances to customers at amortised cost 59,818 54,321Finance leases 939 861Less allowance for impairment (1,673) (1,522)
59,084 53,660IFRS 7.8(a)(i) Loans and advances to customers at fair value through profit or loss 3,986 3,145
63,070 56,805
A. Loans and advances to customers at amortised cost
2016 2015
In millions of euro Gross amountImpairment
allowanceCarrying amount Gross amount
Impairment allowance
Carrying amount
Retail customers:Mortgage lending 14,856 (309) 14,547 13,629 (268) 13,361 Personal loans 4,164 (225) 3,939 3,621 (207) 3,414 Credit cards 2,421 (251) 2,170 2,284 (241) 2,043
Corporate customers:Reverse sale and
repurchase agreements 6,318 - 6,318 6,134 - 6,134
Other 32,059 (871) 31,188 28,653 (790) 27,863
59,818 (1,656) 58,162 54,321 (1,506) 52,815
a. Loans and advances as presented in the statement of financial position include loans and advances that are carried at amortised cost and those that have been designated on initial recognition as at FVTPL. However, other presentations are possible.
Illustrative disclosures – Notes 103Assets
© 2017 KPMG IFRG Limited, a UK company, limited by guarantee. All rights reserved.
Intr
oduc
tion
Aud
itor
s’ r
epor
tPr
imar
y st
atem
ents
NO
TE
SA
ppen
dice
s
Notes to the consolidated financial statements (continued)22. Loans and advances to customers (continued)
IAS 17.47 B. Finance lease receivables
IAS 17.47(f) The table below provides an analysis of finance lease receivables for leases of certain property and equipment in which the Group is the lessor.
In millions of euro 2016 2015
IAS 17.47(a) Gross investment in finance leases, receivable:IAS 17.47(a)(i) Less than one year 251 203 IAS 17.47(a)(ii) Between one and five years 805 741 IAS 17.47(a)(iii) More than five years 104 106
1,160 1,050IAS 17.47(b) Unearned finance income (221) (189)
Net investment in finance leases 939 861 Less impairment allowance (17) (16)
922 845
IAS 17.47(a) Net investment in finance leases, receivable:IAS 17.47(a)(i) Less than one year 205 181 IAS 17.47(a)(ii) Between one and five years 650 597 IAS 17.47(a)(iii) More than five years 84 83
939 861
C. Allowance for impairment
In millions of euro 2016 2015
IFRS 7.16 Individual allowance for impairmentBalance at 1 January 791 600
IFRS 7.20(e) Charge for the year 197 191 IFRS 7.20(e) Recoveries (18) (3)
Effect of foreign currency movements 7 9 Unwind of discounting (10) (6)Write-offs (47) -
Balance at 31 December 920 791
IFRS 7.16 Collective allowance for impairmentBalance at 1 January 731 706
IFRS 7.20(e) Charge for the year 31 34IFRS 7.20(e) Recoveries (9) (10)
Other movements - 1
Balance at 31 December 753 731
Total allowance for impairment 1,673 1,522
D. Loans and advances to customers at FVTPL
Loans and advances to customers held by the investment banking business have been designated as at FVTPL because the Group manages these loans and advances on a fair value basis in accordance with its documented investment strategy. Internal reporting and performance measurement of these loans and advances are on a fair value basis.
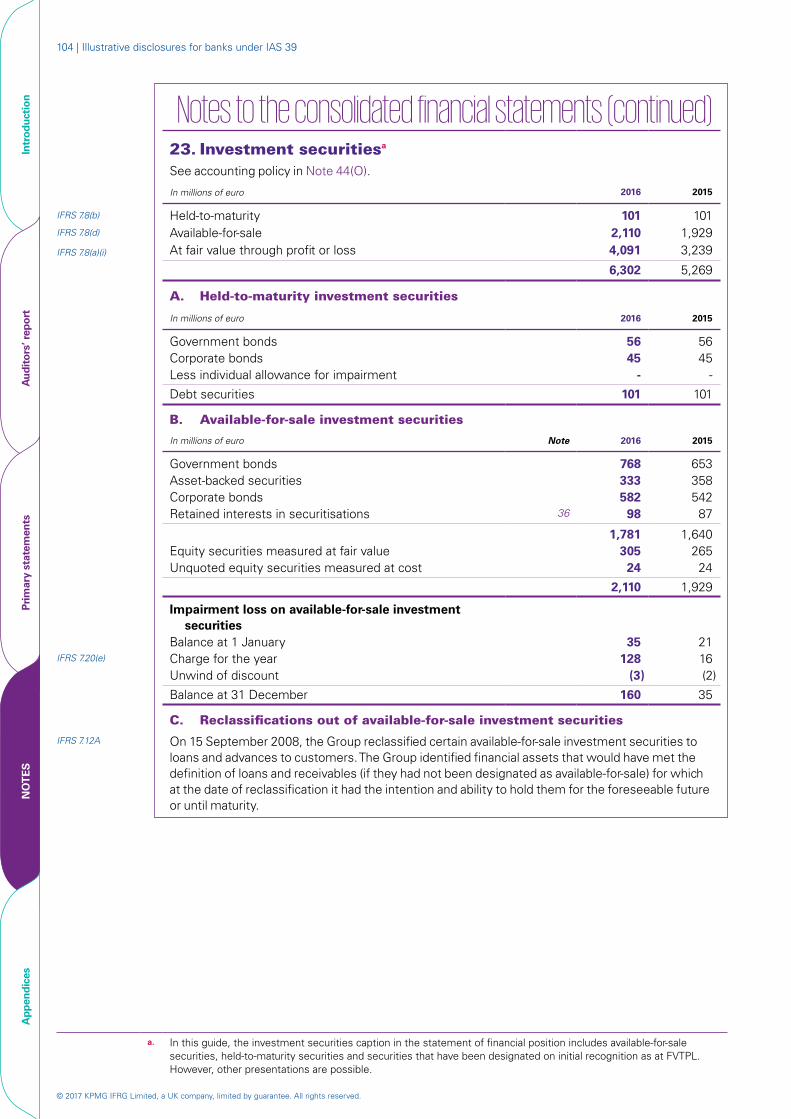
© 2017 KPMG IFRG Limited, a UK company, limited by guarantee. All rights reserved.
104 | Illustrative disclosures for banks under IAS 39
Intr
oduc
tion
Aud
itor
s’ r
epor
tPr
imar
y st
atem
ents
NO
TE
SA
ppen
dice
s
Notes to the consolidated financial statements (continued)23. Investment securitiesa See accounting policy in Note 44(O).
In millions of euro 2016 2015
IFRS 7.8(b) Held-to-maturity 101 101IFRS 7.8(d) Available-for-sale 2,110 1,929IFRS 7.8(a)(i) At fair value through profit or loss 4,091 3,239
6,302 5,269
A. Held-to-maturity investment securities
In millions of euro 2016 2015
Government bonds 56 56 Corporate bonds 45 45 Less individual allowance for impairment - -
Debt securities 101 101
B. Available-for-sale investment securities
In millions of euro Note 2016 2015
Government bonds 768 653Asset-backed securities 333 358 Corporate bonds 582 542 Retained interests in securitisations 36 98 87
1,781 1,640Equity securities measured at fair value 305 265 Unquoted equity securities measured at cost 24 24
2,110 1,929
Impairment loss on available-for-sale investment securities
Balance at 1 January 35 21 IFRS 7.20(e) Charge for the year 128 16
Unwind of discount (3) (2)
Balance at 31 December 160 35
C. Reclassifications out of available-for-sale investment securities
IFRS 7.12A On 15 September 2008, the Group reclassified certain available-for-sale investment securities to loans and advances to customers. The Group identified financial assets that would have met the definition of loans and receivables (if they had not been designated as available-for-sale) for which at the date of reclassification it had the intention and ability to hold them for the foreseeable future or until maturity.
a. In this guide, the investment securities caption in the statement of financial position includes available-for-sale securities, held-to-maturity securities and securities that have been designated on initial recognition as at FVTPL. However, other presentations are possible.
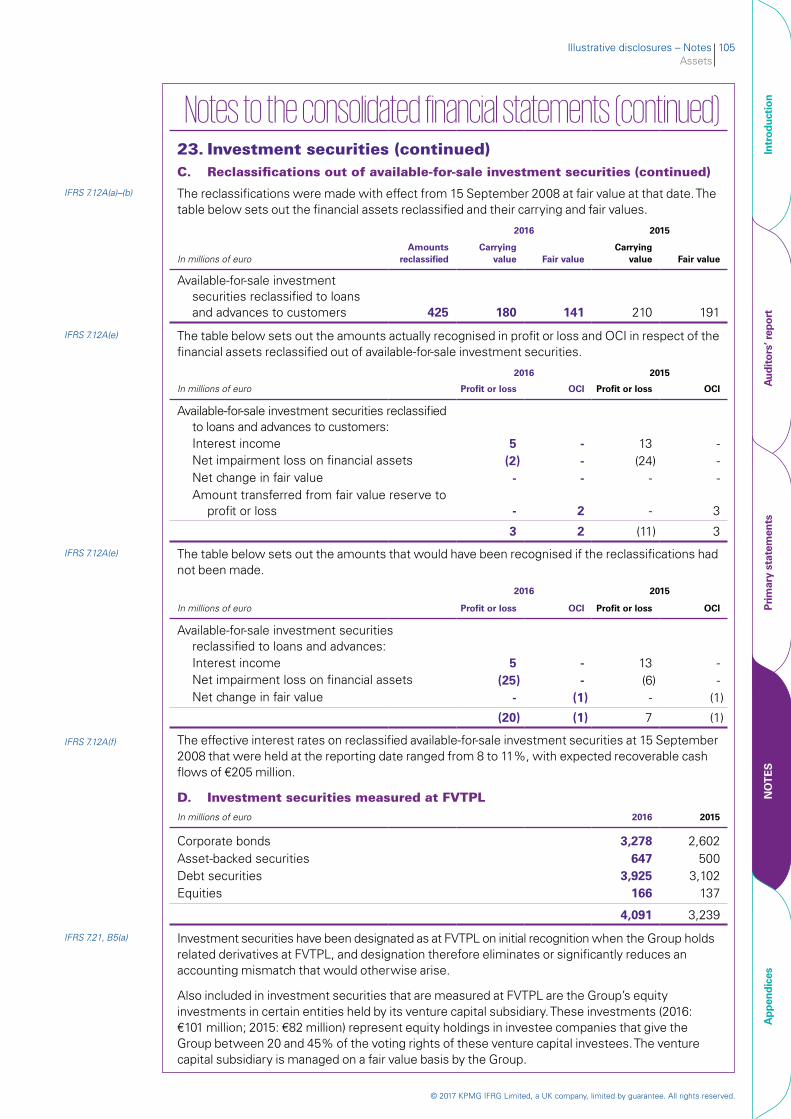
Illustrative disclosures – Notes 105Assets
© 2017 KPMG IFRG Limited, a UK company, limited by guarantee. All rights reserved.
Intr
oduc
tion
Aud
itor
s’ r
epor
tPr
imar
y st
atem
ents
NO
TE
SA
ppen
dice
s
Notes to the consolidated financial statements (continued) 23. Investment securities (continued)C. Reclassifications out of available-for-sale investment securities (continued)
IFRS 7.12A(a)–(b) The reclassifications were made with effect from 15 September 2008 at fair value at that date. The table below sets out the financial assets reclassified and their carrying and fair values.
2016 2015
In millions of euroAmounts
reclassifiedCarrying
value Fair valueCarrying
value Fair value
Available-for-sale investment securities reclassified to loans and advances to customers 425 180 141 210 191
IFRS 7.12A(e) The table below sets out the amounts actually recognised in profit or loss and OCI in respect of the financial assets reclassified out of available-for-sale investment securities.
2016 2015
In millions of euro Profit or loss OCI Profit or loss OCI
Available-for-sale investment securities reclassified to loans and advances to customers:Interest income 5 - 13 -Net impairment loss on financial assets (2) - (24) -Net change in fair value - - - -Amount transferred from fair value reserve to
profit or loss - 2 - 3
3 2 (11) 3
IFRS 7.12A(e) The table below sets out the amounts that would have been recognised if the reclassifications had not been made.
2016 2015
In millions of euro Profit or loss OCI Profit or loss OCI
Available-for-sale investment securities reclassified to loans and advances:Interest income 5 - 13 -Net impairment loss on financial assets (25) - (6) -Net change in fair value - (1) - (1)
(20) (1) 7 (1)
IFRS 7.12A(f) The effective interest rates on reclassified available-for-sale investment securities at 15 September 2008 that were held at the reporting date ranged from 8 to 11%, with expected recoverable cash flows of €205 million.
D. Investment securities measured at FVTPLIn millions of euro 2016 2015
Corporate bonds 3,278 2,602Asset-backed securities 647 500Debt securities 3,925 3,102Equities 166 137
4,091 3,239
IFRS 7.21, B5(a) Investment securities have been designated as at FVTPL on initial recognition when the Group holds related derivatives at FVTPL, and designation therefore eliminates or significantly reduces an accounting mismatch that would otherwise arise.
Also included in investment securities that are measured at FVTPL are the Group’s equity investments in certain entities held by its venture capital subsidiary. These investments (2016: €101 million; 2015: €82 million) represent equity holdings in investee companies that give the Group between 20 and 45% of the voting rights of these venture capital investees. The venture capital subsidiary is managed on a fair value basis by the Group.
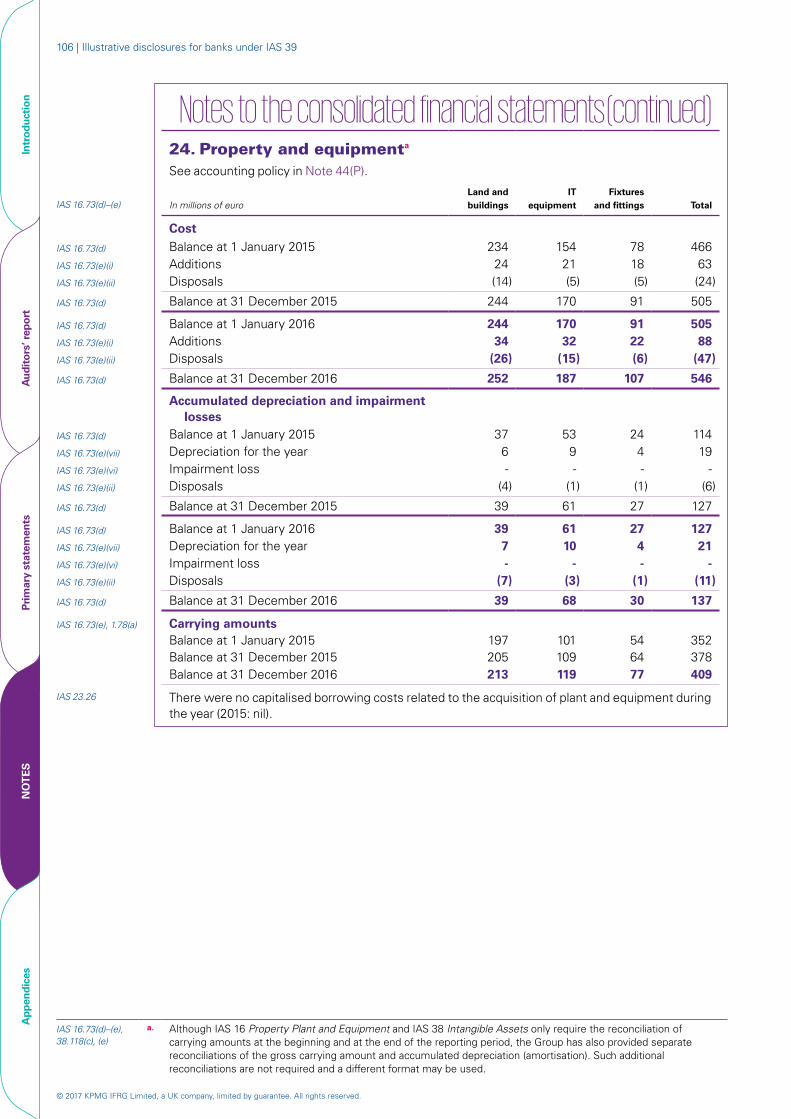
© 2017 KPMG IFRG Limited, a UK company, limited by guarantee. All rights reserved.
106 | Illustrative disclosures for banks under IAS 39
Intr
oduc
tion
Aud
itor
s’ r
epor
tPr
imar
y st
atem
ents
NO
TE
SA
ppen
dice
s
Notes to the consolidated financial statements (continued)24. Property and equipmenta See accounting policy in Note 44(P).
IAS 16.73(d)–(e) In millions of euro Land and buildings
IT equipment
Fixtures and fittings Total
Cost
IAS 16.73(d) Balance at 1 January 2015 234 154 78 466IAS 16.73(e)(i) Additions 24 21 18 63IAS 16.73(e)(ii) Disposals (14) (5) (5) (24)
IAS 16.73(d) Balance at 31 December 2015 244 170 91 505
IAS 16.73(d) Balance at 1 January 2016 244 170 91 505IAS 16.73(e)(i) Additions 34 32 22 88IAS 16.73(e)(ii) Disposals (26) (15) (6) (47)
IAS 16.73(d) Balance at 31 December 2016 252 187 107 546
Accumulated depreciation and impairment losses
IAS 16.73(d) Balance at 1 January 2015 37 53 24 114IAS 16.73(e)(vii) Depreciation for the year 6 9 4 19IAS 16.73(e)(vi) Impairment loss - - - -IAS 16.73(e)(ii) Disposals (4) (1) (1) (6)
IAS 16.73(d) Balance at 31 December 2015 39 61 27 127
IAS 16.73(d) Balance at 1 January 2016 39 61 27 127IAS 16.73(e)(vii) Depreciation for the year 7 10 4 21IAS 16.73(e)(vi) Impairment loss - - - -IAS 16.73(e)(ii) Disposals (7) (3) (1) (11)
IAS 16.73(d) Balance at 31 December 2016 39 68 30 137
IAS 16.73(e), 1.78(a) Carrying amounts Balance at 1 January 2015 197 101 54 352 Balance at 31 December 2015 205 109 64 378 Balance at 31 December 2016 213 119 77 409
IAS 23.26 There were no capitalised borrowing costs related to the acquisition of plant and equipment during the year (2015: nil).
IAS 16.73(d)–(e), 38.118(c), (e)
a. Although IAS 16 Property Plant and Equipment and IAS 38 Intangible Assets only require the reconciliation of carrying amounts at the beginning and at the end of the reporting period, the Group has also provided separate reconciliations of the gross carrying amount and accumulated depreciation (amortisation). Such additional reconciliations are not required and a different format may be used.
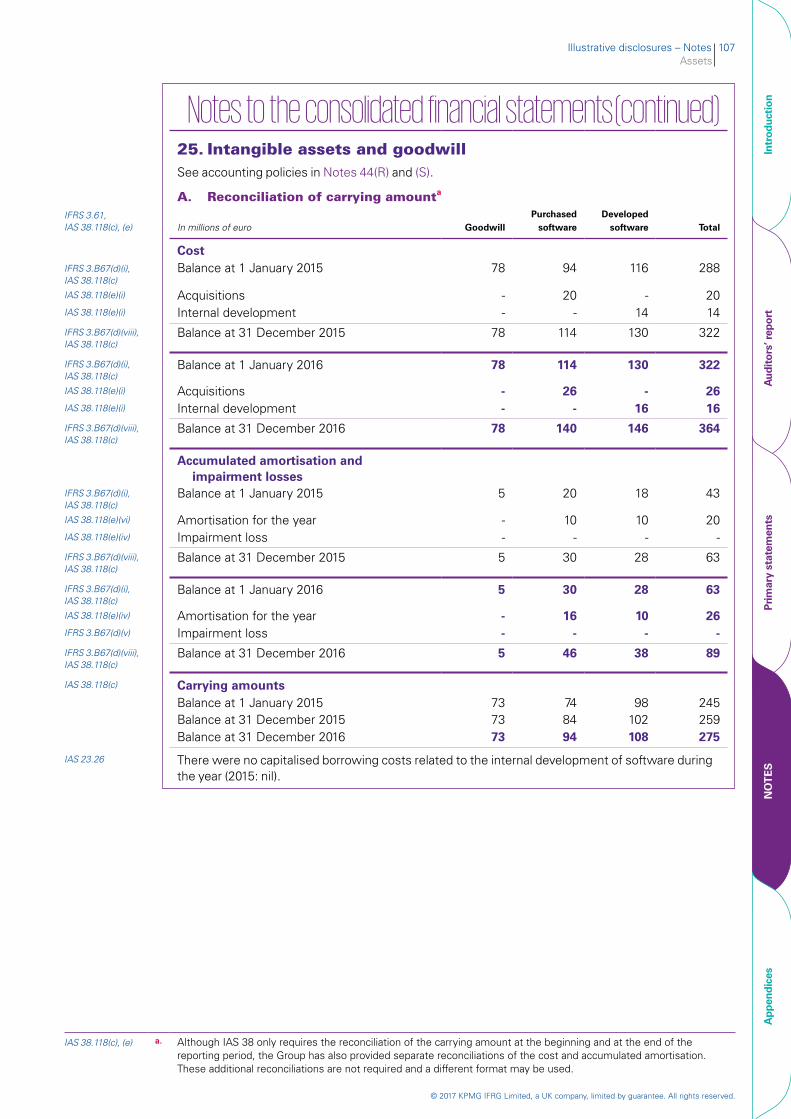
Illustrative disclosures – Notes 107Assets
© 2017 KPMG IFRG Limited, a UK company, limited by guarantee. All rights reserved.
Intr
oduc
tion
Aud
itor
s’ r
epor
tPr
imar
y st
atem
ents
NO
TE
SA
ppen
dice
s
Notes to the consolidated financial statements (continued)25. Intangible assets and goodwillSee accounting policies in Notes 44(R) and (S).
A. Reconciliation of carrying amounta IFRS 3.61, IAS 38.118(c), (e) In millions of euro Goodwill
Purchased software
Developed software Total
CostIFRS 3.B67(d)(i), IAS 38.118(c)
Balance at 1 January 2015 78 94 116 288
IAS 38.118(e)(i) Acquisitions - 20 - 20IAS 38.118(e)(i) Internal development - - 14 14IFRS 3.B67(d)(viii), IAS 38.118(c)
Balance at 31 December 2015 78 114 130 322
IFRS 3.B67(d)(i), IAS 38.118(c)
Balance at 1 January 2016 78 114 130 322
IAS 38.118(e)(i) Acquisitions - 26 - 26IAS 38.118(e)(i) Internal development - - 16 16IFRS 3.B67(d)(viii), IAS 38.118(c)
Balance at 31 December 2016 78 140 146 364
Accumulated amortisation and impairment losses
IFRS 3.B67(d)(i), IAS 38.118(c)
Balance at 1 January 2015 5 20 18 43
IAS 38.118(e)(vi) Amortisation for the year - 10 10 20IAS 38.118(e)(iv) Impairment loss - - - -IFRS 3.B67(d)(viii), IAS 38.118(c)
Balance at 31 December 2015 5 30 28 63
IFRS 3.B67(d)(i), IAS 38.118(c)
Balance at 1 January 2016 5 30 28 63
IAS 38.118(e)(iv) Amortisation for the year - 16 10 26IFRS 3.B67(d)(v) Impairment loss - - - -IFRS 3.B67(d)(viii), IAS 38.118(c)
Balance at 31 December 2016 5 46 38 89
IAS 38.118(c) Carrying amountsBalance at 1 January 2015 73 74 98 245Balance at 31 December 2015 73 84 102 259Balance at 31 December 2016 73 94 108 275
IAS 23.26 There were no capitalised borrowing costs related to the internal development of software during the year (2015: nil).
IAS 38.118(c), (e) a. Although IAS 38 only requires the reconciliation of the carrying amount at the beginning and at the end of the reporting period, the Group has also provided separate reconciliations of the cost and accumulated amortisation. These additional reconciliations are not required and a different format may be used.
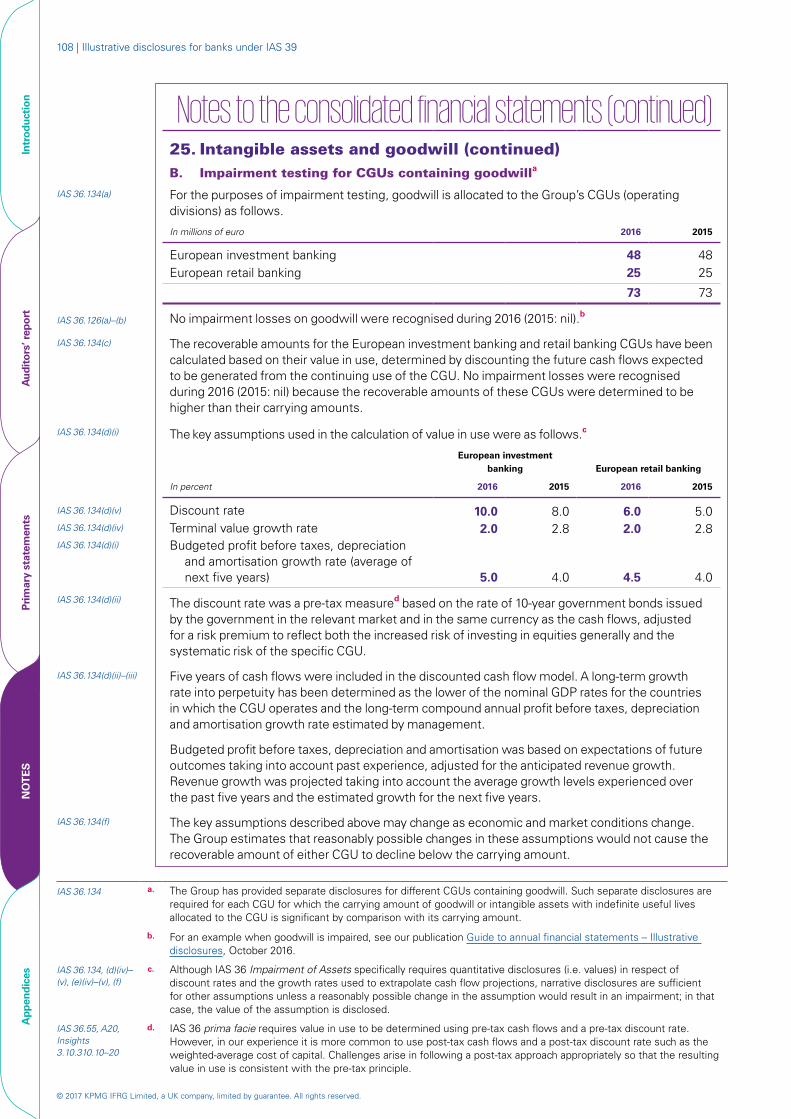
© 2017 KPMG IFRG Limited, a UK company, limited by guarantee. All rights reserved.
108 | Illustrative disclosures for banks under IAS 39
Intr
oduc
tion
Aud
itor
s’ r
epor
tPr
imar
y st
atem
ents
NO
TE
SA
ppen
dice
s
Notes to the consolidated financial statements (continued) 25. Intangible assets and goodwill (continued)B. Impairment testing for CGUs containing goodwilla
IAS 36.134(a) For the purposes of impairment testing, goodwill is allocated to the Group’s CGUs (operating divisions) as follows.
In millions of euro 2016 2015
European investment banking 48 48European retail banking 25 25
73 73
IAS 36.126(a)–(b) No impairment losses on goodwill were recognised during 2016 (2015: nil).b
IAS 36.134(c) The recoverable amounts for the European investment banking and retail banking CGUs have been calculated based on their value in use, determined by discounting the future cash flows expected to be generated from the continuing use of the CGU. No impairment losses were recognised during 2016 (2015: nil) because the recoverable amounts of these CGUs were determined to be higher than their carrying amounts.
IAS 36.134(d)(i) The key assumptions used in the calculation of value in use were as follows.c
European investment banking European retail banking
In percent 2016 2015 2016 2015
IAS 36.134(d)(v) Discount rate 10.0 8.0 6.0 5.0IAS 36.134(d)(iv) Terminal value growth rate 2.0 2.8 2.0 2.8IAS 36.134(d)(i) Budgeted profit before taxes, depreciation
and amortisation growth rate (average of next five years) 5.0 4.0 4.5 4.0
IAS 36.134(d)(ii) The discount rate was a pre-tax measured based on the rate of 10-year government bonds issued by the government in the relevant market and in the same currency as the cash flows, adjusted for a risk premium to reflect both the increased risk of investing in equities generally and the systematic risk of the specific CGU.
IAS 36.134(d)(ii)–(iii) Five years of cash flows were included in the discounted cash flow model. A long-term growth rate into perpetuity has been determined as the lower of the nominal GDP rates for the countries in which the CGU operates and the long-term compound annual profit before taxes, depreciation and amortisation growth rate estimated by management.
Budgeted profit before taxes, depreciation and amortisation was based on expectations of future outcomes taking into account past experience, adjusted for the anticipated revenue growth. Revenue growth was projected taking into account the average growth levels experienced over the past five years and the estimated growth for the next five years.
IAS 36.134(f) The key assumptions described above may change as economic and market conditions change. The Group estimates that reasonably possible changes in these assumptions would not cause the recoverable amount of either CGU to decline below the carrying amount.
IAS 36.134 a. The Group has provided separate disclosures for different CGUs containing goodwill. Such separate disclosures are required for each CGU for which the carrying amount of goodwill or intangible assets with indefinite useful lives allocated to the CGU is significant by comparison with its carrying amount.
b. For an example when goodwill is impaired, see our publication Guide to annual financial statements – Illustrative disclosures, October 2016.
IAS 36.134, (d)(iv)–(v), (e)(iv)–(v), (f)
c. Although IAS 36 Impairment of Assets specifically requires quantitative disclosures (i.e. values) in respect of discount rates and the growth rates used to extrapolate cash flow projections, narrative disclosures are sufficient for other assumptions unless a reasonably possible change in the assumption would result in an impairment; in that case, the value of the assumption is disclosed.
IAS 36.55, A20, Insights 3.10.310.10–20
d. IAS 36 prima facie requires value in use to be determined using pre-tax cash flows and a pre-tax discount rate. However, in our experience it is more common to use post-tax cash flows and a post-tax discount rate such as the weighted-average cost of capital. Challenges arise in following a post-tax approach appropriately so that the resulting value in use is consistent with the pre-tax principle.
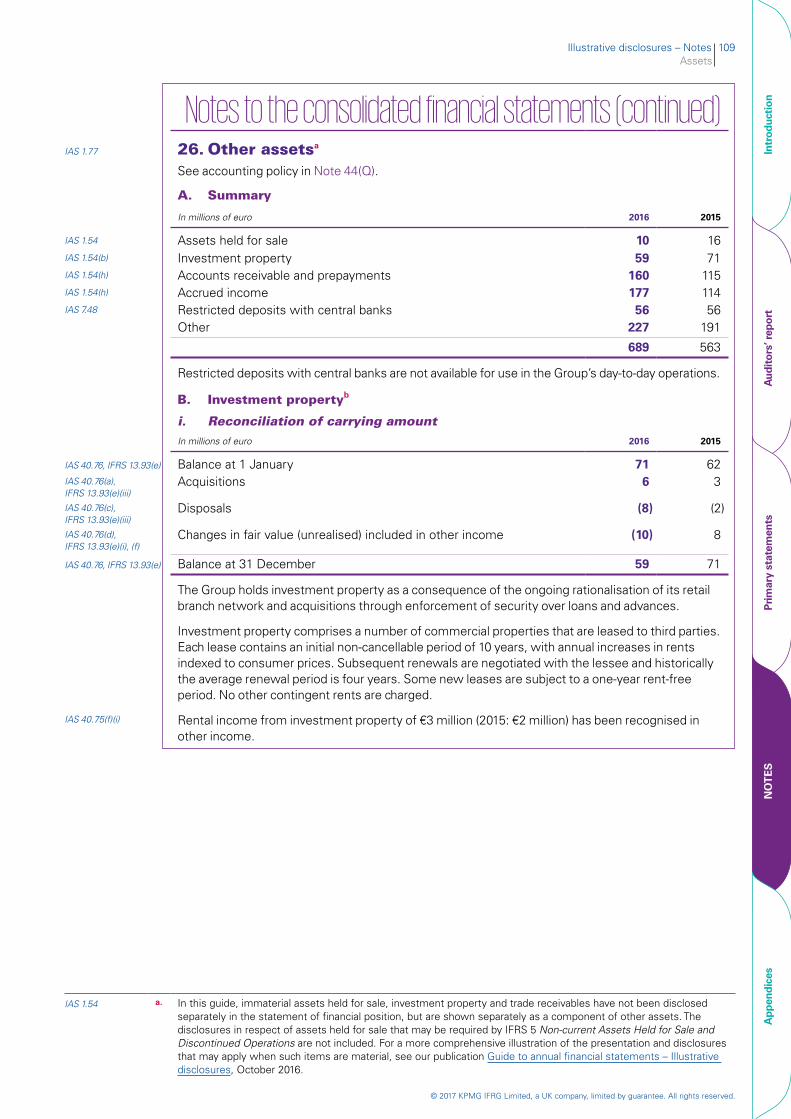
Illustrative disclosures – Notes 109Assets
© 2017 KPMG IFRG Limited, a UK company, limited by guarantee. All rights reserved.
Intr
oduc
tion
Aud
itor
s’ r
epor
tPr
imar
y st
atem
ents
NO
TE
SA
ppen
dice
s
Notes to the consolidated financial statements (continued)IAS 1.77 26. Other assetsa
See accounting policy in Note 44(Q).
A. Summary
In millions of euro 2016 2015
IAS 1.54 Assets held for sale 10 16IAS 1.54(b) Investment property 59 71IAS 1.54(h) Accounts receivable and prepayments 160 115IAS 1.54(h) Accrued income 177 114IAS 7.48 Restricted deposits with central banks 56 56
Other 227 191
689 563
Restricted deposits with central banks are not available for use in the Group’s day-to-day operations.
B. Investment propertyb
i. Reconciliation of carrying amountIn millions of euro 2016 2015
IAS 40.76, IFRS 13.93(e) Balance at 1 January 71 62IAS 40.76(a), IFRS 13.93(e)(iii)
Acquisitions 6 3
IAS 40.76(c), IFRS 13.93(e)(iii)
Disposals (8) (2)
IAS 40.76(d), IFRS 13.93(e)(i), (f)
Changes in fair value (unrealised) included in other income (10) 8
IAS 40.76, IFRS 13.93(e) Balance at 31 December 59 71
The Group holds investment property as a consequence of the ongoing rationalisation of its retail branch network and acquisitions through enforcement of security over loans and advances.
Investment property comprises a number of commercial properties that are leased to third parties. Each lease contains an initial non-cancellable period of 10 years, with annual increases in rents indexed to consumer prices. Subsequent renewals are negotiated with the lessee and historically the average renewal period is four years. Some new leases are subject to a one-year rent-free period. No other contingent rents are charged.
IAS 40.75(f)(i) Rental income from investment property of €3 million (2015: €2 million) has been recognised in other income.
IAS 1.54 a. In this guide, immaterial assets held for sale, investment property and trade receivables have not been disclosed separately in the statement of financial position, but are shown separately as a component of other assets. The disclosures in respect of assets held for sale that may be required by IFRS 5 Non-current Assets Held for Sale and Discontinued Operations are not included. For a more comprehensive illustration of the presentation and disclosures that may apply when such items are material, see our publication Guide to annual financial statements – Illustrative disclosures, October 2016.
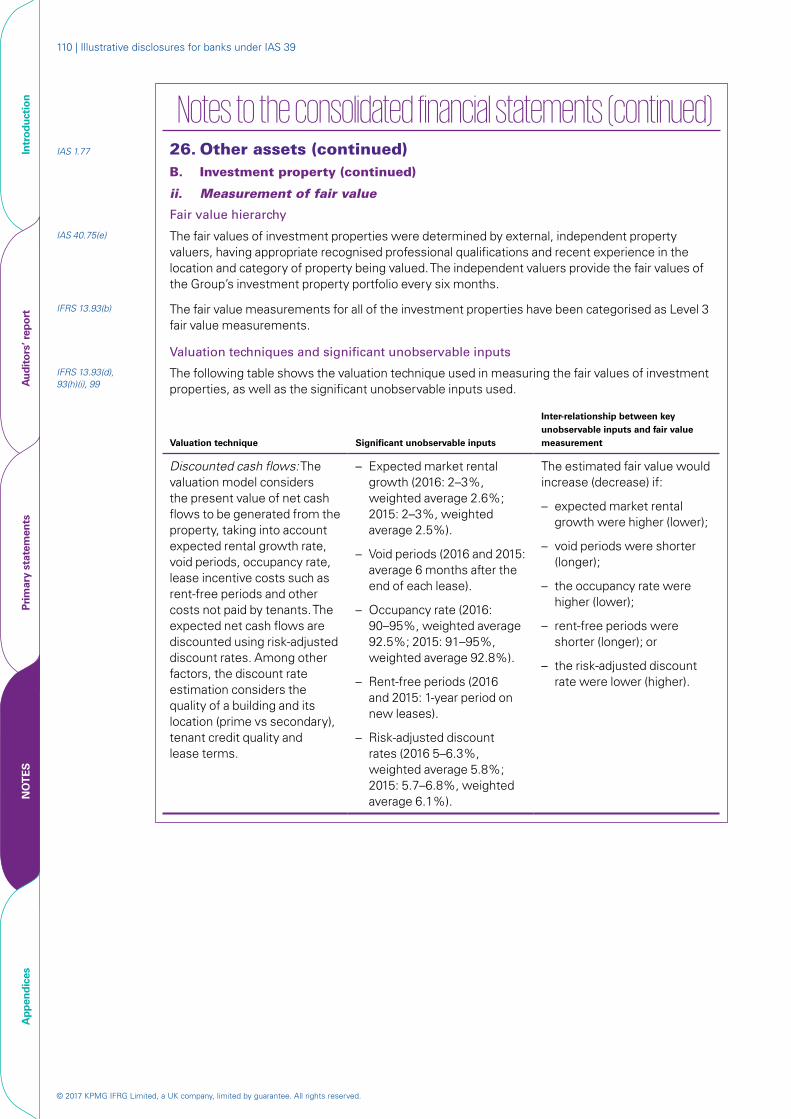
© 2017 KPMG IFRG Limited, a UK company, limited by guarantee. All rights reserved.
110 | Illustrative disclosures for banks under IAS 39
Intr
oduc
tion
Aud
itor
s’ r
epor
tPr
imar
y st
atem
ents
NO
TE
SA
ppen
dice
s
Notes to the consolidated financial statements (continued)IAS 1.77 26. Other assets (continued)
B. Investment property (continued)
ii. Measurement of fair value
Fair value hierarchy
IAS 40.75(e) The fair values of investment properties were determined by external, independent property valuers, having appropriate recognised professional qualifications and recent experience in the location and category of property being valued. The independent valuers provide the fair values of the Group’s investment property portfolio every six months.
IFRS 13.93(b) The fair value measurements for all of the investment properties have been categorised as Level 3 fair value measurements.
Valuation techniques and significant unobservable inputs
IFRS 13.93(d), 93(h)(i), 99
The following table shows the valuation technique used in measuring the fair values of investment properties, as well as the significant unobservable inputs used.
Valuation technique Significant unobservable inputs
Inter-relationship between key unobservable inputs and fair value measurement
Discounted cash flows: The valuation model considers the present value of net cash flows to be generated from the property, taking into account expected rental growth rate, void periods, occupancy rate, lease incentive costs such as rent-free periods and other costs not paid by tenants. The expected net cash flows are discounted using risk-adjusted discount rates. Among other factors, the discount rate estimation considers the quality of a building and its location (prime vs secondary), tenant credit quality and lease terms.
– Expected market rental growth (2016: 2–3%, weighted average 2.6%; 2015: 2–3%, weighted average 2.5%).
– Void periods (2016 and 2015: average 6 months after the end of each lease).
– Occupancy rate (2016: 90–95%, weighted average 92.5%; 2015: 91–95%, weighted average 92.8%).
– Rent-free periods (2016 and 2015: 1-year period on new leases).
– Risk-adjusted discount rates (2016 5–6.3%, weighted average 5.8%; 2015: 5.7–6.8%, weighted average 6.1%).
The estimated fair value would increase (decrease) if:
– expected market rental growth were higher (lower);
– void periods were shorter (longer);
– the occupancy rate were higher (lower);
– rent-free periods were shorter (longer); or
– the risk-adjusted discount rate were lower (higher).
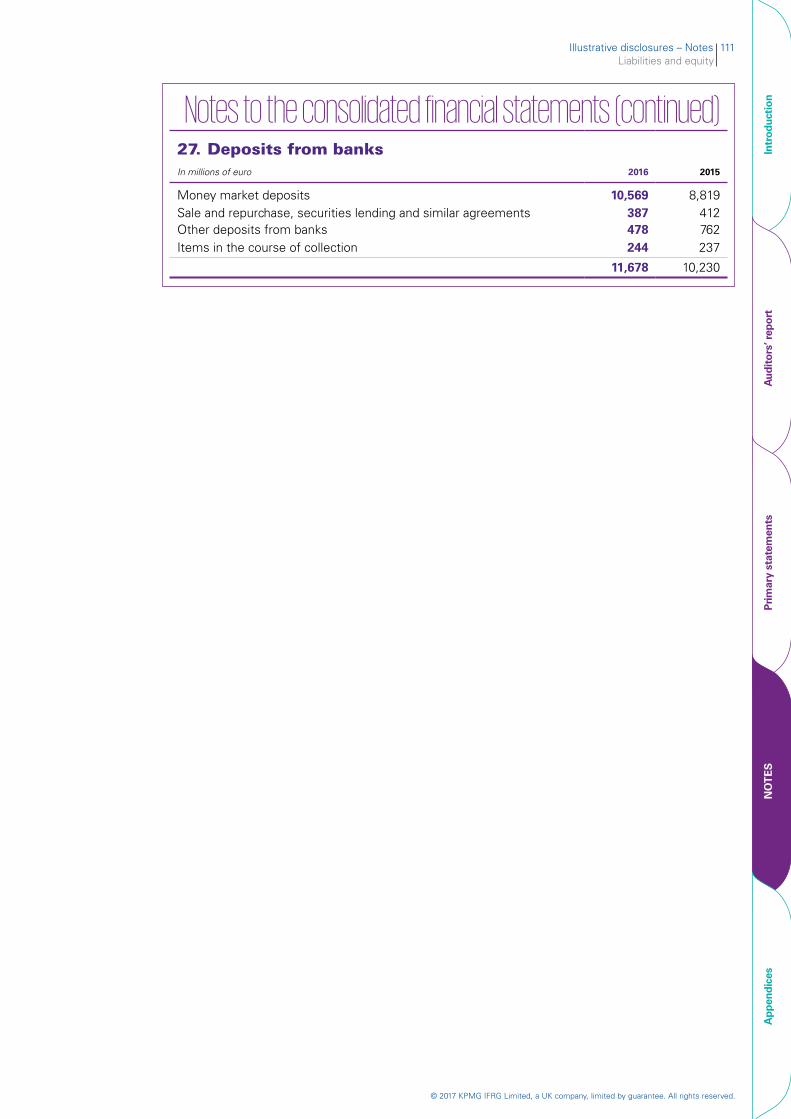
Illustrative disclosures – Notes 111Liabilities and equity
© 2017 KPMG IFRG Limited, a UK company, limited by guarantee. All rights reserved.
Intr
oduc
tion
Aud
itor
s’ r
epor
tPr
imar
y st
atem
ents
NO
TE
SA
ppen
dice
s
Notes to the consolidated financial statements (continued)27. Deposits from banksIn millions of euro 2016 2015
Money market deposits 10,569 8,819 Sale and repurchase, securities lending and similar agreements 387 412Other deposits from banks 478 762 Items in the course of collection 244 237
11,678 10,230
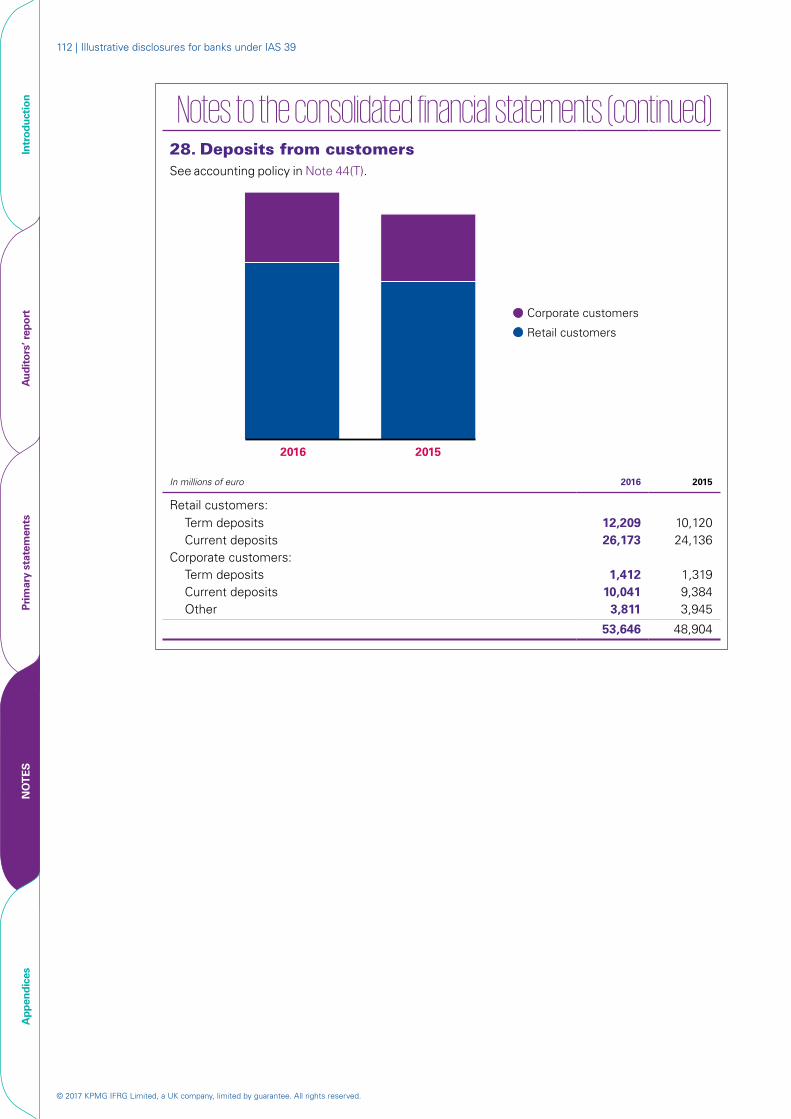
© 2017 KPMG IFRG Limited, a UK company, limited by guarantee. All rights reserved.
112 | Illustrative disclosures for banks under IAS 39
Intr
oduc
tion
Aud
itor
s’ r
epor
tPr
imar
y st
atem
ents
NO
TE
SA
ppen
dice
s
Notes to the consolidated financial statements (continued)28. Deposits from customersSee accounting policy in Note 44(T).
Retail customers
Corporate customers
2016 2015
In millions of euro 2016 2015
Retail customers:Term deposits 12,209 10,120 Current deposits 26,173 24,136
Corporate customers:Term deposits 1,412 1,319 Current deposits 10,041 9,384 Other 3,811 3,945
53,646 48,904
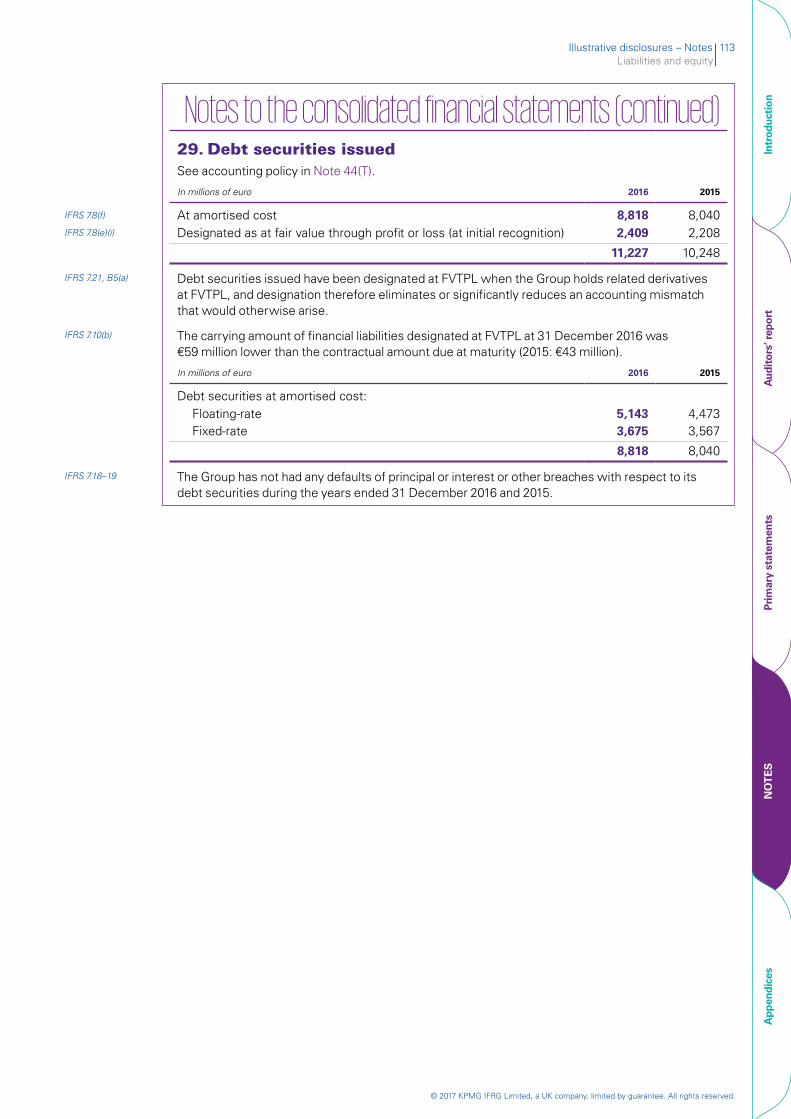
Illustrative disclosures – Notes 113Liabilities and equity
© 2017 KPMG IFRG Limited, a UK company, limited by guarantee. All rights reserved.
Intr
oduc
tion
Aud
itor
s’ r
epor
tPr
imar
y st
atem
ents
NO
TE
SA
ppen
dice
s
Notes to the consolidated financial statements (continued)
29. Debt securities issuedSee accounting policy in Note 44(T).
In millions of euro 2016 2015
IFRS 7.8(f) At amortised cost 8,818 8,040IFRS 7.8(e)(i) Designated as at fair value through profit or loss (at initial recognition) 2,409 2,208
11,227 10,248
IFRS 7.21, B5(a) Debt securities issued have been designated at FVTPL when the Group holds related derivatives at FVTPL, and designation therefore eliminates or significantly reduces an accounting mismatch that would otherwise arise.
IFRS 7.10(b) The carrying amount of financial liabilities designated at FVTPL at 31 December 2016 was €59 million lower than the contractual amount due at maturity (2015: €43 million).
In millions of euro 2016 2015
Debt securities at amortised cost:Floating-rate 5,143 4,473 Fixed-rate 3,675 3,567
8,818 8,040
IFRS 7.18–19 The Group has not had any defaults of principal or interest or other breaches with respect to its debt securities during the years ended 31 December 2016 and 2015.
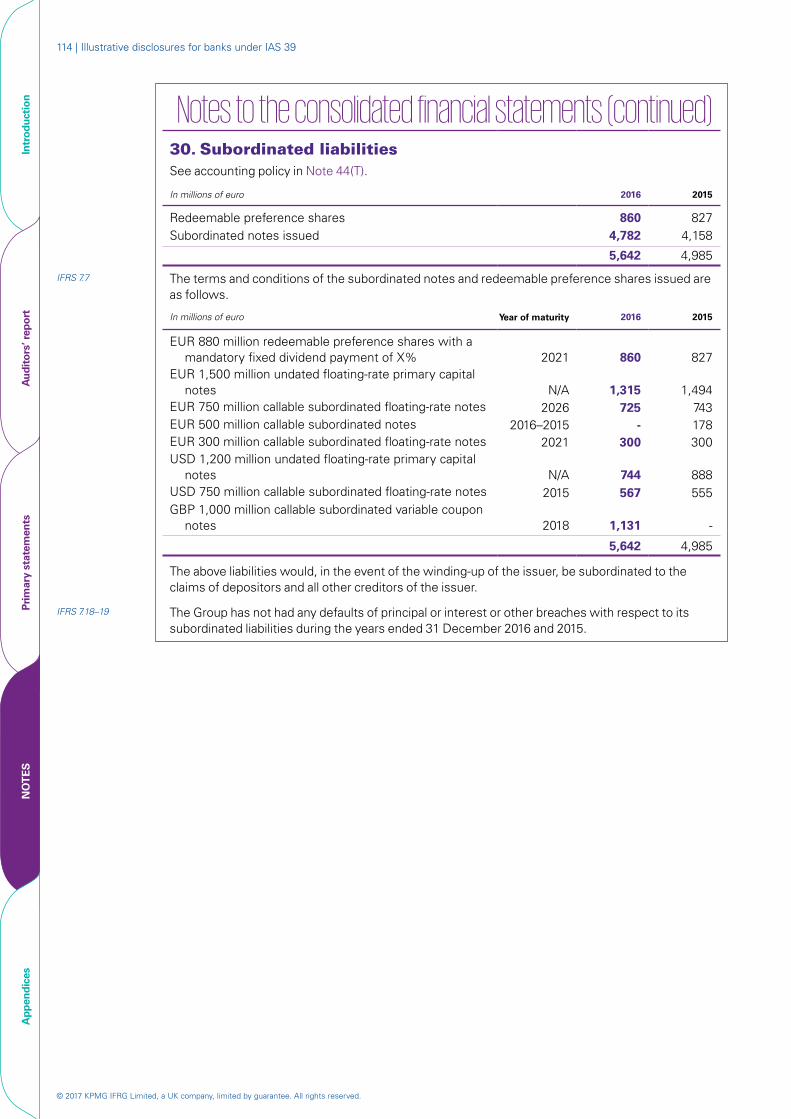
© 2017 KPMG IFRG Limited, a UK company, limited by guarantee. All rights reserved.
114 | Illustrative disclosures for banks under IAS 39
Intr
oduc
tion
Aud
itor
s’ r
epor
tPr
imar
y st
atem
ents
NO
TE
SA
ppen
dice
s
Notes to the consolidated financial statements (continued)
30. Subordinated liabilitiesSee accounting policy in Note 44(T).
In millions of euro 2016 2015
Redeemable preference shares 860 827Subordinated notes issued 4,782 4,158
5,642 4,985
IFRS 7.7 The terms and conditions of the subordinated notes and redeemable preference shares issued are as follows.
In millions of euro Year of maturity 2016 2015
EUR 880 million redeemable preference shares with a mandatory fixed dividend payment of X% 2021 860 827
EUR 1,500 million undated floating-rate primary capital notes N/A 1,315 1,494
EUR 750 million callable subordinated floating-rate notes 2026 725 743EUR 500 million callable subordinated notes 2016–2015 - 178EUR 300 million callable subordinated floating-rate notes 2021 300 300USD 1,200 million undated floating-rate primary capital
notes N/A 744 888USD 750 million callable subordinated floating-rate notes 2015 567 555GBP 1,000 million callable subordinated variable coupon
notes 2018 1,131 -
5,642 4,985
The above liabilities would, in the event of the winding-up of the issuer, be subordinated to the claims of depositors and all other creditors of the issuer.
IFRS 7.18–19 The Group has not had any defaults of principal or interest or other breaches with respect to its subordinated liabilities during the years ended 31 December 2016 and 2015.
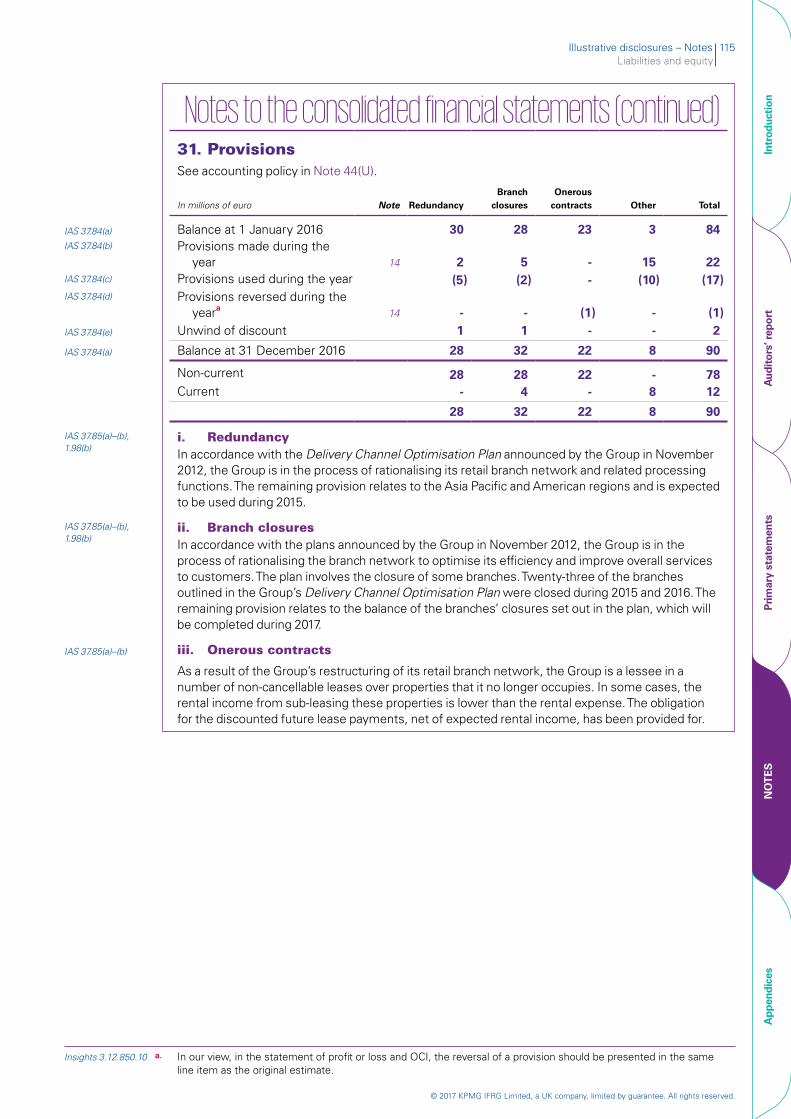
Illustrative disclosures – Notes 115Liabilities and equity
© 2017 KPMG IFRG Limited, a UK company, limited by guarantee. All rights reserved.
Intr
oduc
tion
Aud
itor
s’ r
epor
tPr
imar
y st
atem
ents
NO
TE
SA
ppen
dice
s
Notes to the consolidated financial statements (continued) 31. ProvisionsSee accounting policy in Note 44(U).
In millions of euro Note RedundancyBranch
closuresOnerous
contracts Other Total
IAS 37.84(a) Balance at 1 January 2016 30 28 23 3 84IAS 37.84(b) Provisions made during the
year 14 2 5 - 15 22IAS 37.84(c) Provisions used during the year (5) (2) - (10) (17)IAS 37.84(d) Provisions reversed during the
yeara 14 - - (1) - (1)IAS 37.84(e) Unwind of discount 1 1 - - 2
IAS 37.84(a) Balance at 31 December 2016 28 32 22 8 90
Non-current 28 28 22 - 78Current - 4 - 8 12
28 32 22 8 90
IAS 37.85(a)–(b), 1.98(b)
i. RedundancyIn accordance with the Delivery Channel Optimisation Plan announced by the Group in November 2012, the Group is in the process of rationalising its retail branch network and related processing functions. The remaining provision relates to the Asia Pacific and American regions and is expected to be used during 2015.
IAS 37.85(a)–(b), 1.98(b)
ii. Branch closuresIn accordance with the plans announced by the Group in November 2012, the Group is in the process of rationalising the branch network to optimise its efficiency and improve overall services to customers. The plan involves the closure of some branches. Twenty-three of the branches outlined in the Group’s Delivery Channel Optimisation Plan were closed during 2015 and 2016. The remaining provision relates to the balance of the branches’ closures set out in the plan, which will be completed during 2017.
IAS 37.85(a)–(b) iii. Onerous contracts
As a result of the Group’s restructuring of its retail branch network, the Group is a lessee in a number of non-cancellable leases over properties that it no longer occupies. In some cases, the rental income from sub-leasing these properties is lower than the rental expense. The obligation for the discounted future lease payments, net of expected rental income, has been provided for.
Insights 3.12.850.10 a. In our view, in the statement of profit or loss and OCI, the reversal of a provision should be presented in the same line item as the original estimate.
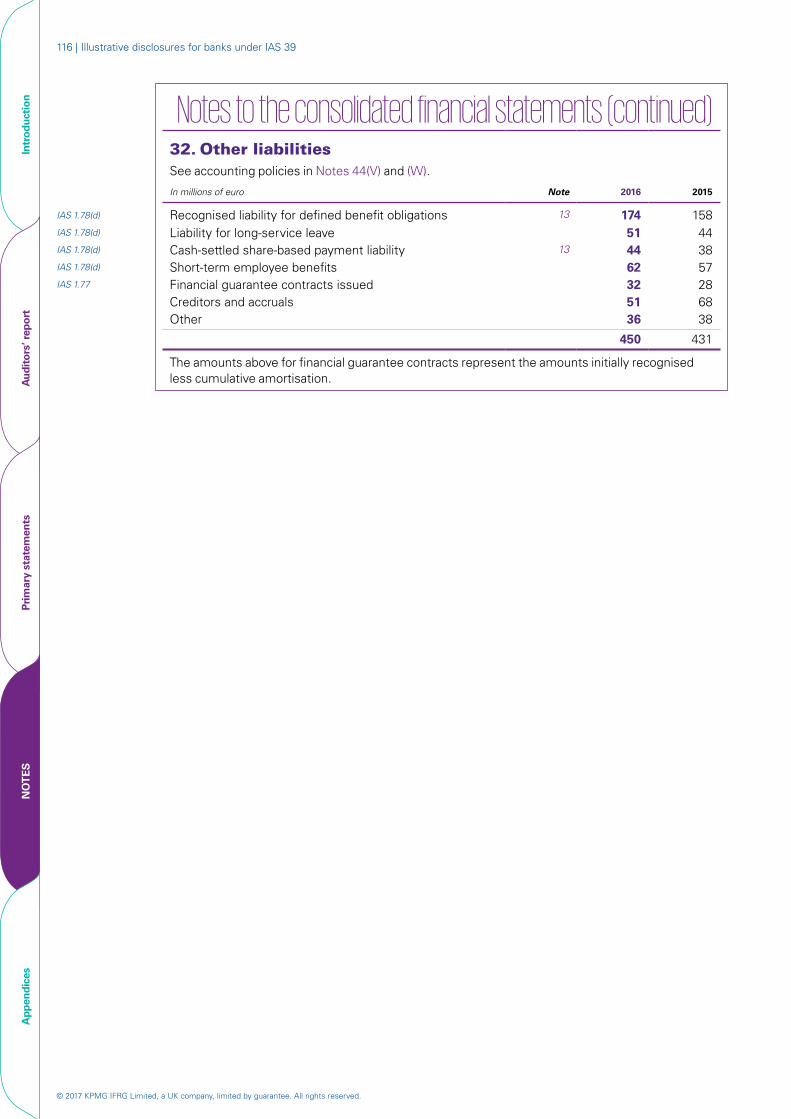
© 2017 KPMG IFRG Limited, a UK company, limited by guarantee. All rights reserved.
116 | Illustrative disclosures for banks under IAS 39
Intr
oduc
tion
Aud
itor
s’ r
epor
tPr
imar
y st
atem
ents
NO
TE
SA
ppen
dice
s
Notes to the consolidated financial statements (continued) 32. Other liabilitiesSee accounting policies in Notes 44(V) and (W).
In millions of euro Note 2016 2015
IAS 1.78(d) Recognised liability for defined benefit obligations 13 174 158IAS 1.78(d) Liability for long-service leave 51 44IAS 1.78(d) Cash-settled share-based payment liability 13 44 38IAS 1.78(d) Short-term employee benefits 62 57IAS 1.77 Financial guarantee contracts issued 32 28
Creditors and accruals 51 68Other 36 38
450 431
The amounts above for financial guarantee contracts represent the amounts initially recognised less cumulative amortisation.
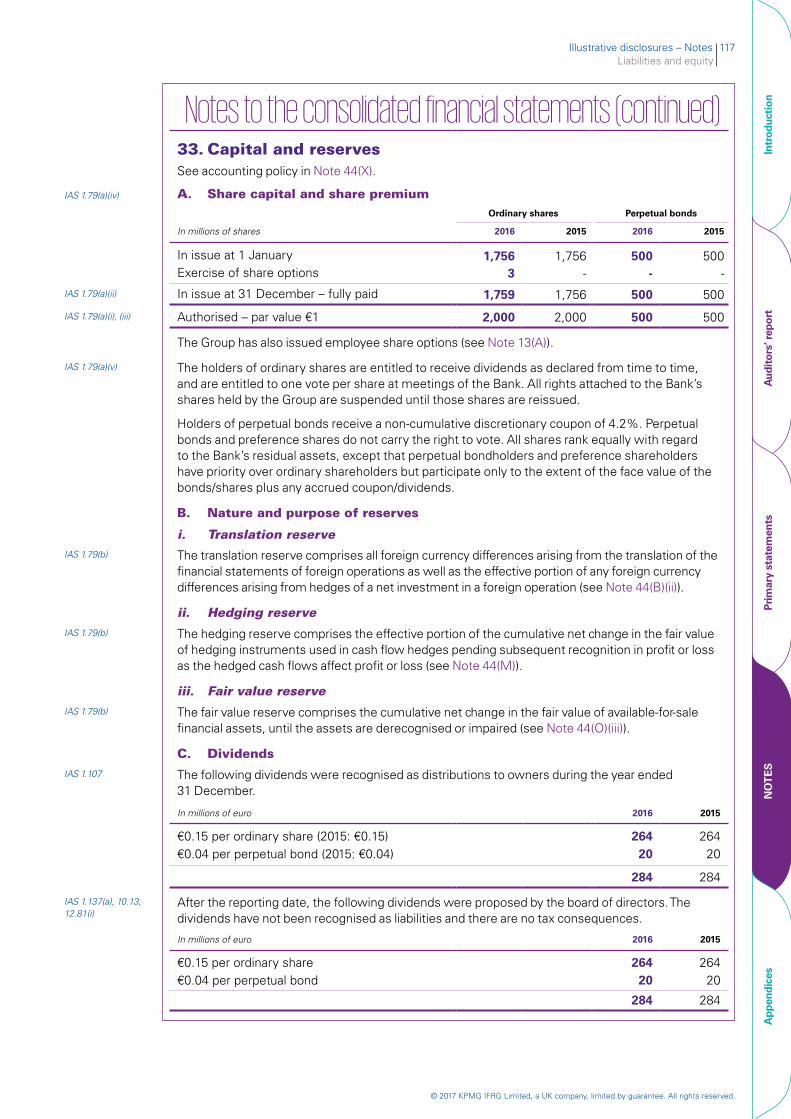
Illustrative disclosures – Notes 117Liabilities and equity
© 2017 KPMG IFRG Limited, a UK company, limited by guarantee. All rights reserved.
Intr
oduc
tion
Aud
itor
s’ r
epor
tPr
imar
y st
atem
ents
NO
TE
SA
ppen
dice
s
Notes to the consolidated financial statements (continued)33. Capital and reservesSee accounting policy in Note 44(X).
IAS 1.79(a)(iv) A. Share capital and share premiumOrdinary shares Perpetual bonds
In millions of shares 2016 2015 2016 2015
In issue at 1 January 1,756 1,756 500 500 Exercise of share options 3 - - -
IAS 1.79(a)(ii) In issue at 31 December – fully paid 1,759 1,756 500 500
IAS 1.79(a)(i), (iii) Authorised – par value €1 2,000 2,000 500 500
The Group has also issued employee share options (see Note 13(A)).
IAS 1.79(a)(v) The holders of ordinary shares are entitled to receive dividends as declared from time to time, and are entitled to one vote per share at meetings of the Bank. All rights attached to the Bank’s shares held by the Group are suspended until those shares are reissued.
Holders of perpetual bonds receive a non-cumulative discretionary coupon of 4.2%. Perpetual bonds and preference shares do not carry the right to vote. All shares rank equally with regard to the Bank’s residual assets, except that perpetual bondholders and preference shareholders have priority over ordinary shareholders but participate only to the extent of the face value of the bonds/shares plus any accrued coupon/dividends.
B. Nature and purpose of reserves
i. Translation reserveIAS 1.79(b) The translation reserve comprises all foreign currency differences arising from the translation of the
financial statements of foreign operations as well as the effective portion of any foreign currency differences arising from hedges of a net investment in a foreign operation (see Note 44(B)(ii)).
ii. Hedging reserve
IAS 1.79(b) The hedging reserve comprises the effective portion of the cumulative net change in the fair value of hedging instruments used in cash flow hedges pending subsequent recognition in profit or loss as the hedged cash flows affect profit or loss (see Note 44(M)).
iii. Fair value reserve
IAS 1.79(b) The fair value reserve comprises the cumulative net change in the fair value of available-for-sale financial assets, until the assets are derecognised or impaired (see Note 44(O)(iii)).
C. Dividends
IAS 1.107 The following dividends were recognised as distributions to owners during the year ended 31 December.
In millions of euro 2016 2015
€0.15 per ordinary share (2015: €0.15) 264 264€0.04 per perpetual bond (2015: €0.04) 20 20
284 284
IAS 1.137(a), 10.13, 12.81(i)
After the reporting date, the following dividends were proposed by the board of directors. The dividends have not been recognised as liabilities and there are no tax consequences.
In millions of euro 2016 2015
€0.15 per ordinary share 264 264€0.04 per perpetual bond 20 20
284 284
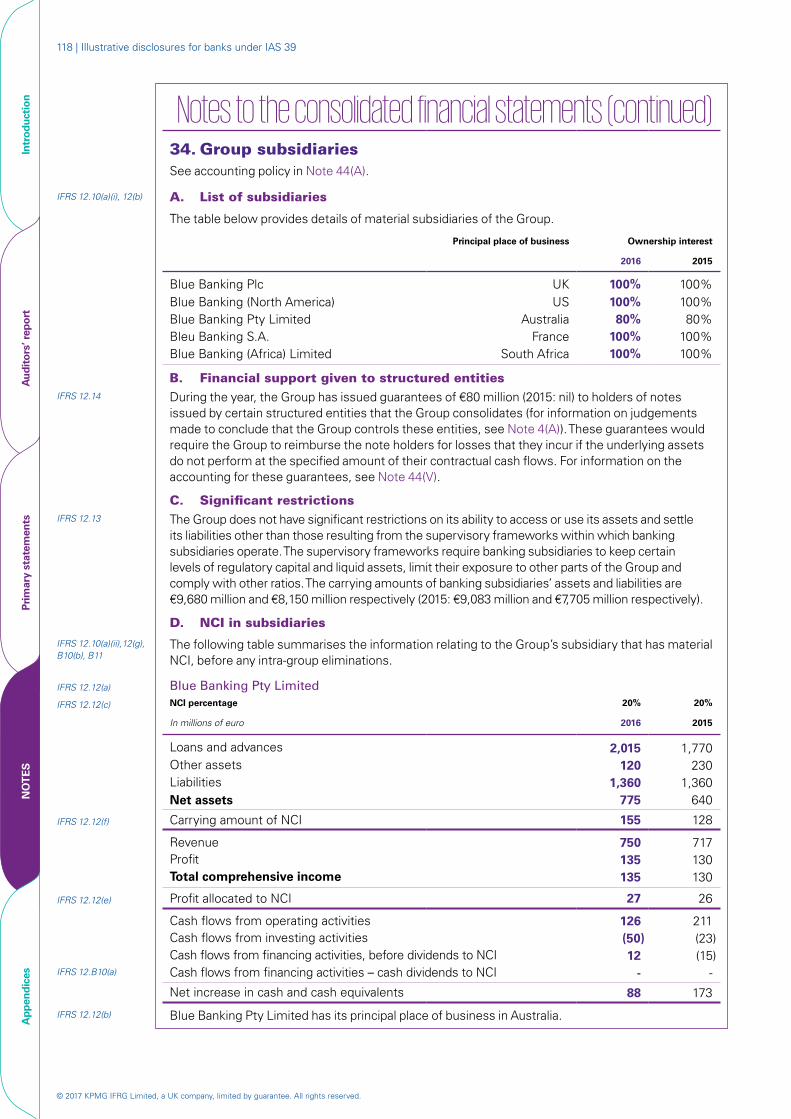
© 2017 KPMG IFRG Limited, a UK company, limited by guarantee. All rights reserved.
118 | Illustrative disclosures for banks under IAS 39
Intr
oduc
tion
Aud
itor
s’ r
epor
tPr
imar
y st
atem
ents
NO
TE
SA
ppen
dice
s
Notes to the consolidated financial statements (continued)34. Group subsidiariesSee accounting policy in Note 44(A).
IFRS 12.10(a)(i), 12(b) A. List of subsidiaries
The table below provides details of material subsidiaries of the Group.
Principal place of business Ownership interest
2016 2015
Blue Banking Plc UK 100% 100%Blue Banking (North America) US 100% 100%Blue Banking Pty Limited Australia 80% 80%Bleu Banking S.A. France 100% 100%Blue Banking (Africa) Limited South Africa 100% 100%
B. Financial support given to structured entitiesIFRS 12.14 During the year, the Group has issued guarantees of €80 million (2015: nil) to holders of notes
issued by certain structured entities that the Group consolidates (for information on judgements made to conclude that the Group controls these entities, see Note 4(A)). These guarantees would require the Group to reimburse the note holders for losses that they incur if the underlying assets do not perform at the specified amount of their contractual cash flows. For information on the accounting for these guarantees, see Note 44(V).
C. Significant restrictionsIFRS 12.13 The Group does not have significant restrictions on its ability to access or use its assets and settle
its liabilities other than those resulting from the supervisory frameworks within which banking subsidiaries operate. The supervisory frameworks require banking subsidiaries to keep certain levels of regulatory capital and liquid assets, limit their exposure to other parts of the Group and comply with other ratios. The carrying amounts of banking subsidiaries’ assets and liabilities are €9,680 million and €8,150 million respectively (2015: €9,083 million and €7,705 million respectively).
D. NCI in subsidiaries
IFRS 12.10(a)(ii),12(g), B10(b), B11
The following table summarises the information relating to the Group’s subsidiary that has material NCI, before any intra-group eliminations.
IFRS 12.12(a) Blue Banking Pty LimitedIFRS 12.12(c) NCI percentage 20% 20%
In millions of euro 2016 2015
Loans and advances 2,015 1,770Other assets 120 230Liabilities 1,360 1,360Net assets 775 640
IFRS 12.12(f) Carrying amount of NCI 155 128
Revenue 750 717Profit 135 130Total comprehensive income 135 130
IFRS 12.12(e) Profit allocated to NCI 27 26
Cash flows from operating activities 126 211Cash flows from investing activities (50) (23)Cash flows from financing activities, before dividends to NCI 12 (15)
IFRS 12.B10(a) Cash flows from financing activities – cash dividends to NCI - -
Net increase in cash and cash equivalents 88 173
IFRS 12.12(b) Blue Banking Pty Limited has its principal place of business in Australia.
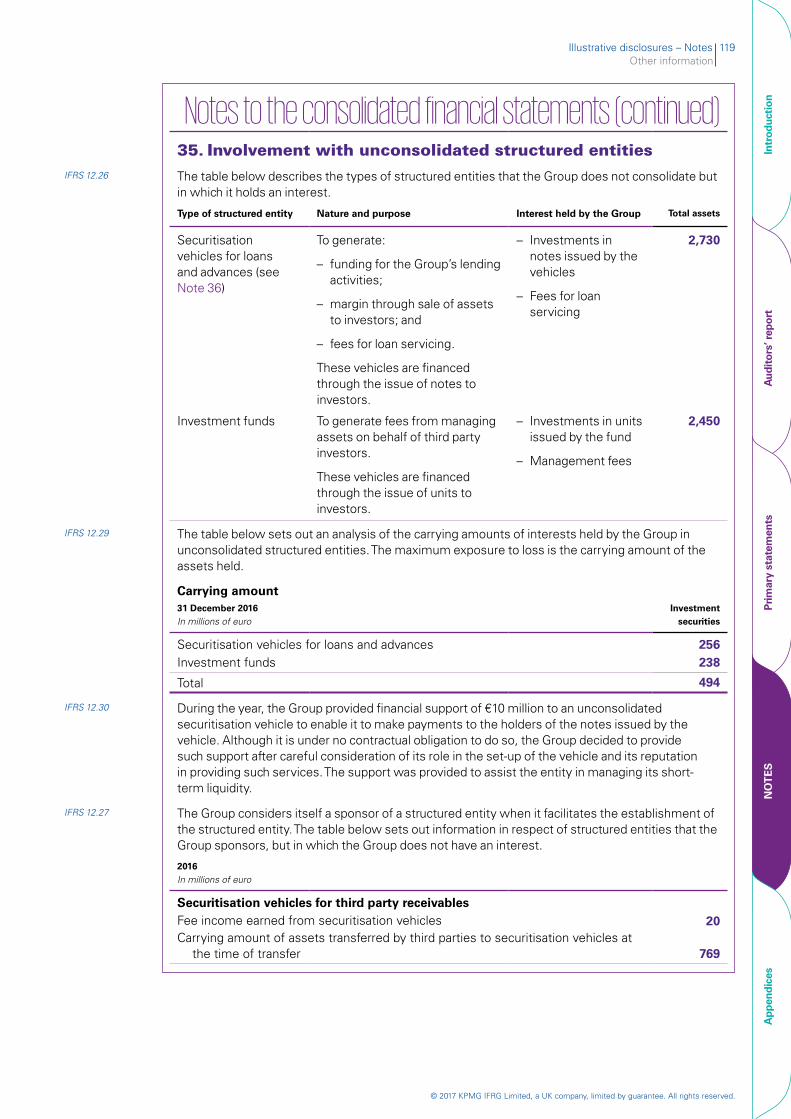
Illustrative disclosures – Notes 119Other information
© 2017 KPMG IFRG Limited, a UK company, limited by guarantee. All rights reserved.
Intr
oduc
tion
Aud
itor
s’ r
epor
tPr
imar
y st
atem
ents
NO
TE
SA
ppen
dice
s
Notes to the consolidated financial statements (continued)35. Involvement with unconsolidated structured entities
IFRS 12.26 The table below describes the types of structured entities that the Group does not consolidate but in which it holds an interest.
Type of structured entity Nature and purpose Interest held by the Group Total assets
Securitisation vehicles for loans and advances (see Note 36)
To generate:
– funding for the Group’s lending activities;
– margin through sale of assets to investors; and
– fees for loan servicing.
These vehicles are financed through the issue of notes to investors.
– Investments in notes issued by the vehicles
– Fees for loan servicing
2,730
Investment funds To generate fees from managing assets on behalf of third party investors.
These vehicles are financed through the issue of units to investors.
– Investments in units issued by the fund
– Management fees
2,450
IFRS 12.29 The table below sets out an analysis of the carrying amounts of interests held by the Group in unconsolidated structured entities. The maximum exposure to loss is the carrying amount of the assets held.
Carrying amount31 December 2016 In millions of euro
Investment securities
Securitisation vehicles for loans and advances 256Investment funds 238
Total 494
IFRS 12.30 During the year, the Group provided financial support of €10 million to an unconsolidated securitisation vehicle to enable it to make payments to the holders of the notes issued by the vehicle. Although it is under no contractual obligation to do so, the Group decided to provide such support after careful consideration of its role in the set-up of the vehicle and its reputation in providing such services. The support was provided to assist the entity in managing its short-term liquidity.
IFRS 12.27 The Group considers itself a sponsor of a structured entity when it facilitates the establishment of the structured entity. The table below sets out information in respect of structured entities that the Group sponsors, but in which the Group does not have an interest.
2016 In millions of euro
Securitisation vehicles for third party receivablesFee income earned from securitisation vehicles 20 Carrying amount of assets transferred by third parties to securitisation vehicles at
the time of transfer 769
© 2017 KPMG IFRG Limited, a UK company, limited by guarantee. All rights reserved.
120 | Illustrative disclosures for banks under IAS 39
Intr
oduc
tion
Aud
itor
s’ r
epor
tPr
imar
y st
atem
ents
NO
TE
SA
ppen
dice
s
Notes to the consolidated financial statements (continued)36. Transfers of financial assetsSee accounting policy in Note 44(J)(iii).
IFRS 7.42A, 42D(a), IAS 39.17–20
In the ordinary course of business, the Group enters into transactions that result in the transfer of financial assets, primarily debt and equity securities, and loans and advances to customers. In accordance with the accounting policy set out in Note 44(J)(iii), the transferred financial assets continue to be recognised in their entirety or to the extent of the Group’s continuing involvement, or are derecognised in their entirety.
The Group transfers financial assets that are not derecognised in their entirety or for which the Group has continuing involvement primarily through the following transactions:
– sale and repurchase of securities;
– securities lending;
– sale of securities with a concurrent total return swap; and
– securitisation activities in which loans and advances to customers or investment securities are transferred to unconsolidated securitisation vehicles or to investors in the notes issued by consolidated securitisation vehicles.
A. Transferred financial assets that are not derecognised in their entirety
i. Sale and repurchase agreementsIAS 39.29, AG51(a)–(c), IFRS 7.42D(a)–(c)
‘Sale and repurchase agreements’ are transactions in which the Group sells a security and simultaneously agrees to repurchase it (or an asset that is substantially the same) at a fixed price on a future date. The Group continues to recognise the securities in their entirety in the statement of financial position because it retains substantially all of the risks and rewards of ownership. The cash consideration received is recognised as a financial asset and a financial liability is recognised for the obligation to pay the repurchase price. Because the Group sells the contractual rights to the cash flows of the securities, it does not have the ability to use the transferred assets during the term of the arrangement.
ii. Securities lending
IAS 39.29, AG51(a)–(c), IFRS 7.42D(a)–(c)
‘Securities lending agreements’ are transactions in which the Group lends securities for a fee and receives cash as collateral. The Group continues to recognise the securities in their entirety in the statement of financial position because it retains substantially all of the risks and rewards of ownership. The cash received is recognised as a financial asset and a financial liability is recognised for the obligation to repay it. Because as part of the lending arrangement the Group sells the contractual rights to the cash flows of the securities, it does not have the ability to use the transferred assets during the term of the arrangement.
Illustrative disclosures – Notes 121Other information
© 2017 KPMG IFRG Limited, a UK company, limited by guarantee. All rights reserved.
Intr
oduc
tion
Aud
itor
s’ r
epor
tPr
imar
y st
atem
ents
NO
TE
SA
ppen
dice
s
Notes to the consolidated financial statements (continued)36. Transfers of financial assets (continued)A. Transferred financial assets that are not derecognised in their entirety
(continued)
iii. Sale of a security with a total return swap
IAS 39.16, 29, AG49, AG51(o), IFRS 7.42D(a)–(c)
The Group sells debt securities that are subject to a concurrent total return swap. In all cases, the Group retains substantially all of the risks and rewards of ownership. Therefore, the Group continues to recognise the transferred securities in its statement of financial position. The cash received is recognised as a financial asset and a corresponding liability is recognised. The Group does not separately recognise the total return swap that prevents derecognition of the security as a derivative because doing so would result in recognising the same rights and obligations twice. Because the Group sells the contractual rights to the cash flows of the securities, it does not have the ability to use the transferred assets during the term of the arrangement.
iv. Securitisations
IAS 39.15, 17–20 Loans and advances to customers and investment securities are sold by the Group to securitisation vehicles that in turn issue notes to investors collateralised by the purchased assets. For the purposes of disclosure in this note, a transfer of such financial assets may arise in one of two ways.
– If the Group sells assets to a consolidated securitisation vehicle, then the transfer is from the Group (which includes the consolidated securitisation vehicle) to investors in the notes. The transfer is in the form of the Group assuming an obligation to pass cash flows from the underlying assets to investors in the notes.
– If the Group sells assets to an unconsolidated securitisation vehicle, then the transfer is from the Group (which excludes the securitisation vehicle) to the securitisation vehicle. The transfer is in the form of a sale of the underlying assets to the securitisation vehicle.
IAS 39.19(c), 29 In the first case, the securitisation vehicles that are part of the Group generally transfer substantially all of the risks and rewards of ownership of the transferred assets to investors in the notes, but derecognition of the transferred assets is prohibited because the cash flows that the securitisation vehicles collect from the transferred assets on behalf of the investors are not passed through to them without material delay. In these cases, the consideration received from the investors in the notes in the form of cash is recognised as a financial asset and a corresponding financial liability is recognised. The investors in the notes have recourse only to the cash flows from the transferred financial assets.
IAS 39.19(c), 29, 31, IFRS 7.42D(a)–(c)
In certain securitisations in which the Group transfers loans and advances to an unconsolidated securitisation vehicle, it retains some credit risk (principally through the purchase of notes issued by the vehicle) while transferring some credit risk, prepayment and interest rate risk to the vehicle. Accordingly, the Group does not retain or transfer substantially all of the risks and rewards of such assets. The terms of the transfer agreement prevent the unconsolidated securitisation vehicle from selling the loans and advances to a third party.
IFRS 7.42D(c) If the Group transfers assets as part of securitisation transactions, then it does not have the ability to use the transferred assets during the term of the arrangement.
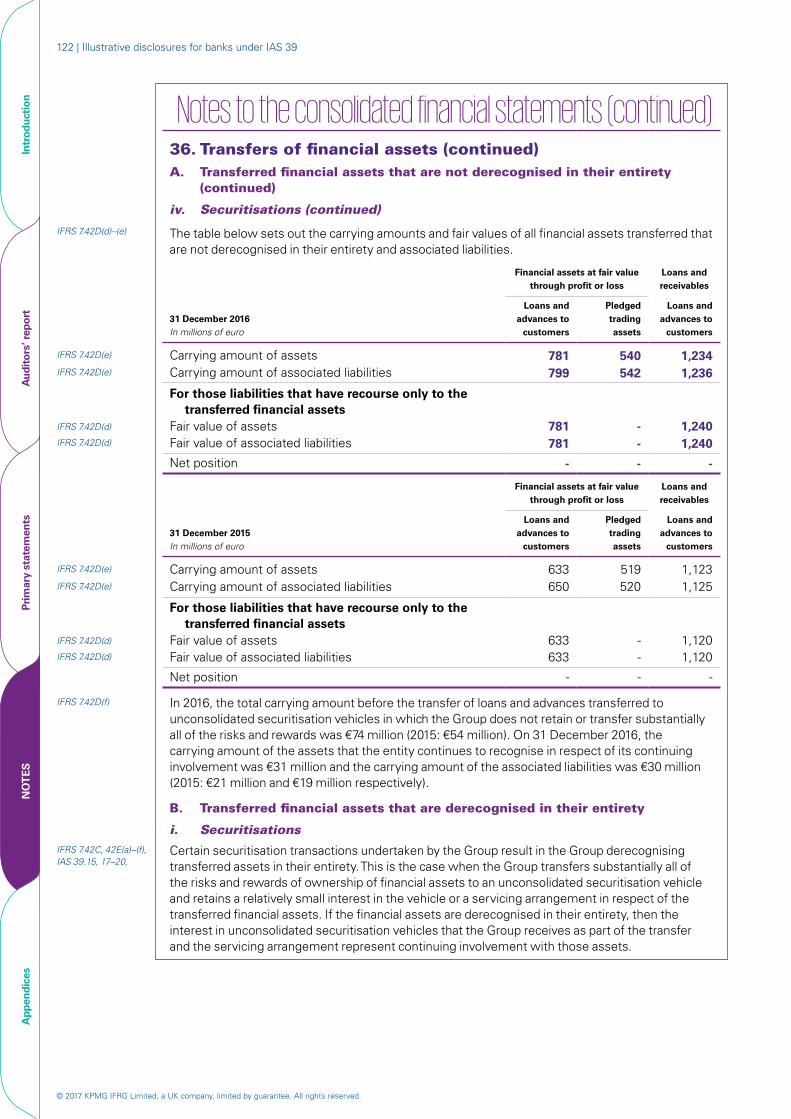
© 2017 KPMG IFRG Limited, a UK company, limited by guarantee. All rights reserved.
122 | Illustrative disclosures for banks under IAS 39
Intr
oduc
tion
Aud
itor
s’ r
epor
tPr
imar
y st
atem
ents
NO
TE
SA
ppen
dice
s
Notes to the consolidated financial statements (continued)
36. Transfers of financial assets (continued)A. Transferred financial assets that are not derecognised in their entirety
(continued)
iv. Securitisations (continued)
IFRS 7.42D(d)–(e) The table below sets out the carrying amounts and fair values of all financial assets transferred that are not derecognised in their entirety and associated liabilities.
Financial assets at fair value through profit or loss
Loans and receivables
31 December 2016 In millions of euro
Loans and advances to
customers
Pledged trading assets
Loans and advances to
customers
IFRS 7.42D(e) Carrying amount of assets 781 540 1,234IFRS 7.42D(e) Carrying amount of associated liabilities 799 542 1,236
For those liabilities that have recourse only to the transferred financial assets
IFRS 7.42D(d) Fair value of assets 781 - 1,240IFRS 7.42D(d) Fair value of associated liabilities 781 - 1,240
Net position - - -
Financial assets at fair value through profit or loss
Loans and receivables
31 December 2015 In millions of euro
Loans and advances to
customers
Pledged trading assets
Loans and advances to
customers
IFRS 7.42D(e) Carrying amount of assets 633 519 1,123IFRS 7.42D(e) Carrying amount of associated liabilities 650 520 1,125
For those liabilities that have recourse only to the transferred financial assets
IFRS 7.42D(d) Fair value of assets 633 - 1,120IFRS 7.42D(d) Fair value of associated liabilities 633 - 1,120
Net position - - -
IFRS 7.42D(f) In 2016, the total carrying amount before the transfer of loans and advances transferred to unconsolidated securitisation vehicles in which the Group does not retain or transfer substantially all of the risks and rewards was €74 million (2015: €54 million). On 31 December 2016, the carrying amount of the assets that the entity continues to recognise in respect of its continuing involvement was €31 million and the carrying amount of the associated liabilities was €30 million (2015: €21 million and €19 million respectively).
B. Transferred financial assets that are derecognised in their entirety
i. SecuritisationsIFRS 7.42C, 42E(a)–(f), IAS 39.15, 17–20,
Certain securitisation transactions undertaken by the Group result in the Group derecognising transferred assets in their entirety. This is the case when the Group transfers substantially all of the risks and rewards of ownership of financial assets to an unconsolidated securitisation vehicle and retains a relatively small interest in the vehicle or a servicing arrangement in respect of the transferred financial assets. If the financial assets are derecognised in their entirety, then the interest in unconsolidated securitisation vehicles that the Group receives as part of the transfer and the servicing arrangement represent continuing involvement with those assets.
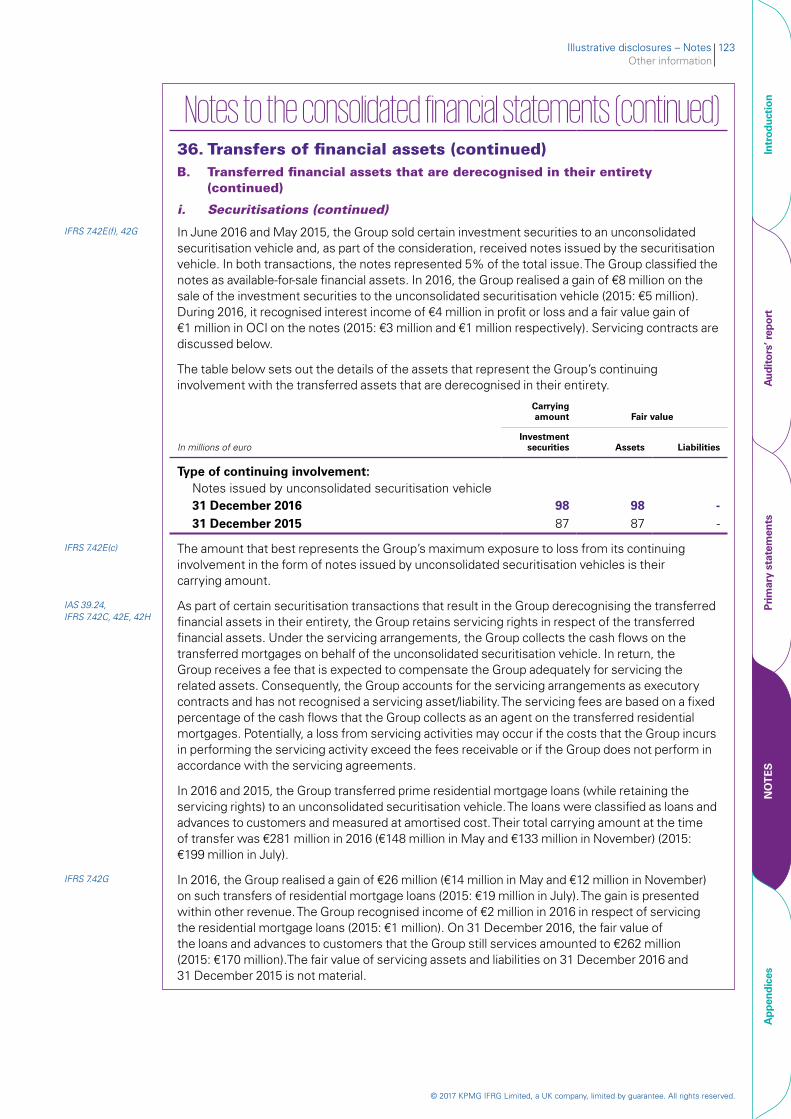
Illustrative disclosures – Notes 123Other information
© 2017 KPMG IFRG Limited, a UK company, limited by guarantee. All rights reserved.
Intr
oduc
tion
Aud
itor
s’ r
epor
tPr
imar
y st
atem
ents
NO
TE
SA
ppen
dice
s
Notes to the consolidated financial statements (continued)
36. Transfers of financial assets (continued)B. Transferred financial assets that are derecognised in their entirety
(continued)
i. Securitisations (continued)
IFRS 7.42E(f), 42G In June 2016 and May 2015, the Group sold certain investment securities to an unconsolidated securitisation vehicle and, as part of the consideration, received notes issued by the securitisation vehicle. In both transactions, the notes represented 5% of the total issue. The Group classified the notes as available-for-sale financial assets. In 2016, the Group realised a gain of €8 million on the sale of the investment securities to the unconsolidated securitisation vehicle (2015: €5 million). During 2016, it recognised interest income of €4 million in profit or loss and a fair value gain of €1 million in OCI on the notes (2015: €3 million and €1 million respectively). Servicing contracts are discussed below.
The table below sets out the details of the assets that represent the Group’s continuing involvement with the transferred assets that are derecognised in their entirety.
Carrying amount Fair value
In millions of euroInvestment
securities Assets Liabilities
Type of continuing involvement:Notes issued by unconsolidated securitisation vehicle31 December 2016 98 98 -31 December 2015 87 87 -
IFRS 7.42E(c) The amount that best represents the Group’s maximum exposure to loss from its continuing involvement in the form of notes issued by unconsolidated securitisation vehicles is their carrying amount.
IAS 39.24, IFRS 7.42C, 42E, 42H
As part of certain securitisation transactions that result in the Group derecognising the transferred financial assets in their entirety, the Group retains servicing rights in respect of the transferred financial assets. Under the servicing arrangements, the Group collects the cash flows on the transferred mortgages on behalf of the unconsolidated securitisation vehicle. In return, the Group receives a fee that is expected to compensate the Group adequately for servicing the related assets. Consequently, the Group accounts for the servicing arrangements as executory contracts and has not recognised a servicing asset/liability. The servicing fees are based on a fixed percentage of the cash flows that the Group collects as an agent on the transferred residential mortgages. Potentially, a loss from servicing activities may occur if the costs that the Group incurs in performing the servicing activity exceed the fees receivable or if the Group does not perform in accordance with the servicing agreements.
In 2016 and 2015, the Group transferred prime residential mortgage loans (while retaining the servicing rights) to an unconsolidated securitisation vehicle. The loans were classified as loans and advances to customers and measured at amortised cost. Their total carrying amount at the time of transfer was €281 million in 2016 (€148 million in May and €133 million in November) (2015: €199 million in July).
IFRS 7.42G In 2016, the Group realised a gain of €26 million (€14 million in May and €12 million in November) on such transfers of residential mortgage loans (2015: €19 million in July). The gain is presented within other revenue. The Group recognised income of €2 million in 2016 in respect of servicing the residential mortgage loans (2015: €1 million). On 31 December 2016, the fair value of the loans and advances to customers that the Group still services amounted to €262 million (2015: €170 million).The fair value of servicing assets and liabilities on 31 December 2016 and 31 December 2015 is not material.
© 2017 KPMG IFRG Limited, a UK company, limited by guarantee. All rights reserved.
124 | Illustrative disclosures for banks under IAS 39
Intr
oduc
tion
Aud
itor
s’ r
epor
tPr
imar
y st
atem
ents
NO
TE
SA
ppen
dice
s
Notes to the consolidated financial statements (continued)37. ContingenciesSee accounting policy in Note 44(U).
IAS 1.125, 37.86 A subsidiary is defending an action brought by a consumer rights organisation in Europe in relation to the marketing of specific pension and investment products from 2003 to 2006. Although liability is not admitted, if defence against the action is unsuccessful, then fines and legal costs could amount to €3 million, of which €250 thousand would be reimbursable under an insurance policy. Based on legal advice, management believes that its defence of the action will be successful.
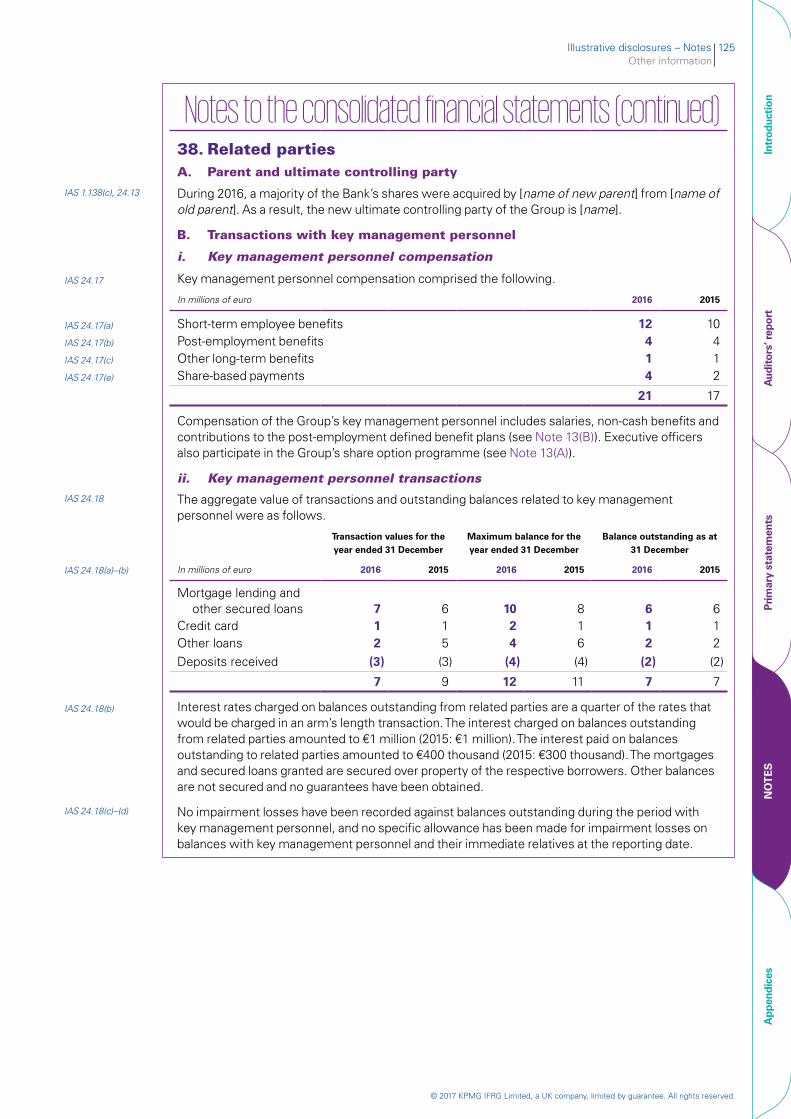
Illustrative disclosures – Notes 125Other information
© 2017 KPMG IFRG Limited, a UK company, limited by guarantee. All rights reserved.
Intr
oduc
tion
Aud
itor
s’ r
epor
tPr
imar
y st
atem
ents
NO
TE
SA
ppen
dice
s
Notes to the consolidated financial statements (continued)38. Related partiesA. Parent and ultimate controlling party
IAS 1.138(c), 24.13 During 2016, a majority of the Bank’s shares were acquired by [name of new parent] from [name of old parent]. As a result, the new ultimate controlling party of the Group is [name].
B. Transactions with key management personnel
i. Key management personnel compensation
IAS 24.17 Key management personnel compensation comprised the following.
In millions of euro 2016 2015
IAS 24.17(a) Short-term employee benefits 12 10IAS 24.17(b) Post-employment benefits 4 4IAS 24.17(c) Other long-term benefits 1 1IAS 24.17(e) Share-based payments 4 2
21 17
Compensation of the Group’s key management personnel includes salaries, non-cash benefits and contributions to the post-employment defined benefit plans (see Note 13(B)). Executive officers also participate in the Group’s share option programme (see Note 13(A)).
ii. Key management personnel transactions
IAS 24.18 The aggregate value of transactions and outstanding balances related to key management personnel were as follows.
Transaction values for the year ended 31 December
Maximum balance for the year ended 31 December
Balance outstanding as at 31 December
IAS 24.18(a)–(b) In millions of euro 2016 2015 2016 2015 2016 2015
Mortgage lending and other secured loans 7 6 10 8 6 6
Credit card 1 1 2 1 1 1Other loans 2 5 4 6 2 2Deposits received (3) (3) (4) (4) (2) (2)
7 9 12 11 7 7
IAS 24.18(b) Interest rates charged on balances outstanding from related parties are a quarter of the rates that would be charged in an arm’s length transaction. The interest charged on balances outstanding from related parties amounted to €1 million (2015: €1 million). The interest paid on balances outstanding to related parties amounted to €400 thousand (2015: €300 thousand). The mortgages and secured loans granted are secured over property of the respective borrowers. Other balances are not secured and no guarantees have been obtained.
IAS 24.18(c)–(d) No impairment losses have been recorded against balances outstanding during the period with key management personnel, and no specific allowance has been made for impairment losses on balances with key management personnel and their immediate relatives at the reporting date.
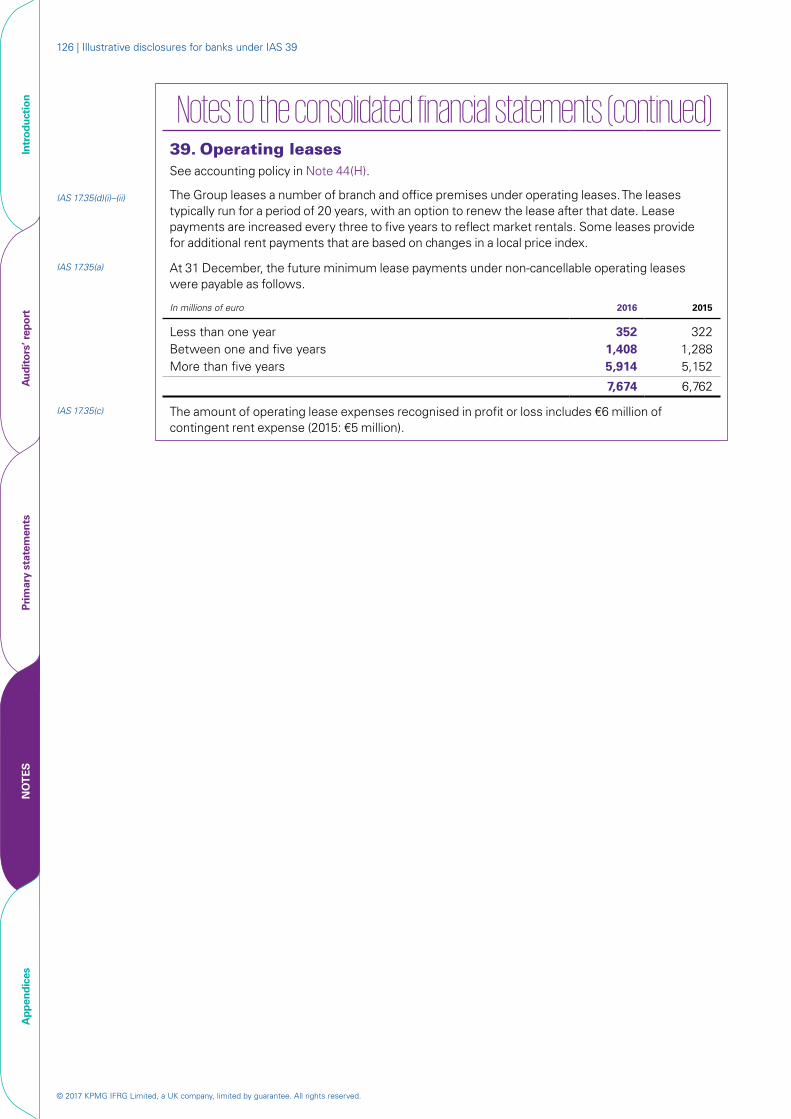
© 2017 KPMG IFRG Limited, a UK company, limited by guarantee. All rights reserved.
126 | Illustrative disclosures for banks under IAS 39
Intr
oduc
tion
Aud
itor
s’ r
epor
tPr
imar
y st
atem
ents
NO
TE
SA
ppen
dice
s
Notes to the consolidated financial statements (continued)39. Operating leasesSee accounting policy in Note 44(H).
IAS 17.35(d)(i)–(ii) The Group leases a number of branch and office premises under operating leases. The leases typically run for a period of 20 years, with an option to renew the lease after that date. Lease payments are increased every three to five years to reflect market rentals. Some leases provide for additional rent payments that are based on changes in a local price index.
IAS 17.35(a) At 31 December, the future minimum lease payments under non-cancellable operating leases were payable as follows.
In millions of euro 2016 2015
Less than one year 352 322 Between one and five years 1,408 1,288 More than five years 5,914 5,152
7,674 6,762
IAS 17.35(c) The amount of operating lease expenses recognised in profit or loss includes €6 million of contingent rent expense (2015: €5 million).

Illustrative disclosures – Notes 127Other information
© 2017 KPMG IFRG Limited, a UK company, limited by guarantee. All rights reserved.
Intr
oduc
tion
Aud
itor
s’ r
epor
tPr
imar
y st
atem
ents
NO
TE
SA
ppen
dice
s
Notes to the consolidated financial statements (continued)40. Subsequent eventsAcquisition of ABC Bank
IAS 10.21–22(a) On 22 February 2017, the Group announced its offer to acquire all of the shares of ABC Bank for €5.0 billion. The transaction still has to be approved by the Group’s shareholders and by regulatory authorities. Approvals are not expected until late in 2017. Due to the early stage of the transaction, an estimate of the financial effect of this proposed acquisition cannot be made reliably.
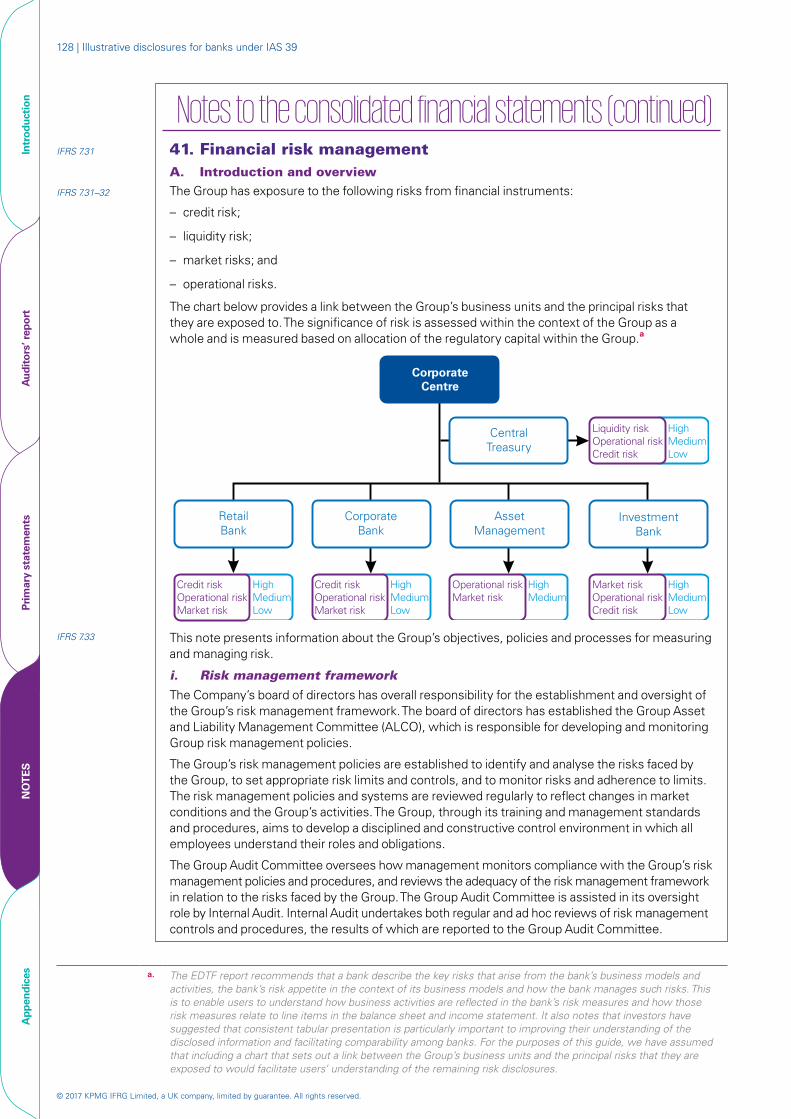
© 2017 KPMG IFRG Limited, a UK company, limited by guarantee. All rights reserved.
128 | Illustrative disclosures for banks under IAS 39
Intr
oduc
tion
Aud
itor
s’ r
epor
tPr
imar
y st
atem
ents
NO
TE
SA
ppen
dice
s
Notes to the consolidated financial statements (continued)IFRS 7.31 41. Financial risk management
A. Introduction and overview
IFRS 7.31–32 The Group has exposure to the following risks from financial instruments:
– credit risk;
– liquidity risk;
– market risks; and
– operational risks.
The chart below provides a link between the Group’s business units and the principal risks that they are exposed to. The significance of risk is assessed within the context of the Group as a whole and is measured based on allocation of the regulatory capital within the Group.a
CorporateCentre
InvestmentBank
AssetManagement
Operational riskMarket risk
HighMedium
CentralTreasury
CorporateBank
RetailBank
Market riskOperational riskCredit risk
HighMediumLow
Credit riskOperational riskMarket risk
HighMediumLow
Credit riskOperational riskMarket risk
HighMediumLow
HighMediumLow
Liquidity riskOperational riskCredit risk
IFRS 7.33 This note presents information about the Group’s objectives, policies and processes for measuring and managing risk.
i. Risk management framework
The Company’s board of directors has overall responsibility for the establishment and oversight of the Group’s risk management framework. The board of directors has established the Group Asset and Liability Management Committee (ALCO), which is responsible for developing and monitoring Group risk management policies.
The Group’s risk management policies are established to identify and analyse the risks faced by the Group, to set appropriate risk limits and controls, and to monitor risks and adherence to limits. The risk management policies and systems are reviewed regularly to reflect changes in market conditions and the Group’s activities. The Group, through its training and management standards and procedures, aims to develop a disciplined and constructive control environment in which all employees understand their roles and obligations.
The Group Audit Committee oversees how management monitors compliance with the Group’s risk management policies and procedures, and reviews the adequacy of the risk management framework in relation to the risks faced by the Group. The Group Audit Committee is assisted in its oversight role by Internal Audit. Internal Audit undertakes both regular and ad hoc reviews of risk management controls and procedures, the results of which are reported to the Group Audit Committee.
a. The EDTF report recommends that a bank describe the key risks that arise from the bank’s business models and
activities, the bank’s risk appetite in the context of its business models and how the bank manages such risks. This is to enable users to understand how business activities are reflected in the bank’s risk measures and how those risk measures relate to line items in the balance sheet and income statement. It also notes that investors have suggested that consistent tabular presentation is particularly important to improving their understanding of the disclosed information and facilitating comparability among banks. For the purposes of this guide, we have assumed that including a chart that sets out a link between the Group’s business units and the principal risks that they are exposed to would facilitate users’ understanding of the remaining risk disclosures.
Illustrative disclosures – Notes 129Other information
© 2017 KPMG IFRG Limited, a UK company, limited by guarantee. All rights reserved.
Intr
oduc
tion
Aud
itor
s’ r
epor
tPr
imar
y st
atem
ents
NO
TE
SA
ppen
dice
s
Notes to the consolidated financial statements (continued)IFRS 7.31 41. Financial risk management (continued)IFRS 7.33 B. Credit risk
‘Credit risk’ is the risk of financial loss to the Group if a customer or counterparty to a financial instrument fails to meet its contractual obligations, and arises principally from the Group’s loans and advances to customers and other banks, and investment debt securities. For risk management reporting purposes, the Group considers and consolidates all elements of credit risk exposure (such as individual obligor default risk, country and sector risk).
The market risk in respect of changes in value in trading assets arising from changes in market credit spreads applied to debt securities and derivatives included in trading assets is managed as a component of market risk; for further details, see (D) below.
i. Settlement risk
The Group’s activities may give rise to risk at the time of settlement of transactions and trades. ‘Settlement risk’ is the risk of loss due to the failure of an entity to honour its obligations to deliver cash, securities or other assets as contractually agreed.
For certain types of transactions, the Group mitigates this risk by conducting settlements through a settlement/clearing agent to ensure that a trade is settled only when both parties have fulfilled their contractual settlement obligations. Settlement limits form part of the credit approval/limit monitoring process described earlier. Acceptance of settlement risk on free-settlement trades requires transaction-specific or counterparty-specific approvals from Group Risk.
ii. Management of credit risk
The board of directors has delegated responsibility for the oversight of credit risk to its Group Credit Committee. A separate Group Credit department, reporting to the Group Credit Committee, is responsible for managing the Group’s credit risk, including the following.
– Formulating credit policies in consultation with business units, covering collateral requirements, credit assessment, risk grading and reporting, documentary and legal procedures, and compliance with regulatory and statutory requirements.
– Establishing the authorisation structure for the approval and renewal of credit facilities. Authorisation limits are allocated to business unit Credit Officers. Larger facilities require approval by Group Credit, the Head of Group Credit, the Group Credit Committee or the board of directors as appropriate.
– Reviewing and assessing credit risk: Group Credit assesses all credit exposures in excess of designated limits, before facilities are committed to customers by the business unit concerned. Renewals and reviews of facilities are subject to the same review process.
– Limiting concentrations of exposure to counterparties, geographies and industries (for loans and advances, financial guarantees and similar exposures), and by issuer, credit rating band, market liquidity and country (for investment securities).
– Developing and maintaining the Group’s risk gradings to categorise exposures according to the degree of risk of financial loss faced and to focus management on the attendant risks. The risk grading system is used in determining where impairment provisions may be required against specific credit exposures. The current risk grading framework consists of eight grades reflecting varying degrees of risk of default and the availability of collateral or other credit risk mitigation. The responsibility for setting risk grades lies with the final approving executive or committee, as appropriate. Risk grades are subject to regular reviews by Group Risk.
– Reviewing compliance of business units with agreed exposure limits, including those for selected industries, country risk and product types. Regular reports on the credit quality of local portfolios are provided to Group Credit, which may require appropriate corrective action to be taken.
– Providing advice, guidance and specialist skills to business units to promote best practice throughout the Group in the management of credit risk.
© 2017 KPMG IFRG Limited, a UK company, limited by guarantee. All rights reserved.
130 | Illustrative disclosures for banks under IAS 39
Intr
oduc
tion
Aud
itor
s’ r
epor
tPr
imar
y st
atem
ents
NO
TE
SA
ppen
dice
s
Notes to the consolidated financial statements (continued)IFRS 7.31 41. Financial risk management (continued)IFRS 7.33 B. Credit risk (continued)
ii. Management of credit risk (continued)
Each business unit is required to implement Group credit policies and procedures, with credit approval authorities delegated from the Group Credit Committee. Each business unit has a Chief Credit Risk officer who reports on all credit-related matters to local management and the Group Credit Committee. Each business unit is responsible for the quality and performance of its credit portfolio and for monitoring and controlling all credit risks in its portfolios, including those subject to central approval.
Regular audits of business units and Group Credit processes are undertaken by Internal Audit.
IFRS 7.33 C. Liquidity risk
‘Liquidity risk’ is the risk that the Group will encounter difficulty in meeting obligations associated with its financial liabilities that are settled by delivering cash or another financial asset.
i. Management of liquidity risk
The Group’s board of directors sets the Group’s strategy for managing liquidity risk and delegates responsibility for oversight of the implementation of this policy to ALCO. ALCO approves the Group’s liquidity policies and procedures. Central Treasury manages the Group’s liquidity position on a day-to-day basis and reviews daily reports covering the liquidity position of both the Group and operating subsidiaries and foreign branches. A summary report, including any exceptions and remedial action taken, is submitted regularly to ALCO.
IFRS 7.39(b) The Group’s approach to managing liquidity is to ensure, as far as possible, that it will always have sufficient liquidity to meet its liabilities when they are due, under both normal and stressed conditions, without incurring unacceptable losses or risking damage to the Group’s reputation. The key elements of the Group’s liquidity strategy are as follows.
– Maintaining a diversified funding base consisting of customer deposits (both retail and corporate) and wholesale market deposits and maintaining contingency facilities.
– Carrying a portfolio of highly liquid assets, diversified by currency and maturity.
– Monitoring liquidity ratios, maturity mismatches, behavioural characteristics of the Group’s financial assets and financial liabilities, and the extent to which the Group’s assets are encumbered and so not available as potential collateral for obtaining funding.
– Carrying out stress testing of the Group’s liquidity position.
Central Treasury receives information from other business units regarding the liquidity profile of their financial assets and financial liabilities and details of other projected cash flows arising from projected future business. Central Treasury then maintains a portfolio of short-term liquid assets, largely made up of short-term liquid investment securities, loans and advances to banks and other inter-bank facilities, to ensure that sufficient liquidity is maintained within the Group as a whole. The liquidity requirements of business units and subsidiaries are met through loans from Central Treasury to cover any short-term fluctuations and longer-term funding to address any structural liquidity requirements.
If an operating subsidiary or branch is subject to a liquidity limit imposed by its local regulator, then the subsidiary or branch is responsible for managing its overall liquidity within the regulatory limit in co-ordination with Central Treasury. Central Treasury monitors compliance of all operating subsidiaries and foreign branches with local regulatory limits on a daily basis.
Regular liquidity stress testing is conducted under a variety of scenarios covering both normal and more severe market conditions. The scenarios are developed taking into account both Group-specific events (e.g. a rating downgrade) and market-related events (e.g. prolonged market illiquidity, reduced fungibility of currencies, natural disasters or other catastrophes).
Illustrative disclosures – Notes 131Other information
© 2017 KPMG IFRG Limited, a UK company, limited by guarantee. All rights reserved.
Intr
oduc
tion
Aud
itor
s’ r
epor
tPr
imar
y st
atem
ents
NO
TE
SA
ppen
dice
s
Notes to the consolidated financial statements (continued)IFRS 7.31 41. Financial risk management (continued)IFRS 7.33 D. Market risks
‘Market risk’ is the risk that changes in market prices – such as interest rates, equity prices, foreign exchange rates and credit spreads (not relating to changes in the obligor’s/issuer’s credit standing) – will affect the Group’s income or the value of its holdings of financial instruments. The objective of the Group’s market risk management is to manage and control market risk exposures within acceptable parameters to ensure the Group’s solvency while optimising the return on risk.
i. Management of market risks
The Group separates its exposure to market risks between trading and non-trading portfolios. Trading portfolios are mainly held by the Investment Banking unit, and include positions arising from market making and proprietary position taking, together with financial assets and financial liabilities that are managed on a fair value basis.
With the exception of translation risk arising on the Group’s net investments in its foreign operations, all foreign exchange positions within the Group are transferred by Central Treasury to the Investment Banking unit. Accordingly, the foreign exchange positions are treated as part of the Group’s trading portfolios for risk management purposes.
Overall authority for market risk is vested in ALCO. ALCO sets up limits for each type of risk in aggregate and for portfolios, with market liquidity being a primary factor in determining the level of limits set for trading portfolios. The Group Market Risk Committee is responsible for the development of detailed risk management policies (subject to review and approval by ALCO) and for the day-to-day review of their implementation.
The Group employs a range of tools to monitor and limit market risk exposures. These are discussed below, separately for trading and non-trading portfolios.
ii. Exposure to market risks – Trading portfolios
IFRS 7.41(a)
The principal tool used to measure and control market risk exposure within the Group’s trading portfolios is VaR. The VaR of a trading portfolio is the estimated loss that will arise on the portfolio over a specified period of time (holding period) from an adverse market movement with a specified probability (confidence level). The VaR model used by the Group is based on a 99% confidence level and assumes a 10-day holding period. The VaR model used is based mainly on historical simulation. Taking account of market data from the previous two years, and observed relationships between different markets and prices, the model generates a wide range of plausible future scenarios for market price movements.
IFRS 7.41(b) Although VaR is an important tool for measuring market risk, the assumptions on which the model is based give rise to some limitations, including the following.
– A 10-day holding period assumes that it is possible to hedge or dispose of positions within that period. This may not be the case for illiquid assets or in situations in which there is severe market illiquidity.
– A 99% confidence level does not reflect losses that may occur beyond this level. Even within the model used, there is a 1% probability that losses could exceed the VaR.
– VaR is calculated on an end-of-day basis and does not reflect exposures that may arise on positions during the trading day.
– The use of historical data as a basis for determining the possible range of future outcomes does not cover all possible scenarios, especially those of an exceptional nature.
– The VaR measure is dependent on the Group’s position and the volatility of market prices. The VaR of an unchanged position reduces if market price volatility declines and vice versa.
© 2017 KPMG IFRG Limited, a UK company, limited by guarantee. All rights reserved.
132 | Illustrative disclosures for banks under IAS 39
Intr
oduc
tion
Aud
itor
s’ r
epor
tPr
imar
y st
atem
ents
NO
TE
SA
ppen
dice
s
Notes to the consolidated financial statements (continued)IFRS 7.31 41. Financial risk management (continued)IFRS 7.33 D. Market risks (continued)
ii. Exposure to market risks – Trading portfolios (continued)
The Group uses VaR limits for total market risk and specific foreign exchange, interest rate, equity, credit spread and other price risks. The overall structure of VaR limits is subject to review and approval by ALCO. VaR limits are allocated to trading portfolios. VaR is measured at least daily and more regularly for more actively traded portfolios. Daily reports of utilisation of VaR limits are submitted to Group Market Risk and regular summaries are submitted to ALCO.
The limitations of the VaR methodology are recognised by supplementing VaR limits with other position and sensitivity limit structures, including limits to address potential concentration risks within each trading portfolio. In addition, the Group uses a wide range of stress tests to model the financial impact of a variety of exceptional market scenarios on individual trading portfolios and the Group’s overall position. The Group determines the scenarios as follows:
– sensitivity scenarios consider the impact of any single risk factor or set of factors that are unlikely to be captured within the VaR models;
– technical scenarios consider the largest move in each risk factor without consideration of any underlying market correlation; and
– hypothetical scenarios consider potential macro economic events – e.g. periods of prolonged market illiquidity, reduced fungibility of currencies, natural disasters or other catastrophes, health pandemics etc.
The analysis of scenarios and stress tests is reviewed by ALCO.
The Group VaR models are subject to regular validation by Group Market Risk to ensure that they continue to perform as expected, and that assumptions used in model development are still appropriate. As part of the validation process, the potential weaknesses of the models are analysed using statistical techniques, such as back-testing.
iii. Exposure to market risk – Non-trading portfolios
The principal risk to which non-trading portfolios are exposed is the risk of loss from fluctuations in the future cash flows or fair values of financial instruments because of a change in market interest rates. Interest rate risk is managed principally through monitoring interest rate gaps and by having pre-approved limits for repricing bands. ALCO is the monitoring body for compliance with these limits and is assisted by Central Treasury in its day-to-day monitoring activities.
Equity price risk is subject to regular monitoring by Group Market Risk, but is not currently significant in relation to the overall results and financial position of the Group.
The effect of structural foreign exchange positions on the Group’s net investments in foreign subsidiaries and branches, together with any related net investment hedges (see Note 19), is recognised in OCI. The Group’s policy is only to hedge such exposures when not doing so would have a significant impact on the regulatory capital ratios of the Group and its banking subsidiaries. The result of this policy is that hedging generally only becomes necessary when the ratio of structural exposures in a particular currency to risk-weighted assets denominated in that currency diverges significantly from the capital ratio of the entity being considered. In addition to monitoring VaR in respect of foreign currency, the Group monitors any concentration risk in relation to any individual currency in regard to the translation of foreign currency transactions and monetary assets and liabilities into the functional currency of Group entities, and with regard to the translation of foreign operations into the presentation currency of the Group (after taking account of the impact of any qualifying net investment hedges).
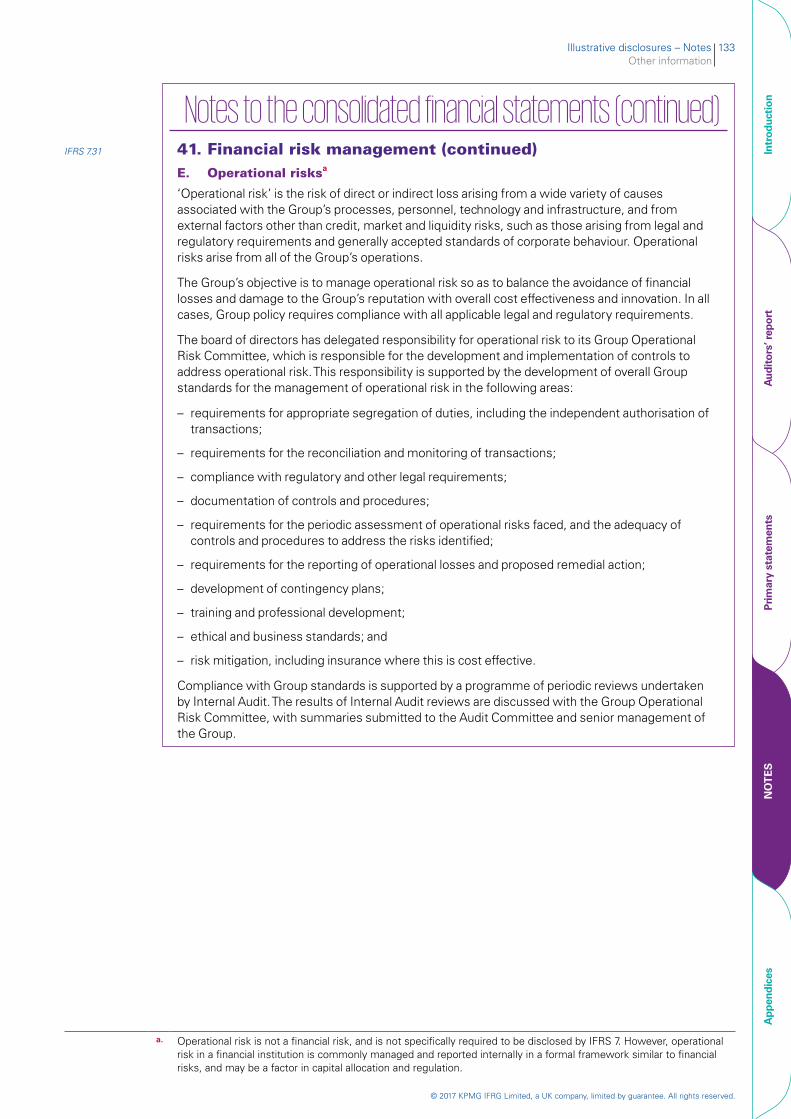
Illustrative disclosures – Notes 133Other information
© 2017 KPMG IFRG Limited, a UK company, limited by guarantee. All rights reserved.
Intr
oduc
tion
Aud
itor
s’ r
epor
tPr
imar
y st
atem
ents
NO
TE
SA
ppen
dice
s
Notes to the consolidated financial statements (continued)IFRS 7.31 41. Financial risk management (continued)
E. Operational risksa
‘Operational risk’ is the risk of direct or indirect loss arising from a wide variety of causes associated with the Group’s processes, personnel, technology and infrastructure, and from external factors other than credit, market and liquidity risks, such as those arising from legal and regulatory requirements and generally accepted standards of corporate behaviour. Operational risks arise from all of the Group’s operations.
The Group’s objective is to manage operational risk so as to balance the avoidance of financial losses and damage to the Group’s reputation with overall cost effectiveness and innovation. In all cases, Group policy requires compliance with all applicable legal and regulatory requirements.
The board of directors has delegated responsibility for operational risk to its Group Operational Risk Committee, which is responsible for the development and implementation of controls to address operational risk. This responsibility is supported by the development of overall Group standards for the management of operational risk in the following areas:
– requirements for appropriate segregation of duties, including the independent authorisation of transactions;
– requirements for the reconciliation and monitoring of transactions;
– compliance with regulatory and other legal requirements;
– documentation of controls and procedures;
– requirements for the periodic assessment of operational risks faced, and the adequacy of controls and procedures to address the risks identified;
– requirements for the reporting of operational losses and proposed remedial action;
– development of contingency plans;
– training and professional development;
– ethical and business standards; and
– risk mitigation, including insurance where this is cost effective.
Compliance with Group standards is supported by a programme of periodic reviews undertaken by Internal Audit. The results of Internal Audit reviews are discussed with the Group Operational Risk Committee, with summaries submitted to the Audit Committee and senior management of the Group.
a. Operational risk is not a financial risk, and is not specifically required to be disclosed by IFRS 7. However, operational risk in a financial institution is commonly managed and reported internally in a formal framework similar to financial risks, and may be a factor in capital allocation and regulation.
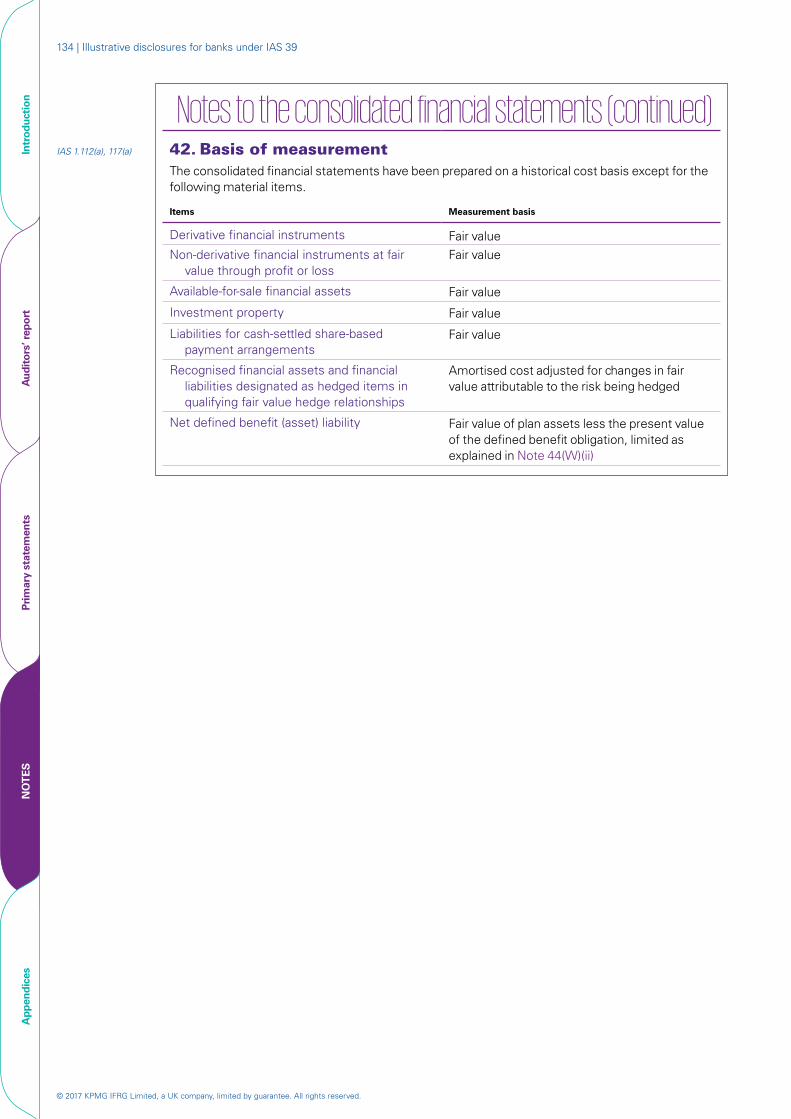
© 2017 KPMG IFRG Limited, a UK company, limited by guarantee. All rights reserved.
134 | Illustrative disclosures for banks under IAS 39
Intr
oduc
tion
Aud
itor
s’ r
epor
tPr
imar
y st
atem
ents
NO
TE
SA
ppen
dice
s
Notes to the consolidated financial statements (continued)IAS 1.112(a), 117(a) 42. Basis of measurement
The consolidated financial statements have been prepared on a historical cost basis except for the following material items.
Items Measurement basis
Derivative financial instruments Fair valueNon-derivative financial instruments at fair
value through profit or lossFair value
Available-for-sale financial assets Fair value
Investment property Fair value
Liabilities for cash-settled share-based payment arrangements
Fair value
Recognised financial assets and financial liabilities designated as hedged items in qualifying fair value hedge relationships
Amortised cost adjusted for changes in fair value attributable to the risk being hedged
Net defined benefit (asset) liability Fair value of plan assets less the present value of the defined benefit obligation, limited as explained in Note 44(W)(ii)
Illustrative disclosures – Notes 135Accounting policies
© 2017 KPMG IFRG Limited, a UK company, limited by guarantee. All rights reserved.
Intr
oduc
tion
Aud
itor
s’ r
epor
tPr
imar
y st
atem
ents
NO
TE
SA
ppen
dice
s
Notes to the consolidated financial statements (continued) 43. Changes in accounting policiesa There were no changes in accounting policies in 2016.
IAS 8.28–29 a. The changes as a result of the new standards and amendments to standards with a date of initial application of
1 January 2016 are assumed to be immaterial for the Group. For guidance on disclosures where such changes are material, see our publication Guide to annual financial statements – Illustrative disclosures, October 2016.
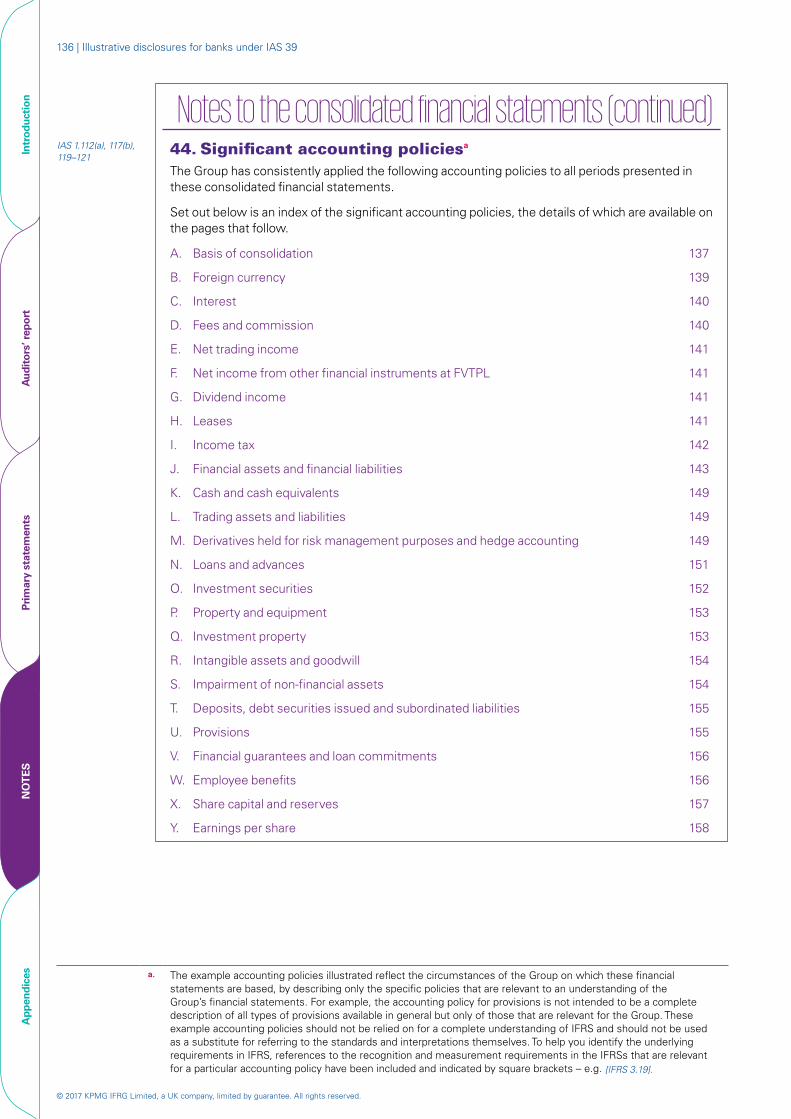
© 2017 KPMG IFRG Limited, a UK company, limited by guarantee. All rights reserved.
136 | Illustrative disclosures for banks under IAS 39
Intr
oduc
tion
Aud
itor
s’ r
epor
tPr
imar
y st
atem
ents
NO
TE
SA
ppen
dice
s
Notes to the consolidated financial statements (continued) IAS 1.112(a), 117(b), 119–121
44. Significant accounting policiesa The Group has consistently applied the following accounting policies to all periods presented in these consolidated financial statements.
Set out below is an index of the significant accounting policies, the details of which are available on the pages that follow.
A. Basis of consolidation 137
B. Foreign currency 139
C. Interest 140
D. Fees and commission 140
E. Net trading income 141
F. Net income from other financial instruments at FVTPL 141
G. Dividend income 141
H. Leases 141
I. Income tax 142
J. Financial assets and financial liabilities 143
K. Cash and cash equivalents 149
L. Trading assets and liabilities 149
M. Derivatives held for risk management purposes and hedge accounting 149
N. Loans and advances 151
O. Investment securities 152
P. Property and equipment 153
Q. Investment property 153
R. Intangible assets and goodwill 154
S. Impairment of non-financial assets 154
T. Deposits, debt securities issued and subordinated liabilities 155
U. Provisions 155
V. Financial guarantees and loan commitments 156
W. Employee benefits 156
X. Share capital and reserves 157
Y. Earnings per share 158
a. The example accounting policies illustrated reflect the circumstances of the Group on which these financial statements are based, by describing only the specific policies that are relevant to an understanding of the Group’s financial statements. For example, the accounting policy for provisions is not intended to be a complete description of all types of provisions available in general but only of those that are relevant for the Group. These example accounting policies should not be relied on for a complete understanding of IFRS and should not be used as a substitute for referring to the standards and interpretations themselves. To help you identify the underlying requirements in IFRS, references to the recognition and measurement requirements in the IFRSs that are relevant for a particular accounting policy have been included and indicated by square brackets – e.g. [IFRS 3.19].
Illustrative disclosures – Notes 137Accounting policies
© 2017 KPMG IFRG Limited, a UK company, limited by guarantee. All rights reserved.
Intr
oduc
tion
Aud
itor
s’ r
epor
tPr
imar
y st
atem
ents
NO
TE
SA
ppen
dice
s
Notes to the consolidated financial statements (continued) 44. Significant accounting policies (continued)A. Basis of consolidation
i. Business combinations
[IFRS 3.4, 32, 34, 53] The Group accounts for business combinations using the acquisition method when control is transferred to the Group (see A(iii)). The consideration transferred in the acquisition is generally measured at fair value, as are the identifiable net assets acquired. Any goodwill that arises is tested annually for impairment (see (R)). Any gain on a bargain purchase is recognised in profit or loss immediately. Transaction costs are expensed as incurred, except if they are related to the issue of debt or equity securities (see (J)(i) and (X)(ii)).
[IFRS 3.B52] The consideration transferred does not include amounts related to the settlement of pre-existing relationships. Such amounts are generally recognised in profit or loss.
[IFRS 3.58] Any contingent consideration is measured at fair value at the date of acquisition. If an obligation to pay contingent consideration that meets the definition of a financial instrument is classified as equity, then it is not remeasured and settlement is accounted for within equity. Other contingent consideration is remeasured at fair value at each reporting date and subsequent changes in the fair value of the contingent consideration are recognised in profit or loss.
[IFRS 3.30, B57–B61] If share-based payment awards (replacement awards) are required to be exchanged for awards held by the acquiree’s employees (acquiree’s awards) and relate to past services, then all or a portion of the amount of the acquirer’s replacement awards is included in measuring the consideration transferred in the business combination. This determination is based on the market-based value of the replacement awards compared with the market-based value of the acquiree’s awards and the extent to which the replacement awards relate to pre-combination service.
ii. Non-controlling interests
[IFRS 3.19] NCI are measured at their proportionate share of the acquiree’s identifiable net assets at the date of acquisition.a
[IFRS 10.23, B96] Changes in the Group’s interest in a subsidiary that do not result in a loss of control are accounted for as equity transactions.
iii. Subsidiaries
[IFRS 10.6, 20] ‘Subsidiaries’ are entities controlled by the Group. The Group ‘controls’ an entity when it is exposed to, or has rights to, variable returns from its involvement with the investee and has the ability to affect those returns through its power over the investee. The Group reassesses whether it has control if there are changes to one or more of the elements of control. This includes circumstances in which protective rights held (e.g. those resulting from a lending relationship) become substantive and lead to the Group having power over an investee.
The financial statements of subsidiaries are included in the consolidated financial statements from the date on which control commences until the date when control ceases.
[IFRS 3.19] a. An entity has a choice on a combination-by-combination basis to measure any NCI in the acquiree at either the
proportionate share of the acquiree’s identifiable net assets or fair value. The Group has elected the former approach.
© 2017 KPMG IFRG Limited, a UK company, limited by guarantee. All rights reserved.
138 | Illustrative disclosures for banks under IAS 39
Intr
oduc
tion
Aud
itor
s’ r
epor
tPr
imar
y st
atem
ents
NO
TE
SA
ppen
dice
s
Notes to the consolidated financial statements (continued) 44. Significant accounting policies (continued)A. Basis of consolidation (continued)
iii. Subsidiaries (continued)
Securitisation vehicles
IFRS 12.7(a), 9(b) Certain securitisation vehicles sponsored by the Group under its securitisation programme are run according to predetermined criteria that are part of the initial design of the vehicles. In addition, the Group is exposed to variability of returns from the vehicles through its holding of debt securities in the vehicles and by issuing financial guarantees. Outside the day-to-day servicing of the receivables (which is carried out by the Group under a servicing contract), key decisions are usually required only when receivables in the vehicles go into default. Therefore, in considering whether it has control, the Group considers whether it manages the key decisions that most significantly affect these vehicles’ returns. As a result, the Group has concluded that it controls some of these vehicles (for more information on consolidated vehicles, see Note 34).
Investment funds
IFRS 12.7(a), 9(c) The Group acts as fund manager to a number of investment funds. Determining whether the Group controls such an investment fund usually focuses on the assessment of the aggregate economic interests of the Group in the fund (comprising any carried interests and expected management fees) and the investors’ rights to remove the fund manager. For all funds managed by the Group, the investors (whose number ranges from 300 to over 1,000) are able to vote by simple majority to remove the Group as fund manager without cause, and the Group’s aggregate economic interest in each case is less than 15%. As a result, the Group has concluded that it acts as agent for the investors in all cases, and therefore has not consolidated these funds.
For further disclosure in respect of unconsolidated securitisation vehicles and investment funds in which the Group has an interest or for which it is a sponsor, see Note 34.
iv. Loss of control
[IFRS 10.25, B98–B99]
When the Group loses control over a subsidiary, it derecognises the assets and liabilities of the subsidiary, and any related NCI and other components of equity. Any resulting gain or loss is recognised in profit or loss. Any interest retained in the former subsidiary is measured at fair value when control is lost.
v. Transactions eliminated on consolidation
[IFRS 10.B86(c), IAS 28.28]
Intra-group balances and transactions, and any unrealised income and expenses (except for foreign currency transaction gains or losses) arising from intra-group transactions, are eliminated in preparing the consolidated financial statements. Unrealised losses are eliminated in the same way as unrealised gains, but only to the extent that there is no evidence of impairment.
Illustrative disclosures – Notes 139Accounting policies
© 2017 KPMG IFRG Limited, a UK company, limited by guarantee. All rights reserved.
Intr
oduc
tion
Aud
itor
s’ r
epor
tPr
imar
y st
atem
ents
NO
TE
SA
ppen
dice
s
Notes to the consolidated financial statements (continued)
44. Significant accounting policies (continued)B. Foreign currency
i. Foreign currency transactions
[IAS 21.21] Transactions in foreign currencies are translated into the respective functional currency of Group entities at the spot exchange rates at the date of the transactions.
[IAS 21.23(a)] Monetary assets and liabilities denominated in foreign currencies at the reporting date are translated into the functional currency at the spot exchange rate at that date. The foreign currency gain or loss on monetary items is the difference between the amortised cost in the functional currency at the beginning of the year, adjusted for effective interest and payments during the year, and the amortised cost in the foreign currency translated at the spot exchange rate at the end of the year.
[IAS 21.23(b)–(c)] Non-monetary assets and liabilities that are measured at fair value in a foreign currency are translated into the functional currency at the spot exchange rate at the date on which the fair value is determined. Non-monetary items that are measured based on historical cost in a foreign currency are translated using the spot exchange rate at the date of the transaction.
[IAS 39.95(a), 102(a), AG83]
Foreign currency differences arising on translation are generally recognised in profit or loss. However, foreign currency differences arising from the translation of the following items are recognised in OCI:
– available-for-sale equity instruments;
– a financial liability designated as a hedge of the net investment in a foreign operation to the extent that the hedge is effective (see (B)(ii)); and
– qualifying cash flow hedges to the extent that the hedge is effective.
ii. Foreign operations
[IAS 21.39] The assets and liabilities of foreign operations, including goodwill and fair value adjustments arising on acquisition, are translated into euro at the spot exchange rates at the reporting date. The income and expenses of foreign operations are translated into euro at the spot exchange rates at the dates of the transactions.
[IFRS 10.B94, IAS 21.41]
Foreign currency differences are recognised in OCI, and accumulated in the foreign currency translation reserve (translation reserve), except to the extent that the translation difference is allocated to NCI.
[IAS 21.48–48D] When a foreign operation is disposed of such that control is lost, the cumulative amount in the translation reserve related to that foreign operation is reclassified to profit or loss as part of the gain or loss on disposal. If the Group disposes of only part of its interest in a subsidiary that includes a foreign operation while retaining control, then the relevant proportion of the cumulative amount is reattributed to NCI.
[IAS 21.15] If the settlement of a monetary item receivable from or payable to a foreign operation is neither planned nor likely in the foreseeable future, then foreign currency differences arising on the item form part of the net investment in the foreign operation and are recognised in OCI, and accumulated in the translation reserve within equity.
iii. Hedge of a net investment in foreign operation
See (M)(iii).

© 2017 KPMG IFRG Limited, a UK company, limited by guarantee. All rights reserved.
140 | Illustrative disclosures for banks under IAS 39
Intr
oduc
tion
Aud
itor
s’ r
epor
tPr
imar
y st
atem
ents
NO
TE
SA
ppen
dice
s
Notes to the consolidated financial statements (continued)
44. Significant accounting policies (continued)IFRS 7.21, B5(e), IAS 18.35(a)
C. Interest
Interest income and expense are recognised in profit or loss using the effective interest method. The ‘effective interest rate’ is the rate that exactly discounts the estimated future cash payments and receipts through the expected life of the financial asset or financial liability (or, where appropriate, a shorter period) to the carrying amount of the financial asset or financial liability. When calculating the effective interest rate, the Group estimates future cash flows considering all contractual terms of the financial instrument, but not future credit losses.
The calculation of the effective interest rate includes transaction costs and fees and points paid or received that are an integral part of the effective interest rate. Transaction costs include incremental costs that are directly attributable to the acquisition or issue of a financial asset or financial liability.
Interest income and expense presented in the statement of profit or loss and OCI include:a
– interest on financial assets and financial liabilities measured at amortised cost calculated on an effective interest basis;
– interest on available-for-sale investment securities calculated on an effective interest basis;
– the effective portion of fair value changes in qualifying hedging derivatives designated in cash flow hedges of variability in interest cash flows, in the same period as the hedged cash flows affect interest income/expense; and
– the effective portion of fair value changes in qualifying hedging derivatives designated in fair value hedges of interest rate risk.
Interest income and expense on all trading assets and liabilities are considered to be incidental to the Group’s trading operations and are presented together with all other changes in the fair value of trading assets and liabilities in net trading income (see (E)).
Fair value changes on other derivatives held for risk management purposes, and other financial assets and financial liabilities carried at FVTPL, are presented in net income from other financial instruments at FVTPL in the statement of profit or loss and OCI (see (F)).
IFRS 7.21, IAS 18.35(a) D. Fees and commission
Fees and commission income and expense that are integral to the effective interest rate on a financial asset or financial liability are included in the measurement of the effective interest rate (see (C)).
Other fees and commission income – including account servicing fees, investment management fees, sales commission, placement fees and syndication fees – are recognised as the related services are performed. If a loan commitment is not expected to result in the draw-down of a loan, then the related loan commitment fees are recognised on a straight-line basis over the commitment period.
Other fees and commission expense relate mainly to transaction and service fees, which are expensed as the services are received.
Insights 7.8.80.20 a. IFRS allows significant scope for an entity to select its presentation of items of income and expense relating to financial
assets and financial liabilities as either interest or other line items. The manner of presentation of components of interest income and expense in this guide is not mandatory – other presentations are possible.
Illustrative disclosures – Notes 141Accounting policies
© 2017 KPMG IFRG Limited, a UK company, limited by guarantee. All rights reserved.
Intr
oduc
tion
Aud
itor
s’ r
epor
tPr
imar
y st
atem
ents
NO
TE
SA
ppen
dice
s
Notes to the consolidated financial statements (continued)
44. Significant accounting policies (continued)IFRS 7.21, B5(e) E. Net trading incomea
‘Net trading income’ comprises gains less losses related to trading assets and liabilities, and includes all realised and unrealised fair value changes, interest, dividends and foreign exchange differences.
IFRS 7.21, B5(e) F. Net income from other financial instruments at FVTPLa
Net income from other financial instruments at FVTPL relates to non-trading derivatives held for risk management purposes that do not form part of qualifying hedge relationships and financial assets and financial liabilities designated at FVTPL. It includes all realised and unrealised fair value changes, interest, dividends and foreign exchange differences.
IFRS 7.21 G. Dividend income
Dividend income is recognised when the right to receive income is established. Usually, this is the ex-dividend date for quoted equity securities. Dividends are presented in net trading income, net income from other financial instruments at FVTPL or other revenue based on the underlying classification of the equity investment.
H. Leases
i. Lease payments – Lessee [IAS 17.33, SIC-15.3] Payments made under operating leases are recognised in profit or loss on a straight-line basis
over the term of the lease. Lease incentives received are recognised as an integral part of the total lease expense, over the term of the lease.
[IAS 17.25] Minimum lease payments made under finance leases are apportioned between the finance expense and the reduction of the outstanding liability. The finance expense is allocated to each period during the lease term so as to produce a constant periodic rate of interest on the remaining balance of the liability.
Contingent lease paymentsb are accounted for by revising the minimum lease payments over the remaining term of the lease when the lease adjustment is confirmed.
ii. Lease assets – Lessee
[IAS 17.8, 20, 27] Assets held by the Group under leases that transfer to the Group substantially all of the risks and rewards of ownership are classified as finance leases. The leased asset is initially measured at an amount equal to the lower of its fair value and the present value of the minimum lease payments. Subsequent to initial recognition, the asset is accounted for in accordance with the accounting policy applicable to that asset.
[IAS 17.8] Assets held under other leases are classified as operating leases and are not recognised in the Group’s statement of financial position.
iii. Lease assets – Lessor
[IAS 17.8] If the Group is the lessor in a lease agreement that transfers substantially all of the risks and rewards incidental to ownership of the asset to the lessee, then the arrangement is classified as a finance lease and a receivable equal to the net investment in the lease is recognised and presented within loans and advances (see (N)).
Insights 7.8.80.20 a. In this guide, net trading income is presented separately from net income from other financial instruments at FVTPL based on the distinction described in the notes. However, other presentations are possible.
Insights 5.1.390.30 b. IFRS does not contain specific guidance on how to account for rent that was considered contingent at inception of the lease but is confirmed subsequently. Therefore, other policies are possible.

© 2017 KPMG IFRG Limited, a UK company, limited by guarantee. All rights reserved.
142 | Illustrative disclosures for banks under IAS 39
Intr
oduc
tion
Aud
itor
s’ r
epor
tPr
imar
y st
atem
ents
NO
TE
SA
ppen
dice
s
Notes to the consolidated financial statements (continued)
44. Significant accounting policies (continued)I. Income tax
[IAS 12.58] Income tax expense comprises current and deferred tax. It is recognised in profit or loss except to the extent that it relates to items recognised directly in equity or in OCI.
i. Current tax
[IAS 12.2, 12, 46] ‘Current tax’ comprises the expected tax payable or receivable on the taxable income or loss for the year and any adjustment to the tax payable or receivable in respect of previous years. The amount of current tax payable or receivable is the best estimate of the tax amount expected to be paid or received that reflects uncertainty related to income taxes, if any. It is measured using tax rates enacted or substantively enacted at the reporting date. Current tax also includes any tax arising from dividends.
ii. Deferred tax
[IAS 12.15, 24, 39, 44] Deferred tax is recognised in respect of temporary differences between the carrying amounts of assets and liabilities for financial reporting purposes and the amounts used for taxation purposes. Deferred tax is not recognised for:
– temporary differences on the initial recognition of assets or liabilities in a transaction that is not a business combination and that affects neither accounting nor taxable profit or loss;
– temporary differences related to investments in subsidiaries to the extent that it is probable that they will not reverse in the foreseeable future; and
– taxable temporary differences arising on the initial recognition of goodwill.
[IAS 12.56] Deferred tax assets are recognised for unused tax losses, unused tax credits and deductible temporary differences to the extent that it is probable that future taxable profits will be available against which they can be used. Future taxable profits are determined based on business plans for individual subsidiaries in the Group and the reversal of temporary differences. Deferred tax assets are reviewed at each reporting date and are reduced to the extent that it is no longer probable that the related tax benefit will be realised.
[IAS 12.37] Unrecognised deferred tax assets are reassessed at each reporting date and recognised to the extent that it has become probable that future taxable profits will be available against which they can be used.
[IAS 12.47] Deferred tax is measured at the tax rates that are expected to be applied to temporary differences when they reverse, using tax rates enacted or substantively enacted at the reporting date.
[IAS 12.51, 51C] The measurement of deferred tax reflects the tax consequences that would follow the manner in which the Group expects, at the reporting date, to recover or settle the carrying amount of its assets and liabilities. For this purpose, the carrying amount of investment property measured at fair value is presumed to be recovered through sale, and the Group has not rebutted this presumption.
[IAS 12.52B] Additional taxes that arise from the distribution of dividends by the Bank are recognised at the same time as the liability to pay the related dividend is recognised. These amounts are generally recognised in profit or loss because they generally relate to income arising from transactions that were originally recognised in profit or loss.
iii. Tax exposures
In determining the amount of current and deferred tax, the Group considers the impact of tax exposures, including whether additional taxes and interest may be due. This assessment relies on estimates and assumptions and may involve a series of judgements about future events. New information may become available that causes the Group to change its judgement regarding the adequacy of existing tax liabilities; such changes to tax liabilities would impact tax expense in the period in which such a determination is made.
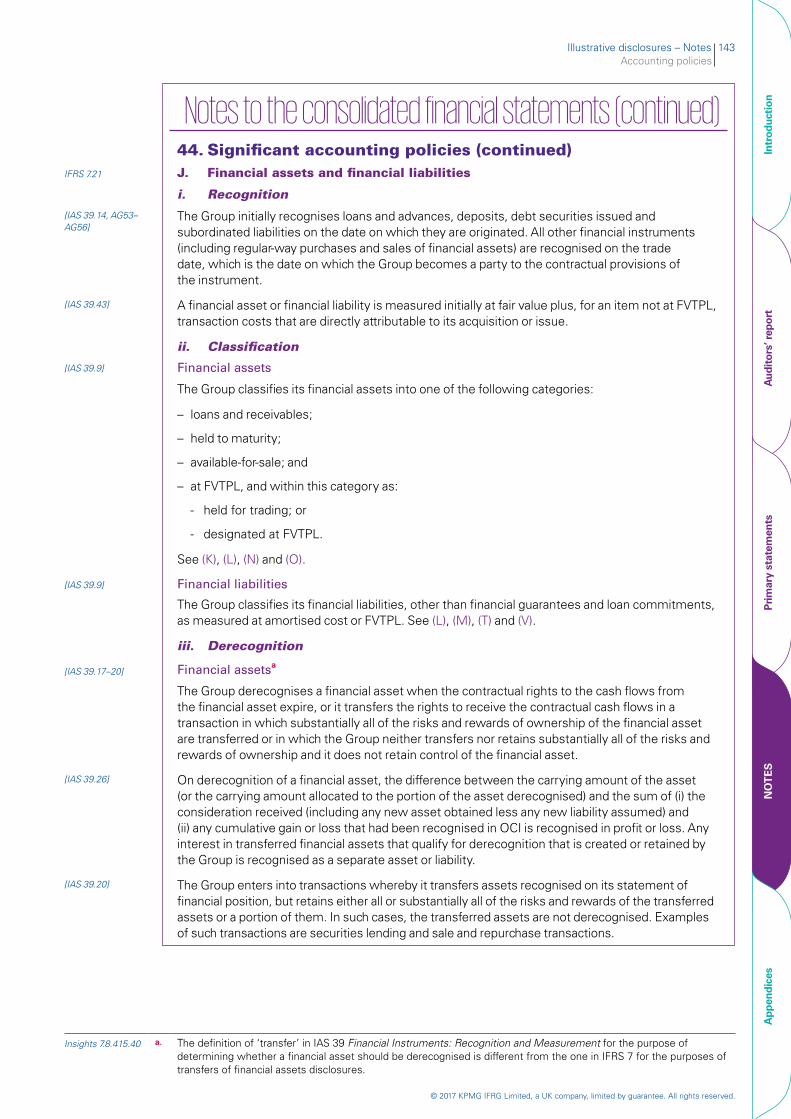
Illustrative disclosures – Notes 143Accounting policies
© 2017 KPMG IFRG Limited, a UK company, limited by guarantee. All rights reserved.
Intr
oduc
tion
Aud
itor
s’ r
epor
tPr
imar
y st
atem
ents
NO
TE
SA
ppen
dice
s
Notes to the consolidated financial statements (continued)
44. Significant accounting policies (continued)IFRS 7.21 J. Financial assets and financial liabilities
i. Recognition
[IAS 39.14, AG53–AG56]
The Group initially recognises loans and advances, deposits, debt securities issued and subordinated liabilities on the date on which they are originated. All other financial instruments (including regular-way purchases and sales of financial assets) are recognised on the trade date, which is the date on which the Group becomes a party to the contractual provisions of the instrument.
[IAS 39.43] A financial asset or financial liability is measured initially at fair value plus, for an item not at FVTPL, transaction costs that are directly attributable to its acquisition or issue.
ii. Classification
[IAS 39.9] Financial assets
The Group classifies its financial assets into one of the following categories:
– loans and receivables;
– held to maturity;
– available-for-sale; and
– at FVTPL, and within this category as:
- held for trading; or
- designated at FVTPL.
See (K), (L), (N) and (O).
[IAS 39.9] Financial liabilities
The Group classifies its financial liabilities, other than financial guarantees and loan commitments, as measured at amortised cost or FVTPL. See (L), (M), (T) and (V).
iii. Derecognition
[IAS 39.17–20] Financial assetsa
The Group derecognises a financial asset when the contractual rights to the cash flows from the financial asset expire, or it transfers the rights to receive the contractual cash flows in a transaction in which substantially all of the risks and rewards of ownership of the financial asset are transferred or in which the Group neither transfers nor retains substantially all of the risks and rewards of ownership and it does not retain control of the financial asset.
[IAS 39.26] On derecognition of a financial asset, the difference between the carrying amount of the asset (or the carrying amount allocated to the portion of the asset derecognised) and the sum of (i) the consideration received (including any new asset obtained less any new liability assumed) and (ii) any cumulative gain or loss that had been recognised in OCI is recognised in profit or loss. Any interest in transferred financial assets that qualify for derecognition that is created or retained by the Group is recognised as a separate asset or liability.
[IAS 39.20] The Group enters into transactions whereby it transfers assets recognised on its statement of financial position, but retains either all or substantially all of the risks and rewards of the transferred assets or a portion of them. In such cases, the transferred assets are not derecognised. Examples of such transactions are securities lending and sale and repurchase transactions.
Insights 7.8.415.40 a. The definition of ‘transfer’ in IAS 39 Financial Instruments: Recognition and Measurement for the purpose of determining whether a financial asset should be derecognised is different from the one in IFRS 7 for the purposes of transfers of financial assets disclosures.
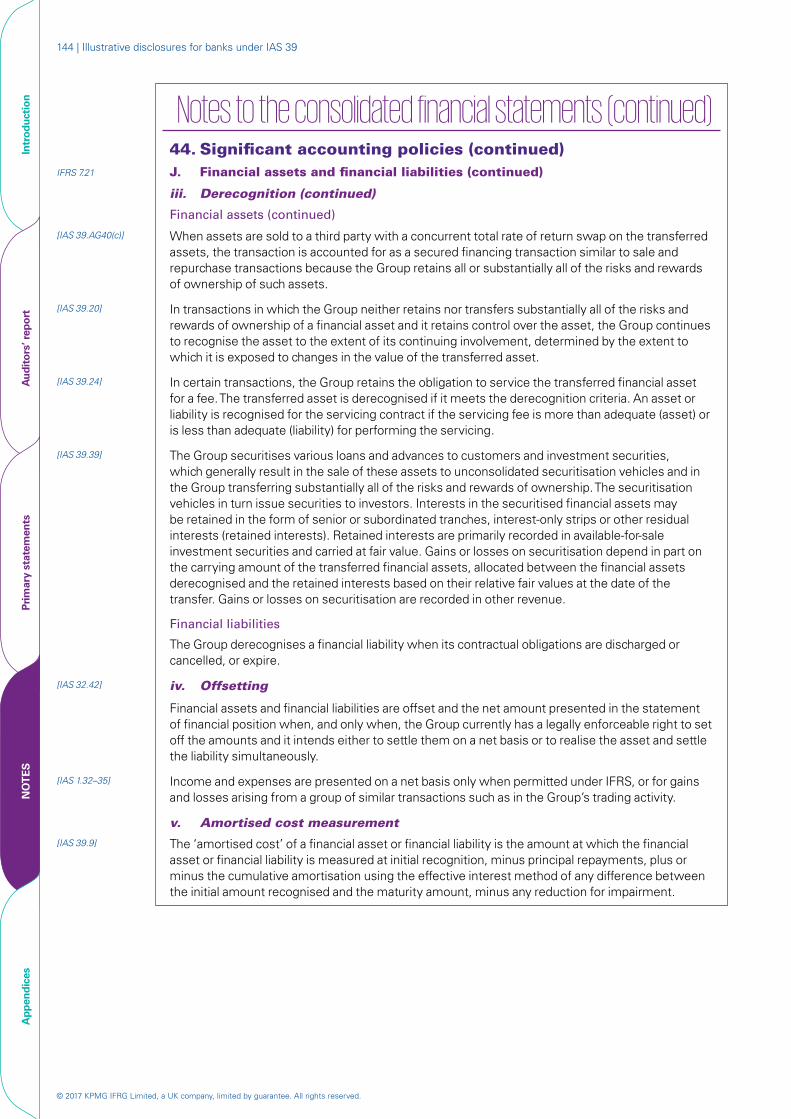
© 2017 KPMG IFRG Limited, a UK company, limited by guarantee. All rights reserved.
144 | Illustrative disclosures for banks under IAS 39
Intr
oduc
tion
Aud
itor
s’ r
epor
tPr
imar
y st
atem
ents
NO
TE
SA
ppen
dice
s
Notes to the consolidated financial statements (continued)
44. Significant accounting policies (continued)IFRS 7.21 J. Financial assets and financial liabilities (continued)
iii. Derecognition (continued)
Financial assets (continued)
[IAS 39.AG40(c)] When assets are sold to a third party with a concurrent total rate of return swap on the transferred assets, the transaction is accounted for as a secured financing transaction similar to sale and repurchase transactions because the Group retains all or substantially all of the risks and rewards of ownership of such assets.
[IAS 39.20] In transactions in which the Group neither retains nor transfers substantially all of the risks and rewards of ownership of a financial asset and it retains control over the asset, the Group continues to recognise the asset to the extent of its continuing involvement, determined by the extent to which it is exposed to changes in the value of the transferred asset.
[IAS 39.24] In certain transactions, the Group retains the obligation to service the transferred financial asset for a fee. The transferred asset is derecognised if it meets the derecognition criteria. An asset or liability is recognised for the servicing contract if the servicing fee is more than adequate (asset) or is less than adequate (liability) for performing the servicing.
[IAS 39.39] The Group securitises various loans and advances to customers and investment securities, which generally result in the sale of these assets to unconsolidated securitisation vehicles and in the Group transferring substantially all of the risks and rewards of ownership. The securitisation vehicles in turn issue securities to investors. Interests in the securitised financial assets may be retained in the form of senior or subordinated tranches, interest-only strips or other residual interests (retained interests). Retained interests are primarily recorded in available-for-sale investment securities and carried at fair value. Gains or losses on securitisation depend in part on the carrying amount of the transferred financial assets, allocated between the financial assets derecognised and the retained interests based on their relative fair values at the date of the transfer. Gains or losses on securitisation are recorded in other revenue.
Financial liabilities
The Group derecognises a financial liability when its contractual obligations are discharged or cancelled, or expire.
[IAS 32.42] iv. Offsetting
Financial assets and financial liabilities are offset and the net amount presented in the statement of financial position when, and only when, the Group currently has a legally enforceable right to set off the amounts and it intends either to settle them on a net basis or to realise the asset and settle the liability simultaneously.
[IAS 1.32–35] Income and expenses are presented on a net basis only when permitted under IFRS, or for gains and losses arising from a group of similar transactions such as in the Group’s trading activity.
v. Amortised cost measurement
[IAS 39.9] The ‘amortised cost’ of a financial asset or financial liability is the amount at which the financial asset or financial liability is measured at initial recognition, minus principal repayments, plus or minus the cumulative amortisation using the effective interest method of any difference between the initial amount recognised and the maturity amount, minus any reduction for impairment.
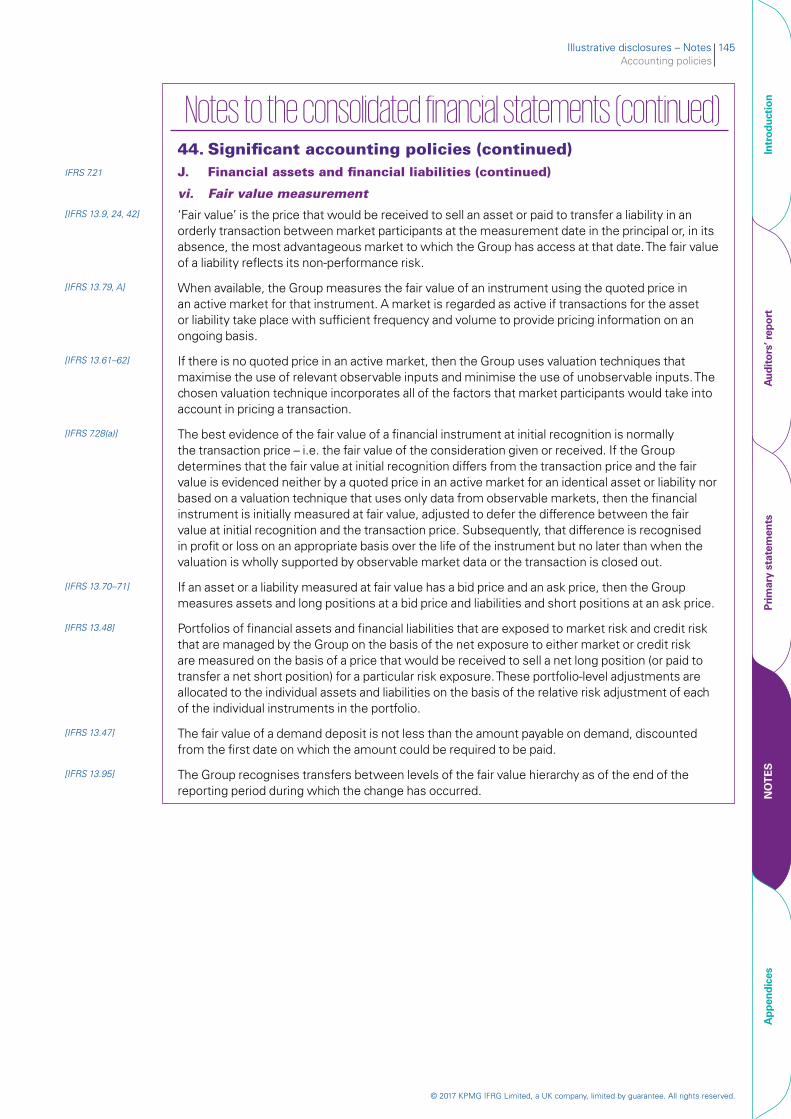
Illustrative disclosures – Notes 145Accounting policies
© 2017 KPMG IFRG Limited, a UK company, limited by guarantee. All rights reserved.
Intr
oduc
tion
Aud
itor
s’ r
epor
tPr
imar
y st
atem
ents
NO
TE
SA
ppen
dice
s
Notes to the consolidated financial statements (continued)
44. Significant accounting policies (continued)IFRS 7.21 J. Financial assets and financial liabilities (continued)
vi. Fair value measurement
[IFRS 13.9, 24, 42] ‘Fair value’ is the price that would be received to sell an asset or paid to transfer a liability in an orderly transaction between market participants at the measurement date in the principal or, in its absence, the most advantageous market to which the Group has access at that date. The fair value of a liability reflects its non-performance risk.
[IFRS 13.79, A] When available, the Group measures the fair value of an instrument using the quoted price in an active market for that instrument. A market is regarded as active if transactions for the asset or liability take place with sufficient frequency and volume to provide pricing information on an ongoing basis.
[IFRS 13.61–62] If there is no quoted price in an active market, then the Group uses valuation techniques that maximise the use of relevant observable inputs and minimise the use of unobservable inputs. The chosen valuation technique incorporates all of the factors that market participants would take into account in pricing a transaction.
[IFRS 7.28(a)] The best evidence of the fair value of a financial instrument at initial recognition is normally the transaction price – i.e. the fair value of the consideration given or received. If the Group determines that the fair value at initial recognition differs from the transaction price and the fair value is evidenced neither by a quoted price in an active market for an identical asset or liability nor based on a valuation technique that uses only data from observable markets, then the financial instrument is initially measured at fair value, adjusted to defer the difference between the fair value at initial recognition and the transaction price. Subsequently, that difference is recognised in profit or loss on an appropriate basis over the life of the instrument but no later than when the valuation is wholly supported by observable market data or the transaction is closed out.
[IFRS 13.70–71] If an asset or a liability measured at fair value has a bid price and an ask price, then the Group measures assets and long positions at a bid price and liabilities and short positions at an ask price.
[IFRS 13.48] Portfolios of financial assets and financial liabilities that are exposed to market risk and credit risk that are managed by the Group on the basis of the net exposure to either market or credit risk are measured on the basis of a price that would be received to sell a net long position (or paid to transfer a net short position) for a particular risk exposure. These portfolio-level adjustments are allocated to the individual assets and liabilities on the basis of the relative risk adjustment of each of the individual instruments in the portfolio.
[IFRS 13.47] The fair value of a demand deposit is not less than the amount payable on demand, discounted from the first date on which the amount could be required to be paid.
[IFRS 13.95] The Group recognises transfers between levels of the fair value hierarchy as of the end of the reporting period during which the change has occurred.
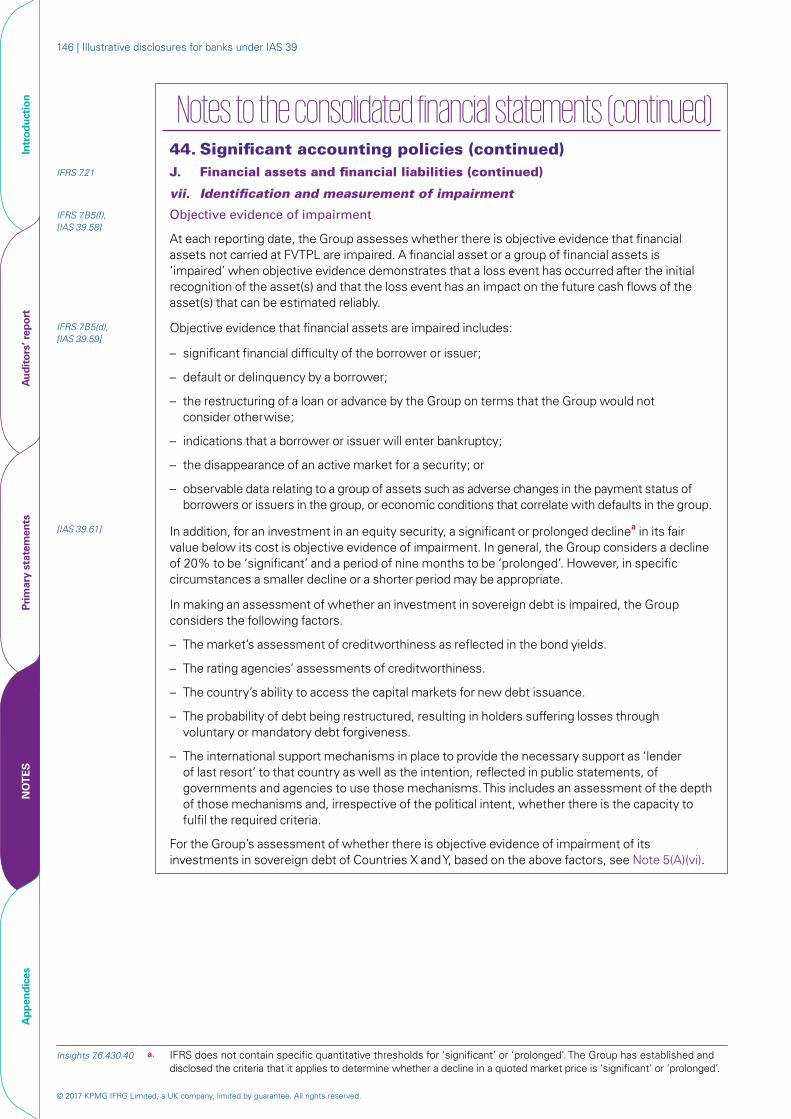
© 2017 KPMG IFRG Limited, a UK company, limited by guarantee. All rights reserved.
146 | Illustrative disclosures for banks under IAS 39
Intr
oduc
tion
Aud
itor
s’ r
epor
tPr
imar
y st
atem
ents
NO
TE
SA
ppen
dice
s
Notes to the consolidated financial statements (continued)
44. Significant accounting policies (continued)IFRS 7.21 J. Financial assets and financial liabilities (continued)
vii. Identification and measurement of impairment
IFRS 7.B5(f), [IAS 39.58]
Objective evidence of impairment
At each reporting date, the Group assesses whether there is objective evidence that financial assets not carried at FVTPL are impaired. A financial asset or a group of financial assets is ‘impaired’ when objective evidence demonstrates that a loss event has occurred after the initial recognition of the asset(s) and that the loss event has an impact on the future cash flows of the asset(s) that can be estimated reliably.
IFRS 7.B5(d), [IAS 39.59]
Objective evidence that financial assets are impaired includes:
– significant financial difficulty of the borrower or issuer;
– default or delinquency by a borrower;
– the restructuring of a loan or advance by the Group on terms that the Group would not consider otherwise;
– indications that a borrower or issuer will enter bankruptcy;
– the disappearance of an active market for a security; or
– observable data relating to a group of assets such as adverse changes in the payment status of borrowers or issuers in the group, or economic conditions that correlate with defaults in the group.
[IAS 39.61] In addition, for an investment in an equity security, a significant or prolonged declinea in its fair value below its cost is objective evidence of impairment. In general, the Group considers a decline of 20% to be ‘significant’ and a period of nine months to be ‘prolonged’. However, in specific circumstances a smaller decline or a shorter period may be appropriate.
In making an assessment of whether an investment in sovereign debt is impaired, the Group considers the following factors.
– The market’s assessment of creditworthiness as reflected in the bond yields.
– The rating agencies’ assessments of creditworthiness.
– The country’s ability to access the capital markets for new debt issuance.
– The probability of debt being restructured, resulting in holders suffering losses through voluntary or mandatory debt forgiveness.
– The international support mechanisms in place to provide the necessary support as ‘lender of last resort’ to that country as well as the intention, reflected in public statements, of governments and agencies to use those mechanisms. This includes an assessment of the depth of those mechanisms and, irrespective of the political intent, whether there is the capacity to fulfil the required criteria.
For the Group’s assessment of whether there is objective evidence of impairment of its investments in sovereign debt of Countries X and Y, based on the above factors, see Note 5(A)(vi).
Insights 7.6.430.40 a. IFRS does not contain specific quantitative thresholds for ‘significant’ or ‘prolonged’. The Group has established and disclosed the criteria that it applies to determine whether a decline in a quoted market price is ‘significant’ or ‘prolonged’.
Illustrative disclosures – Notes 147Accounting policies
© 2017 KPMG IFRG Limited, a UK company, limited by guarantee. All rights reserved.
Intr
oduc
tion
Aud
itor
s’ r
epor
tPr
imar
y st
atem
ents
NO
TE
SA
ppen
dice
s
Notes to the consolidated financial statements (continued)
44. Significant accounting policies (continued)IFRS 7.21 J. Financial assets and financial liabilities (continued)
vii. Identification and measurement of impairment (continued)[IAS 39.63–64] Individual and collective assessment
The Group considers evidence of impairment for loans and advances and held-to-maturity investment securities at both a specific asset and a collective level. All individually significant loans and advances and held-to-maturity investment securities are assessed for specific impairment.
Those found not to be specifically impaired are then collectively assessed for any impairment that has been incurred but not yet identified. Loans and advances and held-to-maturity investment securities that are not individually significant are collectively assessed for impairment by grouping together loans and advances and held-to-maturity investment securities with similar risk characteristics.
The individual component of the total allowance for impairment applies to financial assets evaluated individually for impairment, and found to be individually impaired, and is based on management’s best estimate of the present value of the cash flows that are expected to be received. In estimating these cash flows, management makes judgements about a debtor’s financial situation and the net realisable value of any underlying collateral. Each impaired asset is assessed on its merits, and the workout strategy and estimate of cash flows considered recoverable are independently approved by the Credit Risk function.
A collective component of the total allowance is established for:
– groups of homogeneous loans that are not considered individually significant; and
– groups of assets that are individually significant but that were not found to be individually impaired (loss ‘incurred but not reported’ or IBNR).
The collective allowance for groups of homogeneous loans is established using statistical methods such as roll rate methodology or, for small portfolios with insufficient information, a formula approach based on historical loss rate experience. The roll rate methodology uses statistical analysis of historical data on delinquency to estimate the amount of loss. Management applies judgement to ensure that the estimate of loss arrived at on the basis of historical information is appropriately adjusted to reflect the economic conditions and product mix at the reporting date. Roll rates and loss rates are regularly benchmarked against actual loss experience.
The IBNR allowance covers credit losses inherent in portfolios of loans and advances, and held-to-maturity investment securities with similar credit risk characteristics when there is objective evidence to suggest that they contain impaired items but the individual impaired items cannot yet be identified.
The IBNR allowance is based on historical loss rates, adjusted to reflect the current economic conditions affecting the portfolio. It reflects assumptions made about the loss emergence period – i.e. the period between a loss event occurring and it being identified. Management estimates a loss emergence period for each identified portfolio and back-tests these estimates against past experience. The factors that may influence the loss emergence period include economic and market conditions, customer behaviour, portfolio management information, credit management process and collection experience.
In assessing the collective loss allowance, management considers factors such as credit quality, portfolio size, concentrations and economic factors. To estimate the required allowance, assumptions are made to define how inherent losses are modelled and to determine the required input parameters, based on historical experience and current economic conditions. The accuracy of the allowance depends on the model assumptions and parameters used in determining the collective allowance.
[IAS 39.63]
Measurement
Impairment losses on assets measured at amortised cost are calculated as the difference between the carrying amount and the present value of estimated future cash flows discounted at the asset’s original effective interest rate.
© 2017 KPMG IFRG Limited, a UK company, limited by guarantee. All rights reserved.
148 | Illustrative disclosures for banks under IAS 39
Intr
oduc
tion
Aud
itor
s’ r
epor
tPr
imar
y st
atem
ents
NO
TE
SA
ppen
dice
s
Notes to the consolidated financial statements (continued)
44. Significant accounting policies (continued)IFRS 7.21 J. Financial assets and financial liabilities (continued)
vii. Identification and measurement of impairment (continued)
Measurement (continued)
If the terms of a financial asset are renegotiated or modified or an existing financial asset is replaced with a new one due to financial difficulties of the borrower, then an assessment is made of whether the financial asset should be derecognised. If the cash flows of the renegotiated asset are substantially different, then the contractual rights to cash flows from the original financial asset are deemed to have expired. In this case, the original financial asset is derecognised and the new financial asset is recognised at fair value. The impairment loss before an expected restructuring is measured as follows.
– If the expected restructuring will not result in derecognition of the existing asset, then the estimated cash flows arising from the modified financial asset are included in the measurement of the existing asset based on their expected timing and amounts discounted at the original effective interest rate of the existing financial asset.
– If the expected restructuring will result in derecognition of the existing asset, then the expected fair value of the new asset is treated as the final cash flow from the existing financial asset at the time of its derecognition. This amount is discounted from the expected date of derecognition to the reporting date using the original effective interest rate of the existing financial asset.
IFRS 7.B5(d), [IAS 39.65]
Impairment losses are recognised in profit or loss and reflected in an allowance account against loans and receivables or held-to-maturity investment securities. Interest on the impaired assets continues to be recognised through the unwinding of the discount. If an event occurring after the impairment was recognised causes the amount of impairment loss to decrease, then the decrease in impairment loss is reversed through profit or loss.
[IAS 39.67–68] Impairment losses on available-for-sale investment securities are recognised by reclassifying the losses accumulated in the fair value reserve in equity to profit or loss. The cumulative loss that is reclassified from equity to profit or loss is the difference between the acquisition cost, net of any principal repayment and amortisation, and the current fair value, less any impairment loss previously recognised in profit or loss. Changes in impairment attributable to application of the effective interest method are reflected as a component of interest income.
[IAS 39.69–70]
Reversal of impairment and write-offs
If, in a subsequent period, the fair value of an impaired available-for-sale debt security increases and the increase can be related objectively to an event occurring after the impairment loss was recognised, then the impairment loss is reversed through profit or loss; otherwise, any increase in fair value is recognised through OCI. Any subsequent recovery in the fair value of an impaired available-for-sale equity security is always recognised in OCI.
[IAS 39.63] The Group writes off a loan or an investment debt security, either partially or in full, and any related allowance for impairment losses, when Group Credit determines that there is no realistic prospect of recovery.
Illustrative disclosures – Notes 149Accounting policies
© 2017 KPMG IFRG Limited, a UK company, limited by guarantee. All rights reserved.
Intr
oduc
tion
Aud
itor
s’ r
epor
tPr
imar
y st
atem
ents
NO
TE
SA
ppen
dice
s
Notes to the consolidated financial statements (continued)
44. Significant accounting policies (continued)IFRS 7.21 J. Financial assets and financial liabilities (continued)
viii. Designation at FVTPL
IFRS 7.21, B5(a) The Group has designated financial assets and financial liabilities at FVTPL in either of the following circumstances.
– The assets or liabilities are managed, evaluated and reported internally on a fair value basis.
– The designation eliminates or significantly reduces an accounting mismatch that would otherwise arise.
Note 17 sets out the amount of each class of financial asset or financial liability that has been designated at FVTPL. A description of the basis for each designation is set out in the note for the relevant asset or liability class.
[IAS 7.46] K. Cash and cash equivalents
‘Cash and cash equivalents’ include notes and coins on hand, unrestricted balances held with central banks and highly liquid financial assets with original maturities of three months or less from the date of acquisition that are subject to an insignificant risk of changes in their fair value, and are used by the Group in the management of its short-term commitments.
Cash and cash equivalents are carried at amortised cost in the statement of financial position.
IFRS 7.21 L. Trading assets and liabilities
‘Trading assets and liabilities’ are those assets and liabilities that the Group acquires or incurs principally for the purpose of selling or repurchasing in the near term, or holds as part of a portfolio that is managed together for short-term profit or position taking.
[IAS 39.43, 46–47, 50, 50B, 50D]
Trading assets and liabilities are initially recognised and subsequently measured at fair value in the statement of financial position, with transaction costs recognised in profit or loss. All changes in fair value are recognised as part of net trading income in profit or loss. Trading assets and liabilities are not reclassified subsequent to their initial recognition, except that non-derivative trading assets, other than those designated at FVTPL on initial recognition, may be reclassified out of the FVTPL – i.e. trading – category if they are no longer held for the purpose of being sold or repurchased in the near term and the following conditions are met.
– If the financial asset would have met the definition of loans and receivables (if the financial asset had not been required to be classified as held-for-trading on initial recognition), then it may be reclassified if the Group has the intention and ability to hold the financial asset for the foreseeable future or until maturity.
– If the financial asset would not have met the definition of loans and receivables, then it may be reclassified out of the trading category only in rare circumstances.
IFRS 7.21 M. Derivatives held for risk management purposesa and hedge accounting
Derivatives held for risk management purposes include all derivative assets and liabilities that are not classified as trading assets or liabilities. Derivatives held for risk management purposes are measured at fair value in the statement of financial position.
a. In this guide, the classes of financial instruments reflect the Group’s activities. Accordingly, derivatives are presented
either as trading assets or liabilities or as derivative assets or liabilities held for risk management purposes to reflect the Group’s two uses of derivatives. Derivatives held for risk management purposes include qualifying hedge instruments and non-qualifying hedge instruments held for risk management purposes rather than for trading. However, other presentations are possible.
© 2017 KPMG IFRG Limited, a UK company, limited by guarantee. All rights reserved.
150 | Illustrative disclosures for banks under IAS 39
Intr
oduc
tion
Aud
itor
s’ r
epor
tPr
imar
y st
atem
ents
NO
TE
SA
ppen
dice
s
Notes to the consolidated financial statements (continued)
44. Significant accounting policies (continued)IFRS 7.21 M. Derivatives held for risk management purposes and hedge accounting
(continued)
The Group designates certain derivatives held for risk management as well as certain non-derivative financial instruments as hedging instruments in qualifying hedging relationships. On initial designation of the hedge, the Group formally documents the relationship between the hedging instrument(s) and hedged item(s), including the risk management objective and strategy in undertaking the hedge, together with the method that will be used to assess the effectiveness of the hedging relationship. The Group makes an assessment, both at inception of the hedge relationship and on an ongoing basis, of whether the hedging instrument(s) is(are) expected to be highly effective in offsetting the changes in the fair value or cash flows of the respective hedged item(s) during the period for which the hedge is designated, and whether the actual results of each hedge are within a range of 80–125%. The Group makes an assessment for a cash flow hedge of a forecast transaction, of whether the forecast transaction is highly probable to occur and presents an exposure to variations in cash flows that could ultimately affect profit or loss.
These hedging relationships are discussed below.
i. Fair value hedges
[IAS 39.89, 91–92] When a derivative is designated as the hedging instrument in a hedge of the change in fair value of a recognised asset or liability or a firm commitment that could affect profit or loss, changes in the fair value of the derivative are recognised immediately in profit or loss together with changes in the fair value of the hedged item that are attributable to the hedged risk (in the same line item in the statement of profit or loss and OCI as the hedged item).
If the hedging derivative expires or is sold, terminated or exercised, or the hedge no longer meets the criteria for fair value hedge accounting, or the hedge designation is revoked, then hedge accounting is discontinued prospectively. However, if the derivative is novated to a central counterparty by both parties as a consequence of laws or regulations without changes in its terms except for those that are necessary for the novation, then the derivative is not considered as expired or terminated.
Any adjustment up to the point of discontinuation to a hedged item for which the effective interest method is used is amortised to profit or loss as part of the recalculated effective interest rate of the item over its remaining life.
ii. Cash flow hedges
[IAS 39.95, 97] When a derivative is designated as the hedging instrument in a hedge of the variability in cash flows attributable to a particular risk associated with a recognised asset or liability that could affect profit or loss, the effective portion of changes in the fair value of the derivative is recognised in OCI and presented in the hedging reserve within equity. Any ineffective portion of changes in the fair value of the derivative is recognised immediately in profit or loss. The amount recognised in OCI is reclassified to profit or loss as a reclassification adjustment in the same period as the hedged cash flows affect profit or loss, and in the same line item in the statement of profit or loss and OCI.
[IAS 39.101] If the hedging derivative expires or is sold, terminated or exercised, or the hedge no longer meets the criteria for cash flow hedge accounting, or the hedge designation is revoked, then hedge accounting is discontinued prospectively. However, if the derivative is novated to a central counterparty by both parties as a consequence of laws or regulations without changes in its terms except for those that are necessary for the novation, then the derivative is not considered as expired or terminated.
Illustrative disclosures – Notes 151Accounting policies
© 2017 KPMG IFRG Limited, a UK company, limited by guarantee. All rights reserved.
Intr
oduc
tion
Aud
itor
s’ r
epor
tPr
imar
y st
atem
ents
NO
TE
SA
ppen
dice
s
Notes to the consolidated financial statements (continued)
44. Significant accounting policies (continued)IFRS 7.21 M. Derivatives held for risk management purposes and hedge accounting
(continued)
iii. Net investment hedges[IAS 39.102] When a derivative instrument or a non-derivative financial liability is designated as the hedging
instrument in a hedge of a net investment in a foreign operation, the effective portion of changes in the fair value of the hedging instrument is recognised in OCI and presented in the translation reserve within equity. Any ineffective portion of the changes in the fair value of the derivative is recognised immediately in profit or loss. The amount recognised in OCI is reclassified to profit or loss as a reclassification adjustment on disposal of the foreign operation.
iv. Other non-trading derivatives
If a derivative is not held for trading, and is not designated in a qualifying hedge relationship, then all changes in its fair value are recognised immediately in profit or loss as a component of net income from other financial instruments at FVTPL.
v. Embedded derivativesa
[IAS 39.10–11] Derivatives may be embedded in another contractual arrangement (a host contract). The Group accounts for an embedded derivative separately from the host contract when:
– the host contract is not itself carried at FVTPL;
– the terms of the embedded derivative would meet the definition of a derivative if they were contained in a separate contract; and
– the economic characteristics and risks of the embedded derivative are not closely related to the economic characteristics and risks of the host contract.
Separated embedded derivatives are measured at fair value, with all changes in fair value recognised in profit or loss unless they form part of a qualifying cash flow or net investment hedging relationship. Separated embedded derivatives are presented in the statement of financial position together with the host contract.
IFRS 7.21 N. Loans and advances
[IAS 39.9] ‘Loans and advances’ are non-derivative financial assets with fixed or determinable payments that are not quoted in an active market and that the Group does not intend to sell immediately or in the near term.
Loans and advances to banks are classified as loans and receivables. Loans and advances to customers include:
– those classified as loans and receivables;
– those designated as at FVTPL; and
– finance lease receivables.
[IAS 39.43, 46] Loans and advances are initially measured at fair value plus incremental direct transaction costs, and subsequently measured at their amortised cost using the effective interest method. When the Group chooses to designate the loans and advances as measured at FVTPL as described in (J)(viii), they are measured at fair value with face value changes recognised immediately in profit or loss.
IAS 39.11, Insights 7.8.200, 7.2.410.10
a. IAS 39 does not specify where a separated embedded derivative component is presented in the statement of financial position. In this guide, an embedded derivative component that is separated from the host contract is presented in the same line item in the statement of financial position as the related host contract. However, other presentations are possible.
© 2017 KPMG IFRG Limited, a UK company, limited by guarantee. All rights reserved.
152 | Illustrative disclosures for banks under IAS 39
Intr
oduc
tion
Aud
itor
s’ r
epor
tPr
imar
y st
atem
ents
NO
TE
SA
ppen
dice
s
Notes to the consolidated financial statements (continued)
44. Significant accounting policies (continued)IFRS 7.21 N. Loans and advances (continued)
Loans and advances also include finance lease receivables in which the Group is the lessor (see (H)).
When the Group purchases a financial asset and simultaneously enters into an agreement to resell the asset (or a substantially similar asset) at a fixed price on a future date (reverse repo or stock borrowing), the arrangement is accounted for as a loan or advance, and the underlying asset is not recognised in the Group’s financial statements.
IFRS 7.21 O. Investment securities
[IAS 39.9, 43, 45–46] Investment securities are initially measured at fair value plus, in the case of investment securities not at FVTPL, incremental direct transaction costs, and subsequently accounted for depending on their classification as either held to maturity, FVTPL or available-for-sale.
i. Held-to-maturity
[IAS 39.9, 46] ‘Held-to-maturity investments’ are non-derivative assets with fixed or determinable payments and fixed maturity that the Group has the positive intent and ability to hold to maturity, and which are not designated as at FVTPL or as available-for-sale.
Held-to-maturity investments are carried at amortised cost using the effective interest method, less any impairment losses (see (J)(vii)). A sale or reclassification of a more than insignificant amount of held-to-maturity investments would result in the reclassification of all held-to-maturity investments as available-for-sale, and would prevent the Group from classifying investment securities as held-to-maturity for the current and the following two financial years. However, sales and reclassifications in any of the following circumstances would not trigger a reclassification:
– sales or reclassifications that are so close to maturity that changes in the market rate of interest would not have a significant effect on the financial asset’s fair value;
– sales or reclassifications after the Group has collected substantially all of the asset’s original principal; and
– sales or reclassifications that are attributable to non-recurring isolated events beyond the Group’s control that could not have been reasonably anticipated.
ii. Fair value through profit or loss
[IAS 39.9] The Group designates some investment securities as at fair value, with fair value changes recognised immediately in profit or loss as described in (J)(viii).
iii. Available-for-sale
[IAS 39.9, 46] ‘Available-for-sale investments’ are non-derivative investments that are designated as available-for-sale or are not classified as another category of financial assets. Available-for-sale investments comprise equity securities and debt securities. Unquoted equity securities whose fair value cannot be measured reliably are carried at cost. All other available-for-sale investments are measured at fair value after initial recognition.
[IAS 39.55] Interest income is recognised in profit or loss using the effective interest method. Dividend income is recognised in profit or loss when the Group becomes entitled to the dividend (see (G)). Foreign exchange gains or losses on available-for-sale debt security investments are recognised in profit or loss (see (B)(i)). Impairment losses are recognised in profit or loss (see (J)(vii)).
[IAS 39.55] Other fair value changes, other than impairment losses (see (J)(vii)), are recognised in OCI and presented in the fair value reserve within equity. When the investment is sold, the gain or loss accumulated in equity is reclassified to profit or loss.
Illustrative disclosures – Notes 153Accounting policies
© 2017 KPMG IFRG Limited, a UK company, limited by guarantee. All rights reserved.
Intr
oduc
tion
Aud
itor
s’ r
epor
tPr
imar
y st
atem
ents
NO
TE
SA
ppen
dice
s
Notes to the consolidated financial statements (continued)
44. Significant accounting policies (continued)IFRS 7.21 O. Investment securities (continued)
iii. Available-for-sale (continued)[IAS 39.50E] A non-derivative financial asset may be reclassified from the available-for-sale category to the loans
and receivables category if it would otherwise have met the definition of loans and receivables and if the Group has the intention and ability to hold that financial asset for the foreseeable future or until maturity.
P. Property and equipment
IAS 16.73(a) i. Recognition and measurement[IAS 16.30] Items of property and equipment are measured at cost, which includes capitalised borrowing
costs, less accumulated depreciation and any accumulated impairment losses.
Purchased software that is integral to the functionality of the related equipment is capitalised as part of that equipment.
[IAS 16.45] If significant parts of an item of property or equipment have different useful lives, then they are accounted for as separate items (major components) of property and equipment.
[IAS 16.41, 71] Any gain or loss on disposal of an item of property and equipment is recognised within other income in profit or loss.
ii. Subsequent costs
[IAS 16.13] Subsequent expenditure is capitalised only when it is probable that the future economic benefits of the expenditure will flow to the Group. Ongoing repairs and maintenance are expensed as incurred.
iii. Depreciation
[IAS 16.53, 58, 60], IAS 16.73(b)
Depreciation is calculated to write off the cost of items of property and equipment less their estimated residual values using the straight-line method over their estimated useful lives, and is generally recognised in profit or loss. Leased assets are depreciated over the shorter of the lease term and their useful lives unless it is reasonably certain that the Group will obtain ownership by the end of the lease term. Land is not depreciated.
IAS 16.73(c) The estimated useful lives of significant items of property and equipment are as follows:
– buildings
– IT equipment
– fixtures and fittings
40 years;
3–5 years; and
5–10 years.
Depreciation methods, useful lives and residual values are reviewed at each reporting date and adjusted if appropriate.
[IAS 40.7, 33, 35] Q. Investment property
IAS 40.75(a) Investment property is initially measured at cost and subsequently at fair value, with any change therein recognised in profit or loss within other income.
[IAS 40.60] When the use of a property changes such that it is reclassified as property and equipment, its fair value at the date of reclassification becomes its cost for subsequent accounting.
© 2017 KPMG IFRG Limited, a UK company, limited by guarantee. All rights reserved.
154 | Illustrative disclosures for banks under IAS 39
Intr
oduc
tion
Aud
itor
s’ r
epor
tPr
imar
y st
atem
ents
NO
TE
SA
ppen
dice
s
Notes to the consolidated financial statements (continued)
44. Significant accounting policies (continued)R. Intangible assets and goodwill
i. Goodwill
[IAS 38.107–108] Goodwill that arises on the acquisition of subsidiaries is presented with intangible assets (see (A)(i)). Subsequent to initial recognition, goodwill is measured at cost less accumulated impairment losses.
ii. Software
[IAS 38.74] Software acquired by the Group is measured at cost less accumulated amortisation and any accumulated impairment losses.
[IAS 38.57, 66] Expenditure on internally developed software is recognised as an asset when the Group is able to demonstrate its intention and ability to complete the development and use the software in a manner that will generate future economic benefits, and can reliably measure the costs to complete the development. The capitalised costs of internally developed software include all costs directly attributable to developing the software and capitalised borrowing costs, and are amortised over its useful life. Internally developed software is stated at capitalised cost less accumulated amortisation and any accumulated impairment losses.
[IAS 38.18] Subsequent expenditure on software assets is capitalised only when it increases the future economic benefits embodied in the specific asset to which it relates. All other expenditure is expensed as incurred.
[IAS 38.118(a)–(b)] Software is amortised on a straight-line basis in profit or loss over its estimated useful life, from the date on which it is available for use. The estimated useful life of software for the current and comparative periods is three to five years.
[IAS 38.104] Amortisation methods, useful lives and residual values are reviewed at each reporting date and adjusted if appropriate.
S. Impairment of non-financial assets
[IAS 36.9–10] At each reporting date, the Group reviews the carrying amounts of its non-financial assets (other than investment properties and deferred tax assets) to determine whether there is any indication of impairment. If any such indication exists, then the asset’s recoverable amount is estimated. Goodwill is tested annually for impairment.
[IAS 36.18, 80] For impairment testing, assets are grouped together into the smallest group of assets that generates cash inflows from continuing use that is largely independent of the cash inflows of other assets or CGUs. Goodwill arising from a business combination is allocated to CGUs or groups of CGUs that are expected to benefit from the synergies of the combination.
[IAS 36.6, 30] The ‘recoverable amount’ of an asset or CGU is the greater of its value in use and its fair value less costs to sell. ‘Value in use’ is based on the estimated future cash flows, discounted to their present value using a pre-tax discount rate that reflects current market assessments of the time value of money and the risks specific to the asset or CGU.
[IAS 36.59] An impairment loss is recognised if the carrying amount of an asset or CGU exceeds its recoverable amount.
[IAS 36.102] The Group’s corporate assets do not generate separate cash inflows and are used by more than one CGU. Corporate assets are allocated to CGUs on a reasonable and consistent basis and tested for impairment as part of the testing of the CGUs to which the corporate assets are allocated.
Illustrative disclosures – Notes 155Accounting policies
© 2017 KPMG IFRG Limited, a UK company, limited by guarantee. All rights reserved.
Intr
oduc
tion
Aud
itor
s’ r
epor
tPr
imar
y st
atem
ents
NO
TE
SA
ppen
dice
s
Notes to the consolidated financial statements (continued)
44. Significant accounting policies (continued)S. Impairment of non-financial assets (continued)
[IAS 36.104] Impairment losses are recognised in profit or loss. They are allocated first to reduce the carrying amount of any goodwill allocated to the CGU, and then to reduce the carrying amounts of the other assets in the CGU on a pro rata basis.
[IAS 36.117, 122, 124] An impairment loss in respect of goodwill is not reversed. For other assets, an impairment loss is reversed only to the extent that the asset’s carrying amount does not exceed the carrying amount that would have been determined, net of depreciation or amortisation, if no impairment loss had been recognised.
IFRS 7.21 T. Deposits, debt securities issued and subordinated liabilities
Deposits, debt securities issued and subordinated liabilities are the Group’s sources of debt funding.
When the Group sells a financial asset and simultaneously enters into an agreement to repurchase the asset (or a similar asset) at a fixed price on a future date (sale and repurchase agreement), the arrangement is accounted for as a deposit, and the underlying asset continues to be recognised in the Group’s financial statements.
The Group classifies capital instruments as financial liabilities or equity instruments in accordance with the substance of the contractual terms of the instruments. The Group’s redeemable preference shares bear non-discretionary coupons and are redeemable by the holder, and are therefore included within subordinated liabilities.
Deposits, debt securities issued and subordinated liabilities are initially measured at fair value minus incremental direct transaction costs, and subsequently measured at their amortised cost using the effective interest method, except where the Group designates liabilities at FVTPL (see (J)(vi) and (viii)).
U. Provisions
[IAS 37.14, 45, 47, IFRIC 1.8]
A provision is recognised if, as a result of a past event, the Group has a present legal or constructive obligation that can be estimated reliably, and it is probable that an outflow of economic benefits will be required to settle the obligation. Provisions are determined by discounting the expected future cash flows at a pre-tax rate that reflects current market assessments of the time value of money and the risks specific to the liability. The unwinding of the discount is recognised as finance cost.
i. Restructuring
[IAS 37.72] A provision for restructuring is recognised when the Group has approved a detailed and formal restructuring plan, and the restructuring either has commenced or has been announced publicly. Future operating losses are not provided for.
ii. Onerous contracts
[IAS 37.66, 68] A provision for onerous contracts is recognised when the expected benefits to be derived by the Group from a contract are lower than the unavoidable cost of meeting its obligations under the contract. The provision is measured at the present value of the lower of the expected cost of terminating the contract and the expected net cost of continuing with the contract. Before a provision is established, the Group recognises any impairment loss on the assets associated with that contract (see (S)).
© 2017 KPMG IFRG Limited, a UK company, limited by guarantee. All rights reserved.
156 | Illustrative disclosures for banks under IAS 39
Intr
oduc
tion
Aud
itor
s’ r
epor
tPr
imar
y st
atem
ents
NO
TE
SA
ppen
dice
s
Notes to the consolidated financial statements (continued)
44. Significant accounting policies (continued)U. Provisions (continued)
iii. Bank levies
A provision for bank levies is recognised when the condition that triggers the payment of the levy is met. If a levy obligation is subject to a minimum activity threshold so that the obligating event is reaching a minimum activity, then a provision is recognised when that minimum activity threshold is reached.
IFRS 7.21, [IAS 39.4(c), 9, BC15]
V. Financial guarantees and loan commitments
‘Financial guarantees’ are contracts that require the Group to make specified payments to reimburse the holder for a loss that it incurs because a specified debtor fails to make payment when it is due in accordance with the terms of a debt instrument. ‘Loan commitments’ are firm commitments to provide credit under pre-specified terms and conditions.
[IAS 37.36, 45, 39.47(c)–(d)]
Liabilities arising from financial guarantees or commitments to provide a loan at a below-market interest rate are initially measured at fair value and the initial fair value is amortised over the life of the guarantee or the commitment. The liability is subsequently carried at the higher of this amortised amount and the present value of any expected payment to settle the liability when a payment under the contract has become probable. Financial guarantees and commitments to provide a loan at a below-market interest rate are included within other liabilities.
W. Employee benefits
i. Defined contribution plans[IAS 19.28, 51] Obligations for contributions to defined contribution plans are expensed as the related service
is provided and recognised as personnel expenses in profit or loss. Prepaid contributions are recognised as an asset to the extent that a cash refund or a reduction in future payments is available.
ii. Defined benefit plans
[IAS 19.57, 83] The Group’s net obligation in respect of defined benefit plans is calculated separately for each plan by estimating the amount of future benefit that employees have earned in the current and prior periods, discounting that amount and deducting the fair value of any plan assets.
[IAS 19.63–64, 67, IFRIC 14.23–24]
The calculation of defined benefit obligations is performed annually by a qualified actuary using the projected unit credit method. When the calculation results in a potential asset for the Group, the recognised asset is limited to the present value of economic benefits available in the form of any future refunds from the plan or reductions in future contributions to the plan. To calculate the present value of economic benefits, consideration is given to any applicable minimum funding requirements.
[IAS 19.122, 127–130] Remeasurements of the net defined benefit liability, which comprise actuarial gains and losses, the return on plan assets (excluding interest) and the effect of the asset ceiling (if any, excluding interest), are recognised immediately in OCI. The Group determines the net interest expense (income) on the net defined benefit liability (asset) for the period by applying the discount rate used to measure the defined benefit obligation at the beginning of the annual period to the then-net defined benefit liability (asset), taking into account any changes in the net defined benefit liability (asset) during the period as a result of contributions and benefit payments. Net interest expense and other expenses related to defined benefit plans are recognised in personnel expenses in profit or loss.
[IAS 19.103, 109–110] When the benefits of a plan are changed or when a plan is curtailed, the resulting change in benefit that relates to past service or the gain or loss on curtailment is recognised immediately in profit or loss. The Group recognises gains and losses on the settlement of a defined benefit plan when the settlement occurs.
Illustrative disclosures – Notes 157Accounting policies
© 2017 KPMG IFRG Limited, a UK company, limited by guarantee. All rights reserved.
Intr
oduc
tion
Aud
itor
s’ r
epor
tPr
imar
y st
atem
ents
NO
TE
SA
ppen
dice
s
Notes to the consolidated financial statements (continued)
44. Significant accounting policies (continued)W. Employee benefits (continued)
iii. Other long-term employee benefits
[IAS 19.155–156] The Group’s net obligation in respect of long-term employee benefits is the amount of future benefit that employees have earned in return for their service in the current and prior periods. That benefit is discounted to determine its present value. Remeasurements are recognised in profit or loss in the period in which they arise.
iv. Termination benefits
[IAS 19.165] Termination benefits are expensed at the earlier of when the Group can no longer withdraw the offer of those benefits and when the Group recognises costs for a restructuring. If benefits are not expected to be wholly settled within 12 months of the reporting date, then they are discounted.
v. Short-term employee benefits
[IAS 19.11] Short-term employee benefits are expensed as the related service is provided. A liability is recognised for the amount expected to be paid if the Group has a present legal or constructive obligation to pay this amount as a result of past service provided by the employee and the obligation can be estimated reliably.
vi. Share-based payment transactions
[IFRS 2.14–15, 19–21, 21A]
The grant-date fair value of share-based payment awards – i.e. stock options – granted to employees is recognised as personnel expense, with a corresponding increase in equity, over the period in which the employees become unconditionally entitled to the awards. The amount recognised as an expense is adjusted to reflect the number of awards for which the related service and non-market performance conditions are expected to be met, such that the amount ultimately recognised as an expense is based on the number of awards that meet the related service and non-market performance conditions at the vesting date. For share-based payment awards with non-vesting conditions, the grant-date fair value of the share-based payment is measured to reflect such conditions and there is no true-up for differences between expected and actual outcomes.
[IFRS 2.30, 32] The fair value of the amount payable to employees in respect of SARs that are settled in cash is recognised as an expense with a corresponding increase in liabilities over the period in which the employees become unconditionally entitled to payment. The liability is remeasured at each reporting date and at settlement date based on the fair value of the SARs. Any changes in the liability are recognised as personnel expenses in profit or loss.
IFRS 7.21 X. Share capital and reserves
i. Perpetual bonds[IAS 12.52B, 58,
32.11, 15–16, 35] The Group classifies capital instruments as financial liabilities or equity instruments in accordance with the substance of the contractual terms of the instruments. The Group’s perpetual bonds are not redeemable by holders and bear an entitlement to distributions that is non-cumulative and at the discretion of the board of directors. Accordingly, they are presented as a component of issued capital within equity. Distributions thereon are recognised in equity. Related income tax is accounted for in accordance with IAS 12.
ii. Share issue costs
[IAS 32.35] Incremental costs that are directly attributable to the issue of an equity instrument are deducted from the initial measurement of the equity instruments.

© 2017 KPMG IFRG Limited, a UK company, limited by guarantee. All rights reserved.
158 | Illustrative disclosures for banks under IAS 39
Intr
oduc
tion
Aud
itor
s’ r
epor
tPr
imar
y st
atem
ents
NO
TE
SA
ppen
dice
s
Notes to the consolidated financial statements (continued)
44. Significant accounting policies (continued)Y. Earnings per share
[IAS 33.10, 31] The Group presents basic and diluted EPS data for its ordinary shares. Basic EPS is calculated by dividing the profit or loss that is attributable to ordinary shareholders of the Bank by the weighted-average number of ordinary shares outstanding during the period. Diluted EPS is determined by adjusting the profit or loss that is attributable to ordinary shareholders and the weighted-average number of ordinary shares outstanding for the effects of all dilutive potential ordinary shares, which comprise share options granted to employees.
Illustrative disclosures – Notes 159Accounting policies
© 2017 KPMG IFRG Limited, a UK company, limited by guarantee. All rights reserved.
Intr
oduc
tion
Aud
itor
s’ r
epor
tPr
imar
y st
atem
ents
NO
TE
SA
ppen
dice
s
Notes to the consolidated financial statements (continued)
45. Standards issued but not yet effectivea, b IAS 8.30–31 A number of new standards and amendments to standards are effective for annual periods
beginning after 1 January 2016 and earlier application is permitted; however, the Group has not early adopted the following new or amended standards in preparing these consolidated financial statements. The new standards and amendments listed below are those that could potentially have an impact on the Group’s performance, financial position or disclosures.
Disclosure Initiative (Amendments to IAS 7)c
The amendments require disclosures that enable users of financial statements to evaluate changes in liabilities arising from financing activities, including both changes arising from cash flow and non-cash changes.
The amendments are effective for annual periods beginning on or after 1 January 2017, with early adoption permitted.
To satisfy the new disclosure requirements, the Group intends to present a reconciliation between the opening and closing balances for liabilities that form part of financing activities in the consolidated statement of cash flows.
Recognition of Deferred Tax Assets for Unrealised Losses (Amendments to IAS 12)
The amendments clarify the accounting for deferred tax assets for unrealised losses on debt instruments measured at fair value.
The amendments are effective for annual periods beginning on or after 1 January 2017, with early adoption permitted.
The Group is assessing the potential impact on its consolidated financial statements resulting from the amendments. So far, the Group does not expect any significant impact.
IFRS 9 Financial Instruments
In July 2014, the International Accounting Standards Board issued the final version of IFRS 9 Financial Instruments.
IFRS 9 is effective for annual periods beginning on or after 1 January 2018, with early adoption permitted. The Group currently plans to apply IFRS 9 initially on 1 January 2018.
The actual impact of adopting IFRS 9 on the Group’s consolidated financial statements in 2018 is not known and cannot be reliably estimated because it will be dependent on the financial instruments that the Group holds and economic conditions at that time as well as accounting elections and judgements that it will make in the future. The new standard will require the Group to revise its accounting processes and internal controls related to reporting financial instruments and these changes are not yet complete. However, the Group has performed a preliminary assessment of the potential impact of adoption of IFRS 9 based on its positions at 31 December 2016.
IAS 8.31 a. Although new or amended standards that will have no or no material effect on the financial statements need not be provided, the Group has included all new or amended IFRSs and their possible qualitative impact on the consolidated financial statements for illustrative purposes only.
For a list of forthcoming requirements that are not yet mandatory for 2016 but are available for early adoption, see Appendix I.
b. The Group has disclosed known or reasonably estimable information relevant to assessing the possible impact that the application of new standards will have on its financial statements in the period of initial application that was available when the financial statements were prepared. Some regulators – e.g. ESMA – have indicated that they expect the extent of quantitative disclosures to increase as the mandatory effective date of a new standard approaches.
c. The Group has not early adopted Disclosure Initiative (Amendments to IAS 7) in its consolidated financial statements for the year ended 31 December 2016. Appendix IV of our publication Guide to annual financial statements – Illustrative disclosures (October 2016) provides disclosure examples for entities that have early adopted the amendments to IAS 7.
© 2017 KPMG IFRG Limited, a UK company, limited by guarantee. All rights reserved.
160 | Illustrative disclosures for banks under IAS 39
Intr
oduc
tion
Aud
itor
s’ r
epor
tPr
imar
y st
atem
ents
NO
TE
SA
ppen
dice
s
Notes to the consolidated financial statements (continued)
45. Standards issued but not yet effective (continued)IFRS 9 Financial Instruments (continued)
i. IFRS 9 implementation strategy
The Group’s IFRS 9 implementation process is governed by a Steering Committee whose members include representatives from risk, finance, operations and IT functions. The Steering Committee meets weekly to challenge key assumptions, approve decisions and monitor the progress of the implementation work across the Group, including evaluation of whether the project has sufficient resources.
The Group has completed a preliminary impact assessment and most of the accounting analysis and has commenced work on the design and build of models, systems, processes and controls. The Group intends to undertake a parallel run during 2017.
ii. Classification – Financial assets
IFRS 9 contains a new classification and measurement approach for financial assets that reflects the business model in which assets are managed and their cash flow characteristics.
IFRS 9 contains three principal classification categories for financial assets: measured at amortised cost, fair value through other comprehensive income (FVOCI) and fair value through profit or loss (FVTPL). The standard eliminates the existing IAS 39 categories of held to maturity, loans and receivables and available for sale.
A financial asset is measured at amortised cost if it meets both of the following conditions and is not designated as at FVTPL:
– the asset is held within a business model whose objective is to hold assets to collect contractual cash flows; and
– the contractual terms of the financial asset give rise on specified dates to cash flows that are solely payments of principal and interest on the principal amount outstanding.
A debt instrument is measured at FVOCI only if it meets both of the following conditions and is not designated as at FVTPL:
– the asset is held within a business model whose objective is achieved by both collecting contractual cash flows and selling financial assets; and
– the contractual terms of the financial asset give rise on specified dates to cash flows that are solely payments of principal and interest on the principal amount outstanding.
On initial recognition of an equity investment that is not held for trading, the Group may irrevocably elect to present subsequent changes in fair value in OCI. This election is made on an investment-by-investment basis.
All other financial assets are classified as measured at FVTPL.
In addition, on initial recognition, the Group may irrevocably designate a financial asset that otherwise meets the requirements to be measured at amortised cost or at FVOCI as at FVTPL if doing so eliminates or significantly reduces an accounting mismatch that would otherwise arise.
A financial asset is classified into one of these categories on initial recognition. However, for financial assets held at initial application, the business model assessment is based on facts and circumstances at that date. Also, IFRS 9 permits new elective designations at FVTPL or FVOCI to be made on the date of initial application and permits or requires revocation of previous FVTPL elections at the date of initial application depending on the facts and circumstances at that date.
Under IFRS 9, derivatives embedded in contracts where the host is a financial asset in the scope of the standard are never bifurcated. Instead, the hybrid financial instrument as a whole is assessed for classification.
Illustrative disclosures – Notes 161Accounting policies
© 2017 KPMG IFRG Limited, a UK company, limited by guarantee. All rights reserved.
Intr
oduc
tion
Aud
itor
s’ r
epor
tPr
imar
y st
atem
ents
NO
TE
SA
ppen
dice
s
Notes to the consolidated financial statements (continued)
45. Standards issued but not yet effective (continued)IFRS 9 Financial Instruments (continued)
ii. Classification – Financial assets (continued)
Business model assessment
The Group will make an assessment of the objective of the business model in which a financial asset is held at a portfolio levela because this best reflects the way the business is managed and information is provided to management. The information that will be considered includes:
– the stated policies and objectives for the portfolio and the operation of those policies in practice. In particular, whether management’s strategy focuses on earning contractual interest revenue, maintaining a particular interest rate profile, matching the duration of the financial assets to the duration of the liabilities that are funding those assets or realising cash flows through the sale of the assets;
– how the performance of the portfolio is evaluated and reported to the Group’s management;
– the risks that affect the performance of the business model (and the financial assets held within that business model) and how those risks are managed;
– how managers of the business are compensated – e.g. whether compensation is based on the fair value of the assets managed or the contractual cash flows collected; and
– the frequency, volume and timing of sales in prior periods, the reasons for such sales and expectations about future sales activity. However, information about sales activity will not be considered in isolation, but as part of an overall assessment of how the Group’s stated objective for managing the financial assets is achieved and how cash flows are realised.
Financial assets that are held for trading or that are managed and whose performance is evaluated on a fair value basis will be measured at FVTPL because they are neither held to collect contractual cash flows nor held both to collect contractual cash flows and to sell financial assets.
Assessment whether contractual cash flows are solely payments of principal and interest
For the purposes of this assessment, ‘principal’ is defined as the fair value of the financial asset on initial recognition. ‘Interest’ is defined as consideration for the time value of money and for the credit risk associated with the principal amount outstanding during a particular period of time and for other basic lending risks and costs (e.g. liquidity risk and administrative costs), as well as profit margin.
In assessing whether the contractual cash flows are solely payments of principal and interest, the Group will consider the contractual terms of the instrument. This will include assessing whether the financial asset contains a contractual term that could change the timing or amount of contractual cash flows such that it would not meet this condition. In making the assessment, the Group will consider:
– contingent events that would change the amount and timing of cash flows;
– leverage features;
– prepayment and extension terms;
– terms that limit the Group’s claim to cash flows from specified assets (e.g. non-recourse asset arrangements); and
– features that modify consideration for the time value of money – e.g. periodic reset of interest rates.
a. The objective of the entity’s business model is not based on management’s intentions with respect to an individual instrument, but rather is determined at a higher level of aggregation. The assessment needs to reflect the way that an entity manages its business or businesses. A single reporting entity may have more than one business model for managing its financial instruments.
© 2017 KPMG IFRG Limited, a UK company, limited by guarantee. All rights reserved.
162 | Illustrative disclosures for banks under IAS 39
Intr
oduc
tion
Aud
itor
s’ r
epor
tPr
imar
y st
atem
ents
NO
TE
SA
ppen
dice
s
Notes to the consolidated financial statements (continued)
45. Standards issued but not yet effective (continued)IFRS 9 Financial Instruments (continued)
ii. Classification – Financial assets (continued)
Preliminary impact assessment
Based on its preliminary high-level assessment of possible changes to the classification and measurement of financial assets held as at 31 December 2016, the Group’s current expectation is that:
– trading assets and derivative assets held for risk management that are classified as held-for-trading and measured at FVTPL under IAS 39 would also be measured at FVTPL under IFRS 9;
– loans and advances to banks and to customers that are classified as loans and receivables and measured at amortised cost under IAS 39 would in general also be measured at amortised cost under IFRS 9;
– held-to-maturity investment securities measured at amortised cost under IAS 39 would in general also be measured at amortised cost under IFRS 9;
– debt securities that are classified as available-for-sale under IAS 39 may, under IFRS 9, be measured at amortised cost, FVOCI or FVTPL, depending on the particular circumstances;
– investment securities designated as at FVTPL under IAS 39 would in general continue to be so designated under IFRS 9; and
– equity securities classified as available-for-sale under IAS 39 would generally be measured at FVTPL under IFRS 9.
The classification and measurement assessment as at 31 December 2016 may not necessarily represent the impact on the Group’s financial statements as at 1 January 2018 because IFRS 9 requires the business model assessment to be undertaken based on the facts and circumstances that exist at the date of initial application, which will be 1 January 2018 for the Group. Furthermore, the financial assets held on initial application will not be the same as those held at 31 December 2016 and how they are managed may not be the same.
Moreover, the Group’s preliminary assessment has not included a detailed review of the contractual terms of all financial assets – which is ongoing – and it has not yet finalised its policies and methods for analysing certain prepayment features and variable interest-rate features.
iii. Impairment of financial assets
IFRS 9 replaces the ‘incurred loss’ model in IAS 39 with a forward-looking ‘expected credit loss’ (ECL) model. This will require considerable judgement over how changes in economic factors affect ECLs, which will be determined on a probability-weighted basis.
The new impairment model will apply to the following financial instruments that are not measured at FVTPL:
– financial assets that are debt instruments;
– lease receivables;
– financial guarantee contracts issued; and
– loan commitments issued.
No impairment loss will be recognised on equity investments.
Under IFRS 9, the Group will recognise loss allowances at an amount equal to lifetime ECL, except in the following cases, where the amount recognised will be 12-month ECL:
– debt investment securities that are determined to have low credit risk at the reporting date; and
– other financial instruments (other than lease receivables) on which credit risk has not increased significantly since their initial recognition.
The assessment of whether credit risk on a financial asset has increased significantly will be one of the critical judgements in implementing the impairment model of IFRS 9. It is discussed below.
Loss allowances for lease receivables will always be measured at an amount equal to lifetime ECL.
Illustrative disclosures – Notes 163Accounting policies
© 2017 KPMG IFRG Limited, a UK company, limited by guarantee. All rights reserved.
Intr
oduc
tion
Aud
itor
s’ r
epor
tPr
imar
y st
atem
ents
NO
TE
SA
ppen
dice
s
Notes to the consolidated financial statements (continued)
45. Standards issued but not yet effective (continued)IFRS 9 Financial Instruments (continued)
iii. Impairment of financial assets (continued)
12-month ECL are the portion of ECL that results from default events on a financial instrument that are possible within the 12 months after the reporting date.
Measurement of ECL
ECLs are a probability-weighted estimate of credit losses and will be measured as follows:
– financial assets that are not credit-impaired at the reporting date: the present value of all cash shortfalls (i.e. the difference between the cash flows due to the entity in accordance with the contract and the cash flows that the Group expects to receive);
– financial assets that are credit-impaired at the reporting date: the difference between the gross carrying amount and the present value of estimated future cash flows;
– undrawn loan commitments: the present value of the difference between the contractual cash flows that are due to the Group if the commitment is drawn down and the cash flows that the Group expects to receive; and
– financial guarantee contracts: the expected payments to reimburse the holder less any amounts that the Group expects to recover.
Financial assets that are credit-impaired are defined by IFRS 9 in a similar way to financial assets that are impaired under IAS 39 (see Note 44(J)(vii)).
Definition of default
Under IFRS 9, the Group will consider a financial asset to be in default when:
– the borrower is unlikely to pay its credit obligations to the Group in full, without recourse by the Group to actions such as realising security (if any is held); or
– the borrower is past due more than 90 days on any material credit obligation to the Group. Overdrafts are considered as being past due once the customer has breached an advised limit or been advised of a limit smaller than the current amount outstanding.
This definition is largely consistent with the definition that is expected to be used for regulatory purposes from 1 January 2018 (see Note 5(D)(i)).
In assessing whether a borrower is in default, the Group will consider indicators that are:
– qualitative – e.g. breaches of covenant;
– quantitative – e.g. overdue status and non-payment on another obligation of the same issuer to the Group; and
– based on data developed internally and obtained from external sources.
Inputs into the assessment of whether a financial instrument is in default and their significance may vary over time to reflect changes in circumstances.
© 2017 KPMG IFRG Limited, a UK company, limited by guarantee. All rights reserved.
164 | Illustrative disclosures for banks under IAS 39
Intr
oduc
tion
Aud
itor
s’ r
epor
tPr
imar
y st
atem
ents
NO
TE
SA
ppen
dice
s
Notes to the consolidated financial statements (continued)
45. Standards issued but not yet effective (continued)IFRS 9 Financial Instruments (continued)
iii. Impairment of financial assets (continued)
Significant increase in credit risk
Under IFRS 9, when determining whether the risk of default on a financial instrument has increased significantly since initial recognition, the Group will consider reasonable and supportable information that is relevant and available without undue cost or effort, including both quantitative and qualitative information and analysis, based on the Group’s historical experience and expert credit assessment and including forward-looking information.
The Group is currently formulating its detailed methodologies for assessing increases in credit risk under IFRS 9.
The Group expects that identifying whether a significant increase in credit risk has occurred for an exposure will entail comparing:
– the remaining lifetime probability of default (PD) as at the reporting date; with
– the remaining lifetime PD for this point in time that was estimated at the time of initial recognition of the exposure.
Credit risk grades
The Group will allocate each exposure to a credit risk grade based on a variety of data that is determined to be predictive of the risk of default and applying experienced credit judgement and the Group expects to use these grades for the purposes of identifying significant increases in credit risk under IFRS 9. Credit risk grades are defined using qualitative and quantitative factors that are indicative of risk of default. These factors may vary depending on the nature of the exposure and the type of borrower.
Credit risk grades are defined and calibrated such that the risk of default occurring increases exponentially as the credit risk deteriorates so, for example, the difference in risk of default between credit risk grades 1 and 2 is smaller than the difference between credit risk grades 2 and 3.
Each exposure will be allocated to a credit risk grade at initial recognition based on available information about the borrower. Exposures will be subject to ongoing monitoring, which may result in an exposure being moved to a different credit risk grade.
Generating the term structure of PD
Credit risk grades are expected to be a primary input into the determination of the term structure of PD for exposures. The Group intends to collect performance and default information about its credit risk exposures analysed by jurisdiction or region and by type of product and borrower as well as by credit risk grading. For some portfolios, information purchased from external credit reference agencies may also be used.
The Group is designing and testing statistical models to analyse the data collected and generate estimates of the remaining lifetime PD of exposures and how these are expected to change as a result of the passage of time.
Illustrative disclosures – Notes 165Accounting policies
© 2017 KPMG IFRG Limited, a UK company, limited by guarantee. All rights reserved.
Intr
oduc
tion
Aud
itor
s’ r
epor
tPr
imar
y st
atem
ents
NO
TE
SA
ppen
dice
s
Notes to the consolidated financial statements (continued)
45. Standards issued but not yet effective (continued)IFRS 9 Financial Instruments (continued)
iii. Impairment of financial assets (continued)
Significant increase in credit risk (continued)
Generating the term structure of PD (continued)
This analysis is expected to include the identification and calibration of relationships between changes in default rates and changes in key macro-economic factors, as well as in-depth analysis of the impact of certain other factors (e.g. forbearance experience) on the risk of default. For most exposures, key macro-economic indicators are likely to include: GDP growth, benchmark interest rates and unemployment.
For exposures to specific industries and/or regions, the analysis may extend to relevant commodity and/or real estate prices.
The Group intends to formulate a ‘base case’ view of the future direction of relevant economic variables as well as a representative range of other possible forecast scenarios based on advice from the Group Market Risk Committee and economic experts and consideration of a variety of external actual and forecast information. The Group plans to use these forecasts to adjust its estimates of PDs.
Determining whether credit risk has increased significantly
The criteria for determining whether credit risk has increased significantly vary by portfolio and will include quantitative changes in PDs and qualitative factors, including a backstop based on delinquency.
The Group expects that it will deem the credit risk of a particular exposure to have increased significantly since initial recognition if, based on the Group’s quantitative modelling, the remaining lifetime PD is determined to have increased by more than a predetermined percentage or range.
In certain instances, using its expert credit judgement and, where possible, relevant historical experience, the Group may determine that an exposure has undergone a significant increase in credit risk based on particular qualitative indicators that it considers are indicative of this and whose effect may not otherwise be fully reflected in its quantitative analysis on a timely basis. As a backstop, and as required by IFRS 9, the Group will presumptively consider that a significant increase in credit risk occurs no later than when an asset is more than 30 days past due. The Group expects to determine days past due by counting the number of days since the earliest elapsed due date in respect of which full payment has not been received.
The Group intends to monitor the effectiveness of the criteria used to identify significant increases in credit risk by regular reviews to confirm that:
– the criteria are capable of identifying significant increases in credit risk before an exposure is in default;
– the criteria do not align with the point in time when an asset becomes 30 days past due; and
– there is no unwarranted volatility in loss allowance from transfers between 12-month PD (stage 1) and lifetime PD (stage 2).
Inputs into measurement of ECL
The key inputs into the measurement of ECL are likely to be the term structures of the following variables:
– probability of default (PD);
– loss given default (LGD);
– exposure at default (EAD).
In general, the Group expects to derive these parameters from internally developed statistical models and other historical data. They will be adjusted to reflect forward-looking information as described above.
© 2017 KPMG IFRG Limited, a UK company, limited by guarantee. All rights reserved.
166 | Illustrative disclosures for banks under IAS 39
Intr
oduc
tion
Aud
itor
s’ r
epor
tPr
imar
y st
atem
ents
NO
TE
SA
ppen
dice
s
Notes to the consolidated financial statements (continued)
45. Standards issued but not yet effective (continued)IFRS 9 Financial Instruments (continued)
iii. Impairment of financial assets (continued)
Inputs into measurement of ECL (continued)
PD estimates are estimates at a certain date, which the Group expects to calculate based on statistical rating models, and assessed using rating tools tailored to the various categories of counterparties and exposures. These statistical models are expected to be based on internally compiled data comprising both quantitative and qualitative factors. Where it is available, market data may also be used to derive the PD for large corporate counterparties. If a counterparty or exposure migrates between rating classes, then this will lead to a change in the estimate of the associated PD. PDs will be estimated considering the contractual maturities of exposures and estimated prepayment rates.
LGD is the magnitude of the likely loss if there is a default. The Group plans to estimate LGD parameters based on the history of recovery rates of claims against defaulted counterparties. It expects the LGD models to consider the structure, collateral, seniority of the claim, counterparty industry and recovery costs of any collateral that is integral to the financial asset. For loans secured by retail property, LTV ratios are likely to be a key parameter in determining LGD. The Group expects to calibrate LGD estimates for different economic scenarios and, for real estate lending, to reflect possible changes in property prices. They will be calculated on a discounted cash flow basis using the effective interest rate as the discounting factor. The LGD may differ from the amounts used for regulatory purposes. The principal differences relate to: removal of conservative regulatory add-ons and downturn calibration assumptions, inclusion of forward-looking information and use of multiple economic scenarios and the discount rate used.
EAD represents the expected exposure in the event of a default. The Group expects to derive the EAD from the current exposure to the counterparty and potential changes to the current amount allowed under the contract including amortisation. The EAD of a financial asset will be the gross carrying amount at default. For lending commitments and financial guarantees, the EAD will consider the amount drawn, as well as potential future amounts that may be drawn or repaid under the contract, which will be estimated based on historical observations and forward-looking forecasts. For some financial assets, the Group expects to determine EAD by modelling the range of possible exposure outcomes at various points in time using scenario and statistical techniques. The EAD may differ from that used for regulatory purposes. The principal differences relate to: only irrevocable undrawn commitments being included for accounting purposes, removal of conservative bias adjustments and down calibration assumptions, and adjustment to remove any excess over the contractual maximum amount.
As described above, and subject to using a maximum of a 12-month PD for financial assets for which credit risk has not significantly increased, the Group will measure ECL considering the risk of default over the maximum contractual period (including any borrower’s extension options) over which it is exposed to credit risk, even if, for risk management purposes, the Group considers a longer period. The maximum contractual period extends to the date at which the Group has the right to require repayment of an advance or terminate a loan commitment or guarantee.
For retail overdrafts and credit card facilities that include both a loan and an undrawn commitment component, the Group will measure ECL over a period longer than the maximum contractual period if the Group’s contractual ability to demand repayment and cancel the undrawn commitment does not limit the Group’s exposure to credit losses to the contractual notice period. These facilities do not have a fixed term or repayment structure and are managed on a collective basis. The Group can cancel them with immediate effect but this contractual right is not enforced in the normal day-to-day management, but only when the Group becomes aware of an increase in credit risk at the facility level. This longer period will be estimated taking into account the credit risk management actions that the Group expects to take and that serve to mitigate ECL. These include a reduction in limits, cancellation of the facility and/or turning the outstanding balance into a loan with fixed repayment terms.
Illustrative disclosures – Notes 167Accounting policies
© 2017 KPMG IFRG Limited, a UK company, limited by guarantee. All rights reserved.
Intr
oduc
tion
Aud
itor
s’ r
epor
tPr
imar
y st
atem
ents
NO
TE
SA
ppen
dice
s
Notes to the consolidated financial statements (continued)
45. Standards issued but not yet effective (continued)IFRS 9 Financial Instruments (continued)
iii. Impairment of financial assets (continued)
Forward-looking information
Under IFRS 9, the Group will incorporate forward-looking information into both its assessment of whether the credit risk of an instrument has increased significantly since its initial recognition and its measurement of ECL. Based on advice from the Group Market Risk Committee and economic experts and consideration of a variety of external actual and forecast information, the Group intends to formulate a ‘base case’ view of the future direction of relevant economic variables as well as a representative range of other possible forecast scenarios. This process would involve developing two or more additional economic scenarios and considering the relative probabilities of each outcome. External information may include economic data and forecasts published by governmental bodies and monetary authorities in the countries where the Group operates, supranational organisations such as the OECD and the International Monetary Fund, and selected private-sector and academic forecasters.
The base case is expected to represent a most-likely outcome and be aligned with information used by the Group for other purposes, such as strategic planning and budgeting. The other scenarios would represent more optimistic and more pessimistic outcomes. The Group plans also to periodically carry out stress testing of more extreme shocks to calibrate its determination of these other representative scenarios.
The Group is in the process of identifying and documenting key drivers of credit risk and credit losses for each portfolio of financial instruments and, using an analysis of historical data, estimating relationships between macro-economic variables and credit risk and credit losses.
Preliminary impact assessment
The most significant impact on the Group’s financial statements from the implementation of IFRS 9 is expected to result from the new impairment requirements. Management is not yet able to provide quantitative information about the expected impact, since the Group is in the process of building and testing models, assembling data and calibrating the impairment stage transfer criteria. The impact is also dependent on finalising the classification assessment and the circumstances at 1 January 2018. However, management expects loss allowances under IFRS 9 to be larger than under IAS 39.
iv. Classification – Financial liabilities
IFRS 9 largely retains the existing requirements in IAS 39 for the classification of financial liabilities.
However, under IAS 39 all fair value changes of liabilities designated as at FVTPL are recognised in profit or loss, whereas under IFRS 9 these fair value changes will generally be presented as follows:
– the amount of change in the fair value that is attributable to changes in the credit risk of the liability is presented in OCI; and
– the remaining amount of change in the fair value is presented in profit or loss.
The Group has designated debt securities issued at FVTPL when it holds related derivatives at FVTPL and designation therefore eliminates or significantly reduces an accounting mismatch that would otherwise arise. The amount of the change in fair value attributable to changes in credit risk of these liabilities that were recognised in profit or loss in 2016 under IAS 39 is disclosed in Note 11. On the adoption of IFRS 9, our current expectation is that such changes in fair value will be recognised in OCI although the amount recognised in OCI each year will be variable. The cumulative amount recognised in OCI will be nil if the designated liabilities are repaid at maturity.
v. Hedge accounting
When initially applying IFRS 9, the Group may choose as its accounting policy to continue to apply the hedge accounting requirements of IAS 39 instead of the requirements in Chapter 6 of IFRS 9. The Group’s current plan is that it will elect to continue to apply IAS 39. However, the Group will provide the expanded disclosures on hedge accounting introduced by IFRS 9 amendments of IFRS 7 because the accounting policy election does not provide an exemption from these new disclosure requirements.
© 2017 KPMG IFRG Limited, a UK company, limited by guarantee. All rights reserved.
168 | Illustrative disclosures for banks under IAS 39
Intr
oduc
tion
Aud
itor
s’ r
epor
tPr
imar
y st
atem
ents
NO
TE
SA
ppen
dice
s
Notes to the consolidated financial statements (continued)
45. Standards issued but not yet effective (continued)IFRS 9 Financial Instruments (continued)
vi. Disclosures
IFRS 9 will require extensive new disclosures, in particular about hedge accounting, credit risk and ECLs. The Group’s preliminary assessment included an analysis to identify data gaps against current processes and the Group plans to implement the system and controls changes that it believes will be necessary to capture the required data.
vii. Impact on capital planning
The principal impact on the Group’s regulatory capital of the implementation of IFRS 9 will arise from the new impairment requirements. Under current regulatory requirements, impairment provisions are dealt with differently depending on whether a particular portfolio is on the IRB or standardised approach.
– IRB approach: The capital requirement is calculated based on the gross exposure. Any shortfall between eligible accounting provisions and regulatory expected losses is deducted from capital resources and any excess is added back to Tier 2 (up to a certain limit). Our preliminary assessment indicates that under the current regulatory requirements, the implementation of IFRS 9 for the IRB portfolios will result in a reduction in CET1 reflecting expected higher impairment losses under the standard with total capital remaining at a similar level. Approximately 80% of the Group’s loans and advances to customers are subject to the IRB approach.
– Standardised approach: The capital requirement is calculated based on the gross exposures net of specific provisions (i.e. net exposure). IFRS 9 is expected to increase the loss allowances associated with individual assets and therefore the resulting net exposure, and so the capital requirement will fall. However, this reduction in capital requirement would be outweighed by the one-for-one deduction of the increased IFRS 9 loss allowance from capital resources. Only provisions against losses presently unidentified on an individual basis are allowed to be added back to Tier 2 capital (up to a certain limit). Our preliminary assessment indicates that under the current regulatory requirements, the implementation of IFRS 9 for the standardised portfolios will result in a reduction in CET1 and total capital. Approximately 20% of the Group’s loans and advances to customers are subject to the standardised approach.
The Group’s lead regulator is currently consulting on possible transition provisions relating to the implementation of IFRS 9 under which some of the capital impact of IFRS 9 would be phased in over a three-to-five-year period. The Group’s lead regulator is also considering the proposals included in the Basel committee’s recently issued discussion paper, which addresses the future long-term regulatory capital treatment.
viii. Transition
Changes in accounting policies resulting from the adoption of IFRS 9 will generally be applied retrospectively, except as described below.
– The Group plans to take advantage of the exemption allowing it not to restate comparative information for prior periods with respect to classification and measurement (including impairment) changes. Differences in the carrying amounts of financial assets and financial liabilities resulting from the adoption of IFRS 9 will generally be recognised in retained earnings and reserves as at 1 January 2018.
Illustrative disclosures – Notes 169Accounting policies
© 2017 KPMG IFRG Limited, a UK company, limited by guarantee. All rights reserved.
Intr
oduc
tion
Aud
itor
s’ r
epor
tPr
imar
y st
atem
ents
NO
TE
SA
ppen
dice
s
Notes to the consolidated financial statements (continued)
45. Standards issued but not yet effective (continued)IFRS 9 Financial Instruments (continued)
viii. Transition (continued)
– The following assessments have to be made on the basis of the facts and circumstances that exist at the date of initial application.
- The determination of the business model within which a financial asset is held.
- The designation and revocation of previous designations of certain financial assets and financial liabilities as measured at FVTPL.
- The designation of certain investments in equity instruments not held for trading as at FVOCI.
ix. Timeline for implementing IFRS 9
The Group expects that it will be in a position to provide quantitative information on the impact of the transition to IFRS 9 on its financial position and performance in its 2017 interim financial statements. This will include the impact on its CET1 and key regulatory ratios.
The quantitative information is expected to be based on the portfolios and information as at 31 March 2017. Business, portfolios and economic conditions will continue to evolve and therefore such quantitative information compiled ahead of the transition date will not be an estimate of the future transition impact but rather an indicative application of the ECL methodology to portfolios existing at 31 March 2017 and forecasts at that date.
IFRS 15 Revenue from Contracts with Customersa
IFRS 15 establishes a comprehensive framework for determining whether, how much and when revenue is recognised. It replaces existing revenue recognition guidance, including IAS 18 Revenue, IAS 11 Construction Contracts and IFRIC 13 Customer Loyalty Programmes.
IFRS 15 is effective for annual periods beginning on or after 1 January 2018, with early adoption permitted.
The Group has completed an initial review of the potential impact of the adoption of IFRS 15 on its consolidated financial statements. This focused on a review of fees and commission income.
The Group earns fee and commission income (other than fees included in the calculation of the effective interest rate) on provision of the following services (see Note 9):
– retail banking;
– corporate banking;
– investment banking;
– brokerage;
– asset management; and
– financial guarantees issued.
The initial review indicates that IFRS 15 will not have a material impact on the timing of recognition or measurement of fees and commission income. The Group is currently performing a detailed impact assessment and expects to disclose additional information in its 2017 interim financial statements.
a. The Group has not early adopted IFRS 15 in its consolidated financial statements for the year ended 31 December 2016. Our publication Guide to annual financial statements – IFRS 15 supplement provides disclosure examples and explanations on early adoption of IFRS 15.
© 2017 KPMG IFRG Limited, a UK company, limited by guarantee. All rights reserved.
170 | Illustrative disclosures for banks under IAS 39
Intr
oduc
tion
Aud
itor
s’ r
epor
tPr
imar
y st
atem
ents
NO
TE
SA
ppen
dice
s
Notes to the consolidated financial statements (continued)
45. Standards issued but not yet effective (continued)IFRS 16 Leases
IFRS 16 introduces a single, on-balance sheet lease accounting model for lessees. A lessee recognises a right-of-use (ROU) asset representing its right to use the underlying asset and a lease liability representing its obligation to make lease payments. There are optional exemptions for short-term leases and leases of low-value items. Lessor accounting remains similar to the current standard – i.e. lessors continue to classify leases as finance or operating leases.
IFRS 16 replaces existing leases guidance, including IAS 17 Leases, IFRIC 4 Determining whether an Arrangement contains a Lease, SIC-15 Operating Leases – Incentives and SIC-27 Evaluating the Substance of Transactions Involving the Legal Form of a Lease.
The standard is effective for annual periods beginning on or after 1 January 2019. Early adoption is permitted for entities that apply IFRS 15 at or before the date of initial application of IFRS 16.
The Group has started an initial assessment of the potential impact on its consolidated financial statements. So far, the most significant impact identified is that the Group will recognise new assets and liabilities for its operating leases of branches and office premises. In addition, the nature of expenses related to those leases will now change because IFRS 16 replaces the straight-line operating lease expense with a depreciation charge for ROU assets and interest expense on lease liabilities. The Group has not yet decided whether it will use the optional exemptions. No significant impact is expected for the Group’s finance leases. The Group is also in the process of assessing the impact on its CET1 ratio, particularly in respect of ROU assets in leases where the Group is a lessee.
i. Transition
The Group currently plans to apply IFRS 16 initially on 1 January 2019.
As a lessee, the Group can either apply the standard using a:
– retrospective approach; or
– modified retrospective approach with optional practical expedients.
The lessee applies the election consistently to all of its leases. The Group has not yet determined which transition approach to apply. As a lessor, the Group is not required to make any adjustments for leases except where it is an intermediate lessor in a sub-lease.
The Group has not yet quantified the impact on its reported assets and liabilities of the adoption of IFRS 16. The quantitative effect will depend on, inter alia, the transition method chosen, the extent to which the Group uses the practical expedients and recognition exemptions, and any additional leases that the Group enters into. The Group expects to disclose its transition approach and quantitative information before adoption.
© 2017 KPMG IFRG Limited, a UK company, limited by guarantee. All rights reserved.
Intr
oduc
tion
Aud
itor
s’ r
epor
tPr
imar
y st
atem
ents
Not
esA
PP
EN
DIC
ES
Appendix INew standards or amendments for 2016 and forthcoming requirementsSince the December 2015 edition of this guide, a number of standards, amendments to or interpretations of standards have been issued. This Appendix lists these new standards, amendments to or interpretations of standards in issue at 31 December 2016, which were not yet effective for periods beginning on 1 January 2015 and therefore may need to be considered for the first time when preparing IFRS financial statements for an annual period beginning on 1 January 2016.
This Appendix contains two tables, as follows.
– New currently effective requirements: This table lists the recent changes to IFRS that are required to be adopted in annual periods beginning on 1 January 2016.
– Forthcoming requirements: This table lists the recent changes to IFRS that are available for early adoption in annual periods beginning on 1 January 2016, although they are not mandatory until a later period. These requirements are not illustrated in this guide.
The tables also include a cross-reference to further KPMG guidance, as appropriate. All of the effective dates in the tables refer to the beginning of an annual accounting period.
New currently effective requirements
Effective date New standards or amendments KPMG guidance
1 January 2016
IFRS 14 Regulatory Deferral Accounts
Insights into IFRS (Chapters 6.1 and 6.2), In the Headlines – Issue 2014/01
Accounting for Acquisitions of Interests in Joint Operations (Amendments to IFRS 11)
Insights into IFRS (Chapters 3.6 and 6.1), web article
Clarification of Acceptable Methods of Depreciation and Amortisation (Amendments to IAS 16 and IAS 38)
Insights into IFRS (Chapters 3.2, 3.3 and 5.12), In the Headlines – Issue 2014/08
Agriculture: Bearer Plants (Amendments to IAS 16 and IAS 41)
Insights into IFRS (Chapters 3.2 and 3.9), In the Headlines – Issue 2014/12
Equity Method in Separate Financial Statements (Amendments to IAS 27)
Insights into IFRS (Chapters 2.1, 3.5, 3.6, 3.10 and 6.1), web article
Annual Improvements to IFRSs 2012–2014 Cycle – various standards
Insights into IFRS (Chapters 4.4, 5.4, 5.9 and 7.8), IFRS Newsletter: The Balancing Items – Issue 7
Investment Entities: Applying the Consolidation Exception (Amendments to IFRS 10, IFRS 12 and IAS 28)
Insights into IFRS (Chapters 2.1, 3.5, 5.6 and 5.10), web article
Disclosure Initiative (Amendments to IAS 1)Insights into IFRS (Chapters 1.2, 2.1, 3.1, 3.5 and 4.1), web article
In this guide, the Group has no transactions that would be affected by these new amendments.
Appendix I 171New standards or amendments for 2016 and forthcoming requirements
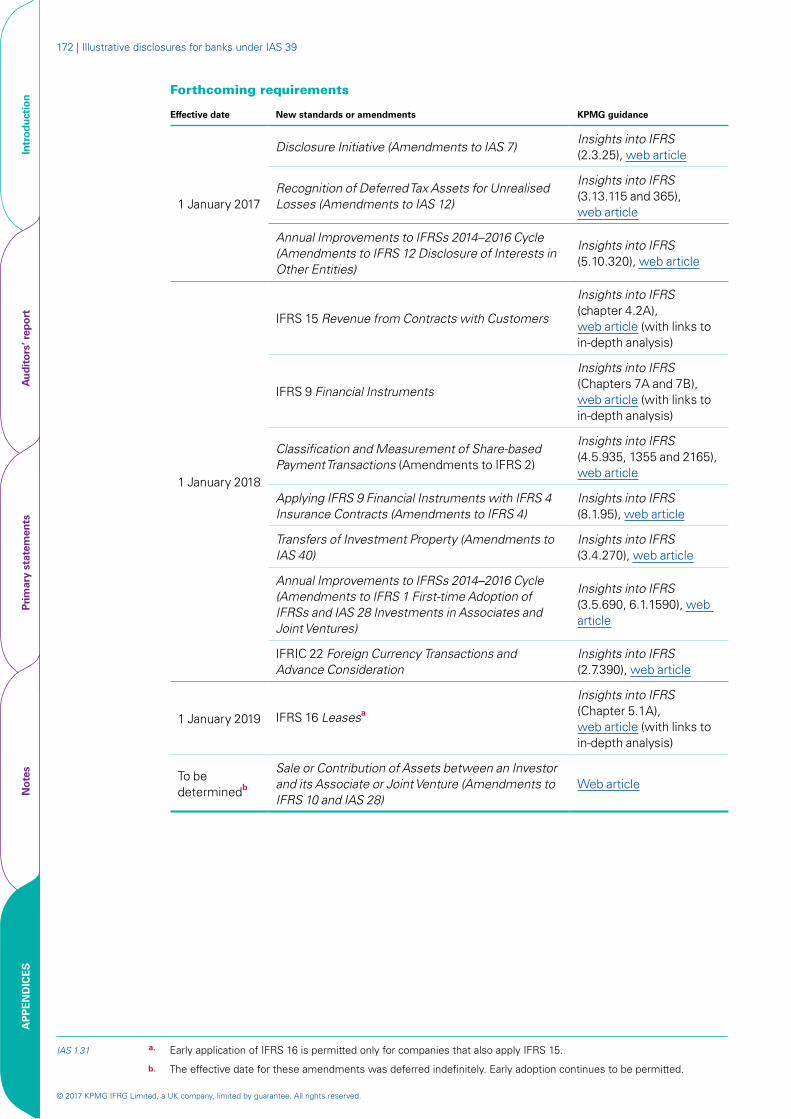
© 2017 KPMG IFRG Limited, a UK company, limited by guarantee. All rights reserved.
172 | Illustrative disclosures for banks under IAS 39
Intr
oduc
tion
Aud
itor
s’ r
epor
tPr
imar
y st
atem
ents
Not
esA
PP
EN
DIC
ES
Forthcoming requirements
Effective date New standards or amendments KPMG guidance
1 January 2017
Disclosure Initiative (Amendments to IAS 7)Insights into IFRS (2.3.25), web article
Recognition of Deferred Tax Assets for Unrealised Losses (Amendments to IAS 12)
Insights into IFRS (3.13.115 and 365), web article
Annual Improvements to IFRSs 2014–2016 Cycle (Amendments to IFRS 12 Disclosure of Interests in Other Entities)
Insights into IFRS (5.10.320), web article
1 January 2018
IFRS 15 Revenue from Contracts with Customers
Insights into IFRS (chapter 4.2A), web article (with links to in-depth analysis)
IFRS 9 Financial Instruments
Insights into IFRS (Chapters 7A and 7B), web article (with links to in-depth analysis)
Classification and Measurement of Share-based Payment Transactions (Amendments to IFRS 2)
Insights into IFRS (4.5.935, 1355 and 2165), web article
Applying IFRS 9 Financial Instruments with IFRS 4 Insurance Contracts (Amendments to IFRS 4)
Insights into IFRS (8.1.95), web article
Transfers of Investment Property (Amendments to IAS 40)
Insights into IFRS (3.4.270), web article
Annual Improvements to IFRSs 2014–2016 Cycle (Amendments to IFRS 1 First-time Adoption of IFRSs and IAS 28 Investments in Associates and Joint Ventures)
Insights into IFRS (3.5.690, 6.1.1590), web article
IFRIC 22 Foreign Currency Transactions and Advance Consideration
Insights into IFRS (2.7.390), web article
1 January 2019 IFRS 16 Leasesa
Insights into IFRS (Chapter 5.1A), web article (with links to in-depth analysis)
To be determinedb
Sale or Contribution of Assets between an Investor and its Associate or Joint Venture (Amendments to IFRS 10 and IAS 28)
Web article
IAS 1.31 a. Early application of IFRS 16 is permitted only for companies that also apply IFRS 15.
b. The effective date for these amendments was deferred indefinitely. Early adoption continues to be permitted.
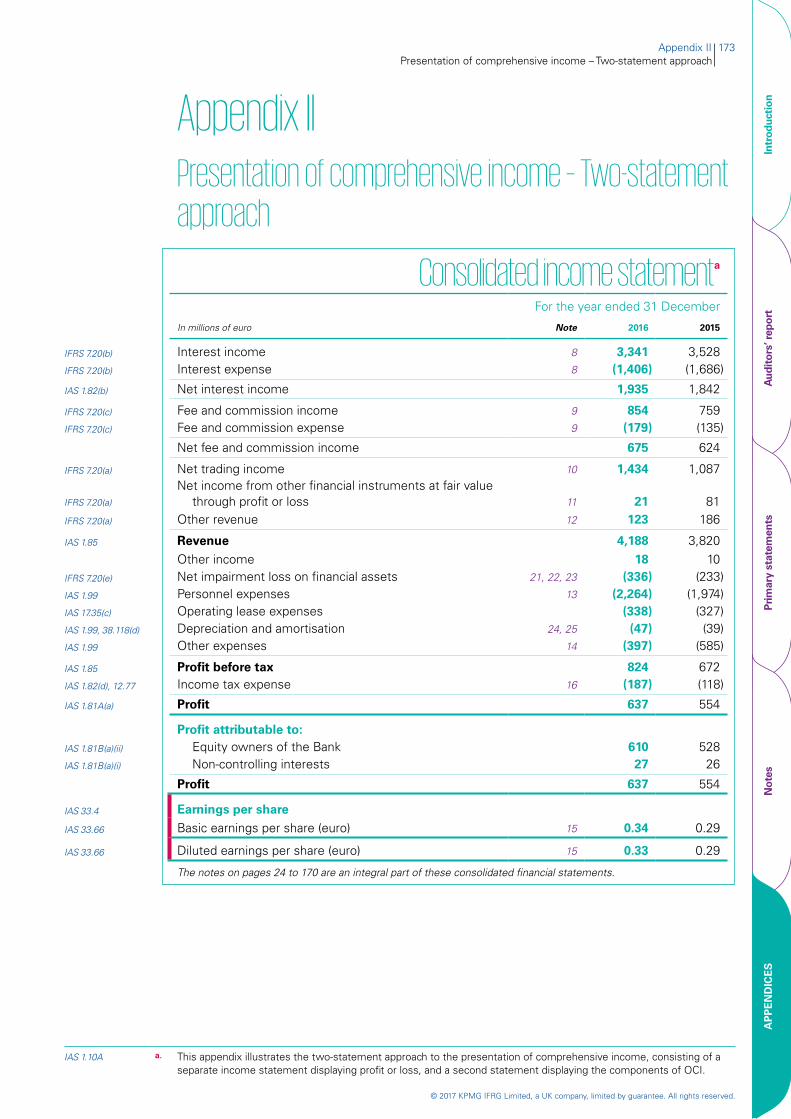
© 2017 KPMG IFRG Limited, a UK company, limited by guarantee. All rights reserved.
Intr
oduc
tion
Aud
itor
s’ r
epor
tPr
imar
y st
atem
ents
Not
esA
PP
EN
DIC
ES
Appendix IIPresentation of comprehensive income – Two-statement approach
Consolidated income statementa
For the year ended 31 December
In millions of euro Note 2016 2015
IFRS 7.20(b) Interest income 8 3,341 3,528IFRS 7.20(b) Interest expense 8 (1,406) (1,686)
IAS 1.82(b) Net interest income 1,935 1,842
IFRS 7.20(c) Fee and commission income 9 854 759IFRS 7.20(c) Fee and commission expense 9 (179) (135)
Net fee and commission income 675 624
IFRS 7.20(a) Net trading income 10 1,434 1,087
IFRS 7.20(a)
Net income from other financial instruments at fair value through profit or loss 11 21 81
IFRS 7.20(a) Other revenue 12 123 186
IAS 1.85 Revenue 4,188 3,820Other income 18 10
IFRS 7.20(e) Net impairment loss on financial assets 21, 22, 23 (336) (233)IAS 1.99 Personnel expenses 13 (2,264) (1,974)IAS 17.35(c) Operating lease expenses (338) (327)IAS 1.99, 38.118(d) Depreciation and amortisation 24, 25 (47) (39)IAS 1.99 Other expenses 14 (397) (585)
IAS 1.85 Profit before tax 824 672IAS 1.82(d), 12.77 Income tax expense 16 (187) (118)
IAS 1.81A(a) Profit 637 554
Profit attributable to:IAS 1.81B(a)(ii) Equity owners of the Bank 610 528 IAS 1.81B(a)(i) Non-controlling interests 27 26
Profit 637 554
IAS 33.4 Earnings per share
IAS 33.66 Basic earnings per share (euro) 15 0.34 0.29
IAS 33.66 Diluted earnings per share (euro) 15 0.33 0.29
The notes on pages 24 to 170 are an integral part of these consolidated financial statements.
IAS 1.10A a. This appendix illustrates the two-statement approach to the presentation of comprehensive income, consisting of a separate income statement displaying profit or loss, and a second statement displaying the components of OCI.
Appendix II 173Presentation of comprehensive income – Two-statement approach
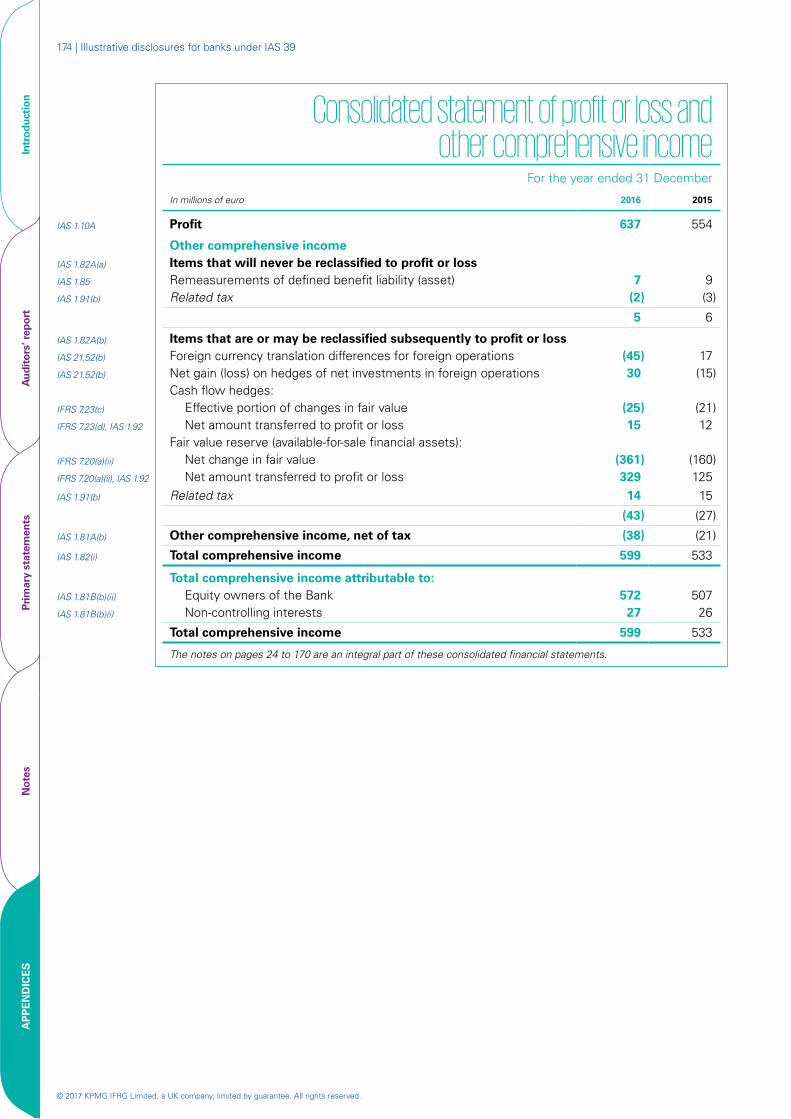
© 2017 KPMG IFRG Limited, a UK company, limited by guarantee. All rights reserved.
174 | Illustrative disclosures for banks under IAS 39
Intr
oduc
tion
Aud
itor
s’ r
epor
tPr
imar
y st
atem
ents
Not
esA
PP
EN
DIC
ES
Consolidated statement of profit or loss and other comprehensive income
For the year ended 31 December
In millions of euro 2016 2015
IAS 1.10A Profit 637 554
Other comprehensive incomeIAS 1.82A(a) Items that will never be reclassified to profit or lossIAS 1.85 Remeasurements of defined benefit liability (asset) 7 9IAS 1.91(b) Related tax (2) (3)
5 6
IAS 1.82A(b) Items that are or may be reclassified subsequently to profit or lossIAS 21.52(b) Foreign currency translation differences for foreign operations (45) 17 IAS 21.52(b) Net gain (loss) on hedges of net investments in foreign operations 30 (15)
Cash flow hedges:IFRS 7.23(c) Effective portion of changes in fair value (25) (21)IFRS 7.23(d), IAS 1.92 Net amount transferred to profit or loss 15 12
Fair value reserve (available-for-sale financial assets):IFRS 7.20(a)(ii) Net change in fair value (361) (160)IFRS 7.20(a)(ii), IAS 1.92 Net amount transferred to profit or loss 329 125
IAS 1.91(b) Related tax 14 15
(43) (27)
IAS 1.81A(b) Other comprehensive income, net of tax (38) (21)
IAS 1.82(i) Total comprehensive income 599 533
Total comprehensive income attributable to:IAS 1.81B(b)(ii) Equity owners of the Bank 572 507IAS 1.81B(b)(i) Non-controlling interests 27 26
Total comprehensive income 599 533
The notes on pages 24 to 170 are an integral part of these consolidated financial statements.
© 2017 KPMG IFRG Limited, a UK company, limited by guarantee. All rights reserved.
Intr
oduc
tion
Aud
itor
s’ r
epor
tPr
imar
y st
atem
ents
Not
esA
PP
EN
DIC
ES
Acknowledgements We would like to acknowledge the efforts of the principal contributors to this publication, who include: Ewa Bialkowska and Shandhir Lachman.
Acknowledgements | 175

© 2017 KPMG IFRG Limited, a UK company, limited by guarantee. All rights reserved.
176 | Illustrative disclosures for banks under IAS 39
Intr
oduc
tion
Aud
itor
s’ r
epor
tPr
imar
y st
atem
ents
Not
esA
PP
EN
DIC
ES
Keeping in touchVisit kpmg.com/ifrs for the latest on IFRS.
Whether you are new to IFRS or a current user, you can find digestible summaries of recent developments, detailed guidance on complex requirements, and practical tools such as illustrative disclosures and checklists.
You can also follow our LinkedIn showcase page for the latest content and topical discussion.
Helping you deal with IFRS today…
Insights into IFRS
Helping you apply IFRS to real transactions and arrangements.
Guides to financial statements
Illustrative IFRS disclosures and checklists of currently effective requirements.
Newly effective standards US GAAP
… and prepare for IFRS tomorrow
IFRS news IFRS newsletters
IFRS for banks IFRS 15 for sectors

© 2017 KPMG IFRG Limited, a UK company, limited by guarantee. All rights reserved.
Intr
oduc
tion
Aud
itor
s’ r
epor
tPr
imar
y st
atem
ents
Not
esA
PP
EN
DIC
ES
Major new and forthcoming standards
Revenue Financial instruments
Leases Insurance contracts (under development)
Amendments to existing standards
Business combinations and consolidation Presentation and disclosures
For access to an extensive range of accounting, auditing and financial reporting guidance and literature, visit KPMG’s Accounting Research Online. This web-based subscription service can be a valuable tool for anyone who wants to stay informed in today’s dynamic environment. For a free 15-day trial, go to aro.kpmg.com and register today.
Keeping in touch | 177

kpmg.com/ifrs
© 2017 KPMG IFRG Limited, a UK company, limited by guarantee. All rights reserved.
Publication name: Illustrative disclosures for banks under IAS 39
Publication number: 134223
Publication date: February 2017
KPMG International Standards Group is part of KPMG IFRG Limited.
KPMG International Cooperative (“KPMG International”) is a Swiss entity that serves as a coordinating entity for a network of independent firms operating under the KPMG name. KPMG International provides no audit or other client services. Such services are provided solely by member firms of KPMG International (including sublicensees and subsidiaries) in their respective geographic areas. KPMG International and its member firms are legally distinct and separate entities. They are not and nothing contained herein shall be construed to place these entities in the relationship of parents, subsidiaries, agents, partners, or joint venturers. No member firm has any authority (actual, apparent, implied or otherwise) to obligate or bind KPMG International or any other member firm, nor does KPMG International have any such authority to obligate or bind any member firm, in any manner whatsoever.
The information contained herein is of a general nature and is not intended to address the circumstances of any particular individual or entity. Although we endeavour to provide accurate and timely information, there can be no guarantee that such information is accurate as of the date it is received or that it will continue to be accurate in the future. No one should act upon such information without appropriate professional advice after a thorough examination of the particular situation.
The KPMG name, logo and “cutting through complexity” are registered trademarks or trademarks of KPMG International.


