235
Illustrative disclosures for insurers Guide to annual financial statements: IFRS 17 and IFRS 9 IFRS ® January 2018 kpmg.com/ifrs $ $
Illustrative disclosures for insurersGuide to annual financial statements: IFRS 17 and IFRS 9
IFRS®
January 2018
kpmg.com/ifrs
$
$

ContentsAbout this guide 2
About IFRS 17 5
About the Group 9
Independent auditors’ report 10
Consolidated financial statements 14
Financial highlights 15
Consolidated statement of profit or loss 16
Consolidated statement of profit or loss and other comprehensive income 17
Consolidated statement of financial position 18
Consolidated statement of changes in equity 20
Consolidated statement of cash flows 22
Notes to the consolidated financial statements 24
Keeping in touch 230
Acknowledgements 232
Contents
Notes
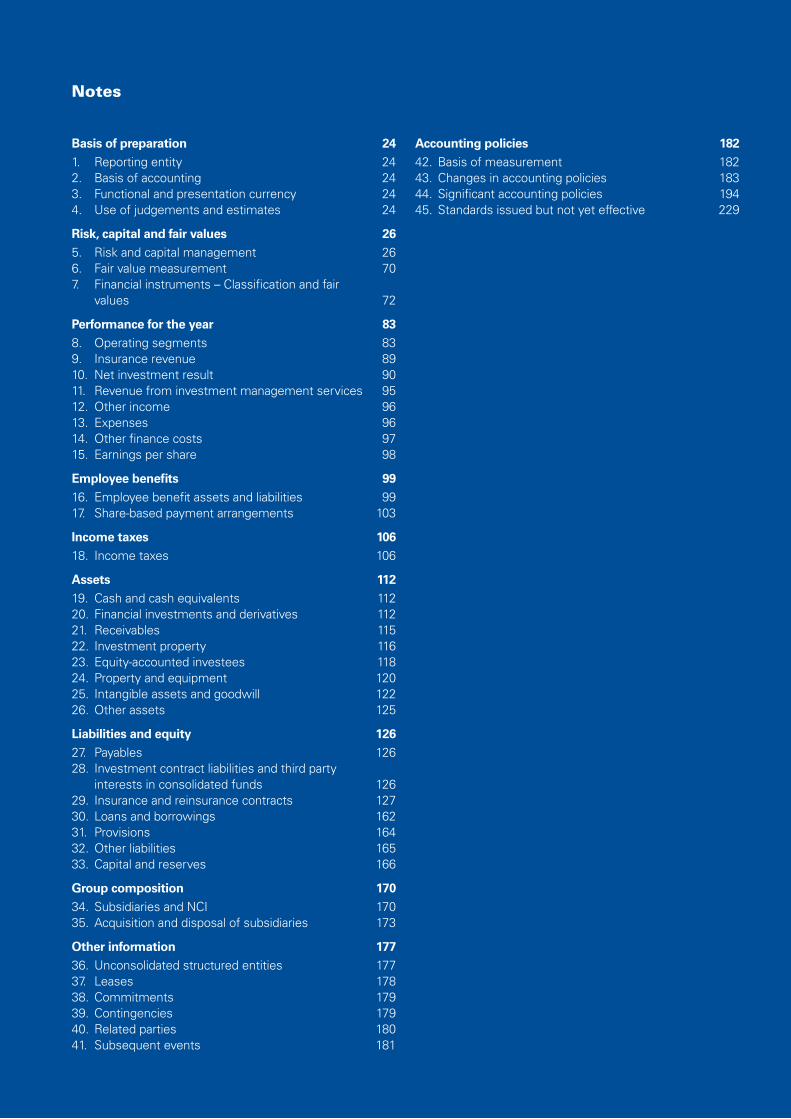
Basis of preparation 241. Reporting entity 242. Basis of accounting 243. Functional and presentation currency 244. Use of judgements and estimates 24
Risk, capital and fair values 265. Risk and capital management 266. Fair value measurement 707. Financial instruments – Classification and fair
values 72
Performance for the year 838. Operating segments 839. Insurance revenue 8910. Net investment result 9011. Revenue from investment management services 9512. Other income 9613. Expenses 9614. Other finance costs 9715. Earnings per share 98
Employee benefits 9916. Employee benefit assets and liabilities 9917. Share-based payment arrangements 103
Income taxes 10618. Income taxes 106
Assets 11219. Cash and cash equivalents 11220. Financial investments and derivatives 11221. Receivables 11522. Investment property 11623. Equity-accounted investees 11824. Property and equipment 12025. Intangible assets and goodwill 12226. Other assets 125
Liabilities and equity 12627. Payables 12628. Investment contract liabilities and third party
interests in consolidated funds 12629. Insurance and reinsurance contracts 12730. Loans and borrowings 16231. Provisions 16432. Other liabilities 16533. Capital and reserves 166
Group composition 17034. Subsidiaries and NCI 17035. Acquisition and disposal of subsidiaries 173
Other information 17736. Unconsolidated structured entities 17737. Leases 17838. Commitments 17939. Contingencies 17940. Related parties 18041. Subsequent events 181
Accounting policies 18242. Basis of measurement 18243. Changes in accounting policies 18344. Significant accounting policies 19445. Standards issued but not yet effective 229
© 2018 KPMG IFRG Limited, a UK company, limited by guarantee. All rights reserved.
2 | Guide to annual financial statements: IFRS 17 and IFRS 9 – Illustrative disclosures for insurers
INT
RO
DU
CT
ION
Aud
itor
s’ r
epor
tPr
imar
y st
atem
ents
Not
esFu
rthe
r re
sour
ces
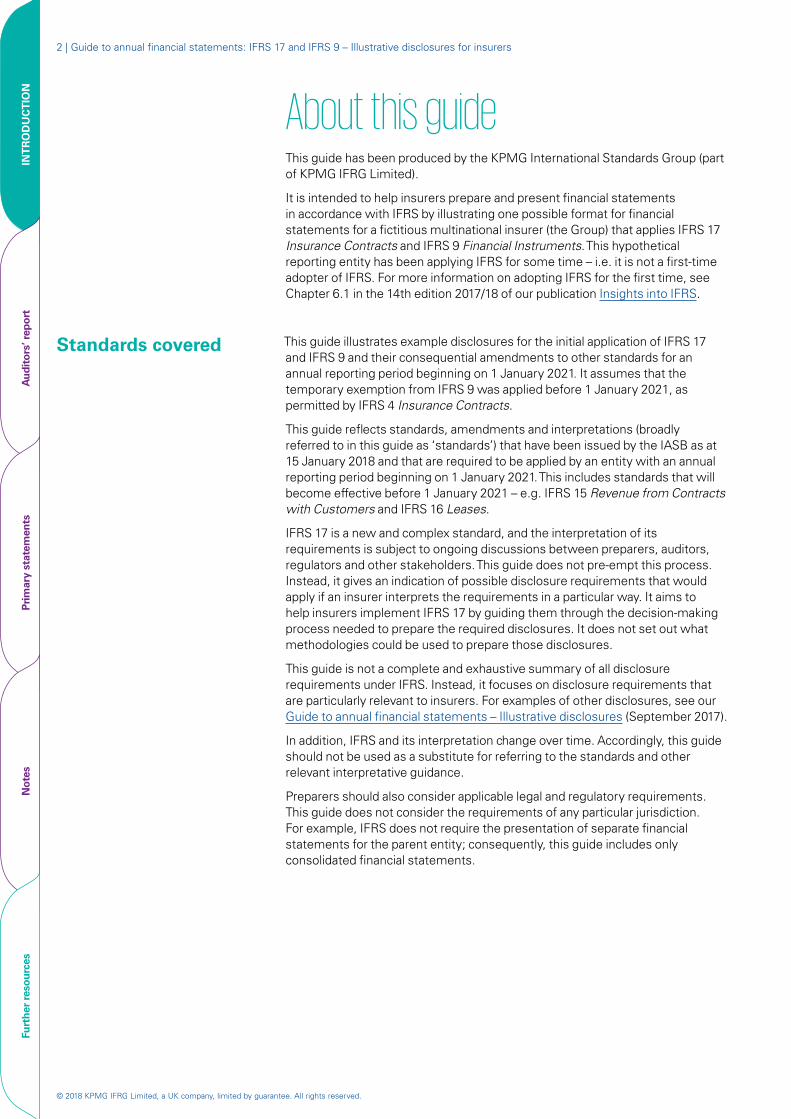
About this guideThis guide has been produced by the KPMG International Standards Group (part of KPMG IFRG Limited).
It is intended to help insurers prepare and present financial statements in accordance with IFRS by illustrating one possible format for financial statements for a fictitious multinational insurer (the Group) that applies IFRS 17 Insurance Contracts and IFRS 9 Financial Instruments. This hypothetical reporting entity has been applying IFRS for some time – i.e. it is not a first-time adopter of IFRS. For more information on adopting IFRS for the first time, see Chapter 6.1 in the 14th edition 2017/18 of our publication Insights into IFRS.
Standards covered This guide illustrates example disclosures for the initial application of IFRS 17 and IFRS 9 and their consequential amendments to other standards for an annual reporting period beginning on 1 January 2021. It assumes that the temporary exemption from IFRS 9 was applied before 1 January 2021, as permitted by IFRS 4 Insurance Contracts.
This guide reflects standards, amendments and interpretations (broadly referred to in this guide as ‘standards’) that have been issued by the IASB as at 15 January 2018 and that are required to be applied by an entity with an annual reporting period beginning on 1 January 2021. This includes standards that will become effective before 1 January 2021 – e.g. IFRS 15 Revenue from Contracts with Customers and IFRS 16 Leases.
IFRS 17 is a new and complex standard, and the interpretation of its requirements is subject to ongoing discussions between preparers, auditors, regulators and other stakeholders. This guide does not pre-empt this process. Instead, it gives an indication of possible disclosure requirements that would apply if an insurer interprets the requirements in a particular way. It aims to help insurers implement IFRS 17 by guiding them through the decision-making process needed to prepare the required disclosures. It does not set out what methodologies could be used to prepare those disclosures.
This guide is not a complete and exhaustive summary of all disclosure requirements under IFRS. Instead, it focuses on disclosure requirements that are particularly relevant to insurers. For examples of other disclosures, see our Guide to annual financial statements – Illustrative disclosures (September 2017).
In addition, IFRS and its interpretation change over time. Accordingly, this guide should not be used as a substitute for referring to the standards and other relevant interpretative guidance.
Preparers should also consider applicable legal and regulatory requirements. This guide does not consider the requirements of any particular jurisdiction. For example, IFRS does not require the presentation of separate financial statements for the parent entity; consequently, this guide includes only consolidated financial statements.
© 2018 KPMG IFRG Limited, a UK company, limited by guarantee. All rights reserved.
| 3
INT
RO
DU
CT
ION
Aud
itor
s’ r
epor
tPr
imar
y st
atem
ents
Not
esFu
rthe
r re
sour
ces
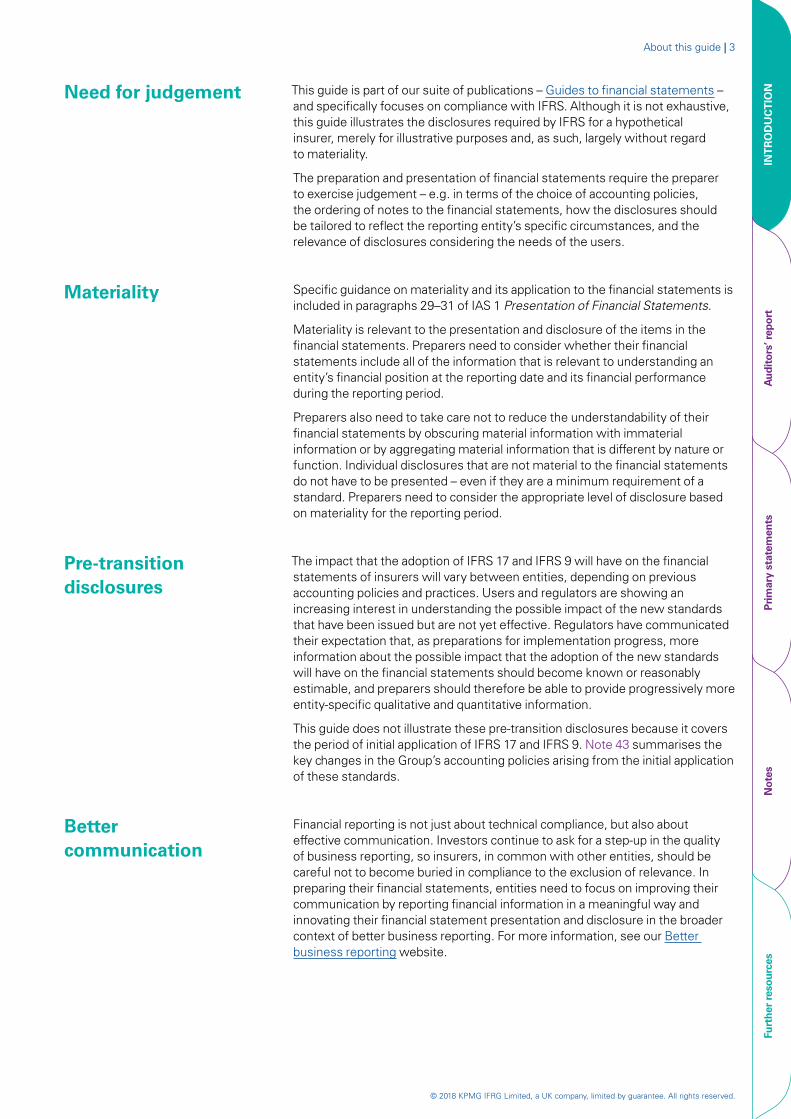
Need for judgement This guide is part of our suite of publications – Guides to financial statements – and specifically focuses on compliance with IFRS. Although it is not exhaustive, this guide illustrates the disclosures required by IFRS for a hypothetical insurer, merely for illustrative purposes and, as such, largely without regard to materiality.
The preparation and presentation of financial statements require the preparer to exercise judgement – e.g. in terms of the choice of accounting policies, the ordering of notes to the financial statements, how the disclosures should be tailored to reflect the reporting entity’s specific circumstances, and the relevance of disclosures considering the needs of the users.
Materiality Specific guidance on materiality and its application to the financial statements is included in paragraphs 29–31 of IAS 1 Presentation of Financial Statements.
Materiality is relevant to the presentation and disclosure of the items in the financial statements. Preparers need to consider whether their financial statements include all of the information that is relevant to understanding an entity’s financial position at the reporting date and its financial performance during the reporting period.
Preparers also need to take care not to reduce the understandability of their financial statements by obscuring material information with immaterial information or by aggregating material information that is different by nature or function. Individual disclosures that are not material to the financial statements do not have to be presented – even if they are a minimum requirement of a standard. Preparers need to consider the appropriate level of disclosure based on materiality for the reporting period.
Pre-transition disclosures
The impact that the adoption of IFRS 17 and IFRS 9 will have on the financial statements of insurers will vary between entities, depending on previous accounting policies and practices. Users and regulators are showing an increasing interest in understanding the possible impact of the new standards that have been issued but are not yet effective. Regulators have communicated their expectation that, as preparations for implementation progress, more information about the possible impact that the adoption of the new standards will have on the financial statements should become known or reasonably estimable, and preparers should therefore be able to provide progressively more entity-specific qualitative and quantitative information.
This guide does not illustrate these pre-transition disclosures because it covers the period of initial application of IFRS 17 and IFRS 9. Note 43 summarises the key changes in the Group’s accounting policies arising from the initial application of these standards.
Better communication
Financial reporting is not just about technical compliance, but also about effective communication. Investors continue to ask for a step-up in the quality of business reporting, so insurers, in common with other entities, should be careful not to become buried in compliance to the exclusion of relevance. In preparing their financial statements, entities need to focus on improving their communication by reporting financial information in a meaningful way and innovating their financial statement presentation and disclosure in the broader context of better business reporting. For more information, see our Better business reporting website.
About this guide |
© 2018 KPMG IFRG Limited, a UK company, limited by guarantee. All rights reserved.
4 | Guide to annual financial statements: IFRS 17 and IFRS 9 – Illustrative disclosures for insurers
INT
RO
DU
CT
ION
Aud
itor
s’ r
epor
tPr
imar
y st
atem
ents
Not
esFu
rthe
r re
sour
ces
References References are included in the left-hand margin of this guide. Generally, they relate only to presentation and disclosure requirements.
IAS 1.82(a) Paragraph 82(a) of IAS 1 as at 15 January 2018 and effective on 1 January 2021.
[IFRS 9.4.1.1] Paragraph 4.1.1 of IFRS 9. The square brackets indicate that the paragraph relates to recognition and measurement requirements, as opposed to presentation and disclosure requirements.
IAS 39 IAS 39 before amendment by IFRS 9.
Insights 2.8.50.10 Paragraph 2.8.50.10 of the 14th edition 2017/18 of our publication Insights into IFRS.
The following marking in the left-hand margins indicates the following.
In the context of consolidated financial statements, the disclosures in respect of operating segments (Note 8) and EPS (statement of profit or loss and OCI, and Note 15) apply only if the parent:
– has debt or equity instruments (operating segments) or ordinary shares or potential ordinary shares (EPS) that are traded in a public market – i.e. a domestic or foreign stock exchange or an over-the-counter market, including local and regional markets; or
– files, or is in the process of filing, its financial statements with a securities commission or other regulatory organisation for the purpose of issuing any class of instruments in a public market.
Abbreviations The following abbreviations are used often in this guide.
CGUCSMECLEPSFVOCIFVTPL IUNCINotesOCIPAA
Cash-generating unitContractual service marginExpected credit lossesEarnings per shareFair value through other comprehensive incomeFair value through profit or lossIFRS Interpretations Committee publication IFRIC UpdateNon-controlling interestsNotes to the financial statementsOther comprehensive incomePremium allocation approach
© 2018 KPMG IFRG Limited, a UK company, limited by guarantee. All rights reserved.
| 5
INT
RO
DU
CT
ION
Aud
itor
s’ r
epor
tPr
imar
y st
atem
ents
Not
esFu
rthe
r re
sour
ces
About IFRS 17IFRS 17 introduces an accounting model that measures groups of insurance contracts based on fulfilment cash flows and a CSM. It brings greater comparability and transparency about the profitability of new and in-force business and gives users of financial statements more insight into an insurer’s financial health. Separate presentation of underwriting and financial results will give added transparency about the sources of profits and quality of earnings.
IFRS 17 is effective for annual periods beginning on or after 1 January 2021. Early adoption is permitted for entities that apply IFRS 9 and IFRS 15 on or before the date of application of IFRS 17.
For further details of IFRS 17 and its impacts, see our publication First Impressions: IFRS 17 Insurance Contracts.
General disclosure objectiveIFRS 17.93 IFRS 17 contains qualitative and quantitative disclosure requirements. The
objective is for an entity to disclose information that, together with information presented in the primary financial statements, provides a basis for users of its financial statements to assess the effects that insurance contracts have on its financial position, financial performance and cash flows. To achieve this objective, IFRS 17 requires specific disclosures about:
– amounts recognised in the financial statements;
– significant judgements made when applying IFRS 17; and
– the nature and extent of risks from insurance contracts.
IFRS 17.94 If these specific disclosures are insufficient to meet this objective, then an entity discloses additional information that is necessary to meet the objective.
IFRS 17.94–96 Entities consider the level of detail that is necessary to satisfy the general disclosure objective and how much emphasis to place on each disclosure requirement. Examples of aggregation bases that may be appropriate for disclosure purposes are types of contract (e.g. major product lines), geographic areas (e.g. country or region) and reportable segments as defined in IFRS 8 Operating Segments.
About IFRS 17 |
© 2018 KPMG IFRG Limited, a UK company, limited by guarantee. All rights reserved.
6 | Guide to annual financial statements: IFRS 17 and IFRS 9 – Illustrative disclosures for insurers
INT
RO
DU
CT
ION
Aud
itor
s’ r
epor
tPr
imar
y st
atem
ents
Not
esFu
rthe
r re
sour
ces
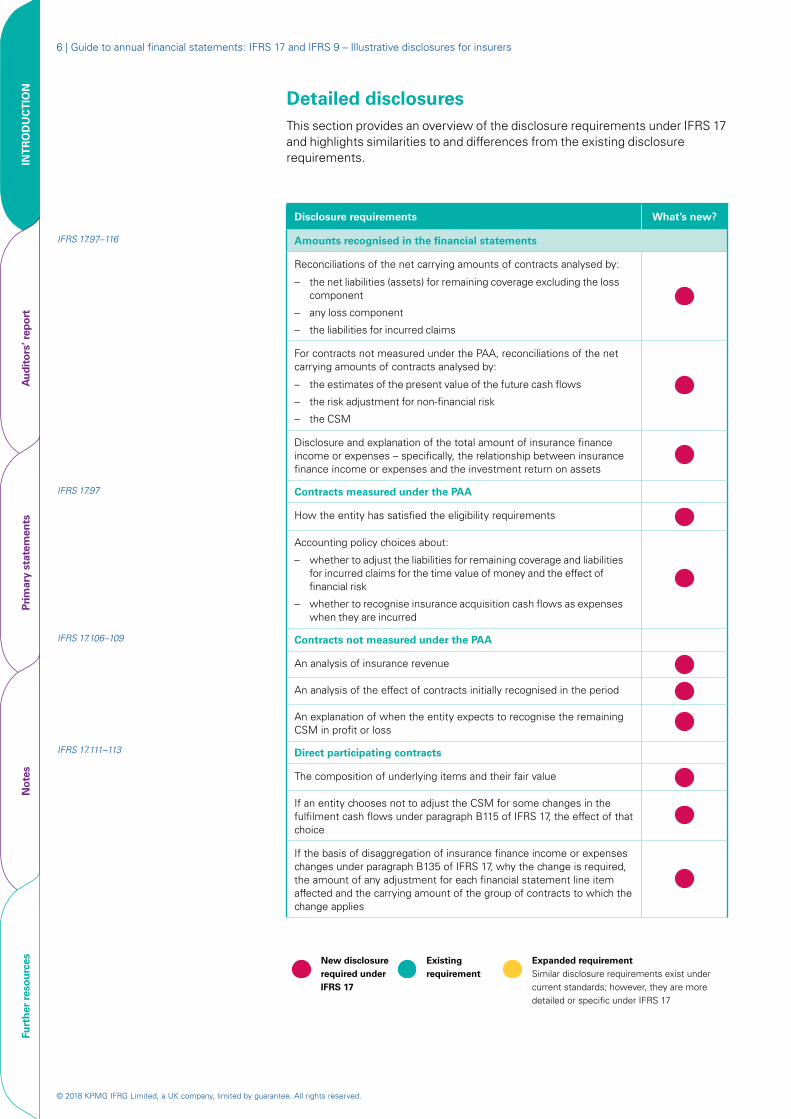
Detailed disclosuresThis section provides an overview of the disclosure requirements under IFRS 17 and highlights similarities to and differences from the existing disclosure requirements.
Disclosure requirements What’s new?
IFRS 17.97–116 Amounts recognised in the financial statements
Reconciliations of the net carrying amounts of contracts analysed by:
– the net liabilities (assets) for remaining coverage excluding the loss component
– any loss component
– the liabilities for incurred claims
For contracts not measured under the PAA, reconciliations of the net carrying amounts of contracts analysed by:
– the estimates of the present value of the future cash flows
– the risk adjustment for non-financial risk
– the CSM
Disclosure and explanation of the total amount of insurance finance income or expenses – specifically, the relationship between insurance finance income or expenses and the investment return on assets
IFRS 17.97 Contracts measured under the PAA
How the entity has satisfied the eligibility requirements
Accounting policy choices about:
– whether to adjust the liabilities for remaining coverage and liabilities for incurred claims for the time value of money and the effect of financial risk
– whether to recognise insurance acquisition cash flows as expenses when they are incurred
IFRS 17.106–109 Contracts not measured under the PAA
An analysis of insurance revenue
An analysis of the effect of contracts initially recognised in the period
An explanation of when the entity expects to recognise the remaining CSM in profit or loss
IFRS 17.111–113 Direct participating contracts
The composition of underlying items and their fair value
If an entity chooses not to adjust the CSM for some changes in the fulfilment cash flows under paragraph B115 of IFRS 17, the effect of that choice
If the basis of disaggregation of insurance finance income or expenses changes under paragraph B135 of IFRS 17, why the change is required, the amount of any adjustment for each financial statement line item affected and the carrying amount of the group of contracts to which the change applies
New disclosure required under IFRS 17
Existing requirement
Expanded requirementSimilar disclosure requirements exist under current standards; however, they are more detailed or specific under IFRS 17
© 2018 KPMG IFRG Limited, a UK company, limited by guarantee. All rights reserved.
| 7
INT
RO
DU
CT
ION
Aud
itor
s’ r
epor
tPr
imar
y st
atem
ents
Not
esFu
rthe
r re
sour
ces
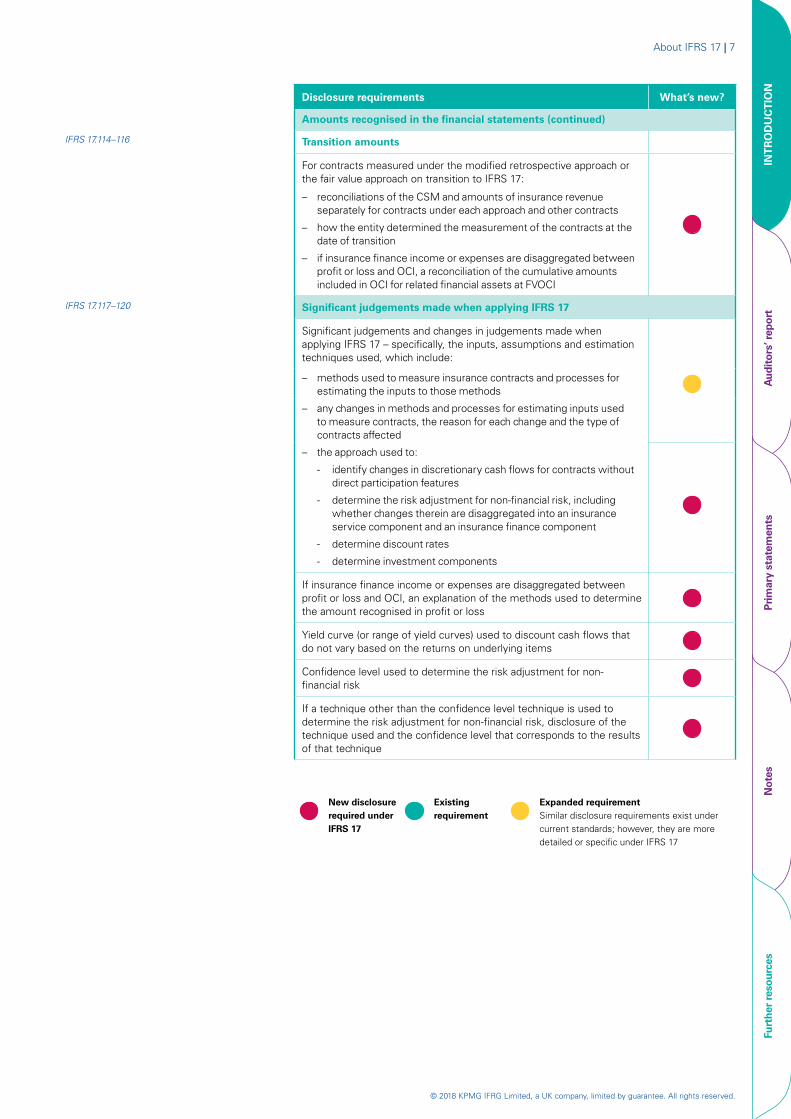
Disclosure requirements What’s new?
Amounts recognised in the financial statements (continued)
IFRS 17.114–116 Transition amounts
For contracts measured under the modified retrospective approach or the fair value approach on transition to IFRS 17:
– reconciliations of the CSM and amounts of insurance revenue separately for contracts under each approach and other contracts
– how the entity determined the measurement of the contracts at the date of transition
– if insurance finance income or expenses are disaggregated between profit or loss and OCI, a reconciliation of the cumulative amounts included in OCI for related financial assets at FVOCI
IFRS 17.117–120 Significant judgements made when applying IFRS 17
Significant judgements and changes in judgements made when applying IFRS 17 – specifically, the inputs, assumptions and estimation techniques used, which include:
– methods used to measure insurance contracts and processes for estimating the inputs to those methods
– any changes in methods and processes for estimating inputs used to measure contracts, the reason for each change and the type of contracts affected
– the approach used to:
- identify changes in discretionary cash flows for contracts without direct participation features
- determine the risk adjustment for non-financial risk, including whether changes therein are disaggregated into an insurance service component and an insurance finance component
- determine discount rates
- determine investment components
If insurance finance income or expenses are disaggregated between profit or loss and OCI, an explanation of the methods used to determine the amount recognised in profit or loss
Yield curve (or range of yield curves) used to discount cash flows that do not vary based on the returns on underlying items
Confidence level used to determine the risk adjustment for non-financial risk
If a technique other than the confidence level technique is used to determine the risk adjustment for non-financial risk, disclosure of the technique used and the confidence level that corresponds to the results of that technique
New disclosure required under IFRS 17
Existing requirement
Expanded requirementSimilar disclosure requirements exist under current standards; however, they are more detailed or specific under IFRS 17
About IFRS 17 |

© 2018 KPMG IFRG Limited, a UK company, limited by guarantee. All rights reserved.
8 | Guide to annual financial statements: IFRS 17 and IFRS 9 – Illustrative disclosures for insurers
INT
RO
DU
CT
ION
Aud
itor
s’ r
epor
tPr
imar
y st
atem
ents
Not
esFu
rthe
r re
sour
ces
Disclosure requirements What’s new?
IFRS 17.121–132 Nature and extent of risks from insurance contracts
Information about the effect of the regulatory frameworks in which the entity operates
If contracts are included within the same group as a result of law or regulation under paragraph 20 of IFRS 17, disclosure of that fact
For each type of risk:
– the exposures to risks, how they arise and changes therein
– the entity’s objectives, policies and processes for managing the risks, methods used to measure the risks and changes therein
– summary quantitative information about exposure to the risk at the reporting date, based on information provided internally to key management personnel or, when this is not provided, based on the specific disclosure requirements below
Information about risk concentrations
IFRS 17.128–129 Insurance and market risks
For insurance risk, a sensitivity analysis that shows the effect for insurance contracts issued, before and after risk mitigation by reinsurance
For each type of market risk, a sensitivity analysis that explains the relationship between the sensitivities from insurance contracts and those from financial assets
Methods and assumptions used in preparing the sensitivity analyses, changes therein and the reasons for such changes
If an entity discloses an alternative sensitivity analysis in place of any of those specified above, explanations of the method used and its objective, the main parameters and assumptions, and any limitations that may result in the information provided
IFRS 17.130 Insurance risk
Claims development – i.e. actual claims compared with previous estimates of the undiscounted amount of the claims
IFRS 17.131 Credit risk
The entity’s maximum exposure to credit risk
Information about the credit quality of reinsurance contract assets
IFRS 17.132 Liquidity risk
A description of how liquidity risk is managed
Maturity analyses that show, as a minimum, net cash flows for each of the first five years after the reporting date and in aggregate beyond the first five years, which may be based on the estimated timing of:
– the remaining contractual undiscounted net cash flows; or
– the estimates of the present value of the future cash flows
Amounts that are payable on demand and their relationship with the carrying amounts of the related groups of contracts
New disclosure required under IFRS 17
Existing requirement
Expanded requirementSimilar disclosure requirements exist under current standards; however, they are more detailed or specific under IFRS 17
© 2018 KPMG IFRG Limited, a UK company, limited by guarantee. All rights reserved.
| 9
INT
RO
DU
CT
ION
Aud
itor
s’ r
epor
tPr
imar
y st
atem
ents
Not
esFu
rthe
r re
sour
ces
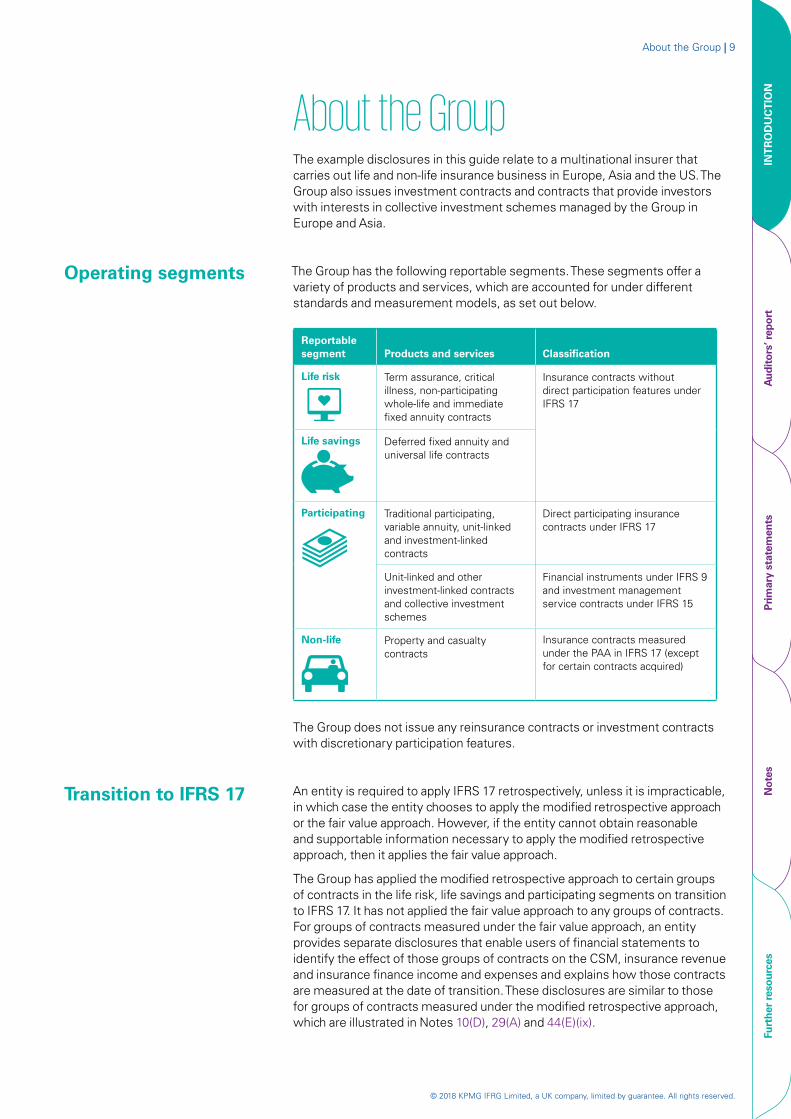
About the GroupThe example disclosures in this guide relate to a multinational insurer that carries out life and non-life insurance business in Europe, Asia and the US. The Group also issues investment contracts and contracts that provide investors with interests in collective investment schemes managed by the Group in Europe and Asia.
Operating segments The Group has the following reportable segments. These segments offer a variety of products and services, which are accounted for under different standards and measurement models, as set out below.
Reportable segment Products and services Classification
Life risk
Term assurance, critical illness, non-participating whole-life and immediate fixed annuity contracts
Insurance contracts without direct participation features under IFRS 17
Life savings Deferred fixed annuity and universal life contracts
Participating Traditional participating, variable annuity, unit-linked and investment-linked contracts
Direct participating insurance contracts under IFRS 17
Unit-linked and other investment-linked contracts and collective investment schemes
Financial instruments under IFRS 9 and investment management service contracts under IFRS 15
Non-life Property and casualty contracts
Insurance contracts measured under the PAA in IFRS 17 (except for certain contracts acquired)
The Group does not issue any reinsurance contracts or investment contracts with discretionary participation features.
Transition to IFRS 17 An entity is required to apply IFRS 17 retrospectively, unless it is impracticable, in which case the entity chooses to apply the modified retrospective approach or the fair value approach. However, if the entity cannot obtain reasonable and supportable information necessary to apply the modified retrospective approach, then it applies the fair value approach.
The Group has applied the modified retrospective approach to certain groups of contracts in the life risk, life savings and participating segments on transition to IFRS 17. It has not applied the fair value approach to any groups of contracts. For groups of contracts measured under the fair value approach, an entity provides separate disclosures that enable users of financial statements to identify the effect of those groups of contracts on the CSM, insurance revenue and insurance finance income and expenses and explains how those contracts are measured at the date of transition. These disclosures are similar to those for groups of contracts measured under the modified retrospective approach, which are illustrated in Notes 10(D), 29(A) and 44(E)(ix).
About the Group |

© 2018 KPMG IFRG Limited, a UK company, limited by guarantee. All rights reserved.
10 | Guide to annual financial statements: IFRS 17 and IFRS 9 – Illustrative disclosures for insurers
Intr
oduc
tion
AU
DIT
OR
S’ R
EP
OR
TPr
imar
y st
atem
ents
Not
esFu
rthe
r re
sour
ces
[Name of the Company]
Independent auditors’ report
© 2018 KPMG IFRG Limited, a UK company, limited by guarantee. All rights reserved.
Independent auditors’ report | 11
Intr
oduc
tion
AU
DIT
OR
S’ R
EP
OR
TPr
imar
y st
atem
ents
Not
esFu
rthe
r re
sour
ces
Independent auditors’ reporta
To the Shareholders of [Name of the Company]
Opinion
We have audited the consolidated financial statements of [Name of the Company] and its subsidiaries (the Group), which comprise the consolidated statement of financial position as at 31 December 2021, and the consolidated statement of profit or loss and other comprehensive income, changes in equity and cash flows for the year then ended, and notes to the consolidated financial statements, including significant accounting policies and other explanatory information.
In our opinion, the accompanying consolidated financial statements present fairly, in all material respects, the consolidated financial position of the Group as at 31 December 2021, and its consolidated financial performance and its consolidated cash flows for the year then ended in accordance with International Financial Reporting Standards (IFRS).
Basis for Opinion
We conducted our audit in accordance with International Standards on Auditing (ISAs). Our responsibilities under those standards are further described in the ‘Auditors’ Responsibilities for the Audit of the Consolidated Financial Statements’ section of our report. We are independent of the Group in accordance with the ethical requirements that are relevant to our audit of the consolidated financial statements in [jurisdiction], and we have fulfilled our other ethical responsibilities in accordance with these requirements. We believe that the audit evidence we have obtained is sufficient and appropriate to provide a basis for our opinion.
Key Audit Matters
Key audit matters are those matters that, in our professional judgement, were of most significance in our audit of the consolidated financial statements of the current period. These matters were addressed in the context of our audit of the consolidated financial statements as a whole, and in forming our opinion thereon, and we do not provide a separate opinion on these matters.
[Description of each key audit matter.]
a. This example report has been prepared based on the following International Standards on Auditing (ISAs) that have been issued as at 15 January 2018:
– ISA 700 (Revised) Forming an Opinion and Reporting on Financial Statements;
– ISA 701 Communicating Key Audit Matters in the Independent Auditor’s Report; and
– ISA 720 (Revised) The Auditor’s Responsibilities Relating to Other Information and Related Conforming Amendments.
The format of the example report does not reflect the legal or regulatory requirements of any particular jurisdiction.
In accordance with ISA 701, key audit matters are included in the auditor’s report:
– for audits of complete sets of general purpose financial statements of listed entities;
– when otherwise required by law or regulation; and
– when the auditor otherwise decides to do so.

© 2018 KPMG IFRG Limited, a UK company, limited by guarantee. All rights reserved.
12 | Guide to annual financial statements: IFRS 17 and IFRS 9 – Illustrative disclosures for insurers
Intr
oduc
tion
AU
DIT
OR
S’ R
EP
OR
TPr
imar
y st
atem
ents
Not
esFu
rthe
r re
sour
ces
Other Information
Management is responsible for the other information. The other information comprises the [information included in the X report, but does not include the consolidated financial statements and our auditors’ report thereon].
Our opinion on the consolidated financial statements does not cover the other information and we do not express any form of assurance conclusion thereon.
In connection with our audit of the consolidated financial statements, our responsibility is to read the other information and, in doing so, consider whether the other information is materially inconsistent with the consolidated financial statements or our knowledge obtained in the audit or otherwise appears to be materially misstated.
If, based on the work that we have performed, we conclude that there is a material misstatement of this other information, then we are required to report that fact. We have nothing to report in this regard.
Responsibilities of Management and Those Charged with Governance for the Consolidated Financial Statements
Management is responsible for the preparation and fair presentation of the consolidated financial statements in accordance with IFRS, and for such internal control as management determines is necessary to enable the preparation of consolidated financial statements that are free from material misstatement, whether due to fraud or error.
In preparing the consolidated financial statements, management is responsible for assessing the Group’s ability to continue as a going concern, disclosing, as applicable, matters related to going concern and using the going concern basis of accounting unless management either intends to liquidate the Group or to cease operations, or has no realistic alternative but to do so.
Those charged with governance are responsible for overseeing the Group’s financial reporting process.
Auditors’ Responsibilities for the Audit of the Consolidated Financial Statements
Our objectives are to obtain reasonable assurance about whether the consolidated financial statements as a whole are free from material misstatement, whether due to fraud or error, and to issue an auditors’ report that includes our opinion. ‘Reasonable assurance’ is a high level of assurance, but is not a guarantee that an audit conducted in accordance with ISAs will always detect a material misstatement when it exists. Misstatements can arise from fraud or error and are considered material if, individually or in aggregate, they could reasonably be expected to influence the economic decisions of users taken on the basis of these consolidated financial statements.
© 2018 KPMG IFRG Limited, a UK company, limited by guarantee. All rights reserved.
Independent auditors’ report | 13
Intr
oduc
tion
AU
DIT
OR
S’ R
EP
OR
TPr
imar
y st
atem
ents
Not
esFu
rthe
r re
sour
ces
As part of an audit in accordance with ISAs, we exercise professional judgement and maintain professional scepticism throughout the audit. We also:
– Identify and assess the risks of material misstatement of the consolidated financial statements, whether due to fraud or error, design and perform audit procedures responsive to those risks, and obtain audit evidence that is sufficient and appropriate to provide a basis for our opinion. The risk of not detecting a material misstatement resulting from fraud is higher than for one resulting from error, as fraud may involve collusion, forgery, intentional omissions, misrepresentations or the override of internal control.
– Obtain an understanding of internal control relevant to the audit in order to design audit procedures that are appropriate in the circumstances, but not for the purpose of expressing an opinion on the effectiveness of the Group’s internal control.
– Evaluate the appropriateness of accounting policies used and the reasonableness of accounting estimates and related disclosures made by management.
– Conclude on the appropriateness of management’s use of the going concern basis of accounting and, based on the audit evidence obtained, whether a material uncertainty exists related to events or conditions that may cast significant doubt on the Group’s ability to continue as a going concern. If we conclude that a material uncertainty exists, then we are required to draw attention in our auditors’ report to the related disclosures in the consolidated financial statements or, if such disclosures are inadequate, to modify our opinion. Our conclusions are based on the audit evidence obtained up to the date of our auditors’ report. However, future events or conditions may cause the Group to cease to continue as a going concern.
– Evaluate the overall presentation, structure and content of the consolidated financial statements, including the disclosures, and whether the consolidated financial statements represent the underlying transactions and events in a manner that achieves fair presentation.
– Obtain sufficient appropriate audit evidence regarding the financial information of the entities or business activities within the Group to express an opinion on the consolidated financial statements. We are responsible for the direction, supervision and performance of the group audit. We remain solely responsible for our audit opinion.
We communicate with those charged with governance regarding, among other matters, the planned scope and timing of the audit and significant audit findings, including any significant deficiencies in internal control that we identify during our audit.
We also provide those charged with governance with a statement that we have complied with relevant ethical requirements regarding independence, and communicate with them all relationships and other matters that may reasonably be thought to bear on our independence and, where applicable, related safeguards.
From the matters communicated with those charged with governance, we determine those matters that were of most significance in the audit of the consolidated financial statements of the current period and are therefore the key audit matters. We describe these matters in our auditors’ report unless law or regulation precludes public disclosure about the matter or when, in extremely rare circumstances, we determine that a matter should not be communicated in our report because the adverse consequences of doing so would reasonably be expected to outweigh the public interest benefits of such communication.
The engagement partner on the audit resulting in this independent auditors’ report is [name].
[Signature as appropriate for the particular jurisdiction] [Auditors’ address][Date]

© 2018 KPMG IFRG Limited, a UK company, limited by guarantee. All rights reserved.
14 | Guide to annual financial statements: IFRS 17 and IFRS 9 – Illustrative disclosures for insurers
Intr
oduc
tion
AU
DIT
OR
S’ R
EP
OR
TPr
imar
y st
atem
ents
Not
esFu
rthe
r re
sour
ces
[Name of the Company]
Consolidated financial statements
31 December 2021
© 2018 KPMG IFRG Limited, a UK company, limited by guarantee. All rights reserved.
Illustrative disclosures – Primary statements | 15
Intr
oduc
tion
Aud
itor
s’ r
epor
tP
RIM
AR
Y S
TAT
EM
EN
TS
Not
esFu
rthe
r re
sour
ces
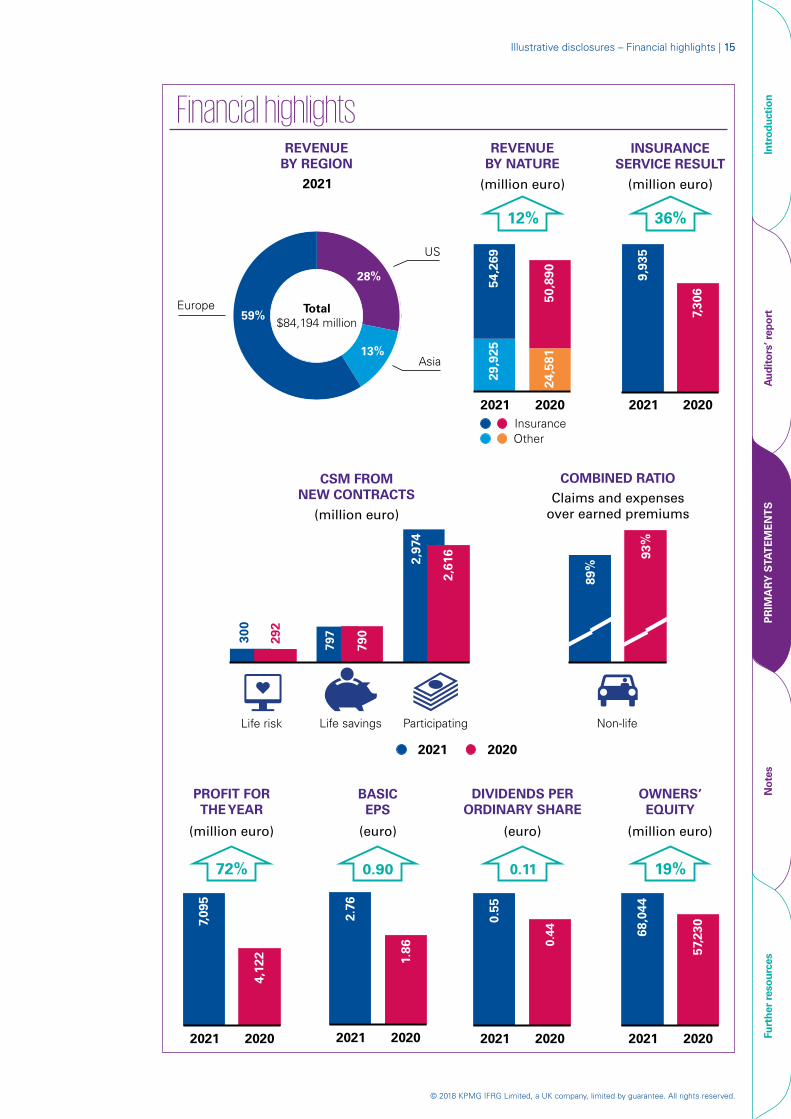
Financial highlights
28%
13%
59%Europe
Asia
US
REVENUE
BY REGION
BASIC
EPS
(euro)
2021 2020
2.7
6
1.8
6
0.90
2021 (million euro)
12%
2021 2020
Insurance
Other
29
,92
5
24
,58
1
54
,26
9
50
,89
0
REVENUE
BY NATURE
9,9
35
7,3
06
INSURANCE
SERVICE RESULT
(million euro)
2021 2020
36%
2021 2020
0.4
4
0.5
5
DIVIDENDS PER
ORDINARY SHARE
(euro)
0.11
2021 2020
57,
230
68,0
44
OWNERS’
EQUITY
(million euro)
19%
30
0
797
2 9, 7
4
292
790
2,6
16
Life risk Life savings Participating
2021 2020
(million euro)
CSM FROM
NEW CONTRACTS
93
%
89
%
COMBINED RATIO
Claims and expenses
over premiumsearned
Total
$84,194 million
Non-life
2021 2020
4,1
22
7,095
PROFIT FOR
THEYEAR
(million euro)
72%
Illustrative disclosures – Financial highlights | 15
© 2018 KPMG IFRG Limited, a UK company, limited by guarantee. All rights reserved.
16 | Guide to annual financial statements: IFRS 17 and IFRS 9 – Illustrative disclosures for insurers
Intr
oduc
tion
Aud
itor
s’ r
epor
tP
RIM
AR
Y S
TAT
EM
EN
TS
Not
esFu
rthe
r re
sour
ces
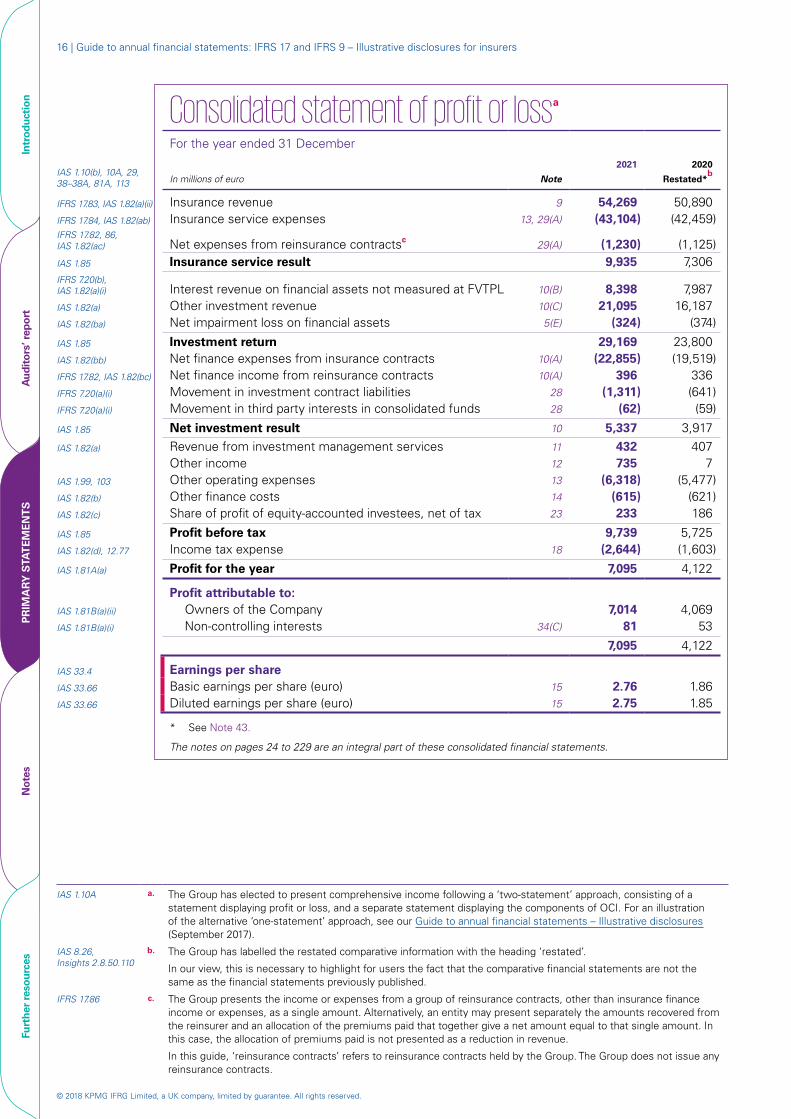
Consolidated statement of profit or lossa
IAS 1.10(b), 10A, 29, 38–38A, 81A, 113
For the year ended 31 December
In millions of euro Note
2021 2020
Restated*b
IFRS 17.83, IAS 1.82(a)(ii) Insurance revenue 9 54,269 50,890 IFRS 17.84, IAS 1.82(ab) Insurance service expenses 13, 29(A) (43,104) (42,459)IFRS 17.82, 86, IAS 1.82(ac) Net expenses from reinsurance contractsc 29(A) (1,230) (1,125)IAS 1.85 Insurance service result 9,935 7,306 IFRS 7.20(b), IAS 1.82(a)(i) Interest revenue on financial assets not measured at FVTPL 10(B) 8,398 7,987 IAS 1.82(a) Other investment revenue 10(C) 21,095 16,187 IAS 1.82(ba) Net impairment loss on financial assets 5(E) (324) (374)
IAS 1.85 Investment return 29,169 23,800 IAS 1.82(bb) Net finance expenses from insurance contracts 10(A) (22,855) (19,519)IFRS 17.82, IAS 1.82(bc) Net finance income from reinsurance contracts 10(A) 396 336 IFRS 7.20(a)(i) Movement in investment contract liabilities 28 (1,311) (641)IFRS 7.20(a)(i) Movement in third party interests in consolidated funds 28 (62) (59)
IAS 1.85 Net investment result 10 5,337 3,917
IAS 1.82(a) Revenue from investment management services 11 432 407 Other income 12 735 7
IAS 1.99, 103 Other operating expenses 13 (6,318) (5,477)IAS 1.82(b) Other finance costs 14 (615) (621)IAS 1.82(c) Share of profit of equity-accounted investees, net of tax 23 233 186
IAS 1.85 Profit before tax 9,739 5,725 IAS 1.82(d), 12.77 Income tax expense 18 (2,644) (1,603)
IAS 1.81A(a) Profit for the year 7,095 4,122
Profit attributable to:IAS 1.81B(a)(ii) Owners of the Company 7,014 4,069 IAS 1.81B(a)(i) Non-controlling interests 34(C) 81 53
7,095 4,122
IAS 33.4 Earnings per shareIAS 33.66 Basic earnings per share (euro) 15 2.76 1.86 IAS 33.66 Diluted earnings per share (euro) 15 2.75 1.85
* See Note 43.
The notes on pages 24 to 229 are an integral part of these consolidated financial statements.
IAS 1.10A a. The Group has elected to present comprehensive income following a ‘two-statement’ approach, consisting of a statement displaying profit or loss, and a separate statement displaying the components of OCI. For an illustration of the alternative ‘one-statement’ approach, see our Guide to annual financial statements – Illustrative disclosures (September 2017).
IAS 8.26, Insights 2.8.50.110
b. The Group has labelled the restated comparative information with the heading ‘restated’.
In our view, this is necessary to highlight for users the fact that the comparative financial statements are not the same as the financial statements previously published.
IFRS 17.86 c. The Group presents the income or expenses from a group of reinsurance contracts, other than insurance finance income or expenses, as a single amount. Alternatively, an entity may present separately the amounts recovered from the reinsurer and an allocation of the premiums paid that together give a net amount equal to that single amount. In this case, the allocation of premiums paid is not presented as a reduction in revenue.
In this guide, ‘reinsurance contracts’ refers to reinsurance contracts held by the Group. The Group does not issue any reinsurance contracts.
© 2018 KPMG IFRG Limited, a UK company, limited by guarantee. All rights reserved.
Illustrative disclosures – Primary statements | 17
Intr
oduc
tion
Aud
itor
s’ r
epor
tP
RIM
AR
Y S
TAT
EM
EN
TS
Not
esFu
rthe
r re
sour
ces
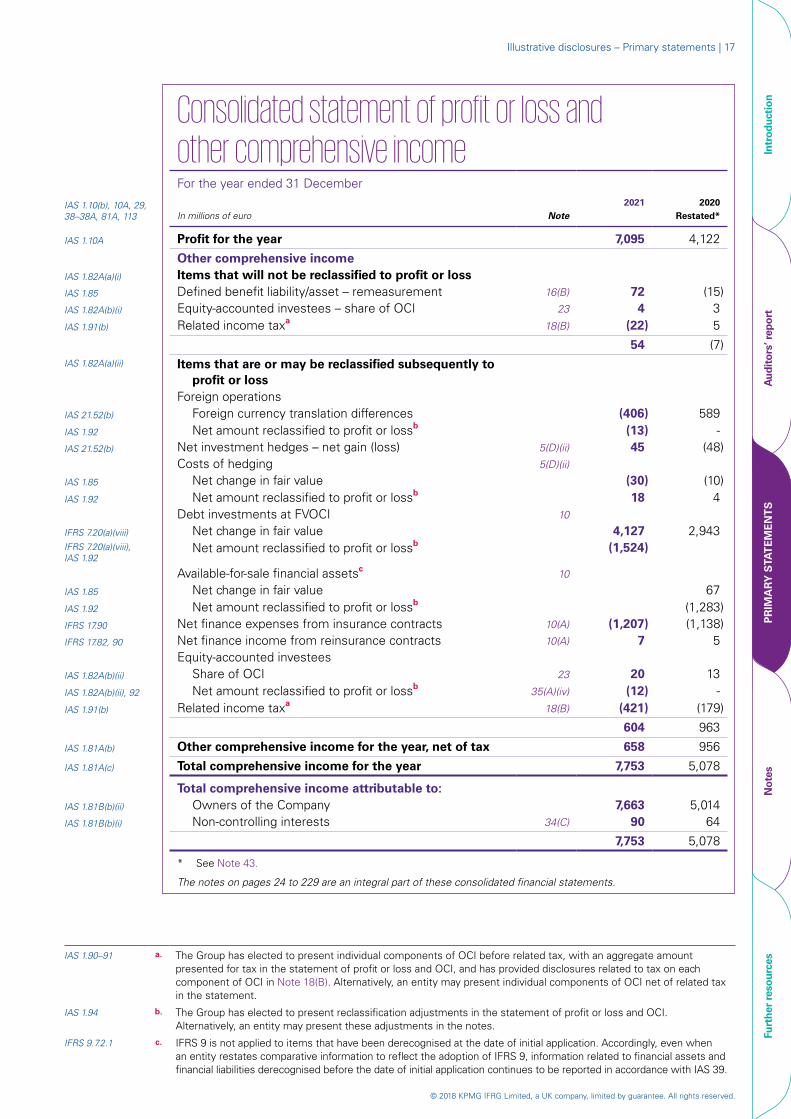
Consolidated statement of profit or loss and other comprehensive incomeFor the year ended 31 December
IAS 1.10(b), 10A, 29, 38–38A, 81A, 113 In millions of euro Note
2021 2020Restated*
IAS 1.10A Profit for the year 7,095 4,122
Other comprehensive incomeIAS 1.82A(a)(i) Items that will not be reclassified to profit or lossIAS 1.85 Defined benefit liability/asset – remeasurement 16(B) 72 (15)IAS 1.82A(b)(i) Equity-accounted investees – share of OCI 23 4 3 IAS 1.91(b) Related income taxa 18(B) (22) 5
54 (7)IAS 1.82A(a)(ii) Items that are or may be reclassified subsequently to
profit or lossForeign operations
IAS 21.52(b) Foreign currency translation differences (406) 589IAS 1.92 Net amount reclassified to profit or lossb (13) - IAS 21.52(b) Net investment hedges – net gain (loss) 5(D)(ii) 45 (48)
Costs of hedging 5(D)(ii)
IAS 1.85 Net change in fair value (30) (10)IAS 1.92 Net amount reclassified to profit or lossb 18 4
Debt investments at FVOCI 10
IFRS 7.20(a)(viii) Net change in fair value 4,127 2,943 IFRS 7.20(a)(viii), IAS 1.92
Net amount reclassified to profit or lossb (1,524)
Available-for-sale financial assetsc 10
IAS 1.85 Net change in fair value 67 IAS 1.92 Net amount reclassified to profit or lossb (1,283)IFRS 17.90 Net finance expenses from insurance contracts 10(A) (1,207) (1,138)IFRS 17.82, 90 Net finance income from reinsurance contracts 10(A) 7 5
Equity-accounted investeesIAS 1.82A(b)(ii) Share of OCI 23 20 13 IAS 1.82A(b)(ii), 92 Net amount reclassified to profit or lossb 35(A)(iv) (12) - IAS 1.91(b) Related income taxa 18(B) (421) (179)
604 963
IAS 1.81A(b) Other comprehensive income for the year, net of tax 658 956
IAS 1.81A(c) Total comprehensive income for the year 7,753 5,078
Total comprehensive income attributable to:IAS 1.81B(b)(ii) Owners of the Company 7,663 5,014 IAS 1.81B(b)(i) Non-controlling interests 34(C) 90 64
7,753 5,078
* See Note 43.
The notes on pages 24 to 229 are an integral part of these consolidated financial statements.
IAS 1.90–91 a. The Group has elected to present individual components of OCI before related tax, with an aggregate amount presented for tax in the statement of profit or loss and OCI, and has provided disclosures related to tax on each component of OCI in Note 18(B). Alternatively, an entity may present individual components of OCI net of related tax in the statement.
IAS 1.94 b. The Group has elected to present reclassification adjustments in the statement of profit or loss and OCI. Alternatively, an entity may present these adjustments in the notes.
IFRS 9.7.2.1 c. IFRS 9 is not applied to items that have been derecognised at the date of initial application. Accordingly, even when an entity restates comparative information to reflect the adoption of IFRS 9, information related to financial assets and financial liabilities derecognised before the date of initial application continues to be reported in accordance with IAS 39.
© 2018 KPMG IFRG Limited, a UK company, limited by guarantee. All rights reserved.
18 | Guide to annual financial statements: IFRS 17 and IFRS 9 – Illustrative disclosures for insurers
Intr
oduc
tion
Aud
itor
s’ r
epor
tP
RIM
AR
Y S
TAT
EM
EN
TS
Not
esFu
rthe
r re
sour
ces
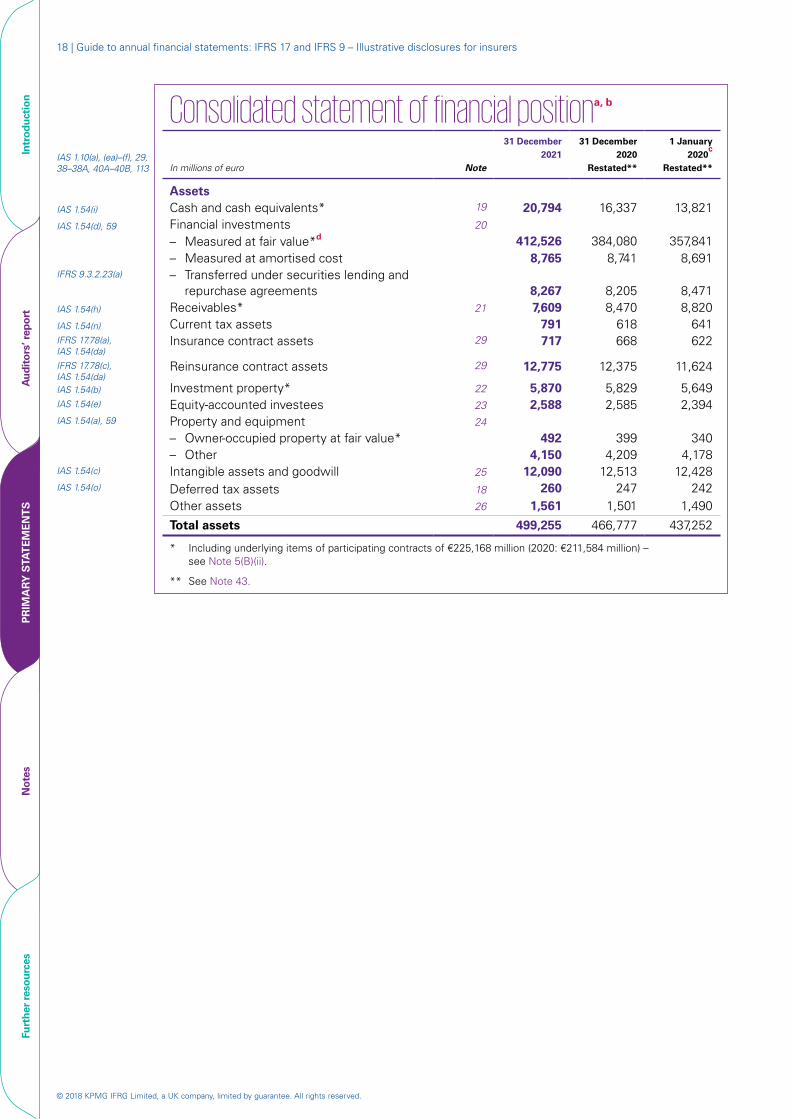
Consolidated statement of financial positiona, b IAS 1.10(a), (ea)–(f), 29, 38–38A, 40A–40B, 113 In millions of euro Note
31 December2021
31 December2020
Restated**
1 January2020
c
Restated**
AssetsIAS 1.54(i) Cash and cash equivalents* 19 20,794 16,337 13,821 IAS 1.54(d), 59 Financial investments 20
– Measured at fair value*d 412,526 384,080 357,841– Measured at amortised cost 8,765 8,741 8,691
IFRS 9.3.2.23(a) – Transferred under securities lending and repurchase agreements 8,267 8,205 8,471
IAS 1.54(h) Receivables* 21 7,609 8,470 8,820 IAS 1.54(n) Current tax assets 791 618 641 IFRS 17.78(a), IAS 1.54(da)
Insurance contract assets 29 717 668 622
IFRS 17.78(c), IAS 1.54(da)
Reinsurance contract assets 29 12,775 12,375 11,624
IAS 1.54(b) Investment property* 22 5,870 5,829 5,649 IAS 1.54(e) Equity-accounted investees 23 2,588 2,585 2,394 IAS 1.54(a), 59 Property and equipment 24
– Owner-occupied property at fair value* 492 399 340– Other 4,150 4,209 4,178
IAS 1.54(c) Intangible assets and goodwill 25 12,090 12,513 12,428 IAS 1.54(o) Deferred tax assets 18 260 247 242
Other assets 26 1,561 1,501 1,490
Total assets 499,255 466,777 437,252
* Including underlying items of participating contracts of €225,168 million (2020: €211,584 million) – see Note 5(B)(ii).
** See Note 43.
© 2018 KPMG IFRG Limited, a UK company, limited by guarantee. All rights reserved.
Illustrative disclosures – Primary statements | 19
Intr
oduc
tion
Aud
itor
s’ r
epor
tP
RIM
AR
Y S
TAT
EM
EN
TS
Not
esFu
rthe
r re
sour
ces
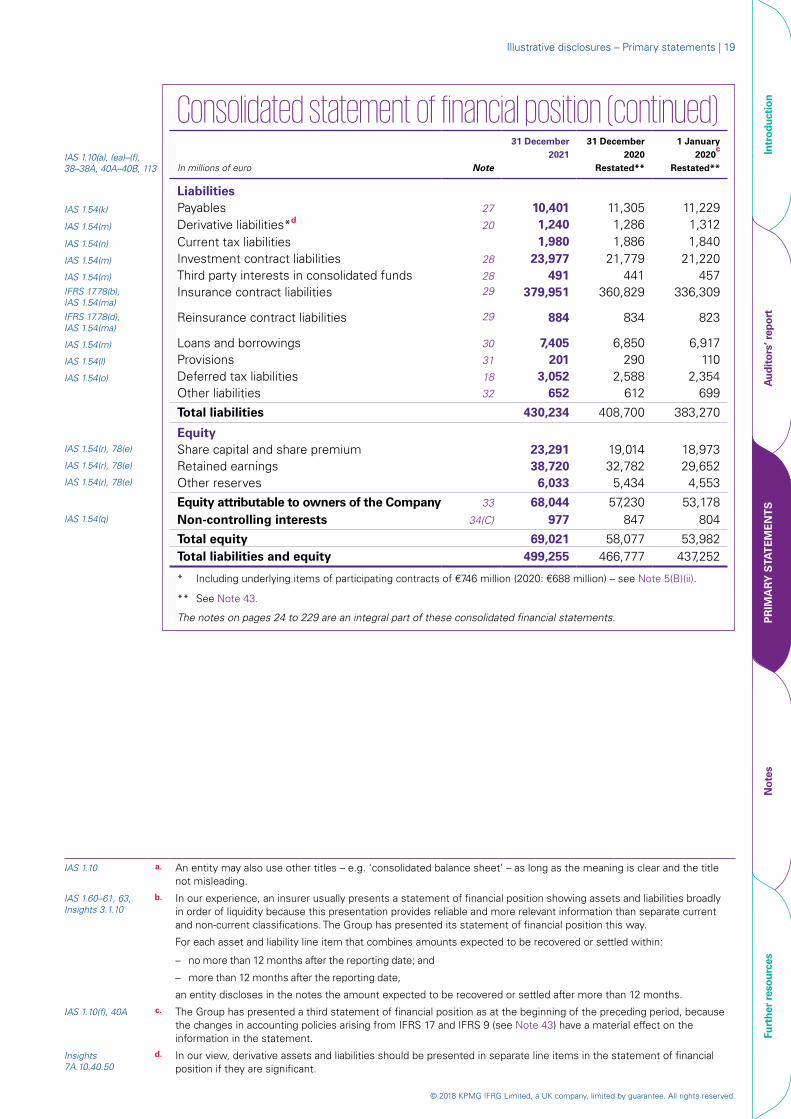
Consolidated statement of financial position (continued)IAS 1.10(a), (ea)–(f), 38–38A, 40A–40B, 113 In millions of euro Note
31 December2021
31 December2020
Restated**
1 January 2020
c
Restated**
LiabilitiesIAS 1.54(k) Payables 27 10,401 11,305 11,229 IAS 1.54(m) Derivative liabilities*d 20 1,240 1,286 1,312 IAS 1.54(n) Current tax liabilities 1,980 1,886 1,840 IAS 1.54(m) Investment contract liabilities 28 23,977 21,779 21,220 IAS 1.54(m) Third party interests in consolidated funds 28 491 441 457 IFRS 17.78(b), IAS 1.54(ma)
Insurance contract liabilities 29 379,951 360,829 336,309
IFRS 17.78(d), IAS 1.54(ma)
Reinsurance contract liabilities 29 884 834 823
IAS 1.54(m) Loans and borrowings 30 7,405 6,850 6,917IAS 1.54(l) Provisions 31 201 290 110 IAS 1.54(o) Deferred tax liabilities 18 3,052 2,588 2,354
Other liabilities 32 652 612 699
Total liabilities 430,234 408,700 383,270
EquityIAS 1.54(r), 78(e) Share capital and share premium 23,291 19,014 18,973 IAS 1.54(r), 78(e) Retained earnings 38,720 32,782 29,652 IAS 1.54(r), 78(e) Other reserves 6,033 5,434 4,553
Equity attributable to owners of the Company 33 68,044 57,230 53,178 IAS 1.54(q) Non-controlling interests 34(C) 977 847 804
Total equity 69,021 58,077 53,982 Total liabilities and equity 499,255 466,777 437,252
* Including underlying items of participating contracts of €746 million (2020: €688 million) – see Note 5(B)(ii).
** See Note 43.
The notes on pages 24 to 229 are an integral part of these consolidated financial statements.
IAS 1.10 a. An entity may also use other titles – e.g. ‘consolidated balance sheet’ – as long as the meaning is clear and the title not misleading.
IAS 1.60–61, 63, Insights 3.1.10
b. In our experience, an insurer usually presents a statement of financial position showing assets and liabilities broadly in order of liquidity because this presentation provides reliable and more relevant information than separate current and non-current classifications. The Group has presented its statement of financial position this way.
For each asset and liability line item that combines amounts expected to be recovered or settled within:
– no more than 12 months after the reporting date; and
– more than 12 months after the reporting date,
an entity discloses in the notes the amount expected to be recovered or settled after more than 12 months.
IAS 1.10(f), 40A c. The Group has presented a third statement of financial position as at the beginning of the preceding period, because the changes in accounting policies arising from IFRS 17 and IFRS 9 (see Note 43) have a material effect on the information in the statement.
Insights 7A.10.40.50
d. In our view, derivative assets and liabilities should be presented in separate line items in the statement of financial position if they are significant.
© 2018 KPMG IFRG Limited, a UK company, limited by guarantee. All rights reserved.
20 | Guide to annual financial statements: IFRS 17 and IFRS 9 – Illustrative disclosures for insurers
Intr
oduc
tion
Aud
itor
s’ r
epor
tP
RIM
AR
Y S
TAT
EM
EN
TS
Not
esFu
rthe
r re
sour
ces
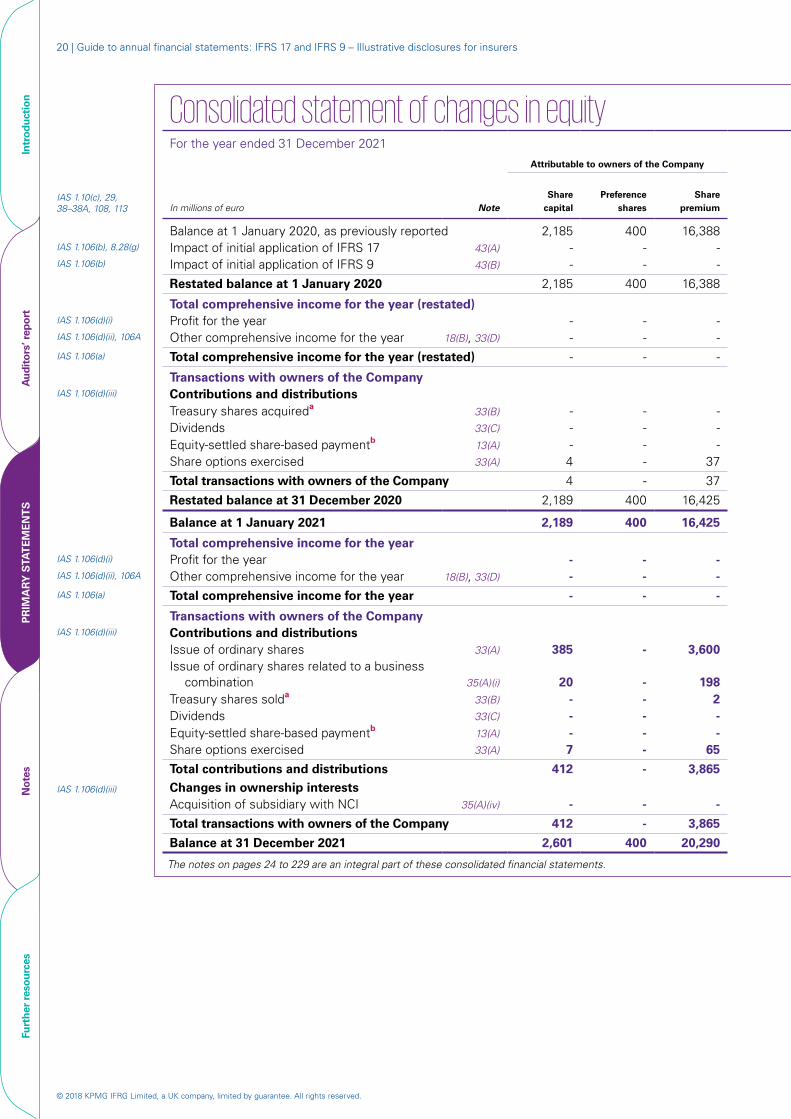
Consolidated statement of changes in
equityConsolidated statement of changes in equityFor the year ended 31 December 2021
Attributable to owners of the Company Attributable to owners of the Company
IAS 1.10(c), 29, 38–38A, 108, 113 In millions of euro Note
Share capital
Preference shares
Share premium
Translation reserve
Costs of hedging reserve
Fair value reserve
Insurance finance reserve
Treasury share reserve
Retained earnings Total NCI Total equity
Balance at 1 January 2020, as previously reported 2,185 400 16,388 2,514 - 825 - (274) 29,001 51,039 771 51,810 IAS 1.106(b), 8.28(g) Impact of initial application of IFRS 17 43(A) - - - - - - (870) 250 3,023 2,403 44 2,447IAS 1.106(b) Impact of initial application of IFRS 9 43(B) - - - - (9) 2,117 - - (2,372) (264) (11) (275)
Restated balance at 1 January 2020 2,185 400 16,388 2,514 (9) 2,942 (870) (24) 29,652 53,178 804 53,982
Total comprehensive income for the year (restated)IAS 1.106(d)(i) Profit for the year - - - - - - - - 4,069 4,069 53 4,122IAS 1.106(d)(ii), 106A Other comprehensive income for the year 18(B), 33(D) - - - 536 (6) 1,200 (779) - (6) 945 11 956 IAS 1.106(a) Total comprehensive income for the year (restated) - - - 536 (6) 1,200 (779) - 4,063 5,014 64 5,078
Transactions with owners of the CompanyIAS 1.106(d)(iii) Contributions and distributions
Treasury shares acquireda 33(B) - - - - - - - (70) - (70) - (70)Dividends 33(C) - - - - - - - - (958) (958) (21) (979)Equity-settled share-based paymentb 13(A) - - - - - - - - 25 25 - 25Share options exercised 33(A) 4 - 37 - - - - - - 41 - 41
Total transactions with owners of the Company 4 - 37 - - - (70) (933) (962) (21) (983)
Restated balance at 31 December 2020 2,189 400 16,425 3,050 (15) 4,142 (1,649) (94) 32,782 57,230 847 58,077
Balance at 1 January 2021 2,189 400 16,425 3,050 (15) 4,142 (1,649) (94) 32,782 57,230 847 58,077
Total comprehensive income for the yearIAS 1.106(d)(i) Profit for the year - - - - - - - - 7,014 7,014 81 7,095 IAS 1.106(d)(ii), 106A Other comprehensive income for the year 18(B), 33(D) - - - (365) (12) 1,799 (826) - 53 649 9 658 IAS 1.106(a) Total comprehensive income for the year - - - (365) (12) 1,799 (826) - 7,067 7,663 90 7,753
Transactions with owners of the CompanyIAS 1.106(d)(iii) Contributions and distributions
Issue of ordinary shares 33(A) 385 - 3,600 - - - - - - 3,985 - 3,985 Issue of ordinary shares related to a business
combination 35(A)(i) 20 - 198 - - - - - 12 230 - 230 Treasury shares solda 33(B) - - 2 - - - - 3 - 5 - 5 Dividends 33(C) - - - - - - - - (1,207) (1,207) (24) (1,231)Equity-settled share-based paymentb 13(A) - - - - - - - - 66 66 - 66 Share options exercised 33(A) 7 - 65 - - - - - - 72 - 72
Total contributions and distributions 412 - 3,865 - - - - 3 (1,129) 3,151 (24) 3,127
IAS 1.106(d)(iii) Changes in ownership interestsAcquisition of subsidiary with NCI 35(A)(iv) - - - - - - - - - - 64 64
Total transactions with owners of the Company 412 - 3,865 - - - - 3 (1,129) 3,151 40 3,191
Balance at 31 December 2021 2,601 400 20,290 2,685 (27) 5,941 (2,475) (91) 38,720 68,044 977 69,021
The notes on pages 24 to 229 are an integral part of these consolidated financial statements.
© 2018 KPMG IFRG Limited, a UK company, limited by guarantee. All rights reserved.
Illustrative disclosures – Primary statements | 21
Intr
oduc
tion
Aud
itor
s’ r
epor
tP
RIM
AR
Y S
TAT
EM
EN
TS
Not
esFu
rthe
r re
sour
ces
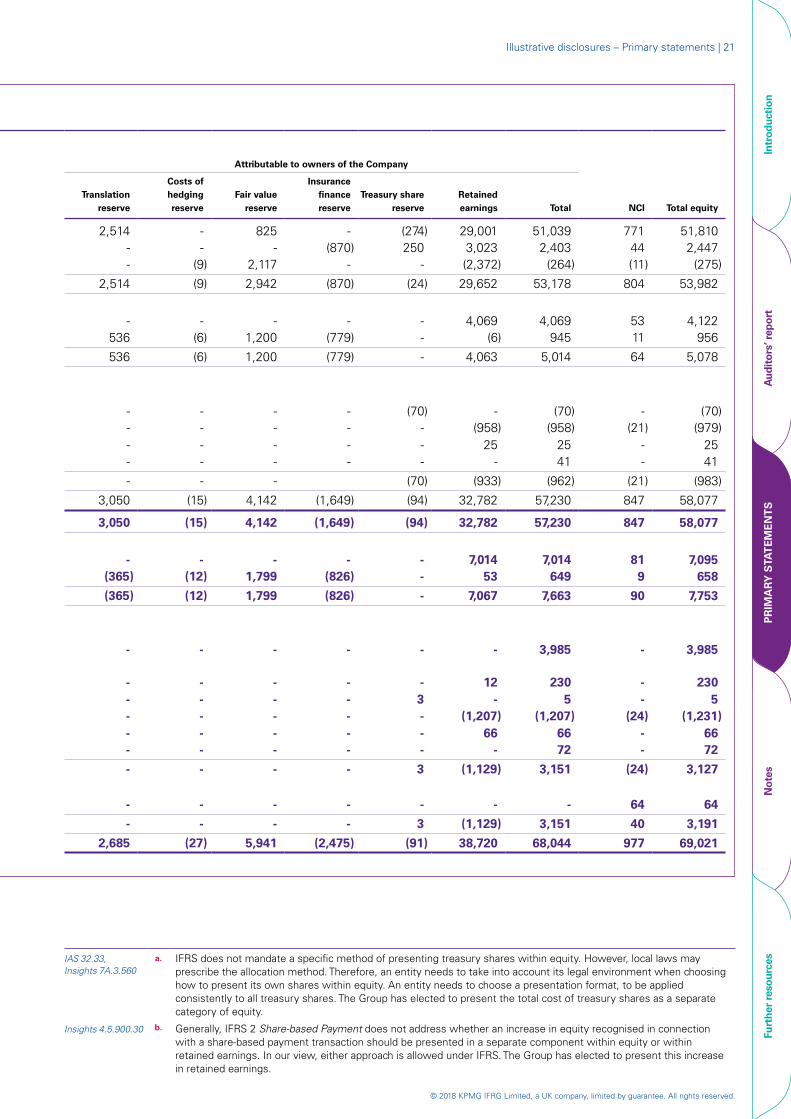
Consolidated statement of changes in equityFor the year ended 31 December 2021
Attributable to owners of the Company
Translation reserve
2,514 --
2,514
- 536
536
---
Costs of hedging reserve
--
(9)
(9)
-(6)
(6)
---
Attributable to
Fair value reserve
825 -
2,117
2,942
- 1,200
1,200
---
owners of the Company
Insurance finance reserve
- (870)
-
(870)
- (779)
(779)
---
Treasury share reserve
(274)250
-
(24)
- -
-
(70)--
Retained earnings
29,001 3,023(2,372)
29,652
4,069 (6)
4,063
-(958)
25
Total
51,039 2,403
(264)
53,178
4,069 945
5,014
(70)(958)
25
NCI
771 44(11)
804
53 11
64
-(21)
-
Total equity
51,810 2,447
(275)
53,982
4,122 956
5,078
(70)(979)
25-
-
3,050
3,050
- (365)
(365)
-
-
-
(15)
(15)
-(12)
(12)
-
-
-
4,142
4,142
- 1,799
1,799
-
-
(1,649)
(1,649)
- (826)
(826)
-
-
(70)
(94)
(94)
- -
-
-
-
(933)
32,782
32,782
7,014 53
7,067
-
41
(962)
57,230
57,230
7,014 649
7,663
3,985
-
(21)
847
847
81 9
90
-
41
(983)
58,077
58,077
7,095 658
7,753
3,985
- - - - - 12 230 - 230 - - - - 3 - 5 - 5 --
--
--
--
--
(1,207)66
(1,207) 66
(24) -
(1,231) 66
-
-
-
-
-
-
-
-
-
3
-
(1,129)
72
3,151
-
(24)
72
3,127
-
-
2,685
-
-
(27)
-
-
5,941
-
-
(2,475)
-
3
(91)
-
(1,129)
38,720
-
3,151
68,044
64
40
977
64
3,191
69,021
IAS 1.10(c), 29, 38–38A, 108, 113 In millions of euro Note
Share capital
Preference shares
Share premium
Balance at 1 January 2020, as previously reported 2,185 400 16,388 IAS 1.106(b), 8.28(g) Impact of initial application of IFRS 17 43(A) - - -IAS 1.106(b) Impact of initial application of IFRS 9 43(B) - - -
Restated balance at 1 January 2020 2,185 400 16,388
Total comprehensive income for the year (restated)IAS 1.106(d)(i) Profit for the year - - -IAS 1.106(d)(ii), 106A Other comprehensive income for the year 18(B), 33(D) - - -IAS 1.106(a) Total comprehensive income for the year (restated) - - -
Transactions with owners of the CompanyIAS 1.106(d)(iii) Contributions and distributions
Treasury shares acquireda 33(B) - - -Dividends 33(C) - - -Equity-settled share-based paymentb 13(A) - - -Share options exercised 33(A) 4 - 37
Total transactions with owners of the Company 4 - 37
Restated balance at 31 December 2020 2,189 400 16,425
Balance at 1 January 2021 2,189 400 16,425
Total comprehensive income for the yearIAS 1.106(d)(i) Profit for the year - - -IAS 1.106(d)(ii), 106A Other comprehensive income for the year 18(B), 33(D) - - -IAS 1.106(a) Total comprehensive income for the year - - -
Transactions with owners of the CompanyIAS 1.106(d)(iii) Contributions and distributions
Issue of ordinary shares 33(A) 385 - 3,600 Issue of ordinary shares related to a business
combination 35(A)(i) 20 - 198 Treasury shares solda 33(B) - - 2 Dividends 33(C) - - - Equity-settled share-based paymentb 13(A) - - - Share options exercised 33(A) 7 - 65
Total contributions and distributions 412 - 3,865
IAS 1.106(d)(iii) Changes in ownership interestsAcquisition of subsidiary with NCI 35(A)(iv) - - -
Total transactions with owners of the Company 412 - 3,865
Balance at 31 December 2021 2,601 400 20,290
The notes on pages 24 to 229 are an integral part of these consolidated financial statements.
IAS 32.33, Insights 7A.3.560
a. IFRS does not mandate a specific method of presenting treasury shares within equity. However, local laws may prescribe the allocation method. Therefore, an entity needs to take into account its legal environment when choosing how to present its own shares within equity. An entity needs to choose a presentation format, to be applied consistently to all treasury shares. The Group has elected to present the total cost of treasury shares as a separate category of equity.
Insights 4.5.900.30 b. Generally, IFRS 2 Share-based Payment does not address whether an increase in equity recognised in connection with a share-based payment transaction should be presented in a separate component within equity or within retained earnings. In our view, either approach is allowed under IFRS. The Group has elected to present this increase in retained earnings.
© 2018 KPMG IFRG Limited, a UK company, limited by guarantee. All rights reserved.
22 | Guide to annual financial statements: IFRS 17 and IFRS 9 – Illustrative disclosures for insurers
Intr
oduc
tion
Aud
itor
s’ r
epor
tP
RIM
AR
Y S
TAT
EM
EN
TS
Not
esFu
rthe
r re
sour
ces
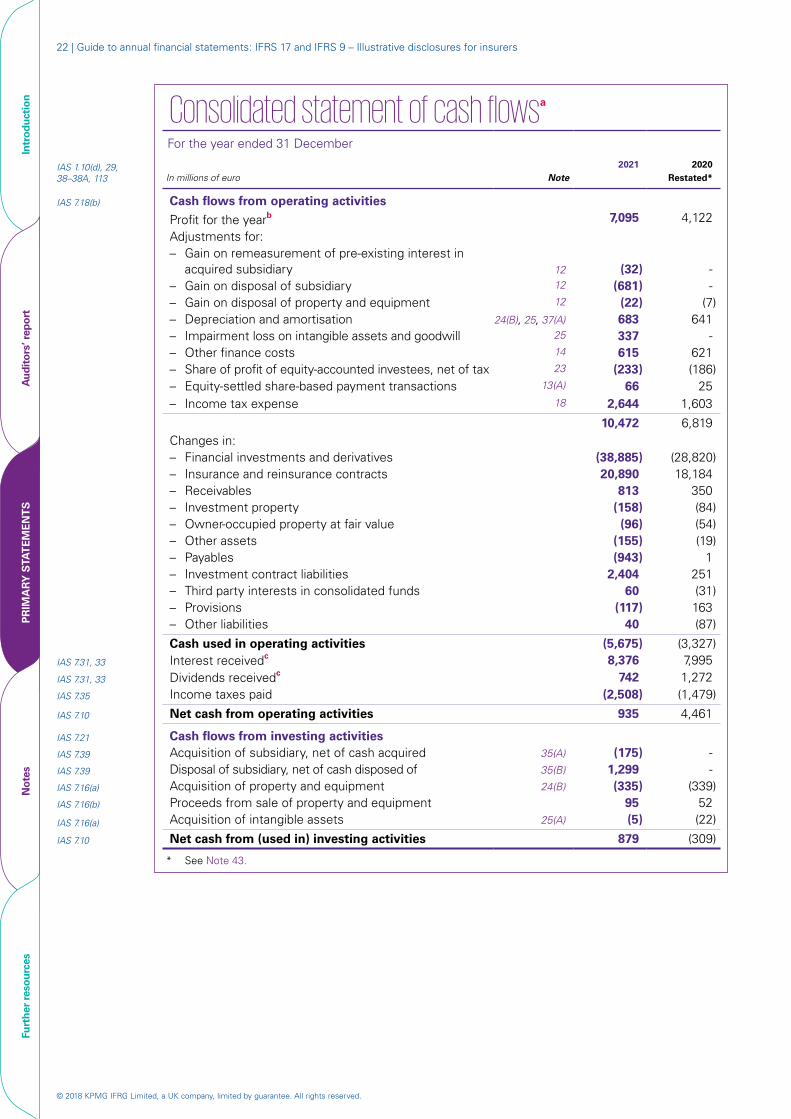
Consolidated statement of cash flowsa
IAS 1.10(d), 29, 38–38A, 113
For the year ended 31 December
In millions of euro Note2021 2020
Restated*
IAS 7.18(b) Cash flows from operating activities
Profit for the yearb 7,095 4,122 Adjustments for:– Gain on remeasurement of pre-existing interest in
acquired subsidiary 12 (32) - – Gain on disposal of subsidiary 12 (681) - – Gain on disposal of property and equipment 12 (22) (7)– Depreciation and amortisation 24(B), 25, 37(A) 683 641 – Impairment loss on intangible assets and goodwill 25 337 - – Other finance costs 14 615 621– Share of profit of equity-accounted investees, net of tax 23 (233) (186)
– Equity-settled share-based payment transactions 13(A) 66 25 – Income tax expense 18 2,644 1,603
10,472 6,819Changes in:– Financial investments and derivatives (38,885) (28,820)– Insurance and reinsurance contracts 20,890 18,184 – Receivables 813 350 – Investment property (158) (84)– Owner-occupied property at fair value (96) (54)– Other assets (155) (19)– Payables (943) 1 – Investment contract liabilities 2,404 251 – Third party interests in consolidated funds 60 (31)– Provisions (117) 163 – Other liabilities 40 (87)
Cash used in operating activities (5,675) (3,327)IAS 7.31, 33 Interest receivedc 8,376 7,995 IAS 7.31, 33 Dividends receivedc 742 1,272IAS 7.35 Income taxes paid (2,508) (1,479)
IAS 7.10 Net cash from operating activities 935 4,461
IAS 7.21 Cash flows from investing activitiesIAS 7.39 Acquisition of subsidiary, net of cash acquired 35(A) (175) - IAS 7.39 Disposal of subsidiary, net of cash disposed of 35(B) 1,299 - IAS 7.16(a) Acquisition of property and equipment 24(B) (335) (339)IAS 7.16(b) Proceeds from sale of property and equipment 95 52
IAS 7.16(a) Acquisition of intangible assets 25(A) (5) (22)
IAS 7.10 Net cash from (used in) investing activities 879 (309)
* See Note 43.
© 2018 KPMG IFRG Limited, a UK company, limited by guarantee. All rights reserved.
Illustrative disclosures – Primary statements | 23
Intr
oduc
tion
Aud
itor
s’ r
epor
tP
RIM
AR
Y S
TAT
EM
EN
TS
Not
esFu
rthe
r re
sour
ces
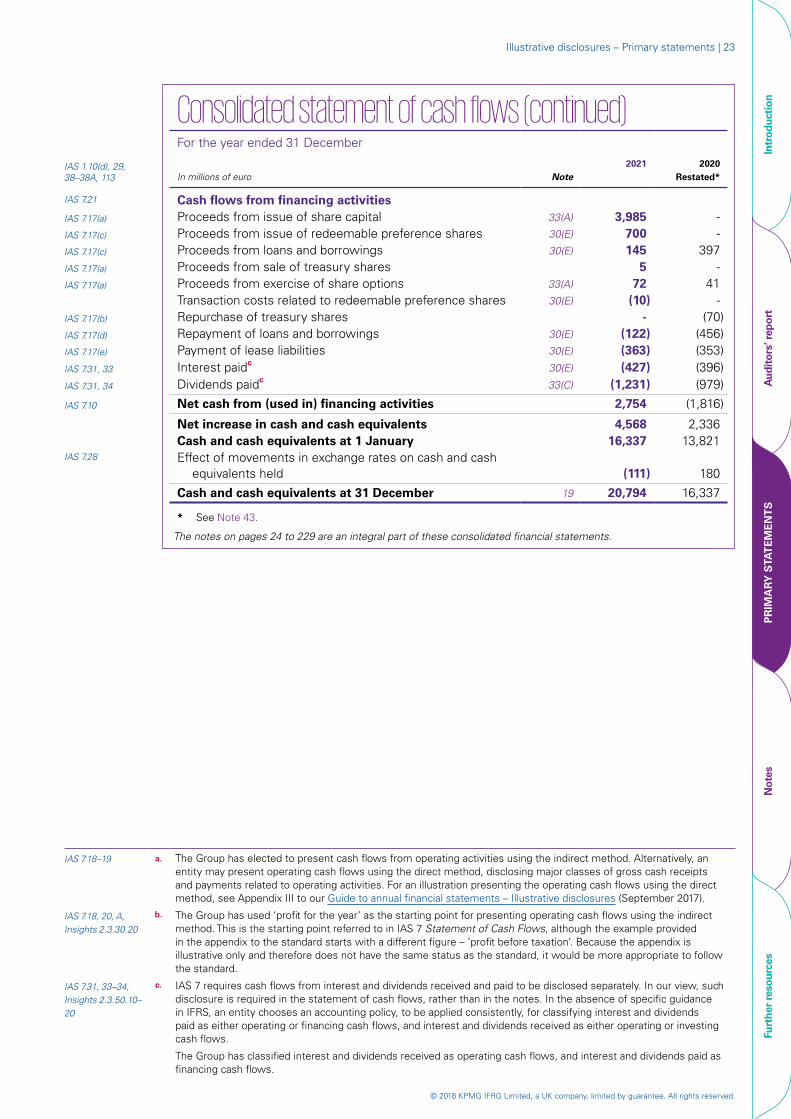
Consolidated statement of cash flows (continued)For the year ended 31 December
IAS 1.10(d), 29, 38–38A, 113 In millions of euro Note
2021 2020Restated*
IAS 7.21 Cash flows from financing activitiesIAS 7.17(a) Proceeds from issue of share capital 33(A) 3,985 - IAS 7.17(c) Proceeds from issue of redeemable preference shares 30(E) 700 - IAS 7.17(c) Proceeds from loans and borrowings 30(E) 145 397 IAS 7.17(a) Proceeds from sale of treasury shares 5 - IAS 7.17(a) Proceeds from exercise of share options 33(A) 72 41
Transaction costs related to redeemable preference shares 30(E) (10) - IAS 7.17(b) Repurchase of treasury shares - (70)IAS 7.17(d) Repayment of loans and borrowings 30(E) (122) (456)IAS 7.17(e) Payment of lease liabilities 30(E) (363) (353)IAS 7.31, 33 Interest paidc 30(E) (427) (396)IAS 7.31, 34 Dividends paidc 33(C) (1,231) (979)
IAS 7.10 Net cash from (used in) financing activities 2,754 (1,816)
Net increase in cash and cash equivalents 4,568 2,336 Cash and cash equivalents at 1 January 16,337 13,821
IAS 7.28 Effect of movements in exchange rates on cash and cash equivalents held (111) 180
Cash and cash equivalents at 31 December 19 20,794 16,337
* See Note 43.
The notes on pages 24 to 229 are an integral part of these consolidated financial statements.
IAS 7.18–19 a. The Group has elected to present cash flows from operating activities using the indirect method. Alternatively, an entity may present operating cash flows using the direct method, disclosing major classes of gross cash receipts and payments related to operating activities. For an illustration presenting the operating cash flows using the direct method, see Appendix III to our Guide to annual financial statements – Illustrative disclosures (September 2017).
IAS 7.18, 20, A, Insights 2.3.30.20
b. The Group has used ‘profit for the year’ as the starting point for presenting operating cash flows using the indirect method. This is the starting point referred to in IAS 7 Statement of Cash Flows, although the example provided in the appendix to the standard starts with a different figure – ‘profit before taxation’. Because the appendix is illustrative only and therefore does not have the same status as the standard, it would be more appropriate to follow the standard.
IAS 7.31, 33–34, Insights 2.3.50.10–20
c. IAS 7 requires cash flows from interest and dividends received and paid to be disclosed separately. In our view, such disclosure is required in the statement of cash flows, rather than in the notes. In the absence of specific guidance in IFRS, an entity chooses an accounting policy, to be applied consistently, for classifying interest and dividends paid as either operating or financing cash flows, and interest and dividends received as either operating or investing cash flows.
The Group has classified interest and dividends received as operating cash flows, and interest and dividends paid as financing cash flows.
© 2018 KPMG IFRG Limited, a UK company, limited by guarantee. All rights reserved.
24 | Guide to annual financial statements: IFRS 17 and IFRS 9 – Illustrative disclosures for insurers
Intr
oduc
tion
Aud
itor
s’ r
epor
tPr
imar
y st
atem
ents
NO
TE
SFu
rthe
r re
sour
ces
IAS 1.10(e) Notes to the consolidated financial statementsa 1. Reporting entity
IAS 1.51(a)–(b), 138(a)–(b)
[Name of the Company] (the Company) is domiciled in [Country X]. The Company’s registered office is at [address]. These consolidated financial statements comprise the Company and its subsidiaries (together referred to as ‘the Group’). The Group carries out life and non-life insurance business in Europe, Asia and the US. The Group also issues investment contracts and contracts that provide investors with interests in collective investment schemes managed by the Group in Europe and Asia.
2. Basis of accountingIAS 1.16, 112(a), 116, 10.17
These consolidated financial statements have been prepared in accordance with IFRS. They were authorised for issue by the Company’s board of directors on [date].
IAS 1.41 Details of the Group’s accounting policies, including changes during the year, are included in Notes 43 and 44. As explained in Note 43, the Group has adopted IFRS 17 Insurance Contracts and IFRS 9 Financial Instruments, including any consequential amendments to other standards, with a date of initial application of 1 January 2021. The requirements of IFRS 17 and IFRS 9 have brought significant changes to the accounting for insurance and reinsurance contracts and financial instruments. As a result, the Group has restated certain comparative amounts and presented a third statement of financial position as at 1 January 2020.
3. Functional and presentation currencyIAS 1.51(d)–(e) These consolidated financial statements are presented in euro, which is the Company’s functional
currency. All amounts have been rounded to the nearest million, unless otherwise indicated.
4. Use of judgements and estimatesb
In preparing these consolidated financial statements, management has made judgements, estimates and assumptions that affect the application of the Group’s accounting policies and the reported amounts of assets, liabilities, income and expenses. Actual results may differ from these estimates.
Estimates and underlying assumptions are reviewed on an ongoing basis. Revisions to estimates are recognised prospectively.
IAS 1.113–114 a. Notes are presented, to the extent practicable, in a systematic order and are cross-referred to/from items in the primary statements. In determining a systematic manner of presentation, an entity considers the effect on the understandability and comparability of its financial statements. The Group has applied its judgement in presenting related information together in a manner that it considers to be the most relevant to an understanding of its financial performance and financial position. The order presented is illustrative and entities need to tailor the organisation of the notes to fit their specific circumstances.
IAS 1.122, 125 b. The judgements, estimates and assumptions disclosed reflect the facts and circumstances of the Group. Entities need to tailor the disclosures to fit their specific circumstances.

© 2018 KPMG IFRG Limited, a UK company, limited by guarantee. All rights reserved.
Illustrative disclosures – Notes 25Basis of preparation
Intr
oduc
tion
Aud
itor
s’ r
epor
tPr
imar
y st
atem
ents
NO
TE
SFu
rthe
r re
sour
ces
Notes to the consolidated financial statements (continued)
4. Use of judgements and estimates (continued)A. Judgements
IAS 1.122 Information about judgements made in applying accounting policies that have the most significant effects on the amounts recognised in the consolidated financial statements is included in the following notes:
– Notes 5(E)(iv) and 44(G)(iii) – impairment of financial assets: assessing whether credit risk on the financial asset has increased significantly since initial recognition;
– Notes 20 and 44(G)(ii) – classification of financial assets: assessing the business model within which the assets are held and whether the contractual terms of the assets are solely payments of principal and interest on the principal amount outstanding;
– Notes 28, 29 and 44(D) – classification of insurance, reinsurance and investment contracts: assessing whether the contract transfers significant insurance risk and whether an insurance contract contains direct participation features;
– Notes 29 and 44(E)(ii) – level of aggregation of insurance and reinsurance contracts: identifying portfolios of contracts and determining groups of contracts that are onerous on initial recognition and those that have no significant possibility of becoming onerous subsequently;
– Notes 29(E) and 44(E)(v) – measurement of insurance and reinsurance contracts: determining the techniques for estimating risk adjustments for non-financial risk and the quantity of benefits provided under a contract;
– Notes 34(A), 36 and 44(A)(ii) – consolidation: determining whether the Group controls an investee;
– Note 35(A)(iii) – acquisition of subsidiary: identifying separately identifiable assets acquired and liabilities assumed; and
– Notes 43(A)(ii) and 44(E)(ix) – transition to IFRS 17: determining whether sufficient reasonable and supportable information is available to apply a full or modified retrospective approach.
B. Assumptions and estimation uncertaintiesIAS 1.125, 129–130 Information about assumptions and estimation uncertainties that have a significant risk of
resulting in a material adjustment to the carrying amounts of assets and liabilities within the year ending 31 December 2022 is included in the following notes:
– Notes 5(E)(iv) and 44(G)(iii) – impairment of financial assets: incorporation of forward-looking information into the measurement of the ECL;
– Notes 7(B)(ii), 20, 22 and 24(A) – determination of the fair value of financial instruments and investment and owner-occupied properties with significant unobservable inputs;
– Note 18 – recognition of deferred tax assets: availability of future taxable profit against which tax losses carried forward can be used; and
– Note 25(B) – impairment of non-financial assets and CGUs containing goodwill: key assumptions underlying recoverable amounts.
Information about assumptions made in measuring insurance and reinsurance contracts is included in Note 29(E). Changes in the following key assumptions may change the fulfilment cash flows materially during 2022. However, these changes adjust the CSM and do not affect the carrying amounts of the contracts, unless they arise from onerous contracts or do not relate to future services:
– life and participating contracts: assumptions about future cash flows relating to mortality, morbidity, policyholder behaviour, participation percentages and differences between crediting rates and discount rates;
– non-life contracts: assumptions about claims development; and
– all contracts: assumptions about discount rates, including any illiquidity premiums.
© 2018 KPMG IFRG Limited, a UK company, limited by guarantee. All rights reserved.
26 | Guide to annual financial statements: IFRS 17 and IFRS 9 – Illustrative disclosures for insurers
Notes to the consolidated financial statements (continued)
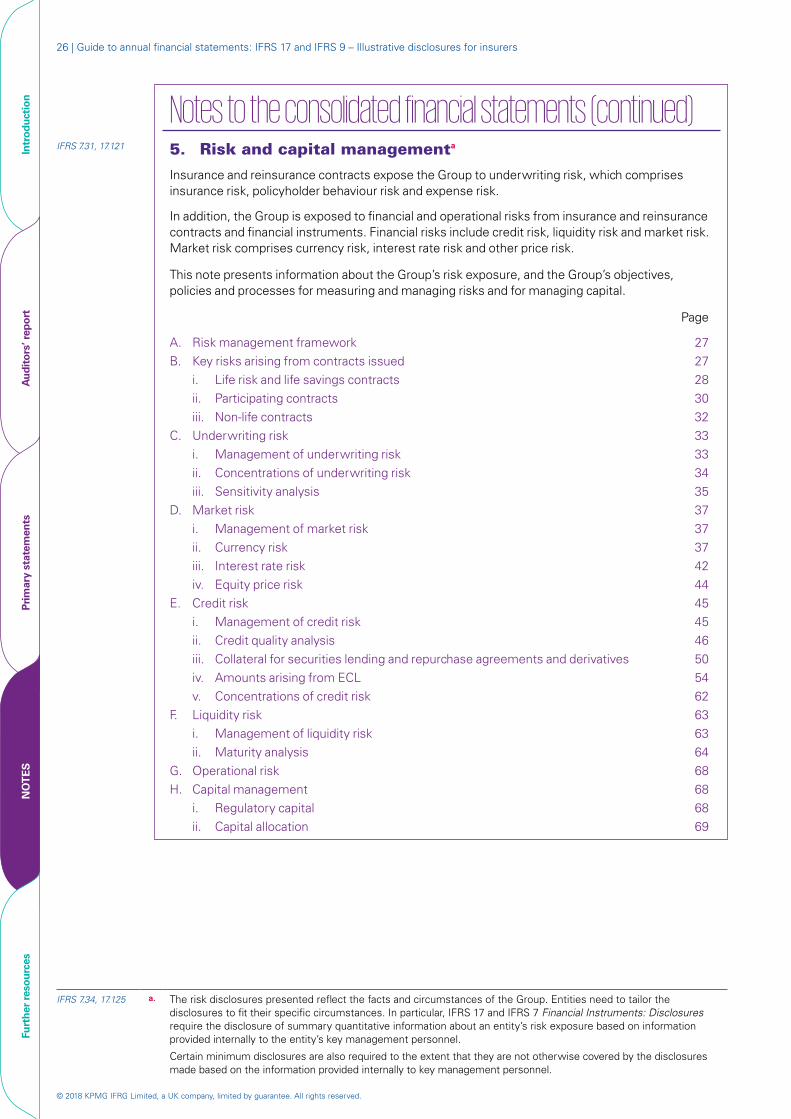
IFRS 7.31, 17.121 5. Risk and capital managementa
Insurance and reinsurance contracts expose the Group to underwriting risk, which comprises insurance risk, policyholder behaviour risk and expense risk.
In addition, the Group is exposed to financial and operational risks from insurance and reinsurance contracts and financial instruments. Financial risks include credit risk, liquidity risk and market risk. Market risk comprises currency risk, interest rate risk and other price risk.
This note presents information about the Group’s risk exposure, and the Group’s objectives, policies and processes for measuring and managing risks and for managing capital.
Page
A. Risk management framework 27B. Key risks arising from contracts issued 27
i. Life risk and life savings contracts 28ii. Participating contracts 30iii. Non-life contracts 32
C. Underwriting risk 33i. Management of underwriting risk 33ii. Concentrations of underwriting risk 34iii. Sensitivity analysis 35
D. Market risk 37i. Management of market risk 37ii. Currency risk 37iii. Interest rate risk 42iv. Equity price risk 44
E. Credit risk 45i. Management of credit risk 45ii. Credit quality analysis 46iii. Collateral for securities lending and repurchase agreements and derivatives 50iv. Amounts arising from ECL 54v. Concentrations of credit risk 62
F. Liquidity risk 63i. Management of liquidity risk 63ii. Maturity analysis 64
G. Operational risk 68H. Capital management 68
i. Regulatory capital 68ii. Capital allocation 69
IFRS 7.34, 17.125 a. The risk disclosures presented reflect the facts and circumstances of the Group. Entities need to tailor the disclosures to fit their specific circumstances. In particular, IFRS 17 and IFRS 7 Financial Instruments: Disclosures require the disclosure of summary quantitative information about an entity’s risk exposure based on information provided internally to the entity’s key management personnel.
Certain minimum disclosures are also required to the extent that they are not otherwise covered by the disclosures made based on the information provided internally to key management personnel.
Intr
oduc
tion
Aud
itor
s’ r
epor
tPr
imar
y st
atem
ents
NO
TE
SFu
rthe
r re
sour
ces

© 2018 KPMG IFRG Limited, a UK company, limited by guarantee. All rights reserved.
Illustrative disclosures – Notes 27Risk, capital and fair values
Notes to the consolidated financial statements (continued)5. Risk and capital management (continued)A. Risk management framework
IFRS 7.33(b), 17.124(b) The Company’s board of directors has overall responsibility for the establishment and oversight of the Group’s risk management framework. The Group risk committee is responsible for developing and monitoring the Group’s risk management policies, and reports regularly to the board of directors on its activities.
The Group’s risk management policies are established to identify and analyse the risks faced by the Group, set appropriate risk limits and controls, and monitor adherence to risk limits. Risk management policies are reviewed regularly to reflect changes in market conditions and the Group’s activities. The Group, through its training and management standards and procedures, aims to develop a disciplined and constructive control environment in which all employees understand their roles and obligations.
The Group audit committee oversees how management monitors compliance with the Group’s risk management policies and procedures, and reviews the adequacy of the risk management framework in relation to the risks faced by the Group. It is assisted in its oversight role by internal audit, which undertakes both regular and ad hoc reviews of risk management controls and procedures, the results of which are reported to the Group audit committee.
Risk is managed at local entity level where the business is transacted, based on the principles and policies established at Group level. An integrated approach to risk management involves common measurement of risk to allow for aggregation at Group level. Operating within this policy framework, the Group employs risk management programmes, including asset-liability matching (ALM) processes, hedging programmes (largely conducted through the use of derivatives) and insurance programmes (largely conducted through the use of reinsurance). Programmes are in place in each country in which the Group operates and are an integral part of the Group’s overall risk management framework.
B. Key risks arising from contracts issuedIFRS 7.33, 17.124 The Group issues insurance contracts, investment contracts and contracts that provide investors
with interests in collective investment schemes managed by the Group. The nature and extent of the underwriting and financial risks arising from these contracts are determined by the contract design. The risks are evaluated for risk management purposes in conjunction with the risks mitigated by related reinsurance contracts and the risks arising from financial assets held to fund the settlement of the liabilities. The extent to which profit or loss and equity in any period are sensitive to financial risks depends on the extent to which they are economically hedged or borne by contract holders and the extent of any mismatches inherent in the accounting policies adopted by the Group.
Intr
oduc
tion
Aud
itor
s’ r
epor
tPr
imar
y st
atem
ents
NO
TE
SFu
rthe
r re
sour
ces
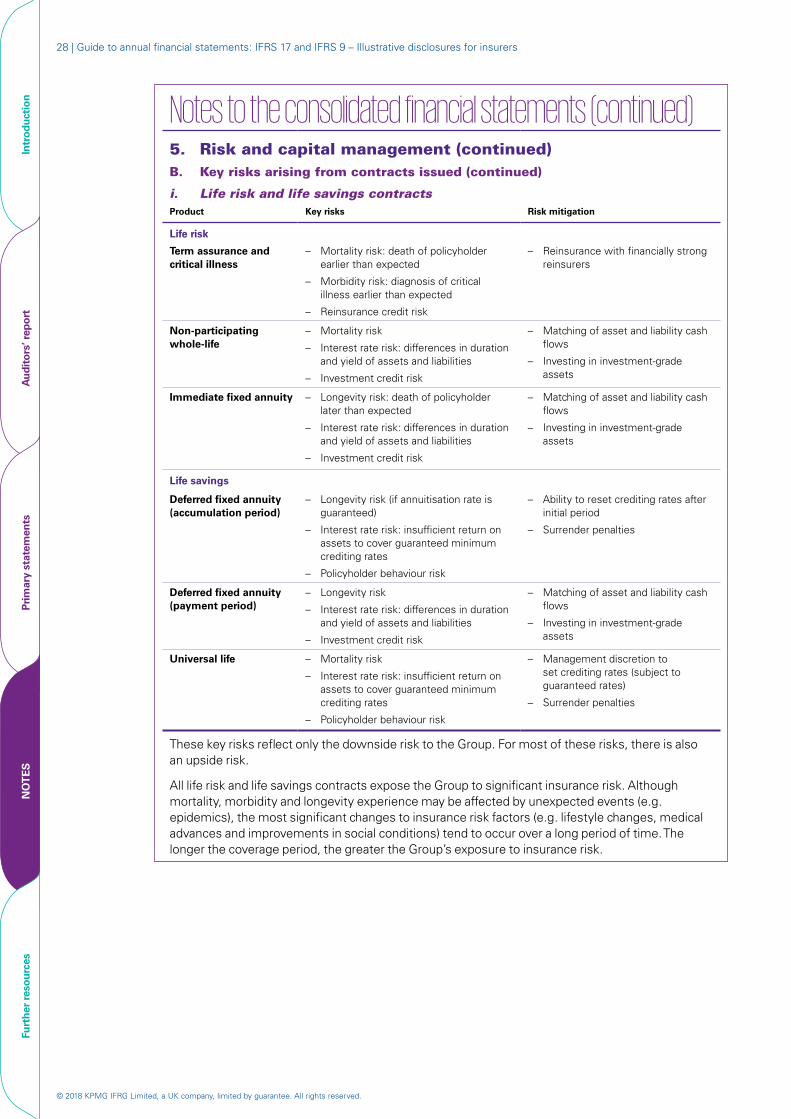
© 2018 KPMG IFRG Limited, a UK company, limited by guarantee. All rights reserved.
28 | Guide to annual financial statements: IFRS 17 and IFRS 9 – Illustrative disclosures for insurers
Notes to the consolidated financial statements (continued)
5. Risk and capital management (continued)B. Key risks arising from contracts issued (continued)
i. Life risk and life savings contractsProduct Key risks Risk mitigation
Life risk
Term assurance and critical illness
– Mortality risk: death of policyholder earlier than expected
– Morbidity risk: diagnosis of critical illness earlier than expected
– Reinsurance credit risk
– Reinsurance with financially strong reinsurers
Non-participating whole-life
– Mortality risk
– Interest rate risk: differences in duration and yield of assets and liabilities
– Investment credit risk
– Matching of asset and liability cash flows
– Investing in investment-grade assets
Immediate fixed annuity – Longevity risk: death of policyholder later than expected
– Interest rate risk: differences in duration and yield of assets and liabilities
– Investment credit risk
– Matching of asset and liability cash flows
– Investing in investment-grade assets
Life savings
Deferred fixed annuity (accumulation period)
– Longevity risk (if annuitisation rate is guaranteed)
– Interest rate risk: insufficient return on assets to cover guaranteed minimum crediting rates
– Policyholder behaviour risk
– Ability to reset crediting rates after initial period
– Surrender penalties
Deferred fixed annuity (payment period)
– Longevity risk
– Interest rate risk: differences in duration and yield of assets and liabilities
– Investment credit risk
– Matching of asset and liability cash flows
– Investing in investment-grade assets
Universal life – Mortality risk
– Interest rate risk: insufficient return on assets to cover guaranteed minimum crediting rates
– Policyholder behaviour risk
– Management discretion to set crediting rates (subject to guaranteed rates)
– Surrender penalties
These key risks reflect only the downside risk to the Group. For most of these risks, there is also an upside risk.
All life risk and life savings contracts expose the Group to significant insurance risk. Although mortality, morbidity and longevity experience may be affected by unexpected events (e.g. epidemics), the most significant changes to insurance risk factors (e.g. lifestyle changes, medical advances and improvements in social conditions) tend to occur over a long period of time. The longer the coverage period, the greater the Group’s exposure to insurance risk.
Intr
oduc
tion
Aud
itor
s’ r
epor
tPr
imar
y st
atem
ents
NO
TE
SFu
rthe
r re
sour
ces
© 2018 KPMG IFRG Limited, a UK company, limited by guarantee. All rights reserved.
Illustrative disclosures – Notes 29Risk, capital and fair values
Notes to the consolidated financial statements (continued)
5. Risk and capital management (continued)B. Key risks arising from contracts issued (continued)
i. Life risk and life savings contracts (continued)
Policyholder behaviour risk is a key risk for deferred fixed annuity and universal life contracts. The timing of surrenders and, for deferred fixed annuity contracts, the timing and frequency of withdrawals or annuitisation may impact the Group’s returns.
All life risk and life savings contracts expose the Group to interest rate risk. Interest rate risk arises from the extent to which the actual return on financial assets held to fund the settlement of liabilities differs from the expected return when the contracts were issued. This risk is most significant for immediate fixed annuity contracts, deferred fixed annuity contracts in the payment period and non-participating whole-life contracts because these contracts typically have long durations, it is not always possible to obtain matching assets with similar durations, and the Group does not have discretion to change the amounts of premiums or future payments to policyholders.
Term assurance and non-participating whole-life contracts provide policyholders with a fixed lump sum payable on death. Term assurance contracts provide coverage over a fixed term. Term assurance premiums may be level or increasing over time (for yearly renewable contracts). Non-participating whole-life contracts provide coverage over the lifetime of the policyholder and have a surrender value after an initial period. The premiums for non-participating whole-life contracts are level throughout the duration of the contracts.
Critical illness contracts are similar to term assurance but pay out a lump sum if the policyholder is diagnosed with an illness specified in the contract.
Immediate fixed annuity contracts provide policyholders with periodic payments over their lifetime or the lifetime of additional beneficiaries (if this is longer). The amount of each periodic payment may be fixed or changing over time based on a specified index.
Deferred fixed annuity contracts provide policyholders with a return of principal plus a fixed rate of interest during the accumulation period. The policyholder has the right to surrender the contract during the accumulation period and receive the current account value less any surrender charges. The fixed rate of interest is guaranteed for an initial period; after the initial period, the rate of interest credited to policyholders’ accounts is set at the Group’s discretion based on the prevailing market rates.
Universal life contracts provide policyholders with a lump sum benefit payable on death and access to an account value. The account value is credited with interest at a rate set at the Group’s discretion on a periodic basis, subject to a guaranteed minimum, and debited with a charge for the death benefit. A contract typically lapses when the account value is no longer sufficient to cover the cost of insurance. Some contracts issued by the Group provide ‘no lapse’ guarantees, where if certain minimum payments are made for a given period, then the contract will remain in force for the period covered by the guarantee even if the account value falls to zero. In 2021, the cost of ‘no lapse’ guarantees – i.e. the charges for the cost of insurance that have been waived under such guarantees – was €0.3 million (2020: €0.2 million).
The guaranteed interest rates on deferred fixed annuity and universal life contracts depend on the country and date of issue and range from 1.0 to 5.0% (2020: 1.0 to 5.0%). The weighted-average guaranteed interest rate is 2.1% (2020: 2.2%).
For discussions of the credit risk from reinsurance contract assets and investments, see (E).
Intr
oduc
tion
Aud
itor
s’ r
epor
tPr
imar
y st
atem
ents
NO
TE
SFu
rthe
r re
sour
ces
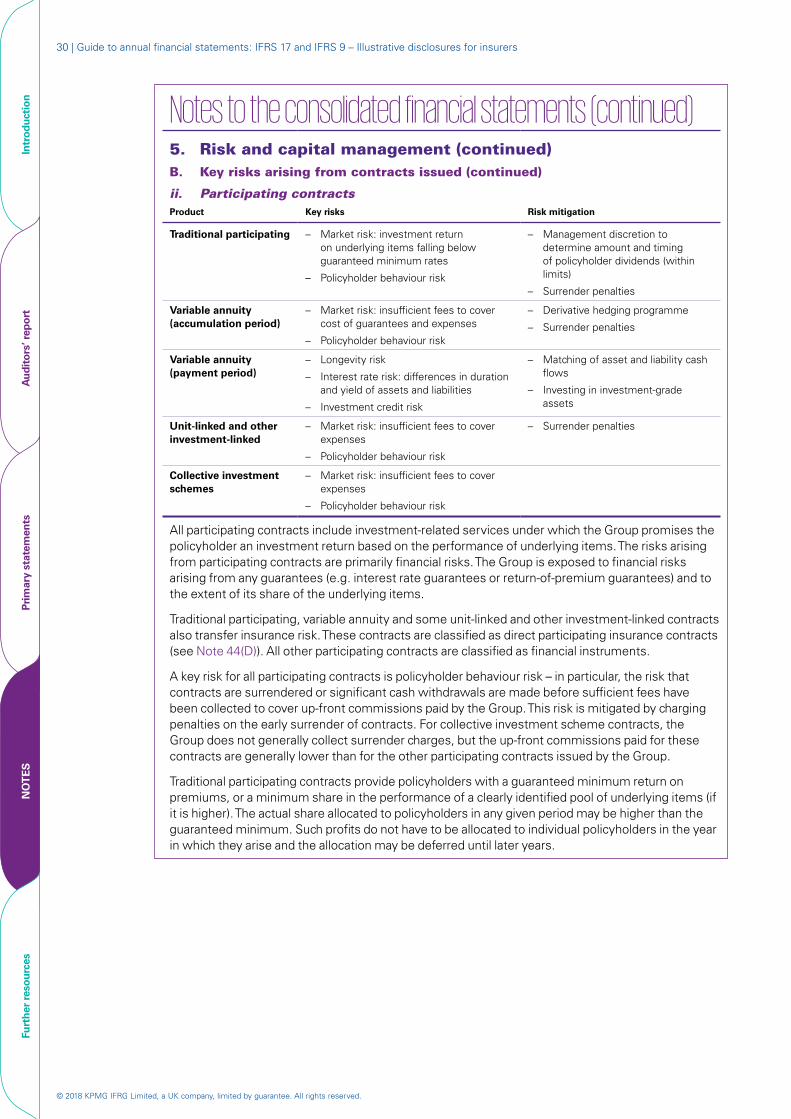
© 2018 KPMG IFRG Limited, a UK company, limited by guarantee. All rights reserved.
30 | Guide to annual financial statements: IFRS 17 and IFRS 9 – Illustrative disclosures for insurers
Notes to the consolidated financial statements (continued)
5. Risk and capital management (continued)B. Key risks arising from contracts issued (continued)
ii. Participating contractsProduct Key risks Risk mitigation
Traditional participating – Market risk: investment return on underlying items falling below guaranteed minimum rates
– Policyholder behaviour risk
– Management discretion to determine amount and timing of policyholder dividends (within limits)
– Surrender penalties
Variable annuity (accumulation period)
– Market risk: insufficient fees to cover cost of guarantees and expenses
– Policyholder behaviour risk
– Derivative hedging programme
– Surrender penalties
Variable annuity (payment period)
– Longevity risk
– Interest rate risk: differences in duration and yield of assets and liabilities
– Investment credit risk
– Matching of asset and liability cash flows
– Investing in investment-grade assets
Unit-linked and other investment-linked
– Market risk: insufficient fees to cover expenses
– Policyholder behaviour risk
– Surrender penalties
Collective investment schemes
– Market risk: insufficient fees to cover expenses
– Policyholder behaviour risk
All participating contracts include investment-related services under which the Group promises the policyholder an investment return based on the performance of underlying items. The risks arising from participating contracts are primarily financial risks. The Group is exposed to financial risks arising from any guarantees (e.g. interest rate guarantees or return-of-premium guarantees) and to the extent of its share of the underlying items.
Traditional participating, variable annuity and some unit-linked and other investment-linked contracts also transfer insurance risk. These contracts are classified as direct participating insurance contracts (see Note 44(D)). All other participating contracts are classified as financial instruments.
A key risk for all participating contracts is policyholder behaviour risk – in particular, the risk that contracts are surrendered or significant cash withdrawals are made before sufficient fees have been collected to cover up-front commissions paid by the Group. This risk is mitigated by charging penalties on the early surrender of contracts. For collective investment scheme contracts, the Group does not generally collect surrender charges, but the up-front commissions paid for these contracts are generally lower than for the other participating contracts issued by the Group.
Traditional participating contracts provide policyholders with a guaranteed minimum return on premiums, or a minimum share in the performance of a clearly identified pool of underlying items (if it is higher). The actual share allocated to policyholders in any given period may be higher than the guaranteed minimum. Such profits do not have to be allocated to individual policyholders in the year in which they arise and the allocation may be deferred until later years.
Intr
oduc
tion
Aud
itor
s’ r
epor
tPr
imar
y st
atem
ents
NO
TE
SFu
rthe
r re
sour
ces
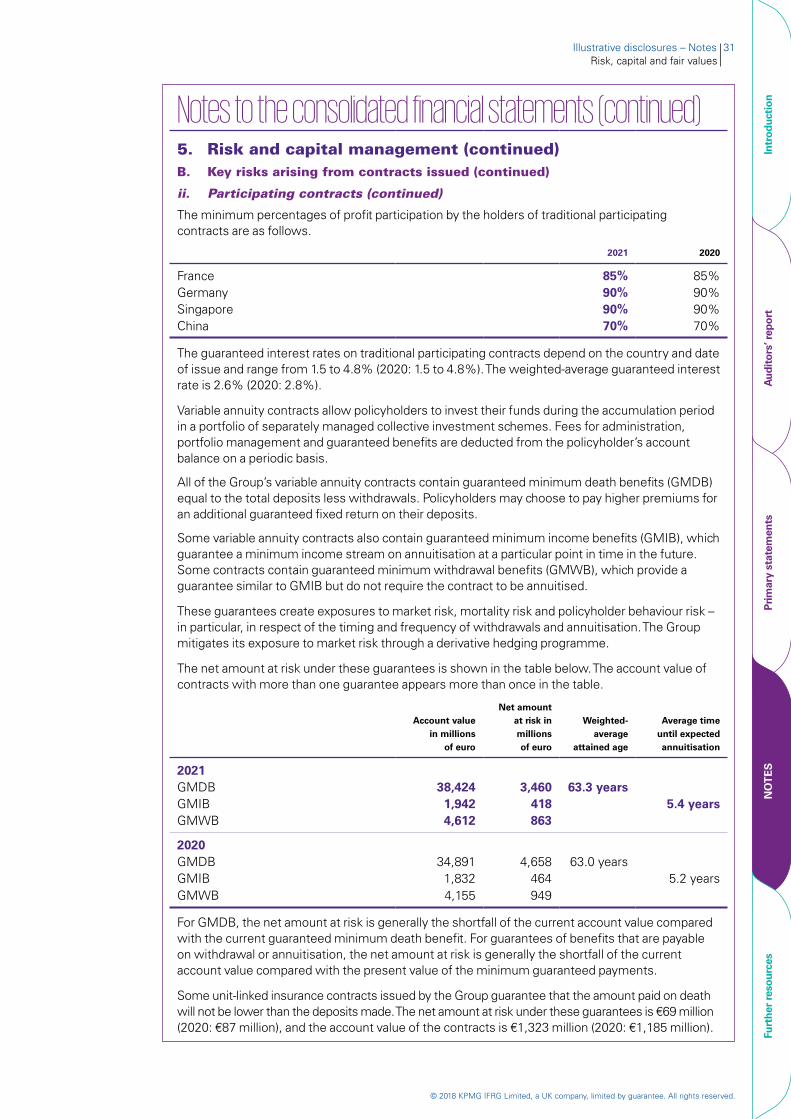
© 2018 KPMG IFRG Limited, a UK company, limited by guarantee. All rights reserved.
Illustrative disclosures – Notes 31Risk, capital and fair values
Notes to the consolidated financial statements (continued)5. Risk and capital management (continued)B. Key risks arising from contracts issued (continued)
ii. Participating contracts (continued)
The minimum percentages of profit participation by the holders of traditional participating contracts are as follows.
2021 2020
France 85% 85%Germany 90% 90%Singapore 90% 90%China 70% 70%
The guaranteed interest rates on traditional participating contracts depend on the country and date of issue and range from 1.5 to 4.8% (2020: 1.5 to 4.8%). The weighted-average guaranteed interest rate is 2.6% (2020: 2.8%).
Variable annuity contracts allow policyholders to invest their funds during the accumulation period in a portfolio of separately managed collective investment schemes. Fees for administration, portfolio management and guaranteed benefits are deducted from the policyholder’s account balance on a periodic basis.
All of the Group’s variable annuity contracts contain guaranteed minimum death benefits (GMDB) equal to the total deposits less withdrawals. Policyholders may choose to pay higher premiums for an additional guaranteed fixed return on their deposits.
Some variable annuity contracts also contain guaranteed minimum income benefits (GMIB), which guarantee a minimum income stream on annuitisation at a particular point in time in the future. Some contracts contain guaranteed minimum withdrawal benefits (GMWB), which provide a guarantee similar to GMIB but do not require the contract to be annuitised.
These guarantees create exposures to market risk, mortality risk and policyholder behaviour risk – in particular, in respect of the timing and frequency of withdrawals and annuitisation. The Group mitigates its exposure to market risk through a derivative hedging programme.
The net amount at risk under these guarantees is shown in the table below. The account value of contracts with more than one guarantee appears more than once in the table.
Account value in millions
of euro
Net amount at risk in millions of euro
Weighted-average
attained age
Average time until expected annuitisation
2021GMDB 38,424 3,460 63.3 yearsGMIB 1,942 418 5.4 yearsGMWB 4,612 863
2020GMDB 34,891 4,658 63.0 yearsGMIB 1,832 464 5.2 yearsGMWB 4,155 949
For GMDB, the net amount at risk is generally the shortfall of the current account value compared with the current guaranteed minimum death benefit. For guarantees of benefits that are payable on withdrawal or annuitisation, the net amount at risk is generally the shortfall of the current account value compared with the present value of the minimum guaranteed payments.
Some unit-linked insurance contracts issued by the Group guarantee that the amount paid on death will not be lower than the deposits made. The net amount at risk under these guarantees is €69 million (2020: €87 million), and the account value of the contracts is €1,323 million (2020: €1,185 million).
Intr
oduc
tion
Aud
itor
s’ r
epor
tPr
imar
y st
atem
ents
NO
TE
SFu
rthe
r re
sour
ces
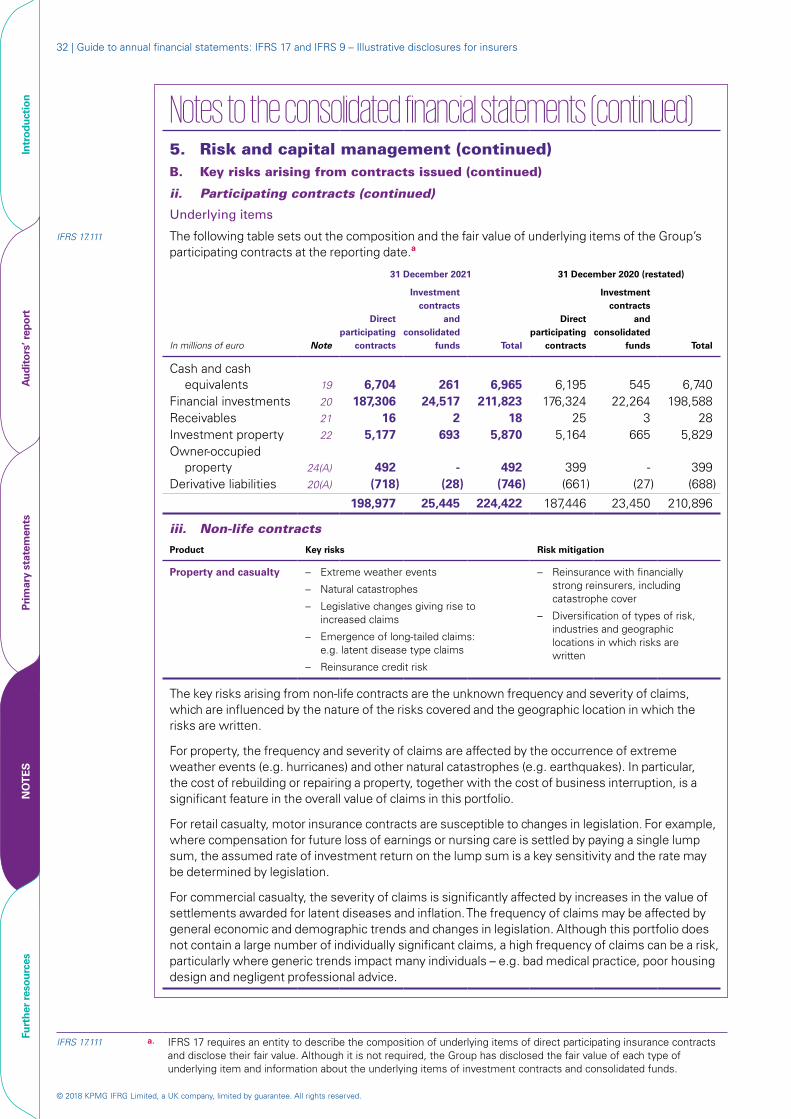
© 2018 KPMG IFRG Limited, a UK company, limited by guarantee. All rights reserved.
32 | Guide to annual financial statements: IFRS 17 and IFRS 9 – Illustrative disclosures for insurers
Notes to the consolidated financial statements (continued)5. Risk and capital management (continued)B. Key risks arising from contracts issued (continued)
ii. Participating contracts (continued)
Underlying items
IFRS 17.111 The following table sets out the composition and the fair value of underlying items of the Group’s participating contracts at the reporting date.a
31 December 2021 31 December 2020 (restated)
In millions of euro Note
Direct participating
contracts
Investment contracts
and consolidated
funds Total
Direct participating
contracts
Investment contracts
and consolidated
funds Total
Cash and cash equivalents 19 6,704 261 6,965 6,195 545 6,740
Financial investments 20 187,306 24,517 211,823 176,324 22,264 198,588Receivables 21 16 2 18 25 3 28Investment property 22 5,177 693 5,870 5,164 665 5,829Owner-occupied
property 24(A) 492 - 492 399 - 399Derivative liabilities 20(A) (718) (28) (746) (661) (27) (688)
198,977 25,445 224,422 187,446 23,450 210,896
iii. Non-life contracts
Product Key risks Risk mitigation
Property and casualty – Extreme weather events
– Natural catastrophes
– Legislative changes giving rise to increased claims
– Emergence of long-tailed claims: e.g. latent disease type claims
– Reinsurance credit risk
– Reinsurance with financially strong reinsurers, including catastrophe cover
– Diversification of types of risk, industries and geographic locations in which risks are written
The key risks arising from non-life contracts are the unknown frequency and severity of claims, which are influenced by the nature of the risks covered and the geographic location in which the risks are written.
For property, the frequency and severity of claims are affected by the occurrence of extreme weather events (e.g. hurricanes) and other natural catastrophes (e.g. earthquakes). In particular, the cost of rebuilding or repairing a property, together with the cost of business interruption, is a significant feature in the overall value of claims in this portfolio.
For retail casualty, motor insurance contracts are susceptible to changes in legislation. For example, where compensation for future loss of earnings or nursing care is settled by paying a single lump sum, the assumed rate of investment return on the lump sum is a key sensitivity and the rate may be determined by legislation.
For commercial casualty, the severity of claims is significantly affected by increases in the value of settlements awarded for latent diseases and inflation. The frequency of claims may be affected by general economic and demographic trends and changes in legislation. Although this portfolio does not contain a large number of individually significant claims, a high frequency of claims can be a risk, particularly where generic trends impact many individuals – e.g. bad medical practice, poor housing design and negligent professional advice.
IFRS 17.111 a. IFRS 17 requires an entity to describe the composition of underlying items of direct participating insurance contracts and disclose their fair value. Although it is not required, the Group has disclosed the fair value of each type of underlying item and information about the underlying items of investment contracts and consolidated funds.
Intr
oduc
tion
Aud
itor
s’ r
epor
tPr
imar
y st
atem
ents
NO
TE
SFu
rthe
r re
sour
ces
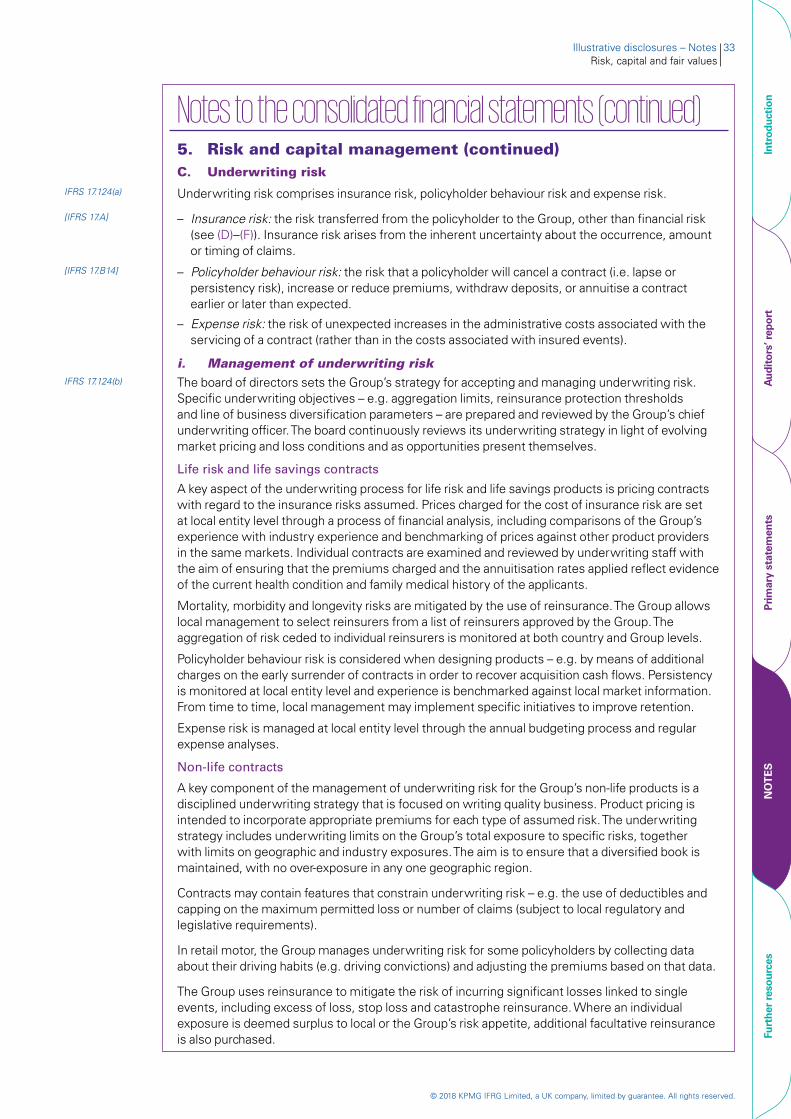
© 2018 KPMG IFRG Limited, a UK company, limited by guarantee. All rights reserved.
Illustrative disclosures – Notes 33Risk, capital and fair values
Notes to the consolidated financial statements (continued)5. Risk and capital management (continued)C. Underwriting risk
IFRS 17.124(a) Underwriting risk comprises insurance risk, policyholder behaviour risk and expense risk.
[IFRS 17.A] – Insurance risk: the risk transferred from the policyholder to the Group, other than financial risk (see (D)–(F)). Insurance risk arises from the inherent uncertainty about the occurrence, amount or timing of claims.
[IFRS 17.B14] – Policyholder behaviour risk: the risk that a policyholder will cancel a contract (i.e. lapse or persistency risk), increase or reduce premiums, withdraw deposits, or annuitise a contract earlier or later than expected.
– Expense risk: the risk of unexpected increases in the administrative costs associated with the servicing of a contract (rather than in the costs associated with insured events).
i. Management of underwriting riskIFRS 17.124(b) The board of directors sets the Group’s strategy for accepting and managing underwriting risk.
Specific underwriting objectives – e.g. aggregation limits, reinsurance protection thresholds and line of business diversification parameters – are prepared and reviewed by the Group’s chief underwriting officer. The board continuously reviews its underwriting strategy in light of evolving market pricing and loss conditions and as opportunities present themselves.
Life risk and life savings contracts
A key aspect of the underwriting process for life risk and life savings products is pricing contracts with regard to the insurance risks assumed. Prices charged for the cost of insurance risk are set at local entity level through a process of financial analysis, including comparisons of the Group’s experience with industry experience and benchmarking of prices against other product providers in the same markets. Individual contracts are examined and reviewed by underwriting staff with the aim of ensuring that the premiums charged and the annuitisation rates applied reflect evidence of the current health condition and family medical history of the applicants.
Mortality, morbidity and longevity risks are mitigated by the use of reinsurance. The Group allows local management to select reinsurers from a list of reinsurers approved by the Group. The aggregation of risk ceded to individual reinsurers is monitored at both country and Group levels.
Policyholder behaviour risk is considered when designing products – e.g. by means of additional charges on the early surrender of contracts in order to recover acquisition cash flows. Persistency is monitored at local entity level and experience is benchmarked against local market information. From time to time, local management may implement specific initiatives to improve retention.
Expense risk is managed at local entity level through the annual budgeting process and regular expense analyses.
Non-life contracts
A key component of the management of underwriting risk for the Group’s non-life products is a disciplined underwriting strategy that is focused on writing quality business. Product pricing is intended to incorporate appropriate premiums for each type of assumed risk. The underwriting strategy includes underwriting limits on the Group’s total exposure to specific risks, together with limits on geographic and industry exposures. The aim is to ensure that a diversified book is maintained, with no over-exposure in any one geographic region.
Contracts may contain features that constrain underwriting risk – e.g. the use of deductibles and capping on the maximum permitted loss or number of claims (subject to local regulatory and legislative requirements).
In retail motor, the Group manages underwriting risk for some policyholders by collecting data about their driving habits (e.g. driving convictions) and adjusting the premiums based on that data.
The Group uses reinsurance to mitigate the risk of incurring significant losses linked to single events, including excess of loss, stop loss and catastrophe reinsurance. Where an individual exposure is deemed surplus to local or the Group’s risk appetite, additional facultative reinsurance is also purchased.
Intr
oduc
tion
Aud
itor
s’ r
epor
tPr
imar
y st
atem
ents
NO
TE
SFu
rthe
r re
sour
ces
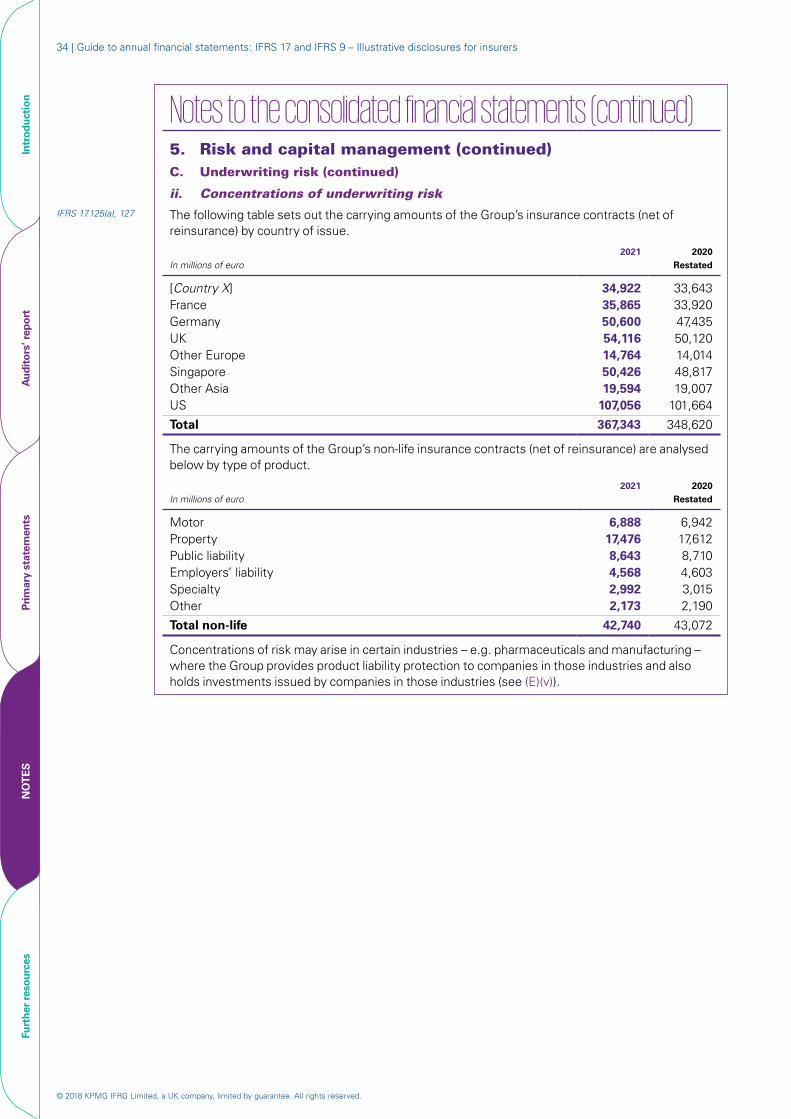
© 2018 KPMG IFRG Limited, a UK company, limited by guarantee. All rights reserved.
34 | Guide to annual financial statements: IFRS 17 and IFRS 9 – Illustrative disclosures for insurers
Notes to the consolidated financial statements (continued)5. Risk and capital management (continued)C. Underwriting risk (continued)
ii. Concentrations of underwriting riskIFRS 17.125(a), 127 The following table sets out the carrying amounts of the Group’s insurance contracts (net of
reinsurance) by country of issue.
In millions of euro2021 2020
Restated
[Country X] 34,922 33,643France 35,865 33,920Germany 50,600 47,435 UK 54,116 50,120 Other Europe 14,764 14,014 Singapore 50,426 48,817 Other Asia 19,594 19,007 US 107,056 101,664
Total 367,343 348,620
The carrying amounts of the Group’s non-life insurance contracts (net of reinsurance) are analysed below by type of product.
In millions of euro2021 2020
Restated
Motor 6,888 6,942Property 17,476 17,612Public liability 8,643 8,710Employers’ liability 4,568 4,603Specialty 2,992 3,015Other 2,173 2,190
Total non-life 42,740 43,072
Concentrations of risk may arise in certain industries – e.g. pharmaceuticals and manufacturing – where the Group provides product liability protection to companies in those industries and also holds investments issued by companies in those industries (see (E)(v)).
Intr
oduc
tion
Aud
itor
s’ r
epor
tPr
imar
y st
atem
ents
NO
TE
SFu
rthe
r re
sour
ces
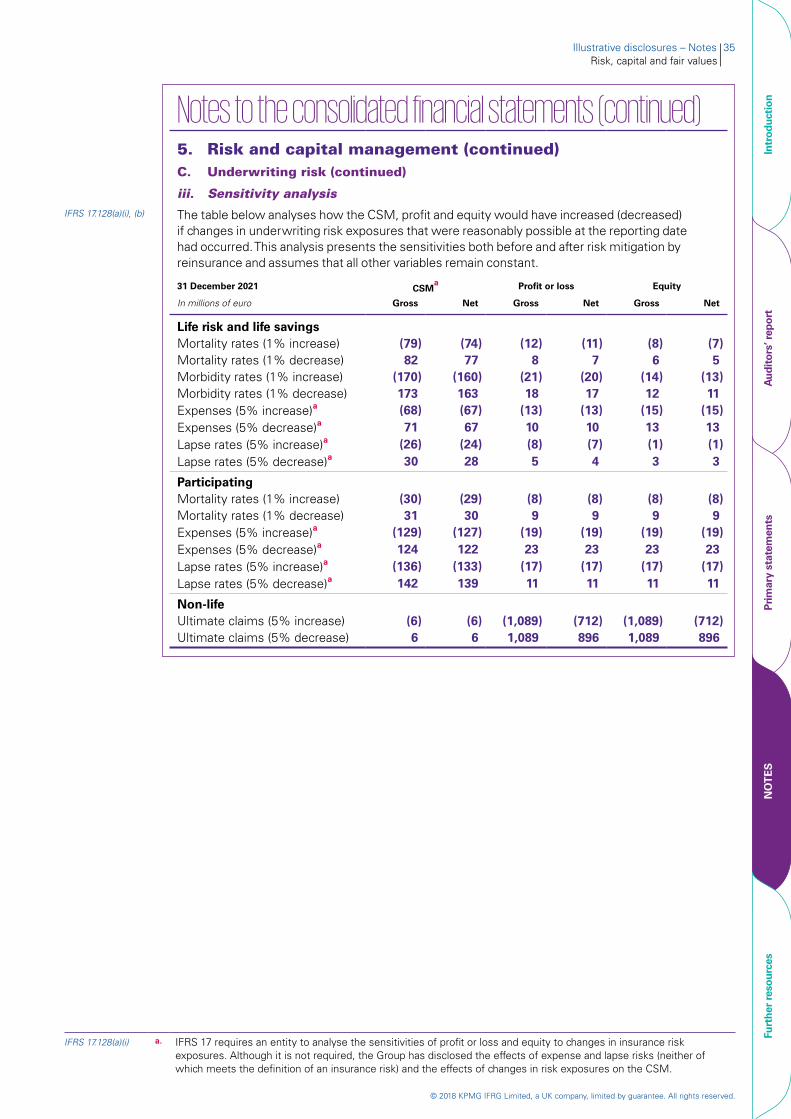
© 2018 KPMG IFRG Limited, a UK company, limited by guarantee. All rights reserved.
Illustrative disclosures – Notes 35Risk, capital and fair values
Notes to the consolidated financial statements (continued)
5. Risk and capital management (continued)C. Underwriting risk (continued)
iii. Sensitivity analysisIFRS 17.128(a)(i), (b) The table below analyses how the CSM, profit and equity would have increased (decreased)
if changes in underwriting risk exposures that were reasonably possible at the reporting date had occurred. This analysis presents the sensitivities both before and after risk mitigation by reinsurance and assumes that all other variables remain constant.
31 December 2021 CSMa Profit or loss Equity
In millions of euro Gross Net Gross Net Gross Net
Life risk and life savingsMortality rates (1% increase) (79) (74) (12) (11) (8) (7)Mortality rates (1% decrease) 82 77 8 7 6 5Morbidity rates (1% increase) (170) (160) (21) (20) (14) (13)Morbidity rates (1% decrease) 173 163 18 17 12 11Expenses (5% increase)a (68) (67) (13) (13) (15) (15)Expenses (5% decrease)a 71 67 10 10 13 13Lapse rates (5% increase)a (26) (24) (8) (7) (1) (1)Lapse rates (5% decrease)a 30 28 5 4 3 3
ParticipatingMortality rates (1% increase) (30) (29) (8) (8) (8) (8)Mortality rates (1% decrease) 31 30 9 9 9 9Expenses (5% increase)a (129) (127) (19) (19) (19) (19)Expenses (5% decrease)a 124 122 23 23 23 23Lapse rates (5% increase)a (136) (133) (17) (17) (17) (17)Lapse rates (5% decrease)a 142 139 11 11 11 11
Non-lifeUltimate claims (5% increase) (6) (6) (1,089) (712) (1,089) (712)Ultimate claims (5% decrease) 6 6 1,089 896 1,089 896
IFRS 17.128(a)(i) a. IFRS 17 requires an entity to analyse the sensitivities of profit or loss and equity to changes in insurance risk exposures. Although it is not required, the Group has disclosed the effects of expense and lapse risks (neither of which meets the definition of an insurance risk) and the effects of changes in risk exposures on the CSM.
Intr
oduc
tion
Aud
itor
s’ r
epor
tPr
imar
y st
atem
ents
NO
TE
SFu
rthe
r re
sour
ces
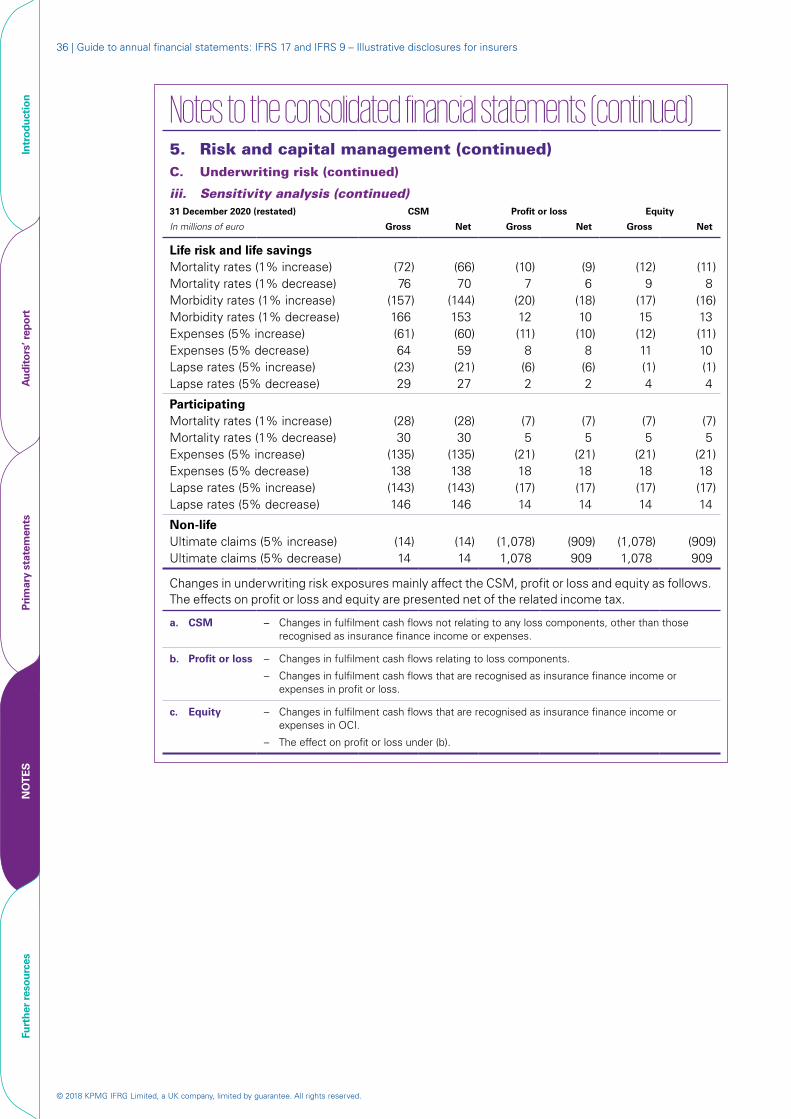
© 2018 KPMG IFRG Limited, a UK company, limited by guarantee. All rights reserved.
36 | Guide to annual financial statements: IFRS 17 and IFRS 9 – Illustrative disclosures for insurers
Notes to the consolidated financial statements (continued)
5. Risk and capital management (continued)C. Underwriting risk (continued)
iii. Sensitivity analysis (continued)31 December 2020 (restated) CSM Profit or loss Equity
In millions of euro Gross Net Gross Net Gross Net
Life risk and life savingsMortality rates (1% increase) (72) (66) (10) (9) (12) (11)Mortality rates (1% decrease) 76 70 7 6 9 8Morbidity rates (1% increase) (157) (144) (20) (18) (17) (16)Morbidity rates (1% decrease) 166 153 12 10 15 13Expenses (5% increase) (61) (60) (11) (10) (12) (11)Expenses (5% decrease) 64 59 8 8 11 10Lapse rates (5% increase) (23) (21) (6) (6) (1) (1)Lapse rates (5% decrease) 29 27 2 2 4 4
ParticipatingMortality rates (1% increase) (28) (28) (7) (7) (7) (7)Mortality rates (1% decrease) 30 30 5 5 5 5 Expenses (5% increase) (135) (135) (21) (21) (21) (21)Expenses (5% decrease) 138 138 18 18 18 18 Lapse rates (5% increase) (143) (143) (17) (17) (17) (17)Lapse rates (5% decrease) 146 146 14 14 14 14
Non-lifeUltimate claims (5% increase) (14) (14) (1,078) (909) (1,078) (909)Ultimate claims (5% decrease) 14 14 1,078 909 1,078 909
Changes in underwriting risk exposures mainly affect the CSM, profit or loss and equity as follows. The effects on profit or loss and equity are presented net of the related income tax.
a. CSM – Changes in fulfilment cash flows not relating to any loss components, other than those recognised as insurance finance income or expenses.
b. Profit or loss – Changes in fulfilment cash flows relating to loss components.
– Changes in fulfilment cash flows that are recognised as insurance finance income or expenses in profit or loss.
c. Equity – Changes in fulfilment cash flows that are recognised as insurance finance income or expenses in OCI.
– The effect on profit or loss under (b).
Intr
oduc
tion
Aud
itor
s’ r
epor
tPr
imar
y st
atem
ents
NO
TE
SFu
rthe
r re
sour
ces
© 2018 KPMG IFRG Limited, a UK company, limited by guarantee. All rights reserved.
Illustrative disclosures – Notes 37Risk, capital and fair values
Notes to the consolidated financial statements (continued)5. Risk and capital management (continued)D. Market risk
IFRS 7.33(a), 17.124(a), [IFRS 7.A]
Market risk is the risk that changes in market prices – e.g. foreign exchange rates, interest rates and equity prices – will affect the fulfilment cash flows of insurance and reinsurance contracts as well as the fair value or future cash flows of financial instruments. The objective of market risk management is to control market risk exposures within acceptable parameters while optimising the return on risk.
Market risk principally arises on the Group’s equity investments, interest-bearing financial assets and financial liabilities, and financial assets and financial liabilities denominated in foreign currencies, although these exposures are largely offset by similar exposures arising from insurance and reinsurance contracts. The nature of the Group’s insurance and reinsurance contracts and financial instruments means that it is exposed to market risk on net assets representing shareholders’ equity. Interest rate risk and equity price risk also arise from interest rate and equity guarantees in the Group’s insurance and investment contracts to the extent that they are not economically hedged or borne by contract holders.
i. Management of market riskIFRS 7.33(b), 17.124(b) The board of directors sets the Group’s strategy for managing market risk and delegates
responsibility for overseeing the implementation of this strategy and the ALM framework to the Group’s asset and liability committee (ALCO). The ALM framework seeks to match the cash flows arising from the Group’s financial investments with the cash flows arising from its insurance and investment contracts while achieving the optimum long-term investment return on its financial investments representing shareholders’ equity for an acceptable level of risk. ALCO seeks to achieve this by setting limits both for each type of risk in aggregate across the Group and for individual portfolios. On a day-to-day basis, responsibility for monitoring market risk exposures rests with local management.
As part of its ALM framework, the Group uses derivatives to manage its exposures to market risk. All such transactions are carried out within the guidelines set by ALCO.
In the participating segment, changes in the fair value of underlying items due to changes in market variables are largely reflected in the value of the related insurance and investment contracts. The Group is exposed to market risk only to the extent of the changes in its share of the fair value of the underlying items, represented by the CSM.
ii. Currency risk
Exposure to currency risk
IFRS 7.33(a), 17.124(a), [IFRS 7.A]
The Group is exposed to currency risk to the extent that the currencies in which insurance and reinsurance contracts and financial instruments are denominated differ from the functional currencies of Group entities. Primarily, these transactions are denominated in euro, sterling and US dollars, and are entered into by Group entities with functional currencies of sterling, euro and Singapore dollars (SGD) respectively.
Generally, borrowings are denominated in currencies that match the cash flows generated by the underlying operations of the Group. To the extent that they are not matched, the Group uses cross-currency swaps to hedge the currency risk arising from borrowings denominated in foreign currencies.
IFRS 7.33(b), 17.124(b) Foreign currency transaction risk arising from insurance and reinsurance contracts is managed by holding cash and investing in assets denominated in currencies that match the related liabilities, to the extent that it is deemed by local management to be both practical and appropriate. The Group’s policy is to ensure that its net exposure is kept to an acceptable level by buying or selling foreign currencies at spot rates when necessary to address short-term imbalances.
Intr
oduc
tion
Aud
itor
s’ r
epor
tPr
imar
y st
atem
ents
NO
TE
SFu
rthe
r re
sour
ces
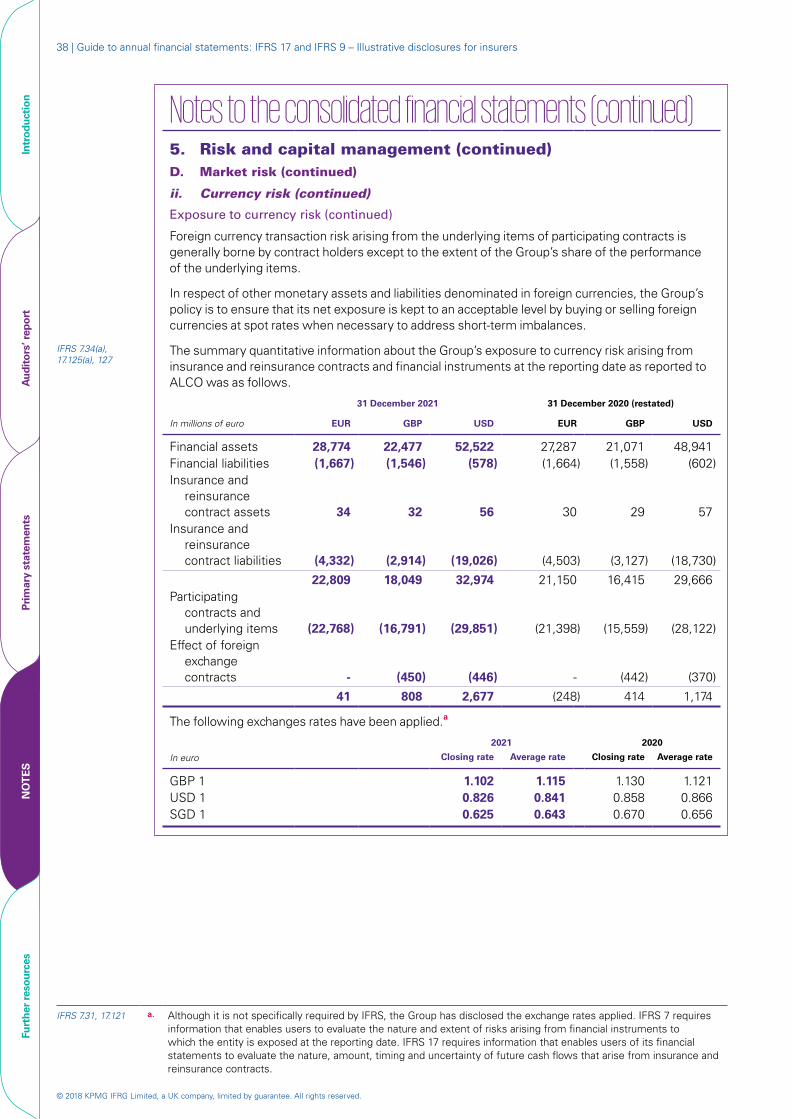
© 2018 KPMG IFRG Limited, a UK company, limited by guarantee. All rights reserved.
38 | Guide to annual financial statements: IFRS 17 and IFRS 9 – Illustrative disclosures for insurers
Notes to the consolidated financial statements (continued)5. Risk and capital management (continued)D. Market risk (continued)
ii. Currency risk (continued)
Exposure to currency risk (continued)
Foreign currency transaction risk arising from the underlying items of participating contracts is generally borne by contract holders except to the extent of the Group’s share of the performance of the underlying items.
In respect of other monetary assets and liabilities denominated in foreign currencies, the Group’s policy is to ensure that its net exposure is kept to an acceptable level by buying or selling foreign currencies at spot rates when necessary to address short-term imbalances.
IFRS 7.34(a), 17.125(a), 127
The summary quantitative information about the Group’s exposure to currency risk arising from insurance and reinsurance contracts and financial instruments at the reporting date as reported to ALCO was as follows.
31 December 2021 31 December 2020 (restated)
In millions of euro EUR GBP USD EUR GBP USD
Financial assets 28,774 22,477 52,522 27,287 21,071 48,941Financial liabilities (1,667) (1,546) (578) (1,664) (1,558) (602)Insurance and
reinsurance contract assets 34 32 56 30 29 57
Insurance and reinsurance contract liabilities (4,332) (2,914) (19,026) (4,503) (3,127) (18,730)
22,809 18,049 32,974 21,150 16,415 29,666Participating
contracts and underlying items (22,768) (16,791) (29,851) (21,398) (15,559) (28,122)
Effect of foreign exchange contracts - (450) (446) - (442) (370)
41 808 2,677 (248) 414 1,174
The following exchanges rates have been applied.a
2021 2020
In euro Closing rate Average rate Closing rate Average rate
GBP 1 1.102 1.115 1.130 1.121USD 1 0.826 0.841 0.858 0.866SGD 1 0.625 0.643 0.670 0.656
IFRS 7.31, 17.121 a. Although it is not specifically required by IFRS, the Group has disclosed the exchange rates applied. IFRS 7 requires information that enables users to evaluate the nature and extent of risks arising from financial instruments to which the entity is exposed at the reporting date. IFRS 17 requires information that enables users of its financial statements to evaluate the nature, amount, timing and uncertainty of future cash flows that arise from insurance and reinsurance contracts.
Intr
oduc
tion
Aud
itor
s’ r
epor
tPr
imar
y st
atem
ents
NO
TE
SFu
rthe
r re
sour
ces
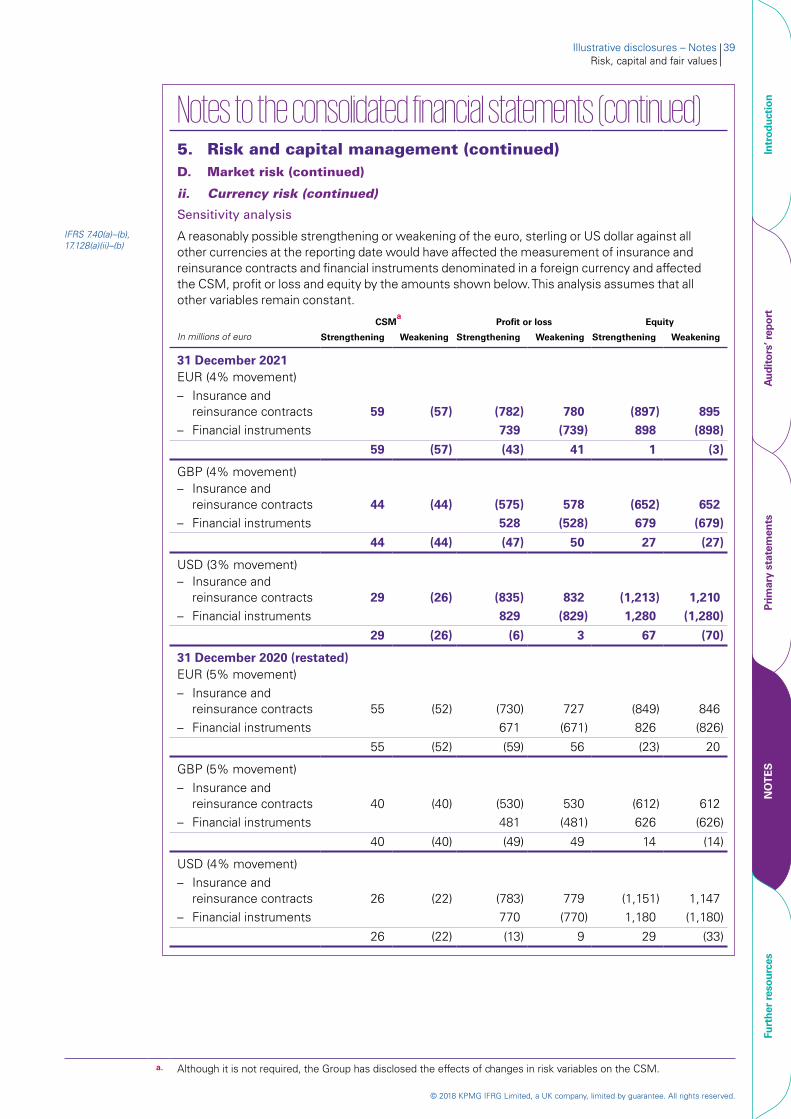
© 2018 KPMG IFRG Limited, a UK company, limited by guarantee. All rights reserved.
Illustrative disclosures – Notes 39Risk, capital and fair values
Notes to the consolidated financial statements (continued)5. Risk and capital management (continued)D. Market risk (continued)
ii. Currency risk (continued)
Sensitivity analysis
IFRS 7.40(a)–(b), 17.128(a)(ii)–(b)
A reasonably possible strengthening or weakening of the euro, sterling or US dollar against all other currencies at the reporting date would have affected the measurement of insurance and reinsurance contracts and financial instruments denominated in a foreign currency and affected the CSM, profit or loss and equity by the amounts shown below. This analysis assumes that all other variables remain constant.
CSMa
Profit or loss Equity
In millions of euro Strengthening Weakening Strengthening Weakening Strengthening Weakening
31 December 2021EUR (4% movement)– Insurance and
reinsurance contracts 59 (57) (782) 780 (897) 895– Financial instruments 739 (739) 898 (898)
59 (57) (43) 41 1 (3)
GBP (4% movement)– Insurance and
reinsurance contracts 44 (44) (575) 578 (652) 652 – Financial instruments 528 (528) 679 (679)
44 (44) (47) 50 27 (27)
USD (3% movement)– Insurance and
reinsurance contracts 29 (26) (835) 832 (1,213) 1,210 – Financial instruments 829 (829) 1,280 (1,280)
29 (26) (6) 3 67 (70)
31 December 2020 (restated)EUR (5% movement)– Insurance and
reinsurance contracts 55 (52) (730) 727 (849) 846 – Financial instruments 671 (671) 826 (826)
55 (52) (59) 56 (23) 20
GBP (5% movement)– Insurance and
reinsurance contracts 40 (40) (530) 530 (612) 612 – Financial instruments 481 (481) 626 (626)
40 (40) (49) 49 14 (14)
USD (4% movement)– Insurance and
reinsurance contracts 26 (22) (783) 779 (1,151) 1,147 – Financial instruments 770 (770) 1,180 (1,180)
26 (22) (13) 9 29 (33)
a. Although it is not required, the Group has disclosed the effects of changes in risk variables on the CSM.
Intr
oduc
tion
Aud
itor
s’ r
epor
tPr
imar
y st
atem
ents
NO
TE
SFu
rthe
r re
sour
ces

© 2018 KPMG IFRG Limited, a UK company, limited by guarantee. All rights reserved.
40 | Guide to annual financial statements: IFRS 17 and IFRS 9 – Illustrative disclosures for insurers
Notes to the consolidated financial statements (continued)5. Risk and capital management (continued)D. Market risk (continued)
ii. Currency risk (continued)
Sensitivity analysis (continued)
Changes in foreign exchange rates mainly affect the CSM, profit or loss and equity as follows. The effects on profit or loss and equity are presented net of the related income tax.
a. CSM – Changes in the carrying amount of the CSM as a result of translation into the functional currency at the closing rate.
– Changes in the Group’s share of the fair value of underlying items of direct participating contracts not relating to loss components.
b. Profit or loss – Foreign currency gains and losses on insurance and reinsurance contracts that are recognised in profit or loss, including those arising from the translation of the carrying amount of the CSM under (a).
– Changes in the Group’s share of the fair value of underlying items of direct participating contracts relating to loss components.
– Foreign currency gains and losses on financial instruments that are recognised in profit or loss.
c. Equity – Foreign currency gains and losses recognised in OCI (see Note 44(B)(i)).
– The effect on profit or loss under (b).
Net investment hedges
IFRS 7.22A A foreign currency exposure arises from a net investment in subsidiaries that have a different functional currency from that of the Company. The risk arises from the fluctuation in spot exchange rates between the functional currency of the subsidiaries and the Company’s functional currency, which causes the amount of the net investment to vary. This risk may have a significant impact on the Group’s consolidated financial statements. The Group’s policy is to hedge these exposures only when not doing so would be expected to have a significant impact on the regulatory capital ratios of the Group and its insurance subsidiaries.
The hedged risk in the net investment hedges is the risk of a weakening of sterling against the euro that will result in a reduction in the carrying amount of the Group’s net investments in subsidiaries in the UK.
IFRS 7.22B To hedge its currency risk, the Group designates the spot elements of certain foreign exchange forward contracts as hedging instruments and applies a hedge ratio of 1:1. The forward elements are excluded from designation as hedging instruments. To assess hedge effectiveness, the Group determines the economic relationship between the hedging instrument and the hedged item by comparing changes in the fair value of the derivative with changes in the fair value of a hypothetical derivative.
IFRS 7.22B(c), 23D Because the Group expects to hold the net investment for a period longer than the maturity of the foreign exchange forward contract, and the Group’s policy is to hedge the net investment only to the extent of the nominal amount of the foreign exchange leg of the derivative, the only source of ineffectiveness that is expected to arise from these hedging relationships is the effect of the counterparty’s and the Group’s credit risk on the fair value of the derivative, which is not reflected in the fair value of the hypothetical derivative.
IFRS 7.23B The Group held the following foreign exchange forward contracts to hedge its net investments in its subsidiaries in the UK.
Maturity
Less than 1 year 1–2 years 2–5 years
31 December 2021Nominal amount (net) in millions of euro 274 115 199Average EUR/GBP exchange rate 1.091 1.085 1.072
31 December 2020Nominal amount (net) in millions of euro 244 102 177Average EUR/GBP exchange rate 1.120 1.106 1.098
Intr
oduc
tion
Aud
itor
s’ r
epor
tPr
imar
y st
atem
ents
NO
TE
SFu
rthe
r re
sour
ces
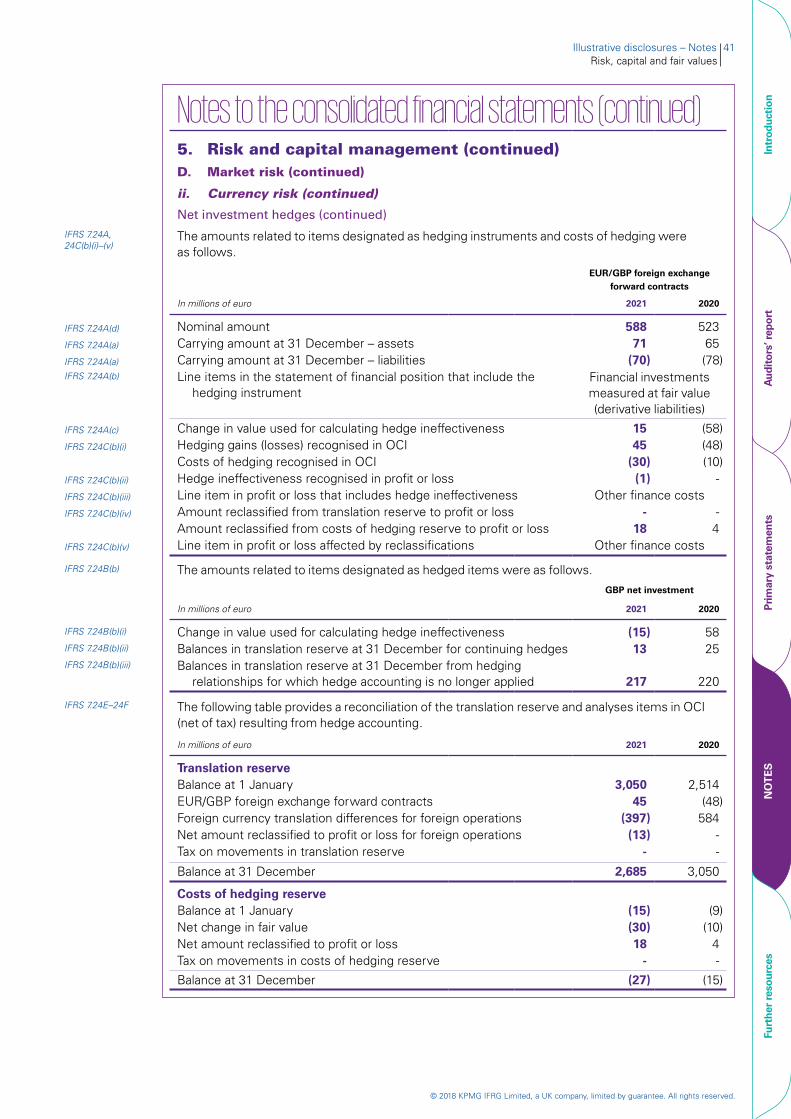
© 2018 KPMG IFRG Limited, a UK company, limited by guarantee. All rights reserved.
Illustrative disclosures – Notes 41Risk, capital and fair values
Notes to the consolidated financial statements (continued)5. Risk and capital management (continued)D. Market risk (continued)
ii. Currency risk (continued)
Net investment hedges (continued)
IFRS 7.24A, 24C(b)(i)–(v)
The amounts related to items designated as hedging instruments and costs of hedging were as follows.
EUR/GBP foreign exchange forward contracts
In millions of euro 2021 2020
IFRS 7.24A(d) Nominal amount 588 523IFRS 7.24A(a) Carrying amount at 31 December – assets 71 65IFRS 7.24A(a) Carrying amount at 31 December – liabilities (70) (78)IFRS 7.24A(b) Line items in the statement of financial position that include the
hedging instrumentFinancial investments measured at fair value (derivative liabilities)
IFRS 7.24A(c) Change in value used for calculating hedge ineffectiveness 15 (58)IFRS 7.24C(b)(i) Hedging gains (losses) recognised in OCI 45 (48)
Costs of hedging recognised in OCI (30) (10)IFRS 7.24C(b)(ii) Hedge ineffectiveness recognised in profit or loss (1) -IFRS 7.24C(b)(iii) Line item in profit or loss that includes hedge ineffectiveness Other finance costsIFRS 7.24C(b)(iv) Amount reclassified from translation reserve to profit or loss - -
Amount reclassified from costs of hedging reserve to profit or loss 18 4IFRS 7.24C(b)(v) Line item in profit or loss affected by reclassifications Other finance costs
IFRS 7.24B(b) The amounts related to items designated as hedged items were as follows.GBP net investment
In millions of euro 2021 2020
IFRS 7.24B(b)(i) Change in value used for calculating hedge ineffectiveness (15) 58IFRS 7.24B(b)(ii) Balances in translation reserve at 31 December for continuing hedges 13 25IFRS 7.24B(b)(iii) Balances in translation reserve at 31 December from hedging
relationships for which hedge accounting is no longer applied 217 220
IFRS 7.24E–24F The following table provides a reconciliation of the translation reserve and analyses items in OCI (net of tax) resulting from hedge accounting.
In millions of euro 2021 2020
Translation reserveBalance at 1 January 3,050 2,514EUR/GBP foreign exchange forward contracts 45 (48)Foreign currency translation differences for foreign operations (397) 584Net amount reclassified to profit or loss for foreign operations (13) -Tax on movements in translation reserve - -
Balance at 31 December 2,685 3,050
Costs of hedging reserveBalance at 1 January (15) (9)Net change in fair value (30) (10)Net amount reclassified to profit or loss 18 4Tax on movements in costs of hedging reserve - -
Balance at 31 December (27) (15)
Intr
oduc
tion
Aud
itor
s’ r
epor
tPr
imar
y st
atem
ents
NO
TE
SFu
rthe
r re
sour
ces
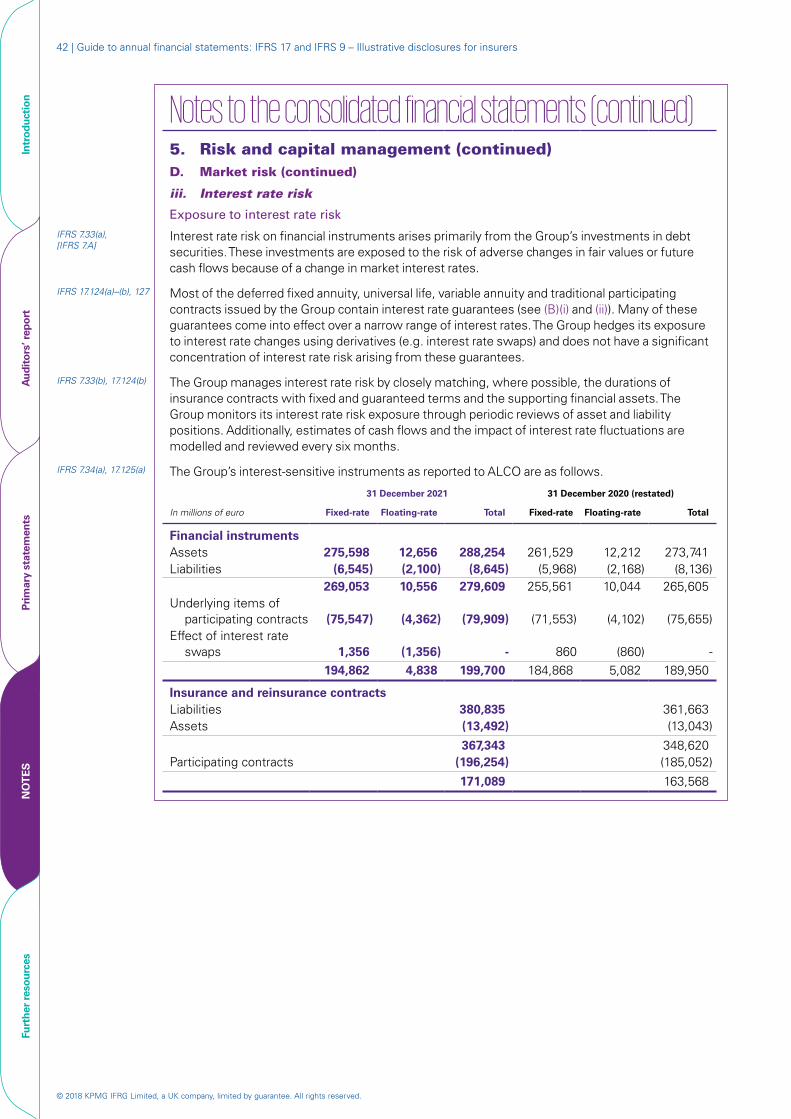
© 2018 KPMG IFRG Limited, a UK company, limited by guarantee. All rights reserved.
42 | Guide to annual financial statements: IFRS 17 and IFRS 9 – Illustrative disclosures for insurers
Notes to the consolidated financial statements (continued)5. Risk and capital management (continued)D. Market risk (continued)
iii. Interest rate risk
Exposure to interest rate risk
IFRS 7.33(a), [IFRS 7.A]
Interest rate risk on financial instruments arises primarily from the Group’s investments in debt securities. These investments are exposed to the risk of adverse changes in fair values or future cash flows because of a change in market interest rates.
IFRS 17.124(a)–(b), 127 Most of the deferred fixed annuity, universal life, variable annuity and traditional participating contracts issued by the Group contain interest rate guarantees (see (B)(i) and (ii)). Many of these guarantees come into effect over a narrow range of interest rates. The Group hedges its exposure to interest rate changes using derivatives (e.g. interest rate swaps) and does not have a significant concentration of interest rate risk arising from these guarantees.
IFRS 7.33(b), 17.124(b) The Group manages interest rate risk by closely matching, where possible, the durations of insurance contracts with fixed and guaranteed terms and the supporting financial assets. The Group monitors its interest rate risk exposure through periodic reviews of asset and liability positions. Additionally, estimates of cash flows and the impact of interest rate fluctuations are modelled and reviewed every six months.
IFRS 7.34(a), 17.125(a) The Group’s interest-sensitive instruments as reported to ALCO are as follows.
31 December 2021 31 December 2020 (restated)
In millions of euro Fixed-rate Floating-rate Total Fixed-rate Floating-rate Total
Financial instrumentsAssets 275,598 12,656 288,254 261,529 12,212 273,741 Liabilities (6,545) (2,100) (8,645) (5,968) (2,168) (8,136)
269,053 10,556 279,609 255,561 10,044 265,605Underlying items of
participating contracts (75,547) (4,362) (79,909) (71,553) (4,102) (75,655)Effect of interest rate
swaps 1,356 (1,356) - 860 (860) - 194,862 4,838 199,700 184,868 5,082 189,950
Insurance and reinsurance contractsLiabilities 380,835 361,663Assets (13,492) (13,043)
367,343 348,620Participating contracts (196,254) (185,052)
171,089 163,568
Intr
oduc
tion
Aud
itor
s’ r
epor
tPr
imar
y st
atem
ents
NO
TE
SFu
rthe
r re
sour
ces
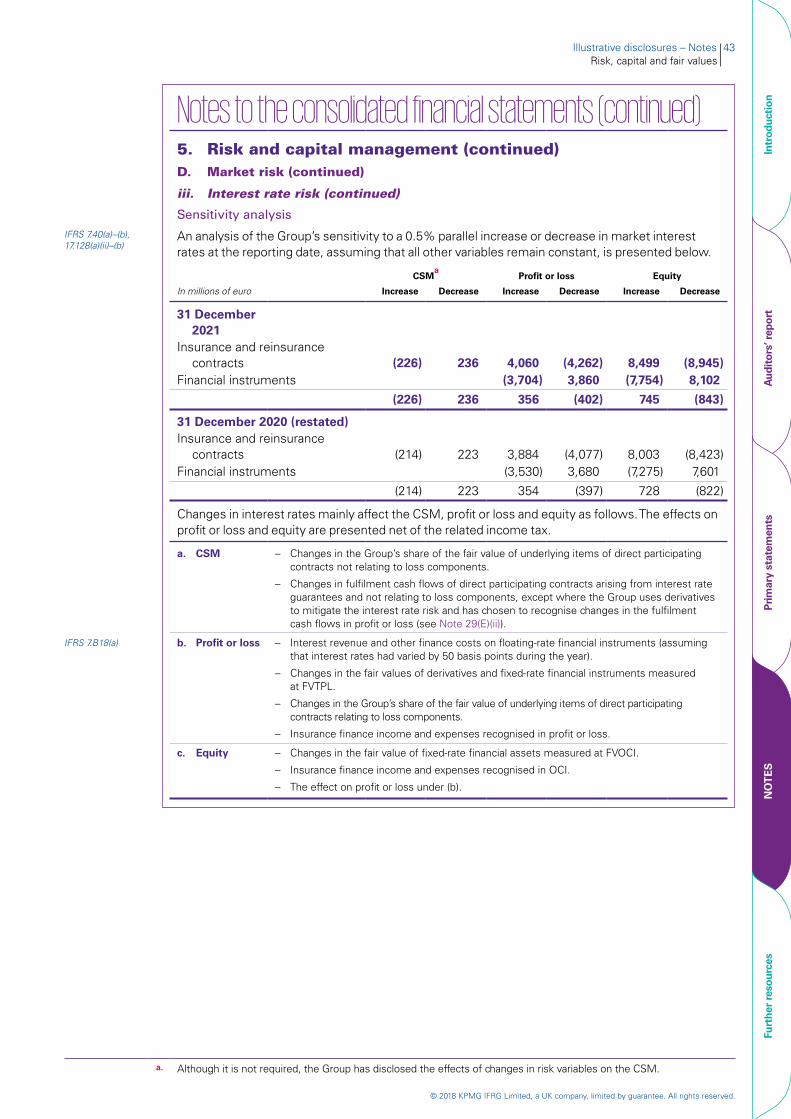
© 2018 KPMG IFRG Limited, a UK company, limited by guarantee. All rights reserved.
Illustrative disclosures – Notes 43Risk, capital and fair values
Notes to the consolidated financial statements (continued)5. Risk and capital management (continued)D. Market risk (continued)
iii. Interest rate risk (continued)
Sensitivity analysis
IFRS 7.40(a)–(b), 17.128(a)(ii)–(b)
An analysis of the Group’s sensitivity to a 0.5% parallel increase or decrease in market interest rates at the reporting date, assuming that all other variables remain constant, is presented below.
CSMa
Profit or loss Equity
In millions of euro Increase Decrease Increase Decrease Increase Decrease
31 December 2021
Insurance and reinsurance contracts (226) 236 4,060 (4,262) 8,499 (8,945)
Financial instruments (3,704) 3,860 (7,754) 8,102
(226) 236 356 (402) 745 (843)
31 December 2020 (restated)Insurance and reinsurance
contracts (214) 223 3,884 (4,077) 8,003 (8,423)Financial instruments (3,530) 3,680 (7,275) 7,601
(214) 223 354 (397) 728 (822)
Changes in interest rates mainly affect the CSM, profit or loss and equity as follows. The effects on profit or loss and equity are presented net of the related income tax.
a. CSM – Changes in the Group’s share of the fair value of underlying items of direct participating contracts not relating to loss components.
– Changes in fulfilment cash flows of direct participating contracts arising from interest rate guarantees and not relating to loss components, except where the Group uses derivatives to mitigate the interest rate risk and has chosen to recognise changes in the fulfilment cash flows in profit or loss (see Note 29(E)(ii)).
IFRS 7.B18(a) b. Profit or loss – Interest revenue and other finance costs on floating-rate financial instruments (assuming that interest rates had varied by 50 basis points during the year).
– Changes in the fair values of derivatives and fixed-rate financial instruments measured at FVTPL.
– Changes in the Group’s share of the fair value of underlying items of direct participating contracts relating to loss components.
– Insurance finance income and expenses recognised in profit or loss.
c. Equity – Changes in the fair value of fixed-rate financial assets measured at FVOCI.
– Insurance finance income and expenses recognised in OCI.
– The effect on profit or loss under (b).
a. Although it is not required, the Group has disclosed the effects of changes in risk variables on the CSM.
Intr
oduc
tion
Aud
itor
s’ r
epor
tPr
imar
y st
atem
ents
NO
TE
SFu
rthe
r re
sour
ces
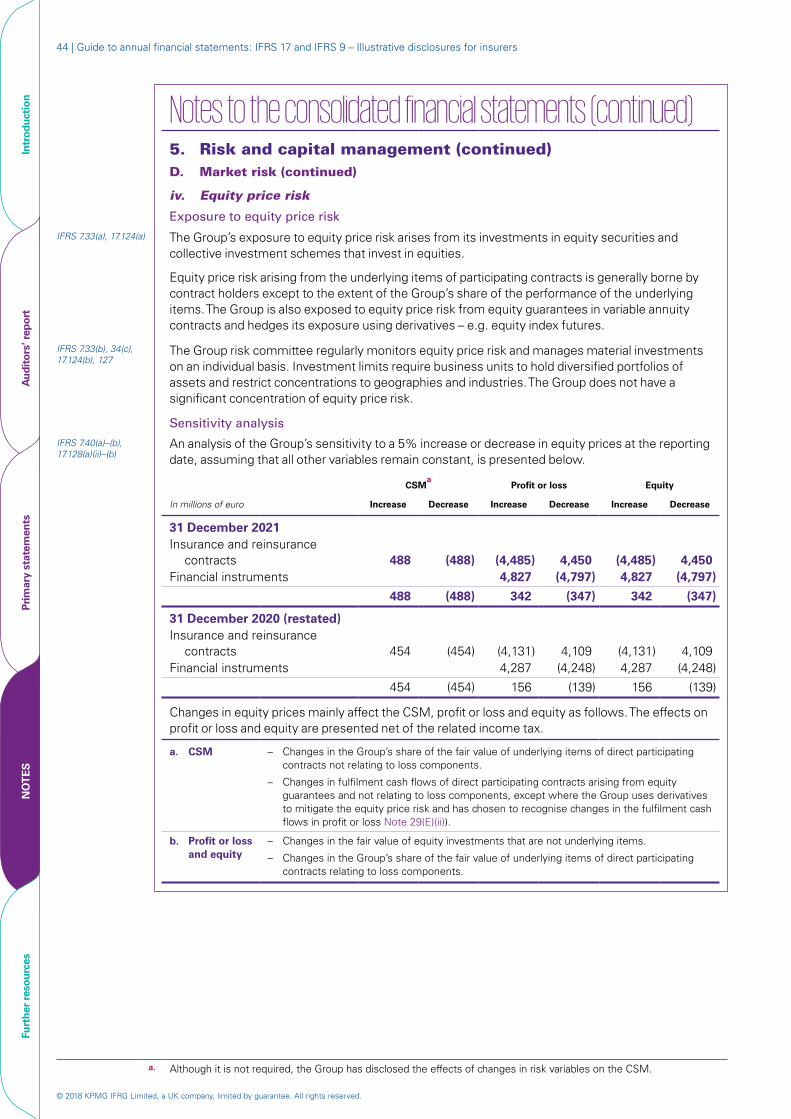
© 2018 KPMG IFRG Limited, a UK company, limited by guarantee. All rights reserved.
44 | Guide to annual financial statements: IFRS 17 and IFRS 9 – Illustrative disclosures for insurers
Notes to the consolidated financial statements (continued)5. Risk and capital management (continued)D. Market risk (continued)
iv. Equity price risk
Exposure to equity price risk
IFRS 7.33(a), 17.124(a) The Group’s exposure to equity price risk arises from its investments in equity securities and collective investment schemes that invest in equities.
Equity price risk arising from the underlying items of participating contracts is generally borne by contract holders except to the extent of the Group’s share of the performance of the underlying items. The Group is also exposed to equity price risk from equity guarantees in variable annuity contracts and hedges its exposure using derivatives – e.g. equity index futures.
IFRS 7.33(b), 34(c), 17.124(b), 127
The Group risk committee regularly monitors equity price risk and manages material investments on an individual basis. Investment limits require business units to hold diversified portfolios of assets and restrict concentrations to geographies and industries. The Group does not have a significant concentration of equity price risk.
Sensitivity analysis
IFRS 7.40(a)–(b), 17.128(a)(ii)–(b)
An analysis of the Group’s sensitivity to a 5% increase or decrease in equity prices at the reporting date, assuming that all other variables remain constant, is presented below.
CSMa
Profit or loss Equity
In millions of euro Increase Decrease Increase Decrease Increase Decrease
31 December 2021Insurance and reinsurance
contracts 488 (488) (4,485) 4,450 (4,485) 4,450Financial instruments 4,827 (4,797) 4,827 (4,797)
488 (488) 342 (347) 342 (347)
31 December 2020 (restated)Insurance and reinsurance
contracts 454 (454) (4,131) 4,109 (4,131) 4,109Financial instruments 4,287 (4,248) 4,287 (4,248)
454 (454) 156 (139) 156 (139)
Changes in equity prices mainly affect the CSM, profit or loss and equity as follows. The effects on profit or loss and equity are presented net of the related income tax.
a. CSM – Changes in the Group’s share of the fair value of underlying items of direct participating contracts not relating to loss components.
– Changes in fulfilment cash flows of direct participating contracts arising from equity guarantees and not relating to loss components, except where the Group uses derivatives to mitigate the equity price risk and has chosen to recognise changes in the fulfilment cash flows in profit or loss Note 29(E)(ii)).
b. Profit or loss and equity
– Changes in the fair value of equity investments that are not underlying items.
– Changes in the Group’s share of the fair value of underlying items of direct participating contracts relating to loss components.
a. Although it is not required, the Group has disclosed the effects of changes in risk variables on the CSM.
Intr
oduc
tion
Aud
itor
s’ r
epor
tPr
imar
y st
atem
ents
NO
TE
SFu
rthe
r re
sour
ces
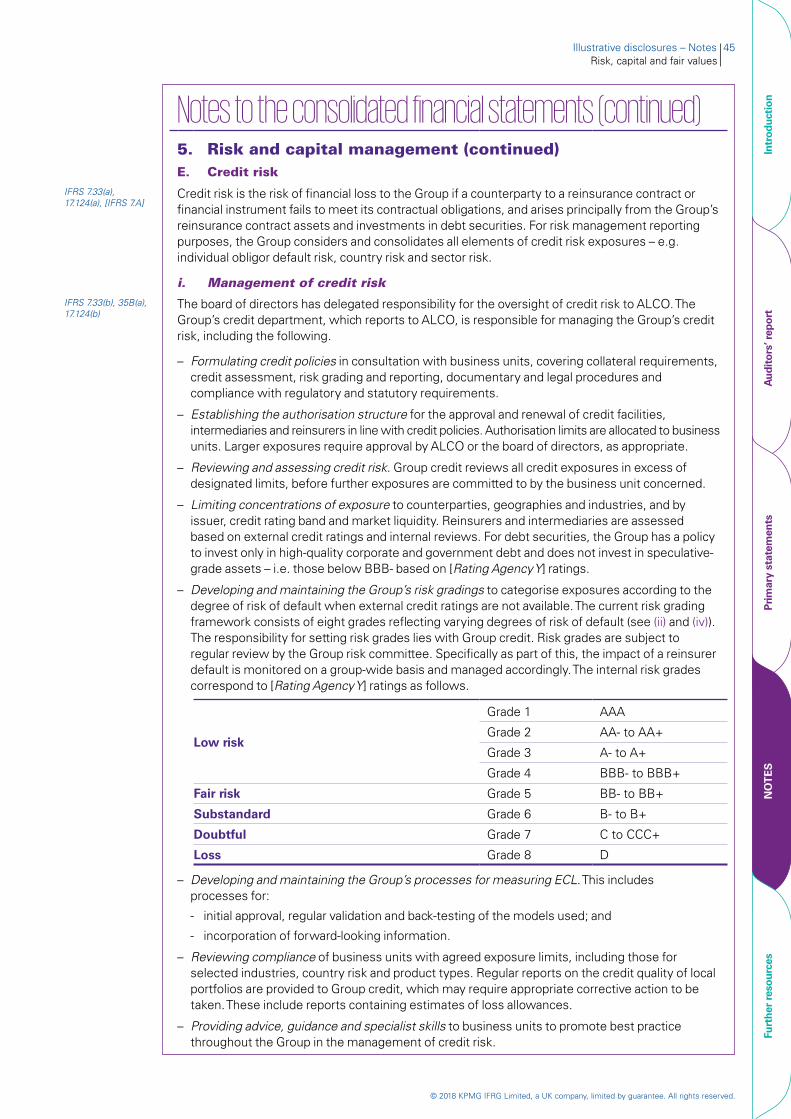
© 2018 KPMG IFRG Limited, a UK company, limited by guarantee. All rights reserved.
Illustrative disclosures – Notes 45Risk, capital and fair values
Notes to the consolidated financial statements (continued)5. Risk and capital management (continued)E. Credit risk
IFRS 7.33(a), 17.124(a), [IFRS 7.A]
Credit risk is the risk of financial loss to the Group if a counterparty to a reinsurance contract or financial instrument fails to meet its contractual obligations, and arises principally from the Group’s reinsurance contract assets and investments in debt securities. For risk management reporting purposes, the Group considers and consolidates all elements of credit risk exposures – e.g. individual obligor default risk, country risk and sector risk.
i. Management of credit riskIFRS 7.33(b), 35B(a), 17.124(b)
The board of directors has delegated responsibility for the oversight of credit risk to ALCO. The Group’s credit department, which reports to ALCO, is responsible for managing the Group’s credit risk, including the following.
– Formulating credit policies in consultation with business units, covering collateral requirements, credit assessment, risk grading and reporting, documentary and legal procedures and compliance with regulatory and statutory requirements.
– Establishing the authorisation structure for the approval and renewal of credit facilities, intermediaries and reinsurers in line with credit policies. Authorisation limits are allocated to business units. Larger exposures require approval by ALCO or the board of directors, as appropriate.
– Reviewing and assessing credit risk. Group credit reviews all credit exposures in excess of designated limits, before further exposures are committed to by the business unit concerned.
– Limiting concentrations of exposure to counterparties, geographies and industries, and by issuer, credit rating band and market liquidity. Reinsurers and intermediaries are assessed based on external credit ratings and internal reviews. For debt securities, the Group has a policy to invest only in high-quality corporate and government debt and does not invest in speculative-grade assets – i.e. those below BBB- based on [Rating Agency Y] ratings.
– Developing and maintaining the Group’s risk gradings to categorise exposures according to the degree of risk of default when external credit ratings are not available. The current risk grading framework consists of eight grades reflecting varying degrees of risk of default (see (ii) and (iv)). The responsibility for setting risk grades lies with Group credit. Risk grades are subject to regular review by the Group risk committee. Specifically as part of this, the impact of a reinsurer default is monitored on a group-wide basis and managed accordingly. The internal risk grades correspond to [Rating Agency Y] ratings as follows.
Low risk
Grade 1 AAA
Grade 2 AA- to AA+
Grade 3 A- to A+
Grade 4 BBB- to BBB+
Fair risk Grade 5 BB- to BB+
Substandard Grade 6 B- to B+
Doubtful Grade 7 C to CCC+
Loss Grade 8 D
– Developing and maintaining the Group’s processes for measuring ECL. This includes processes for:
- initial approval, regular validation and back-testing of the models used; and
- incorporation of forward-looking information.
– Reviewing compliance of business units with agreed exposure limits, including those for selected industries, country risk and product types. Regular reports on the credit quality of local portfolios are provided to Group credit, which may require appropriate corrective action to be taken. These include reports containing estimates of loss allowances.
– Providing advice, guidance and specialist skills to business units to promote best practice throughout the Group in the management of credit risk.
Intr
oduc
tion
Aud
itor
s’ r
epor
tPr
imar
y st
atem
ents
NO
TE
SFu
rthe
r re
sour
ces
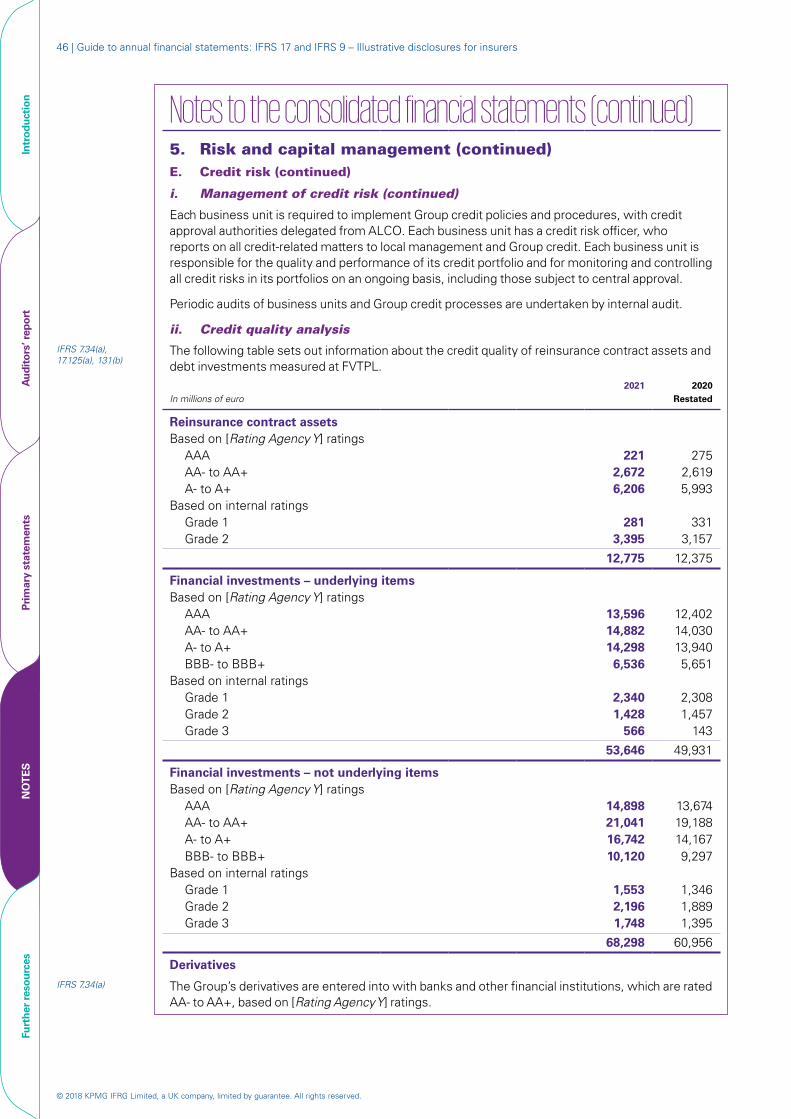
© 2018 KPMG IFRG Limited, a UK company, limited by guarantee. All rights reserved.
46 | Guide to annual financial statements: IFRS 17 and IFRS 9 – Illustrative disclosures for insurers
Notes to the consolidated financial statements (continued)5. Risk and capital management (continued)E. Credit risk (continued)
i. Management of credit risk (continued)
Each business unit is required to implement Group credit policies and procedures, with credit approval authorities delegated from ALCO. Each business unit has a credit risk officer, who reports on all credit-related matters to local management and Group credit. Each business unit is responsible for the quality and performance of its credit portfolio and for monitoring and controlling all credit risks in its portfolios on an ongoing basis, including those subject to central approval.
Periodic audits of business units and Group credit processes are undertaken by internal audit.
ii. Credit quality analysisIFRS 7.34(a), 17.125(a), 131(b)
The following table sets out information about the credit quality of reinsurance contract assets and debt investments measured at FVTPL.
In millions of euro2021 2020
Restated
Reinsurance contract assetsBased on [Rating Agency Y] ratings
AAA 221 275 AA- to AA+ 2,672 2,619 A- to A+ 6,206 5,993
Based on internal ratingsGrade 1 281 331 Grade 2 3,395 3,157
12,775 12,375
Financial investments – underlying items Based on [Rating Agency Y] ratings
AAA 13,596 12,402 AA- to AA+ 14,882 14,030 A- to A+ 14,298 13,940 BBB- to BBB+ 6,536 5,651
Based on internal ratingsGrade 1 2,340 2,308Grade 2 1,428 1,457Grade 3 566 143
53,646 49,931
Financial investments – not underlying itemsBased on [Rating Agency Y] ratings
AAA 14,898 13,674 AA- to AA+ 21,041 19,188 A- to A+ 16,742 14,167 BBB- to BBB+ 10,120 9,297
Based on internal ratingsGrade 1 1,553 1,346Grade 2 2,196 1,889Grade 3 1,748 1,395
68,298 60,956
DerivativesIFRS 7.34(a) The Group’s derivatives are entered into with banks and other financial institutions, which are rated
AA- to AA+, based on [Rating Agency Y] ratings.
Intr
oduc
tion
Aud
itor
s’ r
epor
tPr
imar
y st
atem
ents
NO
TE
SFu
rthe
r re
sour
ces
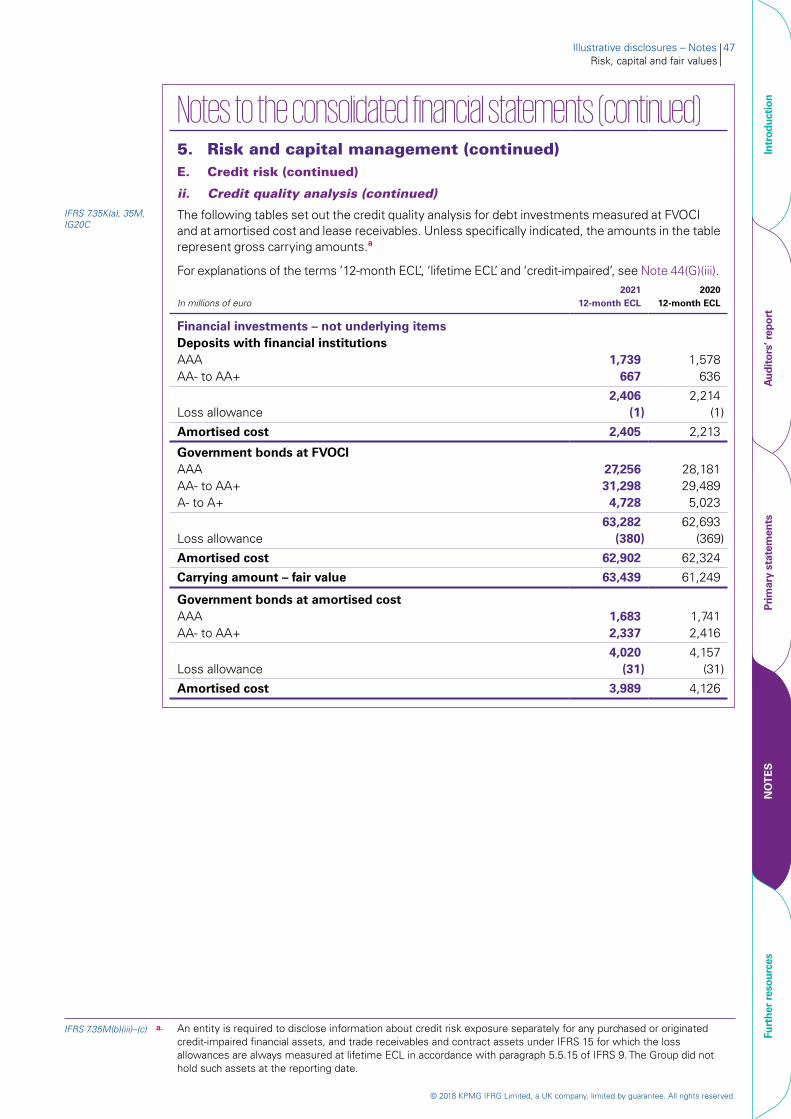
© 2018 KPMG IFRG Limited, a UK company, limited by guarantee. All rights reserved.
Illustrative disclosures – Notes 47Risk, capital and fair values
Notes to the consolidated financial statements (continued)5. Risk and capital management (continued)E. Credit risk (continued)
ii. Credit quality analysis (continued)IFRS 7.35K(a), 35M, IG20C
The following tables set out the credit quality analysis for debt investments measured at FVOCI and at amortised cost and lease receivables. Unless specifically indicated, the amounts in the table represent gross carrying amounts.a
For explanations of the terms ’12-month ECL’, ‘lifetime ECL’ and ‘credit-impaired’, see Note 44(G)(iii).
In millions of euro2021
12-month ECL2020
12-month ECL
Financial investments – not underlying itemsDeposits with financial institutionsAAA 1,739 1,578AA- to AA+ 667 636
2,406 2,214Loss allowance (1) (1)
Amortised cost 2,405 2,213
Government bonds at FVOCIAAA 27,256 28,181 AA- to AA+ 31,298 29,489 A- to A+ 4,728 5,023
63,282 62,693 Loss allowance (380) (369)
Amortised cost 62,902 62,324
Carrying amount – fair value 63,439 61,249
Government bonds at amortised costAAA 1,683 1,741 AA- to AA+ 2,337 2,416
4,020 4,157 Loss allowance (31) (31)
Amortised cost 3,989 4,126
IFRS 7.35M(b)(iii)–(c) a. An entity is required to disclose information about credit risk exposure separately for any purchased or originated credit-impaired financial assets, and trade receivables and contract assets under IFRS 15 for which the loss allowances are always measured at lifetime ECL in accordance with paragraph 5.5.15 of IFRS 9. The Group did not hold such assets at the reporting date.
Intr
oduc
tion
Aud
itor
s’ r
epor
tPr
imar
y st
atem
ents
NO
TE
SFu
rthe
r re
sour
ces
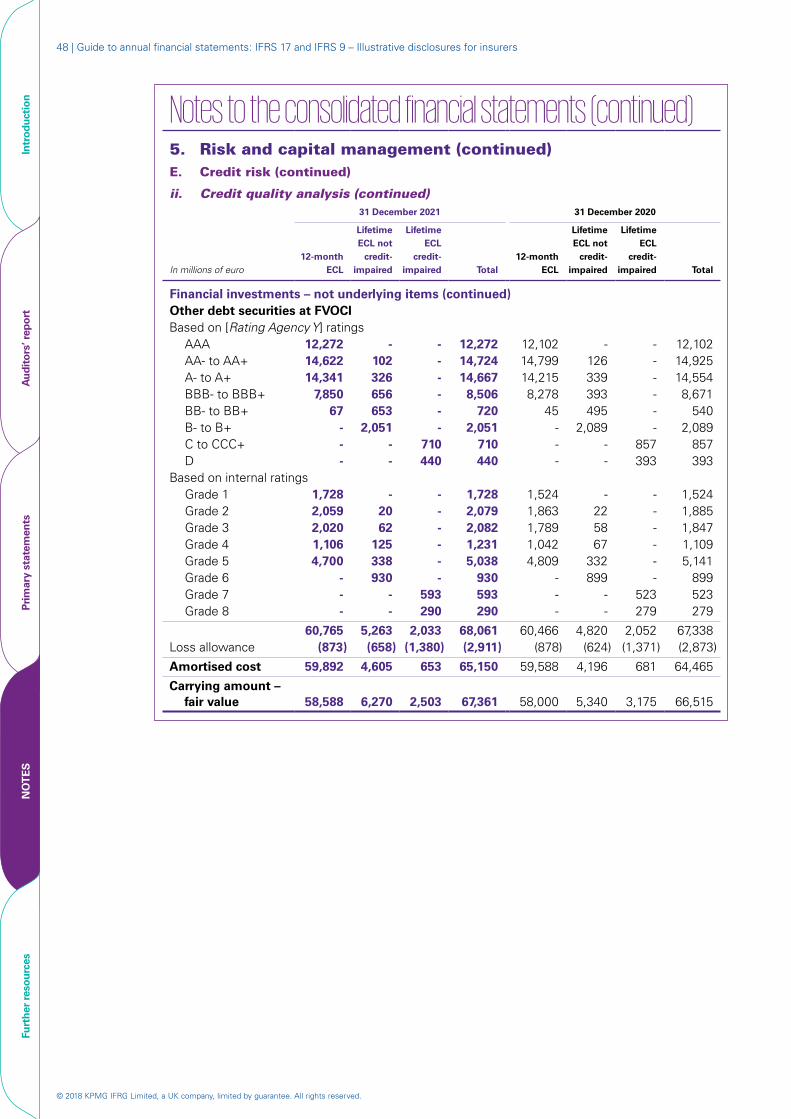
© 2018 KPMG IFRG Limited, a UK company, limited by guarantee. All rights reserved.
48 | Guide to annual financial statements: IFRS 17 and IFRS 9 – Illustrative disclosures for insurers
Notes to the consolidated financial statements (continued)5. Risk and capital management (continued)E. Credit risk (continued)
ii. Credit quality analysis (continued)31 December 2021 31 December 2020
In millions of euro12-month
ECL
Lifetime ECL not
credit-impaired
Lifetime ECL
credit-impaired Total
12-month ECL
Lifetime ECL not
credit-impaired
Lifetime ECL
credit-impaired Total
Financial investments – not underlying items (continued)Other debt securities at FVOCIBased on [Rating Agency Y] ratings
AAA 12,272 - - 12,272 12,102 - - 12,102 AA- to AA+ 14,622 102 - 14,724 14,799 126 - 14,925 A- to A+ 14,341 326 - 14,667 14,215 339 - 14,554 BBB- to BBB+ 7,850 656 - 8,506 8,278 393 - 8,671 BB- to BB+ 67 653 - 720 45 495 - 540 B- to B+ - 2,051 - 2,051 - 2,089 - 2,089 C to CCC+ - - 710 710 - - 857 857 D - - 440 440 - - 393 393
Based on internal ratingsGrade 1 1,728 - - 1,728 1,524 - - 1,524Grade 2 2,059 20 - 2,079 1,863 22 - 1,885Grade 3 2,020 62 - 2,082 1,789 58 - 1,847Grade 4 1,106 125 - 1,231 1,042 67 - 1,109Grade 5 4,700 338 - 5,038 4,809 332 - 5,141 Grade 6 - 930 - 930 - 899 - 899 Grade 7 - - 593 593 - - 523 523 Grade 8 - - 290 290 - - 279 279
60,765 5,263 2,033 68,061 60,466 4,820 2,052 67,338 Loss allowance (873) (658) (1,380) (2,911) (878) (624) (1,371) (2,873)
Amortised cost 59,892 4,605 653 65,150 59,588 4,196 681 64,465
Carrying amount – fair value 58,588 6,270 2,503 67,361 58,000 5,340 3,175 66,515
Intr
oduc
tion
Aud
itor
s’ r
epor
tPr
imar
y st
atem
ents
NO
TE
SFu
rthe
r re
sour
ces
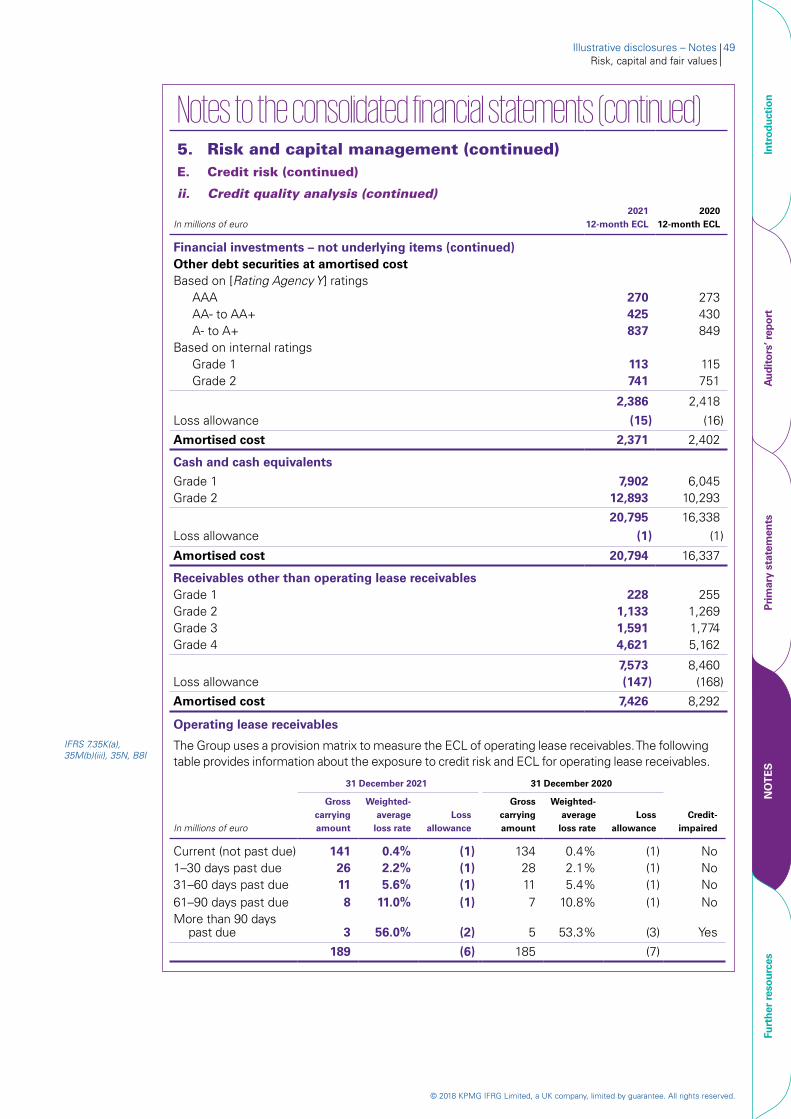
© 2018 KPMG IFRG Limited, a UK company, limited by guarantee. All rights reserved.
Illustrative disclosures – Notes 49Risk, capital and fair values
Notes to the consolidated financial statements (continued)5. Risk and capital management (continued)E. Credit risk (continued)
ii. Credit quality analysis (continued)
In millions of euro2021
12-month ECL2020
12-month ECL
Financial investments – not underlying items (continued)Other debt securities at amortised costBased on [Rating Agency Y] ratings
AAA 270 273 AA- to AA+ 425 430 A- to A+ 837 849
Based on internal ratingsGrade 1 113 115Grade 2 741 751
2,386 2,418
Loss allowance (15) (16)
Amortised cost 2,371 2,402
Cash and cash equivalents
Grade 1 7,902 6,045Grade 2 12,893 10,293
20,795 16,338 Loss allowance (1) (1)
Amortised cost 20,794 16,337
Receivables other than operating lease receivablesGrade 1 228 255Grade 2 1,133 1,269Grade 3 1,591 1,774Grade 4 4,621 5,162
7,573 8,460Loss allowance (147) (168)
Amortised cost 7,426 8,292
Operating lease receivablesIFRS 7.35K(a), 35M(b)(iii), 35N, B8I
The Group uses a provision matrix to measure the ECL of operating lease receivables. The following table provides information about the exposure to credit risk and ECL for operating lease receivables.
31 December 2021 31 December 2020
In millions of euro
Gross carrying amount
Weighted-average
loss rateLoss
allowance
Gross carrying amount
Weighted-average
loss rateLoss
allowanceCredit-
impaired
Current (not past due) 141 0.4% (1) 134 0.4% (1) No1–30 days past due 26 2.2% (1) 28 2.1% (1) No31–60 days past due 11 5.6% (1) 11 5.4% (1) No61–90 days past due 8 11.0% (1) 7 10.8% (1) NoMore than 90 days
past due 3 56.0% (2) 5 53.3% (3) Yes
189 (6) 185 (7)
Intr
oduc
tion
Aud
itor
s’ r
epor
tPr
imar
y st
atem
ents
NO
TE
SFu
rthe
r re
sour
ces
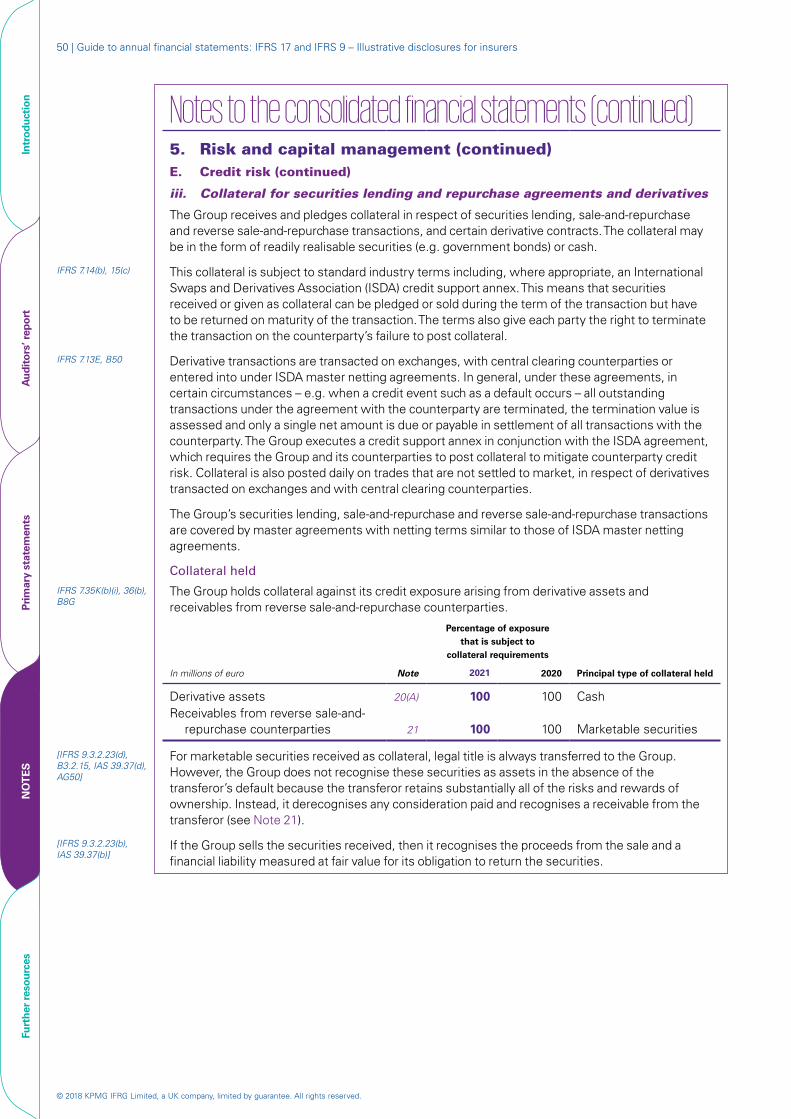
© 2018 KPMG IFRG Limited, a UK company, limited by guarantee. All rights reserved.
50 | Guide to annual financial statements: IFRS 17 and IFRS 9 – Illustrative disclosures for insurers
Notes to the consolidated financial statements (continued)5. Risk and capital management (continued)E. Credit risk (continued)
iii. Collateral for securities lending and repurchase agreements and derivatives
The Group receives and pledges collateral in respect of securities lending, sale-and-repurchase and reverse sale-and-repurchase transactions, and certain derivative contracts. The collateral may be in the form of readily realisable securities (e.g. government bonds) or cash.
IFRS 7.14(b), 15(c) This collateral is subject to standard industry terms including, where appropriate, an International Swaps and Derivatives Association (ISDA) credit support annex. This means that securities received or given as collateral can be pledged or sold during the term of the transaction but have to be returned on maturity of the transaction. The terms also give each party the right to terminate the transaction on the counterparty’s failure to post collateral.
IFRS 7.13E, B50 Derivative transactions are transacted on exchanges, with central clearing counterparties or entered into under ISDA master netting agreements. In general, under these agreements, in certain circumstances – e.g. when a credit event such as a default occurs – all outstanding transactions under the agreement with the counterparty are terminated, the termination value is assessed and only a single net amount is due or payable in settlement of all transactions with the counterparty. The Group executes a credit support annex in conjunction with the ISDA agreement, which requires the Group and its counterparties to post collateral to mitigate counterparty credit risk. Collateral is also posted daily on trades that are not settled to market, in respect of derivatives transacted on exchanges and with central clearing counterparties.
The Group’s securities lending, sale-and-repurchase and reverse sale-and-repurchase transactions are covered by master agreements with netting terms similar to those of ISDA master netting agreements.
Collateral held
IFRS 7.35K(b)(i), 36(b), B8G
The Group holds collateral against its credit exposure arising from derivative assets and receivables from reverse sale-and-repurchase counterparties.
Percentage of exposure that is subject to
collateral requirements
In millions of euro Principal type of collateral heldNote 2021 2020
Derivative assets 20(A) 100 100 Cash Receivables from reverse sale-and-
repurchase counterparties 21 100 100 Marketable securities
[IFRS 9.3.2.23(d), B3.2.15, IAS 39.37(d), AG50]
For marketable securities received as collateral, legal title is always transferred to the Group. However, the Group does not recognise these securities as assets in the absence of the transferor’s default because the transferor retains substantially all of the risks and rewards of ownership. Instead, it derecognises any consideration paid and recognises a receivable from the transferor (see Note 21).
[IFRS 9.3.2.23(b), IAS 39.37(b)]
If the Group sells the securities received, then it recognises the proceeds from the sale and a financial liability measured at fair value for its obligation to return the securities.
Intr
oduc
tion
Aud
itor
s’ r
epor
tPr
imar
y st
atem
ents
NO
TE
SFu
rthe
r re
sour
ces
© 2018 KPMG IFRG Limited, a UK company, limited by guarantee. All rights reserved.
Illustrative disclosures – Notes 51Risk, capital and fair values
Notes to the consolidated financial statements (continued) 5. Risk and capital management (continued)E. Credit risk (continued)
iii. Collateral for securities lending and repurchase agreements and derivatives (continued)
Collateral held (continued)
IFRS 7.15(a)–(b) At 31 December 2021, the fair value of financial assets accepted as collateral that the Group is permitted to sell or repledge in the absence of default was €6,793 million (2020: €7,338 million). None of the financial assets accepted as collateral have been sold or repledged.
IFRS 7.38 At 31 December 2021, the Group held marketable debt securities of €3 million (2020: €2 million) that were obtained during the year by taking possession of collateral held as security against receivables from reverse sale-and-repurchase counterparties. The Group’s policy is to pursue timely realisation of the collateral in an orderly manner. The Group does not generally use the non-cash collateral for its own operations.
IFRS 7.35K(b)(ii) During 2021 and 2020, there were no significant changes in the quality of collateral or changes in the Group’s collateral policies.
Collateral pledged
The Group also pledges collateral for certain derivative liabilities and for payables to sale-and-repurchase and securities lending counterparties.
IFRS 7.14(a), 42D(a)–(b), (e), [IFRS 9.3.2.23(a), B3.2.16(a)–(c), IAS 39.37(a), AG51(a)–(c)]
At 31 December 2021, securities lent to unrelated parties under securities lending transactions or subject to sale-and-repurchase agreements in which the counterparties obtain the right to sell or pledge the assets amount to €8,267 million (2020: €8,205 million). These securities are reclassified as ‘financial investments transferred under securities lending and repurchase agreements’ separately from other assets. The Group continues to recognise the transferred securities in their entirety because it retains substantially all of the risks and rewards of ownership.
IFRS 7.14(b), 42D(c) Because the Group transfers the contractual rights to the cash flows of the securities as part of the arrangement, it does not have the ability to use the transferred assets during the term of the arrangement.
IFRS 7.42D(c), (e), [IFRS 9.3.2.15, IAS 39.29]
Any consideration received in the transfer is recognised as a financial liability. The carrying amount of the liabilities associated with the transferred securities is €8,274 million (2020: €8,214 million) and is included in ‘payables’ (see Note 27).
Intr
oduc
tion
Aud
itor
s’ r
epor
tPr
imar
y st
atem
ents
NO
TE
SFu
rthe
r re
sour
ces
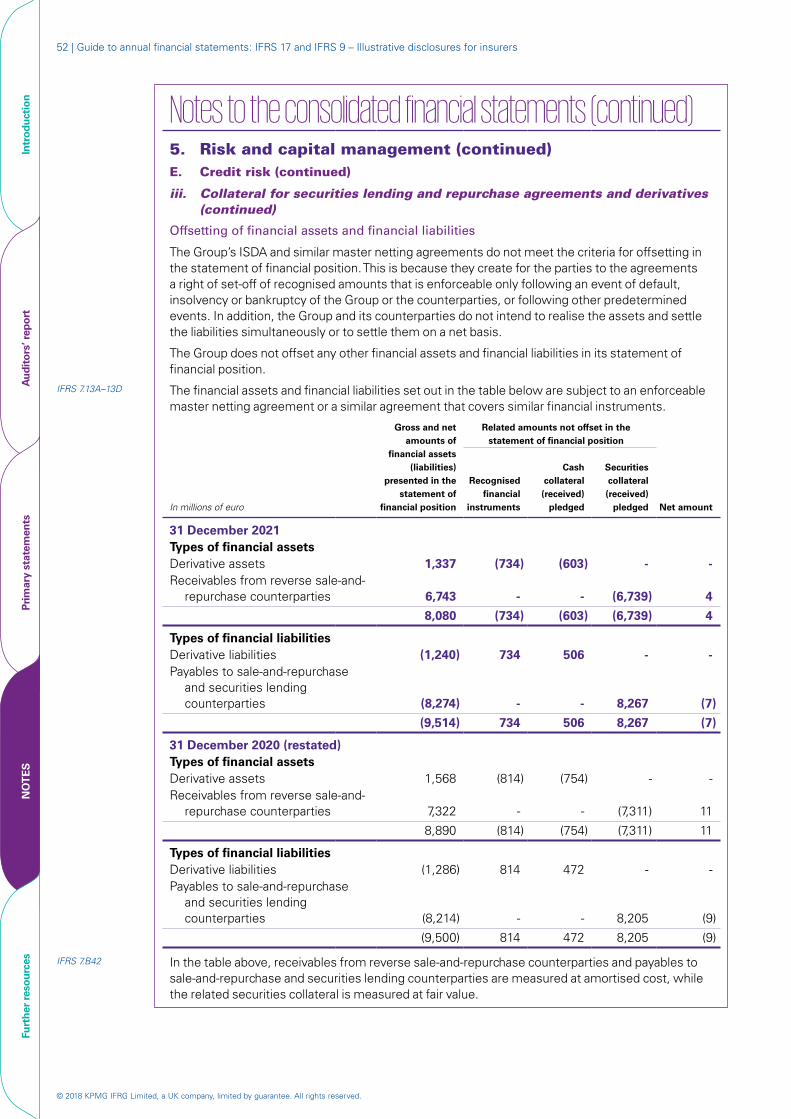
© 2018 KPMG IFRG Limited, a UK company, limited by guarantee. All rights reserved.
52 | Guide to annual financial statements: IFRS 17 and IFRS 9 – Illustrative disclosures for insurers
Notes to the consolidated financial statements (continued) 5. Risk and capital management (continued)E. Credit risk (continued)
iii. Collateral for securities lending and repurchase agreements and derivatives (continued)
Offsetting of financial assets and financial liabilities
The Group’s ISDA and similar master netting agreements do not meet the criteria for offsetting in the statement of financial position. This is because they create for the parties to the agreements a right of set-off of recognised amounts that is enforceable only following an event of default, insolvency or bankruptcy of the Group or the counterparties, or following other predetermined events. In addition, the Group and its counterparties do not intend to realise the assets and settle the liabilities simultaneously or to settle them on a net basis.
The Group does not offset any other financial assets and financial liabilities in its statement of financial position.
IFRS 7.13A–13D The financial assets and financial liabilities set out in the table below are subject to an enforceable master netting agreement or a similar agreement that covers similar financial instruments.
Gross and net amounts of
financial assets (liabilities)
presented in the statement of
financial position
Related amounts not offset in the statement of financial position
In millions of euro
Recognised financial
instruments
Cash collateral (received)
pledged
Securities collateral (received)
pledged Net amount
31 December 2021Types of financial assetsDerivative assets 1,337 (734) (603) - -Receivables from reverse sale-and-
repurchase counterparties 6,743 - - (6,739) 4
8,080 (734) (603) (6,739) 4
Types of financial liabilitiesDerivative liabilities (1,240) 734 506 - -Payables to sale-and-repurchase
and securities lending counterparties (8,274) - - 8,267 (7)
(9,514) 734 506 8,267 (7)
31 December 2020 (restated)Types of financial assetsDerivative assets 1,568 (814) (754) - -Receivables from reverse sale-and-
repurchase counterparties 7,322 - - (7,311) 11
8,890 (814) (754) (7,311) 11
Types of financial liabilitiesDerivative liabilities (1,286) 814 472 - -Payables to sale-and-repurchase
and securities lending counterparties (8,214) - - 8,205 (9)
(9,500) 814 472 8,205 (9)
IFRS 7.B42 In the table above, receivables from reverse sale-and-repurchase counterparties and payables to sale-and-repurchase and securities lending counterparties are measured at amortised cost, while the related securities collateral is measured at fair value.
Intr
oduc
tion
Aud
itor
s’ r
epor
tPr
imar
y st
atem
ents
NO
TE
SFu
rthe
r re
sour
ces
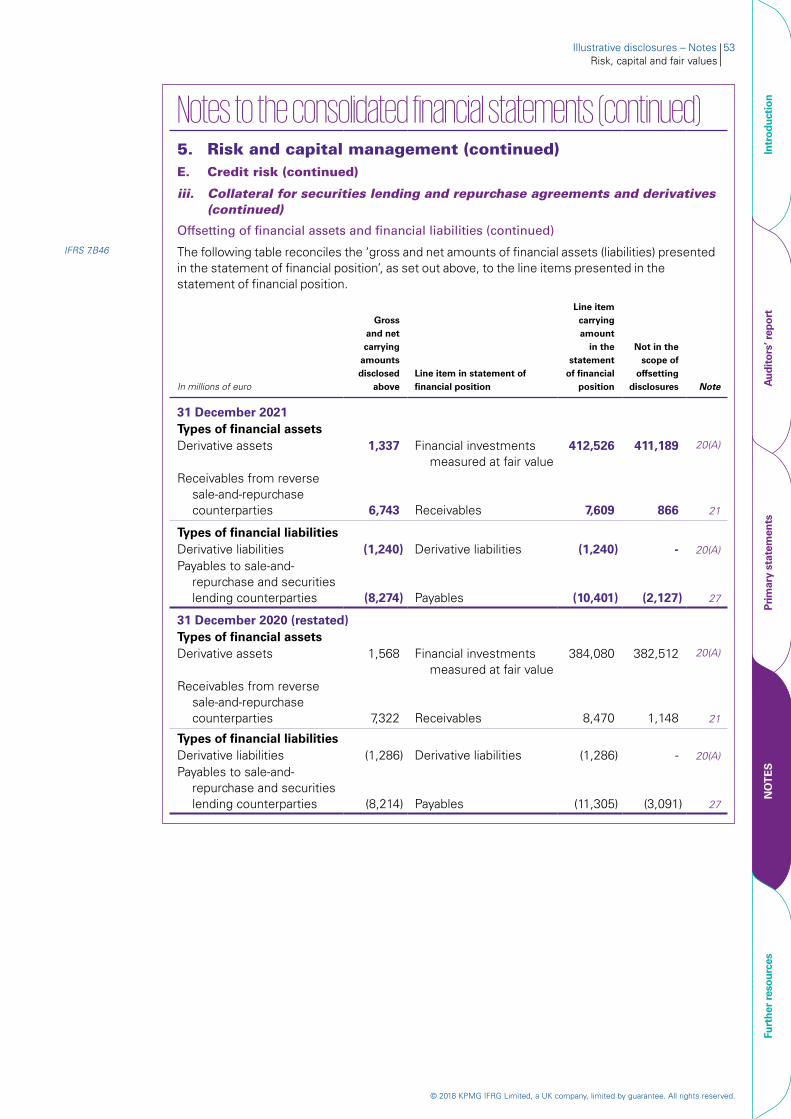
© 2018 KPMG IFRG Limited, a UK company, limited by guarantee. All rights reserved.
Illustrative disclosures – Notes 53Risk, capital and fair values
Notes to the consolidated financial statements (continued) 5. Risk and capital management (continued)E. Credit risk (continued)
iii. Collateral for securities lending and repurchase agreements and derivatives (continued)
Offsetting of financial assets and financial liabilities (continued)
IFRS 7.B46 The following table reconciles the ‘gross and net amounts of financial assets (liabilities) presented in the statement of financial position’, as set out above, to the line items presented in the statement of financial position.
In millions of euro
Gross and net carrying
amounts disclosed
aboveLine item in statement of financial position
Line item carrying amount
in the statement
of financial position
Not in the scope of
offsetting disclosures Note
31 December 2021Types of financial assetsDerivative assets 1,337 Financial investments
measured at fair value412,526 411,189 20(A)
Receivables from reverse sale-and-repurchase counterparties 6,743 Receivables 7,609 866 21
Types of financial liabilitiesDerivative liabilities (1,240) Derivative liabilities (1,240) - 20(A)
Payables to sale-and-repurchase and securities lending counterparties (8,274) Payables (10,401) (2,127) 27
31 December 2020 (restated)Types of financial assetsDerivative assets 1,568 Financial investments
measured at fair value384,080 382,512 20(A)
Receivables from reverse sale-and-repurchase counterparties 7,322 Receivables 8,470 1,148 21
Types of financial liabilitiesDerivative liabilities (1,286) Derivative liabilities (1,286) - 20(A)
Payables to sale-and-repurchase and securities lending counterparties (8,214) Payables (11,305) (3,091) 27
Intr
oduc
tion
Aud
itor
s’ r
epor
tPr
imar
y st
atem
ents
NO
TE
SFu
rthe
r re
sour
ces
© 2018 KPMG IFRG Limited, a UK company, limited by guarantee. All rights reserved.
54 | Guide to annual financial statements: IFRS 17 and IFRS 9 – Illustrative disclosures for insurers
Notes to the consolidated financial statements (continued)5. Risk and capital management (continued)E. Credit risk (continued)
IFRS 7.35B(b) iv. Amounts arising from ECL
Inputs, assumptions and techniques used for estimating impairment
See accounting policies in Note 44(G)(iii).
Significant increase in credit riskIFRS 7.35F(a), 35G(a)(ii)
When determining whether the credit risk (i.e. risk of default) on a financial instrument has increased significantly since initial recognition, the Group considers reasonable and supportable information that is relevant and available without undue cost or effort. This includes both qualitative and quantitative information and analysis based on the Group’s experience, expert credit assessment and forward-looking information.
The Group primarily identifies whether a significant increase in credit risk has occurred for an exposure by comparing:
– the remaining lifetime probability of default (PD) as at the reporting date; with
– the remaining lifetime PD for this point in time that was estimated on initial recognition of the exposure.
Whenever available, the Group monitors changes in credit risk by tracking published external credit ratings. To determine whether published ratings remain up to date and to assess whether there has been a significant increase in credit risk at the reporting date that has not been reflected in published ratings, the Group also reviews changes in bond yields and, where available, credit default swap (CDS) prices together with available press and regulatory information about issuers.
Where external credit ratings are not available, the Group allocates each exposure to a credit risk grade based on data that is determined to be predictive of the risk of default (including but not limited to audited financial statements, management accounts and cash flow projections and available regulatory and press information about borrowers) and applying experienced credit judgement. Credit risk grades are defined using qualitative and quantitative factors that are indicative of the risk of default and are aligned with external credit rating definitions from [Rating Agencies X and Y].
IFRS 7.35F(a)(i), [IFRS 9.5.5.10, B5.5.22–B5.5.24]
The Group has assumed that the credit risk of a financial asset has not increased significantly since initial recognition if the financial asset has low credit risk at the reporting date. The Group considers a financial asset to have low credit risk when its credit risk rating is equivalent to the globally understood definition of ‘investment-grade’. The Group considers this to be BBB- or higher based on [Rating Agency Y] ratings, which is equivalent to an internal risk grade of 4 or lower.
IFRS 7.35F(a)(ii) As a backstop, the Group considers that a significant increase in credit risk occurs no later than when an asset is more than 30 days past due. Days past due are determined by counting the number of days since the earliest elapsed due date in respect of which full payment has not been received. Due dates are determined without considering any grace period that might be available to the borrower.a
The Group monitors the effectiveness of the criteria used to identify significant increases in credit risk by regular reviews to confirm that:
– the criteria are capable of identifying significant increases in credit risk before an exposure is in default;
– the criteria do not align with the point in time when an asset becomes 30 days past due;
– the average time between the identification of a significant increase in credit risk and default appears reasonable;
– exposures are not generally transferred from 12-month ECL measurement to credit-impaired; and
– there is no unwarranted volatility in loss allowance from transfers between 12-month and lifetime ECL measurements.
IFRS 7.35F(a)(ii) a. If an entity has rebutted the presumption in paragraph 5.5.11 of IFRS 9 that the credit risk on a financial asset has increased significantly since initial recognition when contractual payments are more than 30 days past due, then it explains how it has rebutted that presumption.
Intr
oduc
tion
Aud
itor
s’ r
epor
tPr
imar
y st
atem
ents
NO
TE
SFu
rthe
r re
sour
ces
© 2018 KPMG IFRG Limited, a UK company, limited by guarantee. All rights reserved.
Illustrative disclosures – Notes 55Risk, capital and fair values
Notes to the consolidated financial statements (continued)5. Risk and capital management (continued)E. Credit risk (continued)
iv. Amounts arising from ECL (continued)
Inputs, assumptions and techniques used for estimating impairment (continued)
Modified financial assets IFRS 7.35F(f), B8B The contractual terms of a financial asset may be modified for a number of reasons, including
changing market conditions and other factors not related to a current or potential credit deterioration of the borrower. An existing financial asset whose terms have been modified may be derecognised and the renegotiated asset recognised as a new financial asset at fair value in accordance with the accounting policies in Note 44(G)(iv).
When the terms of a financial asset are modified and the modification does not result in derecognition, the determination of whether the asset’s credit risk has increased significantly reflects a comparison of:
– its remaining lifetime PD as at the reporting date based on the modified terms; with
– the remaining lifetime PD estimated based on data on initial recognition and the original contractual terms.
Definition of defaultIFRS 7.35F(b), B8A The Group considers a financial asset to be in default when:
– the borrower is unlikely to pay its credit obligations to the Group in full, without recourse by the Group to actions such as realising security (if any is held); or
– the financial asset is more than 90 days past due.
In assessing whether a borrower is in default, the Group considers indicators that are:
– qualitative: e.g. breaches of covenant and other indicators of financial distress;
– quantitative: e.g. overdue status and non-payment of another obligation of the same issuer to the Group; and
– based on data developed internally and obtained from external sources.
Inputs into the assessment of whether a financial instrument is in default and their significance may vary over time to reflect changes in circumstances.
Incorporation of forward-looking informationIFRS 7.35G(b) The Group incorporates forward-looking information into both its assessment of whether
the credit risk of an instrument has increased significantly since initial recognition and its measurement of ECL. It formulates a ‘base case’ view of the future direction of relevant economic variables and a representative range of other possible forecast scenarios based on advice from the Group risk committee and economic experts and consideration of a variety of external actual and forecast information. This process involves developing two or more additional economic scenarios and considering the relative probabilities of each outcome. External information includes economic data and forecasts published by governmental bodies and monetary authorities in the countries where the Group operates, supranational organisations such as the Organisation for Economic Co-operation and Development and the International Monetary Fund, and selected private-sector and academic forecasters.
The base case represents a best estimate and is aligned with information used by the Group for other purposes, such as strategic planning and budgeting. The other scenarios represent more optimistic and more pessimistic outcomes. The Group also periodically carries out stress-testing of more extreme shocks to calibrate its determination of these other representative scenarios.
Intr
oduc
tion
Aud
itor
s’ r
epor
tPr
imar
y st
atem
ents
NO
TE
SFu
rthe
r re
sour
ces
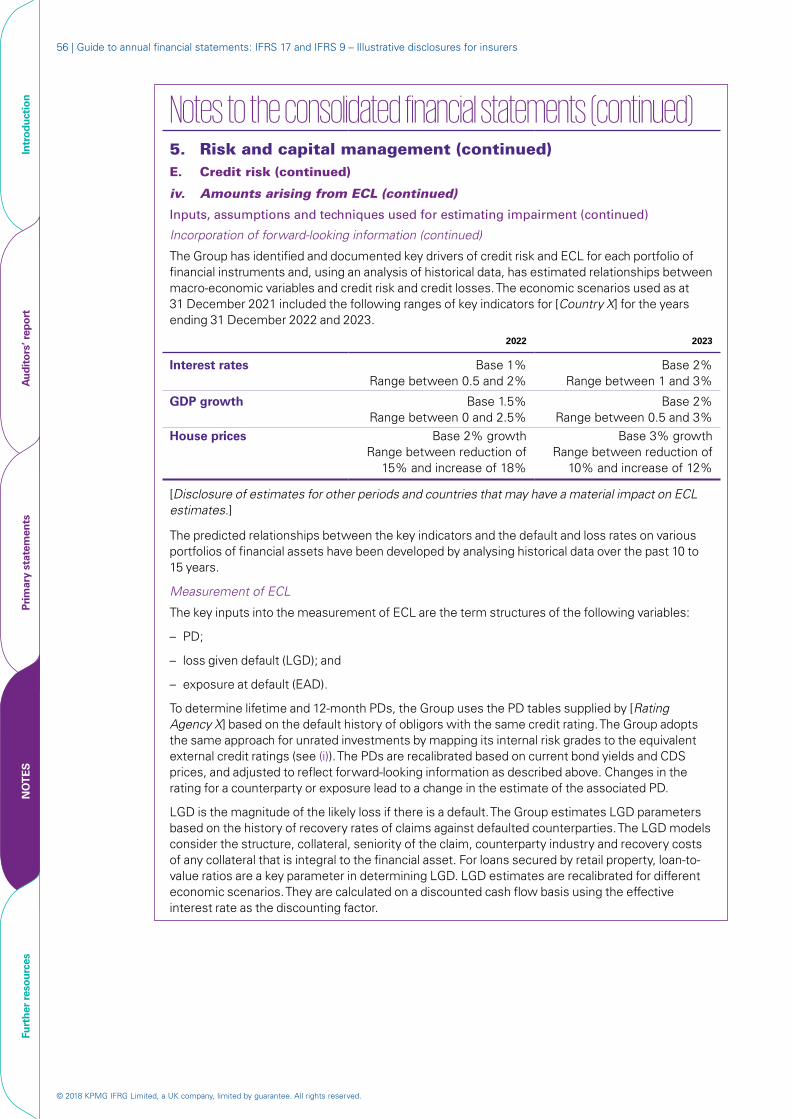
© 2018 KPMG IFRG Limited, a UK company, limited by guarantee. All rights reserved.
56 | Guide to annual financial statements: IFRS 17 and IFRS 9 – Illustrative disclosures for insurers
Notes to the consolidated financial statements (continued) 5. Risk and capital management (continued)E. Credit risk (continued)
iv. Amounts arising from ECL (continued)
Inputs, assumptions and techniques used for estimating impairment (continued)
Incorporation of forward-looking information (continued)
The Group has identified and documented key drivers of credit risk and ECL for each portfolio of financial instruments and, using an analysis of historical data, has estimated relationships between macro-economic variables and credit risk and credit losses. The economic scenarios used as at 31 December 2021 included the following ranges of key indicators for [Country X] for the years ending 31 December 2022 and 2023.
2022 2023
Interest rates Base 1%Range between 0.5 and 2%
Base 2%Range between 1 and 3%
GDP growth Base 1.5%Range between 0 and 2.5%
Base 2%Range between 0.5 and 3%
House prices Base 2% growthRange between reduction of
15% and increase of 18%
Base 3% growthRange between reduction of
10% and increase of 12%
[Disclosure of estimates for other periods and countries that may have a material impact on ECL estimates.]
The predicted relationships between the key indicators and the default and loss rates on various portfolios of financial assets have been developed by analysing historical data over the past 10 to 15 years.
Measurement of ECL
The key inputs into the measurement of ECL are the term structures of the following variables:
– PD;
– loss given default (LGD); and
– exposure at default (EAD).
To determine lifetime and 12-month PDs, the Group uses the PD tables supplied by [Rating Agency X] based on the default history of obligors with the same credit rating. The Group adopts the same approach for unrated investments by mapping its internal risk grades to the equivalent external credit ratings (see (i)). The PDs are recalibrated based on current bond yields and CDS prices, and adjusted to reflect forward-looking information as described above. Changes in the rating for a counterparty or exposure lead to a change in the estimate of the associated PD.
LGD is the magnitude of the likely loss if there is a default. The Group estimates LGD parameters based on the history of recovery rates of claims against defaulted counterparties. The LGD models consider the structure, collateral, seniority of the claim, counterparty industry and recovery costs of any collateral that is integral to the financial asset. For loans secured by retail property, loan-to-value ratios are a key parameter in determining LGD. LGD estimates are recalibrated for different economic scenarios. They are calculated on a discounted cash flow basis using the effective interest rate as the discounting factor.
Intr
oduc
tion
Aud
itor
s’ r
epor
tPr
imar
y st
atem
ents
NO
TE
SFu
rthe
r re
sour
ces

© 2018 KPMG IFRG Limited, a UK company, limited by guarantee. All rights reserved.
Illustrative disclosures – Notes 57Risk, capital and fair values
Notes to the consolidated financial statements (continued)5. Risk and capital management (continued)E. Credit risk (continued)
iv. Amounts arising from ECL (continued)
Inputs, assumptions and techniques used for estimating impairment (continued)
Measurement of ECL (continued)
EAD represents the expected exposure in the event of a default. The Group derives the EAD from the current exposure to the counterparty and potential changes to the current amount allowed under the contract, including amortisation, and prepayments. The EAD of a financial asset is its gross carrying amount.
[IFRS 9.5.5.19, B5.5.38]
As described above, and subject to using a maximum of a 12-month PD for financial assets for which credit risk has not significantly increased, the Group measures ECL considering the risk of default over the maximum contractual period (including any borrower’s extension options) over which it is exposed to credit risk, even if, for risk management purposes, the Group considers a longer period.
IFRS 7.35F(c) Where modelling of a parameter is carried out on a collective basis, the financial instruments are grouped on the basis of shared risk characteristics, which include:
– instrument type;
– credit risk gradings;
– collateral type;
– date of initial recognition;
– remaining term to maturity;
– industry; and
– geographic location of the borrower.
The groupings are subject to regular review to ensure that exposures within a particular group remain appropriately homogeneous.
When ECL are measured using parameters based on collective modelling, a significant input into the measurement of ECL is the external benchmark information that the Group uses to derive the default rates of its portfolios. This includes the PDs provided in the [Rating Agency X] default study and the LGDs provided in the [Rating Agency Y] recovery studies.
Operating lease receivablesIFRS 7.35B(a), 35F(c), 35G(a)(i), (b)
The ECL of operating lease receivables are determined at country level using a provision matrix. Loss rates are calculated with reference to days past due and actual credit loss experience over the past five years and are multiplied by scalar factors to incorporate forward-looking information.
Intr
oduc
tion
Aud
itor
s’ r
epor
tPr
imar
y st
atem
ents
NO
TE
SFu
rthe
r re
sour
ces
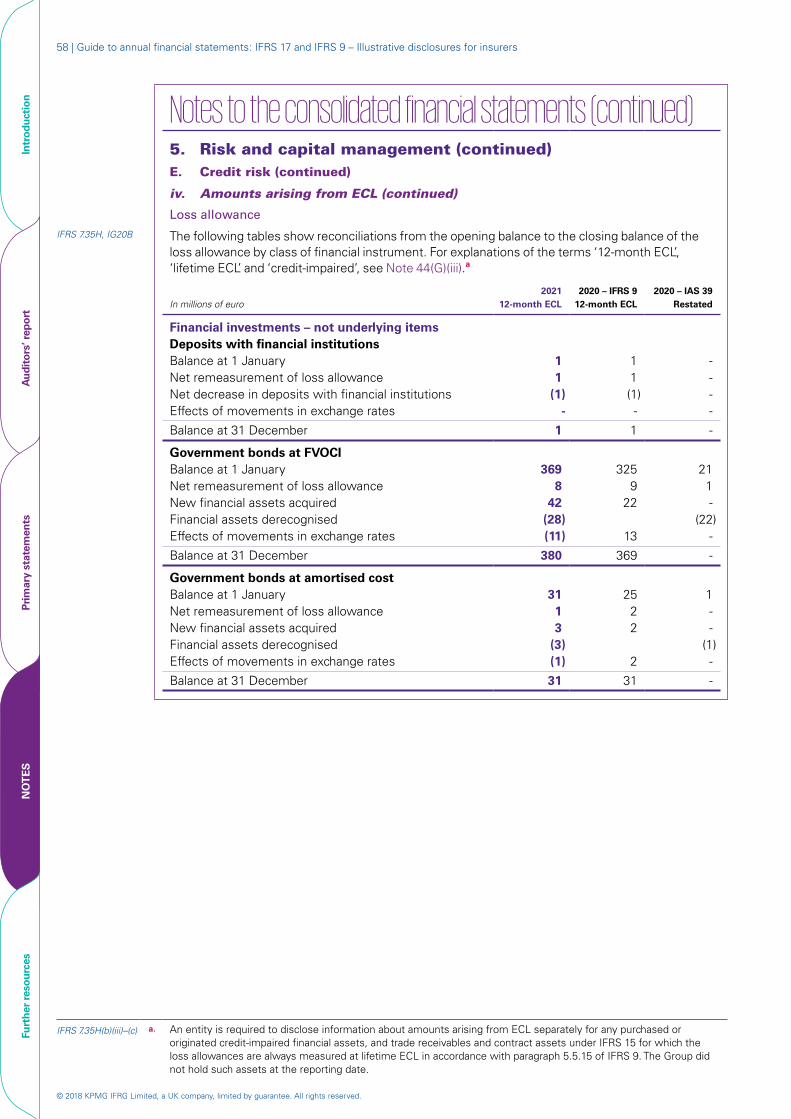
© 2018 KPMG IFRG Limited, a UK company, limited by guarantee. All rights reserved.
58 | Guide to annual financial statements: IFRS 17 and IFRS 9 – Illustrative disclosures for insurers
Notes to the consolidated financial statements (continued)5. Risk and capital management (continued)E. Credit risk (continued)
iv. Amounts arising from ECL (continued)
Loss allowance
IFRS 7.35H, IG20B The following tables show reconciliations from the opening balance to the closing balance of the loss allowance by class of financial instrument. For explanations of the terms ‘12-month ECL’, ‘lifetime ECL’ and ‘credit-impaired’, see Note 44(G)(iii).a
In millions of euro2021
12-month ECL2020 – IFRS 9
12-month ECL2020 – IAS 39
Restated
Financial investments – not underlying itemsDeposits with financial institutionsBalance at 1 January 1 1 -Net remeasurement of loss allowance 1 1 -Net decrease in deposits with financial institutions (1) (1) -Effects of movements in exchange rates - - -
Balance at 31 December 1 1 -
Government bonds at FVOCIBalance at 1 January 369 325 21Net remeasurement of loss allowance 8 9 1New financial assets acquired 42 22 -Financial assets derecognised (28) (22)Effects of movements in exchange rates (11) 13 -
Balance at 31 December 380 369 -
Government bonds at amortised costBalance at 1 January 31 25 1Net remeasurement of loss allowance 1 2 -New financial assets acquired 3 2 -Financial assets derecognised (3) (1)Effects of movements in exchange rates (1) 2 -
Balance at 31 December 31 31 -
IFRS 7.35H(b)(iii)–(c) a. An entity is required to disclose information about amounts arising from ECL separately for any purchased or originated credit-impaired financial assets, and trade receivables and contract assets under IFRS 15 for which the loss allowances are always measured at lifetime ECL in accordance with paragraph 5.5.15 of IFRS 9. The Group did not hold such assets at the reporting date.
Intr
oduc
tion
Aud
itor
s’ r
epor
tPr
imar
y st
atem
ents
NO
TE
SFu
rthe
r re
sour
ces

© 2018 KPMG IFRG Limited, a UK company, limited by guarantee. All rights reserved.
Illustrative disclosures – Notes 59Risk, capital and fair values
Notes to the consolidated financial statements (continued)5. Risk and capital management (continued)E. Credit risk (continued)
iv. Amounts arising from ECL (continued)
Loss allowance (continued)
2021 2020 – IFRS 92020 – IAS 39
In millions of euro12-month
ECL
Lifetime ECL not
credit-impaired
Lifetime ECL
credit-impaired Total
12-month ECL
Lifetime ECL not
credit-impaired
Lifetime ECL
credit-impaired Total Restated
Financial investments – not underlying items (continued)Other debt securities at FVOCIBalance at
1 January 878 624 1,371
2,873 821 607 1,154 2,582 101Transfer to
12-month ECL 75 (75) - - 72 (72) - - Transfer to
lifetime ECL not credit-impaired (97) 193 (96) - (88) 163 (75) -
Transfer to lifetime ECL credit-impaired (12) (98) 110 - (15) (149) 164 -
Net remeasure- ment of loss allowance 21 68 114 203 25 66 106 197 40
New financial assets acquired 62 - - 62 49 - - 49 -
Financial assets derecognised (42) (46) (75) (163) (116)
Write-offs - - (26) (26) (25)Effects of
movements in exchange rates (12) (8) (18) (38) 14 9 22 45 -
Balance at 31 December 873 658 1,380 2,911 878 624 1,371 2,873 -
Intr
oduc
tion
Aud
itor
s’ r
epor
tPr
imar
y st
atem
ents
NO
TE
SFu
rthe
r re
sour
ces
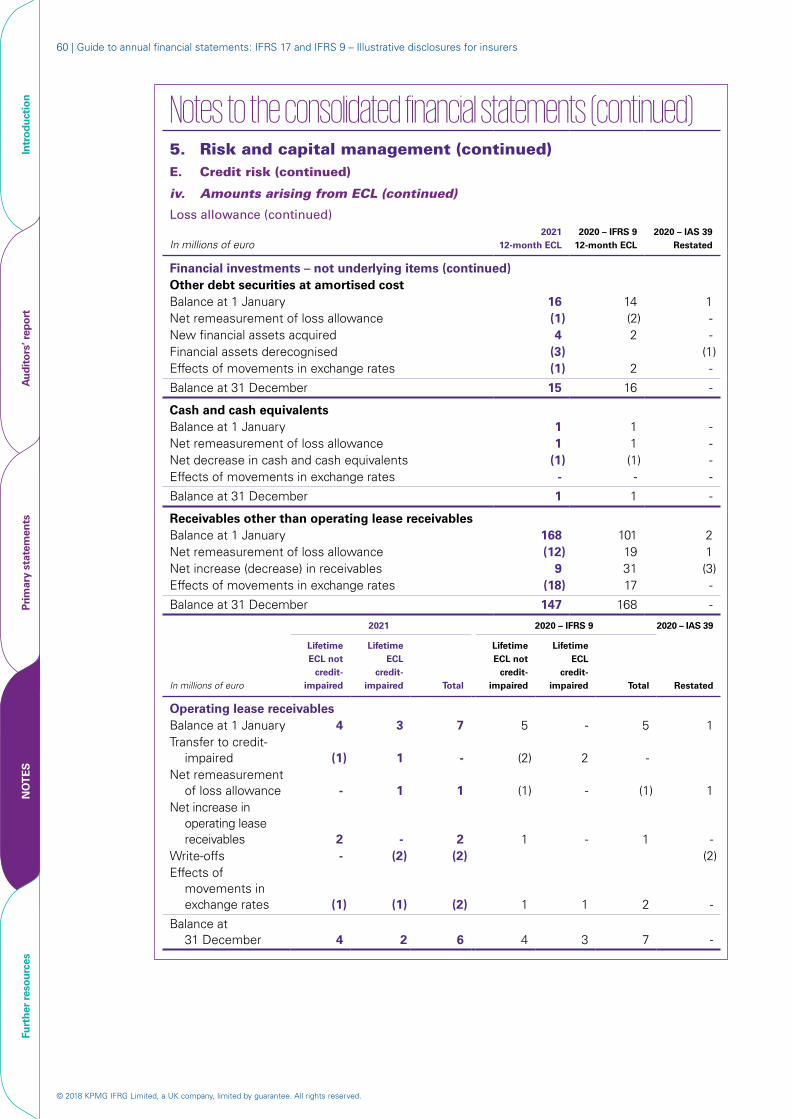
© 2018 KPMG IFRG Limited, a UK company, limited by guarantee. All rights reserved.
60 | Guide to annual financial statements: IFRS 17 and IFRS 9 – Illustrative disclosures for insurers
Notes to the consolidated financial statements (continued)5. Risk and capital management (continued)E. Credit risk (continued)
iv. Amounts arising from ECL (continued)
Loss allowance (continued)
In millions of euro2021
12-month ECL2020 – IFRS 9
12-month ECL2020 – IAS 39
Restated
Financial investments – not underlying items (continued)Other debt securities at amortised costBalance at 1 January 16 14 1Net remeasurement of loss allowance (1) (2) -New financial assets acquired 4 2 -Financial assets derecognised (3) (1)Effects of movements in exchange rates (1) 2 -
Balance at 31 December 15 16 -
Cash and cash equivalentsBalance at 1 January 1 1 -Net remeasurement of loss allowance 1 1 -Net decrease in cash and cash equivalents (1) (1) -Effects of movements in exchange rates - - -
Balance at 31 December 1 1 -
Receivables other than operating lease receivablesBalance at 1 January 168 101 2Net remeasurement of loss allowance (12) 19 1Net increase (decrease) in receivables 9 31 (3)Effects of movements in exchange rates (18) 17 -
Balance at 31 December 147 168 -
2021 2020 – IFRS 9 2020 – IAS 39
In millions of euro
Lifetime ECL not
credit-impaired
Lifetime ECL
credit-impaired Total
Lifetime ECL not
credit-impaired
Lifetime ECL
credit-impaired Total
Restated
Operating lease receivablesBalance at 1 January 4 3 7 5 - 5 1Transfer to credit-
impaired (1) 1 - (2) 2 -Net remeasurement
of loss allowance - 1 1 (1) - (1) 1Net increase in
operating lease receivables 2 - 2 1 - 1 -
Write-offs - (2) (2) (2)Effects of
movements in exchange rates (1) (1) (2) 1 1 2 -
Balance at 31 December 4 2 6 4 3 7 -
Intr
oduc
tion
Aud
itor
s’ r
epor
tPr
imar
y st
atem
ents
NO
TE
SFu
rthe
r re
sour
ces
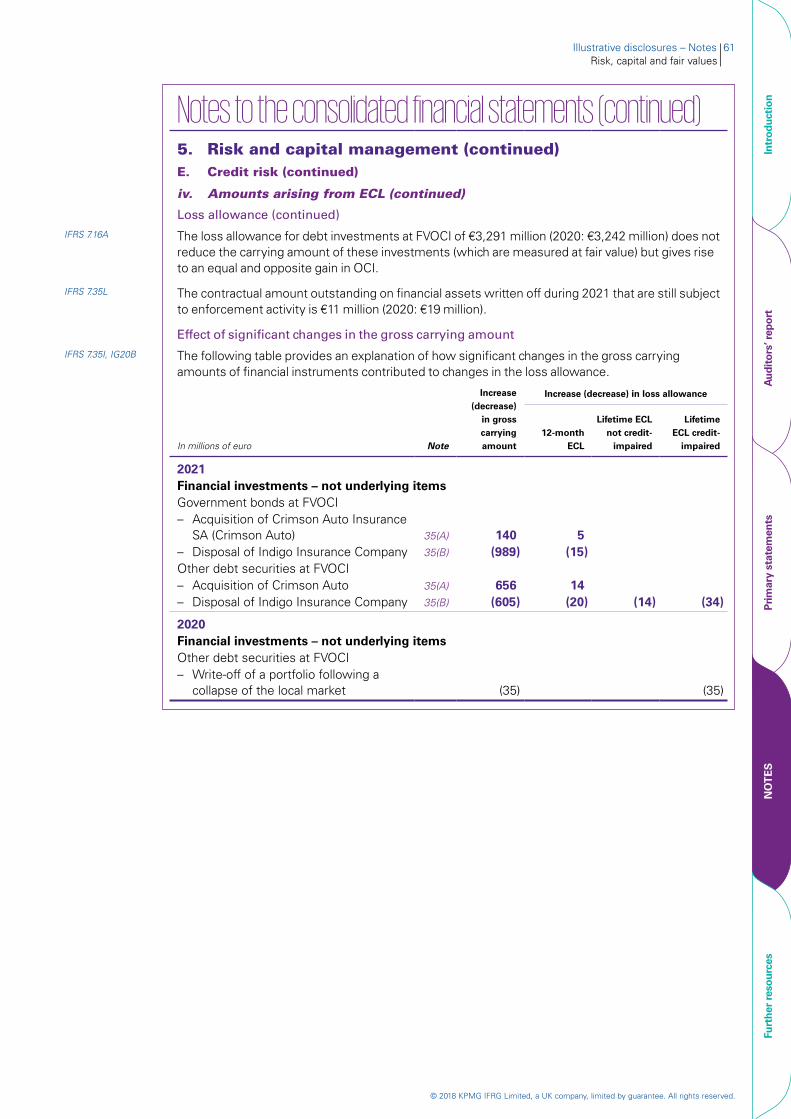
© 2018 KPMG IFRG Limited, a UK company, limited by guarantee. All rights reserved.
Illustrative disclosures – Notes 61Risk, capital and fair values
Notes to the consolidated financial statements (continued)5. Risk and capital management (continued)E. Credit risk (continued)
iv. Amounts arising from ECL (continued)
Loss allowance (continued)
IFRS 7.16A The loss allowance for debt investments at FVOCI of €3,291 million (2020: €3,242 million) does not reduce the carrying amount of these investments (which are measured at fair value) but gives rise to an equal and opposite gain in OCI.
IFRS 7.35L The contractual amount outstanding on financial assets written off during 2021 that are still subject to enforcement activity is €11 million (2020: €19 million).
Effect of significant changes in the gross carrying amount
IFRS 7.35I, IG20B The following table provides an explanation of how significant changes in the gross carrying amounts of financial instruments contributed to changes in the loss allowance.
Increase (decrease)
in gross carrying amount
Increase (decrease) in loss allowance
In millions of euro Note12-month
ECL
Lifetime ECL not credit-
impaired
Lifetime ECL credit-
impaired
2021Financial investments – not underlying itemsGovernment bonds at FVOCI– Acquisition of Crimson Auto Insurance
SA (Crimson Auto) 35(A) 140 5– Disposal of Indigo Insurance Company 35(B) (989) (15)Other debt securities at FVOCI– Acquisition of Crimson Auto 35(A) 656 14– Disposal of Indigo Insurance Company 35(B) (605) (20) (14) (34)
2020Financial investments – not underlying itemsOther debt securities at FVOCI– Write-off of a portfolio following a
collapse of the local market (35) (35)
Intr
oduc
tion
Aud
itor
s’ r
epor
tPr
imar
y st
atem
ents
NO
TE
SFu
rthe
r re
sour
ces
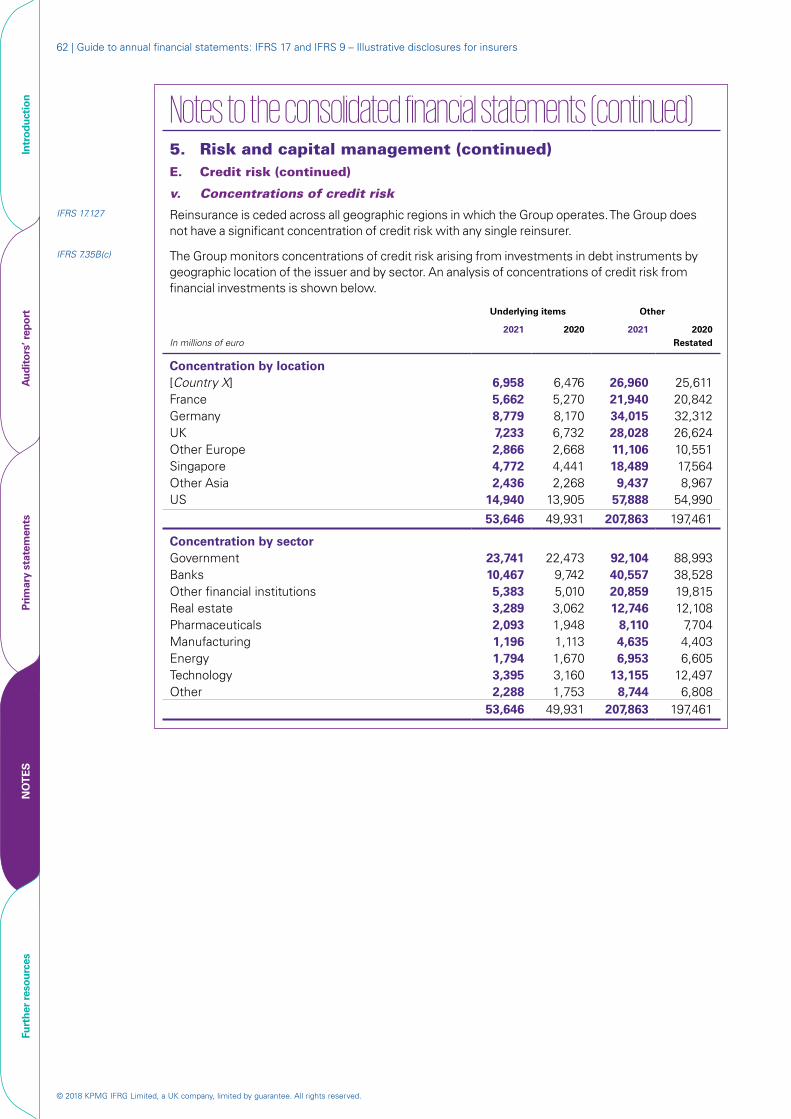
© 2018 KPMG IFRG Limited, a UK company, limited by guarantee. All rights reserved.
62 | Guide to annual financial statements: IFRS 17 and IFRS 9 – Illustrative disclosures for insurers
Notes to the consolidated financial statements (continued)5. Risk and capital management (continued)E. Credit risk (continued)
v. Concentrations of credit riskIFRS 17.127 Reinsurance is ceded across all geographic regions in which the Group operates. The Group does
not have a significant concentration of credit risk with any single reinsurer.
IFRS 7.35B(c) The Group monitors concentrations of credit risk arising from investments in debt instruments by geographic location of the issuer and by sector. An analysis of concentrations of credit risk from financial investments is shown below.
Underlying items Other
In millions of euro2021 2020 2021 2020
Restated
Concentration by location[Country X] 6,958 6,476 26,960 25,611 France 5,662 5,270 21,940 20,842 Germany 8,779 8,170 34,015 32,312 UK 7,233 6,732 28,028 26,624 Other Europe 2,866 2,668 11,106 10,551 Singapore 4,772 4,441 18,489 17,564 Other Asia 2,436 2,268 9,437 8,967 US 14,940 13,905 57,888 54,990
53,646 49,931 207,863 197,461
Concentration by sectorGovernment 23,741 22,473 92,104 88,993 Banks 10,467 9,742 40,557 38,528 Other financial institutions 5,383 5,010 20,859 19,815 Real estate 3,289 3,062 12,746 12,108 Pharmaceuticals 2,093 1,948 8,110 7,704 Manufacturing 1,196 1,113 4,635 4,403 Energy 1,794 1,670 6,953 6,605 Technology 3,395 3,160 13,155 12,497 Other 2,288 1,753 8,744 6,808
53,646 49,931 207,863 197,461
Intr
oduc
tion
Aud
itor
s’ r
epor
tPr
imar
y st
atem
ents
NO
TE
SFu
rthe
r re
sour
ces
© 2018 KPMG IFRG Limited, a UK company, limited by guarantee. All rights reserved.
Illustrative disclosures – Notes 63Risk, capital and fair values
Notes to the consolidated financial statements (continued)5. Risk and capital management (continued)F. Liquidity risk
IFRS 7.33(a), 17.124(a), [IFRS 7.A]
Liquidity risk is the risk that the Group will encounter difficulty in meeting the obligations associated with its insurance and reinsurance contracts and financial liabilities that are settled in cash or other financial assets.
i. Management of liquidity riskIFRS 7.33(b), 17.124(b) The board of directors sets the Group’s strategy for managing liquidity risk and delegates
responsibility for oversight of the implementation of this policy to ALCO, which approves the Group’s liquidity policies and procedures. Group treasury, located in the Group’s head office and the Asia and US regional offices, manages the Group’s liquidity position on a day-to-day basis, including monitoring local business units’ liquidity positions. Summary reports, including any exceptions and remedial action taken, are regularly submitted to ALCO.
IFRS 7.39(c), 17.132(a) The Group’s objective in managing liquidity risk is to ensure, as far as possible, that it will always have sufficient liquidity to meet its liabilities when they are due, under both normal and stressed conditions. The key elements of the Group’s liquidity strategy are as follows.
– Maintaining a diversified funding base and appropriate contingency facilities.
– Carrying a portfolio of highly liquid assets that can be readily converted into cash to protect against unforeseen short-term interruptions to cash flows.
– Matching, to the maximum extent possible, the cash flows of the Group’s financial assets with the cash flows of insurance and investment contracts and other financial liabilities.
– Monitoring liquidity ratios and carrying out stress-testing of the Group’s liquidity position.
Group treasury maintains a pool of short-term liquid assets that is intended to provide sufficient liquidity in the Group as a whole to cover short-term fluctuations in the liquidity requirements of any business units. Longer-term funding is used to manage structural liquidity requirements.
Regular liquidity stress-testing is conducted under a variety of scenarios, covering both normal and more severe market conditions. The scenarios are developed taking into account both Group-specific events (e.g. a rating downgrade) and market-related events (e.g. prolonged market illiquidity, natural disasters or other catastrophes).
IFRS 7.B11F, IAS 7.50(a) In addition, the Group maintains significant undrawn committed banking facilities, as follows.
– €2,000 million unsecured overdraft facilities, which can be drawn at any time and are reviewed annually. Interest would be payable at the rate of Euribor plus 1.5% (2020: Euribor plus 1.6%).
– €4,500 million undrawn committed borrowing facilities that can be drawn at any time to meet short-term financing needs, as long as the Group has maintained satisfactory credit ratings. The facilities have a 30-day maturity that renews automatically at the option of the Group. Interest would be payable at a rate of Euribor plus 1.0% (2020: Euribor plus 1.1%).
Intr
oduc
tion
Aud
itor
s’ r
epor
tPr
imar
y st
atem
ents
NO
TE
SFu
rthe
r re
sour
ces
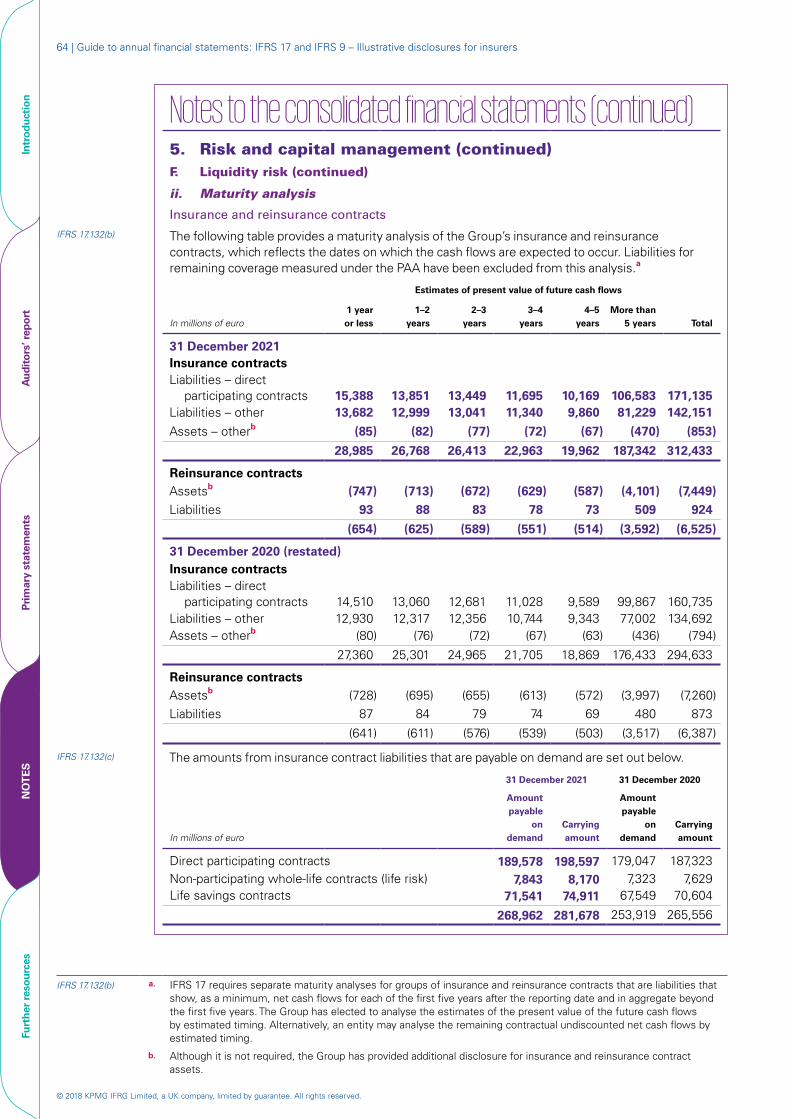
© 2018 KPMG IFRG Limited, a UK company, limited by guarantee. All rights reserved.
64 | Guide to annual financial statements: IFRS 17 and IFRS 9 – Illustrative disclosures for insurers
Notes to the consolidated financial statements (continued)5. Risk and capital management (continued)F. Liquidity risk (continued)
ii. Maturity analysis
Insurance and reinsurance contracts
IFRS 17.132(b) The following table provides a maturity analysis of the Group’s insurance and reinsurance contracts, which reflects the dates on which the cash flows are expected to occur. Liabilities for remaining coverage measured under the PAA have been excluded from this analysis.a
Estimates of present value of future cash flows
In millions of euro1 year or less
1–2 years
2–3 years
3–4 years
4–5 years
More than 5 years Total
31 December 2021Insurance contractsLiabilities – direct
participating contracts 15,388 13,851 13,449 11,695 10,169 106,583 171,135Liabilities – other 13,682 12,999 13,041 11,340 9,860 81,229 142,151
Assets – otherb (85) (82) (77) (72) (67) (470) (853)
28,985 26,768 26,413 22,963 19,962 187,342 312,433
Reinsurance contractsAssetsb (747) (713) (672) (629) (587) (4,101) (7,449)Liabilities 93 88 83 78 73 509 924
(654) (625) (589) (551) (514) (3,592) (6,525)
31 December 2020 (restated)Insurance contractsLiabilities – direct
participating contracts 14,510 13,060 12,681 11,028 9,589 99,867 160,735 Liabilities – other 12,930 12,317 12,356 10,744 9,343 77,002 134,692 Assets – otherb (80) (76) (72) (67) (63) (436) (794)
27,360 25,301 24,965 21,705 18,869 176,433 294,633
Reinsurance contractsAssetsb (728) (695) (655) (613) (572) (3,997) (7,260)Liabilities 87 84 79 74 69 480 873
(641) (611) (576) (539) (503) (3,517) (6,387)
IFRS 17.132(c) The amounts from insurance contract liabilities that are payable on demand are set out below.
31 December 2021 31 December 2020
In millions of euro
Amount payable
on demand
Carrying amount
Amount payable
on demand
Carrying amount
Direct participating contracts 189,578 198,597 179,047 187,323Non-participating whole-life contracts (life risk) 7,843 8,170 7,323 7,629Life savings contracts 71,541 74,911 67,549 70,604
268,962 281,678 253,919 265,556
IFRS 17.132(b) a. IFRS 17 requires separate maturity analyses for groups of insurance and reinsurance contracts that are liabilities that show, as a minimum, net cash flows for each of the first five years after the reporting date and in aggregate beyond the first five years. The Group has elected to analyse the estimates of the present value of the future cash flows by estimated timing. Alternatively, an entity may analyse the remaining contractual undiscounted net cash flows by estimated timing.
b. Although it is not required, the Group has provided additional disclosure for insurance and reinsurance contract assets.
Intr
oduc
tion
Aud
itor
s’ r
epor
tPr
imar
y st
atem
ents
NO
TE
SFu
rthe
r re
sour
ces
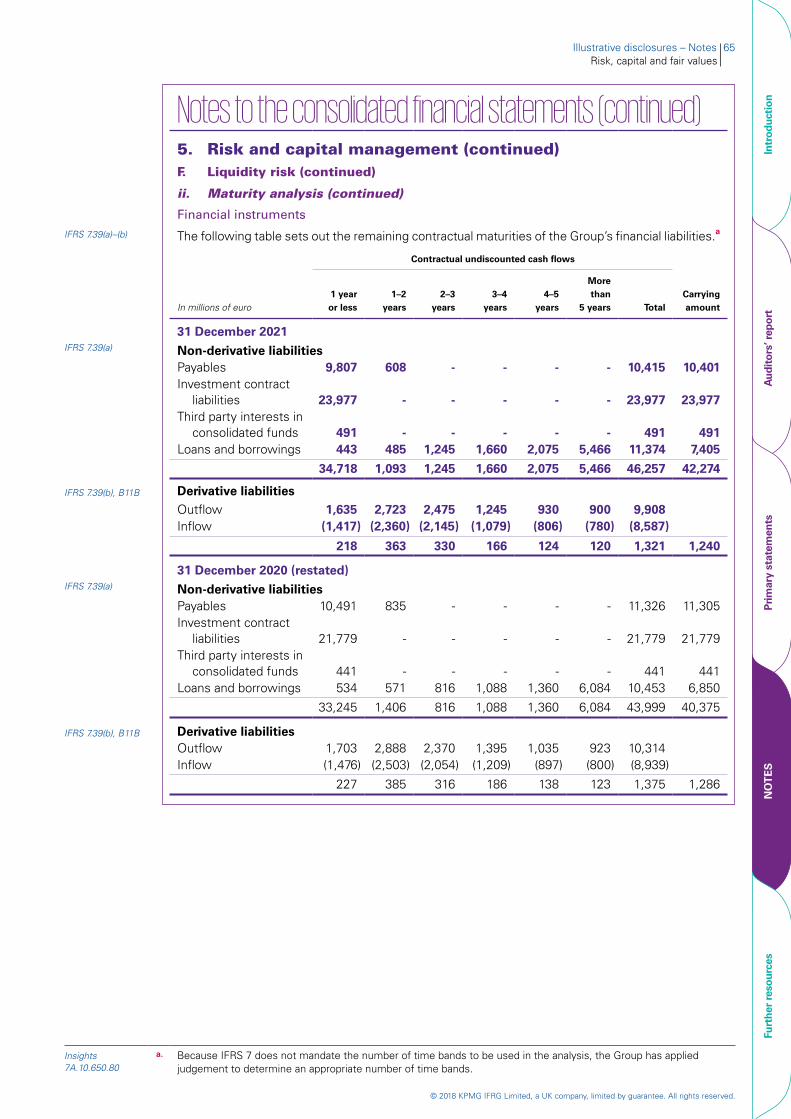
© 2018 KPMG IFRG Limited, a UK company, limited by guarantee. All rights reserved.
Illustrative disclosures – Notes 65Risk, capital and fair values
Notes to the consolidated financial statements (continued)5. Risk and capital management (continued)F. Liquidity risk (continued)
ii. Maturity analysis (continued)
Financial instruments
IFRS 7.39(a)–(b) The following table sets out the remaining contractual maturities of the Group’s financial liabilities.a
Contractual undiscounted cash flows
Carrying amountIn millions of euro
1 year or less
1–2 years
2–3 years
3–4 years
4–5 years
More than
5 years Total
31 December 2021IFRS 7.39(a) Non-derivative liabilities
Payables 9,807 608 - - - - 10,415 10,401 Investment contract
liabilities 23,977 - - - - - 23,977 23,977 Third party interests in
consolidated funds 491 - - - - - 491 491 Loans and borrowings 443 485 1,245 1,660 2,075 5,466 11,374 7,405
34,718 1,093 1,245 1,660 2,075 5,466 46,257 42,274
IFRS 7.39(b), B11B Derivative liabilitiesOutflow 1,635 2,723 2,475 1,245 930 900 9,908Inflow (1,417) (2,360) (2,145) (1,079) (806) (780) (8,587)
218 363 330 166 124 120 1,321 1,240
31 December 2020 (restated)IFRS 7.39(a) Non-derivative liabilities
Payables 10,491 835 - - - - 11,326 11,305 Investment contract
liabilities
21,779 - - - - - 21,779 21,779 Third party interests in
consolidated funds 441 - - - - - 441 441 Loans and borrowings 534 571 816 1,088 1,360 6,084 10,453 6,850
33,245 1,406 816 1,088 1,360 6,084 43,999 40,375
IFRS 7.39(b), B11B Derivative liabilitiesOutflow 1,703 2,888 2,370 1,395 1,035 923 10,314Inflow (1,476) (2,503) (2,054) (1,209) (897) (800) (8,939)
227 385 316 186 138 123 1,375 1,286
Insights 7A.10.650.80
a. Because IFRS 7 does not mandate the number of time bands to be used in the analysis, the Group has applied judgement to determine an appropriate number of time bands.
Intr
oduc
tion
Aud
itor
s’ r
epor
tPr
imar
y st
atem
ents
NO
TE
SFu
rthe
r re
sour
ces
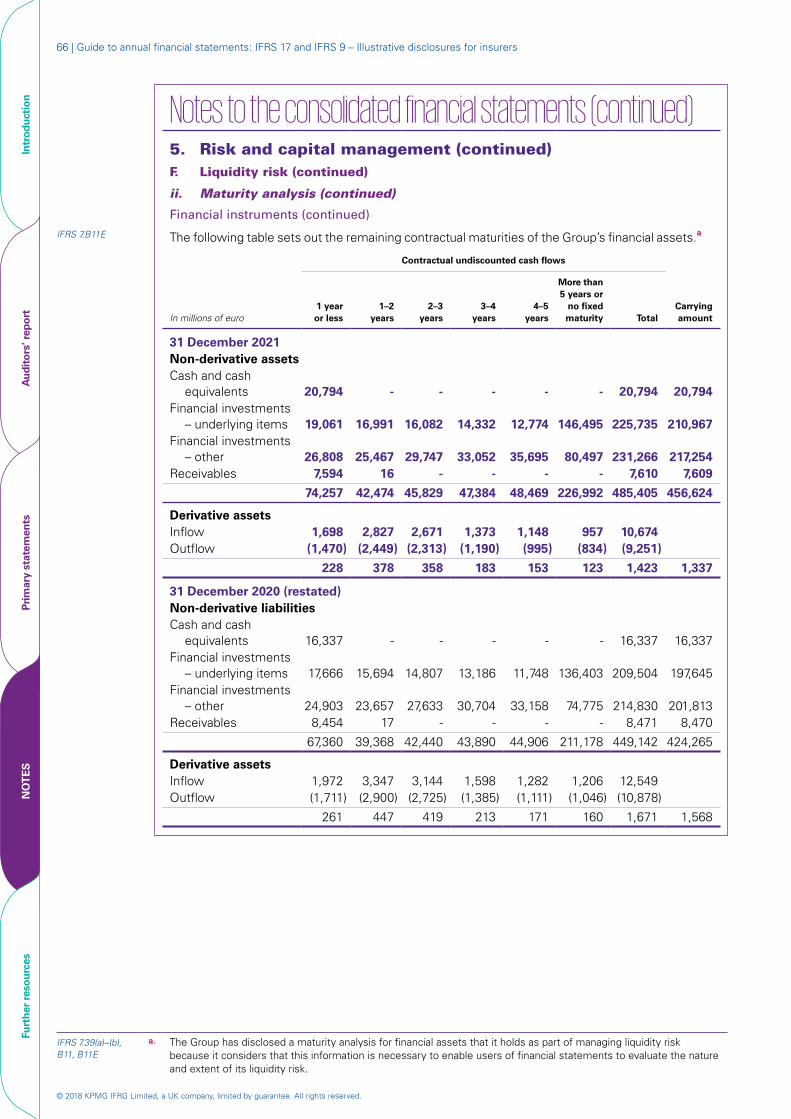
© 2018 KPMG IFRG Limited, a UK company, limited by guarantee. All rights reserved.
66 | Guide to annual financial statements: IFRS 17 and IFRS 9 – Illustrative disclosures for insurers
Notes to the consolidated financial statements (continued)5. Risk and capital management (continued)F. Liquidity risk (continued)
ii. Maturity analysis (continued)
Financial instruments (continued)
IFRS 7.B11E The following table sets out the remaining contractual maturities of the Group’s financial assets.a
Contractual undiscounted cash flows
Carrying amountIn millions of euro
1 year or less
1–2 years
2–3 years
3–4 years
4–5 years
More than 5 years or
no fixed maturity Total
31 December 2021Non-derivative assetsCash and cash
equivalents 20,794 - - - - - 20,794 20,794 Financial investments
– underlying items 19,061 16,991 16,082 14,332 12,774 146,495 225,735 210,967 Financial investments
– other 26,808 25,467 29,747 33,052 35,695 80,497 231,266 217,254 Receivables 7,594 16 - - - - 7,610 7,609
74,257 42,474 45,829 47,384 48,469 226,992 485,405 456,624
Derivative assetsInflow 1,698 2,827 2,671 1,373 1,148 957 10,674 Outflow (1,470) (2,449) (2,313) (1,190) (995) (834) (9,251)
228 378 358 183 153 123 1,423 1,337
31 December 2020 (restated)Non-derivative liabilitiesCash and cash
equivalents 16,337 - - - - - 16,337 16,337Financial investments
– underlying items 17,666 15,694 14,807 13,186 11,748 136,403 209,504 197,645 Financial investments
– other 24,903 23,657 27,633 30,704 33,158 74,775 214,830 201,813 Receivables 8,454 17 - - - - 8,471 8,470
67,360 39,368 42,440 43,890 44,906 211,178 449,142 424,265
Derivative assetsInflow 1,972 3,347 3,144 1,598 1,282 1,206 12,549 Outflow (1,711) (2,900) (2,725) (1,385) (1,111) (1,046) (10,878)
261 447 419 213 171 160 1,671 1,568
IFRS 7.39(a)–(b), B11, B11E
a. The Group has disclosed a maturity analysis for financial assets that it holds as part of managing liquidity risk because it considers that this information is necessary to enable users of financial statements to evaluate the nature and extent of its liquidity risk.
Intr
oduc
tion
Aud
itor
s’ r
epor
tPr
imar
y st
atem
ents
NO
TE
SFu
rthe
r re
sour
ces
© 2018 KPMG IFRG Limited, a UK company, limited by guarantee. All rights reserved.
Illustrative disclosures – Notes 67Risk, capital and fair values
Notes to the consolidated financial statements (continued)5. Risk and capital management (continued)F. Liquidity risk (continued)
ii. Maturity analysis (continued)
Financial instruments (continued)
The amounts in the tables above have been compiled as follows.
Non-derivativesIFRS 7.B11D The amounts are the gross contractual undiscounted cash flows, which include estimated interest
payments. The interest on floating-rate instruments reflects the market forward interest rates at the reporting date, which may change as market interest rates change.a, b
IFRS 7.B11C(a) Financial liabilities are allocated to the earliest period in which the Group could be required to pay. Investment contract liabilities and third party interests in consolidated funds are immediately payable on demand, because each holder has an option to surrender the investment contract or to redeem units in the consolidated funds at any time. Accordingly, these amounts have been included in the earliest time band. Most of the underlying assets are either cash and cash equivalents or liquid investments that can be converted into cash at short notice.
For perpetual debt securities, the contractual par amount has been included in the ‘more than 5 years’ column; interest has been included in the analysis up to 15 years after the reporting date.
Derivatives
IFRS 7.B11D The amounts disclosed represent the contractual undiscounted cash flows, being the gross nominal inflows and outflows for derivatives that have simultaneous gross settlement – e.g. foreign exchange forward contracts and currency swaps – and the net amounts for derivatives that are settled net. They are estimated based on relevant market rates at the reporting date.
Insights 7A.10.650.70
a. The Group has included both the interest and principal cash flows in the analysis. In our view, this best represents the liquidity risk being faced by the Group.
Insights 7A.10.650.110
b. When the amount payable is not fixed, the amount to be disclosed is determined with reference to conditions existing at the reporting date. For example, for a floating-rate bond with interest payments indexed to three-month Euribor, in our view the amount to be disclosed should be based on forward rates rather than spot rates prevailing at the reporting date because the spot interest rates do not represent the level of the index based on which the cash flows will be payable. The forward interest rates better describe the level of the index in accordance with the conditions existing at the reporting date.
Intr
oduc
tion
Aud
itor
s’ r
epor
tPr
imar
y st
atem
ents
NO
TE
SFu
rthe
r re
sour
ces
© 2018 KPMG IFRG Limited, a UK company, limited by guarantee. All rights reserved.
68 | Guide to annual financial statements: IFRS 17 and IFRS 9 – Illustrative disclosures for insurers
Notes to the consolidated financial statements (continued)5. Risk and capital management (continued)G. Operational riska
Operational risk is the risk of direct or indirect loss arising from a wide variety of causes associated with the Group’s processes, personnel, technology and infrastructure, and from external factors other than credit, market and liquidity risks, such as the risks of mis-selling of products, modelling errors and non-compliance with legal and regulatory requirements and generally accepted standards of corporate behaviour. Operational risks arise from all of the Group’s operations.
The Group’s objective in managing operational risk is to balance the avoidance of financial losses and damage to the Group’s reputation with overall cost-effectiveness and innovation. In all cases, Group policy requires compliance with all applicable legal and regulatory requirements.
The board of directors has delegated responsibility for operational risk to the Group risk committee, which is responsible for the development and implementation of controls to address operational risk. This responsibility is supported by the development of overall Group standards for the management of operational risk in the following areas:
– requirements for appropriate segregation of duties, including the independent authorisation of transactions;
– requirements for the reconciliation and monitoring of transactions;
– compliance with regulatory and other legal requirements;
– documentation of controls and procedures;
– requirements for the periodic assessment of operational risks faced, and the adequacy of controls and procedures to address the risks identified;
– requirements for the reporting of operational losses and proposed remedial action;
– development of contingency plans;
– training and professional development;
– ethical and business standards; and
– risk mitigation, including insurance where this is cost-effective.
Compliance with Group standards is supported by a programme of periodic reviews undertaken by internal audit. The results of internal audit reviews are discussed with the Group risk committee, with summaries submitted to the Group’s audit committee and senior management.
IAS 1.134 H. Capital managementb
i. Regulatory capital
IAS 1.135(a)(iii) The Group management committee uses regulatory capital ratios to monitor the Group’s capital base. The Group’s policy is to maintain a strong capital base to maintain investor, creditor and market confidence and to sustain the future development of the business. The Group recognises the impact of the level of capital on shareholders’ returns and the need to maintain a balance between the higher returns that might be possible with greater gearing and the advantages and security afforded by a stronger capital position.
a. Operational risk is not an insurance risk or a financial risk, and is not required to be disclosed by IFRS 17 or IFRS 7. However, operational risk in a financial institution is commonly managed and reported internally in a formal framework similar to insurance and financial risks, and may be a factor in capital allocation and regulation.
IFRS 17.126, IAS 1.134–136
b. Insurers are subject to specific local regulatory capital requirements. The example disclosures are not designed to comply with any particular regulatory framework.
The example disclosures presented in this guide assume that the primary basis for capital management and regulatory capital requirements are aligned. However, other presentations are possible.
Intr
oduc
tion
Aud
itor
s’ r
epor
tPr
imar
y st
atem
ents
NO
TE
SFu
rthe
r re
sour
ces
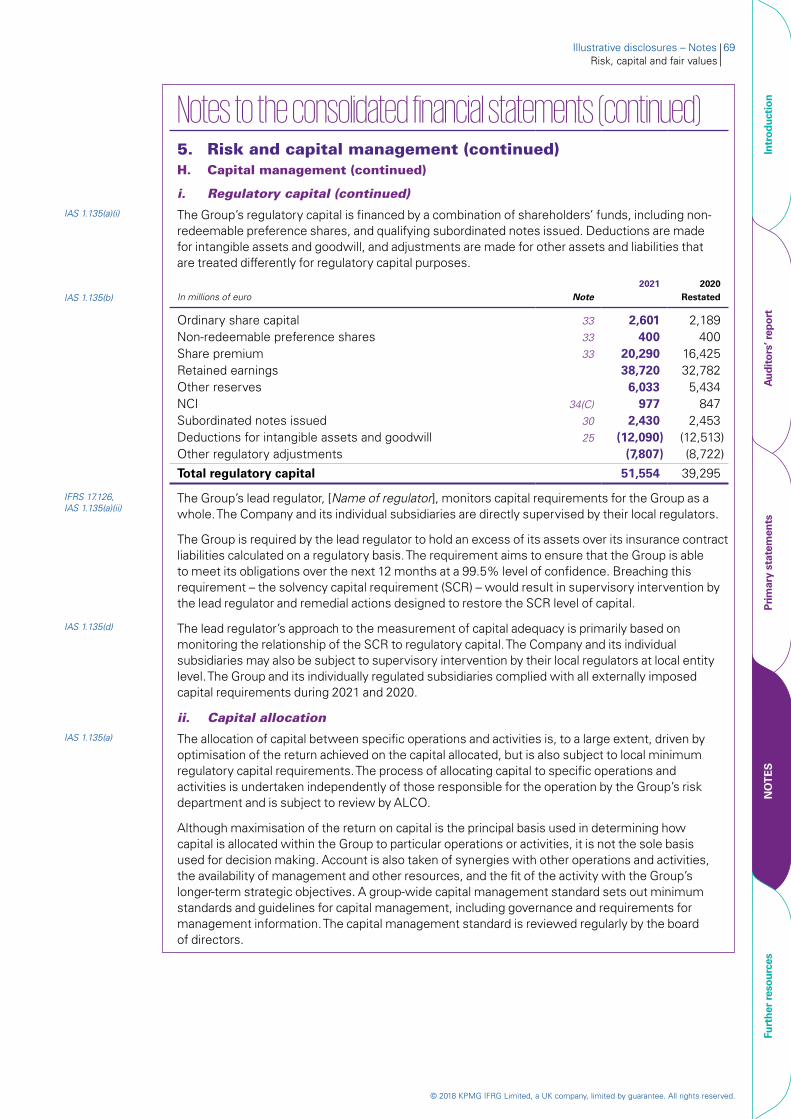
© 2018 KPMG IFRG Limited, a UK company, limited by guarantee. All rights reserved.
Illustrative disclosures – Notes 69Risk, capital and fair values
Notes to the consolidated financial statements (continued)5. Risk and capital management (continued)H. Capital management (continued)
i. Regulatory capital (continued)IAS 1.135(a)(i) The Group’s regulatory capital is financed by a combination of shareholders’ funds, including non-
redeemable preference shares, and qualifying subordinated notes issued. Deductions are made for intangible assets and goodwill, and adjustments are made for other assets and liabilities that are treated differently for regulatory capital purposes.
IAS 1.135(b) In millions of euro Note2021 2020
Restated
Ordinary share capital 33 2,601 2,189Non-redeemable preference shares 33 400 400 Share premium 33 20,290 16,425 Retained earnings 38,720 32,782Other reserves 6,033 5,434NCI 34(C) 977 847 Subordinated notes issued 30 2,430 2,453Deductions for intangible assets and goodwill 25 (12,090) (12,513)Other regulatory adjustments (7,807) (8,722)
Total regulatory capital 51,554 39,295
IFRS 17.126, IAS 1.135(a)(ii)
The Group’s lead regulator, [Name of regulator], monitors capital requirements for the Group as a whole. The Company and its individual subsidiaries are directly supervised by their local regulators.
The Group is required by the lead regulator to hold an excess of its assets over its insurance contract liabilities calculated on a regulatory basis. The requirement aims to ensure that the Group is able to meet its obligations over the next 12 months at a 99.5% level of confidence. Breaching this requirement – the solvency capital requirement (SCR) – would result in supervisory intervention by the lead regulator and remedial actions designed to restore the SCR level of capital.
IAS 1.135(d) The lead regulator’s approach to the measurement of capital adequacy is primarily based on monitoring the relationship of the SCR to regulatory capital. The Company and its individual subsidiaries may also be subject to supervisory intervention by their local regulators at local entity level. The Group and its individually regulated subsidiaries complied with all externally imposed capital requirements during 2021 and 2020.
ii. Capital allocationIAS 1.135(a) The allocation of capital between specific operations and activities is, to a large extent, driven by
optimisation of the return achieved on the capital allocated, but is also subject to local minimum regulatory capital requirements. The process of allocating capital to specific operations and activities is undertaken independently of those responsible for the operation by the Group’s risk department and is subject to review by ALCO.
Although maximisation of the return on capital is the principal basis used in determining how capital is allocated within the Group to particular operations or activities, it is not the sole basis used for decision making. Account is also taken of synergies with other operations and activities, the availability of management and other resources, and the fit of the activity with the Group’s longer-term strategic objectives. A group-wide capital management standard sets out minimum standards and guidelines for capital management, including governance and requirements for management information. The capital management standard is reviewed regularly by the board of directors.
Intr
oduc
tion
Aud
itor
s’ r
epor
tPr
imar
y st
atem
ents
NO
TE
SFu
rthe
r re
sour
ces
© 2018 KPMG IFRG Limited, a UK company, limited by guarantee. All rights reserved.
70 | Guide to annual financial statements: IFRS 17 and IFRS 9 – Illustrative disclosures for insurers
Notes to the consolidated financial statements (continued)6. Fair value measurement
A number of the Group’s accounting policies and disclosures require the measurement of fair values, for both financial and non-financial assets and liabilities.
A. Valuation models[IFRS 13.72] The Group measures fair values using the following fair value hierarchy, which reflects the
significance of the inputs used in making the measurements.
– Level 1: Inputs that are quoted market prices (unadjusted) in active markets for identical instruments.
– Level 2: Inputs other than quoted prices included within Level 1 that are observable either directly (i.e. as prices) or indirectly (i.e. derived from prices). This category includes instruments valued using quoted market prices in active markets for similar instruments, quoted prices for identical or similar instruments in markets that are considered less than active, or other valuation techniques in which all significant inputs are directly or indirectly observable from market data.
– Level 3: Inputs that are unobservable. This category includes all instruments for which the valuation technique includes unobservable inputs that have a significant effect on the instruments’ valuation. This category includes instruments that are valued based on quoted prices for similar instruments for which significant unobservable adjustments or assumptions are required to reflect differences between the instruments.
IFRS 13.93(c), (e)(iv), 95
The Group recognises transfers between levels of the fair value hierarchy as of the end of the reporting period during which the change occurs.
IFRS 13.93(d) Valuation techniques include net present value and discounted cash flow models, comparison with similar instruments for which observable market prices exist, Black-Scholes and polynomial option pricing models and other valuation models. Assumptions and inputs used in valuation techniques include risk-free and benchmark interest rates, credit spreads and other premiums used in estimating discount rates, foreign exchange rates, bond and equity prices and expected price volatilities and correlations.
[IFRS 13.42, 62] The objective of the valuation techniques is to arrive at a fair value measurement that reflects the price that would be received to sell the asset or paid to transfer the liability in an orderly transaction between market participants at the measurement date. The fair value of a liability reflects the effect of non-performance risk.
For more information about the valuation models for financial instruments, see Note 7(A).
Intr
oduc
tion
Aud
itor
s’ r
epor
tPr
imar
y st
atem
ents
NO
TE
SFu
rthe
r re
sour
ces
© 2018 KPMG IFRG Limited, a UK company, limited by guarantee. All rights reserved.
Illustrative disclosures – Notes 71Risk, capital and fair values
Notes to the consolidated financial statements (continued)6. Fair value measurement (continued)B. Valuation framework
IFRS 13.93(g), IE65 The Group has an established control framework for the measurement of fair values. This framework includes a valuation team, which reports to the chief financial officer, with overall responsibility for overseeing and independently verifying all significant fair value measurements. Specific controls include:
– verification of observable pricing;
– re-performance of model valuations;
– a review and approval process for new models and changes to models;
– biannual calibration and back-testing of models against observed market transactions;
– analysis and investigation of significant daily valuation movements; and
– review of significant unobservable inputs, valuation adjustments and significant changes to the fair value measurement of Level 3 instruments compared with the previous month.
When third party information – e.g. broker quotes, pricing services or independent property valuations – is used to measure fair value, the valuation team assesses and documents the evidence obtained from the third parties to support the conclusion that these valuations meet the requirements of IFRS. This includes:
– verifying that the broker, pricing service or independent property valuer is approved by the Group for use in pricing the relevant type of asset or liability;
– understanding how the fair value has been arrived at, the extent to which it reflects actual market transactions and whether it represents a quoted price in an active market for an identical instrument;
– when prices for similar assets or liabilities are used to measure fair value, understanding how these prices have been adjusted to reflect the characteristics of the asset or liability subject to measurement; and
– if a number of quotes for the same asset or liability have been obtained, then understanding how fair value has been determined using those quotes.
Significant valuation issues are reported to the Group audit committee.
Further information about the assumptions made in measuring fair values is included in the following notes:
– Note 7: financial instruments;
– Note 17(B): share-based payment arrangements;a
– Note 22(B): investment property;
– Note 24(A)(ii): owner-occupied property measured at fair value; and
– Note 35(A)(iii): acquisition of subsidiary.b
IFRS 13.6(a) a. The Group has included in the list above a reference to the disclosures about the measurement of fair values for share-based payment arrangements. However, the measurement and disclosure requirements of IFRS 13 Fair Value Measurement do not apply to these arrangements.
IFRS 13.BC184 b. The Group has disclosed information about the fair value measurement on initial recognition of assets acquired and liabilities assumed in a business combination, although the disclosure requirements of IFRS 13 do not apply to measurements on initial recognition.
Intr
oduc
tion
Aud
itor
s’ r
epor
tPr
imar
y st
atem
ents
NO
TE
SFu
rthe
r re
sour
ces
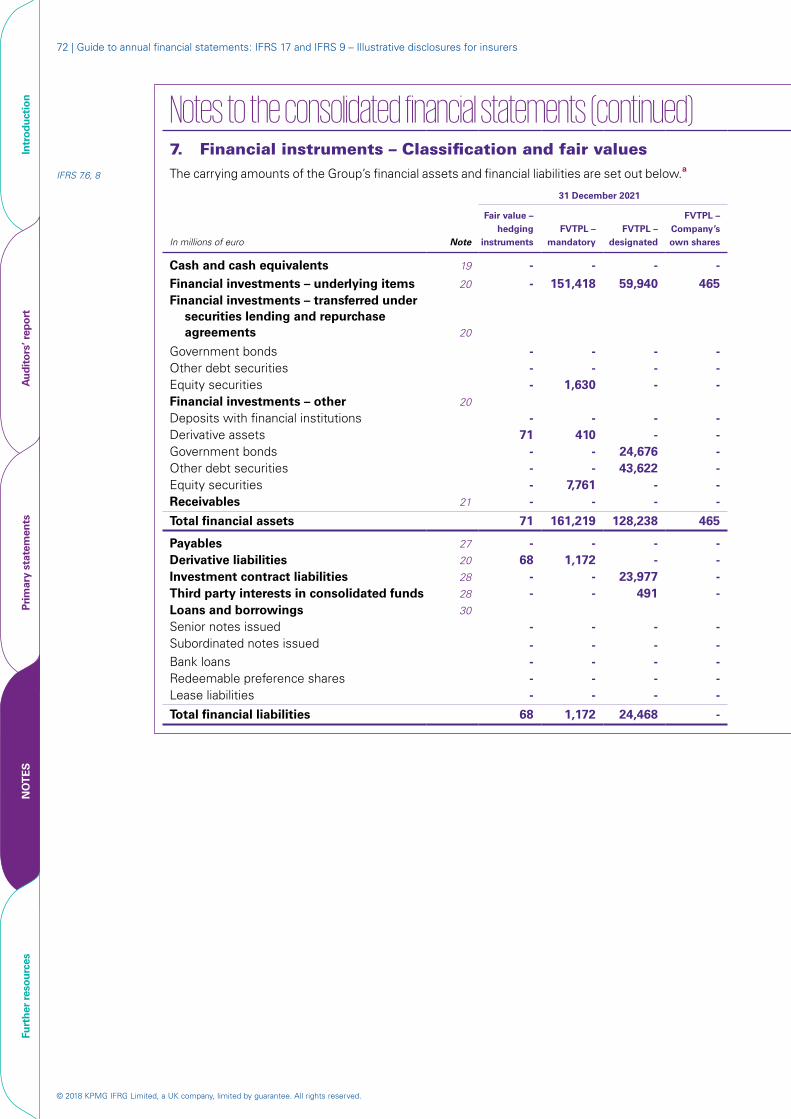
© 2018 KPMG IFRG Limited, a UK company, limited by guarantee. All rights reserved.
72 | Guide to annual financial statements: IFRS 17 and IFRS 9 – Illustrative disclosures for insurers
Notes to the consolidated financial statements (continued)7. Financial instruments – Classification and fair values
IFRS 7.6, 8 The carrying amounts of the Group’s financial assets and financial liabilities are set out below.a
31 December 2021 31 December 2021 31 December 2020 (restated)
In millions of euro Note
Fair value – hedging
instrumentsFVTPL –
mandatoryFVTPL –
designated
FVTPL – Company’s own shares
FVOCI – debt instruments
Amortised cost
Total carrying amount
Fair value – hedging
instrumentsFVTPL –
mandatoryFVTPL –
designated
FVTPL – Company’s own shares
FVOCI – debt instruments
Amortised cost
Total carrying amount
Cash and cash equivalents 19 - - - - - 20,794 20,794 - - - - - 16,337 16,337 Financial investments – underlying items 20 - 151,418 59,940 465 - - 211,823 - 144,914 53,329 345 - - 198,588 Financial investments – transferred under
securities lending and repurchase agreements 20
Government bonds - - - - 4,206 - 4,206 - - - - 4,487 - 4,487Other debt securities - - - - 2,431 - 2,431 - - - - 2,237 - 2,237Equity securities - 1,630 - - - - 1,630 - 1,481 - - - - 1,481Financial investments – other 20
Deposits with financial institutions - - - - - 2,405 2,405 - - - - - 2,213 2,213 Derivative assets 71 410 - - - - 481 65 560 - - - - 625 Government bonds - - 24,676 - 59,233 3,989 87,898 - - 23,618 - 56,762 4,126 84,506 Other debt securities - - 43,622 - 64,930 2,371 110,923 - - 37,338 - 64,278 2,402 104,018 Equity securities - 7,761 - - - - 7,761 - 2,871 - - - - 2,871 Receivables 21 - - - - - 7,609 7,609 - - - - - 8,470 8,470
Total financial assets 71 161,219 128,238 465 130,800 37,168 457,961 65 149,826 114,285 345 127,764 33,548 425,833
Payables 27 - - - - - 10,401 10,401 - - - - - 11,305 11,305Derivative liabilities 20 68 1,172 - - - - 1,240 78 1,208 - - - - 1,286Investment contract liabilities 28 - - 23,977 - - - 23,977 - - 21,779 - - - 21,779Third party interests in consolidated funds 28 - - 491 - - - 491 - - 441 - - - 441Loans and borrowings 30
Senior notes issued - - - - - 1,361 1,361 - - - - - 1,371 1,371Subordinated notes issued - - - - - 2,430 2,430 - - - - - 2,453 2,453Bank loans - - - - - 1,803 1,803 - - - - - 1,908 1,908Redeemable preference shares - - - - - 716 716 - - - - - - -Lease liabilities - - - - - 1,095 1,095 - - - - - 1,118 1,118
Total financial liabilities 68 1,172 24,468 - - 17,806 43,514 78 1,208 22,220 - - 18,155 41,661
Intr
oduc
tion
Aud
itor
s’ r
epor
tPr
imar
y st
atem
ents
NO
TE
SFu
rthe
r re
sour
ces

© 2018 KPMG IFRG Limited, a UK company, limited by guarantee. All rights reserved.
Illustrative disclosures – Notes 73Risk, capital and fair values
Notes to the consolidated financial statements (continued)7. Financial instruments – Classification and fair values
IFRS 7.6, 8 The carrying amounts of the Group’s financial assets and financial liabilities are set out below.a
31 December 2021 31 December 2021 31 December 2020 (restated)
FVOCI – debt instruments
Amortised cost
Total carrying amount
Fair value – hedging
instrumentsFVTPL –
mandatoryFVTPL –
designated
FVTPL – Company’s own shares
FVOCI – debt instruments
Amortised cost
Total carrying amount
- -
20,794 -
20,794 211,823
--
-144,914
-53,329
- 345
- -
16,337 -
16,337 198,588
4,2062,431
-
---
4,2062,4311,630
---
--
1,481
---
---
4,4872,237
-
---
4,4872,2371,481
- -
59,233 64,930
- -
2,405 -
3,989 2,371
- 7,609
2,405 481
87,898 110,923
7,761 7,609
- 65 - - - -
- 560
- -
2,871 -
- -
23,618 37,338
- -
- - - - - -
- -
56,762 64,278
- -
2,213 -
4,126 2,402
- 8,470
2,213 625
84,506 104,018
2,871 8,470
130,800 37,168 457,961 65 149,826 114,285 345 127,764 33,548 425,833
- 10,401- -- -- -
10,4011,240
23,977491
-78
--
-1,208
--
- -- -
21,779 -441 -
- 11,305- -- -- -
11,3051,286
21,779441
- 1,361- 2,430- 1,803- 716- 1,095
1,3612,4301,803
7161,095
-----
-----
- -- -- -- -- -
- 1,371- 2,453- 1,908- -- 1,118
1,3712,4531,908
-1,118
- 17,806 43,514 78 1,208 22,220 - - 18,155 41,661
In millions of euro Note
Fair value – hedging
instrumentsFVTPL –
mandatoryFVTPL –
designated
FVTPL – Company’s own shares
Cash and cash equivalents 19 - - - -Financial investments – underlying items 20 - 151,418 59,940 465 Financial investments – transferred under
securities lending and repurchase agreements 20
Government bonds - - - -Other debt securities - - - -Equity securities - 1,630 - -Financial investments – other 20
Deposits with financial institutions - - - - Derivative assets 71 410 - - Government bonds - - 24,676 - Other debt securities - - 43,622 - Equity securities - 7,761 - - Receivables 21 - - - -
Total financial assets 71 161,219 128,238 465
Payables 27 - - - -Derivative liabilities 20 68 1,172 - -Investment contract liabilities 28 - - 23,977 -Third party interests in consolidated funds 28 - - 491 -Loans and borrowings 30
Senior notes issued - - - -Subordinated notes issued - - - -Bank loans - - - -Redeemable preference shares - - - -Lease liabilities - - - -
Total financial liabilities 68 1,172 24,468 -
IFRS 7.6, B1–B3 a. An entity groups financial instruments into classes that are appropriate to the nature of the information disclosed and that take into account the characteristics of those financial instruments. Although IFRS 7 does not define ‘classes’, as a minimum instruments measured at amortised cost are distinguished from instruments measured at fair value.
Intr
oduc
tion
Aud
itor
s’ r
epor
tPr
imar
y st
atem
ents
NO
TE
SFu
rthe
r re
sour
ces

© 2018 KPMG IFRG Limited, a UK company, limited by guarantee. All rights reserved.
74 | Guide to annual financial statements: IFRS 17 and IFRS 9 – Illustrative disclosures for insurers
Notes to the consolidated financial statements (continued)7. Financial instruments – Classification and fair values
(continued)A. Valuation models
[IFRS 13.77, 79, A] The Group measures the fair value of an instrument using the quoted price in an active market for that instrument whenever one is available. A market is regarded as active if transactions for the asset or liability take place with sufficient frequency and volume to provide pricing information on an ongoing basis.
[IFRS 13.70–71] If an asset or a liability measured at fair value has a bid price and an ask price, then the Group measures assets and long positions at the bid price and liabilities and short positions at the ask price.
[IFRS 13.61–62] If there is no quoted price in an active market, then the Group uses valuation techniques that maximise the use of relevant observable inputs and minimise the use of unobservable inputs. The chosen valuation technique incorporates all of the factors that market participants would take into account in pricing a transaction.
IFRS 7.28(a) The best evidence of the fair value of a financial instrument on initial recognition is normally the transaction price – i.e. the fair value of the consideration given or received. If the Group determines that the fair value on initial recognition differs from the transaction price and the fair value is evidenced neither by a quoted price in an active market for an identical asset or liability nor based on a valuation technique that uses only data from observable markets, then the financial instrument is initially measured at fair value, adjusted to defer the difference between its fair value and the transaction price. Subsequently, that difference is recognised in profit or loss on an appropriate basis over the life of the instrument, but no later than when the valuation is wholly supported by observable market data or the transaction is closed out.
The Group uses widely recognised valuation models to determine the fair value of common and simple financial instruments – e.g. interest rate and currency swaps – that use only observable market data and require little management judgement and estimation. Observable prices or model inputs are usually available in the market for listed debt and equity securities, exchange-traded derivatives and simple over-the-counter derivatives such as interest rate swaps. The availability of observable market prices and model inputs reduces the need for management judgement and estimation, and reduces the uncertainty associated with determining fair values. The availability of observable market prices and inputs varies depending on the products and markets, and is prone to changes based on specific events and general conditions in the financial markets.
For more complex instruments, the Group uses proprietary valuation models, which are usually developed from recognised valuation models. Some or all of the significant inputs into these models may not be observable in the market, and may be derived from market prices or rates or estimated based on assumptions. Examples of instruments involving significant unobservable inputs include certain securities for which there is no active market. Valuation models that employ significant unobservable inputs require a higher degree of management judgement and estimation in the determination of fair value. Management judgement and estimation are usually required for the selection of the appropriate valuation model to be used, determination of expected future cash flows on the financial instrument being valued, determination of the probability of counterparty default and prepayments, determination of expected volatilities and correlations and selection of appropriate discount rates.
Fair value estimates obtained from models are adjusted for any other factors – e.g. liquidity risk or model uncertainties – to the extent that the Group believes that a third party market participant would take them into account in pricing a transaction. Fair values reflect the credit risk of the instrument and include adjustments to take account of the credit risks of the Group entity and the counterparty, where appropriate.
Model inputs and values are calibrated against historical data and published forecasts and, where possible, against current or recent observed transactions in different instruments and against broker quotes. This calibration process is inherently subjective and it yields ranges of possible inputs and estimates of fair value, and management uses judgement to select the most appropriate point in the range.
Intr
oduc
tion
Aud
itor
s’ r
epor
tPr
imar
y st
atem
ents
NO
TE
SFu
rthe
r re
sour
ces
© 2018 KPMG IFRG Limited, a UK company, limited by guarantee. All rights reserved.
Illustrative disclosures – Notes 75Risk, capital and fair values
Notes to the consolidated financial statements (continued)7. Financial instruments – Classification and fair values
(continued)A. Valuation models (continued)
i. Valuation techniques for Level 2 and Level 3 fair value measurementsIFRS 13.93(d) Where quoted prices of financial assets and financial liabilities in active markets are not available,
the following valuation techniques are typically used.
Derivatives
The markets for the Group’s exchange-traded derivatives – e.g. foreign exchange and equity index futures – are usually active. The fair value of an over-the-counter foreign exchange forward contract is determined by discounting the difference between the contractual forward price and the current forward price for the remaining maturity of the contract using a credit-adjusted risk-free interest rate (based on swap rates, if they are available, or otherwise on government bonds).
The fair value of interest rate swaps is typically based on broker quotes. Quotes are tested for reasonableness by discounting estimated future cash flows based on the terms and maturity of each contract using market interest rates for a similar instrument at the measurement date.
For measuring derivatives that might change classification from being an asset to a liability or vice versa – e.g. interest rate swaps – fair values take into account both credit valuation adjustment and debit valuation adjustment when market participants take this into consideration in pricing the derivatives.
Debt and equity securities
Discounted cash flow techniques are most commonly used for the valuation of debt securities. Discount rates are determined with reference to observable market transactions in instruments with substantially the same terms and characteristics, including the credit quality, the remaining term to repayment of the principal and the currency in which the payments are to be made.
For equity securities, the valuation techniques employed generally involve determining a measure of sustainable earnings or dividends and then applying an appropriate current market multiple based on publicly available information for similar companies that have actively traded equity securities.
Asset-backed securities with no active markets
During the current year, low trading volumes continued and there has not been sufficient trading volume to establish an active market for certain asset-backed securities. Therefore, the Group has determined the fair value of these asset-backed securities using other valuation techniques. These securities are backed primarily by static pools of residential mortgages and enjoy a senior claim on cash flows.
To value these asset-backed securities, the Group uses a discounted cash flow technique that takes into account the PD and loss severity by considering the original underwriting criteria, vintage borrower attributes, loan-to-value ratios, expected house price movements and expected prepayment rates. These features are used to estimate expected cash flows, which are then allocated using the ‘waterfall’ applicable to the security and discounted at a risk-adjusted rate. The discounted cash flow technique is often used by market participants to price asset-backed securities. However, this technique is subject to inherent limitations – e.g. estimation of the appropriate risk-adjusted discount rate – and different assumptions and inputs would yield different results.
Collective investment schemes
The fair values of collective investment schemes are based on prices provided by the scheme managers. The prices provided by the scheme managers are generally based on the fair value of the net assets in the underlying funds.
Intr
oduc
tion
Aud
itor
s’ r
epor
tPr
imar
y st
atem
ents
NO
TE
SFu
rthe
r re
sour
ces
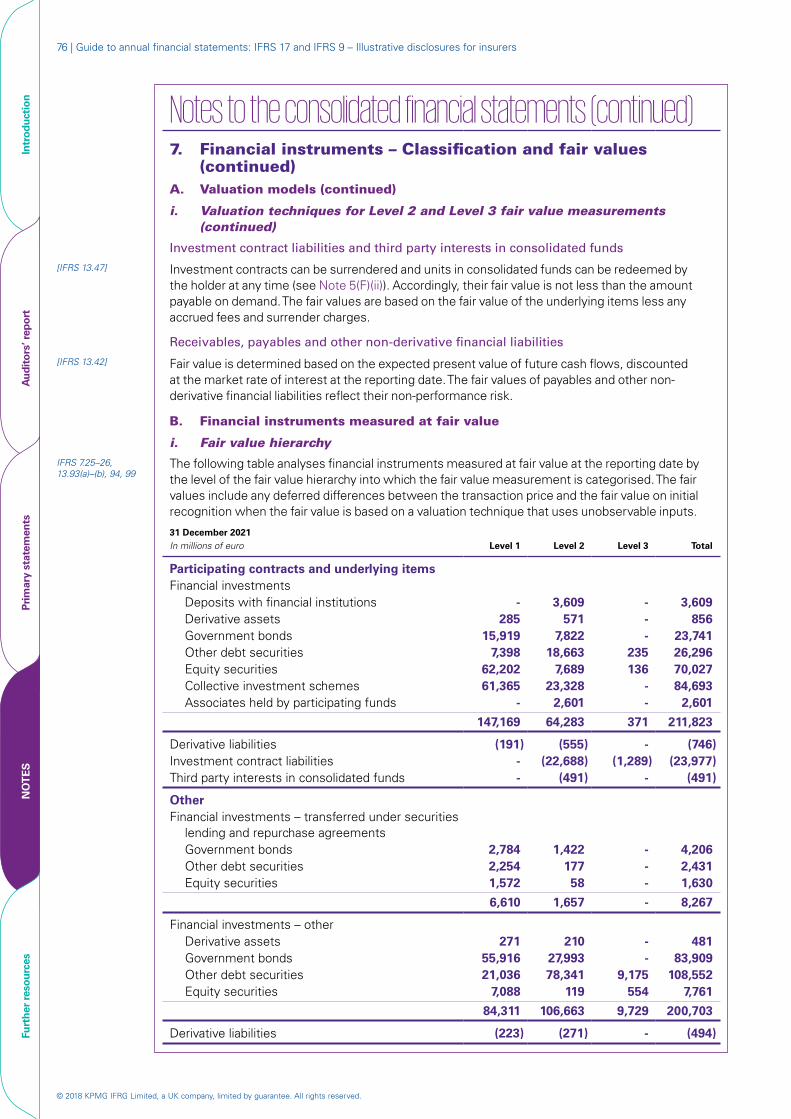
© 2018 KPMG IFRG Limited, a UK company, limited by guarantee. All rights reserved.
76 | Guide to annual financial statements: IFRS 17 and IFRS 9 – Illustrative disclosures for insurers
Notes to the consolidated financial statements (continued)7. Financial instruments – Classification and fair values
(continued)A. Valuation models (continued)
i. Valuation techniques for Level 2 and Level 3 fair value measurements (continued)
Investment contract liabilities and third party interests in consolidated funds
[IFRS 13.47] Investment contracts can be surrendered and units in consolidated funds can be redeemed by the holder at any time (see Note 5(F)(ii)). Accordingly, their fair value is not less than the amount payable on demand. The fair values are based on the fair value of the underlying items less any accrued fees and surrender charges.
Receivables, payables and other non-derivative financial liabilities
[IFRS 13.42] Fair value is determined based on the expected present value of future cash flows, discounted at the market rate of interest at the reporting date. The fair values of payables and other non-derivative financial liabilities reflect their non-performance risk.
B. Financial instruments measured at fair value
i. Fair value hierarchyIFRS 7.25–26, 13.93(a)–(b), 94, 99
The following table analyses financial instruments measured at fair value at the reporting date by the level of the fair value hierarchy into which the fair value measurement is categorised. The fair values include any deferred differences between the transaction price and the fair value on initial recognition when the fair value is based on a valuation technique that uses unobservable inputs.
31 December 2021In millions of euro Level 1 Level 2 Level 3 Total
Participating contracts and underlying itemsFinancial investments
Deposits with financial institutions - 3,609 - 3,609Derivative assets 285 571 - 856Government bonds 15,919 7,822 - 23,741Other debt securities 7,398 18,663 235 26,296Equity securities 62,202 7,689 136 70,027Collective investment schemes 61,365 23,328 - 84,693 Associates held by participating funds - 2,601 - 2,601
147,169 64,283 371 211,823
Derivative liabilities (191) (555) - (746)Investment contract liabilities - (22,688) (1,289) (23,977)Third party interests in consolidated funds - (491) - (491)
OtherFinancial investments – transferred under securities
lending and repurchase agreementsGovernment bonds 2,784 1,422 - 4,206Other debt securities 2,254 177 - 2,431Equity securities 1,572 58 - 1,630
6,610 1,657 - 8,267
Financial investments – otherDerivative assets 271 210 - 481Government bonds 55,916 27,993 - 83,909 Other debt securities 21,036 78,341 9,175 108,552Equity securities 7,088 119 554 7,761
84,311 106,663 9,729 200,703
Derivative liabilities (223) (271) - (494)
Intr
oduc
tion
Aud
itor
s’ r
epor
tPr
imar
y st
atem
ents
NO
TE
SFu
rthe
r re
sour
ces

© 2018 KPMG IFRG Limited, a UK company, limited by guarantee. All rights reserved.
Illustrative disclosures – Notes 77Risk, capital and fair values
Notes to the consolidated financial statements (continued)7. Financial instruments – Classification and fair values
(continued)B. Financial instruments measured at fair value (continued)
i. Fair value hierarchy (continued)31 December 2020 (restated)In millions of euro Level 1 Level 2 Level 3 Total
Participating contracts and underlying itemsFinancial investments
Deposits with financial institutions - 3,320 - 3,320Derivative assets 312 631 - 943Government bonds 15,013 7,460 - 22,473 Other debt securities 7,000 16,822 316 24,138 Equity securities 55,416 7,023 159 62,598Collective investment schemes 58,076 24,528 - 82,604 Associates held by participating funds - 2,512 - 2,512
135,817 62,296 475 198,588
Derivative liabilities (163) (525) - (688)Investment contract liabilities - (20,571) (1,208) (21,779)Third party interests in consolidated funds - (441) - (441)
OtherFinancial investments – transferred under securities
lending and repurchase agreementsGovernment bonds 3,089 1,398 - 4,487Other debt securities 2,050 187 - 2,237Equity securities 1,427 54 - 1,481
6,566 1,639 - 8,205
Financial investments – otherDerivative assets 319 306 - 625Government bonds 53,534 26,846 - 80,380 Other debt securities 15,541 77,338 8,737 101,616 Equity securities 2,386 100 385 2,871
71,780 104,590 9,122 185,492
Derivative liabilities (152) (446) - (598)
IFRS 13.93(c) During 2021, quoted prices in active markets were no longer available for investments in debt securities with a carrying amount of €2,483 million due to changes in market conditions. However, there was sufficient information available to measure the fair values of these securities using a valuation technique in which all significant inputs were observable. Therefore, these securities were transferred from Level 1 to Level 2 of the fair value hierarchy at 31 December 2021.
Intr
oduc
tion
Aud
itor
s’ r
epor
tPr
imar
y st
atem
ents
NO
TE
SFu
rthe
r re
sour
ces
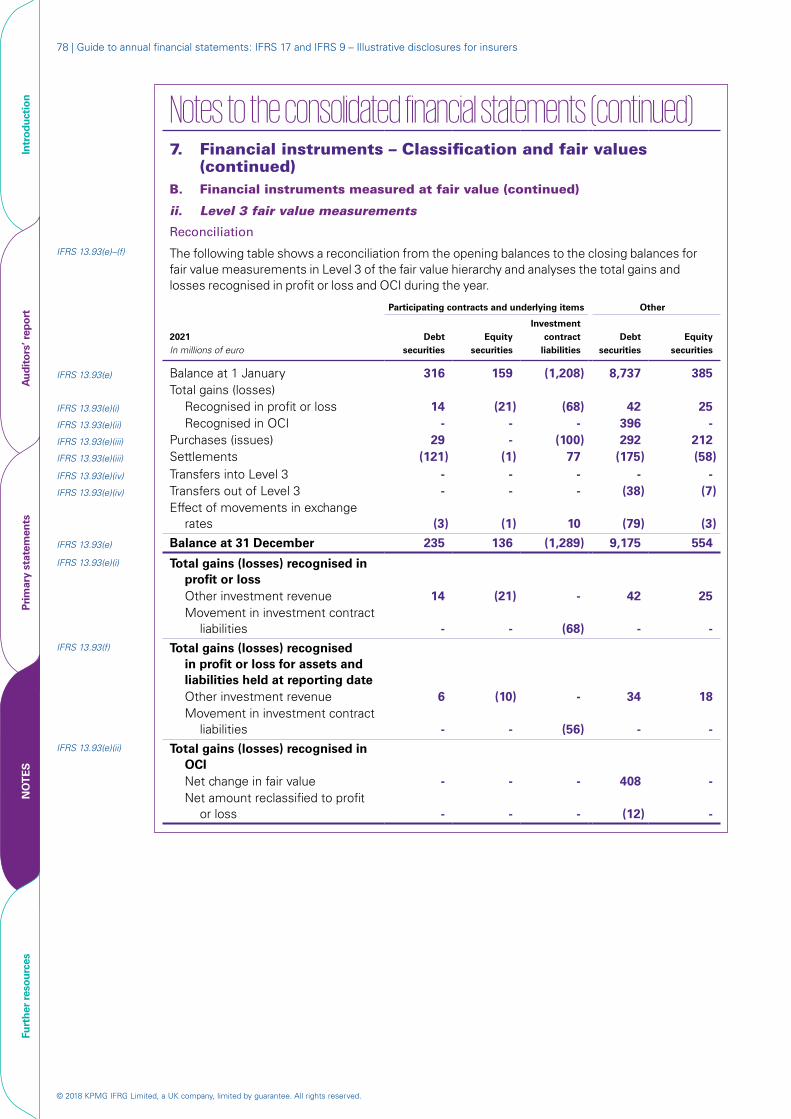
© 2018 KPMG IFRG Limited, a UK company, limited by guarantee. All rights reserved.
78 | Guide to annual financial statements: IFRS 17 and IFRS 9 – Illustrative disclosures for insurers
Notes to the consolidated financial statements (continued)7. Financial instruments – Classification and fair values
(continued)B. Financial instruments measured at fair value (continued)
ii. Level 3 fair value measurements
Reconciliation
IFRS 13.93(e)–(f) The following table shows a reconciliation from the opening balances to the closing balances for fair value measurements in Level 3 of the fair value hierarchy and analyses the total gains and losses recognised in profit or loss and OCI during the year.
Participating contracts and underlying items Other
2021 In millions of euro
Debt securities
Equity securities
Investment contract
liabilitiesDebt
securitiesEquity
securities
IFRS 13.93(e) Balance at 1 January 316 159 (1,208) 8,737 385Total gains (losses)
IFRS 13.93(e)(i) Recognised in profit or loss 14 (21) (68) 42 25IFRS 13.93(e)(ii) Recognised in OCI - - - 396 -IFRS 13.93(e)(iii) Purchases (issues) 29 - (100) 292 212IFRS 13.93(e)(iii) Settlements (121) (1) 77 (175) (58)IFRS 13.93(e)(iv) Transfers into Level 3 - - - - -IFRS 13.93(e)(iv) Transfers out of Level 3 - - - (38) (7)
Effect of movements in exchange rates (3) (1) 10 (79) (3)
IFRS 13.93(e) Balance at 31 December 235 136 (1,289) 9,175 554IFRS 13.93(e)(i) Total gains (losses) recognised in
profit or lossOther investment revenue 14 (21) - 42 25Movement in investment contract
liabilities - - (68) - -IFRS 13.93(f) Total gains (losses) recognised
in profit or loss for assets and liabilities held at reporting date
Other investment revenue 6 (10) - 34 18Movement in investment contract
liabilities - - (56) - -IFRS 13.93(e)(ii) Total gains (losses) recognised in
OCINet change in fair value - - - 408 -Net amount reclassified to profit
or loss - - - (12) -
Intr
oduc
tion
Aud
itor
s’ r
epor
tPr
imar
y st
atem
ents
NO
TE
SFu
rthe
r re
sour
ces
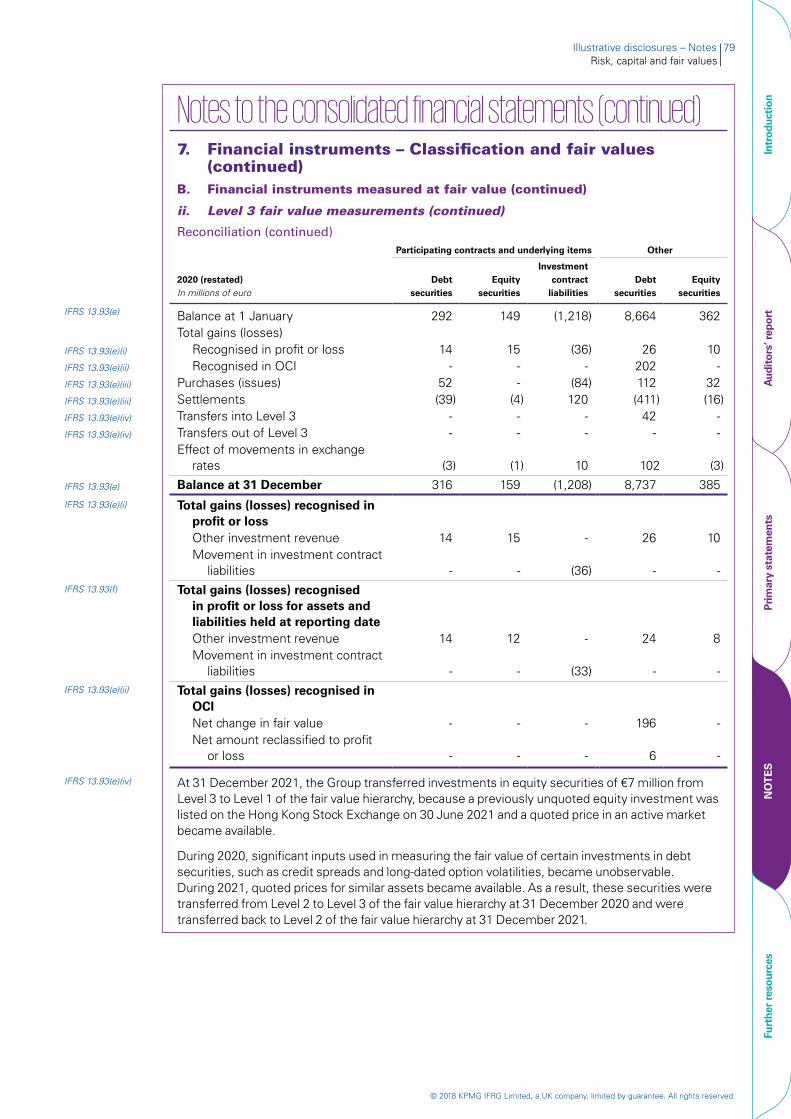
© 2018 KPMG IFRG Limited, a UK company, limited by guarantee. All rights reserved.
Illustrative disclosures – Notes 79Risk, capital and fair values
Notes to the consolidated financial statements (continued)7. Financial instruments – Classification and fair values
(continued)B. Financial instruments measured at fair value (continued)
ii. Level 3 fair value measurements (continued)
Reconciliation (continued)Participating contracts and underlying items Other
2020 (restated) In millions of euro
Debt securities
Equity securities
Investment contract
liabilitiesDebt
securitiesEquity
securities
IFRS 13.93(e) Balance at 1 January 292 149 (1,218) 8,664 362Total gains (losses)
IFRS 13.93(e)(i) Recognised in profit or loss 14 15 (36) 26 10IFRS 13.93(e)(ii) Recognised in OCI - - - 202 -IFRS 13.93(e)(iii) Purchases (issues) 52 - (84) 112 32IFRS 13.93(e)(iii) Settlements (39) (4) 120 (411) (16)IFRS 13.93(e)(iv) Transfers into Level 3 - - - 42 -IFRS 13.93(e)(iv) Transfers out of Level 3 - - - - -
Effect of movements in exchange rates (3) (1) 10 102 (3)
IFRS 13.93(e) Balance at 31 December 316 159 (1,208) 8,737 385IFRS 13.93(e)(i) Total gains (losses) recognised in
profit or lossOther investment revenue 14 15 - 26 10Movement in investment contract
liabilities - - (36) - -IFRS 13.93(f) Total gains (losses) recognised
in profit or loss for assets and liabilities held at reporting date
Other investment revenue 14 12 - 24 8Movement in investment contract
liabilities - - (33) - -IFRS 13.93(e)(ii) Total gains (losses) recognised in
OCINet change in fair value - - - 196 -Net amount reclassified to profit
or loss - - - 6 -
IFRS 13.93(e)(iv) At 31 December 2021, the Group transferred investments in equity securities of €7 million from Level 3 to Level 1 of the fair value hierarchy, because a previously unquoted equity investment was listed on the Hong Kong Stock Exchange on 30 June 2021 and a quoted price in an active market became available.
During 2020, significant inputs used in measuring the fair value of certain investments in debt securities, such as credit spreads and long-dated option volatilities, became unobservable. During 2021, quoted prices for similar assets became available. As a result, these securities were transferred from Level 2 to Level 3 of the fair value hierarchy at 31 December 2020 and were transferred back to Level 2 of the fair value hierarchy at 31 December 2021.
Intr
oduc
tion
Aud
itor
s’ r
epor
tPr
imar
y st
atem
ents
NO
TE
SFu
rthe
r re
sour
ces

© 2018 KPMG IFRG Limited, a UK company, limited by guarantee. All rights reserved.
80 | Guide to annual financial statements: IFRS 17 and IFRS 9 – Illustrative disclosures for insurers
Notes to the consolidated financial statements (continued)7. Financial instruments – Classification and fair values
(continued)B. Financial instruments measured at fair value (continued)
ii. Level 3 fair value measurements (continued)
Unobservable inputs used in measuring fair value
IFRS 13.91(a), 93(d), (h)(i), 99, IE63, IE66
The table below sets out information about significant unobservable inputs used in measuring financial instruments categorised in Level 3 of the fair value hierarchy.a
Type of financial instrument
Fair value in millions of
euroValuation technique
Significant unobservable input
Range of estimates (weighted-average)
for unobservable input
Fair value measurement sensitivity to unobservable inputs
Debt securities
(residential
asset-backed
securities)
2021: 9,410
2020: 9,053Discounted
cash flowCredit spread 2021: 1.35–1.50%
(1.42%)2020: 1.42–1.55%
(1.46%)
Significant increases in any of these inputs in isolation would result in lower fair values. Generally, changes in assumptions used for the PD are accompanied by directionally opposite changes in assumptions used for expected prepayment rates.
Lifetime PD 2021: 8–12% (10%)
2020: 10–14% (12%)
Expected annual prepayment rate
2021: 3–6% (4.8%)
2020: 3–8% (5.8%)
Equity securities 2021: 690
2020: 544Market
comparisonDiscount for
lack of marketability
2021: 5–20% (10%)
2020: 5–20% (17%)
Significant increases in the discount for lack of marketability would result in lower fair values.
Investment
contract
liabilities
2021: 1,289
2020: 1,208Property
appraisal value
Adjusted annual market yield
2021: 5–8% (6.5%)2020: 5–9% (6.7%)
Significant increases in the adjusted market yield would result in lower fair values.
IFRS 13.IE65(e) Significant unobservable inputs are developed as follows.
Debt securities
Credit spreads are derived from the CDS market (whenever this information is available) and from historical defaults and prepayment trends adjusted for current conditions. PDs are derived from historical default and recovery information and adjusted for current conditions. Expected prepayment rates are derived from historical prepayment trends, adjusted to reflect current conditions.
Equity securities
Discounts for lack of marketability are determined by assessing the current and future operating performance and liquidity of the equity investments and current market conditions.
Investment contract liabilities
Investment contract liabilities categorised in Level 3 of the fair value hierarchy are measured with reference to the value of the investment property held in investment funds. Observable market yields for similar properties are adjusted to reflect the quality of tenants and the lease terms. Valuations may also reflect the expected rental growth rates, void periods, occupancy rates and lease incentive costs.
IFRS 13.93(d), IE63, Insights 2.4.530.50
a. IFRS 13 does not specify how to summarise the information about unobservable inputs for each class of assets or liabilities – e.g. whether to include information about the range of values or a weighted average for each unobservable input used for each class. An entity considers the level of detail that is necessary to meet the disclosure objectives. For example, if the range of values for an unobservable input that the entity uses is wide, then this may indicate that the entity should disclose both the range and the weighted average of the values, as disclosed in this guide.
Intr
oduc
tion
Aud
itor
s’ r
epor
tPr
imar
y st
atem
ents
NO
TE
SFu
rthe
r re
sour
ces
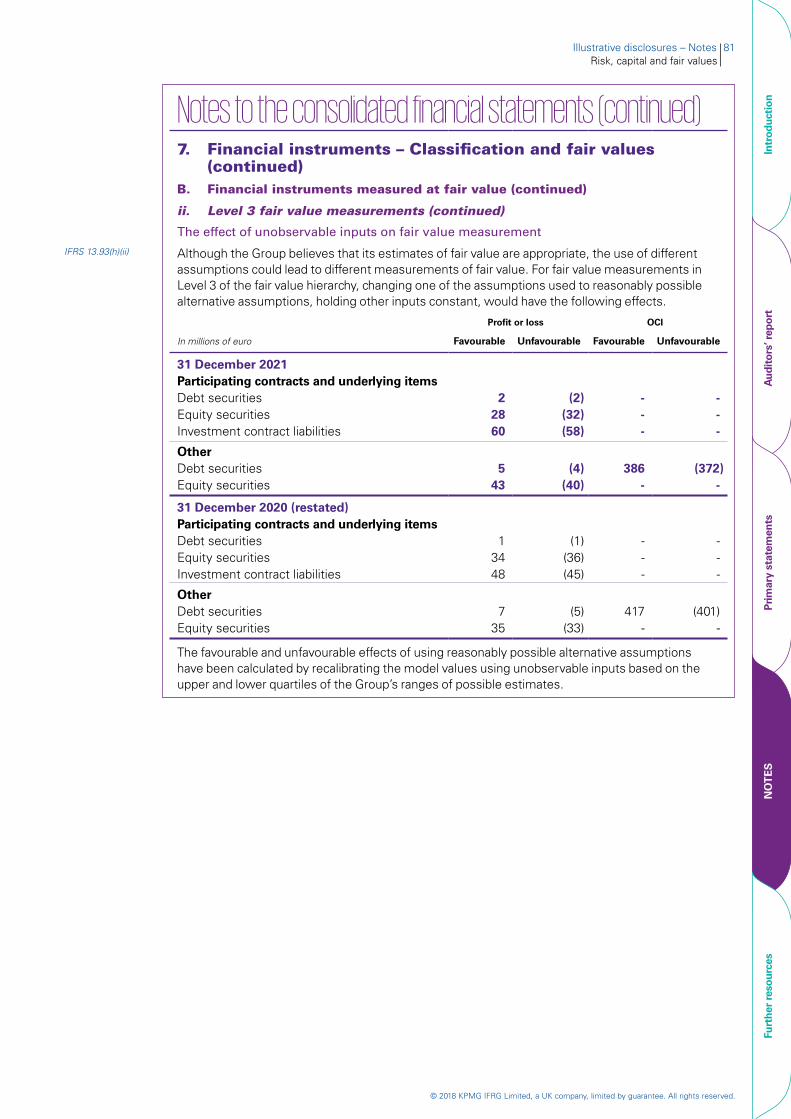
© 2018 KPMG IFRG Limited, a UK company, limited by guarantee. All rights reserved.
Illustrative disclosures – Notes 81Risk, capital and fair values
Notes to the consolidated financial statements (continued)7. Financial instruments – Classification and fair values
(continued)B. Financial instruments measured at fair value (continued)
ii. Level 3 fair value measurements (continued)
The effect of unobservable inputs on fair value measurement
IFRS 13.93(h)(ii) Although the Group believes that its estimates of fair value are appropriate, the use of different assumptions could lead to different measurements of fair value. For fair value measurements in Level 3 of the fair value hierarchy, changing one of the assumptions used to reasonably possible alternative assumptions, holding other inputs constant, would have the following effects.
Profit or loss OCI
In millions of euro Favourable Unfavourable Favourable Unfavourable
31 December 2021Participating contracts and underlying itemsDebt securities 2 (2) - -Equity securities 28 (32) - -Investment contract liabilities 60 (58) - -
OtherDebt securities 5 (4) 386 (372)Equity securities 43 (40) - -
31 December 2020 (restated)Participating contracts and underlying itemsDebt securities 1 (1) - -Equity securities 34 (36) - -Investment contract liabilities 48 (45) - -
OtherDebt securities 7 (5) 417 (401)Equity securities 35 (33) - -
The favourable and unfavourable effects of using reasonably possible alternative assumptions have been calculated by recalibrating the model values using unobservable inputs based on the upper and lower quartiles of the Group’s ranges of possible estimates.
Intr
oduc
tion
Aud
itor
s’ r
epor
tPr
imar
y st
atem
ents
NO
TE
SFu
rthe
r re
sour
ces
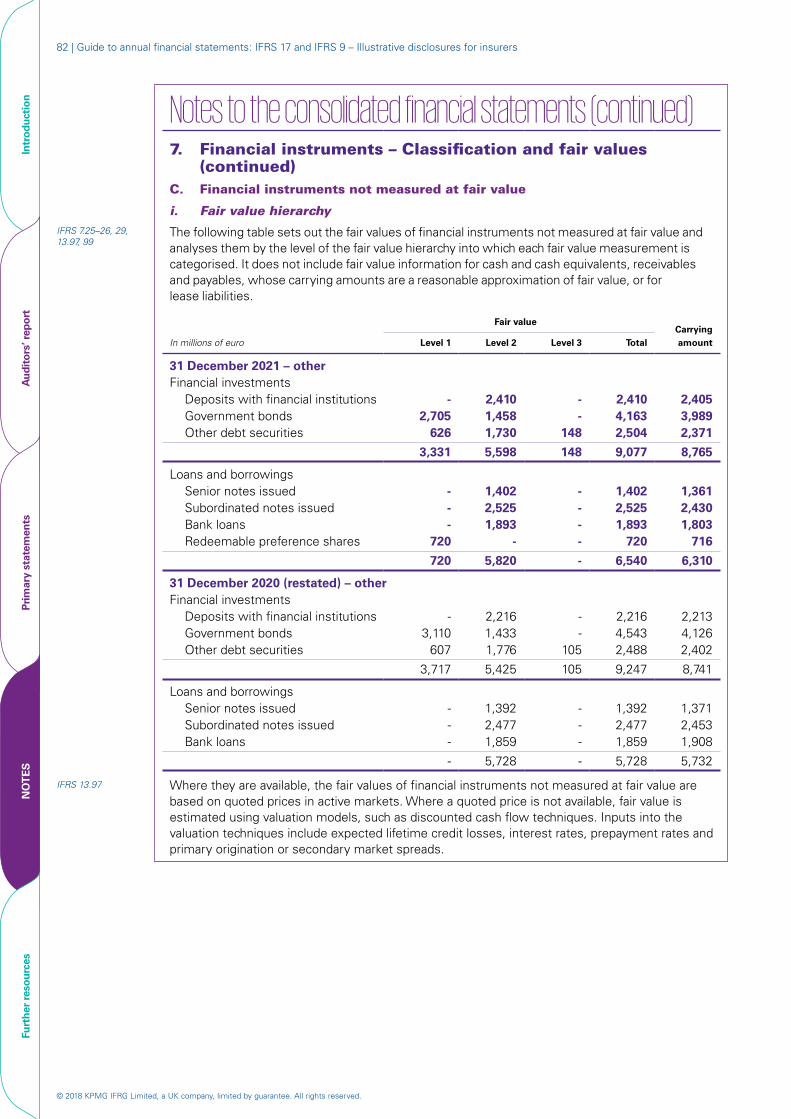
© 2018 KPMG IFRG Limited, a UK company, limited by guarantee. All rights reserved.
82 | Guide to annual financial statements: IFRS 17 and IFRS 9 – Illustrative disclosures for insurers
Notes to the consolidated financial statements (continued)7. Financial instruments – Classification and fair values
(continued)C. Financial instruments not measured at fair value
i. Fair value hierarchyIFRS 7.25–26, 29, 13.97, 99
The following table sets out the fair values of financial instruments not measured at fair value and analyses them by the level of the fair value hierarchy into which each fair value measurement is categorised. It does not include fair value information for cash and cash equivalents, receivables and payables, whose carrying amounts are a reasonable approximation of fair value, or for lease liabilities.
In millions of euro
Fair valueCarrying amountLevel 1 Level 2 Level 3 Total
31 December 2021 – otherFinancial investments
Deposits with financial institutions - 2,410 - 2,410 2,405Government bonds 2,705 1,458 - 4,163 3,989Other debt securities 626 1,730 148 2,504 2,371
3,331 5,598 148 9,077 8,765
Loans and borrowingsSenior notes issued - 1,402 - 1,402 1,361Subordinated notes issued - 2,525 - 2,525 2,430Bank loans - 1,893 - 1,893 1,803Redeemable preference shares 720 - - 720 716
720 5,820 - 6,540 6,310
31 December 2020 (restated) – otherFinancial investments
Deposits with financial institutions - 2,216 - 2,216 2,213Government bonds 3,110 1,433 - 4,543 4,126Other debt securities 607 1,776 105 2,488 2,402
3,717 5,425 105 9,247 8,741
Loans and borrowingsSenior notes issued - 1,392 - 1,392 1,371Subordinated notes issued - 2,477 - 2,477 2,453Bank loans - 1,859 - 1,859 1,908
- 5,728 - 5,728 5,732
IFRS 13.97 Where they are available, the fair values of financial instruments not measured at fair value are based on quoted prices in active markets. Where a quoted price is not available, fair value is estimated using valuation models, such as discounted cash flow techniques. Inputs into the valuation techniques include expected lifetime credit losses, interest rates, prepayment rates and primary origination or secondary market spreads.
Intr
oduc
tion
Aud
itor
s’ r
epor
tPr
imar
y st
atem
ents
NO
TE
SFu
rthe
r re
sour
ces
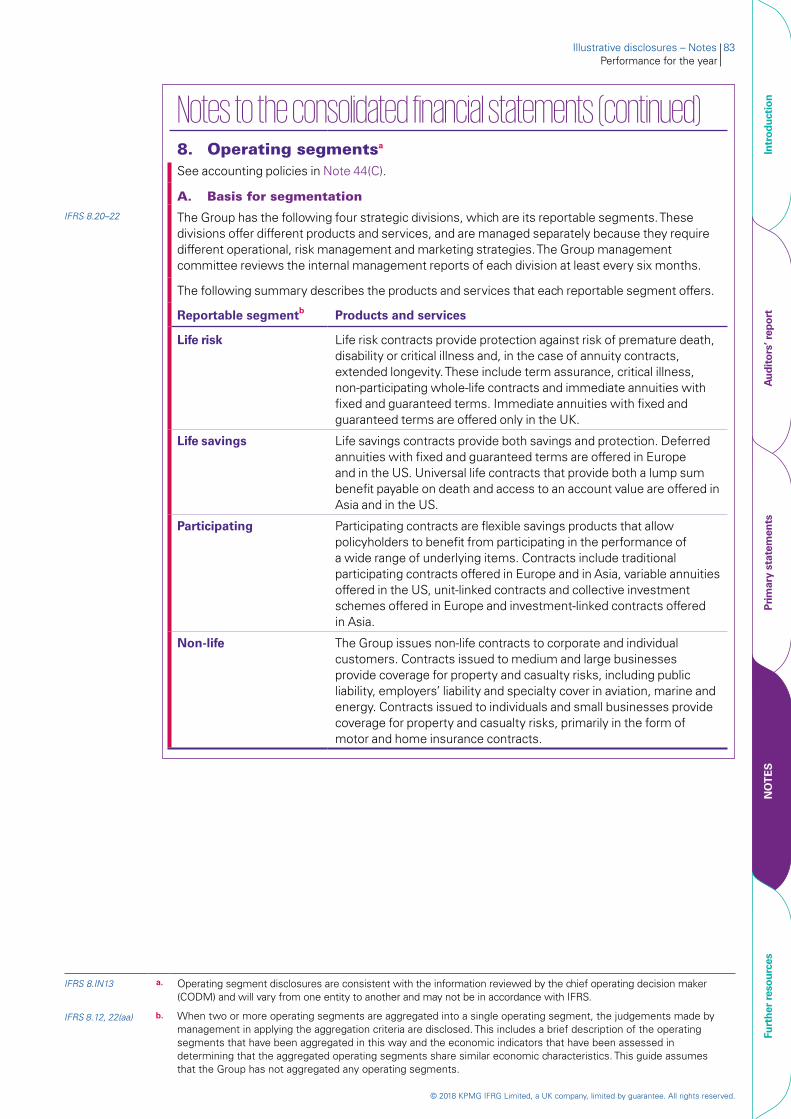
© 2018 KPMG IFRG Limited, a UK company, limited by guarantee. All rights reserved.
Illustrative disclosures – Notes 83Performance for the year
Notes to the consolidated financial statements (continued)8. Operating segmentsa See accounting policies in Note 44(C).
A. Basis for segmentationIFRS 8.20–22 The Group has the following four strategic divisions, which are its reportable segments. These
divisions offer different products and services, and are managed separately because they require different operational, risk management and marketing strategies. The Group management committee reviews the internal management reports of each division at least every six months.
The following summary describes the products and services that each reportable segment offers.
Reportable segmentb Products and services
Life risk Life risk contracts provide protection against risk of premature death, disability or critical illness and, in the case of annuity contracts, extended longevity. These include term assurance, critical illness, non-participating whole-life contracts and immediate annuities with fixed and guaranteed terms. Immediate annuities with fixed and guaranteed terms are offered only in the UK.
Life savings Life savings contracts provide both savings and protection. Deferred annuities with fixed and guaranteed terms are offered in Europe and in the US. Universal life contracts that provide both a lump sum benefit payable on death and access to an account value are offered in Asia and in the US.
Participating Participating contracts are flexible savings products that allow policyholders to benefit from participating in the performance of a wide range of underlying items. Contracts include traditional participating contracts offered in Europe and in Asia, variable annuities offered in the US, unit-linked contracts and collective investment schemes offered in Europe and investment-linked contracts offered in Asia.
Non-life The Group issues non-life contracts to corporate and individual customers. Contracts issued to medium and large businesses provide coverage for property and casualty risks, including public liability, employers’ liability and specialty cover in aviation, marine and energy. Contracts issued to individuals and small businesses provide coverage for property and casualty risks, primarily in the form of motor and home insurance contracts.
IFRS 8.IN13 a. Operating segment disclosures are consistent with the information reviewed by the chief operating decision maker (CODM) and will vary from one entity to another and may not be in accordance with IFRS.
IFRS 8.12, 22(aa) b. When two or more operating segments are aggregated into a single operating segment, the judgements made by management in applying the aggregation criteria are disclosed. This includes a brief description of the operating segments that have been aggregated in this way and the economic indicators that have been assessed in determining that the aggregated operating segments share similar economic characteristics. This guide assumes that the Group has not aggregated any operating segments.
Intr
oduc
tion
Aud
itor
s’ r
epor
tPr
imar
y st
atem
ents
NO
TE
SFu
rthe
r re
sour
ces

© 2018 KPMG IFRG Limited, a UK company, limited by guarantee. All rights reserved.
84 | Guide to annual financial statements: IFRS 17 and IFRS 9 – Illustrative disclosures for insurers
Notes to the consolidated financial statements (continued)8. Operating segments (continued)B. Information about reportable segmentsa
(million euro)
REVENUE
(million euro)
PROFIT BEFORE TAX
2021 2020
Life risk Non-lifeParticipatingLife savings
1,7
64
1,8
14
3,1
08
2,4
46
1,2
24
1,4
93
1,6
89
828
12,1
36
7,548
23,8
81
39,2
79
11,5
96
6,9
48
19,6
00
36,1
96
2021 2020
IFRS 8.27 Information related to each reportable segment is set out below. Segment revenue and profit or loss are determined by adjusting the corresponding IFRS amounts for items that relate to decisions made by the Group’s head office and are therefore considered to be outside the control of segment management. The measurement basis for segment assets and liabilities is the same as that for the corresponding IFRS amounts.
Segment results that are reported to the Group management committee include items that are directly attributable to a segment and those that can be allocated on a reasonable basis. Unallocated items mainly relate to the Group’s head office.
IFRS 8.27–28 a. To help users understand the segment information presented, the Group has disclosed information about the measurement basis adopted – e.g. the nature and effects of any differences between the measurements used in reporting segment information and those used in the Group’s financial statements, the nature and effects of any asymmetrical allocations to reportable segments and reconciliations of segment information to the corresponding IFRS amounts in the financial statements.
Intr
oduc
tion
Aud
itor
s’ r
epor
tPr
imar
y st
atem
ents
NO
TE
SFu
rthe
r re
sour
ces
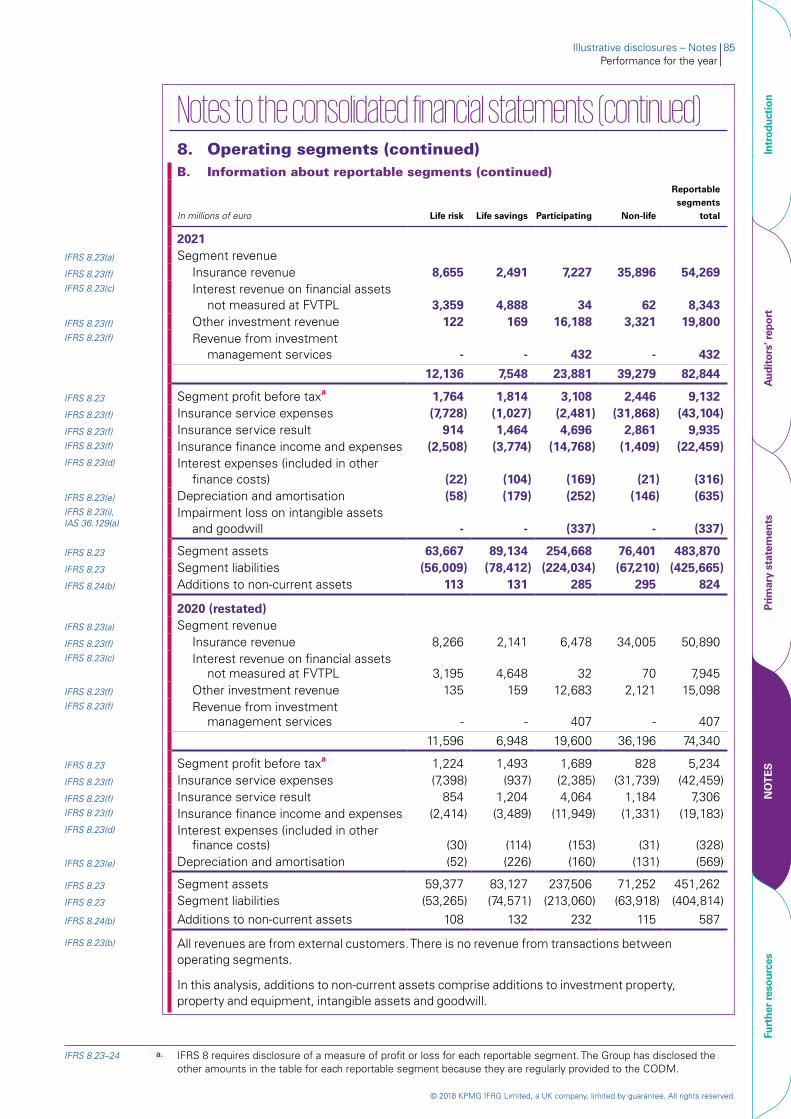
© 2018 KPMG IFRG Limited, a UK company, limited by guarantee. All rights reserved.
Illustrative disclosures – Notes 85Performance for the year
Notes to the consolidated financial statements (continued)8. Operating segments (continued)B. Information about reportable segments (continued)
In millions of euro Life risk Life savings Participating Non-life
Reportable segments
total
2021IFRS 8.23(a) Segment revenueIFRS 8.23(f) Insurance revenue 8,655 2,491 7,227 35,896 54,269 IFRS 8.23(c) Interest revenue on financial assets
not measured at FVTPL 3,359 4,888 34 62 8,343 IFRS 8.23(f) Other investment revenue 122 169 16,188 3,321 19,800 IFRS 8.23(f) Revenue from investment
management services - - 432 - 432
12,136 7,548 23,881 39,279 82,844
IFRS 8.23 Segment profit before taxa 1,764 1,814 3,108 2,446 9,132IFRS 8.23(f) Insurance service expenses (7,728) (1,027) (2,481) (31,868) (43,104) IFRS 8.23(f) Insurance service result 914 1,464 4,696 2,861 9,935IFRS 8.23(f) Insurance finance income and expenses (2,508) (3,774) (14,768) (1,409) (22,459)IFRS 8.23(d) Interest expenses (included in other
finance costs) (22) (104) (169) (21) (316) IFRS 8.23(e) Depreciation and amortisation (58) (179) (252) (146) (635) IFRS 8.23(i), IAS 36.129(a)
Impairment loss on intangible assets and goodwill - - (337) - (337)
IFRS 8.23 Segment assets 63,667 89,134 254,668 76,401 483,870 IFRS 8.23 Segment liabilities (56,009) (78,412) (224,034) (67,210) (425,665)IFRS 8.24(b) Additions to non-current assets 113 131 285 295 824
2020 (restated)IFRS 8.23(a) Segment revenueIFRS 8.23(f) Insurance revenue 8,266 2,141 6,478 34,005 50,890 IFRS 8.23(c) Interest revenue on financial assets
not measured at FVTPL 3,195 4,648 32 70 7,945 IFRS 8.23(f) Other investment revenue 135 159 12,683 2,121 15,098IFRS 8.23(f) Revenue from investment
management services - - 407 - 407
11,596 6,948 19,600 36,196 74,340
IFRS 8.23 Segment profit before taxa 1,224 1,493 1,689 828 5,234IFRS 8.23(f) Insurance service expenses (7,398) (937) (2,385) (31,739) (42,459) IFRS 8.23(f) Insurance service result 854 1,204 4,064 1,184 7,306IFRS 8.23(f) Insurance finance income and expenses (2,414) (3,489) (11,949) (1,331) (19,183)IFRS 8.23(d) Interest expenses (included in other
finance costs) (30) (114) (153) (31) (328)IFRS 8.23(e) Depreciation and amortisation (52) (226) (160) (131) (569)
IFRS 8.23 Segment assets 59,377 83,127 237,506 71,252 451,262 IFRS 8.23 Segment liabilities (53,265) (74,571) (213,060) (63,918) (404,814)
IFRS 8.24(b) Additions to non-current assets 108 132 232 115 587
IFRS 8.23(b) All revenues are from external customers. There is no revenue from transactions between operating segments.
In this analysis, additions to non-current assets comprise additions to investment property, property and equipment, intangible assets and goodwill.
IFRS 8.23–24 a. IFRS 8 requires disclosure of a measure of profit or loss for each reportable segment. The Group has disclosed the other amounts in the table for each reportable segment because they are regularly provided to the CODM.
Intr
oduc
tion
Aud
itor
s’ r
epor
tPr
imar
y st
atem
ents
NO
TE
SFu
rthe
r re
sour
ces
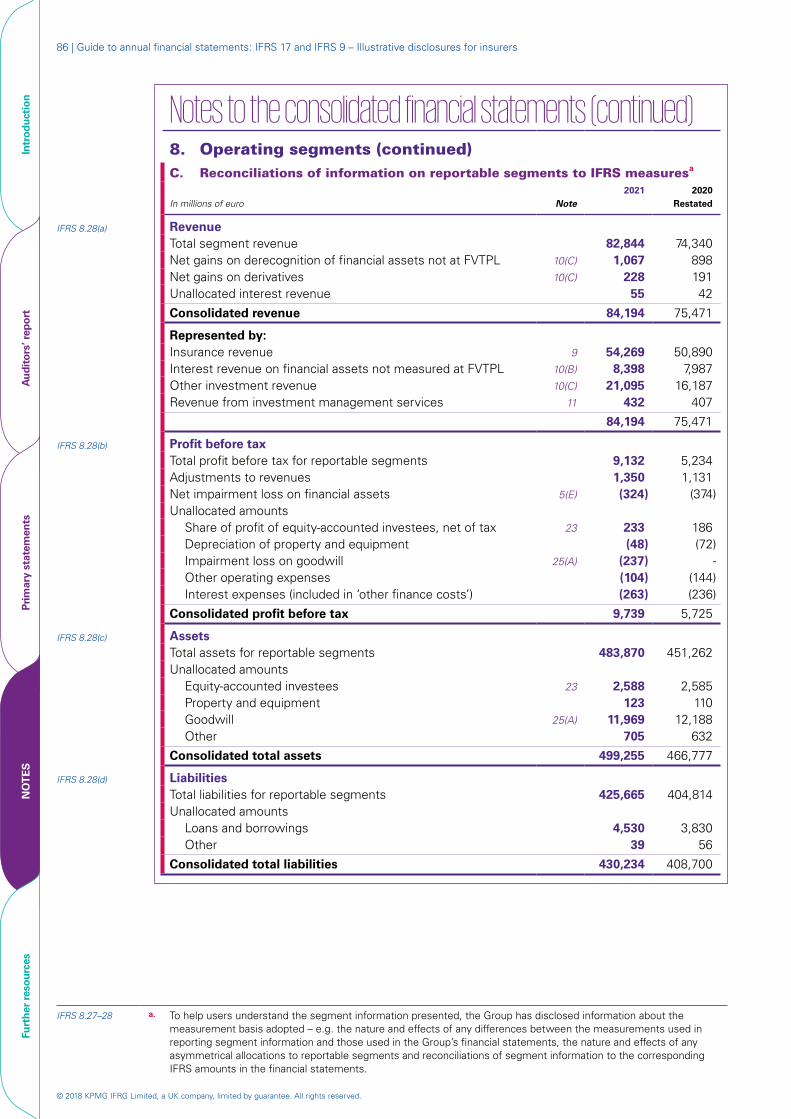
© 2018 KPMG IFRG Limited, a UK company, limited by guarantee. All rights reserved.
86 | Guide to annual financial statements: IFRS 17 and IFRS 9 – Illustrative disclosures for insurers
Notes to the consolidated financial statements (continued)8. Operating segments (continued)C. Reconciliations of information on reportable segments to IFRS measuresa
In millions of euro Note2021 2020
Restated
IFRS 8.28(a) RevenueTotal segment revenue 82,844 74,340 Net gains on derecognition of financial assets not at FVTPL 10(C) 1,067 898 Net gains on derivatives 10(C) 228 191Unallocated interest revenue 55 42
Consolidated revenue 84,194 75,471
Represented by:Insurance revenue 9 54,269 50,890Interest revenue on financial assets not measured at FVTPL 10(B) 8,398 7,987Other investment revenue 10(C) 21,095 16,187Revenue from investment management services 11 432 407
84,194 75,471
IFRS 8.28(b) Profit before taxTotal profit before tax for reportable segments 9,132 5,234 Adjustments to revenues 1,350 1,131 Net impairment loss on financial assets 5(E) (324) (374)Unallocated amounts Share of profit of equity-accounted investees, net of tax 23 233 186 Depreciation of property and equipment (48) (72) Impairment loss on goodwill 25(A) (237) - Other operating expenses (104) (144) Interest expenses (included in ‘other finance costs’) (263) (236)
Consolidated profit before tax 9,739 5,725
IFRS 8.28(c) AssetsTotal assets for reportable segments 483,870 451,262 Unallocated amounts Equity-accounted investees 23 2,588 2,585 Property and equipment 123 110 Goodwill 25(A) 11,969 12,188 Other 705 632
Consolidated total assets 499,255 466,777
IFRS 8.28(d) LiabilitiesTotal liabilities for reportable segments 425,665 404,814 Unallocated amounts Loans and borrowings 4,530 3,830 Other 39 56
Consolidated total liabilities 430,234 408,700
IFRS 8.27–28 a. To help users understand the segment information presented, the Group has disclosed information about the measurement basis adopted – e.g. the nature and effects of any differences between the measurements used in reporting segment information and those used in the Group’s financial statements, the nature and effects of any asymmetrical allocations to reportable segments and reconciliations of segment information to the corresponding IFRS amounts in the financial statements.
Intr
oduc
tion
Aud
itor
s’ r
epor
tPr
imar
y st
atem
ents
NO
TE
SFu
rthe
r re
sour
ces

© 2018 KPMG IFRG Limited, a UK company, limited by guarantee. All rights reserved.
Illustrative disclosures – Notes 87Performance for the year
Notes to the consolidated financial statements (continued)8. Operating segments (continued)C. Reconciliations of information on reportable segments to IFRS measures
(continued)
In millions of euro
Reportable segments
total AdjustmentsConsolidated
total
IFRS 8.28(e) Other material items2021Insurance service expenses (43,104) - (43,104) Insurance service result 9,935 - 9,935Insurance finance income and expenses (22,459) - (22,459)Interest expenses (included in ‘other finance costs’) (316) (263) (579)Depreciation and amortisation (635) (48) (683)Impairment loss on intangible assets and goodwill (337) - (337)Additions to non-current assets 824 17 841
2020 (restated)Insurance service expenses (42,459) - (42,459) Insurance service result 7,306 - 7,306Insurance finance income and expenses (19,183) - (19,183)Interest expenses (included in ‘other finance costs’) (328) (236) (564)Depreciation and amortisation (569) (72) (641)Additions to non-current assets 587 22 609
D. Products and servicesIFRS 8.32 The following table analyses the Group’s revenue by product and service offered.
In millions of euro2021 2020
Restated
Life risk insurance contracts Immediate fixed annuity 6,865 6,463 Other 1,790 1,803 Life savings insurance contracts Deferred fixed annuity 501 407 Universal life 1,990 1,734 Participating insurance contracts Traditional participating 3,162 2,664 Variable annuity 1,518 1,360 Unit-linked and other investment-linked 2,547 2,454 Non-life insurance contracts Motor 5,785 5,480 Property 17,191 16,285 Public liability 7,259 6,876 Employers’ liability 3,836 3,634 Other 1,825 1,730 Financial investments and derivatives 29,493 24,174 Investment management services 432 407
Consolidated revenue 84,194 75,471
Intr
oduc
tion
Aud
itor
s’ r
epor
tPr
imar
y st
atem
ents
NO
TE
SFu
rthe
r re
sour
ces
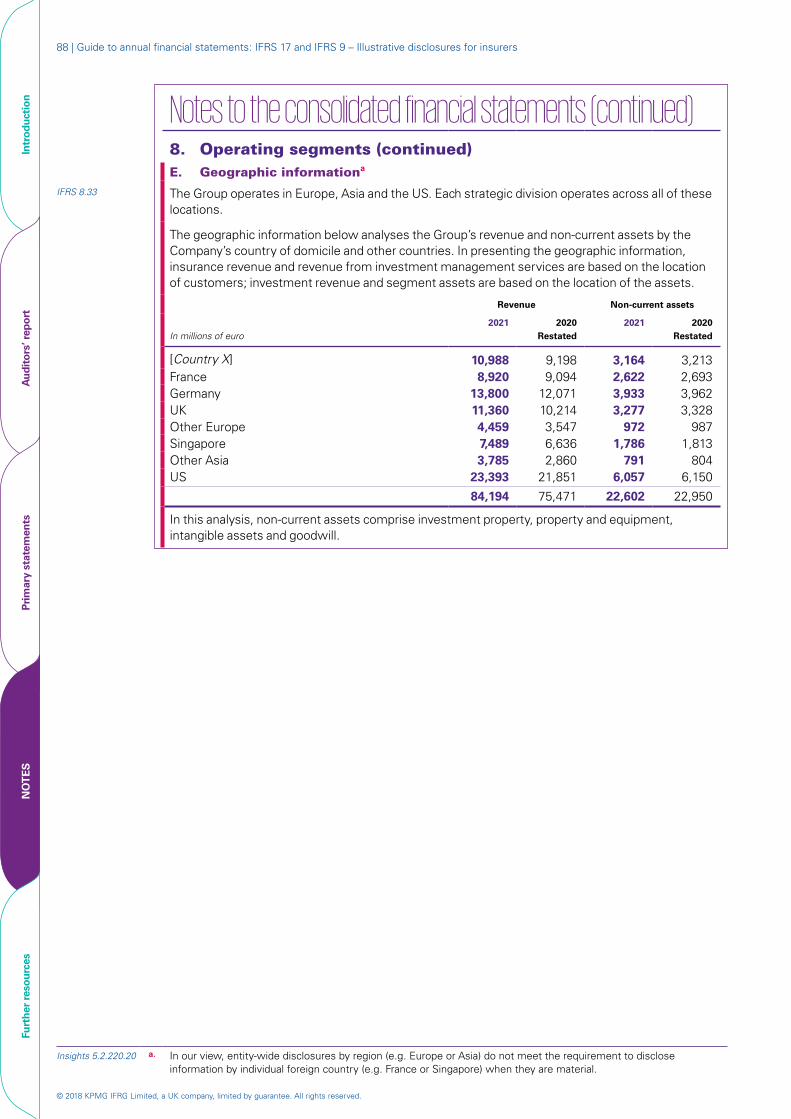
© 2018 KPMG IFRG Limited, a UK company, limited by guarantee. All rights reserved.
88 | Guide to annual financial statements: IFRS 17 and IFRS 9 – Illustrative disclosures for insurers
Notes to the consolidated financial statements (continued)8. Operating segments (continued)E. Geographic informationa
IFRS 8.33 The Group operates in Europe, Asia and the US. Each strategic division operates across all of these locations.
The geographic information below analyses the Group’s revenue and non-current assets by the Company’s country of domicile and other countries. In presenting the geographic information, insurance revenue and revenue from investment management services are based on the location of customers; investment revenue and segment assets are based on the location of the assets.
Revenue Non-current assets
In millions of euro2021 2020
Restated2021 2020
Restated
[Country X] 10,988 9,198 3,164 3,213France 8,920 9,094 2,622 2,693Germany 13,800 12,071 3,933 3,962UK 11,360 10,214 3,277 3,328Other Europe 4,459 3,547 972 987Singapore 7,489 6,636 1,786 1,813Other Asia 3,785 2,860 791 804US 23,393 21,851 6,057 6,150
84,194 75,471 22,602 22,950
In this analysis, non-current assets comprise investment property, property and equipment, intangible assets and goodwill.
Insights 5.2.220.20 a. In our view, entity-wide disclosures by region (e.g. Europe or Asia) do not meet the requirement to disclose information by individual foreign country (e.g. France or Singapore) when they are material.
Intr
oduc
tion
Aud
itor
s’ r
epor
tPr
imar
y st
atem
ents
NO
TE
SFu
rthe
r re
sour
ces
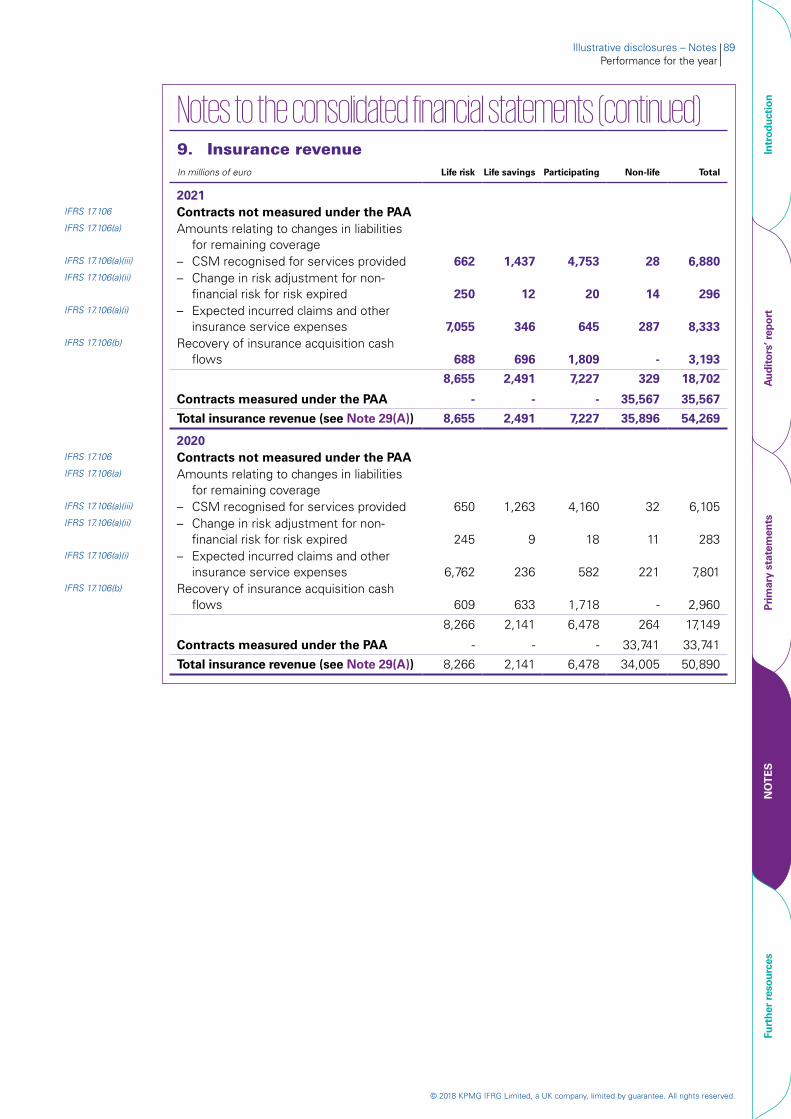
© 2018 KPMG IFRG Limited, a UK company, limited by guarantee. All rights reserved.
Illustrative disclosures – Notes 89Performance for the year
Notes to the consolidated financial statements (continued)9. Insurance revenueIn millions of euro Life risk Life savings Participating Non-life Total
2021IFRS 17.106 Contracts not measured under the PAAIFRS 17.106(a) Amounts relating to changes in liabilities
for remaining coverageIFRS 17.106(a)(iii) – CSM recognised for services provided 662 1,437 4,753 28 6,880 IFRS 17.106(a)(ii) – Change in risk adjustment for non-
financial risk for risk expired 250 12 20 14 296 IFRS 17.106(a)(i) – Expected incurred claims and other
insurance service expenses 7,055 346 645 287 8,333IFRS 17.106(b) Recovery of insurance acquisition cash
flows 688 696 1,809 - 3,193
8,655 2,491 7,227 329 18,702
Contracts measured under the PAA - - - 35,567 35,567
Total insurance revenue (see Note 29(A)) 8,655 2,491 7,227 35,896 54,269
2020IFRS 17.106 Contracts not measured under the PAAIFRS 17.106(a) Amounts relating to changes in liabilities
for remaining coverageIFRS 17.106(a)(iii) – CSM recognised for services provided 650 1,263 4,160 32 6,105 IFRS 17.106(a)(ii) – Change in risk adjustment for non-
financial risk for risk expired 245 9 18 11 283 IFRS 17.106(a)(i) – Expected incurred claims and other
insurance service expenses 6,762 236 582 221 7,801IFRS 17.106(b) Recovery of insurance acquisition cash
flows 609 633 1,718 - 2,960
8,266 2,141 6,478 264 17,149
Contracts measured under the PAA - - - 33,741 33,741
Total insurance revenue (see Note 29(A)) 8,266 2,141 6,478 34,005 50,890
Intr
oduc
tion
Aud
itor
s’ r
epor
tPr
imar
y st
atem
ents
NO
TE
SFu
rthe
r re
sour
ces
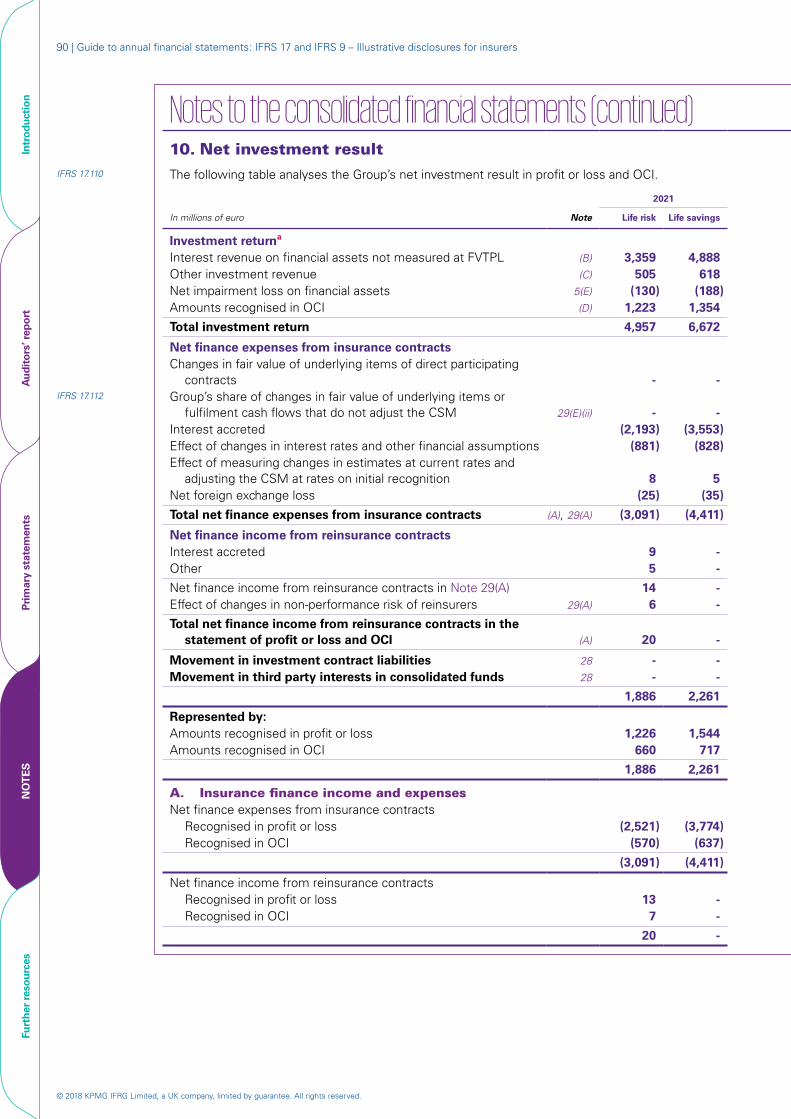
© 2018 KPMG IFRG Limited, a UK company, limited by guarantee. All rights reserved.
90 | Guide to annual financial statements: IFRS 17 and IFRS 9 – Illustrative disclosures for insurers
Notes to the consolidated financial statements (continued) 10. Net investment result
IFRS 17.110 The following table analyses the Group’s net investment result in profit or loss and OCI.
2021 2021 2020
In millions of euro Note Life risk Life savings Participating Non-life Other Total Life risk Life savings Participating Non-life Other Total
Investment returna
Interest revenue on financial assets not measured at FVTPL (B) 3,359 4,888 34 62 55 8,398 3,195 4,648 32 70 42 7,987 Other investment revenue (C) 505 618 16,409 3,563 - 21,095 439 536 12,868 2,344 - 16,187 Net impairment loss on financial assets 5(E) (130) (188) (2) (4) - (324) (157) (209) (2) (6) - (374)Amounts recognised in OCI (D) 1,223 1,354 11 15 - 2,603 812 904 4 7 - 1,727
Total investment return 4,957 6,672 16,452 3,636 55 31,772 4,289 5,879 12,902 2,415 42 25,527
Net finance expenses from insurance contractsChanges in fair value of underlying items of direct participating
contracts - - (14,948) - - (14,948) - - (12,064) - - (12,064)IFRS 17.112 Group’s share of changes in fair value of underlying items or
fulfilment cash flows that do not adjust the CSM 29(E)(ii) - - 45 - - 45 - - 22 - - 22Interest accreted (2,193) (3,553) - (1,637) - (7,383) (2,136) (3,335) - (1,543) - (7,014)Effect of changes in interest rates and other financial assumptions (881) (828) - (5) - (1,714) (806) (680) - (5) - (1,491)Effect of measuring changes in estimates at current rates and
adjusting the CSM at rates on initial recognition 8 5 - - - 13 (6) (5) - - - (11)Net foreign exchange loss (25) (35) - (15) - (75) (25) (53) - (21) - (99)
Total net finance expenses from insurance contracts (A), 29(A) (3,091) (4,411) (14,903) (1,657) - (24,062) (2,973) (4,073) (12,042) (1,569) - (20,657)
Net finance income from reinsurance contractsInterest accreted 9 - 100 264 - 373 8 - 83 246 - 337Other 5 - 18 6 - 29 4 - 24 9 - 37
Net finance income from reinsurance contracts in Note 29(A) 14 - 118 270 - 402 12 - 107 255 - 374Effect of changes in non-performance risk of reinsurers 29(A) 6 - 17 (22) - 1 (2) - (14) (17) - (33)
Total net finance income from reinsurance contracts in the statement of profit or loss and OCI (A) 20 - 135 248 - 403 10 - 93 238 - 341
Movement in investment contract liabilities 28 - - (1,311) - - (1,311) - - (641) - - (641)Movement in third party interests in consolidated funds 28 - - (62) - - (62) - - (59) - - (59)
1,886 2,261 311 2,227 55 6,740 1,319 1,806 260 1,084 42 4,511
Represented by:Amounts recognised in profit or loss 1,226 1,544 300 2,212 55 5,337 1,056 1,486 256 1,077 42 3,917 Amounts recognised in OCI 660 717 11 15 - 1,403 263 320 4 7 - 594
1,886 2,261 311 2,227 55 6,740 1,319 1,806 260 1,084 42 4,511
A. Insurance finance income and expensesNet finance expenses from insurance contracts
Recognised in profit or loss (2,521) (3,774) (14,903) (1,657) - (22,855) (2,419) (3,489) (12,042) (1,569) - (19,519)Recognised in OCI (570) (637) - - - (1,207) (554) (584) - - - (1,138)
(3,091) (4,411) (14,903) (1,657) - (24,062) (2,973) (4,073) (12,042) (1,569) - (20,657)
Net finance income from reinsurance contractsRecognised in profit or loss 13 - 135 248 - 396 5 - 93 238 - 336Recognised in OCI 7 - - - - 7 5 - - - - 5
20 - 135 248 - 403 10 - 93 238 - 341
Intr
oduc
tion
Aud
itor
s’ r
epor
tPr
imar
y st
atem
ents
NO
TE
SFu
rthe
r re
sour
ces
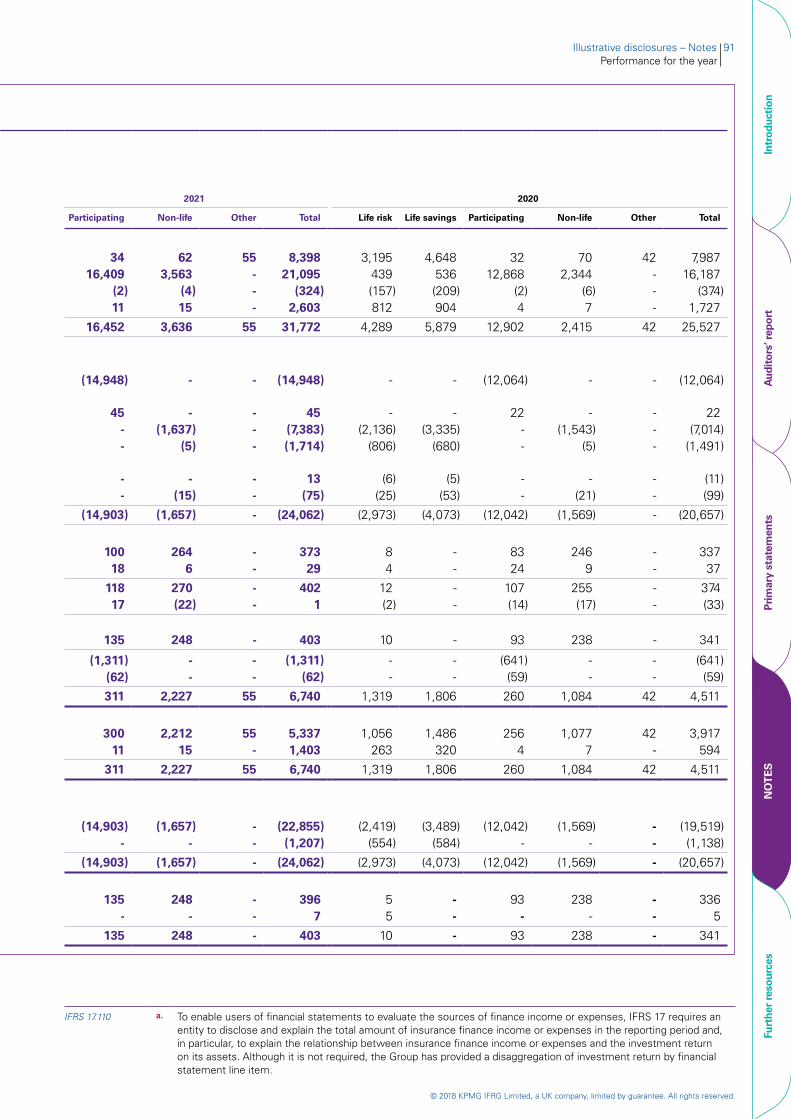
© 2018 KPMG IFRG Limited, a UK company, limited by guarantee. All rights reserved.
Illustrative disclosures – Notes 91Performance for the year
Notes to the consolidated financial statements (continued) 10. Net investment result
IFRS 17.110 The following table analyses the Group’s net investment result in profit or loss and OCI.
2021 2021 2020
Participating Non-life Other Total Life risk Life savings Participating Non-life Other Total
34 16,409
(2) 11
62 3,563
(4) 15
55 - - -
8,398 21,095
(324) 2,603
3,195 439
(157) 812
4,648 536
(209) 904
32 12,868
(2) 4
70 2,344
(6) 7
42 - - -
7,987 16,187
(374) 1,727
16,452 3,636 55 31,772 4,289 5,879 12,902 2,415 42 25,527
(14,948) - - (14,948) - - (12,064) - - (12,064)
45 - - 45 - - 22 - - 22 - -
(1,637) (5)
- -
(7,383) (1,714)
(2,136) (806)
(3,335) (680)
- -
(1,543) (5)
- -
(7,014) (1,491)
- -
- (15)
- -
13 (75)
(6) (25)
(5) (53)
- -
- (21)
- -
(11) (99)
(14,903) (1,657) - (24,062) (2,973) (4,073) (12,042) (1,569) - (20,657)
100 264 - 373 8 - 83 246 - 33718 6 - 29 4 - 24 9 - 37
118 270 - 402 12 - 107 255 - 374 17 (22) - 1 (2) - (14) (17) - (33)
135 248 - 403 10 - 93 238 - 341
(1,311) (62)
- -
- -
(1,311) (62)
- -
- -
(641) (59)
- -
- -
(641) (59)
311 2,227 55 6,740 1,319 1,806 260 1,084 42 4,511
300 11
2,212 15
55 -
5,337 1,403
1,056 263
1,486 320
256 4
1,077 7
42 -
3,917 594
311 2,227 55 6,740 1,319 1,806 260 1,084 42 4,511
(14,903)-
(1,657)-
- (22,855)- (1,207)
(2,419) (554)
(3,489)(584)
(12,042) -
(1,569) -
- (19,519)- (1,138)
(14,903) (1,657) - (24,062) (2,973) (4,073) (12,042) (1,569) - (20,657)
135 248 - 396 5 - 93 238 - 336 - - - 7 5 - - - - 5
135 248 - 403 10 - 93 238 - 341
In millions of euro Note Life risk Life savings
Investment returna
Interest revenue on financial assets not measured at FVTPL (B) 3,359 4,888 Other investment revenue (C) 505 618Net impairment loss on financial assets 5(E) (130) (188)Amounts recognised in OCI (D) 1,223 1,354
Total investment return 4,957 6,672
Net finance expenses from insurance contractsChanges in fair value of underlying items of direct participating
contracts - - IFRS 17.112 Group’s share of changes in fair value of underlying items or
fulfilment cash flows that do not adjust the CSM 29(E)(ii) - - Interest accreted (2,193) (3,553)Effect of changes in interest rates and other financial assumptions (881) (828)Effect of measuring changes in estimates at current rates and
adjusting the CSM at rates on initial recognition 8 5 Net foreign exchange loss (25) (35)
Total net finance expenses from insurance contracts (A), 29(A) (3,091) (4,411)
Net finance income from reinsurance contractsInterest accreted 9 - Other 5 -
Net finance income from reinsurance contracts in Note 29(A) 14 - Effect of changes in non-performance risk of reinsurers 29(A) 6 -
Total net finance income from reinsurance contracts in the statement of profit or loss and OCI (A) 20 -
Movement in investment contract liabilities 28 - - Movement in third party interests in consolidated funds 28 - -
1,886 2,261
Represented by:Amounts recognised in profit or loss 1,226 1,544 Amounts recognised in OCI 660 717
1,886 2,261
A. Insurance finance income and expensesNet finance expenses from insurance contracts
Recognised in profit or loss (2,521) (3,774) Recognised in OCI (570) (637)
(3,091) (4,411)
Net finance income from reinsurance contractsRecognised in profit or loss 13 -Recognised in OCI 7 -
20 -
IFRS 17.110 a. To enable users of financial statements to evaluate the sources of finance income or expenses, IFRS 17 requires an entity to disclose and explain the total amount of insurance finance income or expenses in the reporting period and, in particular, to explain the relationship between insurance finance income or expenses and the investment return on its assets. Although it is not required, the Group has provided a disaggregation of investment return by financial statement line item.
Intr
oduc
tion
Aud
itor
s’ r
epor
tPr
imar
y st
atem
ents
NO
TE
SFu
rthe
r re
sour
ces

© 2018 KPMG IFRG Limited, a UK company, limited by guarantee. All rights reserved.
92 | Guide to annual financial statements: IFRS 17 and IFRS 9 – Illustrative disclosures for insurers
Notes to the consolidated financial statements (continued)10. Net investment result (continued)B. Interest revenue on financial assets not measured at FVTPLa
In millions of euro2021 2020
Restated
IFRS 7.20(b) Debt investments measured at FVOCIGovernment bonds 3,616 3,280Other debt securities 3,907 3,422
7,523 6,702
Available-for-sale financial assetsGovernment bonds 232Other debt securities 211
443
IFRS 7.20(b) Financial assets measured at amortised costCash and cash equivalents 312 286 Deposits with financial institutions 53 49 Government bonds 227 212 Other debt securities 138 144 Receivables from reverse sale-and-repurchase counterparties 145 151
875 842
8,398 7,987
IFRS 7.20(b), IAS 1.97
a. The Group has provided a disaggregation of interest revenue on financial assets not measured at FVTPL by class. Although this level of disaggregation is optional, an entity is required to disclose separately any material items of income and expense and gains and losses arising from financial assets and financial liabilities.
Intr
oduc
tion
Aud
itor
s’ r
epor
tPr
imar
y st
atem
ents
NO
TE
SFu
rthe
r re
sour
ces

© 2018 KPMG IFRG Limited, a UK company, limited by guarantee. All rights reserved.
Illustrative disclosures – Notes 93Performance for the year
Notes to the consolidated financial statements (continued)10. Net investment result (continued)C. Other investment revenue
In millions of euro Note2021 2020
Restated
Underlying itemsIFRS 7.20(a)(i) Net gains on financial instruments mandatorily measured at FVTPLa
Deposits with financial institutions 24 16 Derivatives 203 169 Investments in equity securities 7,307 5,161Investments in collective investment schemes 7,792 6,368 Associates held by participating funds 239 194
15,565 11,908IFRS 7.20(a)(i) Net gains on Company’s own shares measured at FVTPLa 18 37 IFRS 16.90(b)–91, IAS 40.75(f)(i)
Lease income from investment property 22 487 474
Net change in fair value of investment property 22 140 59Net change in fair value of owner-occupied property at fair value 24 60 42
16,270 12,520
OtherIFRS 7.20(a)(i) Net gains on financial assets designated as at FVTPLa
Government bonds 1,268 889 Other debt securities 2,242 1,406
3,510 2,295
IFRS 7.20(a)(i) Net gains on derivativesa 228 191IFRS 7.20(a)(viii), IAS 1.98(d)
Debt investments at FVOCI – net gains on derecognition 1,067
Available-for-sale financial assetsIAS 1.98(d) Net gains on derecognition 898
Dividends 21 Financial assets not measured at FVTPL – net foreign exchange gain 20 262
4,825 3,667
21,095 16,187
IAS 21.52(a) Other than exchange differences on financial instruments measured at FVTPL, in 2021 the Group recognised a net exchange loss of €52 million (2020: gain of €136 million) in profit or loss. Exchange differences on insurance and reinsurance contracts are included in insurance finance income and expenses (see (A)). Exchange differences on financial liabilities are included in other finance costs (see Note 14).
IFRS 7.20(a)(i), IAS 1.97
a. The Group has provided a disaggregation of net gains on financial instruments mandatorily measured at FVTPL and financial assets designated as at FVTPL by class. Although this level of disaggregation is optional, an entity is required to disclose separately any material items of income and expense and gains and losses arising from financial assets and financial liabilities.
Intr
oduc
tion
Aud
itor
s’ r
epor
tPr
imar
y st
atem
ents
NO
TE
SFu
rthe
r re
sour
ces
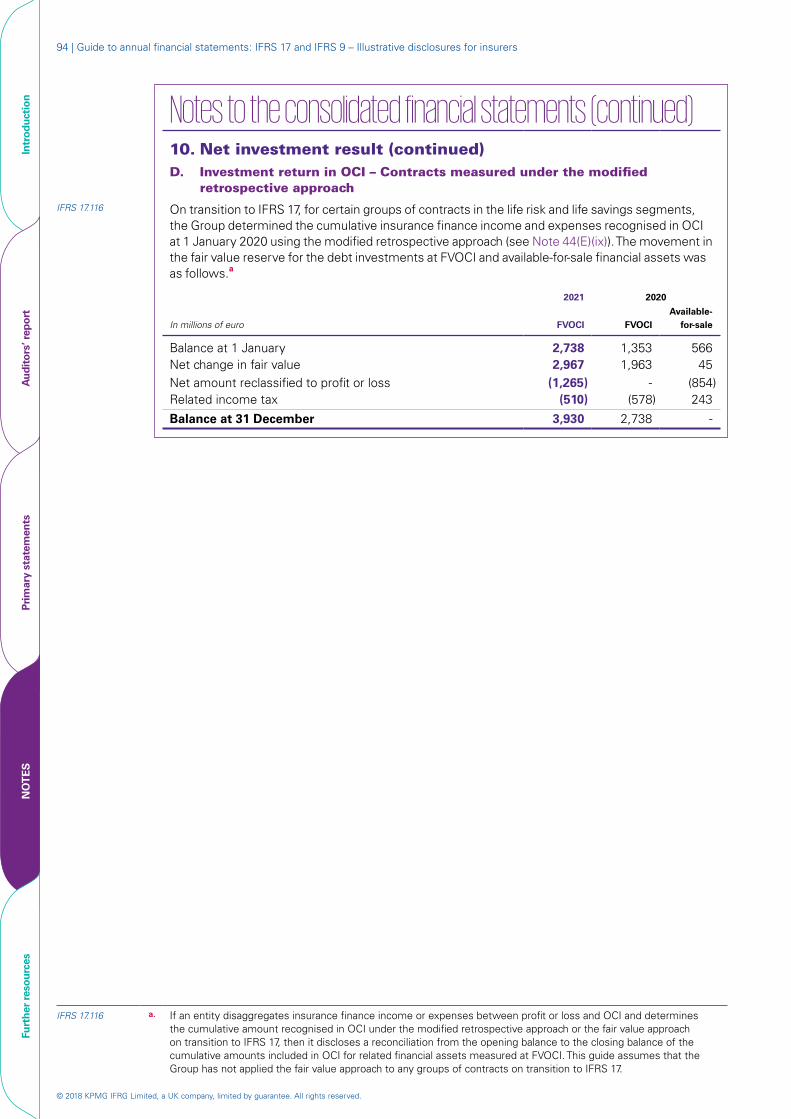
© 2018 KPMG IFRG Limited, a UK company, limited by guarantee. All rights reserved.
94 | Guide to annual financial statements: IFRS 17 and IFRS 9 – Illustrative disclosures for insurers
Notes to the consolidated financial statements (continued)10. Net investment result (continued)D. Investment return in OCI – Contracts measured under the modified
retrospective approachIFRS 17.116 On transition to IFRS 17, for certain groups of contracts in the life risk and life savings segments,
the Group determined the cumulative insurance finance income and expenses recognised in OCI at 1 January 2020 using the modified retrospective approach (see Note 44(E)(ix)). The movement in the fair value reserve for the debt investments at FVOCI and available-for-sale financial assets was as follows.a
2021 2020
In millions of euro FVOCI FVOCIAvailable-
for-sale
Balance at 1 January 2,738 1,353 566Net change in fair value 2,967 1,963 45Net amount reclassified to profit or loss (1,265) - (854)Related income tax (510) (578) 243
Balance at 31 December 3,930 2,738 -
IFRS 17.116 a. If an entity disaggregates insurance finance income or expenses between profit or loss and OCI and determines the cumulative amount recognised in OCI under the modified retrospective approach or the fair value approach on transition to IFRS 17, then it discloses a reconciliation from the opening balance to the closing balance of the cumulative amounts included in OCI for related financial assets measured at FVOCI. This guide assumes that the Group has not applied the fair value approach to any groups of contracts on transition to IFRS 17.
Intr
oduc
tion
Aud
itor
s’ r
epor
tPr
imar
y st
atem
ents
NO
TE
SFu
rthe
r re
sour
ces
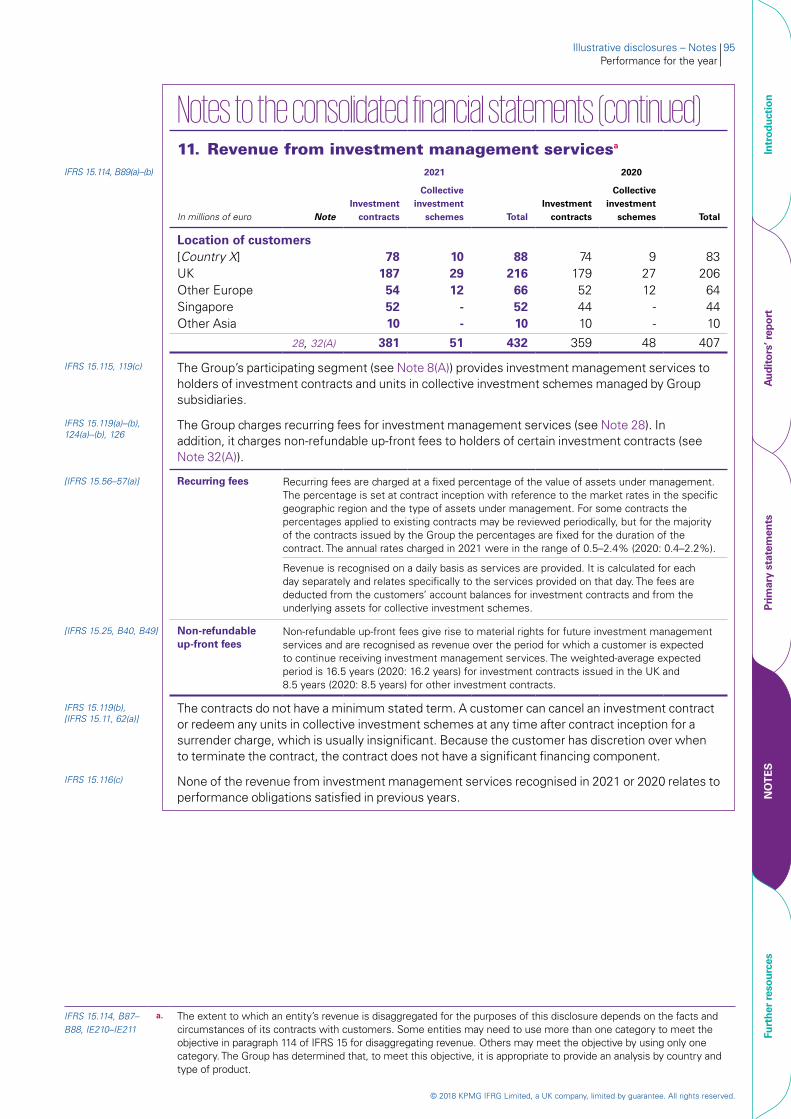
© 2018 KPMG IFRG Limited, a UK company, limited by guarantee. All rights reserved.
Illustrative disclosures – Notes 95Performance for the year
Notes to the consolidated financial statements (continued)11. Revenue from investment management servicesa
IFRS 15.114, B89(a)–(b) 2021 2020
In millions of euro NoteInvestment
contracts
Collective investment
schemes TotalInvestment
contracts
Collective investment
schemes Total
Location of customers[Country X] 78 10 88 74 9 83UK 187 29 216 179 27 206Other Europe 54 12 66 52 12 64Singapore 52 - 52 44 - 44Other Asia 10 - 10 10 - 10
28, 32(A) 381 51 432 359 48 407
IFRS 15.115, 119(c) The Group’s participating segment (see Note 8(A)) provides investment management services to holders of investment contracts and units in collective investment schemes managed by Group subsidiaries.
IFRS 15.119(a)–(b), 124(a)–(b), 126
The Group charges recurring fees for investment management services (see Note 28). In addition, it charges non-refundable up-front fees to holders of certain investment contracts (see Note 32(A)).
[IFRS 15.56–57(a)] Recurring fees Recurring fees are charged at a fixed percentage of the value of assets under management. The percentage is set at contract inception with reference to the market rates in the specific geographic region and the type of assets under management. For some contracts the percentages applied to existing contracts may be reviewed periodically, but for the majority of the contracts issued by the Group the percentages are fixed for the duration of the contract. The annual rates charged in 2021 were in the range of 0.5–2.4% (2020: 0.4–2.2%).
Revenue is recognised on a daily basis as services are provided. It is calculated for each day separately and relates specifically to the services provided on that day. The fees are deducted from the customers’ account balances for investment contracts and from the underlying assets for collective investment schemes.
[IFRS 15.25, B40, B49] Non-refundable up-front fees
Non-refundable up-front fees give rise to material rights for future investment management services and are recognised as revenue over the period for which a customer is expected to continue receiving investment management services. The weighted-average expected period is 16.5 years (2020: 16.2 years) for investment contracts issued in the UK and 8.5 years (2020: 8.5 years) for other investment contracts.
IFRS 15.119(b), [IFRS 15.11, 62(a)]
The contracts do not have a minimum stated term. A customer can cancel an investment contract or redeem any units in collective investment schemes at any time after contract inception for a surrender charge, which is usually insignificant. Because the customer has discretion over when to terminate the contract, the contract does not have a significant financing component.
IFRS 15.116(c) None of the revenue from investment management services recognised in 2021 or 2020 relates to performance obligations satisfied in previous years.
IFRS 15.114, B87–B88, IE210–IE211
a. The extent to which an entity’s revenue is disaggregated for the purposes of this disclosure depends on the facts and circumstances of its contracts with customers. Some entities may need to use more than one category to meet the objective in paragraph 114 of IFRS 15 for disaggregating revenue. Others may meet the objective by using only one category. The Group has determined that, to meet this objective, it is appropriate to provide an analysis by country and type of product.
Intr
oduc
tion
Aud
itor
s’ r
epor
tPr
imar
y st
atem
ents
NO
TE
SFu
rthe
r re
sour
ces
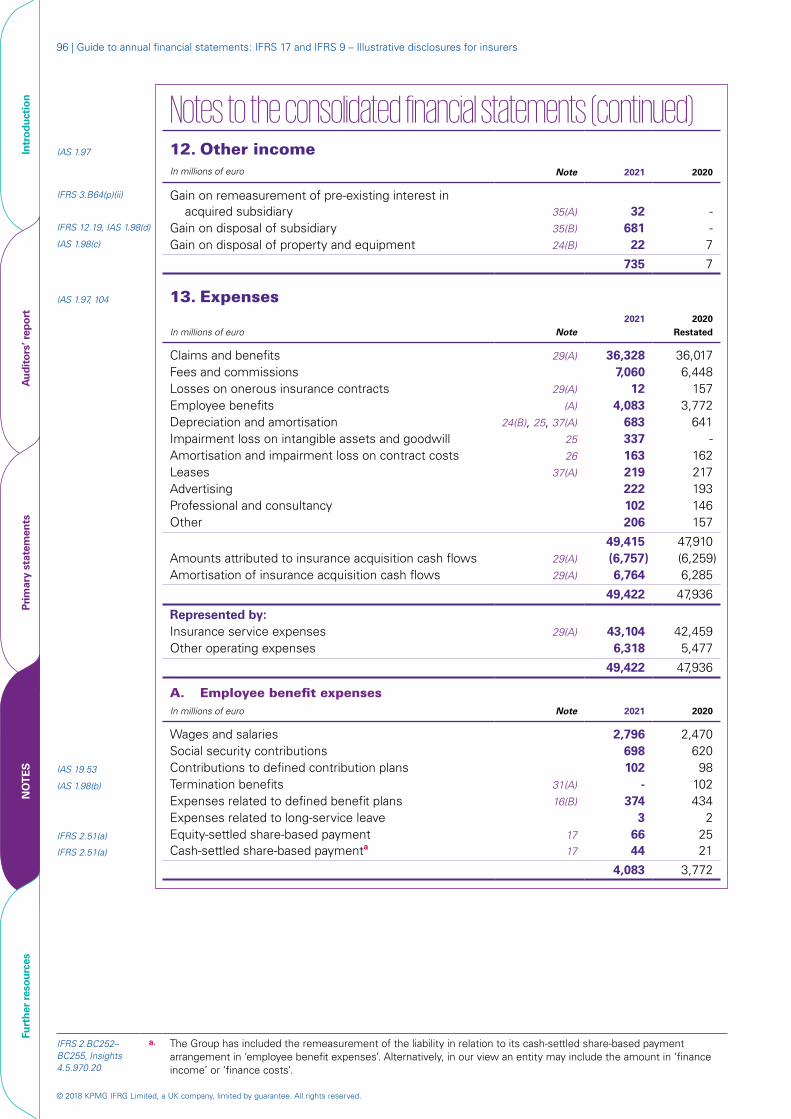
© 2018 KPMG IFRG Limited, a UK company, limited by guarantee. All rights reserved.
96 | Guide to annual financial statements: IFRS 17 and IFRS 9 – Illustrative disclosures for insurers
Notes to the consolidated financial statements (continued)
IAS 1.97 12. Other incomeIn millions of euro Note 2021 2020
IFRS 3.B64(p)(ii) Gain on remeasurement of pre-existing interest in acquired subsidiary 35(A) 32 -
IFRS 12.19, IAS 1.98(d) Gain on disposal of subsidiary 35(B) 681 -IAS 1.98(c) Gain on disposal of property and equipment 24(B) 22 7
735 7
IAS 1.97, 104 13. Expenses
In millions of euro Note2021 2020
Restated
Claims and benefits 29(A) 36,328 36,017 Fees and commissions 7,060 6,448Losses on onerous insurance contracts 29(A) 12 157Employee benefits (A) 4,083 3,772 Depreciation and amortisation 24(B), 25, 37(A) 683 641 Impairment loss on intangible assets and goodwill 25 337 - Amortisation and impairment loss on contract costs 26 163 162 Leases 37(A) 219 217 Advertising 222 193 Professional and consultancy 102 146 Other 206 157
49,415 47,910Amounts attributed to insurance acquisition cash flows 29(A) (6,757) (6,259)Amortisation of insurance acquisition cash flows 29(A) 6,764 6,285
49,422 47,936
Represented by:Insurance service expenses 29(A) 43,104 42,459 Other operating expenses 6,318 5,477
49,422 47,936
A. Employee benefit expensesIn millions of euro Note 2021 2020
Wages and salaries 2,796 2,470 Social security contributions 698 620
IAS 19.53 Contributions to defined contribution plans 102 98 IAS 1.98(b) Termination benefits 31(A) - 102
Expenses related to defined benefit plans 16(B) 374 434 Expenses related to long-service leave 3 2
IFRS 2.51(a) Equity-settled share-based payment 17 66 25 IFRS 2.51(a) Cash-settled share-based paymenta 17 44 21
4,083 3,772
IFRS 2.BC252–BC255, Insights 4.5.970.20
a. The Group has included the remeasurement of the liability in relation to its cash-settled share-based payment arrangement in ‘employee benefit expenses’. Alternatively, in our view an entity may include the amount in ‘finance income’ or ‘finance costs’.
Intr
oduc
tion
Aud
itor
s’ r
epor
tPr
imar
y st
atem
ents
NO
TE
SFu
rthe
r re
sour
ces
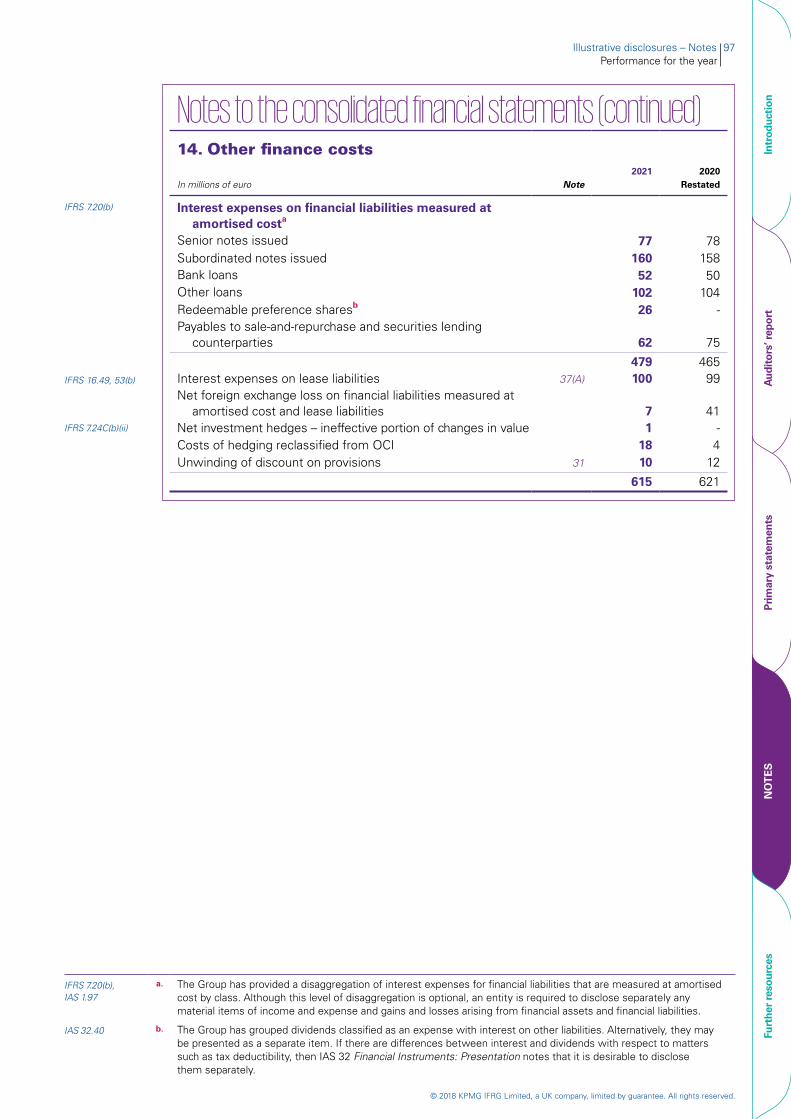
© 2018 KPMG IFRG Limited, a UK company, limited by guarantee. All rights reserved.
Illustrative disclosures – Notes 97Performance for the year
Notes to the consolidated financial statements (continued)14. Other finance costs
In millions of euro Note2021 2020
Restated
IFRS 7.20(b) Interest expenses on financial liabilities measured at amortised costa
Senior notes issued 77 78Subordinated notes issued 160 158Bank loans 52 50Other loans 102 104Redeemable preference sharesb 26 -Payables to sale-and-repurchase and securities lending
counterparties 62 75
479 465IFRS 16.49, 53(b) Interest expenses on lease liabilities 37(A) 100 99
Net foreign exchange loss on financial liabilities measured at amortised cost and lease liabilities 7 41
IFRS 7.24C(b)(ii) Net investment hedges – ineffective portion of changes in value 1 -Costs of hedging reclassified from OCI 18 4Unwinding of discount on provisions 31 10 12
615 621
IFRS 7.20(b), IAS 1.97
a. The Group has provided a disaggregation of interest expenses for financial liabilities that are measured at amortised cost by class. Although this level of disaggregation is optional, an entity is required to disclose separately any material items of income and expense and gains and losses arising from financial assets and financial liabilities.
IAS 32.40 b. The Group has grouped dividends classified as an expense with interest on other liabilities. Alternatively, they may be presented as a separate item. If there are differences between interest and dividends with respect to matters such as tax deductibility, then IAS 32 Financial Instruments: Presentation notes that it is desirable to disclose them separately.
Intr
oduc
tion
Aud
itor
s’ r
epor
tPr
imar
y st
atem
ents
NO
TE
SFu
rthe
r re
sour
ces
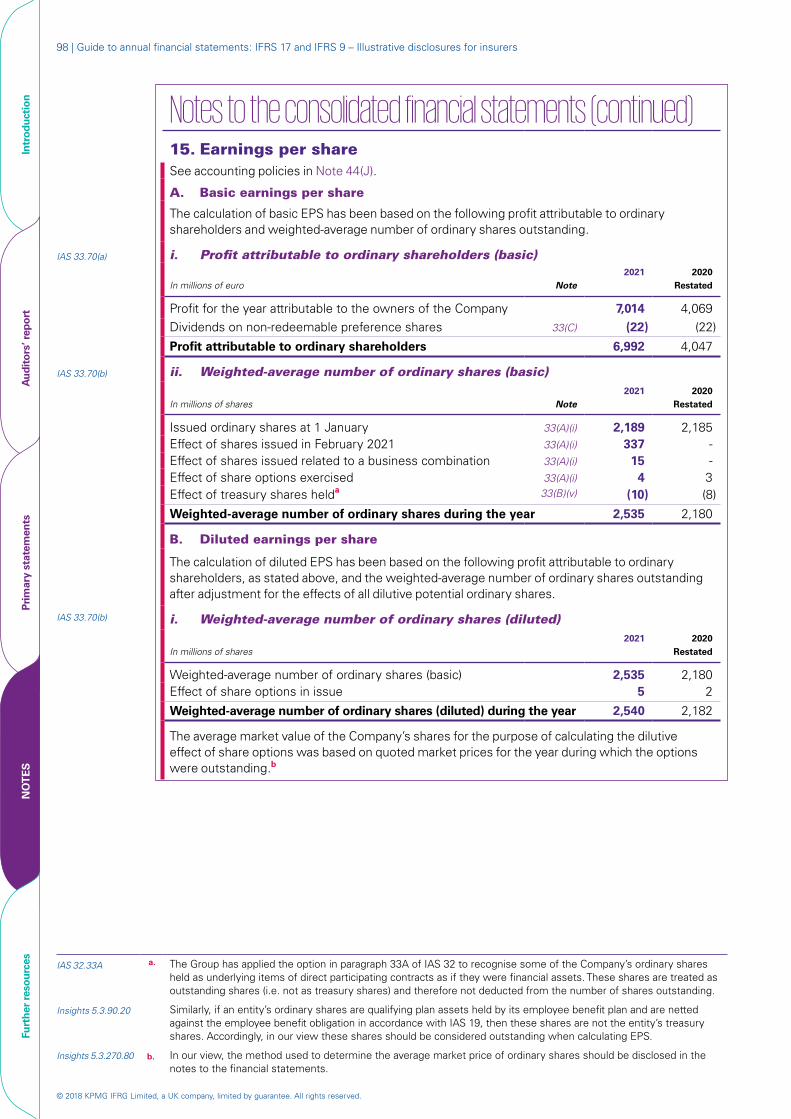
© 2018 KPMG IFRG Limited, a UK company, limited by guarantee. All rights reserved.
98 | Guide to annual financial statements: IFRS 17 and IFRS 9 – Illustrative disclosures for insurers
Notes to the consolidated financial statements (continued)
15. Earnings per shareSee accounting policies in Note 44(J).
A. Basic earnings per share
The calculation of basic EPS has been based on the following profit attributable to ordinary shareholders and weighted-average number of ordinary shares outstanding.
IAS 33.70(a) i. Profit attributable to ordinary shareholders (basic)
In millions of euro Note2021 2020
Restated
Profit for the year attributable to the owners of the Company 7,014 4,069Dividends on non-redeemable preference shares 33(C) (22) (22)
Profit attributable to ordinary shareholders 6,992 4,047
IAS 33.70(b) ii. Weighted-average number of ordinary shares (basic)
In millions of shares Note2021 2020
Restated
Issued ordinary shares at 1 January 33(A)(i) 2,189 2,185Effect of shares issued in February 2021 33(A)(i) 337 -Effect of shares issued related to a business combination 33(A)(i) 15 -Effect of share options exercised 33(A)(i) 4 3Effect of treasury shares helda 33(B)(v) (10) (8)
Weighted-average number of ordinary shares during the year 2,535 2,180
B. Diluted earnings per share
The calculation of diluted EPS has been based on the following profit attributable to ordinary shareholders, as stated above, and the weighted-average number of ordinary shares outstanding after adjustment for the effects of all dilutive potential ordinary shares.
IAS 33.70(b) i. Weighted-average number of ordinary shares (diluted)
In millions of shares2021 2020
Restated
Weighted-average number of ordinary shares (basic) 2,535 2,180Effect of share options in issue 5 2
Weighted-average number of ordinary shares (diluted) during the year 2,540 2,182
The average market value of the Company’s shares for the purpose of calculating the dilutive effect of share options was based on quoted market prices for the year during which the options were outstanding.b
IAS 32.33A a. The Group has applied the option in paragraph 33A of IAS 32 to recognise some of the Company’s ordinary shares held as underlying items of direct participating contracts as if they were financial assets. These shares are treated as outstanding shares (i.e. not as treasury shares) and therefore not deducted from the number of shares outstanding.
Insights 5.3.90.20 Similarly, if an entity’s ordinary shares are qualifying plan assets held by its employee benefit plan and are netted against the employee benefit obligation in accordance with IAS 19, then these shares are not the entity’s treasury shares. Accordingly, in our view these shares should be considered outstanding when calculating EPS.
Insights 5.3.270.80 b. In our view, the method used to determine the average market price of ordinary shares should be disclosed in the notes to the financial statements.
Intr
oduc
tion
Aud
itor
s’ r
epor
tPr
imar
y st
atem
ents
NO
TE
SFu
rthe
r re
sour
ces
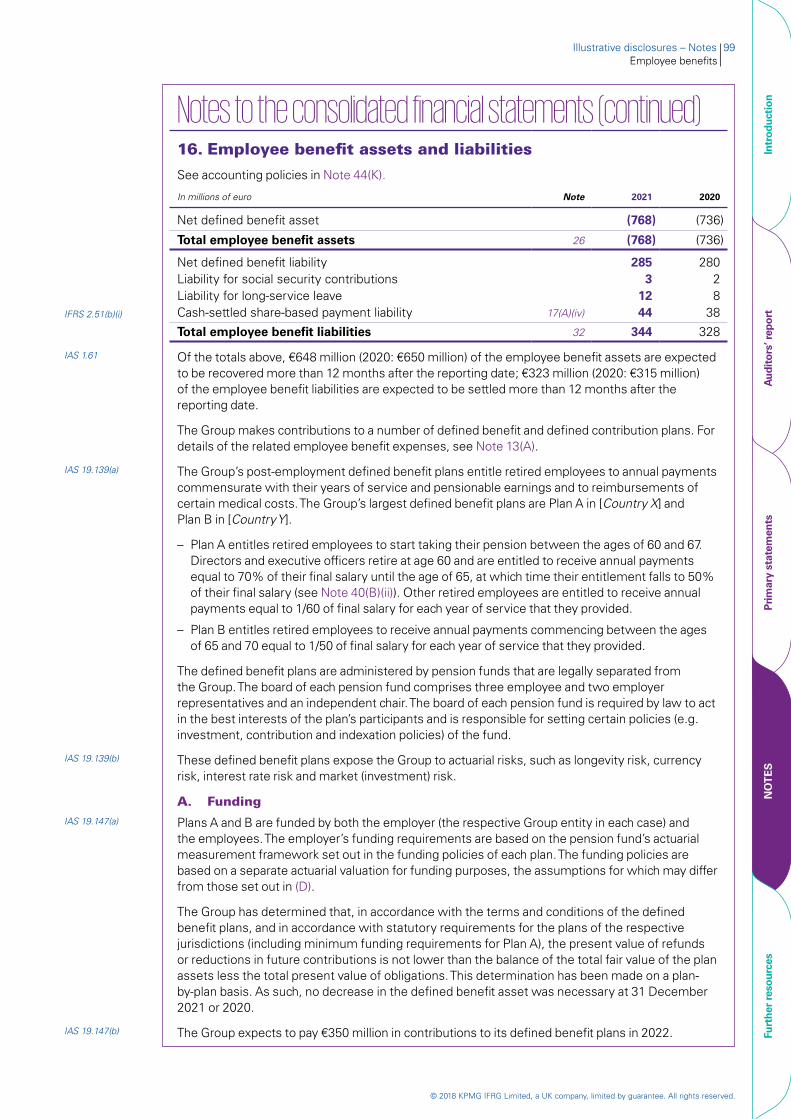
© 2018 KPMG IFRG Limited, a UK company, limited by guarantee. All rights reserved.
Illustrative disclosures – Notes 99Employee benefits
Notes to the consolidated financial statements (continued)16. Employee benefit assets and liabilities
See accounting policies in Note 44(K).
In millions of euro Note 2021 2020
Net defined benefit asset (768) (736)
Total employee benefit assets 26 (768) (736)
Net defined benefit liability 285 280 Liability for social security contributions 3 2Liability for long-service leave 12 8
IFRS 2.51(b)(i) Cash-settled share-based payment liability 17(A)(iv) 44 38
Total employee benefit liabilities 32 344 328
IAS 1.61 Of the totals above, €648 million (2020: €650 million) of the employee benefit assets are expected to be recovered more than 12 months after the reporting date; €323 million (2020: €315 million) of the employee benefit liabilities are expected to be settled more than 12 months after the reporting date.
The Group makes contributions to a number of defined benefit and defined contribution plans. For details of the related employee benefit expenses, see Note 13(A).
IAS 19.139(a) The Group’s post-employment defined benefit plans entitle retired employees to annual payments commensurate with their years of service and pensionable earnings and to reimbursements of certain medical costs. The Group’s largest defined benefit plans are Plan A in [Country X] and Plan B in [Country Y].
– Plan A entitles retired employees to start taking their pension between the ages of 60 and 67. Directors and executive officers retire at age 60 and are entitled to receive annual payments equal to 70% of their final salary until the age of 65, at which time their entitlement falls to 50% of their final salary (see Note 40(B)(ii)). Other retired employees are entitled to receive annual payments equal to 1/60 of final salary for each year of service that they provided.
– Plan B entitles retired employees to receive annual payments commencing between the ages of 65 and 70 equal to 1/50 of final salary for each year of service that they provided.
The defined benefit plans are administered by pension funds that are legally separated from the Group. The board of each pension fund comprises three employee and two employer representatives and an independent chair. The board of each pension fund is required by law to act in the best interests of the plan’s participants and is responsible for setting certain policies (e.g. investment, contribution and indexation policies) of the fund.
IAS 19.139(b) These defined benefit plans expose the Group to actuarial risks, such as longevity risk, currency risk, interest rate risk and market (investment) risk.
A. FundingIAS 19.147(a) Plans A and B are funded by both the employer (the respective Group entity in each case) and
the employees. The employer’s funding requirements are based on the pension fund’s actuarial measurement framework set out in the funding policies of each plan. The funding policies are based on a separate actuarial valuation for funding purposes, the assumptions for which may differ from those set out in (D).
The Group has determined that, in accordance with the terms and conditions of the defined benefit plans, and in accordance with statutory requirements for the plans of the respective jurisdictions (including minimum funding requirements for Plan A), the present value of refunds or reductions in future contributions is not lower than the balance of the total fair value of the plan assets less the total present value of obligations. This determination has been made on a plan-by-plan basis. As such, no decrease in the defined benefit asset was necessary at 31 December 2021 or 2020.
IAS 19.147(b) The Group expects to pay €350 million in contributions to its defined benefit plans in 2022.
Intr
oduc
tion
Aud
itor
s’ r
epor
tPr
imar
y st
atem
ents
NO
TE
SFu
rthe
r re
sour
ces

© 2018 KPMG IFRG Limited, a UK company, limited by guarantee. All rights reserved.
100 | Guide to annual financial statements: IFRS 17 and IFRS 9 – Illustrative disclosures for insurers
Notes to the consolidated financial statements (continued)16. Employee benefit assets and liabilities (continued)B. Movement in net defined benefit (asset) liability
IAS 19.140–141 The following table shows a reconciliation from the opening balances to the closing balances for the net defined benefit (asset) liability and its components.a
Defined benefit obligation
Fair value of plan assets
Net defined benefit (asset) liability
In millions of euro 2021 2020 2021 2020 2021 2020
IAS 19.140 Balance at 1 January 7,103 6,718 (7,559) (7,162) (456) (444)
Included in profit or lossb
IAS 19.141(a) Current service cost 497 456 - - 497 456IAS 19.141(d) Past service credit (100) - - - (100) -IAS 19.141(b) Interest cost (income) 360 322 (383) (344) (23) (22)
757 778 (383) (344) 374 434
Included in OCIb
IAS 19.141(c) Remeasurement (gain) loss– Actuarial (gain) loss arising from:
IAS 19.141(c)(ii) - demographic assumptions (31) 4 - - (31) 4IAS 19.141(c)(iii) - financial assumptions (21) 8 - - (21) 8
- experience adjustment (30) 6 - - (30) 6IAS 19.141(c)(i) – Return on plan assets excluding
interest income - - 10 (3) 10 (3)IAS 19.141(e) Effect of movements in exchange
ratesc (36) 45 41 (52) 5 (7)
(118) 63 51 (55) (67) 8
OtherIAS 19.141(f) Contributions paid by the employer - - (216) (300) (216) (300)IAS 19.141(f) Contributions paid by plan participants - - (109) (103) (109) (103)IAS 19.141(g) Benefits paid (433) (456) 424 405 (9) (51)
(433) (456) 99 2 (334) (454)
IAS 19.140 Balance at 31 December 7,309 7,103 (7,792) (7,559) (483) (456)
Represented by: Net defined benefit asset (Plan A) (768) (736)Net defined benefit liability (Plan B and other plans) 285 280
(483) (456)
IAS 19.139(c) During 2021, the pension arrangements for a number of employees in [Country X] were adjusted to reflect new legal requirements in that country regarding the retirement age. As a result of the plan amendment, the Group’s defined benefit obligations decreased by €100 million (2020: nil). A corresponding past service credit was recognised in profit or loss during 2021.
IAS 19.138 a. The Group has more than one defined benefit plan and has generally provided aggregated disclosures in respect of these plans, on the basis that they are not exposed to materially different risks. Further disaggregation of some or all of the disclosures – e.g. by geographic locations or by different characteristics – would be required if this were not the case.
b. Although it is not required by IAS 19 Employee Benefits, the Group has disclosed the subtotals of items recognised in profit or loss and OCI.
IAS 21.39, Insights 4.4.1010
c. A net obligation under a defined benefit plan may be denominated in a foreign currency from the point of view of the sponsor’s financial statements. In our view, in that case the net defined benefit liability (asset) should first be calculated in the currency in which it is denominated, and the resulting net amount should then be translated into the sponsor’s functional currency. As a result, the foreign exchange gain or loss arising on translation will be recognised together with other foreign exchange gains and losses, rather than as part of the IAS 19 remeasurement. This is different from the situation illustrated above. In this case, the sponsor of the plan is a foreign subsidiary and therefore the translation difference is recognised in OCI in the usual way.
Intr
oduc
tion
Aud
itor
s’ r
epor
tPr
imar
y st
atem
ents
NO
TE
SFu
rthe
r re
sour
ces
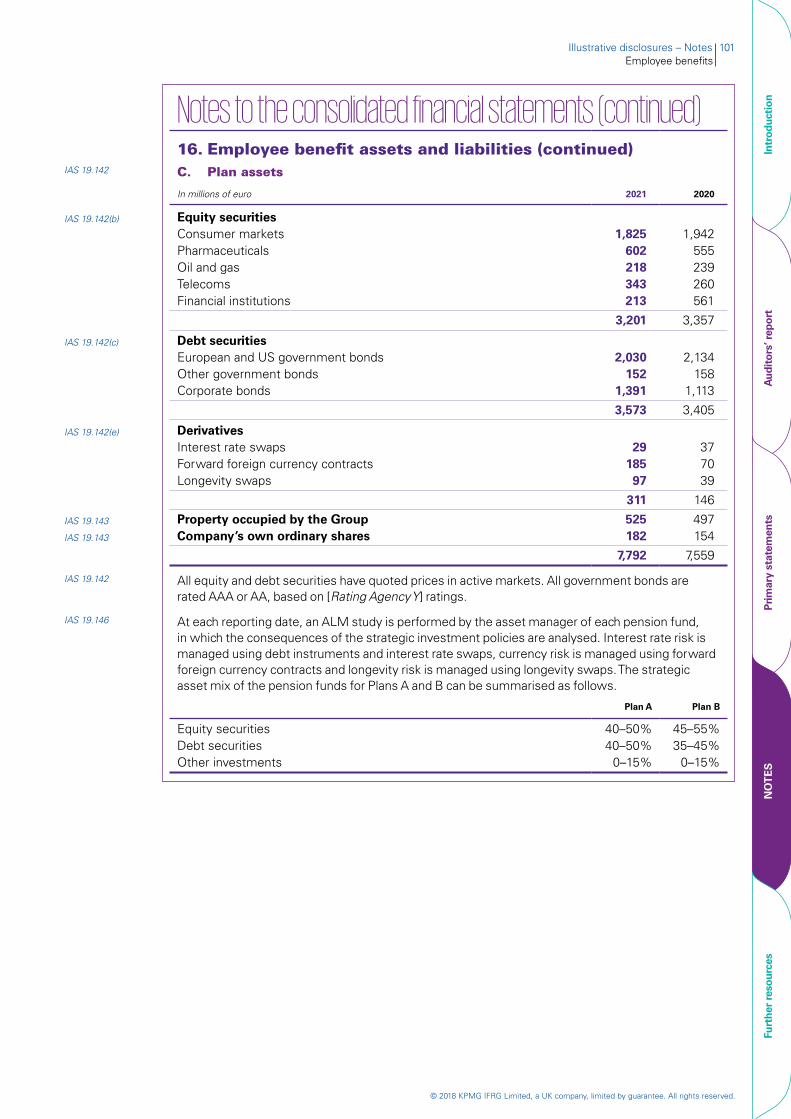
© 2018 KPMG IFRG Limited, a UK company, limited by guarantee. All rights reserved.
Illustrative disclosures – Notes 101Employee benefits
Notes to the consolidated financial statements (continued)16. Employee benefit assets and liabilities (continued)
IAS 19.142 C. Plan assets
In millions of euro 2021 2020
IAS 19.142(b) Equity securitiesConsumer markets 1,825 1,942Pharmaceuticals 602 555Oil and gas 218 239Telecoms 343 260Financial institutions 213 561
3,201 3,357
IAS 19.142(c) Debt securitiesEuropean and US government bonds 2,030 2,134Other government bonds 152 158Corporate bonds 1,391 1,113
3,573 3,405
IAS 19.142(e) DerivativesInterest rate swaps 29 37Forward foreign currency contracts 185 70Longevity swaps 97 39
311 146
IAS 19.143 Property occupied by the Group 525 497IAS 19.143 Company’s own ordinary shares 182 154
7,792 7,559
IAS 19.142 All equity and debt securities have quoted prices in active markets. All government bonds are rated AAA or AA, based on [Rating Agency Y] ratings.
IAS 19.146 At each reporting date, an ALM study is performed by the asset manager of each pension fund, in which the consequences of the strategic investment policies are analysed. Interest rate risk is managed using debt instruments and interest rate swaps, currency risk is managed using forward foreign currency contracts and longevity risk is managed using longevity swaps. The strategic asset mix of the pension funds for Plans A and B can be summarised as follows.
Plan A Plan B
Equity securities 40–50% 45–55%Debt securities 40–50% 35–45%Other investments 0–15% 0–15%
Intr
oduc
tion
Aud
itor
s’ r
epor
tPr
imar
y st
atem
ents
NO
TE
SFu
rthe
r re
sour
ces
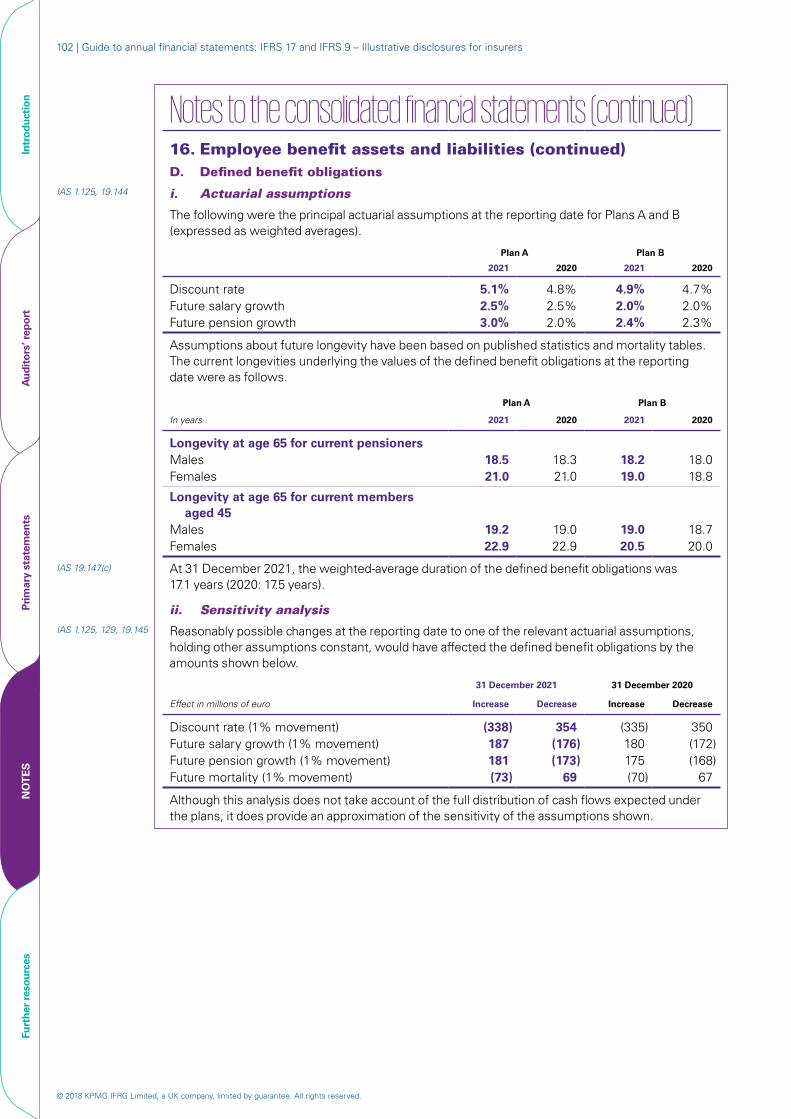
© 2018 KPMG IFRG Limited, a UK company, limited by guarantee. All rights reserved.
102 | Guide to annual financial statements: IFRS 17 and IFRS 9 – Illustrative disclosures for insurers
Notes to the consolidated financial statements (continued)16. Employee benefit assets and liabilities (continued)D. Defined benefit obligations
IAS 1.125, 19.144 i. Actuarial assumptions
The following were the principal actuarial assumptions at the reporting date for Plans A and B (expressed as weighted averages).
Plan A Plan B
2021 2020 2021 2020
Discount rate 5.1% 4.8% 4.9% 4.7%Future salary growth 2.5% 2.5% 2.0% 2.0%Future pension growth 3.0% 2.0% 2.4% 2.3%
Assumptions about future longevity have been based on published statistics and mortality tables. The current longevities underlying the values of the defined benefit obligations at the reporting date were as follows.
Plan A Plan B
In years 2021 2020 2021 2020
Longevity at age 65 for current pensionersMales 18.5 18.3 18.2 18.0Females 21.0 21.0 19.0 18.8
Longevity at age 65 for current members aged 45
Males 19.2 19.0 19.0 18.7Females 22.9 22.9 20.5 20.0
IAS 19.147(c) At 31 December 2021, the weighted-average duration of the defined benefit obligations was 17.1 years (2020: 17.5 years).
ii. Sensitivity analysisIAS 1.125, 129, 19.145 Reasonably possible changes at the reporting date to one of the relevant actuarial assumptions,
holding other assumptions constant, would have affected the defined benefit obligations by the amounts shown below.
31 December 2021 31 December 2020
Effect in millions of euro Increase Decrease Increase Decrease
Discount rate (1% movement) (338) 354 (335) 350Future salary growth (1% movement) 187 (176) 180 (172)Future pension growth (1% movement) 181 (173) 175 (168)Future mortality (1% movement) (73) 69 (70) 67
Although this analysis does not take account of the full distribution of cash flows expected under the plans, it does provide an approximation of the sensitivity of the assumptions shown.
Intr
oduc
tion
Aud
itor
s’ r
epor
tPr
imar
y st
atem
ents
NO
TE
SFu
rthe
r re
sour
ces
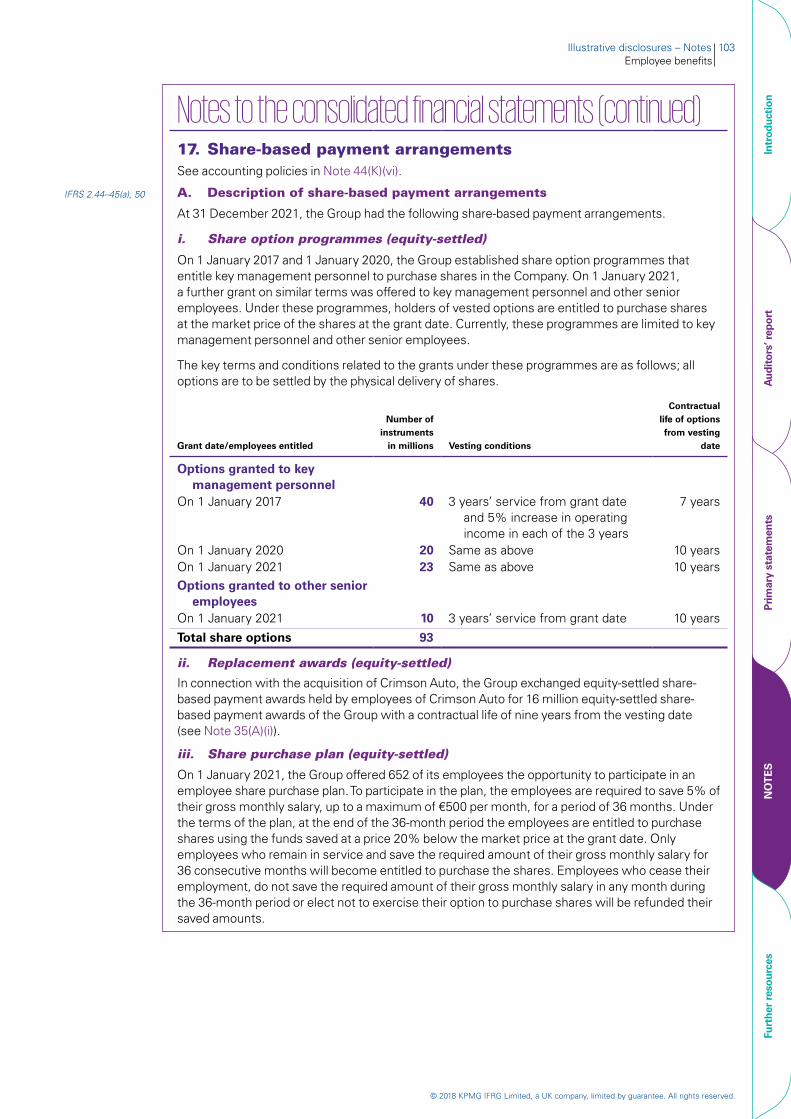
© 2018 KPMG IFRG Limited, a UK company, limited by guarantee. All rights reserved.
Illustrative disclosures – Notes 103Employee benefits
Notes to the consolidated financial statements (continued)17. Share-based payment arrangementsSee accounting policies in Note 44(K)(vi).
IFRS 2.44–45(a), 50 A. Description of share-based payment arrangements
At 31 December 2021, the Group had the following share-based payment arrangements.
i. Share option programmes (equity-settled)
On 1 January 2017 and 1 January 2020, the Group established share option programmes that entitle key management personnel to purchase shares in the Company. On 1 January 2021, a further grant on similar terms was offered to key management personnel and other senior employees. Under these programmes, holders of vested options are entitled to purchase shares at the market price of the shares at the grant date. Currently, these programmes are limited to key management personnel and other senior employees.
The key terms and conditions related to the grants under these programmes are as follows; all options are to be settled by the physical delivery of shares.
Grant date/employees entitled
Number of instruments
in millions Vesting conditions
Contractual life of options from vesting
date
Options granted to key management personnel
On 1 January 2017 40 3 years’ service from grant date and 5% increase in operating income in each of the 3 years
7 years
On 1 January 2020 20 Same as above 10 yearsOn 1 January 2021 23 Same as above 10 yearsOptions granted to other senior
employeesOn 1 January 2021 10 3 years’ service from grant date 10 years
Total share options 93
ii. Replacement awards (equity-settled)
In connection with the acquisition of Crimson Auto, the Group exchanged equity-settled share-based payment awards held by employees of Crimson Auto for 16 million equity-settled share-based payment awards of the Group with a contractual life of nine years from the vesting date (see Note 35(A)(i)).
iii. Share purchase plan (equity-settled)
On 1 January 2021, the Group offered 652 of its employees the opportunity to participate in an employee share purchase plan. To participate in the plan, the employees are required to save 5% of their gross monthly salary, up to a maximum of €500 per month, for a period of 36 months. Under the terms of the plan, at the end of the 36-month period the employees are entitled to purchase shares using the funds saved at a price 20% below the market price at the grant date. Only employees who remain in service and save the required amount of their gross monthly salary for 36 consecutive months will become entitled to purchase the shares. Employees who cease their employment, do not save the required amount of their gross monthly salary in any month during the 36-month period or elect not to exercise their option to purchase shares will be refunded their saved amounts.
Intr
oduc
tion
Aud
itor
s’ r
epor
tPr
imar
y st
atem
ents
NO
TE
SFu
rthe
r re
sour
ces

© 2018 KPMG IFRG Limited, a UK company, limited by guarantee. All rights reserved.
104 | Guide to annual financial statements: IFRS 17 and IFRS 9 – Illustrative disclosures for insurers
Notes to the consolidated financial statements (continued)17. Share-based payment arrangements (continued)A. Description of share-based payment arrangements (continued)
iv. Share appreciation rights (cash-settled)
On 1 January 2017 and 1 January 2021, the Group granted 10 million and 30 million share appreciation rights (SARs) respectively to employees that entitle them to a cash payment after three years of service. The SARs expire at the end of a five-year period after the grant date. The amount of the cash payment is determined based on the increase in the share price of the Company between the grant date and the time of exercise.
The liabilities arising from the SARs were as follows.
In millions of euro Note 2021 2020
IFRS 2.51(b)(i) Total carrying amount of liabilities for SARs 16 44 38IFRS 2.51(b)(ii) Total intrinsic value of liabilities for vested benefits - 38
The liabilities at 31 December 2020 were settled during 2021.
B. Measurement of fair values
i. Equity-settled share-based payment arrangementsIFRS 2.46, 47(a)(i), (iii) The fair value of the employee share purchase plan (see (A)(iii)) has been measured using a
Monte Carlo simulation. The fair value of the employee share options (see (A)(i) and (ii)) has been measured using the Black-Scholes formula. Service and non-market performance conditions attached to the arrangements were not taken into account in measuring fair value.
IFRS 2.47(a)(iii) The requirement that the employee has to save in order to purchase shares under the share purchase plan has been incorporated into the fair value at the grant date by applying a discount to the valuation obtained. The discount has been determined by estimating the probability that the employee will stop saving based on historical behaviour.
The inputs used in the measurement of the fair values at the grant date of the equity-settled share-based payment plans for awards granted during 2021 and 2020 were as follows.
Share option programmes
Key management personnel (see (A)(i))
Senior employees (see (A)(i))
Replacement awards
(see (A)(ii))
Share purchase plan
(see (A)(iii))
2021 2020 2021 2021 2021
IFRS 2.47(a) Fair value at grant date €3.54 €3.75 €3.14 €3.88 €4.02IFRS 2.47(a)(i) Share price at grant date €10.10 €10.50 €10.10 €10.30 €10.10IFRS 2.47(a)(i) Exercise price €10.10 €10.50 €10.10 €10.30 €8.08IFRS 2.47(a)(i) Expected volatility (weighted-average) 40.1% 40.9% 40.1% 42.4% 43.3%IFRS 2.47(a)(i) Expected life (weighted-average) 8.6 years 8.8 years 5.4 years 5.9 years 4.0 yearsIFRS 2.47(a)(i) Expected dividends 3.2% 3.2% 3.2% 3.2% 3.2%IFRS 2.47(a)(i) Risk-free interest rate (based on
government bonds) 3.9% 3.8% 3.9% 3.9% 3.9%
IFRS 2.47(a)(ii) Expected volatility has been based on an evaluation of the historical volatility of the Company’s share price, particularly over the historical period commensurate with the expected term. The expected term of the instruments has been based on historical experience and general option holder behaviour.
At 31 December 2021, a total amount of €2 million was invested by the participants in the share purchase plan (see Note 40(B)(ii)) and has been included in ‘payables’ (see Note 27).
Intr
oduc
tion
Aud
itor
s’ r
epor
tPr
imar
y st
atem
ents
NO
TE
SFu
rthe
r re
sour
ces

© 2018 KPMG IFRG Limited, a UK company, limited by guarantee. All rights reserved.
Illustrative disclosures – Notes 105Employee benefits
Notes to the consolidated financial statements (continued)17. Share-based payment arrangements (continued)B. Measurement of fair values (continued)
ii. Cash-settled share-based payment arrangementsa IFRS 2.52 The fair value of the SARs (see (A)(iv)) has been measured using the Black-Scholes formula.
Service and non-market performance conditions attached to the arrangements were not taken into account in measuring fair value.
The inputs used in the measurement of the fair values at the grant date and measurement date of the SARs were as follows.
Grant date 1 January 2021
Measurement date 31 December 2021
Fair value €2.82 €4.40Share price €10.10 €12.70Exercise price €10.10 €10.10Expected volatility (weighted-average) 43.3% 43.1%Expected life (weighted-average) 4.0 years 2.8 yearsExpected dividends 3.2% 3.3%Risk-free interest rate (based on government bonds) 3.9% 4.0%
Expected volatility has been based on an evaluation of the historical volatility of the Company’s share price, particularly over the historical period commensurate with the expected term. The expected term of the instruments has been based on historical experience and general option holder behaviour.
C. Reconciliation of outstanding share optionsIFRS 2.45(b) The number and weighted-average exercise prices of share options under the share option
programmes (see (A)(i)) and replacement awards (see (A)(ii)) were as follows.
2021 2020
Number of options in millions
Weighted- average
exercise price
Number of options in millions
Weighted- average
exercise price
IFRS 2.45(b)(i) Outstanding at 1 January 54 €10.08 40 €9.84IFRS 2.45(b)(iii) Forfeited during the year (3) €9.84 (2) €9.84IFRS 2.45(b)(iv) Exercised during the year (7) €9.84 (4) €9.84IFRS 2.45(b)(ii) Granted during the year 49 €10.17 20 €10.50
IFRS 2.45(b)(vi) Outstanding at 31 December 93 €10.15 54 €10.08
IFRS 2.45(b)(vii) Exercisable at 31 December 18 €9.84 23 €9.84
IFRS 2.45(d) The options outstanding at 31 December 2021 had an exercise price in the range of €9.84 to €10.50 (2020: €9.84 to €10.50) and a weighted-average remaining contractual life of 6.4 years (2020: 5.2 years).
IFRS 2.45(c) The weighted-average share price at the date of exercise for share options exercised in 2021 was €10.45 (2020: €10.39).
D. Expenses recognised in profit or loss
For details of the related employee benefit expenses, see Note 13(A).
Insights 4.5.1000.10
a. Although it is not specifically required by IFRS 2, the Group has disclosed information about the fair value measurement of its SARs. In our view, these disclosures should be provided for cash-settled share-based payment arrangements. For awards granted during the period, disclosures about fair value measurement at the grant date and at the reporting date should be given; for awards granted in previous periods but unexercised at the reporting date, disclosures about fair value measurement at the reporting date should be given.
Intr
oduc
tion
Aud
itor
s’ r
epor
tPr
imar
y st
atem
ents
NO
TE
SFu
rthe
r re
sour
ces
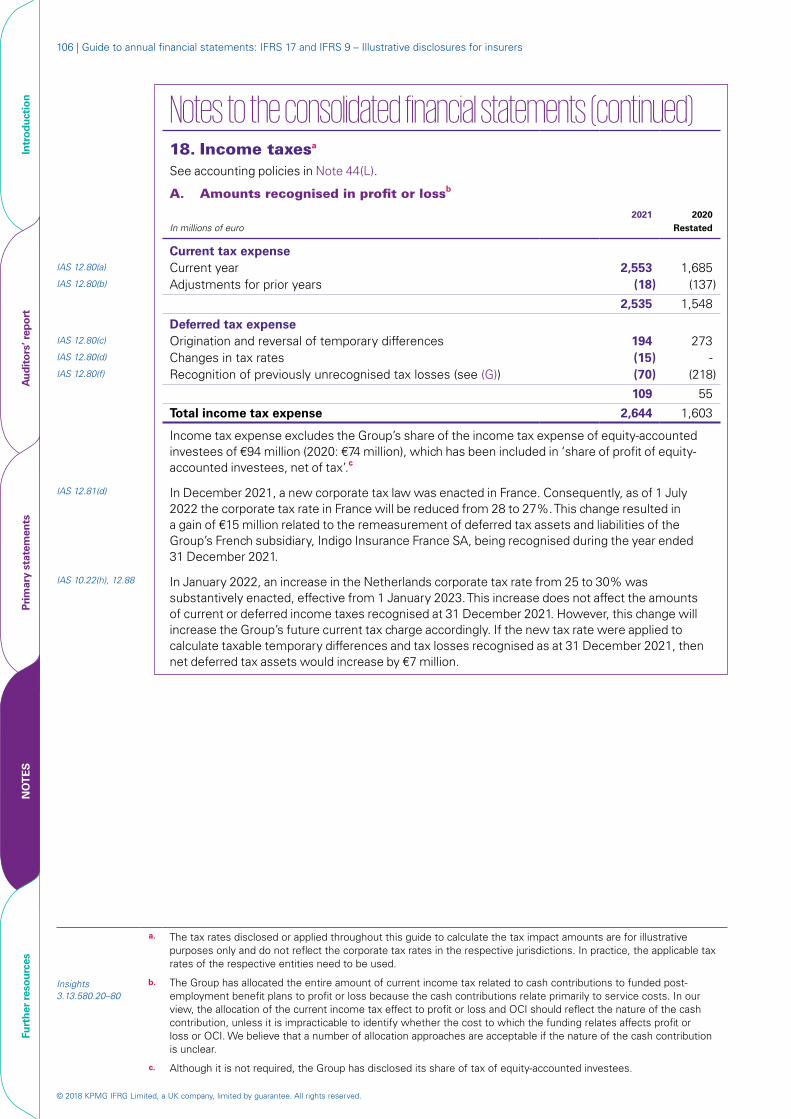
© 2018 KPMG IFRG Limited, a UK company, limited by guarantee. All rights reserved.
106 | Guide to annual financial statements: IFRS 17 and IFRS 9 – Illustrative disclosures for insurers
Notes to the consolidated financial statements (continued)
18. Income taxesa See accounting policies in Note 44(L).
A. Amounts recognised in profit or lossb
In millions of euro2021 2020
Restated
Current tax expenseIAS 12.80(a) Current year 2,553 1,685 IAS 12.80(b) Adjustments for prior years (18) (137)
2,535 1,548
Deferred tax expenseIAS 12.80(c) Origination and reversal of temporary differences 194 273IAS 12.80(d) Changes in tax rates (15) -IAS 12.80(f) Recognition of previously unrecognised tax losses (see (G)) (70) (218)
109 55
Total income tax expense 2,644 1,603
Income tax expense excludes the Group’s share of the income tax expense of equity-accounted investees of €94 million (2020: €74 million), which has been included in ‘share of profit of equity-accounted investees, net of tax’.c
IAS 12.81(d) In December 2021, a new corporate tax law was enacted in France. Consequently, as of 1 July 2022 the corporate tax rate in France will be reduced from 28 to 27%. This change resulted in a gain of €15 million related to the remeasurement of deferred tax assets and liabilities of the Group’s French subsidiary, Indigo Insurance France SA, being recognised during the year ended 31 December 2021.
IAS 10.22(h), 12.88 In January 2022, an increase in the Netherlands corporate tax rate from 25 to 30% was substantively enacted, effective from 1 January 2023. This increase does not affect the amounts of current or deferred income taxes recognised at 31 December 2021. However, this change will increase the Group’s future current tax charge accordingly. If the new tax rate were applied to calculate taxable temporary differences and tax losses recognised as at 31 December 2021, then net deferred tax assets would increase by €7 million.
a. The tax rates disclosed or applied throughout this guide to calculate the tax impact amounts are for illustrative purposes only and do not reflect the corporate tax rates in the respective jurisdictions. In practice, the applicable tax rates of the respective entities need to be used.
Insights 3.13.580.20–80
b. The Group has allocated the entire amount of current income tax related to cash contributions to funded post-employment benefit plans to profit or loss because the cash contributions relate primarily to service costs. In our view, the allocation of the current income tax effect to profit or loss and OCI should reflect the nature of the cash contribution, unless it is impracticable to identify whether the cost to which the funding relates affects profit or loss or OCI. We believe that a number of allocation approaches are acceptable if the nature of the cash contribution is unclear.
c. Although it is not required, the Group has disclosed its share of tax of equity-accounted investees.
Intr
oduc
tion
Aud
itor
s’ r
epor
tPr
imar
y st
atem
ents
NO
TE
SFu
rthe
r re
sour
ces

© 2018 KPMG IFRG Limited, a UK company, limited by guarantee. All rights reserved.
Illustrative disclosures – Notes 107Income taxes
Notes to the consolidated financial statements (continued)
18. Income taxes (continued)IAS 1.90, 12.81(ab) B. Amounts recognised in OCI
2021 2020 (restated)
In millions of euroBefore
tax
Tax (expense)
benefitNet of
taxBefore
tax
Tax (expense)
benefitNet of
tax
Items that will not be reclassified to profit or loss
Defined benefit liability/asset – remeasurement 72 (22) 50 (15) 5 (10)
Equity-accounted investees – share of OCI 4 - 4 3 - 3
76 (22) 54 (12) 5 (7)
Items that are or may be reclassified subsequently to profit or loss
Foreign operationsForeign currency translation
differences (406) - (406) 589 - 589Reclassified to profit or loss (13) - (13) - - -
Net investment hedges – net gain (loss) 45 - 45 (48) - (48)
Costs of hedgingNet change in fair value (30) - (30) (10) - (10) Reclassified to profit or loss 18 - 18 4 - 4
Debt investments at FVOCINet change in fair value 4,127 (1,238) 2,889 2,943 (883) 2,060 Reclassified to profit or loss (1,524) 457 (1,067)
Available-for-sale financial assetsNet change in fair value 67 (20) 47 Reclassified to profit or loss (1,283) 385 (898)
Net finance expenses from insurance contracts (1,207) 362 (845) (1,138) 341 (797)
Net finance income from reinsurance contracts 7 (2) 5 5 (2) 3
Equity-accounted investeesShare of OCI 20 - 20 13 - 13 Reclassified to profit or loss (12) - (12) - - -
1,025 (421) 604 1,142 (179) 963
1,101 (443) 658 1,130 (174) 956
Intr
oduc
tion
Aud
itor
s’ r
epor
tPr
imar
y st
atem
ents
NO
TE
SFu
rthe
r re
sour
ces
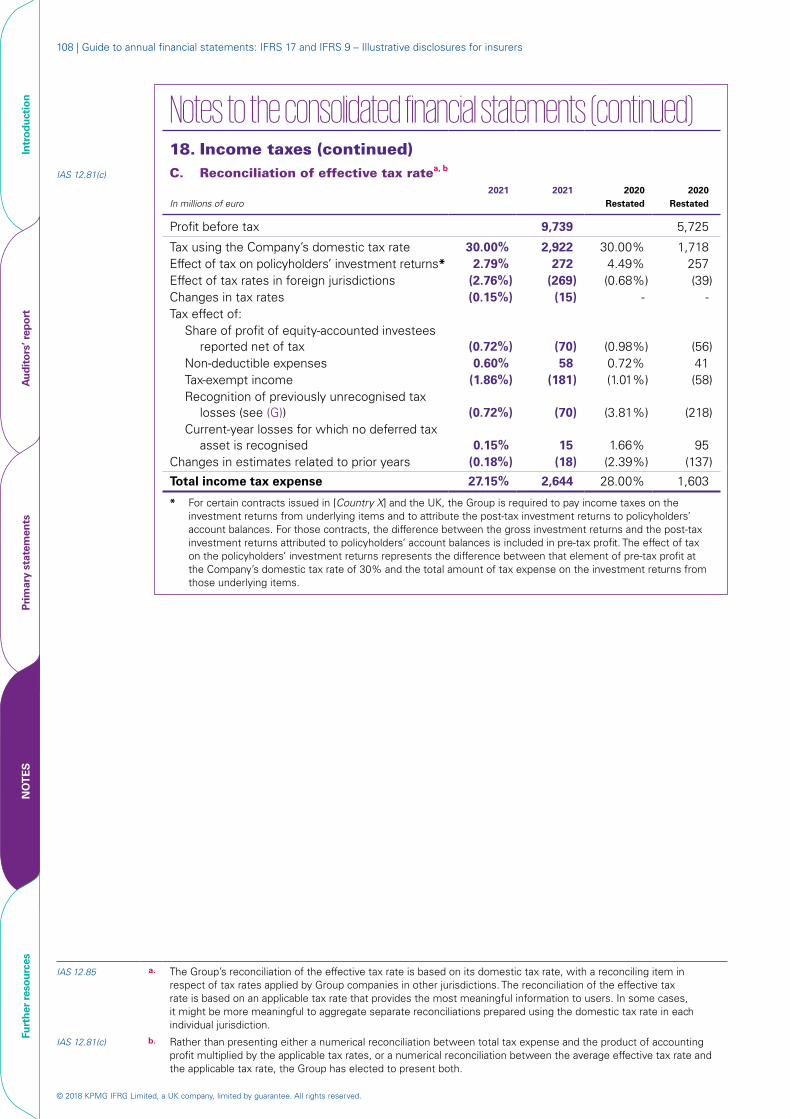
© 2018 KPMG IFRG Limited, a UK company, limited by guarantee. All rights reserved.
108 | Guide to annual financial statements: IFRS 17 and IFRS 9 – Illustrative disclosures for insurers
Notes to the consolidated financial statements (continued)
18. Income taxes (continued)IAS 12.81(c) C. Reconciliation of effective tax ratea, b
In millions of euro2021 2021 2020
Restated2020
Restated
Profit before tax 9,739 5,725
Tax using the Company’s domestic tax rate 30.00% 2,922 30.00% 1,718 Effect of tax on policyholders’ investment returns* 2.79% 272 4.49% 257 Effect of tax rates in foreign jurisdictions (2.76%) (269) (0.68%) (39)Changes in tax rates (0.15%) (15) - - Tax effect of:
Share of profit of equity-accounted investees reported net of tax (0.72%) (70) (0.98%) (56)
Non-deductible expenses 0.60% 58 0.72% 41 Tax-exempt income (1.86%) (181) (1.01%) (58)Recognition of previously unrecognised tax
losses (see (G)) (0.72%) (70) (3.81%) (218)Current-year losses for which no deferred tax
asset is recognised 0.15% 15 1.66% 95 Changes in estimates related to prior years (0.18%) (18) (2.39%) (137)
Total income tax expense 27.15% 2,644 28.00% 1,603
* For certain contracts issued in [Country X] and the UK, the Group is required to pay income taxes on the investment returns from underlying items and to attribute the post-tax investment returns to policyholders’ account balances. For those contracts, the difference between the gross investment returns and the post-tax investment returns attributed to policyholders’ account balances is included in pre-tax profit. The effect of tax on the policyholders’ investment returns represents the difference between that element of pre-tax profit at the Company’s domestic tax rate of 30% and the total amount of tax expense on the investment returns from those underlying items.
IAS 12.85 a. The Group’s reconciliation of the effective tax rate is based on its domestic tax rate, with a reconciling item in respect of tax rates applied by Group companies in other jurisdictions. The reconciliation of the effective tax rate is based on an applicable tax rate that provides the most meaningful information to users. In some cases, it might be more meaningful to aggregate separate reconciliations prepared using the domestic tax rate in each individual jurisdiction.
IAS 12.81(c) b. Rather than presenting either a numerical reconciliation between total tax expense and the product of accounting profit multiplied by the applicable tax rates, or a numerical reconciliation between the average effective tax rate and the applicable tax rate, the Group has elected to present both.
Intr
oduc
tion
Aud
itor
s’ r
epor
tPr
imar
y st
atem
ents
NO
TE
SFu
rthe
r re
sour
ces

© 2018 KPMG IFRG Limited, a UK company, limited by guarantee. All rights reserved.
Illustrative disclosures – Notes 109Income taxes
Notes to the consolidated financial statements (continued)18. Income taxes (continued)
IAS 12.81(g) D. Movement in deferred tax balancesa, b, c
Balance at 31 December
2021In millions of euro
Net balance at 1 January
Recognised in profit or
loss (see (A))
Recognised in OCI
(see (B))Other (see
Note 35) NetDeferred
tax assets
Deferred tax
liabilities
Financial investments and derivatives 4,547 168 781 (122) 5,374 (108) 5,482
Investment property 316 15 - - 331 - 331
Property and equipment 73 7 - 2 82 (6) 88
Intangible assets 165 (28) - 1 138 (148) 286 Insurance and
reinsurance contracts (1,539) 84 (360) 20 (1,795) (1,915) 120
Employee benefits 83 (19) 22 - 86 - 86 Equity-settled share-
based payment (233) (42) - - (275) (275) - Other items (43) (6) - (2) (51) (58) 7 Tax losses carried
forward (1,028) (70) - - (1,098) (1,098) -
Tax liabilities (assets) before set-off 2,341 109 443 (101) 2,792 (3,608) 6,400
Set-off of tax - 3,348 (3,348)
Net tax liabilities (assets) 2,792 (260) 3,052
IAS 12.81(g), Insights 3.13.640.60
a. IAS 12 Income Taxes requires disclosure of the amount of recognised deferred tax assets and liabilities in respect of each type of temporary difference. IFRS is unclear on what constitutes a ‘type’, and the Group has provided the disclosures based on the classes of assets and liabilities related to the temporary differences. Another possible interpretation is to present disclosures based on the reason for the temporary difference – e.g. depreciation.
Insights 3.13.640.70
b. In our view, it is not appropriate to disclose the tax effects of both recognised and unrecognised deferred tax assets as a single amount – e.g. similar to the ‘gross’ approach under US GAAP – because under IFRS, it is recognised deferred tax assets that are required to be disclosed.
Insights 3.13.300 c. The Group does not plan to dispose of its investments in associates in the foreseeable future, and therefore has measured deferred tax relating to these investments using the tax rates applicable to dividends, which are zero because such dividends are tax-exempt. As a result, no deferred tax has been recognised.
Intr
oduc
tion
Aud
itor
s’ r
epor
tPr
imar
y st
atem
ents
NO
TE
SFu
rthe
r re
sour
ces
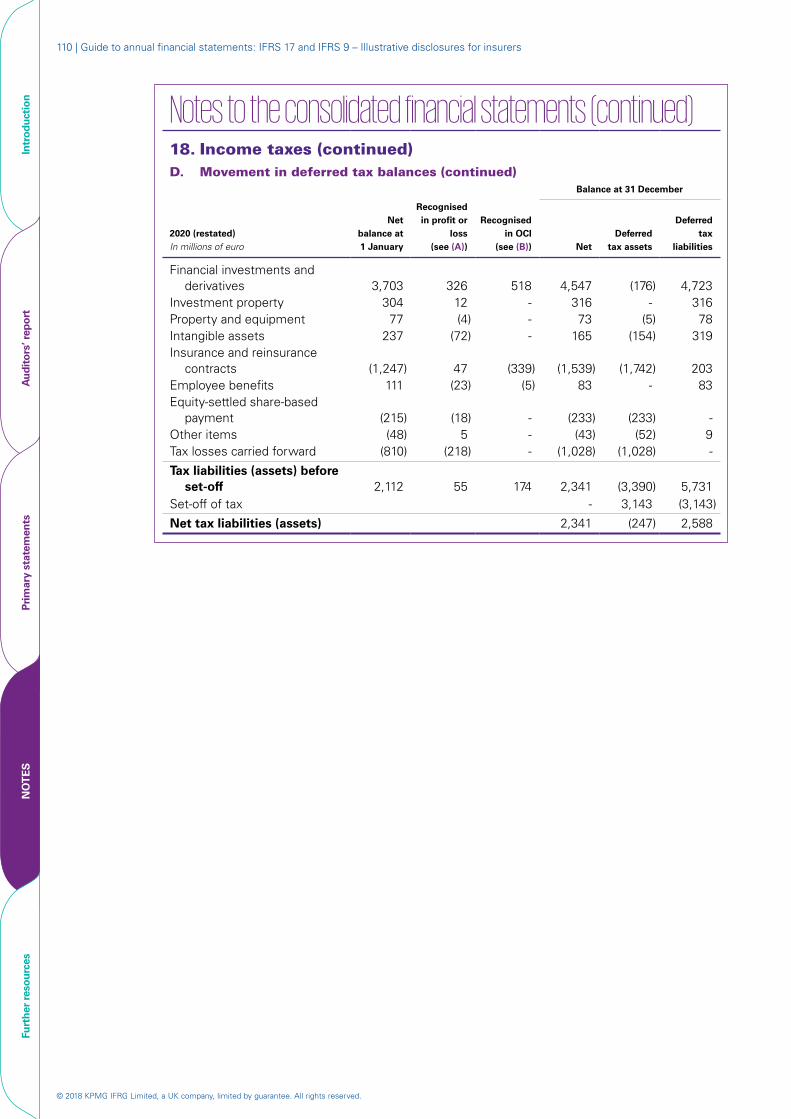
© 2018 KPMG IFRG Limited, a UK company, limited by guarantee. All rights reserved.
110 | Guide to annual financial statements: IFRS 17 and IFRS 9 – Illustrative disclosures for insurers
Notes to the consolidated financial statements (continued)18. Income taxes (continued)D. Movement in deferred tax balances (continued)
Balance at 31 December
2020 (restated)In millions of euro
Net balance at 1 January
Recognised in profit or
loss (see (A))
Recognised in OCI
(see (B)) NetDeferred
tax assets
Deferred tax
liabilities
Financial investments and derivatives 3,703 326 518 4,547 (176) 4,723
Investment property 304 12 - 316 - 316Property and equipment 77 (4) - 73 (5) 78Intangible assets 237 (72) - 165 (154) 319Insurance and reinsurance
contracts (1,247) 47 (339) (1,539) (1,742) 203Employee benefits 111 (23) (5) 83 - 83Equity-settled share-based
payment (215) (18) - (233) (233) -Other items (48) 5 - (43) (52) 9Tax losses carried forward (810) (218) - (1,028) (1,028) -
Tax liabilities (assets) before set-off 2,112 55 174 2,341 (3,390) 5,731
Set-off of tax - 3,143 (3,143)
Net tax liabilities (assets) 2,341 (247) 2,588
Intr
oduc
tion
Aud
itor
s’ r
epor
tPr
imar
y st
atem
ents
NO
TE
SFu
rthe
r re
sour
ces
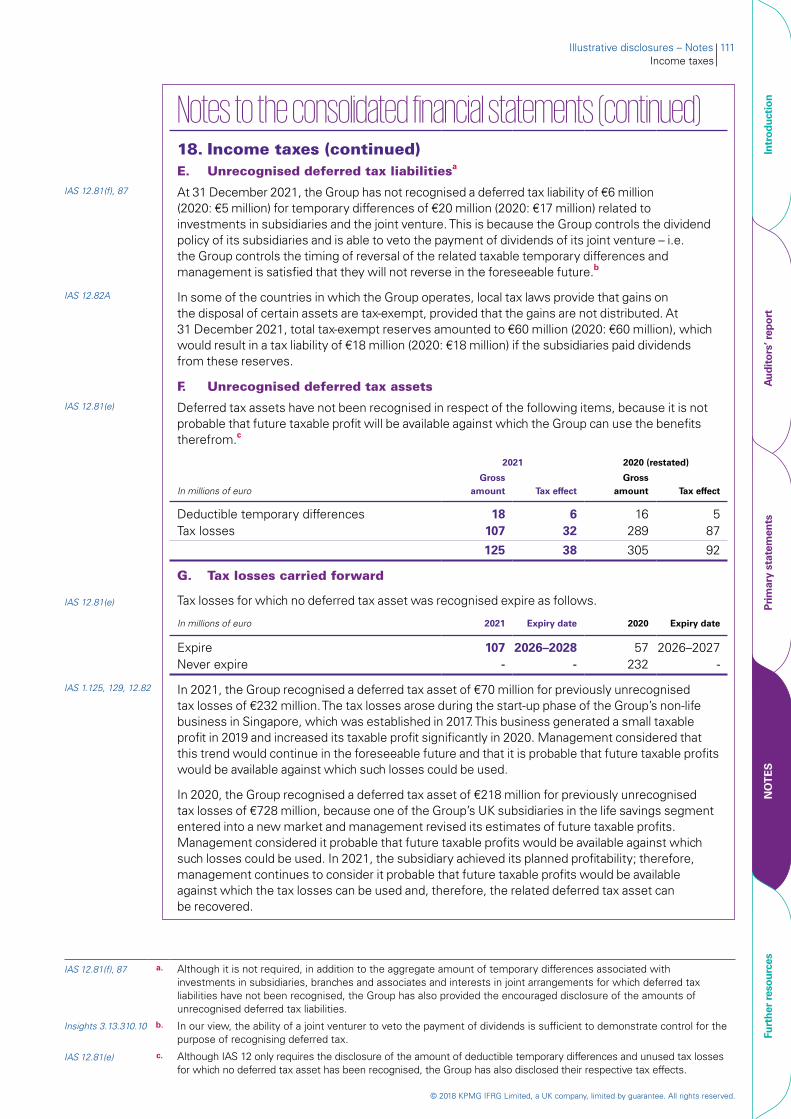
© 2018 KPMG IFRG Limited, a UK company, limited by guarantee. All rights reserved.
Illustrative disclosures – Notes 111Income taxes
Notes to the consolidated financial statements (continued)18. Income taxes (continued)E. Unrecognised deferred tax liabilitiesa
IAS 12.81(f), 87 At 31 December 2021, the Group has not recognised a deferred tax liability of €6 million (2020: €5 million) for temporary differences of €20 million (2020: €17 million) related to investments in subsidiaries and the joint venture. This is because the Group controls the dividend policy of its subsidiaries and is able to veto the payment of dividends of its joint venture – i.e. the Group controls the timing of reversal of the related taxable temporary differences and management is satisfied that they will not reverse in the foreseeable future.b
IAS 12.82A In some of the countries in which the Group operates, local tax laws provide that gains on the disposal of certain assets are tax-exempt, provided that the gains are not distributed. At 31 December 2021, total tax-exempt reserves amounted to €60 million (2020: €60 million), which would result in a tax liability of €18 million (2020: €18 million) if the subsidiaries paid dividends from these reserves.
F. Unrecognised deferred tax assetsIAS 12.81(e) Deferred tax assets have not been recognised in respect of the following items, because it is not
probable that future taxable profit will be available against which the Group can use the benefits therefrom.c
2021 2020 (restated)
In millions of euroGross
amount Tax effectGross
amount Tax effect
Deductible temporary differences 18 6 16 5Tax losses 107 32 289 87
125 38 305 92
G. Tax losses carried forward
IAS 12.81(e) Tax losses for which no deferred tax asset was recognised expire as follows.
In millions of euro 2021 Expiry date 2020 Expiry date
Expire 107 2026–2028 57 2026–2027Never expire - - 232 -
IAS 1.125, 129, 12.82 In 2021, the Group recognised a deferred tax asset of €70 million for previously unrecognised tax losses of €232 million. The tax losses arose during the start-up phase of the Group’s non-life business in Singapore, which was established in 2017. This business generated a small taxable profit in 2019 and increased its taxable profit significantly in 2020. Management considered that this trend would continue in the foreseeable future and that it is probable that future taxable profits would be available against which such losses could be used.
In 2020, the Group recognised a deferred tax asset of €218 million for previously unrecognised tax losses of €728 million, because one of the Group’s UK subsidiaries in the life savings segment entered into a new market and management revised its estimates of future taxable profits. Management considered it probable that future taxable profits would be available against which such losses could be used. In 2021, the subsidiary achieved its planned profitability; therefore, management continues to consider it probable that future taxable profits would be available against which the tax losses can be used and, therefore, the related deferred tax asset can be recovered.
IAS 12.81(f), 87 a. Although it is not required, in addition to the aggregate amount of temporary differences associated with
investments in subsidiaries, branches and associates and interests in joint arrangements for which deferred tax liabilities have not been recognised, the Group has also provided the encouraged disclosure of the amounts of unrecognised deferred tax liabilities.
Insights 3.13.310.10 b. In our view, the ability of a joint venturer to veto the payment of dividends is sufficient to demonstrate control for the purpose of recognising deferred tax.
IAS 12.81(e) c. Although IAS 12 only requires the disclosure of the amount of deductible temporary differences and unused tax losses for which no deferred tax asset has been recognised, the Group has also disclosed their respective tax effects.
Intr
oduc
tion
Aud
itor
s’ r
epor
tPr
imar
y st
atem
ents
NO
TE
SFu
rthe
r re
sour
ces
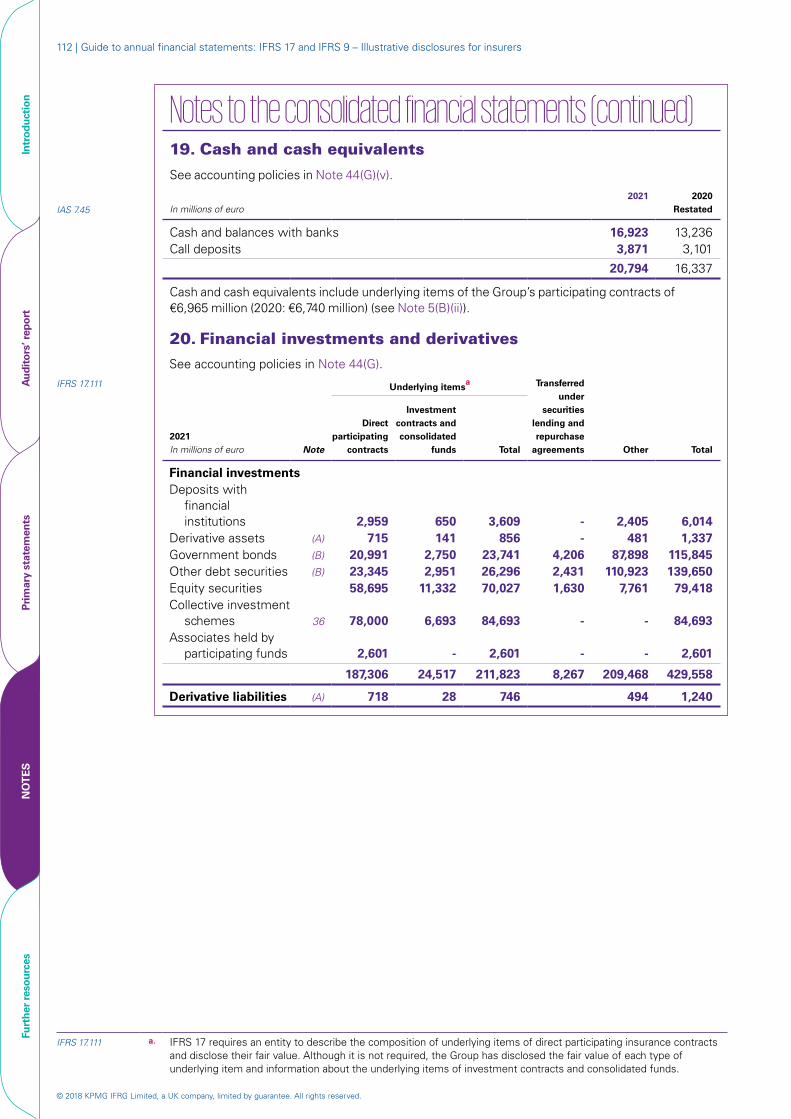
© 2018 KPMG IFRG Limited, a UK company, limited by guarantee. All rights reserved.
112 | Guide to annual financial statements: IFRS 17 and IFRS 9 – Illustrative disclosures for insurers
Notes to the consolidated financial statements (continued)19. Cash and cash equivalents
See accounting policies in Note 44(G)(v).
IAS 7.45 In millions of euro2021 2020
Restated
Cash and balances with banks 16,923 13,236Call deposits 3,871 3,101
20,794 16,337
Cash and cash equivalents include underlying items of the Group’s participating contracts of €6,965 million (2020: €6,740 million) (see Note 5(B)(ii)).
20. Financial investments and derivatives
See accounting policies in Note 44(G).IFRS 17.111 Underlying itemsa Transferred
under securities
lending and repurchase
agreements Other Total2021In millions of euro Note
Direct participating
contracts
Investment contracts and consolidated
funds Total
Financial investmentsDeposits with
financial institutions 2,959 650 3,609 - 2,405 6,014
Derivative assets (A) 715 141 856 - 481 1,337 Government bonds (B) 20,991 2,750 23,741 4,206 87,898 115,845 Other debt securities (B) 23,345 2,951 26,296 2,431 110,923 139,650 Equity securities 58,695 11,332 70,027 1,630 7,761 79,418Collective investment
schemes 36 78,000 6,693 84,693 - - 84,693 Associates held by
participating funds 2,601 - 2,601 - - 2,601
187,306 24,517 211,823 8,267 209,468 429,558
Derivative liabilities (A) 718 28 746 494 1,240
IFRS 17.111 a. IFRS 17 requires an entity to describe the composition of underlying items of direct participating insurance contracts and disclose their fair value. Although it is not required, the Group has disclosed the fair value of each type of underlying item and information about the underlying items of investment contracts and consolidated funds.
Intr
oduc
tion
Aud
itor
s’ r
epor
tPr
imar
y st
atem
ents
NO
TE
SFu
rthe
r re
sour
ces
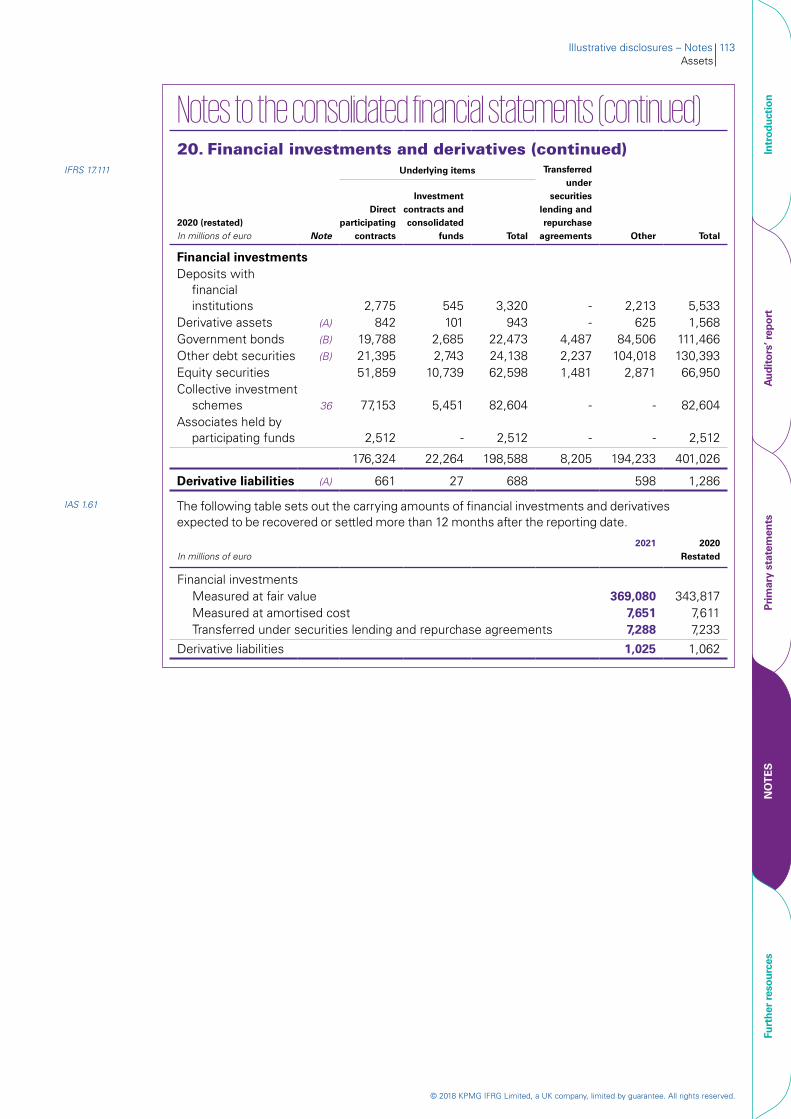
© 2018 KPMG IFRG Limited, a UK company, limited by guarantee. All rights reserved.
Illustrative disclosures – Notes 113Assets
Notes to the consolidated financial statements (continued)20. Financial investments and derivatives (continued)
IFRS 17.111 Underlying items Transferred under
securities lending and repurchase
agreements Other Total2020 (restated)In millions of euro Note
Direct participating
contracts
Investment contracts and consolidated
funds Total
Financial investmentsDeposits with
financial institutions 2,775 545 3,320 - 2,213 5,533
Derivative assets (A) 842 101 943 - 625 1,568 Government bonds (B) 19,788 2,685 22,473 4,487 84,506 111,466 Other debt securities (B) 21,395 2,743 24,138 2,237 104,018 130,393 Equity securities 51,859 10,739 62,598 1,481 2,871 66,950Collective investment
schemes 36 77,153 5,451 82,604 - - 82,604 Associates held by
participating funds 2,512 - 2,512 - - 2,512
176,324 22,264 198,588 8,205 194,233 401,026
Derivative liabilities (A) 661 27 688 598 1,286
IAS 1.61 The following table sets out the carrying amounts of financial investments and derivatives expected to be recovered or settled more than 12 months after the reporting date.
In millions of euro2021 2020
Restated
Financial investmentsMeasured at fair value 369,080 343,817Measured at amortised cost 7,651 7,611Transferred under securities lending and repurchase agreements 7,288 7,233
Derivative liabilities 1,025 1,062
Intr
oduc
tion
Aud
itor
s’ r
epor
tPr
imar
y st
atem
ents
NO
TE
SFu
rthe
r re
sour
ces
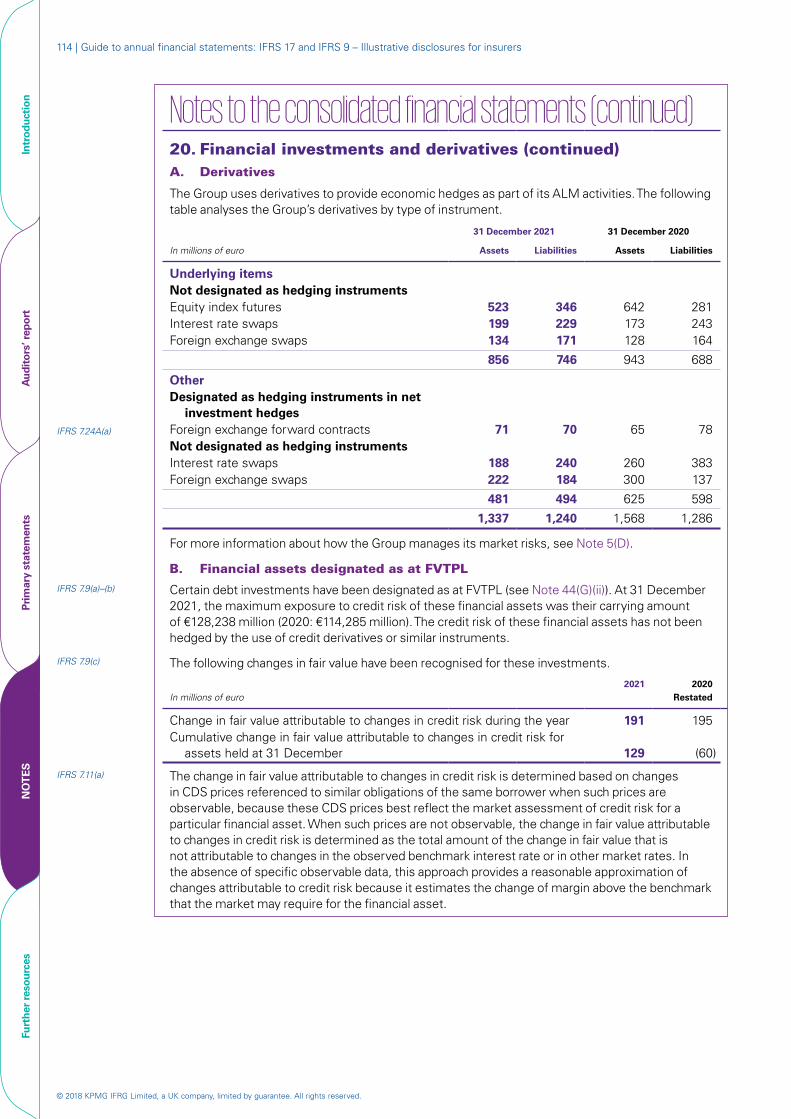
© 2018 KPMG IFRG Limited, a UK company, limited by guarantee. All rights reserved.
114 | Guide to annual financial statements: IFRS 17 and IFRS 9 – Illustrative disclosures for insurers
Notes to the consolidated financial statements (continued) 20. Financial investments and derivatives (continued)A. Derivatives
The Group uses derivatives to provide economic hedges as part of its ALM activities. The following table analyses the Group’s derivatives by type of instrument.
31 December 2021 31 December 2020
In millions of euro Assets Liabilities Assets Liabilities
Underlying itemsNot designated as hedging instrumentsEquity index futures 523 346 642 281Interest rate swaps 199 229 173 243Foreign exchange swaps 134 171 128 164
856 746 943 688
OtherDesignated as hedging instruments in net
investment hedgesIFRS 7.24A(a) Foreign exchange forward contracts 71 70 65 78
Not designated as hedging instrumentsInterest rate swaps 188 240 260 383Foreign exchange swaps 222 184 300 137
481 494 625 598
1,337 1,240 1,568 1,286
For more information about how the Group manages its market risks, see Note 5(D).
B. Financial assets designated as at FVTPLIFRS 7.9(a)–(b) Certain debt investments have been designated as at FVTPL (see Note 44(G)(ii)). At 31 December
2021, the maximum exposure to credit risk of these financial assets was their carrying amount of €128,238 million (2020: €114,285 million). The credit risk of these financial assets has not been hedged by the use of credit derivatives or similar instruments.
IFRS 7.9(c) The following changes in fair value have been recognised for these investments.
In millions of euro2021 2020
Restated
Change in fair value attributable to changes in credit risk during the year 191 195Cumulative change in fair value attributable to changes in credit risk for
assets held at 31 December 129 (60)
IFRS 7.11(a) The change in fair value attributable to changes in credit risk is determined based on changes in CDS prices referenced to similar obligations of the same borrower when such prices are observable, because these CDS prices best reflect the market assessment of credit risk for a particular financial asset. When such prices are not observable, the change in fair value attributable to changes in credit risk is determined as the total amount of the change in fair value that is not attributable to changes in the observed benchmark interest rate or in other market rates. In the absence of specific observable data, this approach provides a reasonable approximation of changes attributable to credit risk because it estimates the change of margin above the benchmark that the market may require for the financial asset.
Intr
oduc
tion
Aud
itor
s’ r
epor
tPr
imar
y st
atem
ents
NO
TE
SFu
rthe
r re
sour
ces

© 2018 KPMG IFRG Limited, a UK company, limited by guarantee. All rights reserved.
Illustrative disclosures – Notes 115Assets
Notes to the consolidated financial statements (continued)21. ReceivablesSee accounting policies in Note 44(G).
In millions of euro Note2021 2020
Restated
Receivables from reverse sale-and-repurchase counterparties 6,743 7,322Cash collateral pledged to counterparties of derivative liabilities 506 472Dividends receivable 124 394Operating lease receivables 183 178Loans to directors 40(B)(i) 2 1Other 51 103
7,609 8,470
IAS 1.61 Of the total receivables, €15 million (2020: €16 million) is expected to be recovered more than 12 months after the reporting date.
Dividends receivable include underlying items of the Group’s participating contracts of €18 million (2020: €28 million) (see Note 5(B)(ii)).
Intr
oduc
tion
Aud
itor
s’ r
epor
tPr
imar
y st
atem
ents
NO
TE
SFu
rthe
r re
sour
ces

© 2018 KPMG IFRG Limited, a UK company, limited by guarantee. All rights reserved.
116 | Guide to annual financial statements: IFRS 17 and IFRS 9 – Illustrative disclosures for insurers
Notes to the consolidated financial statements (continued)22. Investment propertya
See accounting policies in Note 44(M).
IFRS 16.92(a) The Group holds investment property as underlying items of its participating contracts. Investment property comprises commercial properties that are owned by the Group and leased to third parties under operating leases. Each of these leases contains an initial non-cancellable lease term of 10 years, with annual rents indexed to consumer prices. Some leases include options to extend at the end of the term and historically the average renewal period is four years.
A. Reconciliation of carrying amountIn millions of euro Note 2021 2020
IAS 40.76, IFRS 13.93(e) Balance at 1 January 5,829 5,649IAS 40.76(a), IFRS 13.93(e)(iii) Acquisitions 68 49IAS 40.76(d), IFRS 13.93(e)(i) Net change in fair value 10(C) 140 59IAS 40.76(c), IFRS 13.93(e)(iii) Disposals (102) (24) IAS 40.76(e) Effect of movements in exchange rates (65) 96IAS 40.76, IFRS 13.93(e) Balance at 31 December 5,870 5,829
IAS 1.61 Of the total investment property, €5,695 million (2020: 5,720 million) is expected to be recovered more than 12 months after the reporting date.
IFRS 13.93(e)(i), (f) Changes in fair values are recognised as gains in profit or loss and included in ‘other investment revenue’, of which €135 million (2020: €57 million) is attributable to investment property held at the reporting date.
B. Measurement of fair values
i. Fair value hierarchyIAS 40.75(e) The fair value of investment property was determined by external, independent property valuers,
having appropriate recognised professional qualifications and recent experience in the location and category of property being valued. The independent valuers provide the fair value of the Group’s investment property portfolio every six months.
IFRS 13.93(b) The fair value measurement for all of the investment properties has been categorised as a Level 3 fair value based on the inputs to the valuation technique used (see Note 6(A)).
Insights 3.4.260.40 a. Because IAS 40 Investment Property makes no reference to making disclosures on a class-by-class basis, it could be assumed that the minimum requirement is to make the disclosures on an aggregate basis for the whole investment property portfolio. However, if investment property represents a significant portion of the assets, then it may be appropriate to disclose additional analysis – e.g. portfolio by type of investment property.
Intr
oduc
tion
Aud
itor
s’ r
epor
tPr
imar
y st
atem
ents
NO
TE
SFu
rthe
r re
sour
ces
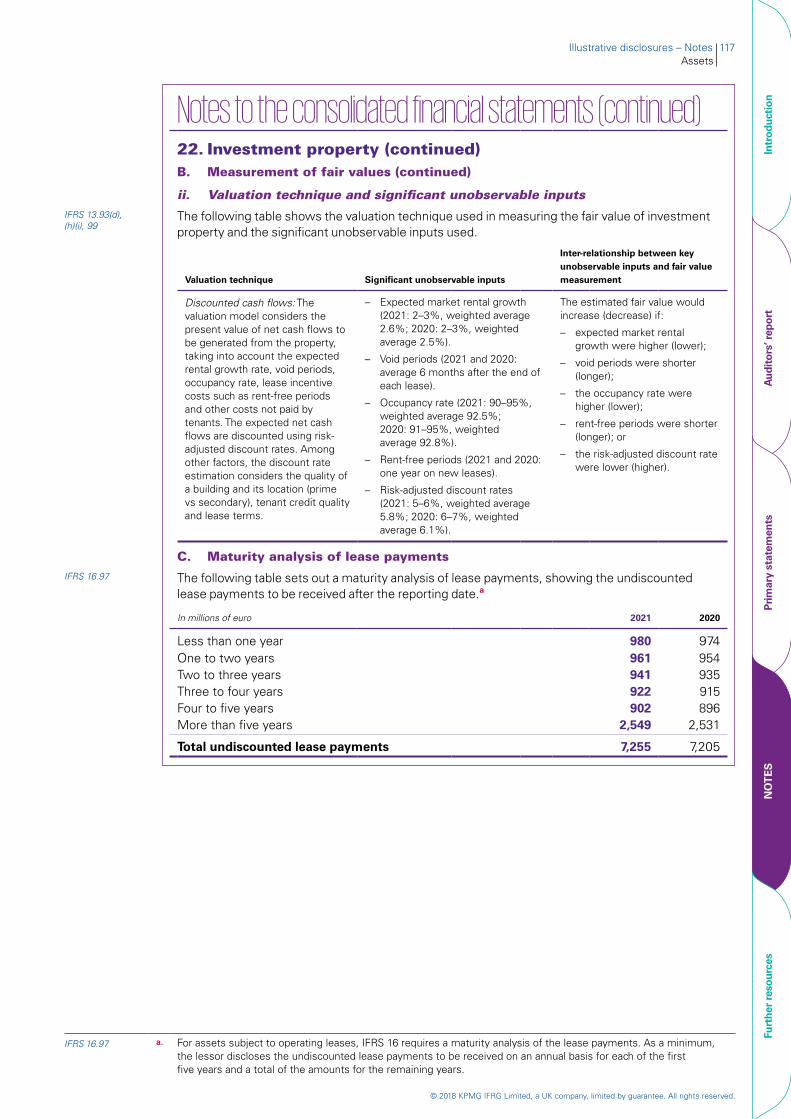
© 2018 KPMG IFRG Limited, a UK company, limited by guarantee. All rights reserved.
Illustrative disclosures – Notes 117Assets
Notes to the consolidated financial statements (continued)22. Investment property (continued)B. Measurement of fair values (continued)
ii. Valuation technique and significant unobservable inputsIFRS 13.93(d), (h)(i), 99
The following table shows the valuation technique used in measuring the fair value of investment property and the significant unobservable inputs used.
Valuation technique Significant unobservable inputs
Inter-relationship between key unobservable inputs and fair value measurement
Discounted cash flows: The valuation model considers the present value of net cash flows to be generated from the property, taking into account the expected rental growth rate, void periods, occupancy rate, lease incentive costs such as rent-free periods and other costs not paid by tenants. The expected net cash flows are discounted using risk-adjusted discount rates. Among other factors, the discount rate estimation considers the quality of a building and its location (prime vs secondary), tenant credit quality and lease terms.
– Expected market rental growth (2021: 2–3%, weighted average 2.6%; 2020: 2–3%, weighted average 2.5%).
– Void periods (2021 and 2020: average 6 months after the end of each lease).
– Occupancy rate (2021: 90–95%, weighted average 92.5%; 2020: 91–95%, weighted average 92.8%).
– Rent-free periods (2021 and 2020: one year on new leases).
– Risk-adjusted discount rates (2021: 5–6%, weighted average 5.8%; 2020: 6–7%, weighted average 6.1%).
The estimated fair value would increase (decrease) if:
– expected market rental growth were higher (lower);
– void periods were shorter (longer);
– the occupancy rate were higher (lower);
– rent-free periods were shorter (longer); or
– the risk-adjusted discount rate were lower (higher).
C. Maturity analysis of lease payments
IFRS 16.97 The following table sets out a maturity analysis of lease payments, showing the undiscounted lease payments to be received after the reporting date.a
In millions of euro 2021 2020
Less than one year 980 974One to two years 961 954Two to three years 941 935Three to four years 922 915Four to five years 902 896More than five years 2,549 2,531
Total undiscounted lease payments 7,255 7,205
IFRS 16.97 a. For assets subject to operating leases, IFRS 16 requires a maturity analysis of the lease payments. As a minimum, the lessor discloses the undiscounted lease payments to be received on an annual basis for each of the first five years and a total of the amounts for the remaining years.
Intr
oduc
tion
Aud
itor
s’ r
epor
tPr
imar
y st
atem
ents
NO
TE
SFu
rthe
r re
sour
ces
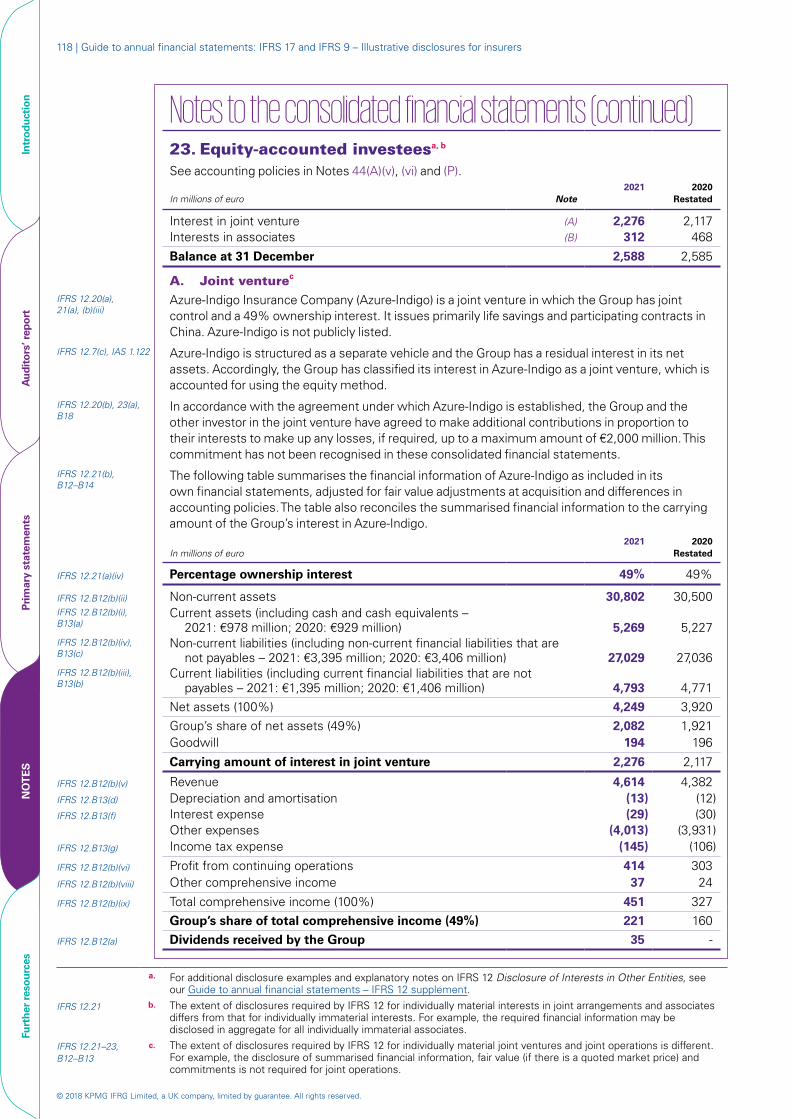
© 2018 KPMG IFRG Limited, a UK company, limited by guarantee. All rights reserved.
118 | Guide to annual financial statements: IFRS 17 and IFRS 9 – Illustrative disclosures for insurers
Notes to the consolidated financial statements (continued)23. Equity-accounted investeesa, b See accounting policies in Notes 44(A)(v), (vi) and (P).
In millions of euro Note2021 2020
Restated
Interest in joint venture (A) 2,276 2,117Interests in associates (B) 312 468
Balance at 31 December 2,588 2,585
A. Joint venturec IFRS 12.20(a), 21(a), (b)(iii)
Azure-Indigo Insurance Company (Azure-Indigo) is a joint venture in which the Group has joint control and a 49% ownership interest. It issues primarily life savings and participating contracts in China. Azure-Indigo is not publicly listed.
IFRS 12.7(c), IAS 1.122 Azure-Indigo is structured as a separate vehicle and the Group has a residual interest in its net assets. Accordingly, the Group has classified its interest in Azure-Indigo as a joint venture, which is accounted for using the equity method.
IFRS 12.20(b), 23(a), B18
In accordance with the agreement under which Azure-Indigo is established, the Group and the other investor in the joint venture have agreed to make additional contributions in proportion to their interests to make up any losses, if required, up to a maximum amount of €2,000 million. This commitment has not been recognised in these consolidated financial statements.
IFRS 12.21(b), B12–B14
The following table summarises the financial information of Azure-Indigo as included in its own financial statements, adjusted for fair value adjustments at acquisition and differences in accounting policies. The table also reconciles the summarised financial information to the carrying amount of the Group’s interest in Azure-Indigo.
In millions of euro2021 2020
Restated
IFRS 12.21(a)(iv) Percentage ownership interest 49% 49%
IFRS 12.B12(b)(ii) Non-current assets 30,802 30,500IFRS 12.B12(b)(i), B13(a)
Current assets (including cash and cash equivalents – 2021: €978 million; 2020: €929 million) 5,269 5,227
IFRS 12.B12(b)(iv), B13(c)
Non-current liabilities (including non-current financial liabilities that are not payables – 2021: €3,395 million; 2020: €3,406 million) 27,029 27,036
IFRS 12.B12(b)(iii), B13(b)
Current liabilities (including current financial liabilities that are not payables – 2021: €1,395 million; 2020: €1,406 million) 4,793 4,771
Net assets (100%) 4,249 3,920Group’s share of net assets (49%) 2,082 1,921Goodwill 194 196
Carrying amount of interest in joint venture 2,276 2,117
IFRS 12.B12(b)(v) Revenue 4,614 4,382IFRS 12.B13(d) Depreciation and amortisation (13) (12)IFRS 12.B13(f) Interest expense (29) (30)
Other expenses (4,013) (3,931)IFRS 12.B13(g) Income tax expense (145) (106)
IFRS 12.B12(b)(vi) Profit from continuing operations 414 303IFRS 12.B12(b)(viii) Other comprehensive income 37 24
IFRS 12.B12(b)(ix) Total comprehensive income (100%) 451 327Group’s share of total comprehensive income (49%) 221 160
IFRS 12.B12(a) Dividends received by the Group 35 -
a. For additional disclosure examples and explanatory notes on IFRS 12 Disclosure of Interests in Other Entities, see our Guide to annual financial statements – IFRS 12 supplement.
IFRS 12.21 b. The extent of disclosures required by IFRS 12 for individually material interests in joint arrangements and associates differs from that for individually immaterial interests. For example, the required financial information may be disclosed in aggregate for all individually immaterial associates.
IFRS 12.21–23, B12–B13
c. The extent of disclosures required by IFRS 12 for individually material joint ventures and joint operations is different. For example, the disclosure of summarised financial information, fair value (if there is a quoted market price) and commitments is not required for joint operations.
Intr
oduc
tion
Aud
itor
s’ r
epor
tPr
imar
y st
atem
ents
NO
TE
SFu
rthe
r re
sour
ces
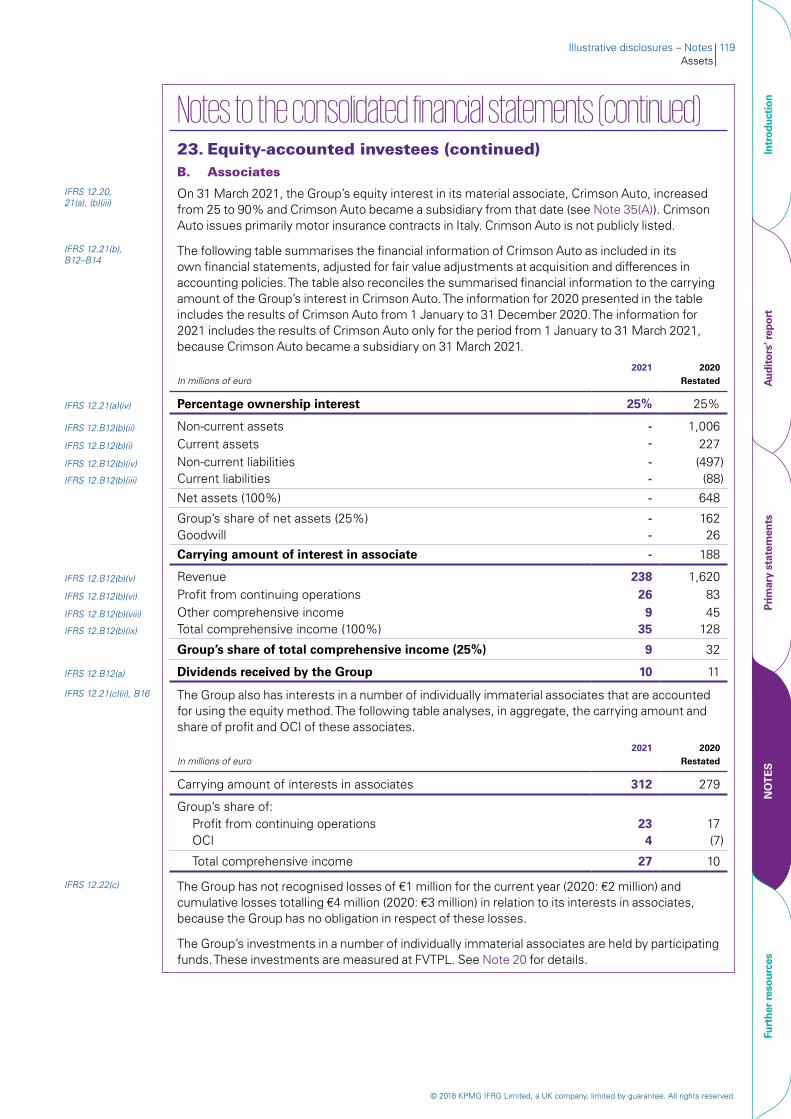
© 2018 KPMG IFRG Limited, a UK company, limited by guarantee. All rights reserved.
Illustrative disclosures – Notes 119Assets
Notes to the consolidated financial statements (continued)23. Equity-accounted investees (continued)B. Associates
IFRS 12.20, 21(a), (b)(iii)
On 31 March 2021, the Group’s equity interest in its material associate, Crimson Auto, increased from 25 to 90% and Crimson Auto became a subsidiary from that date (see Note 35(A)). Crimson Auto issues primarily motor insurance contracts in Italy. Crimson Auto is not publicly listed.
IFRS 12.21(b), B12–B14
The following table summarises the financial information of Crimson Auto as included in its own financial statements, adjusted for fair value adjustments at acquisition and differences in accounting policies. The table also reconciles the summarised financial information to the carrying amount of the Group’s interest in Crimson Auto. The information for 2020 presented in the table includes the results of Crimson Auto from 1 January to 31 December 2020. The information for 2021 includes the results of Crimson Auto only for the period from 1 January to 31 March 2021, because Crimson Auto became a subsidiary on 31 March 2021.
In millions of euro2021 2020
Restated
IFRS 12.21(a)(iv) Percentage ownership interest 25% 25%
IFRS 12.B12(b)(ii) Non-current assets - 1,006IFRS 12.B12(b)(i) Current assets - 227IFRS 12.B12(b)(iv) Non-current liabilities - (497)IFRS 12.B12(b)(iii) Current liabilities - (88)
Net assets (100%) - 648
Group’s share of net assets (25%) - 162Goodwill - 26
Carrying amount of interest in associate - 188
IFRS 12.B12(b)(v) Revenue 238 1,620IFRS 12.B12(b)(vi) Profit from continuing operations 26 83IFRS 12.B12(b)(viii) Other comprehensive income 9 45IFRS 12.B12(b)(ix) Total comprehensive income (100%) 35 128
Group’s share of total comprehensive income (25%) 9 32
IFRS 12.B12(a) Dividends received by the Group 10 11
IFRS 12.21(c)(ii), B16 The Group also has interests in a number of individually immaterial associates that are accounted for using the equity method. The following table analyses, in aggregate, the carrying amount and share of profit and OCI of these associates.
In millions of euro2021 2020
Restated
Carrying amount of interests in associates 312 279
Group’s share of: Profit from continuing operations 23 17 OCI 4 (7)
Total comprehensive income 27 10
IFRS 12.22(c) The Group has not recognised losses of €1 million for the current year (2020: €2 million) and cumulative losses totalling €4 million (2020: €3 million) in relation to its interests in associates, because the Group has no obligation in respect of these losses.
The Group’s investments in a number of individually immaterial associates are held by participating funds. These investments are measured at FVTPL. See Note 20 for details.
Intr
oduc
tion
Aud
itor
s’ r
epor
tPr
imar
y st
atem
ents
NO
TE
SFu
rthe
r re
sour
ces
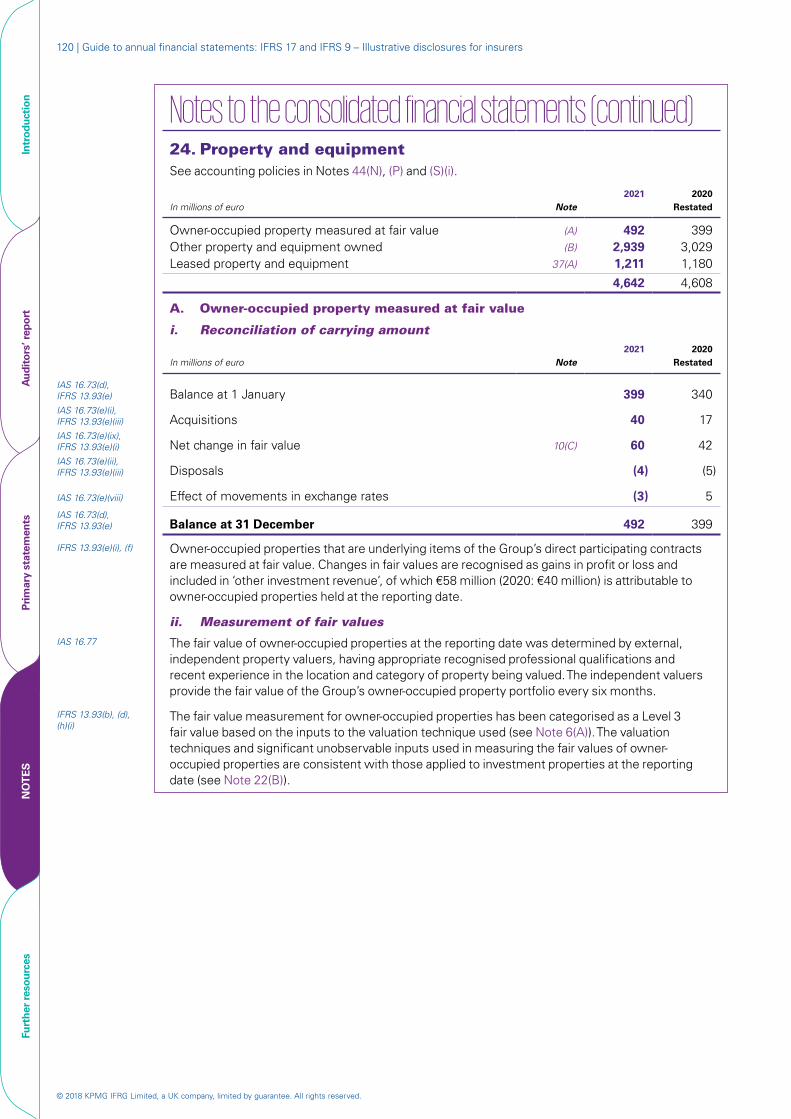
© 2018 KPMG IFRG Limited, a UK company, limited by guarantee. All rights reserved.
120 | Guide to annual financial statements: IFRS 17 and IFRS 9 – Illustrative disclosures for insurers
Notes to the consolidated financial statements (continued)24. Property and equipmentSee accounting policies in Notes 44(N), (P) and (S)(i).
In millions of euro Note2021 2020
Restated
Owner-occupied property measured at fair value (A) 492 399Other property and equipment owned (B) 2,939 3,029Leased property and equipment 37(A) 1,211 1,180
4,642 4,608
A. Owner-occupied property measured at fair value
i. Reconciliation of carrying amount
In millions of euro Note2021 2020
Restated
IAS 16.73(d), IFRS 13.93(e) Balance at 1 January 399 340IAS 16.73(e)(i), IFRS 13.93(e)(iii) Acquisitions 40 17IAS 16.73(e)(ix), IFRS 13.93(e)(i) Net change in fair value 10(C) 60 42IAS 16.73(e)(ii), IFRS 13.93(e)(iii) Disposals (4) (5) IAS 16.73(e)(viii) Effect of movements in exchange rates (3) 5IAS 16.73(d), IFRS 13.93(e) Balance at 31 December 492 399
IFRS 13.93(e)(i), (f) Owner-occupied properties that are underlying items of the Group’s direct participating contracts are measured at fair value. Changes in fair values are recognised as gains in profit or loss and included in ‘other investment revenue’, of which €58 million (2020: €40 million) is attributable to owner-occupied properties held at the reporting date.
ii. Measurement of fair valuesIAS 16.77 The fair value of owner-occupied properties at the reporting date was determined by external,
independent property valuers, having appropriate recognised professional qualifications and recent experience in the location and category of property being valued. The independent valuers provide the fair value of the Group’s owner-occupied property portfolio every six months.
IFRS 13.93(b), (d), (h)(i)
The fair value measurement for owner-occupied properties has been categorised as a Level 3 fair value based on the inputs to the valuation technique used (see Note 6(A)). The valuation techniques and significant unobservable inputs used in measuring the fair values of owner-occupied properties are consistent with those applied to investment properties at the reporting date (see Note 22(B)).
Intr
oduc
tion
Aud
itor
s’ r
epor
tPr
imar
y st
atem
ents
NO
TE
SFu
rthe
r re
sour
ces

© 2018 KPMG IFRG Limited, a UK company, limited by guarantee. All rights reserved.
Illustrative disclosures – Notes 121Assets
Notes to the consolidated financial statements (continued)
24. Property and equipment (continued)B. Other property and equipment owneda
In millions of euro NoteLand and
buildings*IT
equipmentFixtures and
fittings Total*
CostIAS 16.73(d) Balance at 1 January 2020 1,929 1,023 522 3,474IAS 16.73(e)(i) Additions 98 192 49 339IAS 16.73(e)(ii) Disposals (48) - (14) (62)IAS 16.73(e)(viii) Effect of movements in exchange rates 27 14 5 46
IAS 16.73(d) Balance at 31 December 2020 2,006 1,229 562 3,797
IAS 16.73(d) Balance at 1 January 2021 2,006 1,229 562 3,797IAS 16.73(e)(iii) Acquisitions through business combinations 35(A) 31 - - 31IAS 16.73(e)(i) Other additions 144 113 78 335IAS 16.73(e)(ii) Disposals (41) (132) (85) (258)IAS 16.73(e)(viii) Effect of movements in exchange rates (20) (10) (4) (34)
IAS 16.73(d) Balance at 31 December 2021 2,120 1,200 551 3,871
Accumulated depreciation and impairment lossesIAS 16.73(d) Balance at 1 January 2020 106 251 115 472IAS 16.73(e)(vii) Depreciation 13 40 213 55 308IAS 16.73(e)(ii) Disposals (3) - (14) (17)IAS 16.73(e)(viii) Effect of movements in exchange rates 1 3 1 5
IAS 16.73(d) Balance at 31 December 2020 144 467 157 768
IAS 16.73(d) Balance at 1 January 2021 144 467 157 768IAS 16.73(e)(vii) Depreciation 13 41 255 59 355IAS 16.73(e)(ii) Disposals (2) (98) (85) (185)IAS 16.73(e)(viii) Effect of movements in exchange rates (2) (3) (1) (6)
IAS 16.73(d) Balance at 31 December 2021 181 621 130 932
IAS 1.78(a) Carrying amountsAt 1 January 2020 1,823 772 407 3,002At 31 December 2020 1,862 762 405 3,029At 31 December 2021 1,939 579 421 2,939
* Restated – see Note 43.
IAS 16.73(d)–(e) a. Although IAS 16 Property, Plant and Equipment only requires the reconciliation of the carrying amount at the beginning and at the end of the reporting period, the Group has also provided separate reconciliations of the gross carrying amount and accumulated depreciation. These additional reconciliations are not required and a different format may be used.
Intr
oduc
tion
Aud
itor
s’ r
epor
tPr
imar
y st
atem
ents
NO
TE
SFu
rthe
r re
sour
ces
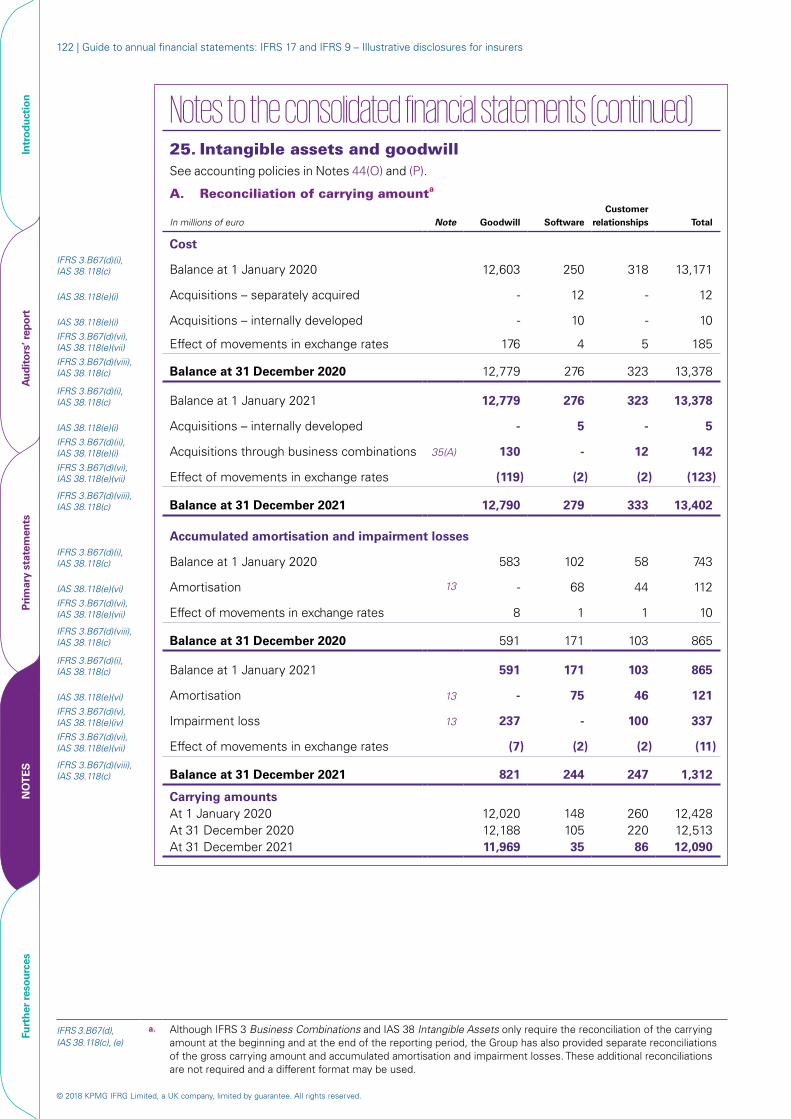
© 2018 KPMG IFRG Limited, a UK company, limited by guarantee. All rights reserved.
122 | Guide to annual financial statements: IFRS 17 and IFRS 9 – Illustrative disclosures for insurers
Notes to the consolidated financial statements (continued) 25. Intangible assets and goodwillSee accounting policies in Notes 44(O) and (P).
A. Reconciliation of carrying amounta
In millions of euro Note Goodwill SoftwareCustomer
relationships Total
CostIFRS 3.B67(d)(i), IAS 38.118(c) Balance at 1 January 2020 12,603 250 318 13,171 IAS 38.118(e)(i) Acquisitions – separately acquired - 12 - 12 IAS 38.118(e)(i) Acquisitions – internally developed - 10 - 10IFRS 3.B67(d)(vi), IAS 38.118(e)(vii) Effect of movements in exchange rates 176 4 5 185IFRS 3.B67(d)(viii), IAS 38.118(c) Balance at 31 December 2020 12,779 276 323 13,378IFRS 3.B67(d)(i), IAS 38.118(c) Balance at 1 January 2021 12,779 276 323 13,378 IAS 38.118(e)(i) Acquisitions – internally developed - 5 - 5IFRS 3.B67(d)(ii), IAS 38.118(e)(i) Acquisitions through business combinations 35(A) 130 - 12 142IFRS 3.B67(d)(vi), IAS 38.118(e)(vii) Effect of movements in exchange rates (119) (2) (2) (123)IFRS 3.B67(d)(viii), IAS 38.118(c) Balance at 31 December 2021 12,790 279 333 13,402
Accumulated amortisation and impairment losses
IFRS 3.B67(d)(i), IAS 38.118(c) Balance at 1 January 2020 583 102 58 743 IAS 38.118(e)(vi) Amortisation 13 - 68 44 112IFRS 3.B67(d)(vi), IAS 38.118(e)(vii) Effect of movements in exchange rates 8 1 1 10IFRS 3.B67(d)(viii), IAS 38.118(c) Balance at 31 December 2020 591 171 103 865IFRS 3.B67(d)(i), IAS 38.118(c) Balance at 1 January 2021 591 171 103 865 IAS 38.118(e)(vi) Amortisation 13 - 75 46 121IFRS 3.B67(d)(v), IAS 38.118(e)(iv) Impairment loss 13 237 - 100 337IFRS 3.B67(d)(vi), IAS 38.118(e)(vii) Effect of movements in exchange rates (7) (2) (2) (11)IFRS 3.B67(d)(viii), IAS 38.118(c) Balance at 31 December 2021 821 244 247 1,312
Carrying amountsAt 1 January 2020 12,020 148 260 12,428At 31 December 2020 12,188 105 220 12,513At 31 December 2021 11,969 35 86 12,090
IFRS 3.B67(d), IAS 38.118(c), (e)
a. Although IFRS 3 Business Combinations and IAS 38 Intangible Assets only require the reconciliation of the carrying amount at the beginning and at the end of the reporting period, the Group has also provided separate reconciliations of the gross carrying amount and accumulated amortisation and impairment losses. These additional reconciliations are not required and a different format may be used.
Intr
oduc
tion
Aud
itor
s’ r
epor
tPr
imar
y st
atem
ents
NO
TE
SFu
rthe
r re
sour
ces
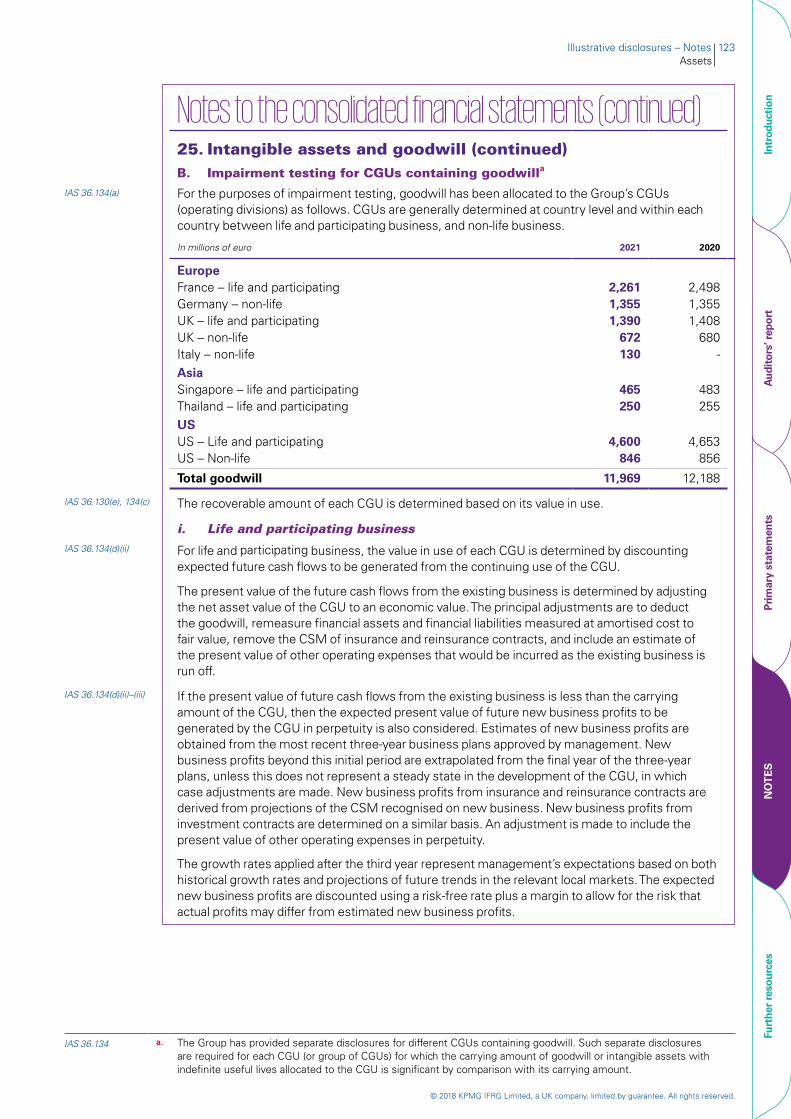
© 2018 KPMG IFRG Limited, a UK company, limited by guarantee. All rights reserved.
Illustrative disclosures – Notes 123Assets
Notes to the consolidated financial statements (continued) 25. Intangible assets and goodwill (continued)B. Impairment testing for CGUs containing goodwilla
IAS 36.134(a) For the purposes of impairment testing, goodwill has been allocated to the Group’s CGUs (operating divisions) as follows. CGUs are generally determined at country level and within each country between life and participating business, and non-life business.
In millions of euro 2021 2020
EuropeFrance – life and participating 2,261 2,498Germany – non-life 1,355 1,355UK – life and participating 1,390 1,408UK – non-life 672 680Italy – non-life 130 -AsiaSingapore – life and participating 465 483Thailand – life and participating 250 255USUS – Life and participating 4,600 4,653US – Non-life 846 856
Total goodwill 11,969 12,188
IAS 36.130(e), 134(c) The recoverable amount of each CGU is determined based on its value in use.
i. Life and participating businessIAS 36.134(d)(ii) For life and participating business, the value in use of each CGU is determined by discounting
expected future cash flows to be generated from the continuing use of the CGU.
The present value of the future cash flows from the existing business is determined by adjusting the net asset value of the CGU to an economic value. The principal adjustments are to deduct the goodwill, remeasure financial assets and financial liabilities measured at amortised cost to fair value, remove the CSM of insurance and reinsurance contracts, and include an estimate of the present value of other operating expenses that would be incurred as the existing business is run off.
IAS 36.134(d)(ii)–(iii) If the present value of future cash flows from the existing business is less than the carrying amount of the CGU, then the expected present value of future new business profits to be generated by the CGU in perpetuity is also considered. Estimates of new business profits are obtained from the most recent three-year business plans approved by management. New business profits beyond this initial period are extrapolated from the final year of the three-year plans, unless this does not represent a steady state in the development of the CGU, in which case adjustments are made. New business profits from insurance and reinsurance contracts are derived from projections of the CSM recognised on new business. New business profits from investment contracts are determined on a similar basis. An adjustment is made to include the present value of other operating expenses in perpetuity.
The growth rates applied after the third year represent management’s expectations based on both historical growth rates and projections of future trends in the relevant local markets. The expected new business profits are discounted using a risk-free rate plus a margin to allow for the risk that actual profits may differ from estimated new business profits.
IAS 36.134 a. The Group has provided separate disclosures for different CGUs containing goodwill. Such separate disclosures are required for each CGU (or group of CGUs) for which the carrying amount of goodwill or intangible assets with indefinite useful lives allocated to the CGU is significant by comparison with its carrying amount.
Intr
oduc
tion
Aud
itor
s’ r
epor
tPr
imar
y st
atem
ents
NO
TE
SFu
rthe
r re
sour
ces

© 2018 KPMG IFRG Limited, a UK company, limited by guarantee. All rights reserved.
124 | Guide to annual financial statements: IFRS 17 and IFRS 9 – Illustrative disclosures for insurers
Notes to the consolidated financial statements (continued) 25. Intangible assets and goodwill (continued)B. Impairment testing for CGUs containing goodwill (continued)
ii. Non-life businessIAS 36.134(d)(ii)–(iii) The value in use of a non-life CGU is based on the expected profits to be earned from the CGU in
perpetuity discounted using a risk-adjusted discount rate. The expected profits to be earned over the first three-year period are based on the most recent three-year business plans approved by management. Cash flow projections beyond this initial period are extrapolated from the final year of the three-year plans, unless this does not represent a steady state in the development of the CGU, in which case adjustments are made. The growth rates applied after the third year represent management’s expectations based on both historical growth rates and projections of future trends in the relevant industries. The expected profits are then discounted using a risk-free rate plus a margin to make allowance for the risk that the actual profits may differ from the estimated profits.
iii. Key assumptions used in cash flow projectionsIAS 36.134(d)(i), (iv)–(v) The key assumptions used to determine the present value of the future cash flows of the existing
business are the assumptions used to determine the fulfilment cash flows of insurance and reinsurance contracts.
The present value of the future cash flows of existing business was sufficient to demonstrate the recoverability of the goodwill allocated to the UK and Singapore life and participating CGUs and it was not necessary to estimate the present value of the future cash flows from future new business.
The key assumptions used in the estimation of value in use are the discount rates and the growth rates for future cash flows beyond the initial period covered by the most recent business plans approved by management, as set out below.a
2021 2020
Growth rate Discount rate Growth rate Discount rate
EuropeIAS 36.130(g) France – life and participating - 8.5% - 8.5%
Germany – non-life 2.5% 8.3% 2.5% 8.2%UK – non-life 2.5% 9.3% 2.5% 9.2%Italy – non-life 3.0% 9.3%Asia
IAS 36.134(f)(ii) Thailand – life and participating 3.5% 12.5% 3.5% 12.5%USUS – life and participating 2.5% 8.0% 2.5% 8.2%US – non-life 2.5% 10.5% 2.0% 10.3%
IAS 36.134(d)(iv)–(v), (e)(iv)–(v), (f)
a. IAS 36 Impairment of Assets requires quantitative disclosures (i.e. values) in respect of the discount rates and growth rates used to extrapolate cash flow projections. Narrative disclosures are sufficient for other key assumptions unless a reasonably possible change in the assumption would result in an impairment; in that case, the value of the assumption is disclosed.
Intr
oduc
tion
Aud
itor
s’ r
epor
tPr
imar
y st
atem
ents
NO
TE
SFu
rthe
r re
sour
ces
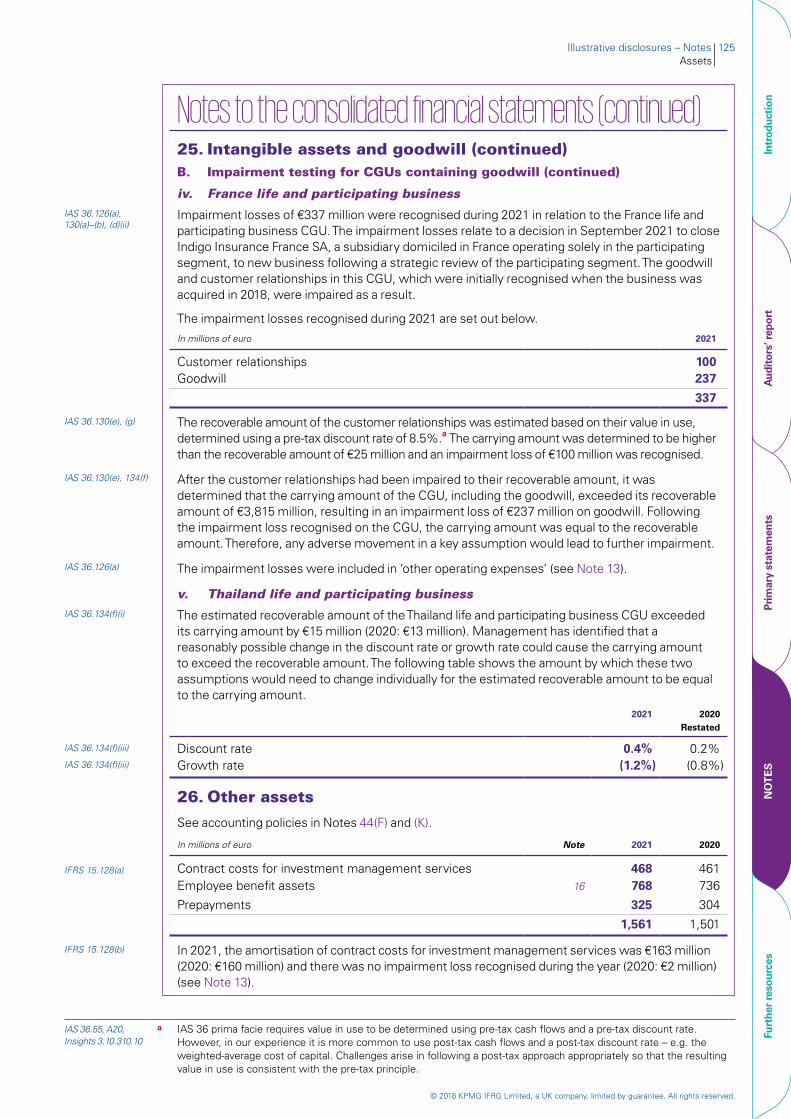
© 2018 KPMG IFRG Limited, a UK company, limited by guarantee. All rights reserved.
Illustrative disclosures – Notes 125Assets
Notes to the consolidated financial statements (continued)25. Intangible assets and goodwill (continued)B. Impairment testing for CGUs containing goodwill (continued)
iv. France life and participating businessIAS 36.126(a), 130(a)–(b), (d)(ii)
Impairment losses of €337 million were recognised during 2021 in relation to the France life and participating business CGU. The impairment losses relate to a decision in September 2021 to close Indigo Insurance France SA, a subsidiary domiciled in France operating solely in the participating segment, to new business following a strategic review of the participating segment. The goodwill and customer relationships in this CGU, which were initially recognised when the business was acquired in 2018, were impaired as a result.
The impairment losses recognised during 2021 are set out below.In millions of euro 2021
Customer relationships 100Goodwill 237
337
IAS 36.130(e), (g) The recoverable amount of the customer relationships was estimated based on their value in use, determined using a pre-tax discount rate of 8.5%.a The carrying amount was determined to be higher than the recoverable amount of €25 million and an impairment loss of €100 million was recognised.
IAS 36.130(e), 134(f) After the customer relationships had been impaired to their recoverable amount, it was determined that the carrying amount of the CGU, including the goodwill, exceeded its recoverable amount of €3,815 million, resulting in an impairment loss of €237 million on goodwill. Following the impairment loss recognised on the CGU, the carrying amount was equal to the recoverable amount. Therefore, any adverse movement in a key assumption would lead to further impairment.
IAS 36.126(a) The impairment losses were included in ‘other operating expenses’ (see Note 13).
v. Thailand life and participating businessIAS 36.134(f)(i) The estimated recoverable amount of the Thailand life and participating business CGU exceeded
its carrying amount by €15 million (2020: €13 million). Management has identified that a reasonably possible change in the discount rate or growth rate could cause the carrying amount to exceed the recoverable amount. The following table shows the amount by which these two assumptions would need to change individually for the estimated recoverable amount to be equal to the carrying amount.
2021 2020Restated
IAS 36.134(f)(iii) Discount rate 0.4% 0.2%IAS 36.134(f)(iii) Growth rate (1.2%) (0.8%)
26. Other assets
See accounting policies in Notes 44(F) and (K).
In millions of euro Note 2021 2020
IFRS 15.128(a) Contract costs for investment management services 468 461Employee benefit assets 16 768 736
Prepayments 325 304
1,561 1,501
IFRS 15.128(b) In 2021, the amortisation of contract costs for investment management services was €163 million (2020: €160 million) and there was no impairment loss recognised during the year (2020: €2 million) (see Note 13).
IAS 36.55, A20, Insights 3.10.310.10
a IAS 36 prima facie requires value in use to be determined using pre-tax cash flows and a pre-tax discount rate. However, in our experience it is more common to use post-tax cash flows and a post-tax discount rate – e.g. the weighted-average cost of capital. Challenges arise in following a post-tax approach appropriately so that the resulting value in use is consistent with the pre-tax principle.
Intr
oduc
tion
Aud
itor
s’ r
epor
tPr
imar
y st
atem
ents
NO
TE
SFu
rthe
r re
sour
ces
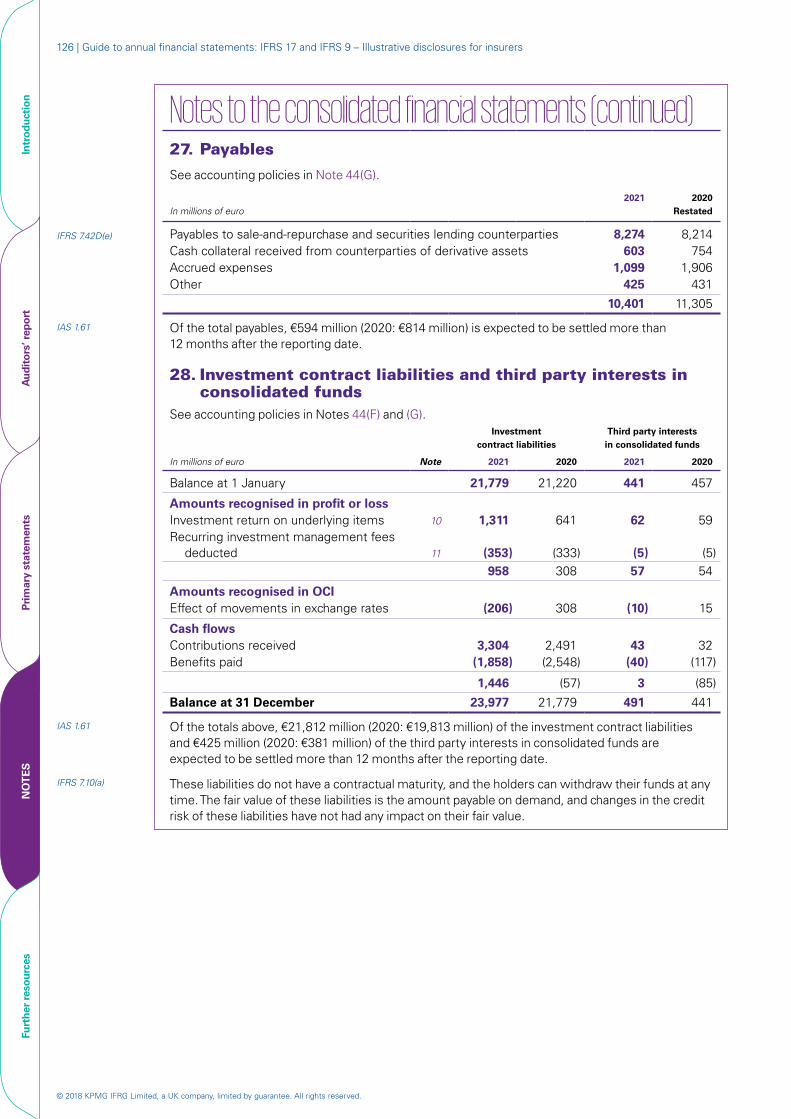
© 2018 KPMG IFRG Limited, a UK company, limited by guarantee. All rights reserved.
126 | Guide to annual financial statements: IFRS 17 and IFRS 9 – Illustrative disclosures for insurers
Notes to the consolidated financial statements (continued)27. Payables
See accounting policies in Note 44(G).
In millions of euro2021 2020
Restated
IFRS 7.42D(e) Payables to sale-and-repurchase and securities lending counterparties 8,274 8,214Cash collateral received from counterparties of derivative assets 603 754Accrued expenses 1,099 1,906Other 425 431
10,401 11,305
IAS 1.61 Of the total payables, €594 million (2020: €814 million) is expected to be settled more than 12 months after the reporting date.
28. Investment contract liabilities and third party interests in consolidated funds
See accounting policies in Notes 44(F) and (G).
Note
Investment contract liabilities
Third party interests in consolidated funds
In millions of euro 2021 2020 2021 2020
Balance at 1 January 21,779 21,220 441 457
Amounts recognised in profit or lossInvestment return on underlying items 10 1,311 641 62 59Recurring investment management fees
deducted 11 (353) (333) (5) (5)958 308 57 54
Amounts recognised in OCIEffect of movements in exchange rates (206) 308 (10) 15
Cash flowsContributions received 3,304 2,491 43 32Benefits paid (1,858) (2,548) (40) (117)
1,446 (57) 3 (85)
Balance at 31 December 23,977 21,779 491 441
IAS 1.61 Of the totals above, €21,812 million (2020: €19,813 million) of the investment contract liabilities and €425 million (2020: €381 million) of the third party interests in consolidated funds are expected to be settled more than 12 months after the reporting date.
IFRS 7.10(a) These liabilities do not have a contractual maturity, and the holders can withdraw their funds at any time. The fair value of these liabilities is the amount payable on demand, and changes in the credit risk of these liabilities have not had any impact on their fair value.
Intr
oduc
tion
Aud
itor
s’ r
epor
tPr
imar
y st
atem
ents
NO
TE
SFu
rthe
r re
sour
ces
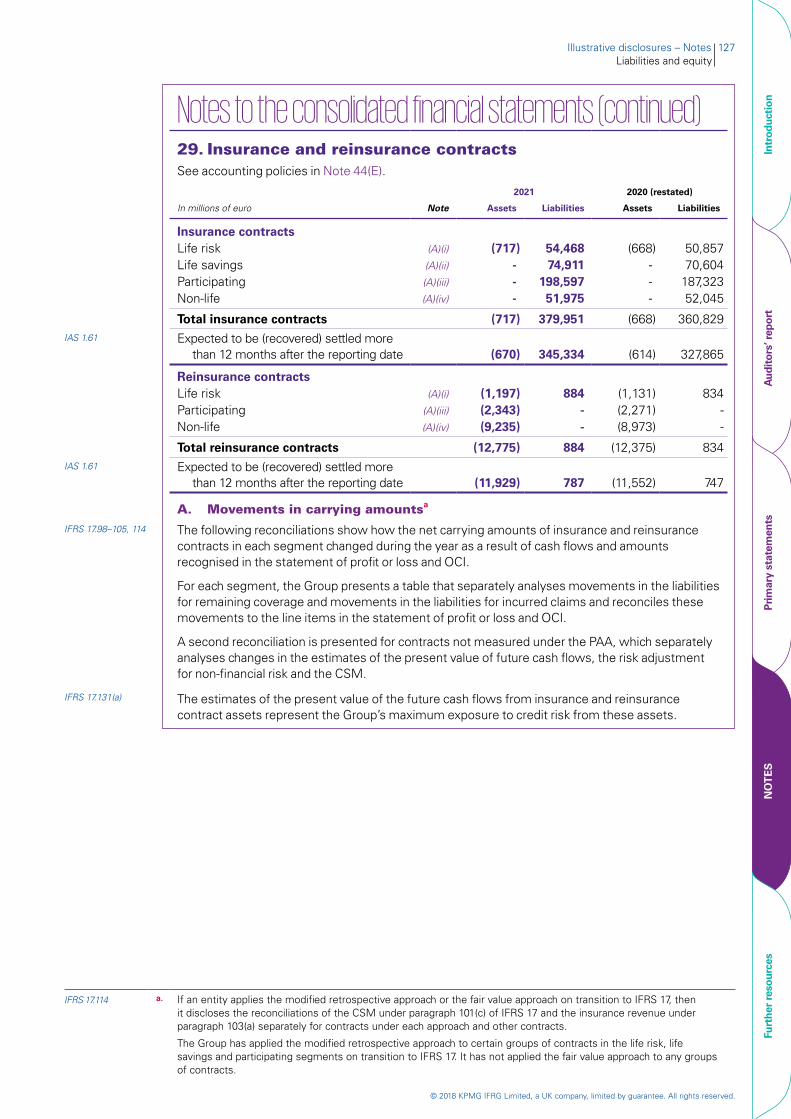
© 2018 KPMG IFRG Limited, a UK company, limited by guarantee. All rights reserved.
Illustrative disclosures – Notes 127Liabilities and equity
Notes to the consolidated financial statements (continued)29. Insurance and reinsurance contracts See accounting policies in Note 44(E).
2021 2020 (restated)
In millions of euro Note Assets Liabilities Assets Liabilities
Insurance contractsLife risk (A)(i) (717) 54,468 (668) 50,857Life savings (A)(ii) - 74,911 - 70,604Participating (A)(iii) - 198,597 - 187,323Non-life (A)(iv) - 51,975 - 52,045
Total insurance contracts (717) 379,951 (668) 360,829IAS 1.61 Expected to be (recovered) settled more
than 12 months after the reporting date (670) 345,334 (614) 327,865
Reinsurance contractsLife risk (A)(i) (1,197) 884 (1,131) 834Participating (A)(iii) (2,343) - (2,271) -Non-life (A)(iv) (9,235) - (8,973) -
Total reinsurance contracts (12,775) 884 (12,375) 834IAS 1.61 Expected to be (recovered) settled more
than 12 months after the reporting date (11,929) 787 (11,552) 747
A. Movements in carrying amountsa IFRS 17.98–105, 114 The following reconciliations show how the net carrying amounts of insurance and reinsurance
contracts in each segment changed during the year as a result of cash flows and amounts recognised in the statement of profit or loss and OCI.
For each segment, the Group presents a table that separately analyses movements in the liabilities for remaining coverage and movements in the liabilities for incurred claims and reconciles these movements to the line items in the statement of profit or loss and OCI.
A second reconciliation is presented for contracts not measured under the PAA, which separately analyses changes in the estimates of the present value of future cash flows, the risk adjustment for non-financial risk and the CSM.
IFRS 17.131(a) The estimates of the present value of the future cash flows from insurance and reinsurance contract assets represent the Group’s maximum exposure to credit risk from these assets.
IFRS 17.114 a. If an entity applies the modified retrospective approach or the fair value approach on transition to IFRS 17, then it discloses the reconciliations of the CSM under paragraph 101(c) of IFRS 17 and the insurance revenue under paragraph 103(a) separately for contracts under each approach and other contracts.
The Group has applied the modified retrospective approach to certain groups of contracts in the life risk, life savings and participating segments on transition to IFRS 17. It has not applied the fair value approach to any groups of contracts.
Intr
oduc
tion
Aud
itor
s’ r
epor
tPr
imar
y st
atem
ents
NO
TE
SFu
rthe
r re
sour
ces
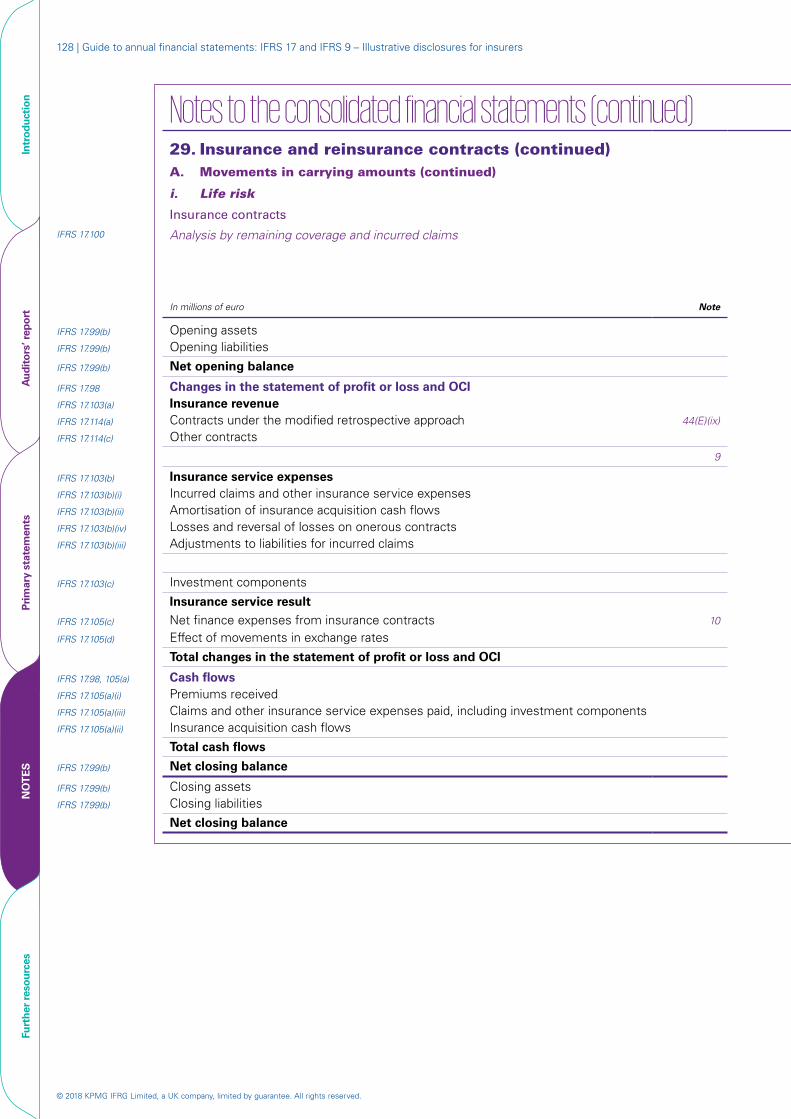
© 2018 KPMG IFRG Limited, a UK company, limited by guarantee. All rights reserved.
128 | Guide to annual financial statements: IFRS 17 and IFRS 9 – Illustrative disclosures for insurers
Notes to the consolidated financial statements (continued)29. Insurance and reinsurance contracts (continued)A. Movements in carrying amounts (continued)
i. Life risk
Insurance contracts
IFRS 17.100 Analysis by remaining coverage and incurred claims2021 2020
Liabilities for remaining coverage
Liabilities for incurred claims Total
Liabilities for remaining coverage
Liabilities for incurred claims TotalIn millions of euro Note
Excluding loss component
Loss component
Excluding loss component
Loss component
IFRS 17.99(b) Opening assets (711) 31 12 (668) (672) 36 14 (622)IFRS 17.99(b) Opening liabilities 48,143 1,998 716 50,857 43,443 1,933 724 46,100
IFRS 17.99(b) Net opening balance 47,432 2,029 728 50,189 42,771 1,969 738 45,478
IFRS 17.98 Changes in the statement of profit or loss and OCIIFRS 17.103(a) Insurance revenueIFRS 17.114(a) Contracts under the modified retrospective approach 44(E)(ix) (5,256) - - (5,256) (5,608) - - (5,608) IFRS 17.114(c) Other contracts (3,399) - - (3,399) (2,658) - - (2,658)
9 (8,655) - - (8,655) (8,266) - - (8,266)
IFRS 17.103(b) Insurance service expensesIFRS 17.103(b)(i) Incurred claims and other insurance service expenses - (168) 7,247 7,079 - (158) 6,900 6,742 IFRS 17.103(b)(ii) Amortisation of insurance acquisition cash flows 688 - - 688 609 - - 609 IFRS 17.103(b)(iv) Losses and reversal of losses on onerous contracts - (48) - (48) - 58 - 58 IFRS 17.103(b)(iii) Adjustments to liabilities for incurred claims - - 9 9 - - (11) (11)
688 (216) 7,256 7,728 609 (100) 6,889 7,398
IFRS 17.103(c) Investment components (903) - 903 - (881) - 881 -
Insurance service result (8,870) (216) 8,159 (927) (8,538) (100) 7,770 (868)
IFRS 17.105(c) Net finance expenses from insurance contracts 10 2,909 133 49 3,091 2,803 124 46 2,973 IFRS 17.105(d) Effect of movements in exchange rates (417) (17) (7) (441) 859 36 10 905
Total changes in the statement of profit or loss and OCI (6,378) (100) 8,201 1,723 (4,876) 60 7,826 3,010
IFRS 17.98, 105(a) Cash flowsIFRS 17.105(a)(i) Premiums received 10,665 - - 10,665 10,157 - - 10,157 IFRS 17.105(a)(iii) Claims and other insurance service expenses paid, including investment components - - (8,163) (8,163) - - (7,836) (7,836)IFRS 17.105(a)(ii) Insurance acquisition cash flows (663) - - (663) (620) - - (620)
Total cash flows 10,002 - (8,163) 1,839 9,537 - (7,836) 1,701
IFRS 17.99(b) Net closing balance 51,056 1,929 766 53,751 47,432 2,029 728 50,189
IFRS 17.99(b) Closing assets (765) 34 14 (717) (711) 31 12 (668)IFRS 17.99(b) Closing liabilities 51,821 1,895 752 54,468 48,143 1,998 716 50,857
Net closing balance 51,056 1,929 766 53,751 47,432 2,029 728 50,189
Intr
oduc
tion
Aud
itor
s’ r
epor
tPr
imar
y st
atem
ents
NO
TE
SFu
rthe
r re
sour
ces
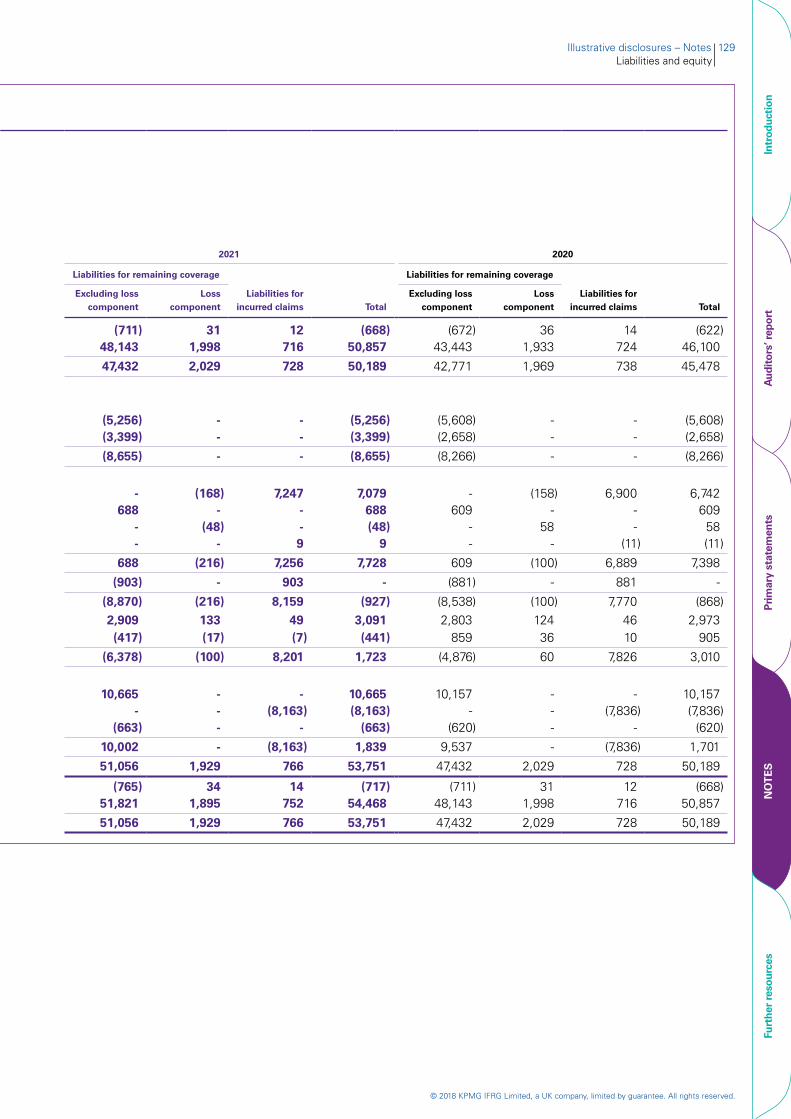
© 2018 KPMG IFRG Limited, a UK company, limited by guarantee. All rights reserved.
Illustrative disclosures – Notes 129Liabilities and equity
Notes to the consolidated financial statements (continued)29. Insurance and reinsurance contracts (continued)A. Movements in carrying amounts (continued)
i. Life risk
Insurance contracts
IFRS 17.100 Analysis by remaining coverage and incurred claims2021 2020
Liabilities for remaining coverage
Liabilities for incurred claims Total
Liabilities for remaining coverage
Liabilities for incurred claims Total
Excluding loss component
Loss component
Excluding loss component
Loss component
(711) 31 12 (668) (672) 36 14 (622) 48,143 1,998 716 50,857 43,443 1,933 724 46,100
47,432 2,029 728 50,189 42,771 1,969 738 45,478
(5,256) - - (5,256) (5,608) - - (5,608) (3,399) - - (3,399) (2,658) - - (2,658)
(8,655) - - (8,655) (8,266) - - (8,266)
- (168) 7,247 7,079 - (158) 6,900 6,742 688 - - 688 609 - - 609
- (48) - (48) - 58 - 58 - - 9 9 - - (11) (11)
688 (216) 7,256 7,728 609 (100) 6,889 7,398
(903) - 903 - (881) - 881 -
(8,870) (216) 8,159 (927) (8,538) (100) 7,770 (868) 2,909 133 49 3,091 2,803 124 46 2,973 (417) (17) (7) (441) 859 36 10 905
(6,378) (100) 8,201 1,723 (4,876) 60 7,826 3,010
10,665 - - 10,665 10,157 - - 10,157 - - (8,163) (8,163) - - (7,836) (7,836)
(663) - - (663) (620) - - (620)
10,002 - (8,163) 1,839 9,537 - (7,836) 1,701
51,056 1,929 766 53,751 47,432 2,029 728 50,189
(765) 34 14 (717) (711) 31 12 (668) 51,821 1,895 752 54,468 48,143 1,998 716 50,857
51,056 1,929 766 53,751 47,432 2,029 728 50,189
In millions of euro Note
IFRS 17.99(b) Opening assetsIFRS 17.99(b) Opening liabilities
IFRS 17.99(b) Net opening balance
IFRS 17.98 Changes in the statement of profit or loss and OCIIFRS 17.103(a) Insurance revenueIFRS 17.114(a) Contracts under the modified retrospective approach 44(E)(ix)
IFRS 17.114(c) Other contracts
9
IFRS 17.103(b) Insurance service expensesIFRS 17.103(b)(i) Incurred claims and other insurance service expensesIFRS 17.103(b)(ii) Amortisation of insurance acquisition cash flowsIFRS 17.103(b)(iv) Losses and reversal of losses on onerous contractsIFRS 17.103(b)(iii) Adjustments to liabilities for incurred claims
IFRS 17.103(c) Investment components
Insurance service result
IFRS 17.105(c) Net finance expenses from insurance contracts 10
IFRS 17.105(d) Effect of movements in exchange rates
Total changes in the statement of profit or loss and OCI
IFRS 17.98, 105(a) Cash flowsIFRS 17.105(a)(i) Premiums receivedIFRS 17.105(a)(iii) Claims and other insurance service expenses paid, including investment componentsIFRS 17.105(a)(ii) Insurance acquisition cash flows
Total cash flows
IFRS 17.99(b) Net closing balance
IFRS 17.99(b) Closing assetsIFRS 17.99(b) Closing liabilities
Net closing balance
Intr
oduc
tion
Aud
itor
s’ r
epor
tPr
imar
y st
atem
ents
NO
TE
SFu
rthe
r re
sour
ces
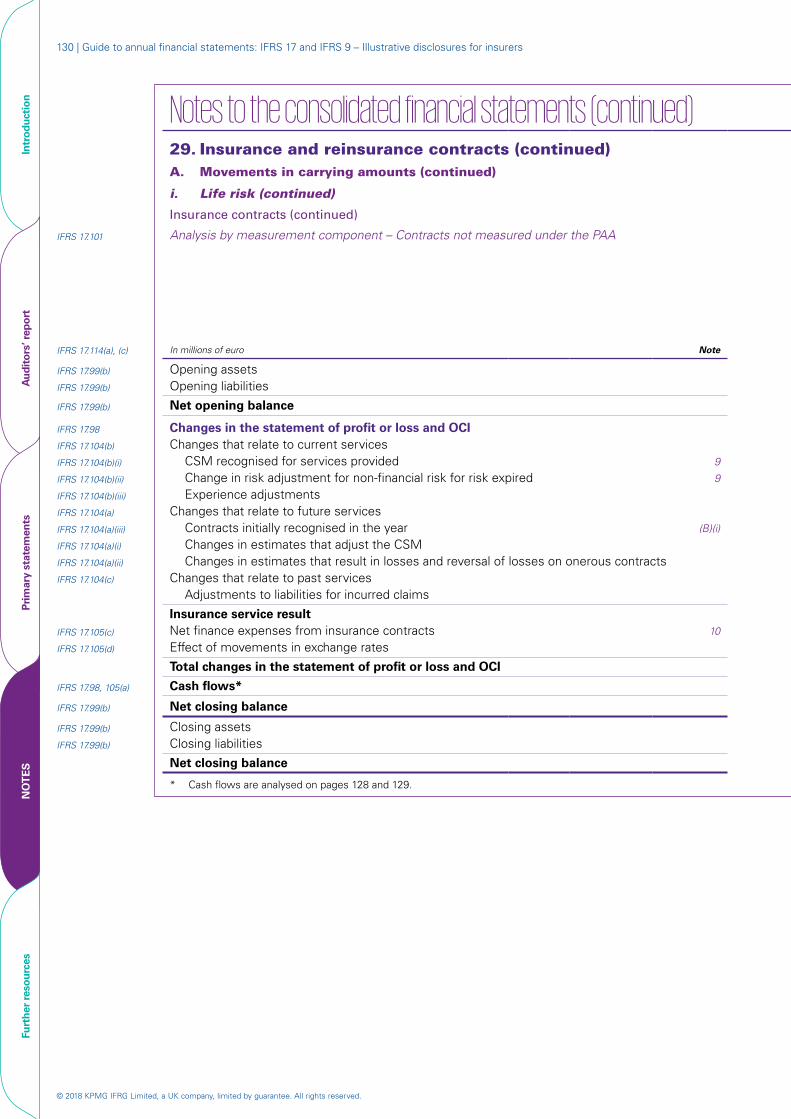
© 2018 KPMG IFRG Limited, a UK company, limited by guarantee. All rights reserved.
130 | Guide to annual financial statements: IFRS 17 and IFRS 9 – Illustrative disclosures for insurers
Notes to the consolidated financial statements (continued) 29. Insurance and reinsurance contracts (continued)A. Movements in carrying amounts (continued)
i. Life risk (continued)
Insurance contracts (continued)
IFRS 17.101 Analysis by measurement component – Contracts not measured under the PAA2021 2020
Estimates of present value
of future cash flows
Risk adjustment
for non-financial risk
CSM (see (C))
Total
Estimates of present value
of future cash flows
Risk adjustment
for non-financial risk
CSM (see (C))
TotalIFRS 17.114(a), (c) In millions of euro Note
Contracts under
modified retrospective
approachOther
contracts
Contracts under
modified retrospective
approachOther
contracts
IFRS 17.99(b) Opening assets (794) 21 69 36 (668) (834) 20 125 67 (622)IFRS 17.99(b) Opening liabilities 43,357 1,190 3,979 2,331 50,857 38,692 1,160 4,125 2,123 46,100
IFRS 17.99(b) Net opening balance 42,563 1,211 4,048 2,367 50,189 37,858 1,180 4,250 2,190 45,478
IFRS 17.98 Changes in the statement of profit or loss and OCIIFRS 17.104(b) Changes that relate to current servicesIFRS 17.104(b)(i) CSM recognised for services provided 9 - - (402) (260) (662) - - (441) (209) (650)IFRS 17.104(b)(ii) Change in risk adjustment for non-financial risk for risk expired 9 - (250) - - (250) - (245) - - (245)IFRS 17.104(b)(iii) Experience adjustments 24 - - - 24 (20) - - - (20)IFRS 17.104(a) Changes that relate to future servicesIFRS 17.104(a)(iii) Contracts initially recognised in the year (B)(i) (504) 235 - 300 31 (504) 231 - 292 19 IFRS 17.104(a)(i) Changes in estimates that adjust the CSM (275) (10) 56 229 - 211 17 (131) (97) - IFRS 17.104(a)(ii) Changes in estimates that result in losses and reversal of losses on onerous contracts (65) (14) - - (79) 32 7 - - 39 IFRS 17.104(c) Changes that relate to past services
Adjustments to liabilities for incurred claims 12 (3) - - 9 (9) (2) - - (11)
Insurance service result (808) (42) (346) 269 (927) (290) 8 (572) (14) (868)IFRS 17.105(c) Net finance expenses from insurance contracts 10 2,686 - 255 150 3,091 2,541 - 285 147 2,973 IFRS 17.105(d) Effect of movements in exchange rates (374) (11) (36) (20) (441) 753 23 85 44 905
Total changes in the statement of profit or loss and OCI 1,504 (53) (127) 399 1,723 3,004 31 (202) 177 3,010
IFRS 17.98, 105(a) Cash flows* 1,839 - - - 1,839 1,701 - - - 1,701
IFRS 17.99(b) Net closing balance 45,906 1,158 3,921 2,766 53,751 42,563 1,211 4,048 2,367 50,189
IFRS 17.99(b) Closing assets (853) 20 71 45 (717) (794) 21 69 36 (668)IFRS 17.99(b) Closing liabilities 46,759 1,138 3,850 2,721 54,468 43,357 1,190 3,979 2,331 50,857
Net closing balance 45,906 1,158 3,921 2,766 53,751 42,563 1,211 4,048 2,367 50,189
* Cash flows are analysed on pages 128 and 129.
Intr
oduc
tion
Aud
itor
s’ r
epor
tPr
imar
y st
atem
ents
NO
TE
SFu
rthe
r re
sour
ces
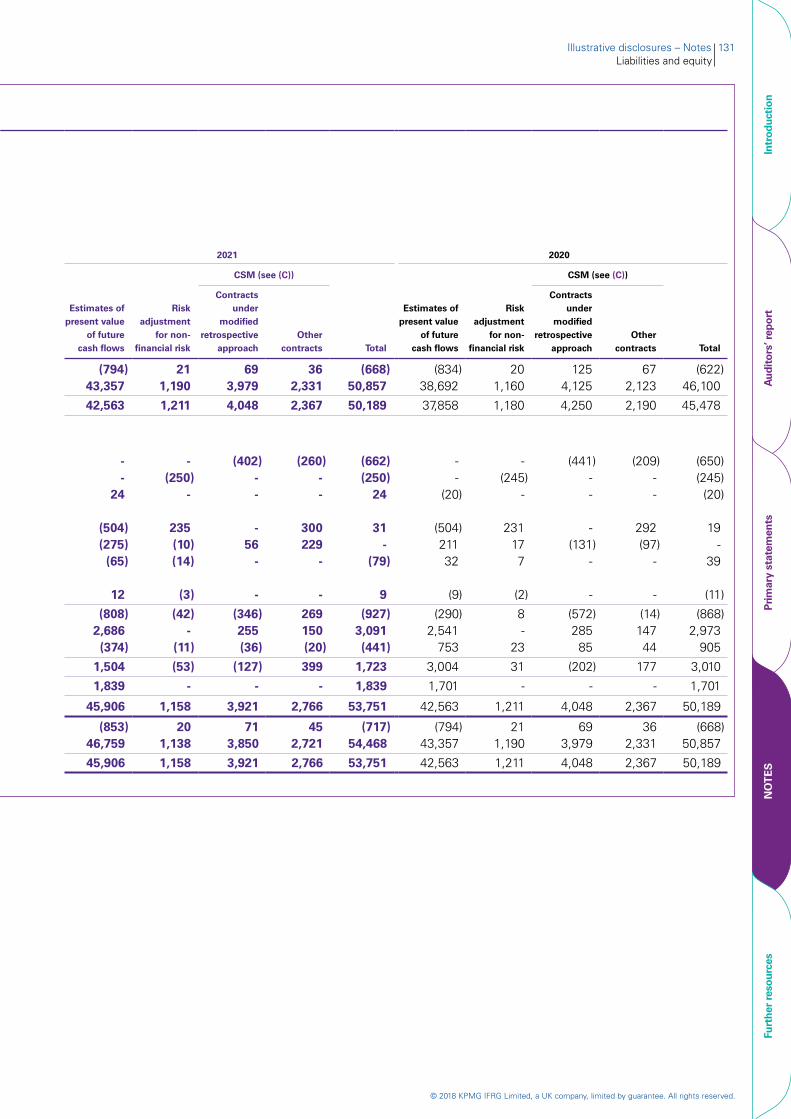
© 2018 KPMG IFRG Limited, a UK company, limited by guarantee. All rights reserved.
Illustrative disclosures – Notes 131Liabilities and equity
Notes to the consolidated financial statements (continued) 29. Insurance and reinsurance contracts (continued)A. Movements in carrying amounts (continued)
i. Life risk (continued)
Insurance contracts (continued)
IFRS 17.101 Analysis by measurement component – Contracts not measured under the PAA2021 2020
Estimates of present value
of future cash flows
Risk adjustment
for non-financial risk
CSM (see (C))
Total
Estimates of present value
of future cash flows
Risk adjustment
for non-financial risk
CSM (see (C))
Total
Contracts under
modified retrospective
approachOther
contracts
Contracts under
modified retrospective
approachOther
contracts
(794) 21 69 36 (668) (834) 20 125 67 (622) 43,357 1,190 3,979 2,331 50,857 38,692 1,160 4,125 2,123 46,100
42,563 1,211 4,048 2,367 50,189 37,858 1,180 4,250 2,190 45,478
- - (402) (260) (662) - - (441) (209) (650) - (250) - - (250) - (245) - - (245)
24 - - - 24 (20) - - - (20)
(504) 235 - 300 31 (504) 231 - 292 19 (275) (10) 56 229 - 211 17 (131) (97) -
(65) (14) - - (79) 32 7 - - 39
12 (3) - - 9 (9) (2) - - (11)
(808) (42) (346) 269 (927) (290) 8 (572) (14) (868) 2,686 - 255 150 3,091 2,541 - 285 147 2,973 (374) (11) (36) (20) (441) 753 23 85 44 905
1,504 (53) (127) 399 1,723 3,004 31 (202) 177 3,010
1,839 - - - 1,839 1,701 - - - 1,701
45,906 1,158 3,921 2,766 53,751 42,563 1,211 4,048 2,367 50,189
(853) 20 71 45 (717) (794) 21 69 36 (668) 46,759 1,138 3,850 2,721 54,468 43,357 1,190 3,979 2,331 50,857
45,906 1,158 3,921 2,766 53,751 42,563 1,211 4,048 2,367 50,189
IFRS 17.114(a), (c) In millions of euro Note
IFRS 17.99(b) Opening assetsIFRS 17.99(b) Opening liabilities
IFRS 17.99(b) Net opening balance
IFRS 17.98 Changes in the statement of profit or loss and OCIIFRS 17.104(b) Changes that relate to current servicesIFRS 17.104(b)(i) CSM recognised for services provided 9
IFRS 17.104(b)(ii) Change in risk adjustment for non-financial risk for risk expired 9
IFRS 17.104(b)(iii) Experience adjustmentsIFRS 17.104(a) Changes that relate to future servicesIFRS 17.104(a)(iii) Contracts initially recognised in the year (B)(i)
IFRS 17.104(a)(i) Changes in estimates that adjust the CSMIFRS 17.104(a)(ii) Changes in estimates that result in losses and reversal of losses on onerous contractsIFRS 17.104(c) Changes that relate to past services
Adjustments to liabilities for incurred claims
Insurance service resultIFRS 17.105(c) Net finance expenses from insurance contracts 10
IFRS 17.105(d) Effect of movements in exchange rates
Total changes in the statement of profit or loss and OCI
IFRS 17.98, 105(a) Cash flows*
IFRS 17.99(b) Net closing balance
IFRS 17.99(b) Closing assetsIFRS 17.99(b) Closing liabilities
Net closing balance
* Cash flows are analysed on pages 128 and 129.
Intr
oduc
tion
Aud
itor
s’ r
epor
tPr
imar
y st
atem
ents
NO
TE
SFu
rthe
r re
sour
ces
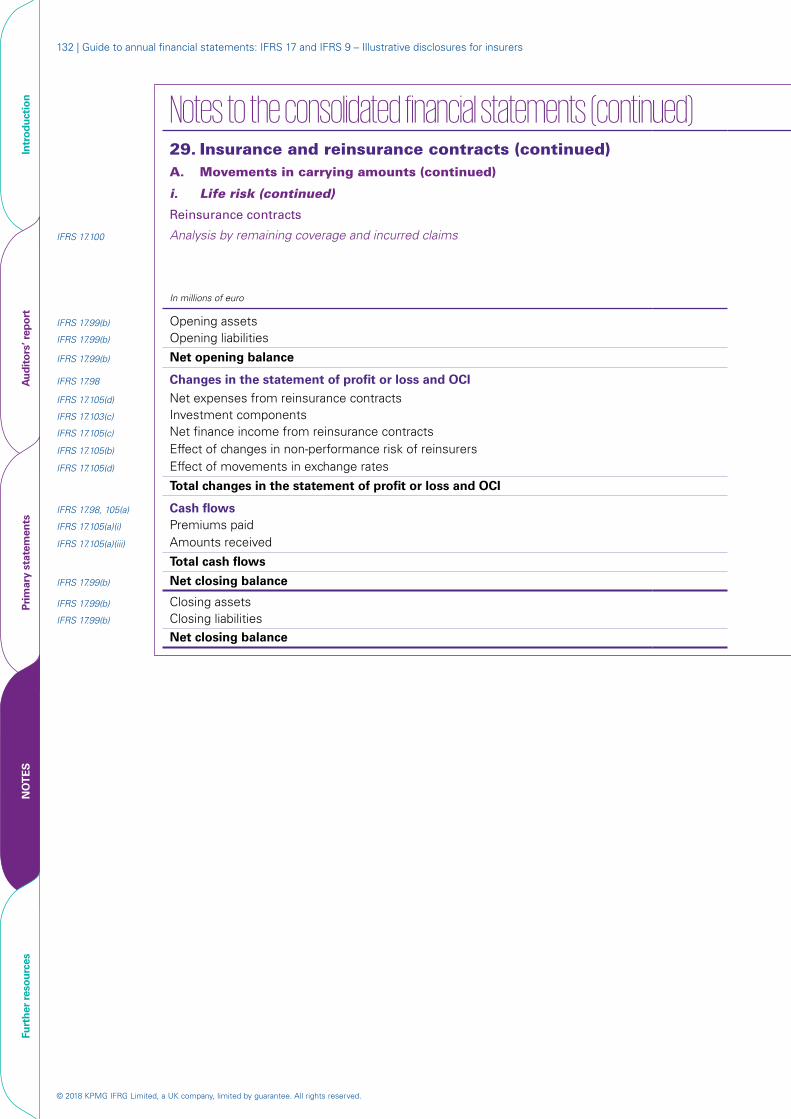
© 2018 KPMG IFRG Limited, a UK company, limited by guarantee. All rights reserved.
132 | Guide to annual financial statements: IFRS 17 and IFRS 9 – Illustrative disclosures for insurers
Notes to the consolidated financial statements (continued)29. Insurance and reinsurance contracts (continued)A. Movements in carrying amounts (continued)
i. Life risk (continued)
Reinsurance contracts
IFRS 17.100 Analysis by remaining coverage and incurred claims2021 2020
In millions of euro Note
Remaining coverage
componentIncurred claims
component Total
Remaining coverage
componentIncurred claims
component Total
IFRS 17.99(b) Opening assets 1,116 15 1,131 1,052 17 1,069IFRS 17.99(b) Opening liabilities (840) 6 (834) (832) 9 (823)
IFRS 17.99(b) Net opening balance 276 21 297 220 26 246
IFRS 17.98 Changes in the statement of profit or loss and OCI
IFRS 17.105(d) Net expenses from reinsurance contracts (309) 296 (13) (268) 254 (14)IFRS 17.103(c) Investment components (25) 25 - (18) 18 - IFRS 17.105(c) Net finance income from reinsurance contracts 10 13 1 14 11 1 12IFRS 17.105(b) Effect of changes in non-performance risk of reinsurers 10 5 1 6 (1) (1) (2)IFRS 17.105(d) Effect of movements in exchange rates (9) (3) (12) 10 7 17
Total changes in the statement of profit or loss and OCI (325) 320 (5) (266) 279 13
IFRS 17.98, 105(a) Cash flows IFRS 17.105(a)(i) Premiums paid 302 - 302 322 - 322IFRS 17.105(a)(iii) Amounts received - (281) (281) - (284) (284)
Total cash flows 302 (281) 21 322 (284) 38
IFRS 17.99(b) Net closing balance 253 60 313 276 21 297
IFRS 17.99(b) Closing assets 1,150 47 1,197 1,116 15 1,131IFRS 17.99(b) Closing liabilities (897) 13 (884) (840) 6 (834)
Net closing balance 253 60 313 276 21 297
Intr
oduc
tion
Aud
itor
s’ r
epor
tPr
imar
y st
atem
ents
NO
TE
SFu
rthe
r re
sour
ces
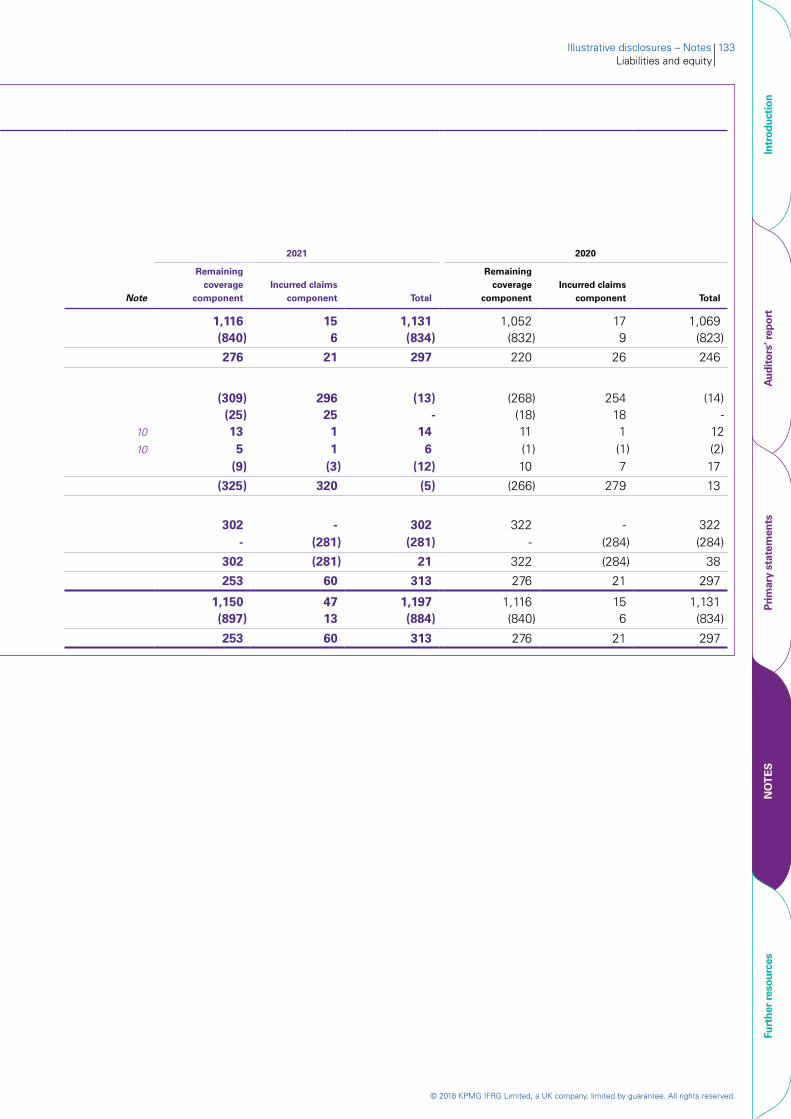
© 2018 KPMG IFRG Limited, a UK company, limited by guarantee. All rights reserved.
Illustrative disclosures – Notes 133Liabilities and equity
Notes to the consolidated financial statements (continued)29. Insurance and reinsurance contracts (continued)A. Movements in carrying amounts (continued)
i. Life risk (continued)
Reinsurance contracts
IFRS 17.100 Analysis by remaining coverage and incurred claims2021 2020
Note
Remaining coverage
componentIncurred claims
component Total
Remaining coverage
componentIncurred claims
component Total
1,116 15 1,131 1,052 17 1,069(840) 6 (834) (832) 9 (823)
276 21 297 220 26 246
(309) 296 (13) (268) 254 (14) (25) 25 - (18) 18 -
10 13 1 14 11 1 1210 5 1 6 (1) (1) (2)
(9) (3) (12) 10 7 17
(325) 320 (5) (266) 279 13
302 - 302 322 - 322
- (281) (281) - (284) (284)
302 (281) 21 322 (284) 38
253 60 313 276 21 297
1,150 47 1,197 1,116 15 1,131(897) 13 (884) (840) 6 (834)
253 60 313 276 21 297
In millions of euro
IFRS 17.99(b) Opening assetsIFRS 17.99(b) Opening liabilities
IFRS 17.99(b) Net opening balance
IFRS 17.98 Changes in the statement of profit or loss and OCI
IFRS 17.105(d) Net expenses from reinsurance contractsIFRS 17.103(c) Investment componentsIFRS 17.105(c) Net finance income from reinsurance contractsIFRS 17.105(b) Effect of changes in non-performance risk of reinsurersIFRS 17.105(d) Effect of movements in exchange rates
Total changes in the statement of profit or loss and OCI
IFRS 17.98, 105(a) Cash flowsIFRS 17.105(a)(i) Premiums paidIFRS 17.105(a)(iii) Amounts received
Total cash flows
IFRS 17.99(b) Net closing balance
IFRS 17.99(b) Closing assetsIFRS 17.99(b) Closing liabilities
Net closing balance
Intr
oduc
tion
Aud
itor
s’ r
epor
tPr
imar
y st
atem
ents
NO
TE
SFu
rthe
r re
sour
ces
© 2018 KPMG IFRG Limited, a UK company, limited by guarantee. All rights reserved.
134 | Guide to annual financial statements: IFRS 17 and IFRS 9 – Illustrative disclosures for insurers
Notes to the consolidated financial statements (continued) 29. Insurance and reinsurance contracts (continued)A. Movements in carrying amounts (continued)
i. Life risk (continued)
Reinsurance contracts (continued)
IFRS 17.101 Analysis by measurement component – Contracts not measured under the PAA2021 2020
Estimates of present value
of future cash flows
Risk adjustment
for non-financial risk
CSM (see (C))
Total
Estimates of present value
of future cash flows
Risk adjustment
for non-financial risk
CSM (see (C))
TotalIFRS 17.114(a), (c) In millions of euro Note
Contracts under
modified retrospective
approachOther
contracts
Contracts under
modified retrospective
approachOther
contracts
IFRS 17.99(b) Opening assets 1,047 20 35 29 1,131 991 18 40 20 1,069
IFRS 17.99(b) Opening liabilities (873) 10 16 13 (834) (857) 8 17 9 (823)
IFRS 17.99(b) Net opening balance 174 30 51 42 297 134 26 57 29 246
IFRS 17.98 Changes in the statement of profit or loss and OCIIFRS 17.104(b) Changes that relate to current servicesIFRS 17.104(b)(i) CSM recognised for services received - - (5) (4) (9) - - (5) (2) (7)IFRS 17.104(b)(ii) Change in risk adjustment for non-financial risk for risk expired - (3) - - (3) - (2) - - (2)IFRS 17.104(b)(iii) Experience adjustments 7 - - - 7 (5) - - - (5)IFRS 17.104(a) Changes that relate to future servicesIFRS 17.104(a)(iii) Contracts initially recognised in the year (B)(i) (18) 3 - 15 - (17) 3 - 14 - IFRS 17.104(a)(i) Changes in estimates that adjust the CSM (6) (2) 5 3 - 5 2 (5) (2) - IFRS 17.104(a)(ii) Changes in estimates that relate to losses and reversal of losses on underlying onerous contracts (7) (2) - - (9) 3 2 - - 5 IFRS 17.104(c) Changes that relate to past services
Changes to incurred claims component 3 (2) - - 1 (3) (2) - - (5)
Net expenses from reinsurance contracts (21) (6) - 14 (13) (17) 3 (10) 10 (14)IFRS 17.105(c) Net finance income from reinsurance contracts 10 9 - 3 2 14 7 - 3 2 12IFRS 17.105(b) Effect of changes in non-performance risk of reinsurers 10 6 - - - 6 (2) - - - (2)IFRS 17.105(d) Effect of movements in exchange rates (9) (1) (1) (1) (12) 14 1 1 1 17
Total changes in the statement of profit or loss and OCI (15) (7) 2 15 (5) 2 4 (6) 13 13
IFRS 17.98, 105(a) Cash flows* 21 - - - 21 38 - - - 38
IFRS 17.99(b) Net closing balance 180 23 53 57 313 174 30 51 42 297
IFRS 17.99(b) Closing assets 1,104 16 37 40 1,197 1,047 20 35 29 1,131IFRS 17.99(b) Closing liabilities (924) 7 16 17 (884) (873) 10 16 13 (834)
Net closing balance 180 23 53 57 313 174 30 51 42 297
* Cash flows are analysed on pages 132 and 133.
Intr
oduc
tion
Aud
itor
s’ r
epor
tPr
imar
y st
atem
ents
NO
TE
SFu
rthe
r re
sour
ces
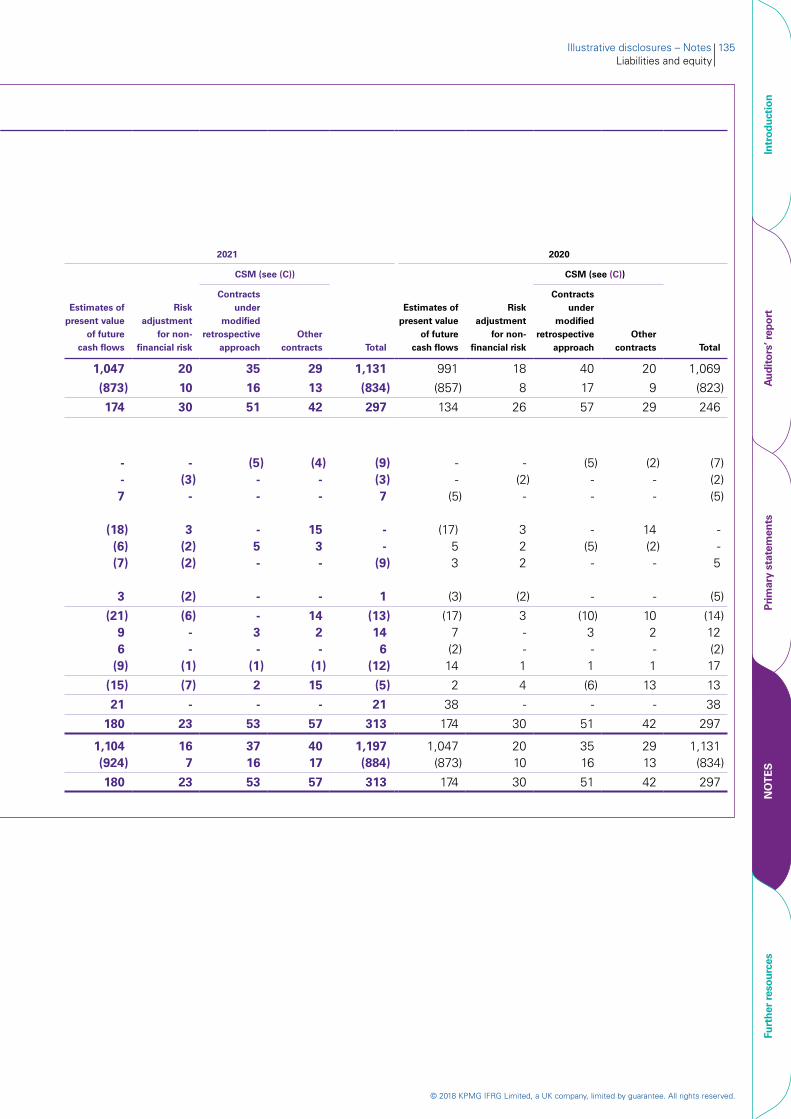
© 2018 KPMG IFRG Limited, a UK company, limited by guarantee. All rights reserved.
Illustrative disclosures – Notes 135Liabilities and equity
Notes to the consolidated financial statements (continued) 29. Insurance and reinsurance contracts (continued)A. Movements in carrying amounts (continued)
i. Life risk (continued)
Reinsurance contracts (continued)
IFRS 17.101 Analysis by measurement component – Contracts not measured under the PAA2021 2020
Estimates of present value
of future cash flows
Risk adjustment
for non-financial risk
CSM (see (C))
Total
Estimates of present value
of future cash flows
Risk adjustment
for non-financial risk
CSM (see (C))
Total
Contracts under
modified retrospective
approachOther
contracts
Contracts under
modified retrospective
approachOther
contracts
1,047 20 35 29 1,131 991 18 40 20 1,069
(873) 10 16 13 (834) (857) 8 17 9 (823)
174 30 51 42 297 134 26 57 29 246
- - (5) (4) (9) - - (5) (2) (7) - (3) - - (3) - (2) - - (2) 7 - - - 7 (5) - - - (5)
(18) 3 - 15 - (17) 3 - 14 - (6) (2) 5 3 - 5 2 (5) (2) - (7) (2) - - (9) 3 2 - - 5
3 (2) - - 1 (3) (2) - - (5)
(21) (6) - 14 (13) (17) 3 (10) 10 (14) 9 - 3 2 14 7 - 3 2 12 6 - - - 6 (2) - - - (2)
(9) (1) (1) (1) (12) 14 1 1 1 17
(15) (7) 2 15 (5) 2 4 (6) 13 13
21 - - - 21 38 - - - 38
180 23 53 57 313 174 30 51 42 297
1,104 16 37 40 1,197 1,047 20 35 29 1,131(924) 7 16 17 (884) (873) 10 16 13 (834)
180 23 53 57 313 174 30 51 42 297
IFRS 17.114(a), (c) In millions of euro Note
IFRS 17.99(b) Opening assetsIFRS 17.99(b) Opening liabilities
IFRS 17.99(b) Net opening balance
IFRS 17.98 Changes in the statement of profit or loss and OCIIFRS 17.104(b) Changes that relate to current servicesIFRS 17.104(b)(i) CSM recognised for services receivedIFRS 17.104(b)(ii) Change in risk adjustment for non-financial risk for risk expiredIFRS 17.104(b)(iii) Experience adjustmentsIFRS 17.104(a) Changes that relate to future servicesIFRS 17.104(a)(iii) Contracts initially recognised in the year (B)(i)
IFRS 17.104(a)(i) Changes in estimates that adjust the CSMIFRS 17.104(a)(ii) Changes in estimates that relate to losses and reversal of losses on underlying onerous contractsIFRS 17.104(c) Changes that relate to past services
Changes to incurred claims component
Net expenses from reinsurance contractsIFRS 17.105(c) Net finance income from reinsurance contracts 10
IFRS 17.105(b) Effect of changes in non-performance risk of reinsurers 10
IFRS 17.105(d) Effect of movements in exchange rates
Total changes in the statement of profit or loss and OCI
IFRS 17.98, 105(a) Cash flows*
IFRS 17.99(b) Net closing balance
IFRS 17.99(b) Closing assetsIFRS 17.99(b) Closing liabilities
Net closing balance
* Cash flows are analysed on pages 132 and 133.
Intr
oduc
tion
Aud
itor
s’ r
epor
tPr
imar
y st
atem
ents
NO
TE
SFu
rthe
r re
sour
ces
© 2018 KPMG IFRG Limited, a UK company, limited by guarantee. All rights reserved.
136 | Guide to annual financial statements: IFRS 17 and IFRS 9 – Illustrative disclosures for insurers
Notes to the consolidated financial statements (continued) 29. Insurance and reinsurance contracts (continued)A. Movements in carrying amounts (continued)
ii. Life savings
Insurance contracts
IFRS 17.100 Analysis by remaining coverage and incurred claims2021 2020
Liabilities for remaining coverage
Liabilities for incurred claims Total
Liabilities for remaining coverage
Liabilities for incurred claims TotalIn millions of euro Note
Excluding loss component
Loss component
Excluding loss component
Loss component
IFRS 17.99(b) Opening liabilities 67,699 2,571 334 70,604 63,590 2,424 338 66,352
Changes in the statement of profit or loss and OCI
IFRS 17.103(a) Insurance revenueIFRS 17.114(a) Contracts under the modified retrospective approach 44(E)(ix) (1,895) - - (1,895) (1,717) - - (1,717) IFRS 17.114(c) Other contracts (596) - - (596) (424) - - (424)
9 (2,491) - - (2,491) (2,141) - - (2,141)
IFRS 17.103(b) Insurance service expensesIFRS 17.103(b)(i) Incurred claims and other insurance service expenses - (40) 371 331 - (75) 323 248 IFRS 17.103(b)(ii) Amortisation of insurance acquisition cash flows 696 - - 696 633 - - 633 IFRS 17.103(b)(iv) Losses and reversal of losses on onerous contracts - 8 - 8 - 44 - 44 IFRS 17.103(b)(iii) Adjustments to liabilities for incurred claims - - (8) (8) - - 12 12
696 (32) 363 1,027 633 (31) 335 937
IFRS 17.103(c) Investment components (7,374) - 7,374 - (6,230) - 6,230 -
Insurance service result (9,169) (32) 7,737 (1,464) (7,738) (31) 6,565 (1,204)IFRS 17.105(c) Net finance expenses from insurance contracts 10 4,221 166 24 4,411 3,893 159 21 4,073 IFRS 17.105(d) Effect of movements in exchange rates (267) (11) (12) (290) 377 19 4 400
Total changes in the statement of profit or loss and OCI (5,215) 123 7,749 2,657 (3,468) 147 6,590 3,269
IFRS 17.98, 105(a) Cash flowsIFRS 17.105(a)(i) Premiums received 10,073 - - 10,073 8,181 - - 8,181 IFRS 17.105(a)(iii) Claims and other insurance service expenses paid, including investment components - - (7,737) (7,737) - - (6,594) (6,594)IFRS 17.105(a)(ii) Insurance acquisition cash flows (686) - - (686) (604) - - (604)
Total cash flows 9,387 - (7,737) 1,650 7,577 - (6,594) 983
IFRS 17.99(b) Closing liabilities 71,871 2,694 346 74,911 67,699 2,571 334 70,604
Intr
oduc
tion
Aud
itor
s’ r
epor
tPr
imar
y st
atem
ents
NO
TE
SFu
rthe
r re
sour
ces
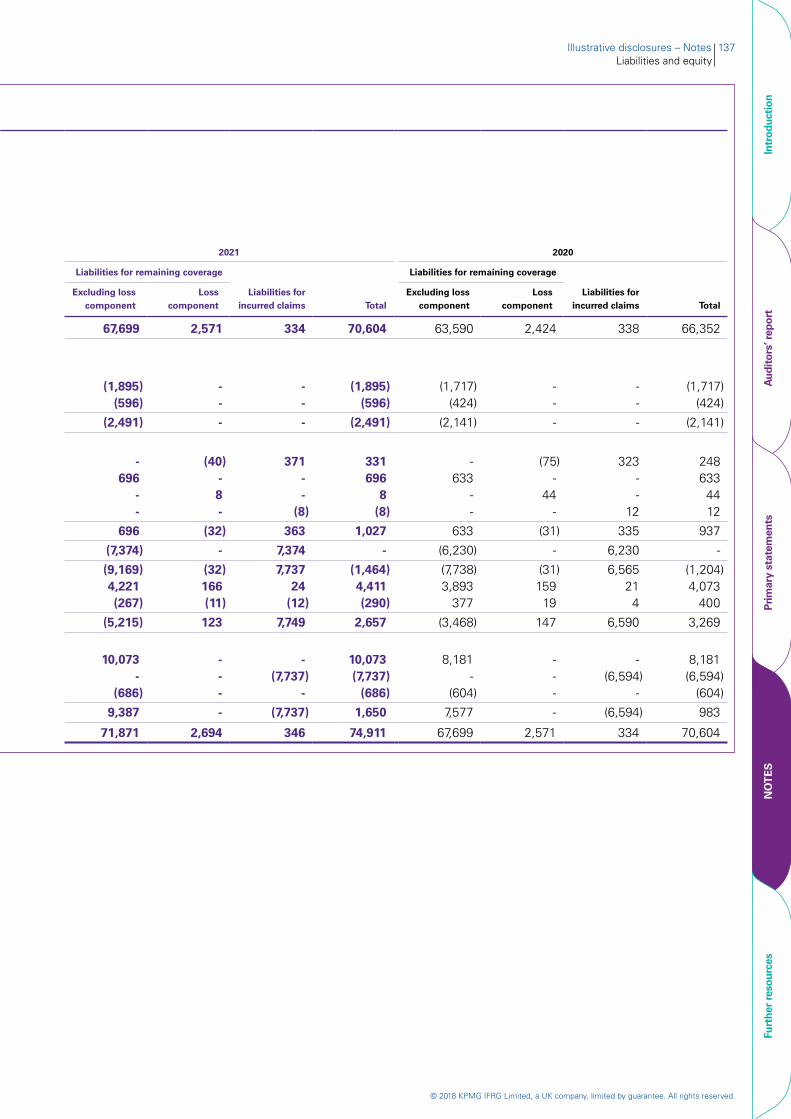
© 2018 KPMG IFRG Limited, a UK company, limited by guarantee. All rights reserved.
Illustrative disclosures – Notes 137Liabilities and equity
Notes to the consolidated financial statements (continued) 29. Insurance and reinsurance contracts (continued)A. Movements in carrying amounts (continued)
ii. Life savings
Insurance contracts
IFRS 17.100 Analysis by remaining coverage and incurred claims2021 2020
Liabilities for remaining coverage
Liabilities for incurred claims Total
Liabilities for remaining coverage
Liabilities for incurred claims Total
Excluding loss component
Loss component
Excluding loss component
Loss component
67,699 2,571 334 70,604 63,590 2,424 338 66,352
(1,895) - - (1,895) (1,717) - - (1,717) (596) - - (596) (424) - - (424)
(2,491) - - (2,491) (2,141) - - (2,141)
- (40) 371 331 - (75) 323 248 696 - - 696 633 - - 633
- 8 - 8 - 44 - 44 - - (8) (8) - - 12 12
696 (32) 363 1,027 633 (31) 335 937
(7,374) - 7,374 - (6,230) - 6,230 -
(9,169) (32) 7,737 (1,464) (7,738) (31) 6,565 (1,204) 4,221 166 24 4,411 3,893 159 21 4,073 (267) (11) (12) (290) 377 19 4 400
(5,215) 123 7,749 2,657 (3,468) 147 6,590 3,269
10,073 - - 10,073 8,181 - - 8,181 - - (7,737) (7,737) - - (6,594) (6,594)
(686) - - (686) (604) - - (604)
9,387 - (7,737) 1,650 7,577 - (6,594) 983
71,871 2,694 346 74,911 67,699 2,571 334 70,604
In millions of euro Note
IFRS 17.99(b) Opening liabilities
Changes in the statement of profit or loss and OCI
IFRS 17.103(a) Insurance revenueIFRS 17.114(a) Contracts under the modified retrospective approach 44(E)(ix)
IFRS 17.114(c) Other contracts
9
IFRS 17.103(b) Insurance service expensesIFRS 17.103(b)(i) Incurred claims and other insurance service expensesIFRS 17.103(b)(ii) Amortisation of insurance acquisition cash flowsIFRS 17.103(b)(iv) Losses and reversal of losses on onerous contractsIFRS 17.103(b)(iii) Adjustments to liabilities for incurred claims
IFRS 17.103(c) Investment components
Insurance service resultIFRS 17.105(c) Net finance expenses from insurance contracts 10
IFRS 17.105(d) Effect of movements in exchange rates
Total changes in the statement of profit or loss and OCI
IFRS 17.98, 105(a) Cash flowsIFRS 17.105(a)(i) Premiums receivedIFRS 17.105(a)(iii) Claims and other insurance service expenses paid, including investment componentsIFRS 17.105(a)(ii) Insurance acquisition cash flows
Total cash flows
IFRS 17.99(b) Closing liabilities
Intr
oduc
tion
Aud
itor
s’ r
epor
tPr
imar
y st
atem
ents
NO
TE
SFu
rthe
r re
sour
ces
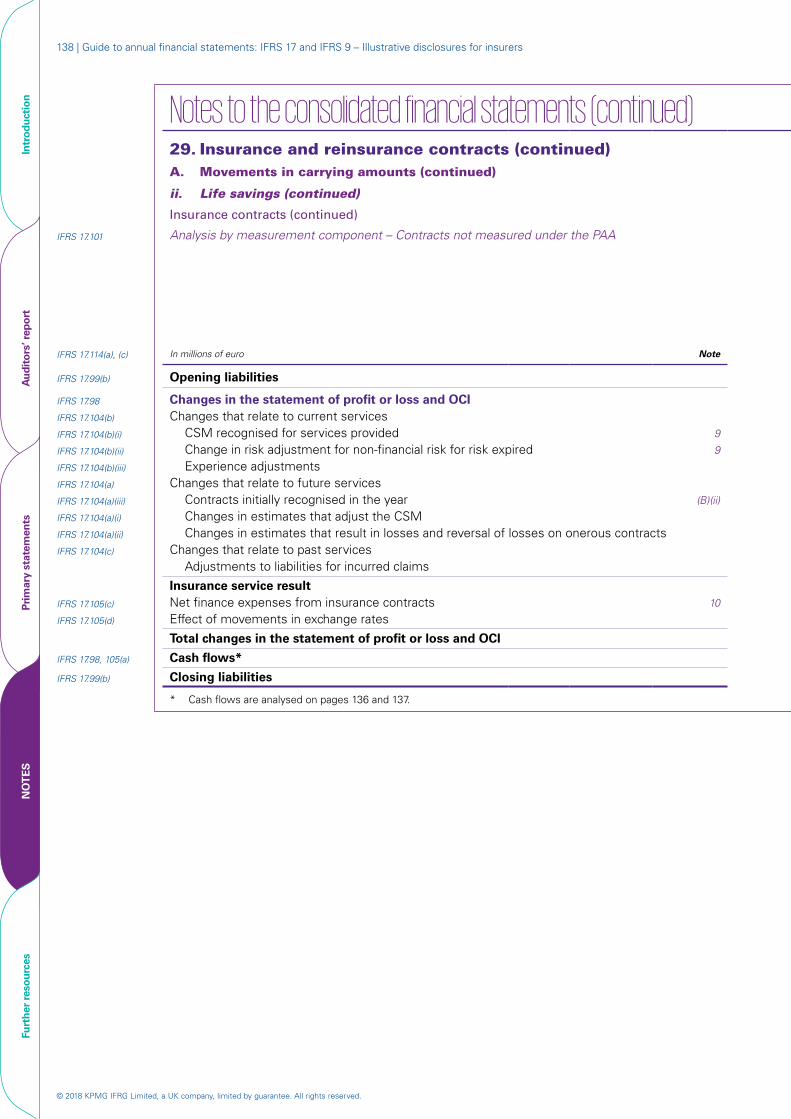
© 2018 KPMG IFRG Limited, a UK company, limited by guarantee. All rights reserved.
138 | Guide to annual financial statements: IFRS 17 and IFRS 9 – Illustrative disclosures for insurers
Notes to the consolidated financial statements (continued) 29. Insurance and reinsurance contracts (continued)A. Movements in carrying amounts (continued)
ii. Life savings (continued)
Insurance contracts (continued)
IFRS 17.101 Analysis by measurement component – Contracts not measured under the PAA
2021 2020
Estimates of present value
of future cash flows
Risk adjustment
for non-financial risk
CSM (see (C))
Total
Estimates of present value
of future cash flows
Risk adjustment
for non-financial risk
CSM (see (C))
TotalIFRS 17.114(a), (c) In millions of euro Note
Contracts under
modified retrospective
approachOther
contracts
Contracts under
modified retrospective
approachOther
contracts
IFRS 17.99(b) Opening liabilities 58,795 132 8,730 2,947 70,604 54,692 122 9,250 2,288 66,352
IFRS 17.98 Changes in the statement of profit or loss and OCIIFRS 17.104(b) Changes that relate to current servicesIFRS 17.104(b)(i) CSM recognised for services provided 9 - - (1,093) (344) (1,437) - - (1,013) (250) (1,263)IFRS 17.104(b)(ii) Change in risk adjustment for non-financial risk for risk expired 9 - (12) - - (12) - (9) - - (9)IFRS 17.104(b)(iii) Experience adjustments (15) - - - (15) 12 - - - 12 IFRS 17.104(a) Changes that relate to future servicesIFRS 17.104(a)(iii) Contracts initially recognised in the year (B)(ii) (793) 13 - 797 17 (789) 14 - 790 15 IFRS 17.104(a)(i) Changes in estimates that adjust the CSM (156) (6) 12 150 - 161 6 (132) (35) - IFRS 17.104(a)(ii) Changes in estimates that result in losses and reversal of losses on onerous contracts (8) (1) - - (9) 28 1 - - 29 IFRS 17.104(c) Changes that relate to past services
Adjustments to liabilities for incurred claims (7) (1) - - (8) 15 (3) - - 12
Insurance service result (979) (7) (1,081) 603 (1,464) (573) 9 (1,145) 505 (1,204)IFRS 17.105(c) Net finance expenses from insurance contracts 10 3,680 - 546 185 4,411 3,363 - 569 141 4,073 IFRS 17.105(d) Effect of movements in exchange rates (241) (1) (36) (12) (290) 330 1 56 13 400
Total changes in the statement of profit or loss and OCI 2,460 (8) (571) 776 2,657 3,120 10 (520) 659 3,269
IFRS 17.98, 105(a) Cash flows* 1,650 - - - 1,650 983 - - - 983
IFRS 17.99(b) Closing liabilities 62,905 124 8,159 3,723 74,911 58,795 132 8,730 2,947 70,604
* Cash flows are analysed on pages 136 and 137.
Intr
oduc
tion
Aud
itor
s’ r
epor
tPr
imar
y st
atem
ents
NO
TE
SFu
rthe
r re
sour
ces

© 2018 KPMG IFRG Limited, a UK company, limited by guarantee. All rights reserved.
Illustrative disclosures – Notes 139Liabilities and equity
Notes to the consolidated financial statements (continued) 29. Insurance and reinsurance contracts (continued)A. Movements in carrying amounts (continued)
ii. Life savings (continued)
Insurance contracts (continued)
IFRS 17.101 Analysis by measurement component – Contracts not measured under the PAA
2021 2020
Estimates of present value
of future cash flows
Risk adjustment
for non-financial risk
CSM (see (C))
Total
Estimates of present value
of future cash flows
Risk adjustment
for non-financial risk
CSM (see (C))
Total
Contracts under
modified retrospective
approachOther
contracts
Contracts under
modified retrospective
approachOther
contracts
58,795 132 8,730 2,947 70,604 54,692 122 9,250 2,288 66,352
- - (1,093) (344) (1,437) - - (1,013) (250) (1,263) - (12) - - (12) - (9) - - (9)
(15) - - - (15) 12 - - - 12
(793) 13 - 797 17 (789) 14 - 790 15 (156) (6) 12 150 - 161 6 (132) (35) -
(8) (1) - - (9) 28 1 - - 29
(7) (1) - - (8) 15 (3) - - 12
(979) (7) (1,081) 603 (1,464) (573) 9 (1,145) 505 (1,204) 3,680 - 546 185 4,411 3,363 - 569 141 4,073 (241) (1) (36) (12) (290) 330 1 56 13 400
2,460 (8) (571) 776 2,657 3,120 10 (520) 659 3,269
1,650 - - - 1,650 983 - - - 983
62,905 124 8,159 3,723 74,911 58,795 132 8,730 2,947 70,604
IFRS 17.114(a), (c) In millions of euro Note
IFRS 17.99(b) Opening liabilities
IFRS 17.98 Changes in the statement of profit or loss and OCIIFRS 17.104(b) Changes that relate to current servicesIFRS 17.104(b)(i) CSM recognised for services provided 9
IFRS 17.104(b)(ii) Change in risk adjustment for non-financial risk for risk expired 9
IFRS 17.104(b)(iii) Experience adjustmentsIFRS 17.104(a) Changes that relate to future servicesIFRS 17.104(a)(iii) Contracts initially recognised in the year (B)(ii)
IFRS 17.104(a)(i) Changes in estimates that adjust the CSMIFRS 17.104(a)(ii) Changes in estimates that result in losses and reversal of losses on onerous contractsIFRS 17.104(c) Changes that relate to past services
Adjustments to liabilities for incurred claims
Insurance service resultIFRS 17.105(c) Net finance expenses from insurance contracts 10
IFRS 17.105(d) Effect of movements in exchange rates
Total changes in the statement of profit or loss and OCI
IFRS 17.98, 105(a) Cash flows*
IFRS 17.99(b) Closing liabilities
* Cash flows are analysed on pages 136 and 137.
Intr
oduc
tion
Aud
itor
s’ r
epor
tPr
imar
y st
atem
ents
NO
TE
SFu
rthe
r re
sour
ces
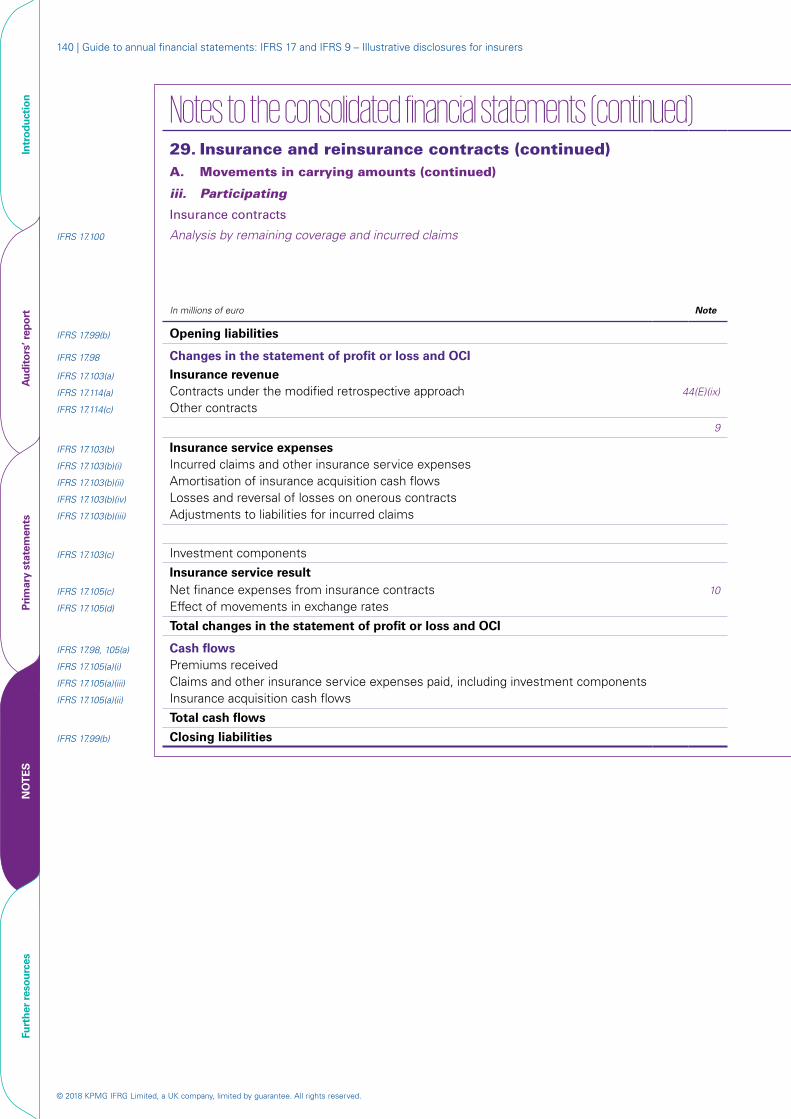
© 2018 KPMG IFRG Limited, a UK company, limited by guarantee. All rights reserved.
140 | Guide to annual financial statements: IFRS 17 and IFRS 9 – Illustrative disclosures for insurers
Notes to the consolidated financial statements (continued) 29. Insurance and reinsurance contracts (continued)A. Movements in carrying amounts (continued)
iii. Participating
Insurance contracts
IFRS 17.100 Analysis by remaining coverage and incurred claims2021 2020
Liabilities for remaining coverage
Liabilities for incurred claims Total
Liabilities for remaining coverage
Liabilities for incurred claims TotalIn millions of euro Note
Excluding loss component
Loss component
Excluding loss component
Loss component
IFRS 17.99(b) Opening liabilities 184,108 1,849 1,366 187,323 171,820 1,626 1,138 174,584
IFRS 17.98 Changes in the statement of profit or loss and OCI
IFRS 17.103(a) Insurance revenueIFRS 17.114(a) Contracts under the modified retrospective approach 44(E)(ix) (5,576) - - (5,576) (5,190) - - (5,190)IFRS 17.114(c) Other contracts (1,651) - - (1,651) (1,288) - - (1,288)
9 (7,227) - - (7,227) (6,478) - - (6,478)
IFRS 17.103(b) Insurance service expensesIFRS 17.103(b)(i) Incurred claims and other insurance service expenses - (58) 676 618 - (44) 659 615 IFRS 17.103(b)(ii) Amortisation of insurance acquisition cash flows 1,809 - - 1,809 1,718 - - 1,718 IFRS 17.103(b)(iv) Losses and reversal of losses on onerous contracts - 52 - 52 - 55 - 55 IFRS 17.103(b)(iii) Adjustments to liabilities for incurred claims - - 2 2 - - (3) (3)
1,809 (6) 678 2,481 1,718 11 656 2,385
IFRS 17.103(c) Investment components (12,448) - 12,448 - (12,210) - 12,210 -
Insurance service result (17,866) (6) 13,126 (4,746) (16,970) 11 12,866 (4,093)IFRS 17.105(c) Net finance expenses from insurance contracts 10 14,744 159 - 14,903 11,852 190 - 12,042 IFRS 17.105(d) Effect of movements in exchange rates (1,762) (16) (11) (1,789) 2,566 22 15 2,603
Total changes in the statement of profit or loss and OCI (4,884) 137 13,115 8,368 (2,552) 223 12,881 10,552
IFRS 17.98, 105(a) Cash flowsIFRS 17.105(a)(i) Premiums received 17,683 - - 17,683 16,550 - - 16,550 IFRS 17.105(a)(iii) Claims and other insurance service expenses paid, including investment components - - (12,940) (12,940) - - (12,653) (12,653)IFRS 17.105(a)(ii) Insurance acquisition cash flows (1,837) - - (1,837) (1,710) - - (1,710)
Total cash flows 15,846 - (12,940) 2,906 14,840 - (12,653) 2,187
IFRS 17.99(b) Closing liabilities 195,070 1,986 1,541 198,597 184,108 1,849 1,366 187,323
Intr
oduc
tion
Aud
itor
s’ r
epor
tPr
imar
y st
atem
ents
NO
TE
SFu
rthe
r re
sour
ces

© 2018 KPMG IFRG Limited, a UK company, limited by guarantee. All rights reserved.
Illustrative disclosures – Notes 141Liabilities and equity
Notes to the consolidated financial statements (continued) 29. Insurance and reinsurance contracts (continued)A. Movements in carrying amounts (continued)
iii. Participating
Insurance contracts
IFRS 17.100 Analysis by remaining coverage and incurred claims2021 2020
Liabilities for remaining coverage
Liabilities for incurred claims Total
Liabilities for remaining coverage
Liabilities for incurred claims Total
Excluding loss component
Loss component
Excluding loss component
Loss component
184,108 1,849 1,366 187,323 171,820 1,626 1,138 174,584
(5,576) - - (5,576) (5,190) - - (5,190)(1,651) - - (1,651) (1,288) - - (1,288)
(7,227) - - (7,227) (6,478) - - (6,478)
- (58) 676 618 - (44) 659 615 1,809 - - 1,809 1,718 - - 1,718
- 52 - 52 - 55 - 55 - - 2 2 - - (3) (3)
1,809 (6) 678 2,481 1,718 11 656 2,385
(12,448) - 12,448 - (12,210) - 12,210 -
(17,866) (6) 13,126 (4,746) (16,970) 11 12,866 (4,093) 14,744 159 - 14,903 11,852 190 - 12,042 (1,762) (16) (11) (1,789) 2,566 22 15 2,603
(4,884) 137 13,115 8,368 (2,552) 223 12,881 10,552
17,683 - - 17,683 16,550 - - 16,550 - - (12,940) (12,940) - - (12,653) (12,653)
(1,837) - - (1,837) (1,710) - - (1,710)
15,846 - (12,940) 2,906 14,840 - (12,653) 2,187
195,070 1,986 1,541 198,597 184,108 1,849 1,366 187,323
In millions of euro Note
IFRS 17.99(b) Opening liabilities
IFRS 17.98 Changes in the statement of profit or loss and OCI
IFRS 17.103(a) Insurance revenueIFRS 17.114(a) Contracts under the modified retrospective approach 44(E)(ix)
IFRS 17.114(c) Other contracts
9
IFRS 17.103(b) Insurance service expensesIFRS 17.103(b)(i) Incurred claims and other insurance service expensesIFRS 17.103(b)(ii) Amortisation of insurance acquisition cash flowsIFRS 17.103(b)(iv) Losses and reversal of losses on onerous contractsIFRS 17.103(b)(iii) Adjustments to liabilities for incurred claims
IFRS 17.103(c) Investment components
Insurance service resultIFRS 17.105(c) Net finance expenses from insurance contracts 10
IFRS 17.105(d) Effect of movements in exchange rates
Total changes in the statement of profit or loss and OCI
IFRS 17.98, 105(a) Cash flowsIFRS 17.105(a)(i) Premiums receivedIFRS 17.105(a)(iii) Claims and other insurance service expenses paid, including investment componentsIFRS 17.105(a)(ii) Insurance acquisition cash flows
Total cash flows
IFRS 17.99(b) Closing liabilities
Intr
oduc
tion
Aud
itor
s’ r
epor
tPr
imar
y st
atem
ents
NO
TE
SFu
rthe
r re
sour
ces

© 2018 KPMG IFRG Limited, a UK company, limited by guarantee. All rights reserved.
142 | Guide to annual financial statements: IFRS 17 and IFRS 9 – Illustrative disclosures for insurers
Notes to the consolidated financial statements (continued) 29. Insurance and reinsurance contracts (continued)A. Movements in carrying amounts (continued)
iii. Participating (continued)
Insurance contracts (continued)
IFRS 17.101 Analysis by measurement component – Contracts not measured under the PAA2021 2020
Estimates of present value
of future cash flows
Risk adjustment
for non-financial risk
CSM (see (C))
Total
Estimates of present value
of future cash flows
Risk adjustment
for non-financial risk
CSM (see (C))
TotalIFRS 17.114(a), (c) In millions of euro Note
Contracts under
modified retrospective
approachOther
contracts
Contracts under
modified retrospective
approachOther
contracts
IFRS 17.99(b) Opening liabilities 160,735 313 16,957 9,318 187,323 149,148 309 19,563 5,564 174,584
IFRS 17.98 Changes in the statement of profit or loss and OCIIFRS 17.104(b) Changes that relate to current servicesIFRS 17.104(b)(i) CSM recognised for services provided 9 - - (3,667) (1,086) (4,753) - - (3,333) (827) (4,160)IFRS 17.104(b)(ii) Change in risk adjustment for non-financial risk for risk expired 9 - (20) - - (20) - (18) - - (18)IFRS 17.104(b)(iii) Experience adjustments (27) - - - (27) 33 - - - 33 IFRS 17.104(a) Changes that relate to future servicesIFRS 17.104(a)(iii) Contracts initially recognised in the year (B)(iii) (2,976) 36 - 2,974 34 (2,634) 34 - 2,616 16 IFRS 17.104(a)(i) Changes in estimates that adjust the CSM (2,890) (23) 1,376 1,537 - (2,299) (19) 435 1,883 - IFRS 17.104(a)(ii) Changes in estimates that result in losses and reversal of losses on onerous contracts 16 2 - - 18 36 3 - - 39 IFRS 17.104(c) Changes that relate to past services
Adjustments to liabilities for incurred claims 3 (1) - - 2 (2) (1) - - (3)
Insurance service result (5,874) (6) (2,291) 3,425 (4,746) (4,866) (1) (2,898) 3,672 (4,093)IFRS 17.105(c) Net finance expenses from insurance contracts 10 14,903 - - - 14,903 12,042 - - - 12,042 IFRS 17.105(d) Effect of movements in exchange rates (1,535) (3) (162) (89) (1,789) 2,224 5 292 82 2,603
Total changes in the statement of profit or loss and OCI 7,494 (9) (2,453) 3,336 8,368 9,400 4 (2,606) 3,754 10,552
IFRS 17.98, 105(a) Cash flows* 2,906 - - - 2,906 2,187 - - - 2,187
IFRS 17.99(b) Closing liabilities 171,135 304 14,504 12,654 198,597 160,735 313 16,957 9,318 187,323
* Cash flows are analysed on pages 140 and 141.
Intr
oduc
tion
Aud
itor
s’ r
epor
tPr
imar
y st
atem
ents
NO
TE
SFu
rthe
r re
sour
ces
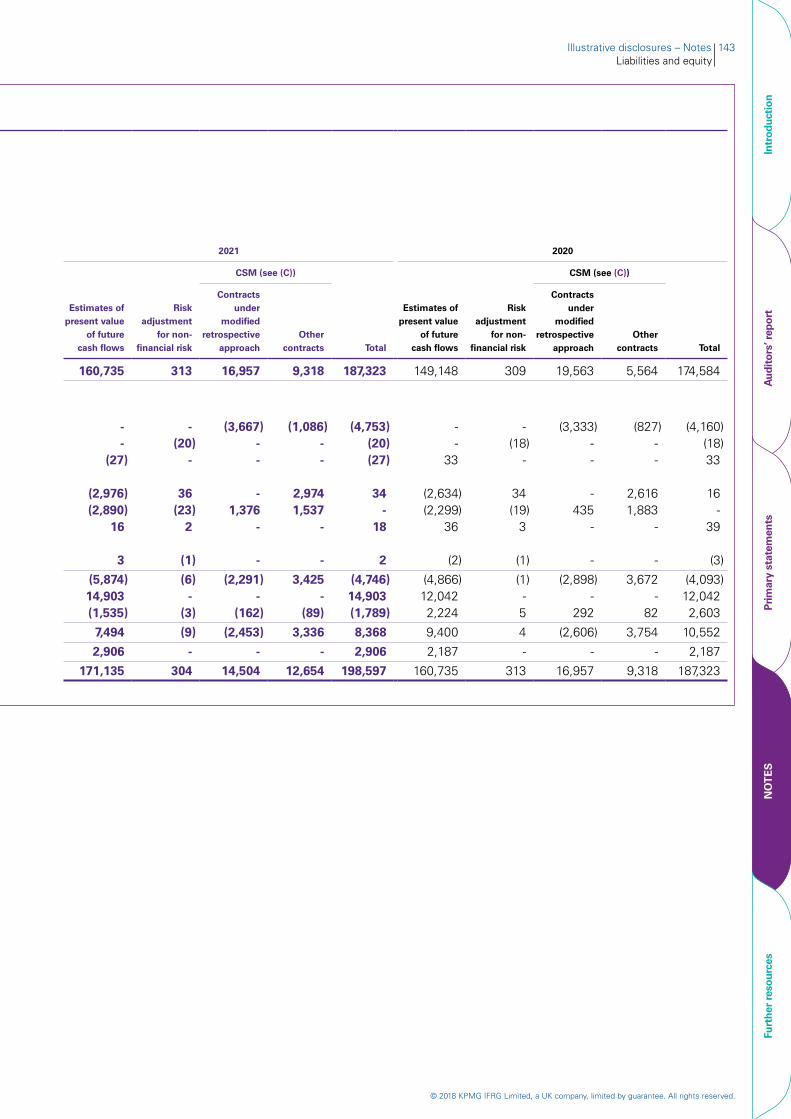
© 2018 KPMG IFRG Limited, a UK company, limited by guarantee. All rights reserved.
Illustrative disclosures – Notes 143Liabilities and equity
Notes to the consolidated financial statements (continued) 29. Insurance and reinsurance contracts (continued)A. Movements in carrying amounts (continued)
iii. Participating (continued)
Insurance contracts (continued)
IFRS 17.101 Analysis by measurement component – Contracts not measured under the PAA2021 2020
Estimates of present value
of future cash flows
Risk adjustment
for non-financial risk
CSM (see (C))
Total
Estimates of present value
of future cash flows
Risk adjustment
for non-financial risk
CSM (see (C))
Total
Contracts under
modified retrospective
approachOther
contracts
Contracts under
modified retrospective
approachOther
contracts
160,735 313 16,957 9,318 187,323 149,148 309 19,563 5,564 174,584
- - (3,667) (1,086) (4,753) - - (3,333) (827) (4,160) - (20) - - (20) - (18) - - (18)
(27) - - - (27) 33 - - - 33
(2,976) 36 - 2,974 34 (2,634) 34 - 2,616 16 (2,890) (23) 1,376 1,537 - (2,299) (19) 435 1,883 -
16 2 - - 18 36 3 - - 39
3 (1) - - 2 (2) (1) - - (3)
(5,874) (6) (2,291) 3,425 (4,746) (4,866) (1) (2,898) 3,672 (4,093) 14,903 - - - 14,903 12,042 - - - 12,042 (1,535) (3) (162) (89) (1,789) 2,224 5 292 82 2,603
7,494 (9) (2,453) 3,336 8,368 9,400 4 (2,606) 3,754 10,552
2,906 - - - 2,906 2,187 - - - 2,187
171,135 304 14,504 12,654 198,597 160,735 313 16,957 9,318 187,323
IFRS 17.114(a), (c) In millions of euro Note
IFRS 17.99(b) Opening liabilities
IFRS 17.98 Changes in the statement of profit or loss and OCIIFRS 17.104(b) Changes that relate to current servicesIFRS 17.104(b)(i) CSM recognised for services provided 9
IFRS 17.104(b)(ii) Change in risk adjustment for non-financial risk for risk expired 9
IFRS 17.104(b)(iii) Experience adjustmentsIFRS 17.104(a) Changes that relate to future servicesIFRS 17.104(a)(iii) Contracts initially recognised in the year (B)(iii)
IFRS 17.104(a)(i) Changes in estimates that adjust the CSMIFRS 17.104(a)(ii) Changes in estimates that result in losses and reversal of losses on onerous contractsIFRS 17.104(c) Changes that relate to past services
Adjustments to liabilities for incurred claims
Insurance service resultIFRS 17.105(c) Net finance expenses from insurance contracts 10
IFRS 17.105(d) Effect of movements in exchange rates
Total changes in the statement of profit or loss and OCI
IFRS 17.98, 105(a) Cash flows*
IFRS 17.99(b) Closing liabilities
* Cash flows are analysed on pages 140 and 141.
Intr
oduc
tion
Aud
itor
s’ r
epor
tPr
imar
y st
atem
ents
NO
TE
SFu
rthe
r re
sour
ces
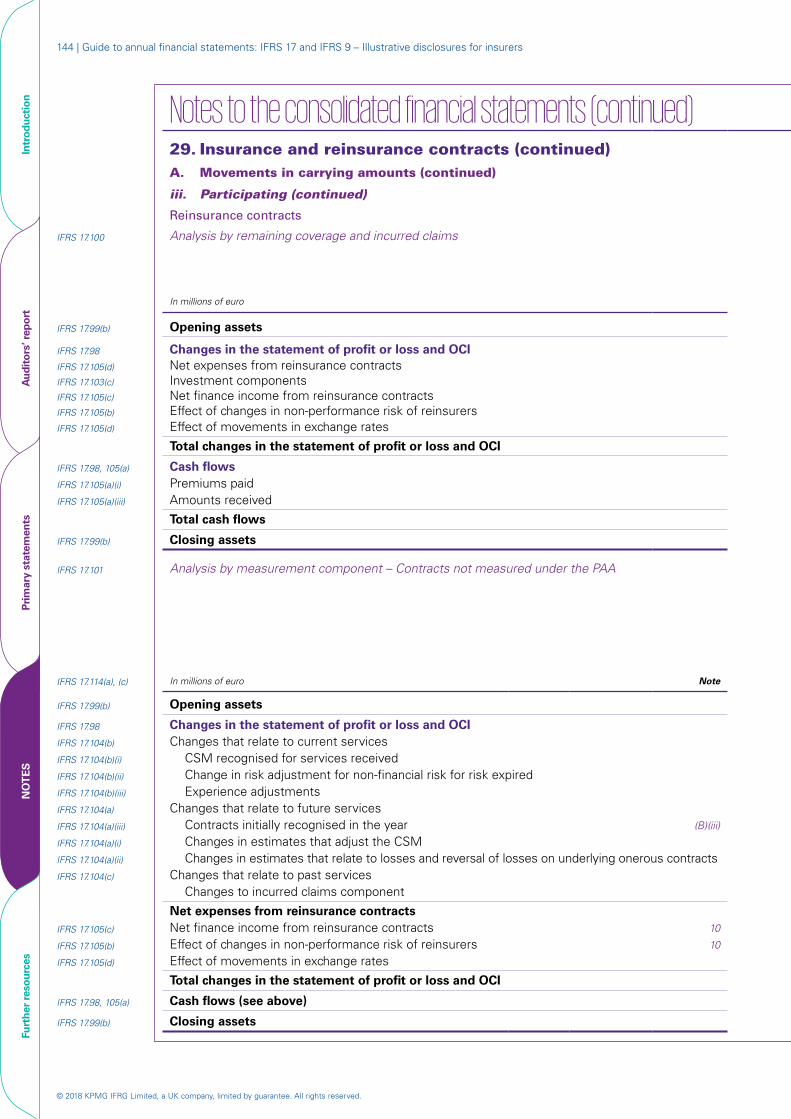
© 2018 KPMG IFRG Limited, a UK company, limited by guarantee. All rights reserved.
144 | Guide to annual financial statements: IFRS 17 and IFRS 9 – Illustrative disclosures for insurers
Notes to the consolidated financial statements (continued) 29. Insurance and reinsurance contracts (continued)A. Movements in carrying amounts (continued)
iii. Participating (continued)
Reinsurance contracts
IFRS 17.100 Analysis by remaining coverage and incurred claims2021 2020
In millions of euro Note
Remaining coverage
componentIncurred claims
component Total
Remaining coverage
componentIncurred claims
component Total
IFRS 17.99(b) Opening assets 2,256 15 2,271 2,143 18 2,161
IFRS 17.98 Changes in the statement of profit or loss and OCIIFRS 17.105(d) Net expenses from reinsurance contracts (68) 18 (50) (40) 11 (29)IFRS 17.103(c) Investment components (149) 149 - (136) 136 - IFRS 17.105(c) Net finance income from reinsurance contracts 10 117 1 118 106 1 107 IFRS 17.105(b) Effect of changes in non-performance risk of reinsurers 10 14 3 17 (13) (1) (14)IFRS 17.105(d) Effect of movements in exchange rates (18) (6) (24) 27 1 28
Total changes in the statement of profit or loss and OCI (104) 165 61 (56) 148 92
IFRS 17.98, 105(a) Cash flowsIFRS 17.105(a)(i) Premiums paid 176 - 176 169 - 169 IFRS 17.105(a)(iii) Amounts received - (165) (165) - (151) (151)
Total cash flows 176 (165) 11 169 (151) 18
IFRS 17.99(b) Closing assets 2,328 15 2,343 2,256 15 2,271
IFRS 17.101 Analysis by measurement component – Contracts not measured under the PAA2021 2020
Estimates of present
value of future cash
flows
Risk adjustment
for non-financial risk
CSM (see (C))
Total
Estimates of present
value of future cash
flows
Risk adjustment
for non-financial risk
CSM (see (C))
TotalIFRS 17.114(a), (c) In millions of euro Note
Contracts under modified
retrospective approach
Other contracts
Contracts under
modified retrospective
approachOther
contracts
IFRS 17.99(b) Opening assets 2,030 11 148 82 2,271 1,941 10 151 59 2,161
IFRS 17.98 Changes in the statement of profit or loss and OCIIFRS 17.104(b) Changes that relate to current servicesIFRS 17.104(b)(i) CSM recognised for services received - - (33) (11) (44) - - (28) (8) (36)IFRS 17.104(b)(ii) Change in risk adjustment for non-financial risk for risk expired - (1) - - (1) - (1) - - (1)IFRS 17.104(b)(iii) Experience adjustments (7) - - - (7) 5 - - - 5 IFRS 17.104(a) Changes that relate to future servicesIFRS 17.104(a)(iii) Contracts initially recognised in the year (B)(iii) (15) 1 - 14 - (13) 1 - 12 - IFRS 17.104(a)(i) Changes in estimates that adjust the CSM (42) (1) 19 24 - (30) (1) 16 15 - IFRS 17.104(a)(ii) Changes in estimates that relate to losses and reversal of losses on underlying onerous contracts 1 1 - - 2 3 2 - - 5 IFRS 17.104(c) Changes that relate to past services
Changes to incurred claims component 1 (1) - - - (1) (1) - - (2)
Net expenses from reinsurance contracts (62) (1) (14) 27 (50) (36) - (12) 19 (29)IFRS 17.105(c) Net finance income from reinsurance contracts 10 106 - 8 4 118 96 - 8 3 107 IFRS 17.105(b) Effect of changes in non-performance risk of reinsurers 10 17 - - - 17 (14) - - - (14)IFRS 17.105(d) Effect of movements in exchange rates (21) (1) (1) (1) (24) 25 1 1 1 28
Total changes in the statement of profit or loss and OCI 40 (2) (7) 30 61 71 1 (3) 23 92
IFRS 17.98, 105(a) Cash flows (see above) 11 - - - 11 18 - - - 18
IFRS 17.99(b) Closing assets 2,081 9 141 112 2,343 2,030 11 148 82 2,271
Intr
oduc
tion
Aud
itor
s’ r
epor
tPr
imar
y st
atem
ents
NO
TE
SFu
rthe
r re
sour
ces

© 2018 KPMG IFRG Limited, a UK company, limited by guarantee. All rights reserved.
Illustrative disclosures – Notes 145Liabilities and equity
Notes to the consolidated financial statements (continued) 29. Insurance and reinsurance contracts (continued)A. Movements in carrying amounts (continued)
iii. Participating (continued)
Reinsurance contracts
IFRS 17.100 Analysis by remaining coverage and incurred claims2021 2020
Note
Remaining coverage
componentIncurred claims
component Total
Remaining coverage
componentIncurred claims
component Total
2,256 15 2,271 2,143 18 2,161
(68) 18 (50) (40) 11 (29) (149) 149 - (136) 136 -
10 117 1 118 106 1 107 10 14 3 17 (13) (1) (14)
(18) (6) (24) 27 1 28
(104) 165 61 (56) 148 92
176 - 176 169 - 169 - (165) (165) - (151) (151)
176 (165) 11 169 (151) 18
2,328 15 2,343 2,256 15 2,271
In millions of euro
IFRS 17.99(b) Opening assets
IFRS 17.98 Changes in the statement of profit or loss and OCIIFRS 17.105(d) Net expenses from reinsurance contractsIFRS 17.103(c) Investment componentsIFRS 17.105(c) Net finance income from reinsurance contractsIFRS 17.105(b) Effect of changes in non-performance risk of reinsurersIFRS 17.105(d) Effect of movements in exchange rates
Total changes in the statement of profit or loss and OCI
IFRS 17.98, 105(a) Cash flowsIFRS 17.105(a)(i) Premiums paidIFRS 17.105(a)(iii) Amounts received
Total cash flows
IFRS 17.99(b) Closing assets
IFRS 17.101 Analysis by measurement component – Contracts not measured under the PAA2021 2020
Estimates of present
value of future cash
flows
Risk adjustment
for non-financial risk
CSM (see (C))
Total
Estimates of present
value of future cash
flows
Risk adjustment
for non-financial risk
CSM (see (C))
Total
Contracts under modified
retrospective approach
Other contracts
Contracts under
modified retrospective
approachOther
contracts
2,030 11 148 82 2,271 1,941 10 151 59 2,161
- - (33) (11) (44) - - (28) (8) (36) - (1) - - (1) - (1) - - (1)
(7) - - - (7) 5 - - - 5
(15) 1 - 14 - (13) 1 - 12 - (42) (1) 19 24 - (30) (1) 16 15 -
1 1 - - 2 3 2 - - 5
1 (1) - - - (1) (1) - - (2)
(62) (1) (14) 27 (50) (36) - (12) 19 (29) 106 - 8 4 118 96 - 8 3 107 17 - - - 17 (14) - - - (14)
(21) (1) (1) (1) (24) 25 1 1 1 28
40 (2) (7) 30 61 71 1 (3) 23 92
11 - - - 11 18 - - - 18
2,081 9 141 112 2,343 2,030 11 148 82 2,271
IFRS 17.114(a), (c) In millions of euro Note
IFRS 17.99(b) Opening assets
IFRS 17.98 Changes in the statement of profit or loss and OCIIFRS 17.104(b) Changes that relate to current servicesIFRS 17.104(b)(i) CSM recognised for services receivedIFRS 17.104(b)(ii) Change in risk adjustment for non-financial risk for risk expiredIFRS 17.104(b)(iii) Experience adjustmentsIFRS 17.104(a) Changes that relate to future servicesIFRS 17.104(a)(iii) Contracts initially recognised in the year (B)(iii)
IFRS 17.104(a)(i) Changes in estimates that adjust the CSMIFRS 17.104(a)(ii) Changes in estimates that relate to losses and reversal of losses on underlying onerous contractsIFRS 17.104(c) Changes that relate to past services
Changes to incurred claims component
Net expenses from reinsurance contractsIFRS 17.105(c) Net finance income from reinsurance contracts 10
IFRS 17.105(b) Effect of changes in non-performance risk of reinsurers 10
IFRS 17.105(d) Effect of movements in exchange rates
Total changes in the statement of profit or loss and OCI
IFRS 17.98, 105(a) Cash flows (see above)
IFRS 17.99(b) Closing assets
Intr
oduc
tion
Aud
itor
s’ r
epor
tPr
imar
y st
atem
ents
NO
TE
SFu
rthe
r re
sour
ces
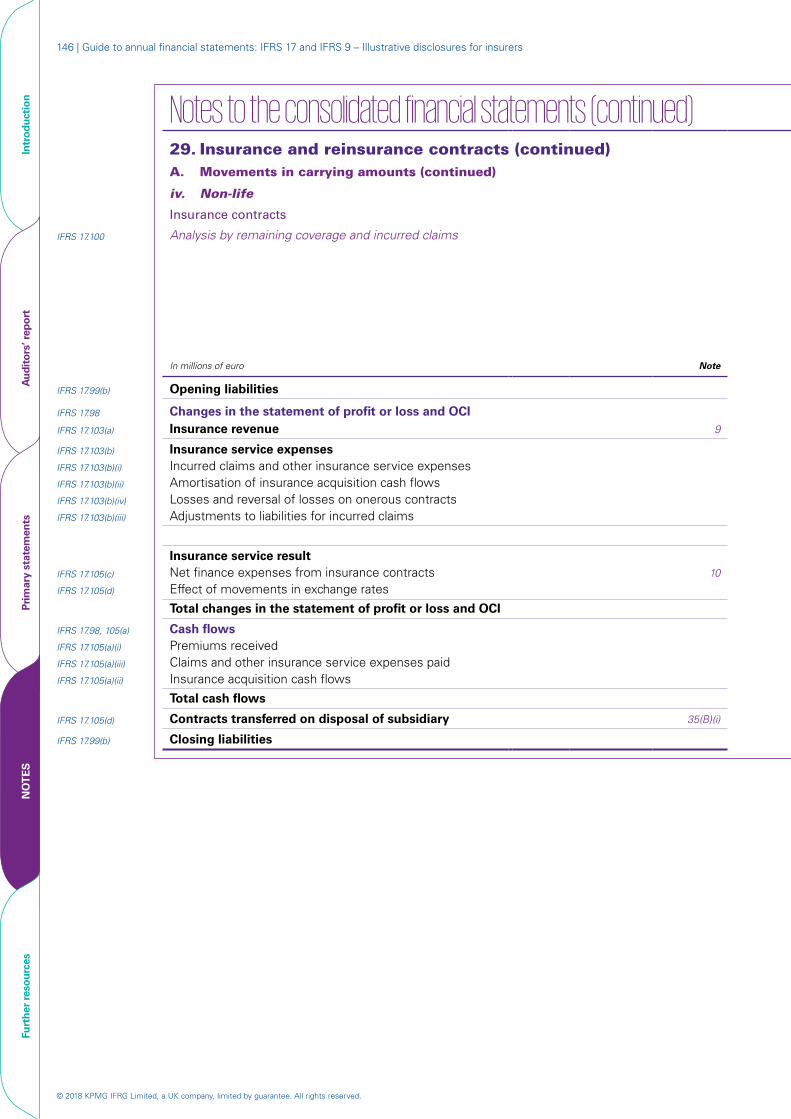
© 2018 KPMG IFRG Limited, a UK company, limited by guarantee. All rights reserved.
146 | Guide to annual financial statements: IFRS 17 and IFRS 9 – Illustrative disclosures for insurers
Notes to the consolidated financial statements (continued) 29. Insurance and reinsurance contracts (continued)A. Movements in carrying amounts (continued)
iv. Non-life
Insurance contracts
IFRS 17.100 Analysis by remaining coverage and incurred claims2021 2020
Liabilities for
remaining coverage
Liabilities for incurred claims (see (D))
Total
Liabilities for
remaining coverage
Liabilities for incurred claims (see (D))
Total
Contracts not under
PAA
Contracts under PAA
Contracts not under
PAA
Contracts under PAA
In millions of euro Note
Estimates of present
value of future cash
flows
Risk adjustment
for non-financial risk
Estimates of present
value of future cash
flows
Risk adjustment
for non-financial risk
IFRS 17.99(b) Opening liabilities 17,833 26 32,252 1,934 52,045 16,367 35 31,070 1,801 49,273
IFRS 17.98 Changes in the statement of profit or loss and OCIIFRS 17.103(a) Insurance revenue 9 (35,896) - - - (35,896) (34,005) - - - (34,005)
IFRS 17.103(b) Insurance service expensesIFRS 17.103(b)(i) Incurred claims and other insurance service expenses - 290 28,864 1,307 30,461 - 225 28,986 1,783 30,994 IFRS 17.103(b)(ii) Amortisation of insurance acquisition cash flows 3,571 - - - 3,571 3,325 - - - 3,325 IFRS 17.103(b)(iv) Losses and reversal of losses on onerous contracts - - - - - - - - - -IFRS 17.103(b)(iii) Adjustments to liabilities for incurred claims - - (1,019) (1,145) (2,164) - - (907) (1,673) (2,580)
3,571 290 27,845 162 31,868 3,325 225 28,079 110 31,739
Insurance service result (32,325) 290 27,845 162 (4,028) (30,680) 225 28,079 110 (2,266)IFRS 17.105(c) Net finance expenses from insurance contracts 10 18 1 1,638 - 1,657 19 1 1,549 - 1,569 IFRS 17.105(d) Effect of movements in exchange rates (157) (1) (250) (15) (423) 228 1 411 23 663
Total changes in the statement of profit or loss and OCI (32,464) 290 29,233 147 (2,794) (30,433) 227 30,039 133 (34)
IFRS 17.98, 105(a) Cash flowsIFRS 17.105(a)(i) Premiums received 36,119 - - - 36,119 35,224 - - - 35,224 IFRS 17.105(a)(iii) Claims and other insurance service expenses paid - (300) (28,518) - (28,818) - (236) (28,857) - (29,093)IFRS 17.105(a)(ii) Insurance acquisition cash flows (3,571) - - - (3,571) (3,325) - - - (3,325)
Total cash flows 32,548 (300) (28,518) - 3,730 31,899 (236) (28,857) - 2,806
IFRS 17.105(d) Contracts transferred on disposal of subsidiary 35(B)(i) (362) - (603) (41) (1,006) - - - - -
IFRS 17.99(b) Closing liabilities 17,555 16 32,364 2,040 51,975 17,833 26 32,252 1,934 52,045
Intr
oduc
tion
Aud
itor
s’ r
epor
tPr
imar
y st
atem
ents
NO
TE
SFu
rthe
r re
sour
ces

© 2018 KPMG IFRG Limited, a UK company, limited by guarantee. All rights reserved.
Illustrative disclosures – Notes 147Liabilities and equity
Notes to the consolidated financial statements (continued) 29. Insurance and reinsurance contracts (continued)A. Movements in carrying amounts (continued)
iv. Non-life
Insurance contracts
IFRS 17.100 Analysis by remaining coverage and incurred claims2021 2020
Liabilities for
remaining coverage
Liabilities for incurred claims (see (D))
Total
Liabilities for
remaining coverage
Liabilities for incurred claims (see (D))
Total
Contracts not under
PAA
Contracts under PAA
Contracts not under
PAA
Contracts under PAA
Estimates of present
value of future cash
flows
Risk adjustment
for non-financial risk
Estimates of present
value of future cash
flows
Risk adjustment
for non-financial risk
17,833 26 32,252 1,934 52,045 16,367 35 31,070 1,801 49,273
(35,896) - - - (35,896) (34,005) - - - (34,005)
- 290 28,864 1,307 30,461 - 225 28,986 1,783 30,994 3,571 - - - 3,571 3,325 - - - 3,325
- - - - - - - - - - - - (1,019) (1,145) (2,164) - - (907) (1,673) (2,580)
3,571 290 27,845 162 31,868 3,325 225 28,079 110 31,739
(32,325) 290 27,845 162 (4,028) (30,680) 225 28,079 110 (2,266)18 1 1,638 - 1,657 19 1 1,549 - 1,569
(157) (1) (250) (15) (423) 228 1 411 23 663
(32,464) 290 29,233 147 (2,794) (30,433) 227 30,039 133 (34)
36,119 - - - 36,119 35,224 - - - 35,224 - (300) (28,518) - (28,818) - (236) (28,857) - (29,093)
(3,571) - - - (3,571) (3,325) - - - (3,325)
32,548 (300) (28,518) - 3,730 31,899 (236) (28,857) - 2,806
(362) - (603) (41) (1,006) - - - - -
17,555 16 32,364 2,040 51,975 17,833 26 32,252 1,934 52,045
In millions of euro Note
IFRS 17.99(b) Opening liabilities
IFRS 17.98 Changes in the statement of profit or loss and OCIIFRS 17.103(a) Insurance revenue 9
IFRS 17.103(b) Insurance service expensesIFRS 17.103(b)(i) Incurred claims and other insurance service expensesIFRS 17.103(b)(ii) Amortisation of insurance acquisition cash flowsIFRS 17.103(b)(iv) Losses and reversal of losses on onerous contractsIFRS 17.103(b)(iii) Adjustments to liabilities for incurred claims
Insurance service resultIFRS 17.105(c) Net finance expenses from insurance contracts 10
IFRS 17.105(d) Effect of movements in exchange rates
Total changes in the statement of profit or loss and OCI
IFRS 17.98, 105(a) Cash flowsIFRS 17.105(a)(i) Premiums receivedIFRS 17.105(a)(iii) Claims and other insurance service expenses paidIFRS 17.105(a)(ii) Insurance acquisition cash flows
Total cash flows
IFRS 17.105(d) Contracts transferred on disposal of subsidiary 35(B)(i)
IFRS 17.99(b) Closing liabilities
Intr
oduc
tion
Aud
itor
s’ r
epor
tPr
imar
y st
atem
ents
NO
TE
SFu
rthe
r re
sour
ces
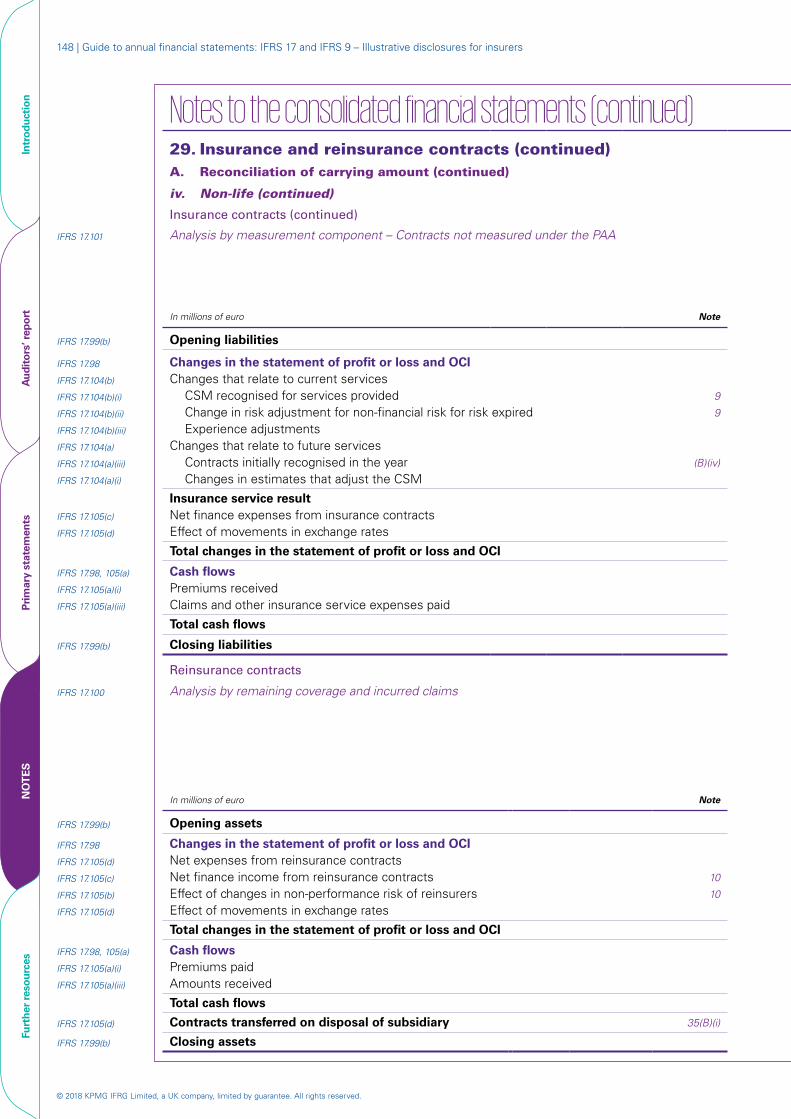
© 2018 KPMG IFRG Limited, a UK company, limited by guarantee. All rights reserved.
148 | Guide to annual financial statements: IFRS 17 and IFRS 9 – Illustrative disclosures for insurers
Notes to the consolidated financial statements (continued)29. Insurance and reinsurance contracts (continued)A. Reconciliation of carrying amount (continued)
iv. Non-life (continued)
Insurance contracts (continued)
IFRS 17.101 Analysis by measurement component – Contracts not measured under the PAA2021 2020
In millions of euro Note
Estimates of present value of future cash
flows
Risk adjustment for non-financial
risk CSM (see (C)) Total
Estimates of present value of future cash
flows
Risk adjustment for non-financial
risk CSM (see (C)) Total
IFRS 17.99(b) Opening liabilities 288 22 33 343 490 30 70 590
IFRS 17.98 Changes in the statement of profit or loss and OCIIFRS 17.104(b) Changes that relate to current servicesIFRS 17.104(b)(i) CSM recognised for services provided 9 - - (28) (28) - - (32) (32)IFRS 17.104(b)(ii) Change in risk adjustment for non-financial risk for risk expired 9 - (14) - (14) - (11) - (11)IFRS 17.104(b)(iii) Experience adjustments 3 - - 3 4 - - 4 IFRS 17.104(a) Changes that relate to future servicesIFRS 17.104(a)(iii) Contracts initially recognised in the year (B)(iv) (23) 7 16 - - - - - IFRS 17.104(a)(i) Changes in estimates that adjust the CSM 8 2 (10) - 8 2 (10) -
Insurance service result (12) (5) (22) (39) 12 (9) (42) (39)IFRS 17.105(c) Net finance expenses from insurance contracts 15 - 4 19 16 - 4 20 IFRS 17.105(d) Effect of movements in exchange rates (2) (1) (1) (4) 6 1 1 8
Total changes in the statement of profit or loss and OCI 1 (6) (19) (24) 34 (8) (37) (11)
IFRS 17.98, 105(a) Cash flowsIFRS 17.105(a)(i) Premiums received 134 - - 134 - - - - IFRS 17.105(a)(iii) Claims and other insurance service expenses paid (300) - - (300) (236) - - (236)
Total cash flows (166) - - (166) (236) - - (236)
IFRS 17.99(b) Closing liabilities 123 16 14 153 288 22 33 343
Reinsurance contracts
IFRS 17.100 Analysis by remaining coverage and incurred claims2021 2020
Incurred claims component (see (D))
Total
Incurred claims component (see (D))
TotalIn millions of euro Note
Remaining coverage
component
Estimates of present value of future cash
flows
Risk adjustment for non-financial
risk
Remaining coverage
component
Estimates of present value of future cash
flows
Risk adjustment for non-financial
risk
IFRS 17.99(b) Opening assets 3,609 5,056 308 8,973 3,126 4,979 289 8,394
IFRS 17.98 Changes in the statement of profit or loss and OCIIFRS 17.105(d) Net expenses from reinsurance contracts (5,730) 4,531 32 (1,167) (5,493) 4,397 14 (1,082)IFRS 17.105(c) Net finance income from reinsurance contracts 10 - 270 - 270 - 255 - 255 IFRS 17.105(b) Effect of changes in non-performance risk of reinsurers 10 - (22) - (22) - (17) - (17)IFRS 17.105(d) Effect of movements in exchange rates (26) (47) (2) (75) 40 64 5 109
Total changes in the statement of profit or loss and OCI (5,756) 4,732 30 (994) (5,453) 4,699 19 (735)
IFRS 17.98, 105(a) Cash flowsIFRS 17.105(a)(i) Premiums paid 5,912 - - 5,912 5,936 - - 5,936 IFRS 17.105(a)(iii) Amounts received - (4,519) - (4,519) - (4,622) - (4,622)
Total cash flows 5,912 (4,519) - 1,393 5,936 (4,622) - 1,314
IFRS 17.105(d) Contracts transferred on disposal of subsidiary 35(B)(i) (51) (81) (5) (137) - - - -
IFRS 17.99(b) Closing assets 3,714 5,188 333 9,235 3,609 5,056 308 8,973
Intr
oduc
tion
Aud
itor
s’ r
epor
tPr
imar
y st
atem
ents
NO
TE
SFu
rthe
r re
sour
ces

© 2018 KPMG IFRG Limited, a UK company, limited by guarantee. All rights reserved.
Illustrative disclosures – Notes 149Liabilities and equity
Notes to the consolidated financial statements (continued)29. Insurance and reinsurance contracts (continued)A. Reconciliation of carrying amount (continued)
iv. Non-life (continued)
Insurance contracts (continued)
IFRS 17.101 Analysis by measurement component – Contracts not measured under the PAA2021 2020
Estimates of present value of future cash
flows
Risk adjustment for non-financial
risk CSM (see (C)) Total
Estimates of present value of future cash
flows
Risk adjustment for non-financial
risk CSM (see (C)) Total
288 22 33 343 490 30 70 590
- - 3
- (14)
-
(28) - -
(28) (14)
3
- - 4
- (11)
-
(32) - -
(32) (11)
4
(23) 8
7 2
16 (10)
- -
- 8
- 2
- (10)
- -
(12) 15
(5) -
(22) 4
(39) 19
12 16
(9) -
(42) 4
(39) 20
(2) (1) (1) (4) 6 1 1 8
1 (6) (19) (24) 34 (8) (37) (11)
134 - - 134 - - - - (300) - - (300) (236) - - (236)
(166) - - (166) (236) - - (236)
123 16 14 153 288 22 33 343
In millions of euro Note
IFRS 17.99(b) Opening liabilities
IFRS 17.98 Changes in the statement of profit or loss and OCIIFRS 17.104(b) Changes that relate to current servicesIFRS 17.104(b)(i) CSM recognised for services provided 9
IFRS 17.104(b)(ii) Change in risk adjustment for non-financial risk for risk expired 9
IFRS 17.104(b)(iii) Experience adjustmentsIFRS 17.104(a) Changes that relate to future servicesIFRS 17.104(a)(iii) Contracts initially recognised in the year (B)(iv)
IFRS 17.104(a)(i) Changes in estimates that adjust the CSM
Insurance service resultIFRS 17.105(c) Net finance expenses from insurance contractsIFRS 17.105(d) Effect of movements in exchange rates
Total changes in the statement of profit or loss and OCI
IFRS 17.98, 105(a) Cash flowsIFRS 17.105(a)(i) Premiums receivedIFRS 17.105(a)(iii) Claims and other insurance service expenses paid
Total cash flows
IFRS 17.99(b) Closing liabilities
Reinsurance contracts
IFRS 17.100 Analysis by remaining coverage and incurred claims2021 2020
Incurred claims component (see (D))
Total
Incurred claims component (see (D))
Total
Remaining coverage
component
Estimates of present value of future cash
flows
Risk adjustment for non-financial
risk
Remaining coverage
component
Estimates of present value of future cash
flows
Risk adjustment for non-financial
risk
3,609 5,056 308 8,973 3,126 4,979 289 8,394
(5,730) 4,531 32 (1,167) (5,493) 4,397 14 (1,082) - 270 - 270 - 255 - 255 - (22) - (22) - (17) - (17)
(26) (47) (2) (75) 40 64 5 109
(5,756) 4,732 30 (994) (5,453) 4,699 19 (735)
5,912 - - 5,912 5,936 - - 5,936 - (4,519) - (4,519) - (4,622) - (4,622)
5,912 (4,519) - 1,393 5,936 (4,622) - 1,314
(51) (81) (5) (137) - - - -
3,714 5,188 333 9,235 3,609 5,056 308 8,973
In millions of euro Note
IFRS 17.99(b) Opening assets
IFRS 17.98 Changes in the statement of profit or loss and OCIIFRS 17.105(d) Net expenses from reinsurance contractsIFRS 17.105(c) Net finance income from reinsurance contracts 10
IFRS 17.105(b) Effect of changes in non-performance risk of reinsurers 10
IFRS 17.105(d) Effect of movements in exchange rates
Total changes in the statement of profit or loss and OCI
IFRS 17.98, 105(a) Cash flowsIFRS 17.105(a)(i) Premiums paidIFRS 17.105(a)(iii) Amounts received
Total cash flows
IFRS 17.105(d) Contracts transferred on disposal of subsidiary 35(B)(i)
IFRS 17.99(b) Closing assets
Intr
oduc
tion
Aud
itor
s’ r
epor
tPr
imar
y st
atem
ents
NO
TE
SFu
rthe
r re
sour
ces
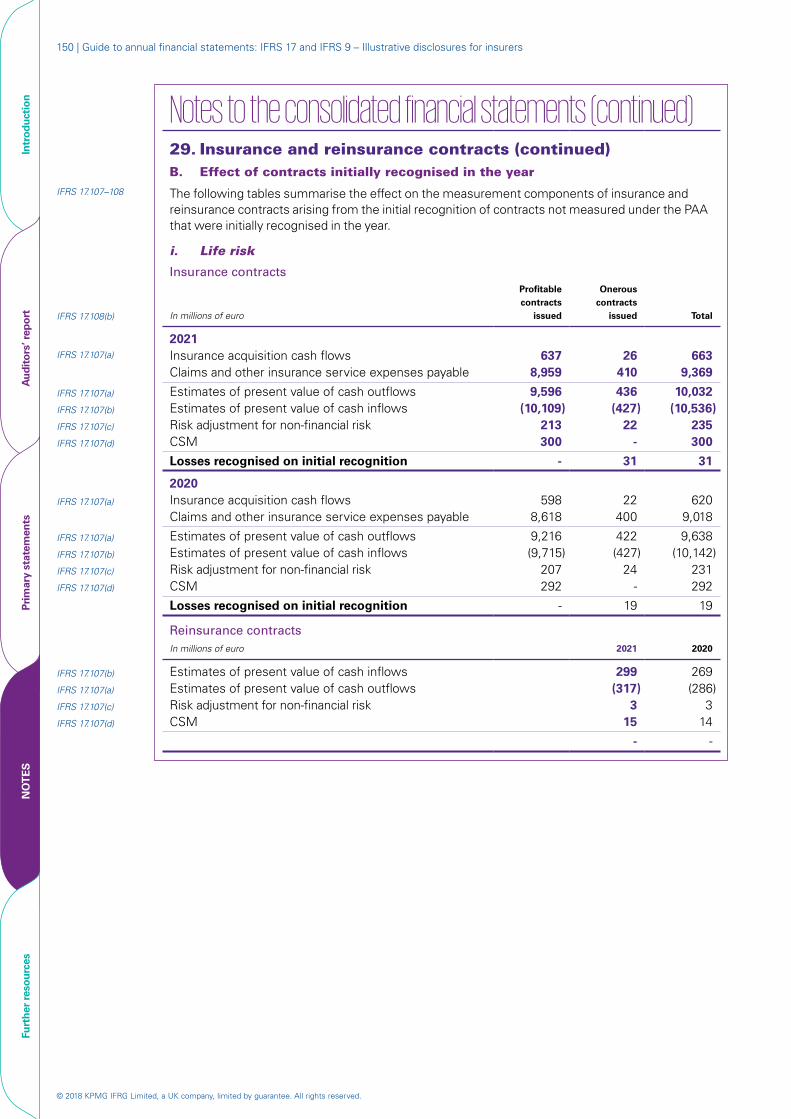
© 2018 KPMG IFRG Limited, a UK company, limited by guarantee. All rights reserved.
150 | Guide to annual financial statements: IFRS 17 and IFRS 9 – Illustrative disclosures for insurers
Notes to the consolidated financial statements (continued)29. Insurance and reinsurance contracts (continued)B. Effect of contracts initially recognised in the year
IFRS 17.107–108 The following tables summarise the effect on the measurement components of insurance and reinsurance contracts arising from the initial recognition of contracts not measured under the PAA that were initially recognised in the year.
i. Life risk
Insurance contracts
IFRS 17.108(b) In millions of euro
Profitable contracts
issued
Onerous contracts
issued Total
2021IFRS 17.107(a) Insurance acquisition cash flows 637 26 663
Claims and other insurance service expenses payable 8,959 410 9,369
IFRS 17.107(a) Estimates of present value of cash outflows 9,596 436 10,032 IFRS 17.107(b) Estimates of present value of cash inflows (10,109) (427) (10,536)IFRS 17.107(c) Risk adjustment for non-financial risk 213 22 235 IFRS 17.107(d) CSM 300 - 300
Losses recognised on initial recognition - 31 31
2020IFRS 17.107(a) Insurance acquisition cash flows 598 22 620
Claims and other insurance service expenses payable 8,618 400 9,018
IFRS 17.107(a) Estimates of present value of cash outflows 9,216 422 9,638 IFRS 17.107(b) Estimates of present value of cash inflows (9,715) (427) (10,142)IFRS 17.107(c) Risk adjustment for non-financial risk 207 24 231 IFRS 17.107(d) CSM 292 - 292
Losses recognised on initial recognition - 19 19
Reinsurance contractsIn millions of euro 2021 2020
IFRS 17.107(b) Estimates of present value of cash inflows 299 269 IFRS 17.107(a) Estimates of present value of cash outflows (317) (286)IFRS 17.107(c) Risk adjustment for non-financial risk 3 3 IFRS 17.107(d) CSM 15 14
- -
Intr
oduc
tion
Aud
itor
s’ r
epor
tPr
imar
y st
atem
ents
NO
TE
SFu
rthe
r re
sour
ces
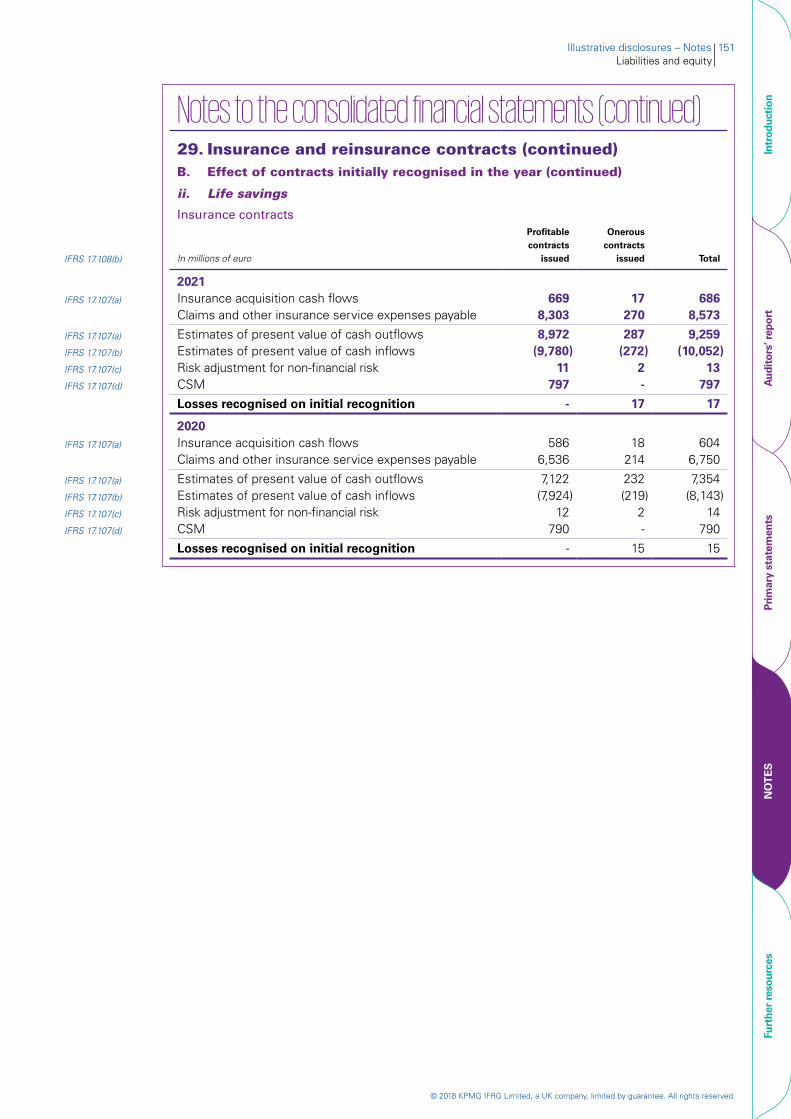
© 2018 KPMG IFRG Limited, a UK company, limited by guarantee. All rights reserved.
Illustrative disclosures – Notes 151Liabilities and equity
Notes to the consolidated financial statements (continued)29. Insurance and reinsurance contracts (continued)B. Effect of contracts initially recognised in the year (continued)
ii. Life savings
Insurance contracts
IFRS 17.108(b) In millions of euro
Profitable contracts
issued
Onerous contracts
issued Total
2021IFRS 17.107(a) Insurance acquisition cash flows 669 17 686
Claims and other insurance service expenses payable 8,303 270 8,573
IFRS 17.107(a) Estimates of present value of cash outflows 8,972 287 9,259 IFRS 17.107(b) Estimates of present value of cash inflows (9,780) (272) (10,052)IFRS 17.107(c) Risk adjustment for non-financial risk 11 2 13 IFRS 17.107(d) CSM 797 - 797
Losses recognised on initial recognition - 17 17
2020IFRS 17.107(a) Insurance acquisition cash flows 586 18 604
Claims and other insurance service expenses payable 6,536 214 6,750
IFRS 17.107(a) Estimates of present value of cash outflows 7,122 232 7,354 IFRS 17.107(b) Estimates of present value of cash inflows (7,924) (219) (8,143)IFRS 17.107(c) Risk adjustment for non-financial risk 12 2 14 IFRS 17.107(d) CSM 790 - 790
Losses recognised on initial recognition - 15 15
Intr
oduc
tion
Aud
itor
s’ r
epor
tPr
imar
y st
atem
ents
NO
TE
SFu
rthe
r re
sour
ces
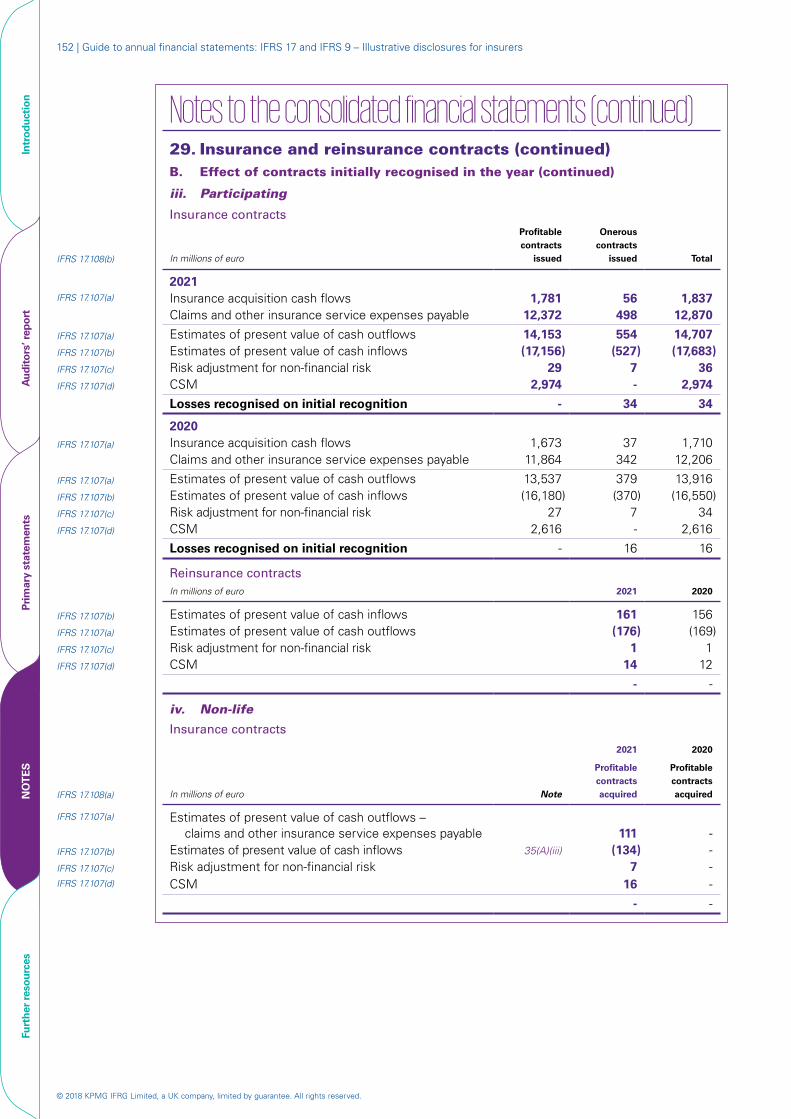
© 2018 KPMG IFRG Limited, a UK company, limited by guarantee. All rights reserved.
152 | Guide to annual financial statements: IFRS 17 and IFRS 9 – Illustrative disclosures for insurers
Notes to the consolidated financial statements (continued)29. Insurance and reinsurance contracts (continued)B. Effect of contracts initially recognised in the year (continued)
iii. Participating
Insurance contracts
IFRS 17.108(b) In millions of euro
Profitable contracts
issued
Onerous contracts
issued Total
2021IFRS 17.107(a) Insurance acquisition cash flows 1,781 56 1,837
Claims and other insurance service expenses payable 12,372 498 12,870
IFRS 17.107(a) Estimates of present value of cash outflows 14,153 554 14,707 IFRS 17.107(b) Estimates of present value of cash inflows (17,156) (527) (17,683)IFRS 17.107(c) Risk adjustment for non-financial risk 29 7 36 IFRS 17.107(d) CSM 2,974 - 2,974
Losses recognised on initial recognition - 34 34
2020IFRS 17.107(a) Insurance acquisition cash flows 1,673 37 1,710
Claims and other insurance service expenses payable 11,864 342 12,206
IFRS 17.107(a) Estimates of present value of cash outflows 13,537 379 13,916 IFRS 17.107(b) Estimates of present value of cash inflows (16,180) (370) (16,550)IFRS 17.107(c) Risk adjustment for non-financial risk 27 7 34 IFRS 17.107(d) CSM 2,616 - 2,616
Losses recognised on initial recognition - 16 16
Reinsurance contractsIn millions of euro 2021 2020
IFRS 17.107(b) Estimates of present value of cash inflows 161 156 IFRS 17.107(a) Estimates of present value of cash outflows (176) (169)IFRS 17.107(c) Risk adjustment for non-financial risk 1 1 IFRS 17.107(d) CSM 14 12
- -
iv. Non-life
Insurance contracts
2021 2020
IFRS 17.108(a) In millions of euro Note
Profitable contracts acquired
Profitable contracts acquired
IFRS 17.107(a) Estimates of present value of cash outflows – claims and other insurance service expenses payable 111 -
IFRS 17.107(b) Estimates of present value of cash inflows 35(A)(iii) (134) -IFRS 17.107(c) Risk adjustment for non-financial risk 7 -IFRS 17.107(d) CSM 16 -
- -
Intr
oduc
tion
Aud
itor
s’ r
epor
tPr
imar
y st
atem
ents
NO
TE
SFu
rthe
r re
sour
ces
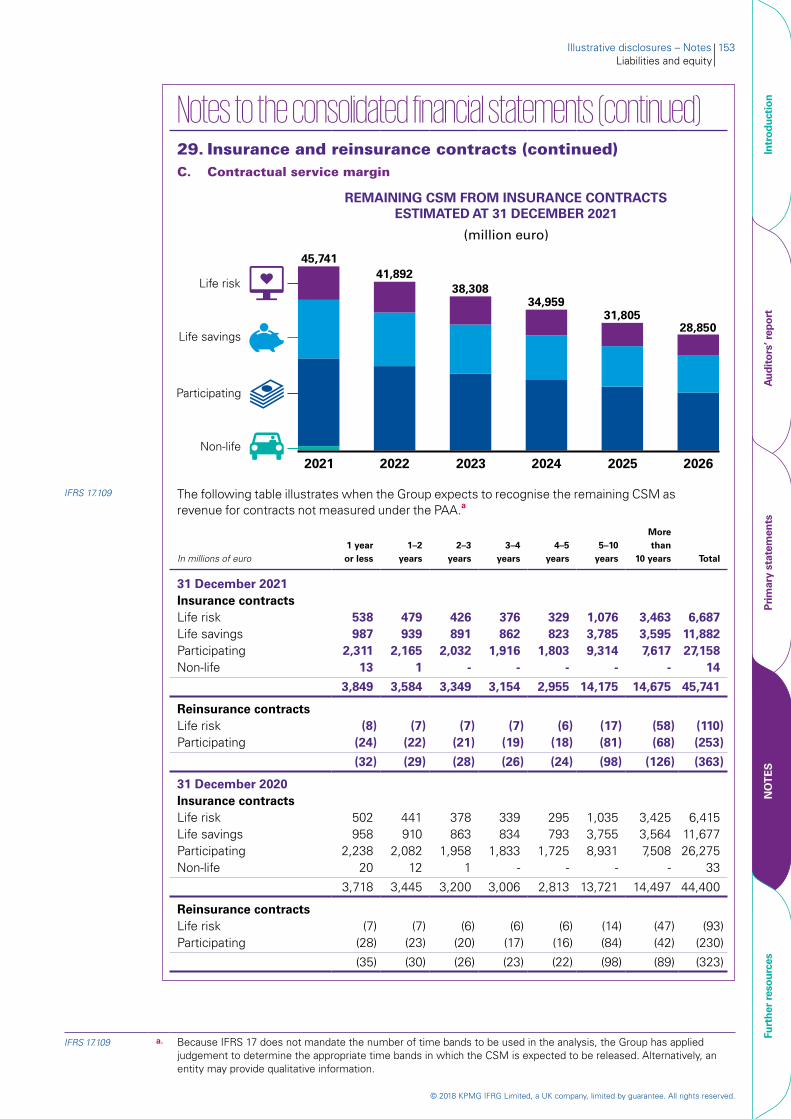
© 2018 KPMG IFRG Limited, a UK company, limited by guarantee. All rights reserved.
Illustrative disclosures – Notes 153Liabilities and equity
Notes to the consolidated financial statements (continued)29. Insurance and reinsurance contracts (continued)C. Contractual service margin
45,741
2021 2022 2023 2024 2025 2026
Life risk
Life savings
Participating
Non-life
(million euro)
REMAINING CSM FROM INSURANCE CONTRACTS
ESTIMATED AT 31 DECEMBER 2021
41,892
38,308
34,959
31,80528,850
IFRS 17.109 The following table illustrates when the Group expects to recognise the remaining CSM as revenue for contracts not measured under the PAA.a
In millions of euro1 year or less
1–2 years
2–3 years
3–4 years
4–5 years
5–10 years
More than
10 years Total
31 December 2021Insurance contractsLife risk 538 479 426 376 329 1,076 3,463 6,687 Life savings 987 939 891 862 823 3,785 3,595 11,882 Participating 2,311 2,165 2,032 1,916 1,803 9,314 7,617 27,158 Non-life 13 1 - - - - - 14
3,849 3,584 3,349 3,154 2,955 14,175 14,675 45,741
Reinsurance contractsLife risk (8) (7) (7) (7) (6) (17) (58) (110)Participating (24) (22) (21) (19) (18) (81) (68) (253)
(32) (29) (28) (26) (24) (98) (126) (363)
31 December 2020Insurance contractsLife risk 502 441 378 339 295 1,035 3,425 6,415 Life savings 958 910 863 834 793 3,755 3,564 11,677 Participating 2,238 2,082 1,958 1,833 1,725 8,931 7,508 26,275 Non-life 20 12 1 - - - - 33
3,718 3,445 3,200 3,006 2,813 13,721 14,497 44,400
Reinsurance contractsLife risk (7) (7) (6) (6) (6) (14) (47) (93)Participating (28) (23) (20) (17) (16) (84) (42) (230)
(35) (30) (26) (23) (22) (98) (89) (323)
IFRS 17.109 a. Because IFRS 17 does not mandate the number of time bands to be used in the analysis, the Group has applied judgement to determine the appropriate time bands in which the CSM is expected to be released. Alternatively, an entity may provide qualitative information.
Intr
oduc
tion
Aud
itor
s’ r
epor
tPr
imar
y st
atem
ents
NO
TE
SFu
rthe
r re
sour
ces
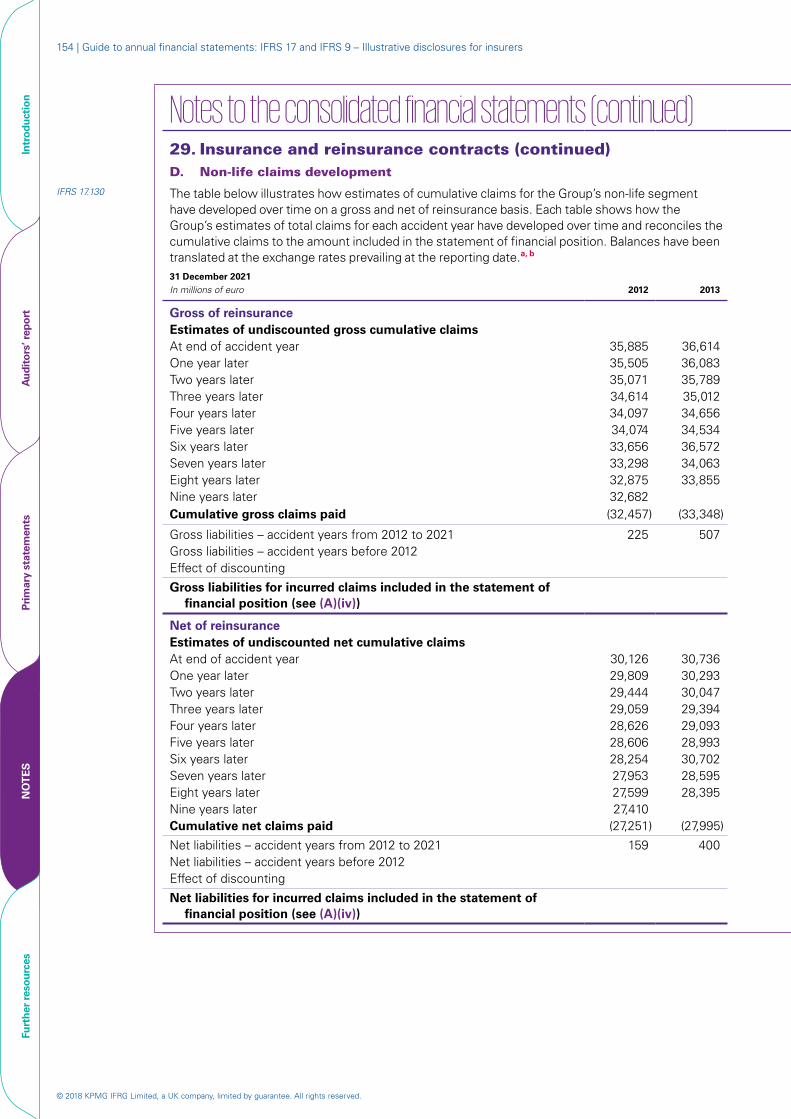
© 2018 KPMG IFRG Limited, a UK company, limited by guarantee. All rights reserved.
154 | Guide to annual financial statements: IFRS 17 and IFRS 9 – Illustrative disclosures for insurers
Notes to the consolidated financial statements (continued) 29. Insurance and reinsurance contracts (continued)D. Non-life claims development
IFRS 17.130 The table below illustrates how estimates of cumulative claims for the Group’s non-life segment have developed over time on a gross and net of reinsurance basis. Each table shows how the Group’s estimates of total claims for each accident year have developed over time and reconciles the cumulative claims to the amount included in the statement of financial position. Balances have been translated at the exchange rates prevailing at the reporting date.a, b
31 December 2021 In millions of euro 2012 2013 2014 2015 2016 2017 2018 2019 2020 2021 Total
Gross of reinsuranceEstimates of undiscounted gross cumulative claimsAt end of accident year 35,885 36,614 37,096 39,080 39,864 40,691 38,623 39,131 38,708 41,001 One year later 35,505 36,083 36,781 38,134 38,944 38,015 38,244 37,694 37,582 Two years later 35,071 35,789 36,123 37,705 38,480 37,514 37,446 37,063 Three years later 34,614 35,012 35,912 37,285 37,850 36,983 36,952 Four years later 34,097 34,656 35,593 36,765 37,296 36,781 Five years later 34,074 34,534 34,191 36,301 36,807 Six years later 33,656 36,572 34,614 36,057 Seven years later 33,298 34,063 34,440 Eight years later 32,875 33,855 Nine years later 32,682 Cumulative gross claims paid (32,457) (33,348) (33,247) (34,086) (34,816) (35,148) (33,784) (33,401) (30,356) (25,707)
Gross liabilities – accident years from 2012 to 2021 225 507 1,193 1,971 1,991 1,633 3,168 3,662 7,226 15,294 36,870 Gross liabilities – accident years before 2012 3,543 Effect of discounting (5,993)
Gross liabilities for incurred claims included in the statement of financial position (see (A)(iv)) 34,420
Net of reinsuranceEstimates of undiscounted net cumulative claimsAt end of accident year 30,126 30,736 31,143 32,808 33,467 34,160 32,423 32,852 32,401 34,087 One year later 29,809 30,293 30,878 32,014 32,695 31,915 32,108 31,563 31,497 Two years later 29,444 30,047 30,326 31,655 32,304 31,496 31,435 31,114 Three years later 29,059 29,394 30,150 31,299 31,774 31,048 31,103 Four years later 28,626 29,093 29,882 30,865 31,310 30,850 Five years later 28,606 28,993 28,703 30,474 30,900 Six years later 28,254 30,702 29,059 30,230 Seven years later 27,953 28,595 28,884 Eight years later 27,599 28,395 Nine years later 27,410 Cumulative net claims paid (27,251) (27,995) (27,912) (28,615) (29,229) (29,508) (28,362) (28,041) (25,485) (21,124)
Net liabilities – accident years from 2012 to 2021 159 400 972 1,615 1,671 1,342 2,741 3,073 6,012 12,963 30,948 Net liabilities – accident years before 2012 2,341 Effect of discounting (4,390)
Net liabilities for incurred claims included in the statement of financial position (see (A)(iv)) 28,899
Intr
oduc
tion
Aud
itor
s’ r
epor
tPr
imar
y st
atem
ents
NO
TE
SFu
rthe
r re
sour
ces

© 2018 KPMG IFRG Limited, a UK company, limited by guarantee. All rights reserved.
Illustrative disclosures – Notes 155Liabilities and equity
Notes to the consolidated financial statements (continued) 29. Insurance and reinsurance contracts (continued)D. Non-life claims development
IFRS 17.130 The table below illustrates how estimates of cumulative claims for the Group’s non-life segment have developed over time on a gross and net of reinsurance basis. Each table shows how the Group’s estimates of total claims for each accident year have developed over time and reconciles the cumulative claims to the amount included in the statement of financial position. Balances have been translated at the exchange rates prevailing at the reporting date.a, b
31 December 2021 In millions of euro 2012 2013 2014 2015 2016 2017 2018 2019 2020 2021 Total
37,096 36,781 36,123 35,912 35,593 34,191 34,614 34,440
39,080 38,134 37,705 37,285 36,765 36,301 36,057
39,864 38,944 38,480 37,850 37,296 36,807
40,691 38,015 37,514 36,983 36,781
38,623 38,244 37,446 36,952
39,131 37,694 37,063
38,708 37,582
41,001
(33,247) (34,086) (34,816) (35,148) (33,784) (33,401) (30,356) (25,707)
1,193 1,971 1,991 1,633 3,168 3,662 7,226 15,294 36,870 3,543
(5,993)
34,420
31,143 30,878 30,326 30,150 29,882 28,703 29,059 28,884
32,808 32,014 31,655 31,299 30,865 30,474 30,230
33,467 32,695 32,304 31,774 31,310 30,900
34,160 31,915 31,496 31,048 30,850
32,423 32,108 31,435 31,103
32,852 31,563 31,114
32,401 31,497
34,087
(27,912) (28,615) (29,229) (29,508) (28,362) (28,041) (25,485) (21,124)
972 1,615 1,671 1,342 2,741 3,073 6,012 12,963 30,948 2,341
(4,390)
28,899
Gross of reinsuranceEstimates of undiscounted gross cumulative claimsAt end of accident year 35,885 36,614 One year later 35,505 36,083 Two years later 35,071 35,789 Three years later 34,614 35,012 Four years later 34,097 34,656 Five years later 34,074 34,534 Six years later 33,656 36,572 Seven years later 33,298 34,063 Eight years later 32,875 33,855 Nine years later 32,682 Cumulative gross claims paid (32,457) (33,348)
Gross liabilities – accident years from 2012 to 2021 225 507 Gross liabilities – accident years before 2012Effect of discounting
Gross liabilities for incurred claims included in the statement of financial position (see (A)(iv))
Net of reinsuranceEstimates of undiscounted net cumulative claimsAt end of accident year 30,126 30,736 One year later 29,809 30,293 Two years later 29,444 30,047 Three years later 29,059 29,394 Four years later 28,626 29,093 Five years later 28,606 28,993 Six years later 28,254 30,702 Seven years later 27,953 28,595 Eight years later 27,599 28,395 Nine years later 27,410 Cumulative net claims paid (27,251) (27,995)
Net liabilities – accident years from 2012 to 2021 159 400 Net liabilities – accident years before 2012Effect of discounting
Net liabilities for incurred claims included in the statement of financial position (see (A)(iv))
IFRS 17.130 a. IFRS 17 does not require an entity to disclose claims development information for which uncertainty about the amount and timing of the claims payments is typically resolved within one year. Therefore, the Group has not disclosed information about the claims in its life risk, life savings and participating segments. However, it has voluntarily included such claims in the non-life segment in the table above.
IFRS 17.C28 b. If an entity has not previously published information about claims development that occurred earlier than five years before the end of the year in which it first applies IFRS 17, then it is not required to disclose this information, in which case it discloses the fact that such information is not disclosed. These illustrative disclosures assume that the Group has previously published claims development information for accident years before 2017.
Intr
oduc
tion
Aud
itor
s’ r
epor
tPr
imar
y st
atem
ents
NO
TE
SFu
rthe
r re
sour
ces
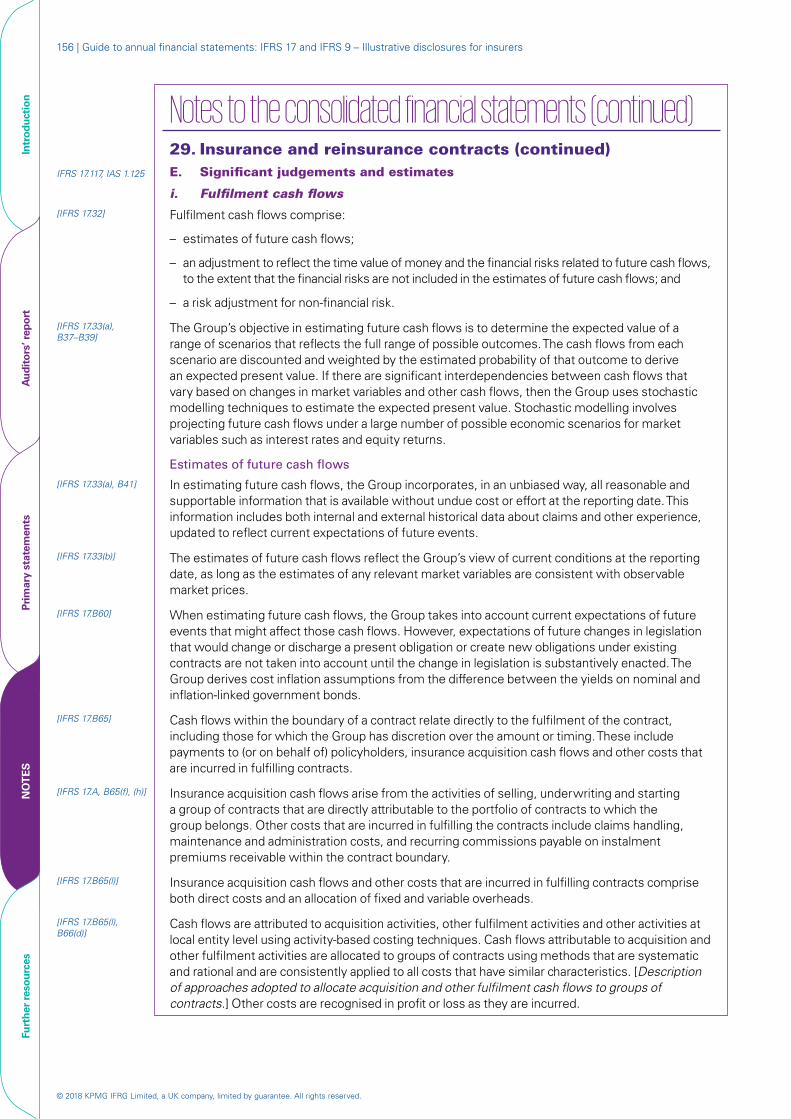
© 2018 KPMG IFRG Limited, a UK company, limited by guarantee. All rights reserved.
156 | Guide to annual financial statements: IFRS 17 and IFRS 9 – Illustrative disclosures for insurers
Notes to the consolidated financial statements (continued)29. Insurance and reinsurance contracts (continued)
IFRS 17.117, IAS 1.125 E. Significant judgements and estimates
i. Fulfilment cash flows[IFRS 17.32] Fulfilment cash flows comprise:
– estimates of future cash flows;
– an adjustment to reflect the time value of money and the financial risks related to future cash flows, to the extent that the financial risks are not included in the estimates of future cash flows; and
– a risk adjustment for non-financial risk.
[IFRS 17.33(a), B37–B39]
The Group’s objective in estimating future cash flows is to determine the expected value of a range of scenarios that reflects the full range of possible outcomes. The cash flows from each scenario are discounted and weighted by the estimated probability of that outcome to derive an expected present value. If there are significant interdependencies between cash flows that vary based on changes in market variables and other cash flows, then the Group uses stochastic modelling techniques to estimate the expected present value. Stochastic modelling involves projecting future cash flows under a large number of possible economic scenarios for market variables such as interest rates and equity returns.
Estimates of future cash flows
[IFRS 17.33(a), B41] In estimating future cash flows, the Group incorporates, in an unbiased way, all reasonable and supportable information that is available without undue cost or effort at the reporting date. This information includes both internal and external historical data about claims and other experience, updated to reflect current expectations of future events.
[IFRS 17.33(b)] The estimates of future cash flows reflect the Group’s view of current conditions at the reporting date, as long as the estimates of any relevant market variables are consistent with observable market prices.
[IFRS 17.B60] When estimating future cash flows, the Group takes into account current expectations of future events that might affect those cash flows. However, expectations of future changes in legislation that would change or discharge a present obligation or create new obligations under existing contracts are not taken into account until the change in legislation is substantively enacted. The Group derives cost inflation assumptions from the difference between the yields on nominal and inflation-linked government bonds.
[IFRS 17.B65] Cash flows within the boundary of a contract relate directly to the fulfilment of the contract, including those for which the Group has discretion over the amount or timing. These include payments to (or on behalf of) policyholders, insurance acquisition cash flows and other costs that are incurred in fulfilling contracts.
[IFRS 17.A, B65(f), (h)] Insurance acquisition cash flows arise from the activities of selling, underwriting and starting a group of contracts that are directly attributable to the portfolio of contracts to which the group belongs. Other costs that are incurred in fulfilling the contracts include claims handling, maintenance and administration costs, and recurring commissions payable on instalment premiums receivable within the contract boundary.
[IFRS 17.B65(l)] Insurance acquisition cash flows and other costs that are incurred in fulfilling contracts comprise both direct costs and an allocation of fixed and variable overheads.
[IFRS 17.B65(l), B66(d)]
Cash flows are attributed to acquisition activities, other fulfilment activities and other activities at local entity level using activity-based costing techniques. Cash flows attributable to acquisition and other fulfilment activities are allocated to groups of contracts using methods that are systematic and rational and are consistently applied to all costs that have similar characteristics. [Description of approaches adopted to allocate acquisition and other fulfilment cash flows to groups of contracts.] Other costs are recognised in profit or loss as they are incurred.
Intr
oduc
tion
Aud
itor
s’ r
epor
tPr
imar
y st
atem
ents
NO
TE
SFu
rthe
r re
sour
ces
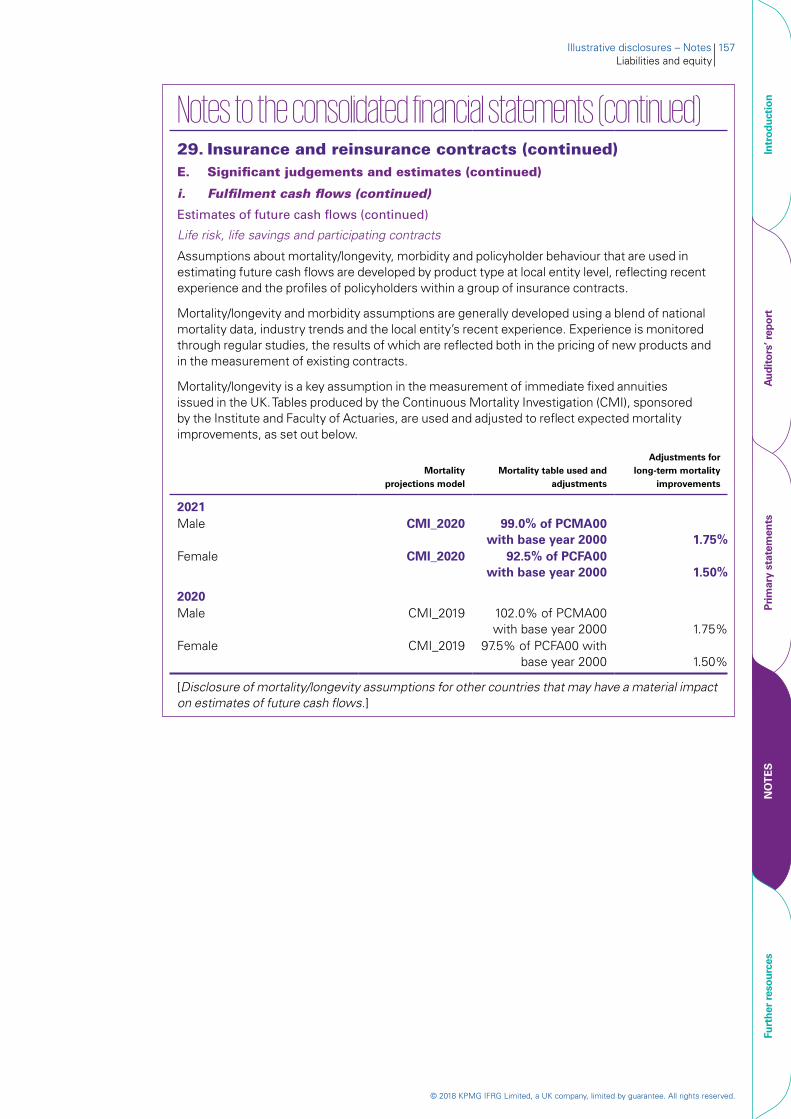
© 2018 KPMG IFRG Limited, a UK company, limited by guarantee. All rights reserved.
Illustrative disclosures – Notes 157Liabilities and equity
Notes to the consolidated financial statements (continued)29. Insurance and reinsurance contracts (continued)E. Significant judgements and estimates (continued)
i. Fulfilment cash flows (continued)
Estimates of future cash flows (continued)
Life risk, life savings and participating contracts
Assumptions about mortality/longevity, morbidity and policyholder behaviour that are used in estimating future cash flows are developed by product type at local entity level, reflecting recent experience and the profiles of policyholders within a group of insurance contracts.
Mortality/longevity and morbidity assumptions are generally developed using a blend of national mortality data, industry trends and the local entity’s recent experience. Experience is monitored through regular studies, the results of which are reflected both in the pricing of new products and in the measurement of existing contracts.
Mortality/longevity is a key assumption in the measurement of immediate fixed annuities issued in the UK. Tables produced by the Continuous Mortality Investigation (CMI), sponsored by the Institute and Faculty of Actuaries, are used and adjusted to reflect expected mortality improvements, as set out below.
Mortality projections model
Mortality table used and adjustments
Adjustments for long-term mortality
improvements
2021Male CMI_2020 99.0% of PCMA00
with base year 2000 1.75%Female CMI_2020 92.5% of PCFA00
with base year 2000 1.50%
2020Male CMI_2019 102.0% of PCMA00
with base year 2000 1.75%Female CMI_2019 97.5% of PCFA00 with
base year 2000 1.50%
[Disclosure of mortality/longevity assumptions for other countries that may have a material impact on estimates of future cash flows.]
Intr
oduc
tion
Aud
itor
s’ r
epor
tPr
imar
y st
atem
ents
NO
TE
SFu
rthe
r re
sour
ces
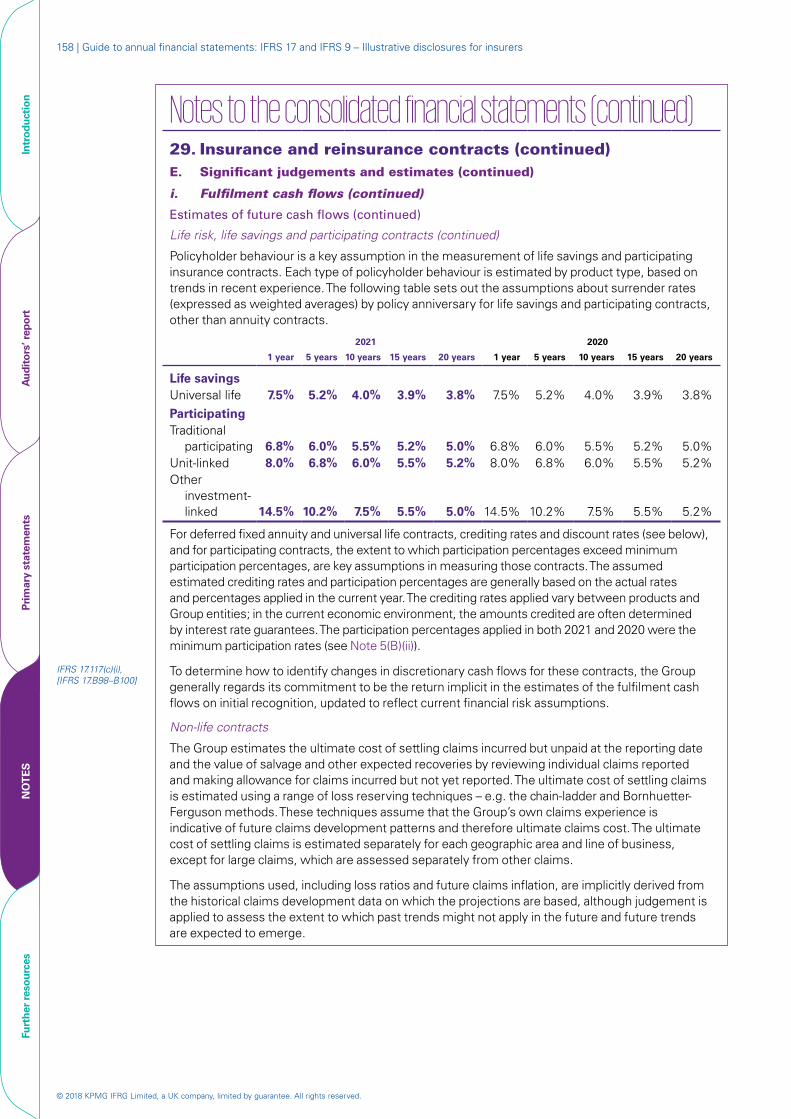
© 2018 KPMG IFRG Limited, a UK company, limited by guarantee. All rights reserved.
158 | Guide to annual financial statements: IFRS 17 and IFRS 9 – Illustrative disclosures for insurers
Notes to the consolidated financial statements (continued)29. Insurance and reinsurance contracts (continued)E. Significant judgements and estimates (continued)
i. Fulfilment cash flows (continued)
Estimates of future cash flows (continued)
Life risk, life savings and participating contracts (continued)
Policyholder behaviour is a key assumption in the measurement of life savings and participating insurance contracts. Each type of policyholder behaviour is estimated by product type, based on trends in recent experience. The following table sets out the assumptions about surrender rates (expressed as weighted averages) by policy anniversary for life savings and participating contracts, other than annuity contracts.
2021 2020
1 year 5 years 10 years 15 years 20 years 1 year 5 years 10 years 15 years 20 years
Life savingsUniversal life 7.5% 5.2% 4.0% 3.9% 3.8% 7.5% 5.2% 4.0% 3.9% 3.8%ParticipatingTraditional
participating 6.8% 6.0% 5.5% 5.2% 5.0% 6.8% 6.0% 5.5% 5.2% 5.0%Unit-linked 8.0% 6.8% 6.0% 5.5% 5.2% 8.0% 6.8% 6.0% 5.5% 5.2%Other
investment-linked 14.5% 10.2% 7.5% 5.5% 5.0% 14.5% 10.2% 7.5% 5.5% 5.2%
For deferred fixed annuity and universal life contracts, crediting rates and discount rates (see below), and for participating contracts, the extent to which participation percentages exceed minimum participation percentages, are key assumptions in measuring those contracts. The assumed estimated crediting rates and participation percentages are generally based on the actual rates and percentages applied in the current year. The crediting rates applied vary between products and Group entities; in the current economic environment, the amounts credited are often determined by interest rate guarantees. The participation percentages applied in both 2021 and 2020 were the minimum participation rates (see Note 5(B)(ii)).
IFRS 17.117(c)(i), [IFRS 17.B98–B100]
To determine how to identify changes in discretionary cash flows for these contracts, the Group generally regards its commitment to be the return implicit in the estimates of the fulfilment cash flows on initial recognition, updated to reflect current financial risk assumptions.
Non-life contracts
The Group estimates the ultimate cost of settling claims incurred but unpaid at the reporting date and the value of salvage and other expected recoveries by reviewing individual claims reported and making allowance for claims incurred but not yet reported. The ultimate cost of settling claims is estimated using a range of loss reserving techniques – e.g. the chain-ladder and Bornhuetter-Ferguson methods. These techniques assume that the Group’s own claims experience is indicative of future claims development patterns and therefore ultimate claims cost. The ultimate cost of settling claims is estimated separately for each geographic area and line of business, except for large claims, which are assessed separately from other claims.
The assumptions used, including loss ratios and future claims inflation, are implicitly derived from the historical claims development data on which the projections are based, although judgement is applied to assess the extent to which past trends might not apply in the future and future trends are expected to emerge.
Intr
oduc
tion
Aud
itor
s’ r
epor
tPr
imar
y st
atem
ents
NO
TE
SFu
rthe
r re
sour
ces
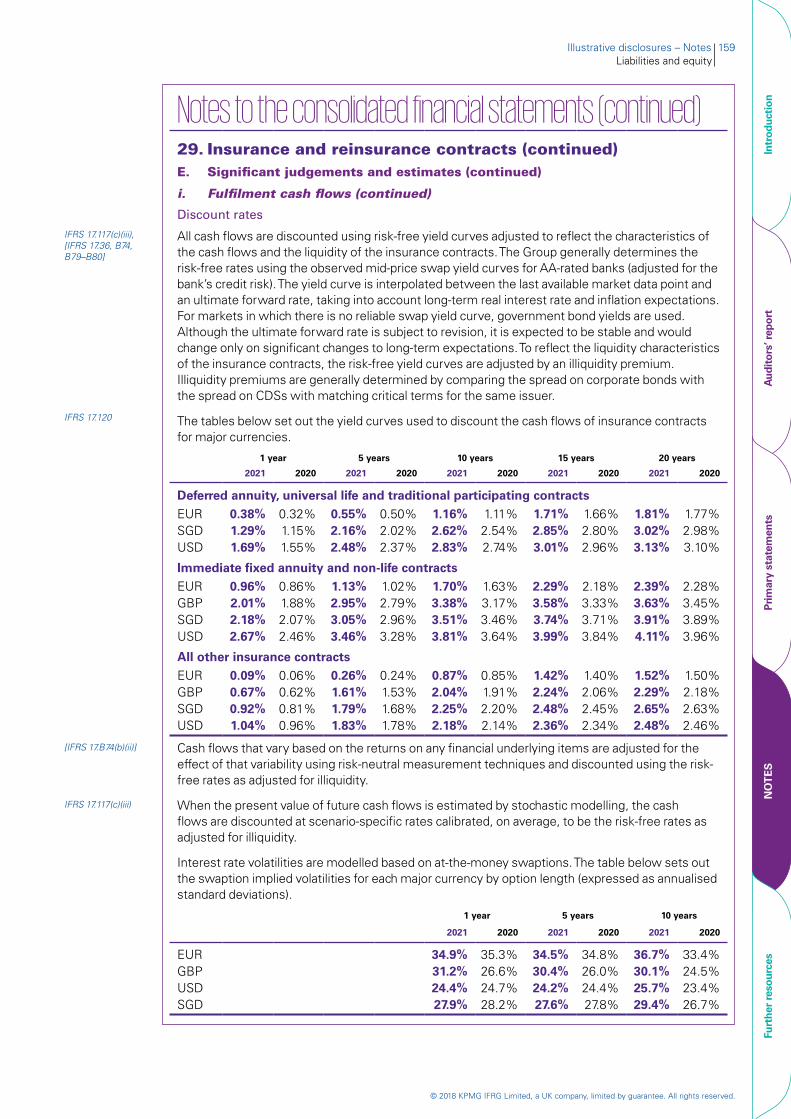
© 2018 KPMG IFRG Limited, a UK company, limited by guarantee. All rights reserved.
Illustrative disclosures – Notes 159Liabilities and equity
Notes to the consolidated financial statements (continued)29. Insurance and reinsurance contracts (continued)E. Significant judgements and estimates (continued)
i. Fulfilment cash flows (continued)
Discount rates
IFRS 17.117(c)(iii), [IFRS 17.36, B74, B79–B80]
All cash flows are discounted using risk-free yield curves adjusted to reflect the characteristics of the cash flows and the liquidity of the insurance contracts. The Group generally determines the risk-free rates using the observed mid-price swap yield curves for AA-rated banks (adjusted for the bank’s credit risk). The yield curve is interpolated between the last available market data point and an ultimate forward rate, taking into account long-term real interest rate and inflation expectations. For markets in which there is no reliable swap yield curve, government bond yields are used. Although the ultimate forward rate is subject to revision, it is expected to be stable and would change only on significant changes to long-term expectations. To reflect the liquidity characteristics of the insurance contracts, the risk-free yield curves are adjusted by an illiquidity premium. Illiquidity premiums are generally determined by comparing the spread on corporate bonds with the spread on CDSs with matching critical terms for the same issuer.
IFRS 17.120 The tables below set out the yield curves used to discount the cash flows of insurance contracts for major currencies.
1 year 5 years 10 years 15 years 20 years
2021 2020 2021 2020 2021 2020 2021 2020 2021 2020
Deferred annuity, universal life and traditional participating contractsEUR 0.38% 0.32% 0.55% 0.50% 1.16% 1.11% 1.71% 1.66% 1.81% 1.77%SGD 1.29% 1.15% 2.16% 2.02% 2.62% 2.54% 2.85% 2.80% 3.02% 2.98%USD 1.69% 1.55% 2.48% 2.37% 2.83% 2.74% 3.01% 2.96% 3.13% 3.10%
Immediate fixed annuity and non-life contractsEUR 0.96% 0.86% 1.13% 1.02% 1.70% 1.63% 2.29% 2.18% 2.39% 2.28%GBP 2.01% 1.88% 2.95% 2.79% 3.38% 3.17% 3.58% 3.33% 3.63% 3.45%SGD 2.18% 2.07% 3.05% 2.96% 3.51% 3.46% 3.74% 3.71% 3.91% 3.89%USD 2.67% 2.46% 3.46% 3.28% 3.81% 3.64% 3.99% 3.84% 4.11% 3.96%
All other insurance contractsEUR 0.09% 0.06% 0.26% 0.24% 0.87% 0.85% 1.42% 1.40% 1.52% 1.50%GBP 0.67% 0.62% 1.61% 1.53% 2.04% 1.91% 2.24% 2.06% 2.29% 2.18%SGD 0.92% 0.81% 1.79% 1.68% 2.25% 2.20% 2.48% 2.45% 2.65% 2.63%USD 1.04% 0.96% 1.83% 1.78% 2.18% 2.14% 2.36% 2.34% 2.48% 2.46%
[IFRS 17.B74(b)(ii)] Cash flows that vary based on the returns on any financial underlying items are adjusted for the effect of that variability using risk-neutral measurement techniques and discounted using the risk-free rates as adjusted for illiquidity.
IFRS 17.117(c)(iii) When the present value of future cash flows is estimated by stochastic modelling, the cash flows are discounted at scenario-specific rates calibrated, on average, to be the risk-free rates as adjusted for illiquidity.
Interest rate volatilities are modelled based on at-the-money swaptions. The table below sets out the swaption implied volatilities for each major currency by option length (expressed as annualised standard deviations).
1 year 5 years 10 years
2021 2020 2021 2020 2021 2020
EUR 34.9% 35.3% 34.5% 34.8% 36.7% 33.4%GBP 31.2% 26.6% 30.4% 26.0% 30.1% 24.5%USD 24.4% 24.7% 24.2% 24.4% 25.7% 23.4%SGD 27.9% 28.2% 27.6% 27.8% 29.4% 26.7%
Intr
oduc
tion
Aud
itor
s’ r
epor
tPr
imar
y st
atem
ents
NO
TE
SFu
rthe
r re
sour
ces
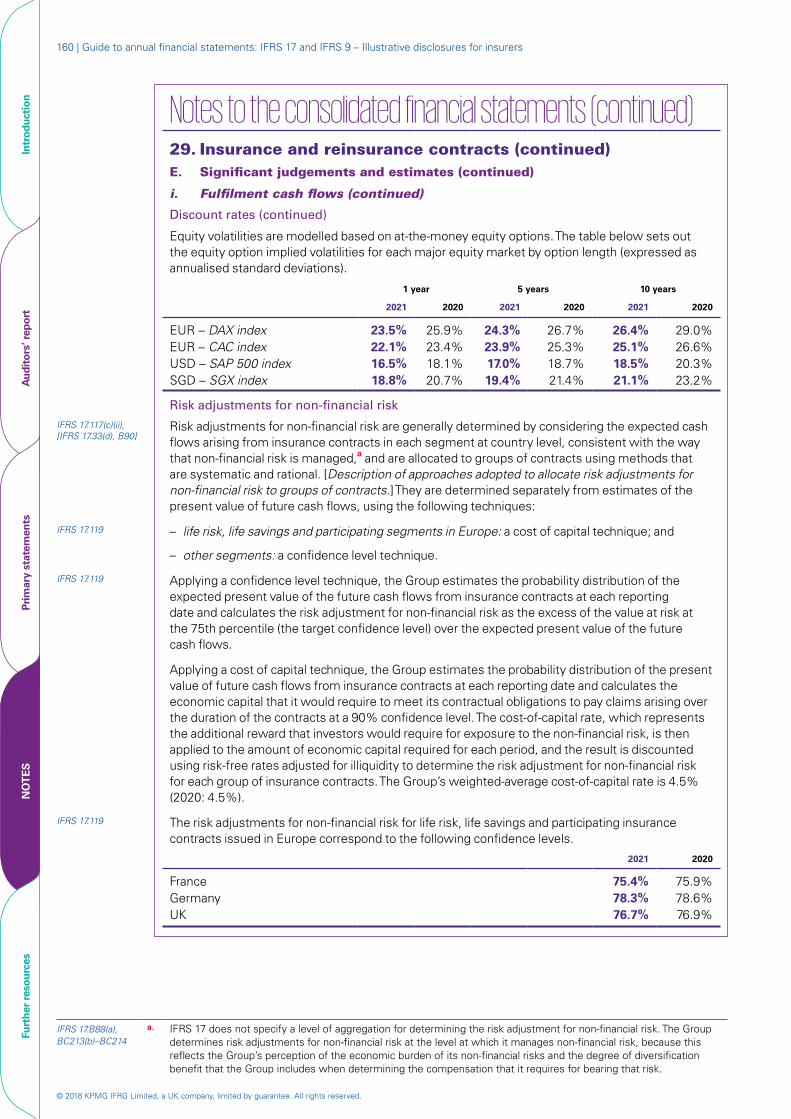
© 2018 KPMG IFRG Limited, a UK company, limited by guarantee. All rights reserved.
160 | Guide to annual financial statements: IFRS 17 and IFRS 9 – Illustrative disclosures for insurers
Notes to the consolidated financial statements (continued)29. Insurance and reinsurance contracts (continued)E. Significant judgements and estimates (continued)
i. Fulfilment cash flows (continued)
Discount rates (continued)
Equity volatilities are modelled based on at-the-money equity options. The table below sets out the equity option implied volatilities for each major equity market by option length (expressed as annualised standard deviations).
1 year 5 years 10 years
2021 2020 2021 2020 2021 2020
EUR – DAX index 23.5% 25.9% 24.3% 26.7% 26.4% 29.0%EUR – CAC index 22.1% 23.4% 23.9% 25.3% 25.1% 26.6%USD – SAP 500 index 16.5% 18.1% 17.0% 18.7% 18.5% 20.3%SGD – SGX index 18.8% 20.7% 19.4% 21.4% 21.1% 23.2%
Risk adjustments for non-financial risk
IFRS 17.117(c)(ii), [IFRS 17.33(d), B90]
Risk adjustments for non-financial risk are generally determined by considering the expected cash flows arising from insurance contracts in each segment at country level, consistent with the way that non-financial risk is managed,a and are allocated to groups of contracts using methods that are systematic and rational. [Description of approaches adopted to allocate risk adjustments for non-financial risk to groups of contracts.] They are determined separately from estimates of the present value of future cash flows, using the following techniques:
IFRS 17.119 – life risk, life savings and participating segments in Europe: a cost of capital technique; and
– other segments: a confidence level technique.
IFRS 17.119 Applying a confidence level technique, the Group estimates the probability distribution of the expected present value of the future cash flows from insurance contracts at each reporting date and calculates the risk adjustment for non-financial risk as the excess of the value at risk at the 75th percentile (the target confidence level) over the expected present value of the future cash flows.
Applying a cost of capital technique, the Group estimates the probability distribution of the present value of future cash flows from insurance contracts at each reporting date and calculates the economic capital that it would require to meet its contractual obligations to pay claims arising over the duration of the contracts at a 90% confidence level. The cost-of-capital rate, which represents the additional reward that investors would require for exposure to the non-financial risk, is then applied to the amount of economic capital required for each period, and the result is discounted using risk-free rates adjusted for illiquidity to determine the risk adjustment for non-financial risk for each group of insurance contracts. The Group’s weighted-average cost-of-capital rate is 4.5% (2020: 4.5%).
IFRS 17.119 The risk adjustments for non-financial risk for life risk, life savings and participating insurance contracts issued in Europe correspond to the following confidence levels.
2021 2020
France 75.4% 75.9%Germany 78.3% 78.6%UK 76.7% 76.9%
IFRS 17.B88(a), BC213(b)–BC214
a. IFRS 17 does not specify a level of aggregation for determining the risk adjustment for non-financial risk. The Group determines risk adjustments for non-financial risk at the level at which it manages non-financial risk, because this reflects the Group’s perception of the economic burden of its non-financial risks and the degree of diversification benefit that the Group includes when determining the compensation that it requires for bearing that risk.
Intr
oduc
tion
Aud
itor
s’ r
epor
tPr
imar
y st
atem
ents
NO
TE
SFu
rthe
r re
sour
ces

© 2018 KPMG IFRG Limited, a UK company, limited by guarantee. All rights reserved.
Illustrative disclosures – Notes 161Liabilities and equity
Notes to the consolidated financial statements (continued)29. Insurance and reinsurance contracts (continued)E. Significant judgements and estimates (continued)
ii. Contractual service margin[IFRS 17.B119] The CSM of a group of insurance contracts is recognised as insurance revenue in each period
based on the number of coverage units provided in the period (see Note 44(E)(viii)), which is determined by considering for each contract the quantity of the benefits provided and its expected coverage duration.
[Disclosure of basis for determining quantity of benefits provided by product.]a
An analysis of the expected timing of the allocation of the CSM to profit or loss is disclosed in (C).
Risk mitigation
[IFRS 17.B116] The Group uses derivatives to mitigate the financial risk arising from interest rate guarantees in traditional participating contracts and equity guarantees in variable annuity contracts. An economic offset exists between the insurance contracts and the derivatives, and credit risk does not dominate the economic offset.
IFRS 17.112, [IFRS 17.B115]
The Group has chosen to recognise changes in its share of the fair value of the underlying items and changes in fulfilment cash flows arising from changes in the effect of financial risk that are mitigated by the use of derivatives in profit or loss and not to adjust the CSM. The adjustment to the CSM that would otherwise have been made in 2021 is an increase of €45 million (2020: increase of €22 million) (see Note 10).
iii. Investment componentsIFRS 17.117(c)(iv), [IFRS 17.85, A]
The Group identifies the investment component of a contract as part of its product governance process by determining the amount that it would be required to repay to the policyholder even if an insured event does not occur. Investment components are excluded from insurance revenue and insurance service expenses.
a. IFRS 17 does not prescribe a method for determining the quantity of benefits provided under each insurance contract. Therefore, management judgement is required to identify the bases that are appropriate for its insurance contracts. For certain types of life insurance contracts, the sum assured may result in an appropriate measure. For other types of contracts, selecting an appropriate measure might not be straightforward.
Intr
oduc
tion
Aud
itor
s’ r
epor
tPr
imar
y st
atem
ents
NO
TE
SFu
rthe
r re
sour
ces
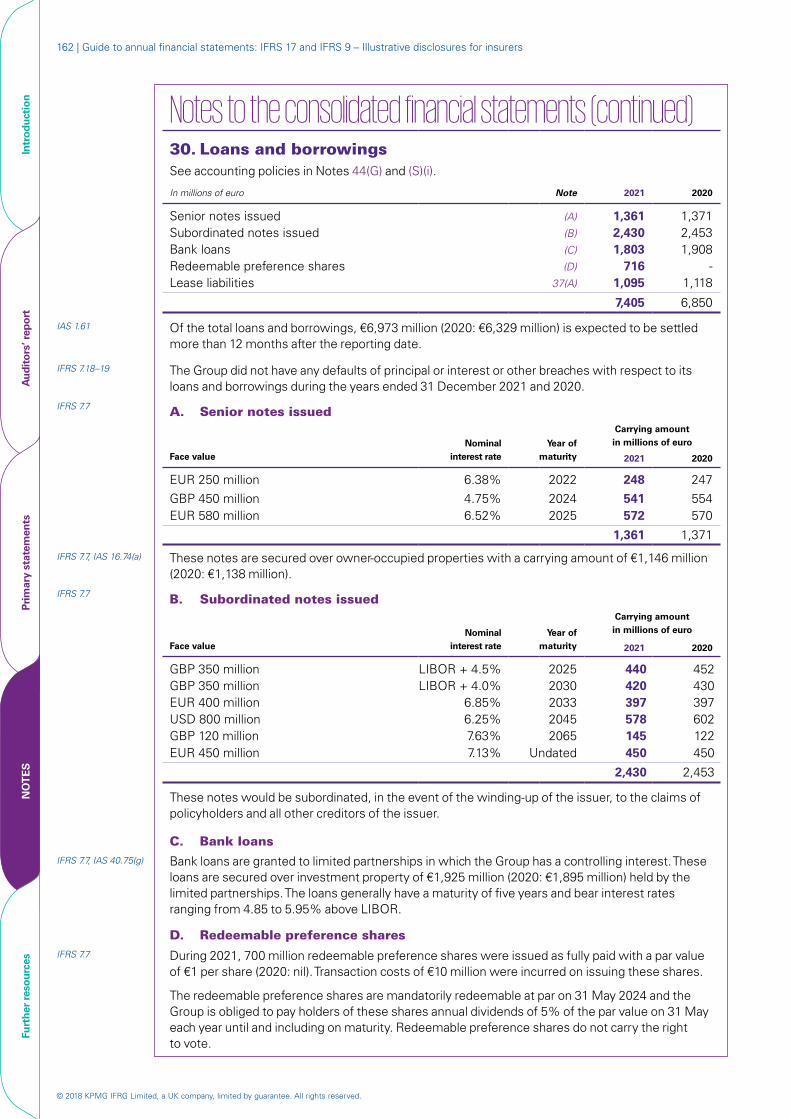
© 2018 KPMG IFRG Limited, a UK company, limited by guarantee. All rights reserved.
162 | Guide to annual financial statements: IFRS 17 and IFRS 9 – Illustrative disclosures for insurers
Notes to the consolidated financial statements (continued) 30. Loans and borrowingsSee accounting policies in Notes 44(G) and (S)(i).
In millions of euro Note 2021 2020
Senior notes issued (A) 1,361 1,371Subordinated notes issued (B) 2,430 2,453Bank loans (C) 1,803 1,908Redeemable preference shares (D) 716 -Lease liabilities 37(A) 1,095 1,118
7,405 6,850
IAS 1.61 Of the total loans and borrowings, €6,973 million (2020: €6,329 million) is expected to be settled more than 12 months after the reporting date.
IFRS 7.18–19 The Group did not have any defaults of principal or interest or other breaches with respect to its loans and borrowings during the years ended 31 December 2021 and 2020.
IFRS 7.7 A. Senior notes issued
Nominal interest rate
Year of maturity
Carrying amount in millions of euro
Face value 2021 2020
EUR 250 million 6.38% 2022 248 247GBP 450 million 4.75% 2024 541 554EUR 580 million 6.52% 2025 572 570
1,361 1,371
IFRS 7.7, IAS 16.74(a) These notes are secured over owner-occupied properties with a carrying amount of €1,146 million (2020: €1,138 million).
IFRS 7.7 B. Subordinated notes issued
Nominal interest rate
Year of maturity
Carrying amount in millions of euro
Face value 2021 2020
GBP 350 million LIBOR + 4.5% 2025 440 452GBP 350 million LIBOR + 4.0% 2030 420 430EUR 400 million 6.85% 2033 397 397USD 800 million 6.25% 2045 578 602GBP 120 million 7.63% 2065 145 122EUR 450 million 7.13% Undated 450 450
2,430 2,453
These notes would be subordinated, in the event of the winding-up of the issuer, to the claims of policyholders and all other creditors of the issuer.
C. Bank loansIFRS 7.7, IAS 40.75(g) Bank loans are granted to limited partnerships in which the Group has a controlling interest. These
loans are secured over investment property of €1,925 million (2020: €1,895 million) held by the limited partnerships. The loans generally have a maturity of five years and bear interest rates ranging from 4.85 to 5.95% above LIBOR.
D. Redeemable preference sharesIFRS 7.7 During 2021, 700 million redeemable preference shares were issued as fully paid with a par value
of €1 per share (2020: nil). Transaction costs of €10 million were incurred on issuing these shares.
The redeemable preference shares are mandatorily redeemable at par on 31 May 2024 and the Group is obliged to pay holders of these shares annual dividends of 5% of the par value on 31 May each year until and including on maturity. Redeemable preference shares do not carry the right to vote.
Intr
oduc
tion
Aud
itor
s’ r
epor
tPr
imar
y st
atem
ents
NO
TE
SFu
rthe
r re
sour
ces

© 2018 KPMG IFRG Limited, a UK company, limited by guarantee. All rights reserved.
Illustrative disclosures – Notes 163Liabilities and equity
Notes to the consolidated financial statements (continued) 30. Loans and borrowings (continued)
IAS 7.44A–44D E. Reconciliation of movements of liabilities to cash flows arising from financing activitiesa
In millions of euroNotes and
loans issued
Redeemable preference
sharesLease
liabilities Total
Balance at 1 January 2020 5,769 - 1,148 6,917
IAS 7.44B(a) Changes from financing cash flowsProceeds from loans and borrowings 397 - - 397Repayment of loans and borrowings (456) - - (456)Payment of lease liabilities - - (353) (353)Interest paid (396) - - (396)
(455) - (353) (808)
IAS 7.44B(c) Effect of movements in exchange rates 28 - 13 41
IAS 7.44B(e) Other changesNew leases and reassessments - - 211 211Interest expense 390 - 99 489
390 - 310 700
Balance at 31 December 2020 5,732 - 1,118 6,850
Balance at 1 January 2021 5,732 - 1,118 6,850
IAS 7.44B(a) Changes from financing cash flowsProceeds from issue of redeemable
preference shares - 700 - 700Proceeds from loans and borrowings 145 - - 145Transaction costs related to redeemable
preference shares - (10) - (10)Repayment of loans and borrowings (122) - - (122)Payment of lease liabilities - - (363) (363)Interest paid (427) - - (427)
(404) 690 (363) (77)IAS 7.44B(b) Changes arising from obtaining or
losing control of subsidiaries or other businesses (108) - - (108)
IAS 7.44B(c) Effect of movements in exchange rates (17) - (10) (27)
IAS 7.44B(e) Other changesNew leases and reassessments - - 250 250Interest expense 391 26 100 517
391 26 350 767
Balance at 31 December 2021 5,594 716 1,095 7,405
IAS 7.44D a. One possible format to meet the disclosure requirement in paragraph 44A of IAS 7 is a reconciliation between the opening balances and the closing balances for liabilities arising from financing activities. Other presentations are possible.
Intr
oduc
tion
Aud
itor
s’ r
epor
tPr
imar
y st
atem
ents
NO
TE
SFu
rthe
r re
sour
ces
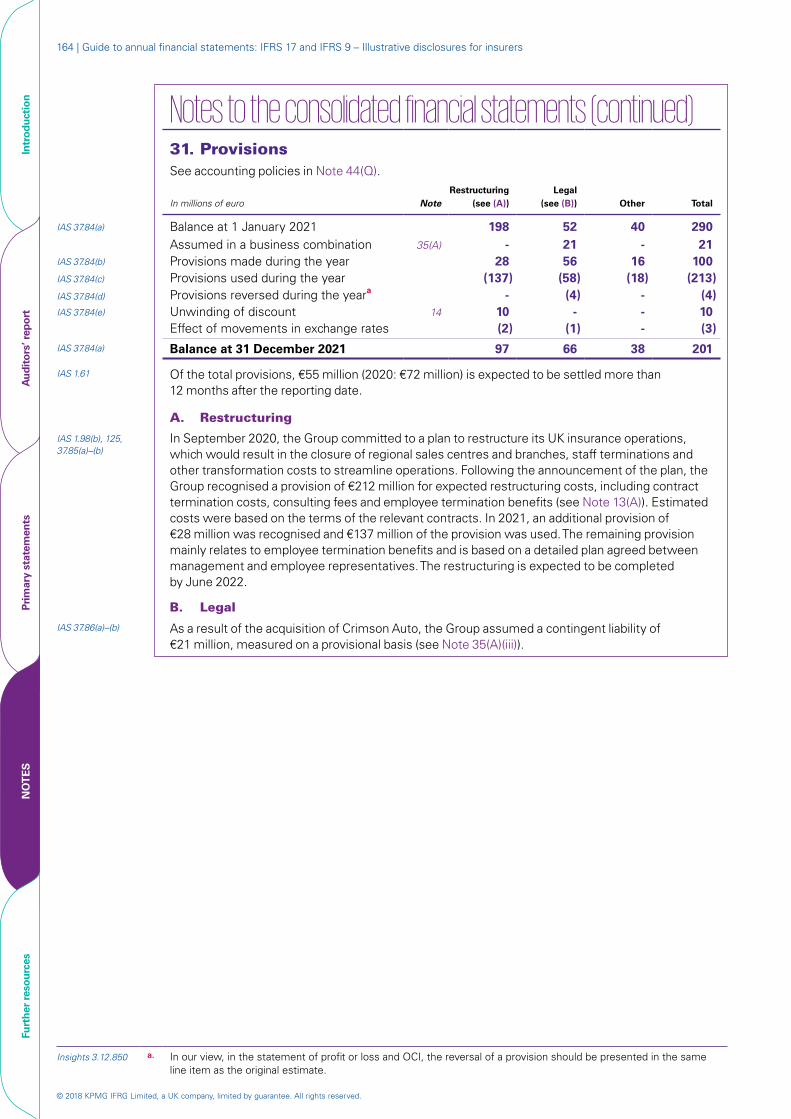
© 2018 KPMG IFRG Limited, a UK company, limited by guarantee. All rights reserved.
164 | Guide to annual financial statements: IFRS 17 and IFRS 9 – Illustrative disclosures for insurers
Notes to the consolidated financial statements (continued)31. ProvisionsSee accounting policies in Note 44(Q).
In millions of euro NoteRestructuring
(see (A))Legal
(see (B)) Other Total
IAS 37.84(a) Balance at 1 January 2021 198 52 40 290Assumed in a business combination 35(A) - 21 - 21
IAS 37.84(b) Provisions made during the year 28 56 16 100IAS 37.84(c) Provisions used during the year (137) (58) (18) (213)IAS 37.84(d) Provisions reversed during the yeara - (4) - (4)IAS 37.84(e) Unwinding of discount 14 10 - - 10
Effect of movements in exchange rates (2) (1) - (3)IAS 37.84(a) Balance at 31 December 2021 97 66 38 201
IAS 1.61 Of the total provisions, €55 million (2020: €72 million) is expected to be settled more than 12 months after the reporting date.
A. Restructuring
IAS 1.98(b), 125, 37.85(a)–(b)
In September 2020, the Group committed to a plan to restructure its UK insurance operations, which would result in the closure of regional sales centres and branches, staff terminations and other transformation costs to streamline operations. Following the announcement of the plan, the Group recognised a provision of €212 million for expected restructuring costs, including contract termination costs, consulting fees and employee termination benefits (see Note 13(A)). Estimated costs were based on the terms of the relevant contracts. In 2021, an additional provision of €28 million was recognised and €137 million of the provision was used. The remaining provision mainly relates to employee termination benefits and is based on a detailed plan agreed between management and employee representatives. The restructuring is expected to be completed by June 2022.
B. Legal
IAS 37.86(a)–(b) As a result of the acquisition of Crimson Auto, the Group assumed a contingent liability of €21 million, measured on a provisional basis (see Note 35(A)(iii)).
Insights 3.12.850 a. In our view, in the statement of profit or loss and OCI, the reversal of a provision should be presented in the same line item as the original estimate.
Intr
oduc
tion
Aud
itor
s’ r
epor
tPr
imar
y st
atem
ents
NO
TE
SFu
rthe
r re
sour
ces

© 2018 KPMG IFRG Limited, a UK company, limited by guarantee. All rights reserved.
Illustrative disclosures – Notes 165Liabilities and equity
Notes to the consolidated financial statements (continued)32. Other liabilitiesSee accounting policies in Notes 44(F) and (K).
In millions of euro Note 2021 2020
Deferred revenue – up-front fees for investment management servicesa (A) 308 284
Employee benefit liabilities 16 344 328
652 612
A. Deferred revenue – Up-front fees for investment management servicesb In millions of euro 2021 2020
IFRS 15.116(a) Balance at 1 January 284 272IFRS 15.118 Up-front fees received during the year 52 38
Revenue recognised (see Note 11)IFRS 15.116(b), 118 Included in the balance at 1 January (25) (24)IFRS 15.118 For up-front fees received during the year (3) (2)
IFRS 15.116(a) Balance at 31 December 308 284
IFRS 15.120 The following table illustrates when the Group expects to recognise the above balances as revenue.c
In millions of euro 2021 2020
Within one year 24 23One to five years 85 79Five to ten years 90 83More than ten years 109 99
308 284
IFRS 15.105, 109, BC320–BC321
a. IFRS 15 uses the terms ‘contract asset’ and ‘contract liability’ but does not prohibit an entity from using alternative descriptions. Furthermore, it does not specify whether an entity is required to present its contract assets and contract liabilities as separate line items in the statement of financial position. In this guide, contract liabilities are referred to as ‘deferred revenue – up-front fees for investment management services’ and included in ‘other liabilities’. However, other presentations are possible.
IFRS 15.118, BC346 b. Although IFRS 15 does not require a tabular reconciliation of the aggregated contract balances, it requires the explanation of significant changes in the contract asset and contract liability balances during the year to include both qualitative and quantitative information.
IFRS 15.120(b)(i) c. The Group has applied judgement to determine the time bands that would be most appropriate for the duration of the remaining performance obligations.
Intr
oduc
tion
Aud
itor
s’ r
epor
tPr
imar
y st
atem
ents
NO
TE
SFu
rthe
r re
sour
ces
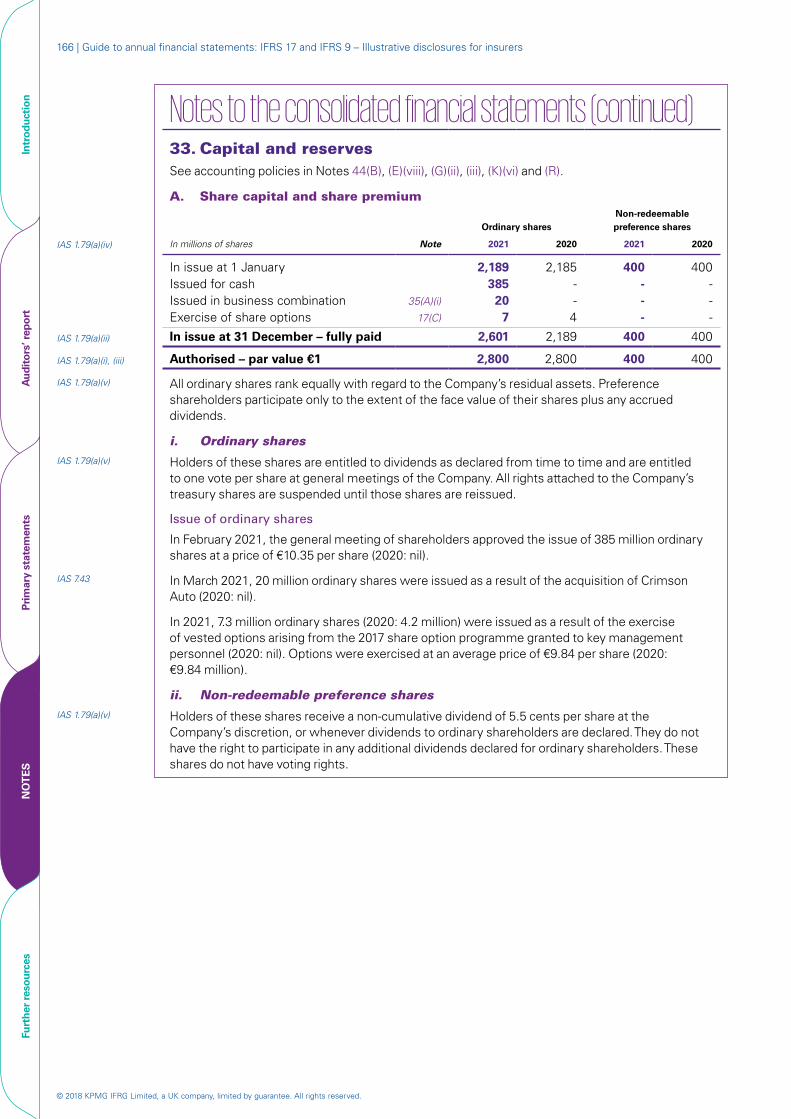
© 2018 KPMG IFRG Limited, a UK company, limited by guarantee. All rights reserved.
166 | Guide to annual financial statements: IFRS 17 and IFRS 9 – Illustrative disclosures for insurers
Notes to the consolidated financial statements (continued)
33. Capital and reservesSee accounting policies in Notes 44(B), (E)(viii), (G)(ii), (iii), (K)(vi) and (R).
A. Share capital and share premium
Ordinary sharesNon-redeemable preference shares
IAS 1.79(a)(iv) In millions of shares Note 2021 2020 2021 2020
In issue at 1 January 2,189 2,185 400 400Issued for cash 385 - - -Issued in business combination 35(A)(i) 20 - - -Exercise of share options 17(C) 7 4 - -
IAS 1.79(a)(ii) In issue at 31 December – fully paid 2,601 2,189 400 400
IAS 1.79(a)(i), (iii) Authorised – par value €1 2,800 2,800 400 400
IAS 1.79(a)(v) All ordinary shares rank equally with regard to the Company’s residual assets. Preference shareholders participate only to the extent of the face value of their shares plus any accrued dividends.
i. Ordinary sharesIAS 1.79(a)(v) Holders of these shares are entitled to dividends as declared from time to time and are entitled
to one vote per share at general meetings of the Company. All rights attached to the Company’s treasury shares are suspended until those shares are reissued.
Issue of ordinary shares
In February 2021, the general meeting of shareholders approved the issue of 385 million ordinary shares at a price of €10.35 per share (2020: nil).
IAS 7.43 In March 2021, 20 million ordinary shares were issued as a result of the acquisition of Crimson Auto (2020: nil).
In 2021, 7.3 million ordinary shares (2020: 4.2 million) were issued as a result of the exercise of vested options arising from the 2017 share option programme granted to key management personnel (2020: nil). Options were exercised at an average price of €9.84 per share (2020: €9.84 million).
ii. Non-redeemable preference sharesIAS 1.79(a)(v) Holders of these shares receive a non-cumulative dividend of 5.5 cents per share at the
Company’s discretion, or whenever dividends to ordinary shareholders are declared. They do not have the right to participate in any additional dividends declared for ordinary shareholders. These shares do not have voting rights.
Intr
oduc
tion
Aud
itor
s’ r
epor
tPr
imar
y st
atem
ents
NO
TE
SFu
rthe
r re
sour
ces
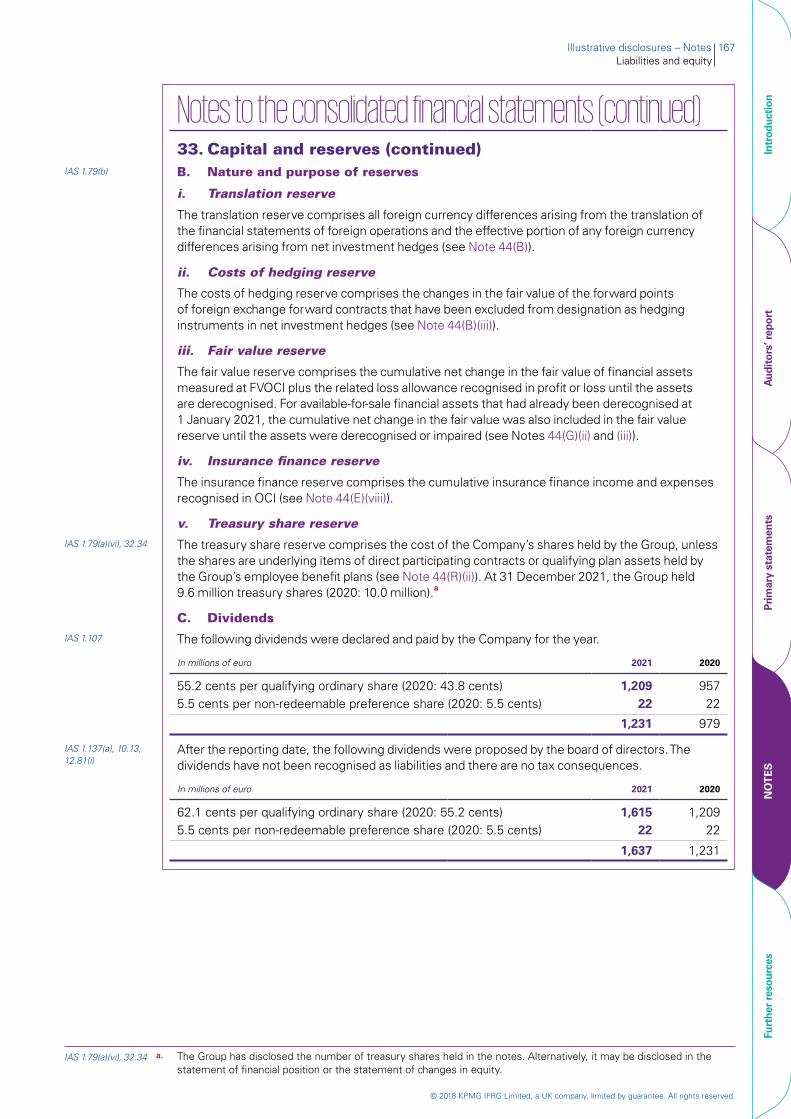
© 2018 KPMG IFRG Limited, a UK company, limited by guarantee. All rights reserved.
Illustrative disclosures – Notes 167Liabilities and equity
Notes to the consolidated financial statements (continued)33. Capital and reserves (continued)
IAS 1.79(b) B. Nature and purpose of reserves
i. Translation reserve
The translation reserve comprises all foreign currency differences arising from the translation of the financial statements of foreign operations and the effective portion of any foreign currency differences arising from net investment hedges (see Note 44(B)).
ii. Costs of hedging reserve
The costs of hedging reserve comprises the changes in the fair value of the forward points of foreign exchange forward contracts that have been excluded from designation as hedging instruments in net investment hedges (see Note 44(B)(iii)).
iii. Fair value reserve
The fair value reserve comprises the cumulative net change in the fair value of financial assets measured at FVOCI plus the related loss allowance recognised in profit or loss until the assets are derecognised. For available-for-sale financial assets that had already been derecognised at 1 January 2021, the cumulative net change in the fair value was also included in the fair value reserve until the assets were derecognised or impaired (see Notes 44(G)(ii) and (iii)).
iv. Insurance finance reserve
The insurance finance reserve comprises the cumulative insurance finance income and expenses recognised in OCI (see Note 44(E)(viii)).
v. Treasury share reserve
IAS 1.79(a)(vi), 32.34 The treasury share reserve comprises the cost of the Company’s shares held by the Group, unless the shares are underlying items of direct participating contracts or qualifying plan assets held by the Group’s employee benefit plans (see Note 44(R)(ii)). At 31 December 2021, the Group held 9.6 million treasury shares (2020: 10.0 million).a
C. Dividends
IAS 1.107 The following dividends were declared and paid by the Company for the year.
In millions of euro 2021 2020
55.2 cents per qualifying ordinary share (2020: 43.8 cents) 1,209 9575.5 cents per non-redeemable preference share (2020: 5.5 cents) 22 22
1,231 979
IAS 1.137(a), 10.13, 12.81(i)
After the reporting date, the following dividends were proposed by the board of directors. The dividends have not been recognised as liabilities and there are no tax consequences.
In millions of euro 2021 2020
62.1 cents per qualifying ordinary share (2020: 55.2 cents) 1,615 1,2095.5 cents per non-redeemable preference share (2020: 5.5 cents) 22 22
1,637 1,231
IAS 1.79(a)(vi), 32.34 a. The Group has disclosed the number of treasury shares held in the notes. Alternatively, it may be disclosed in the statement of financial position or the statement of changes in equity.
Intr
oduc
tion
Aud
itor
s’ r
epor
tPr
imar
y st
atem
ents
NO
TE
SFu
rthe
r re
sour
ces

© 2018 KPMG IFRG Limited, a UK company, limited by guarantee. All rights reserved.
168 | Guide to annual financial statements: IFRS 17 and IFRS 9 – Illustrative disclosures for insurers
Notes to the consolidated financial statements (continued) 33. Capital and reserves (continued)
IAS 1.106(d)(ii), 106A D. OCI accumulated in reserves, net of taxa
Attributable to owners of the Company
In millions of euro
Translation reserve
(see (B)(i))
Costs of hedging reserve
(see (B)(ii))
Fair value reserve
(see (B)(iii))
Insurance finance reserve
(see (B)(iv))Retained earnings
TotalNCI
(see Note 34(C)) Total OCI
2021Items that will not be reclassified to profit or lossDefined benefit liability/asset – remeasurement - - - - 49 49 1 50Equity-accounted investees – share of OCI - - - - 4 4 - 4Items that are or may be reclassified subsequently to profit or lossForeign operations
IAS 21.52(b) Foreign currency translation differences (397) - - - - (397) (9) (406)IAS 21.52(b) Net amount reclassified to profit or loss (13) - - - - (13) - (13)IAS 21.52(b) Net investment hedges – net gain 45 - - - - 45 - 45
Costs of hedgingNet change in fair value - (30) - - - (30) - (30)Net amount reclassified to profit or loss - 18 - - - 18 - 18
Debt investments at FVOCIIFRS 7.20(a)(viii) Net change in fair value - - 2,800 - - 2,800 89 2,889IFRS 7.20(a)(viii) Net amount reclassified to profit or loss - - (1,009) - - (1,009) (58) (1,067)
Finance expenses on insurance contracts - - - (830) - (830) (15) (845)Finance income on reinsurance contracts - - - 4 - 4 1 5 Equity-accounted investees
Share of OCI - - 20 - - 20 - 20Net amount reclassified to profit or loss - - (12) - - (12) - (12)
(365) (12) 1,799 (826) 53 649 9 658
2020 (restated)Items that will not be reclassified to profit or lossDefined benefit liability/asset – remeasurement - - - - (9) (9) (1) (10)Equity-accounted investees – share of OCI - - - - 3 3 - 3Items that are or may be reclassified subsequently to profit or loss
IAS 21.52(b) Foreign operations – foreign currency translation differences 584 - - - - 584 5 589IAS 21.52(b) Net investment hedges – net loss (48) - - - - (48) - (48)
Costs of hedgingNet change in fair value - (10) - - - (10) - (10)Net amount reclassified to profit or loss - 4 - - - 4 - 4
IFRS 7.20(a)(viii) Debt investments at FVOCI – net change in fair value - - 2,004 - - 2,004 56 2,060 Available-for-sale financial assets
Net change in fair value - - 44 - - 44 3 47 Reclassified to profit or loss - - (861) - - (861) (37) (898)
Finance expenses on insurance contracts - (781) - (781) (16) (797)Finance income on reinsurance contracts - - 2 - 2 1 3 Equity-accounted investees – share of OCI - - 13 - - 13 - 13
536 (6) 1,200 (779) (6) 945 11 956
Intr
oduc
tion
Aud
itor
s’ r
epor
tPr
imar
y st
atem
ents
NO
TE
SFu
rthe
r re
sour
ces
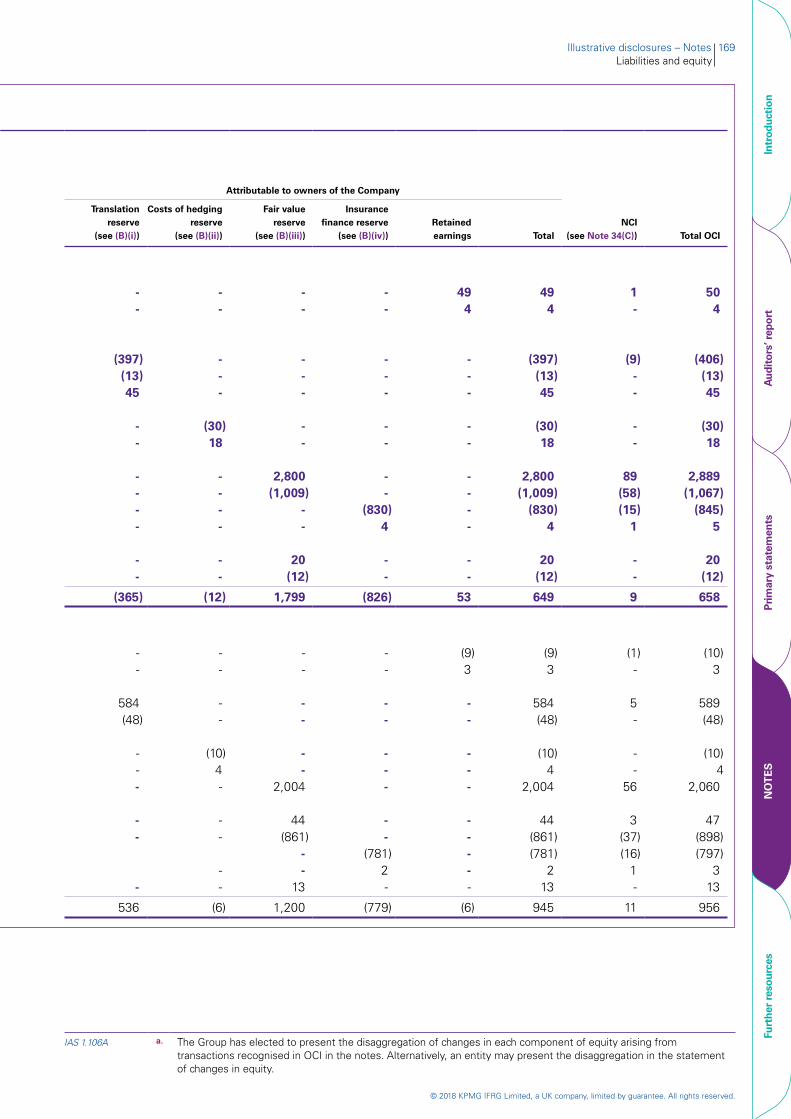
© 2018 KPMG IFRG Limited, a UK company, limited by guarantee. All rights reserved.
Illustrative disclosures – Notes 169Liabilities and equity
Notes to the consolidated financial statements (continued) 33. Capital and reserves (continued)
IAS 1.106(d)(ii), 106A D. OCI accumulated in reserves, net of taxa
Attributable to owners of the Company
Translation reserve
(see (B)(i))
Costs of hedging reserve
(see (B)(ii))
Fair value reserve
(see (B)(iii))
Insurance finance reserve
(see (B)(iv))Retained earnings
TotalNCI
(see Note 34(C)) Total OCI
- - - - 49 49 1 50- - - - 4 4 - 4
(397) - - - - (397) (9) (406) (13) - - - - (13) - (13)
45 - - - - 45 - 45
- (30) - - - (30) - (30)- 18 - - - 18 - 18
- - 2,800 - - 2,800 89 2,889- - (1,009) - - (1,009) (58) (1,067)- - - (830) - (830) (15) (845)- - - 4 - 4 1 5
- - 20 - - 20 - 20- - (12) - - (12) - (12)
(365) (12) 1,799 (826) 53 649 9 658
- - - - (9) (9) (1) (10)- - - - 3 3 - 3
584 - - - - 584 5 589(48) - - - - (48) - (48)
- (10) - - - (10) - (10)- 4 - - - 4 - 4- - 2,004 - - 2,004 56 2,060
- - 44 - - 44 3 47 - - (861) - - (861) (37) (898)
- (781) - (781) (16) (797)- - 2 - 2 1 3
- - 13 - - 13 - 13
536 (6) 1,200 (779) (6) 945 11 956
In millions of euro
2021Items that will not be reclassified to profit or lossDefined benefit liability/asset – remeasurementEquity-accounted investees – share of OCIItems that are or may be reclassified subsequently to profit or lossForeign operations
IAS 21.52(b) Foreign currency translation differencesIAS 21.52(b) Net amount reclassified to profit or lossIAS 21.52(b) Net investment hedges – net gain
Costs of hedgingNet change in fair valueNet amount reclassified to profit or loss
Debt investments at FVOCIIFRS 7.20(a)(viii) Net change in fair valueIFRS 7.20(a)(viii) Net amount reclassified to profit or loss
Finance expenses on insurance contractsFinance income on reinsurance contractsEquity-accounted investees
Share of OCINet amount reclassified to profit or loss
2020 (restated)Items that will not be reclassified to profit or lossDefined benefit liability/asset – remeasurementEquity-accounted investees – share of OCIItems that are or may be reclassified subsequently to profit or loss
IAS 21.52(b) Foreign operations – foreign currency translation differencesIAS 21.52(b) Net investment hedges – net loss
Costs of hedgingNet change in fair valueNet amount reclassified to profit or loss
IFRS 7.20(a)(viii) Debt investments at FVOCI – net change in fair valueAvailable-for-sale financial assets
Net change in fair valueReclassified to profit or loss
Finance expenses on insurance contractsFinance income on reinsurance contractsEquity-accounted investees – share of OCI
IAS 1.106A a. The Group has elected to present the disaggregation of changes in each component of equity arising from transactions recognised in OCI in the notes. Alternatively, an entity may present the disaggregation in the statement of changes in equity.
Intr
oduc
tion
Aud
itor
s’ r
epor
tPr
imar
y st
atem
ents
NO
TE
SFu
rthe
r re
sour
ces
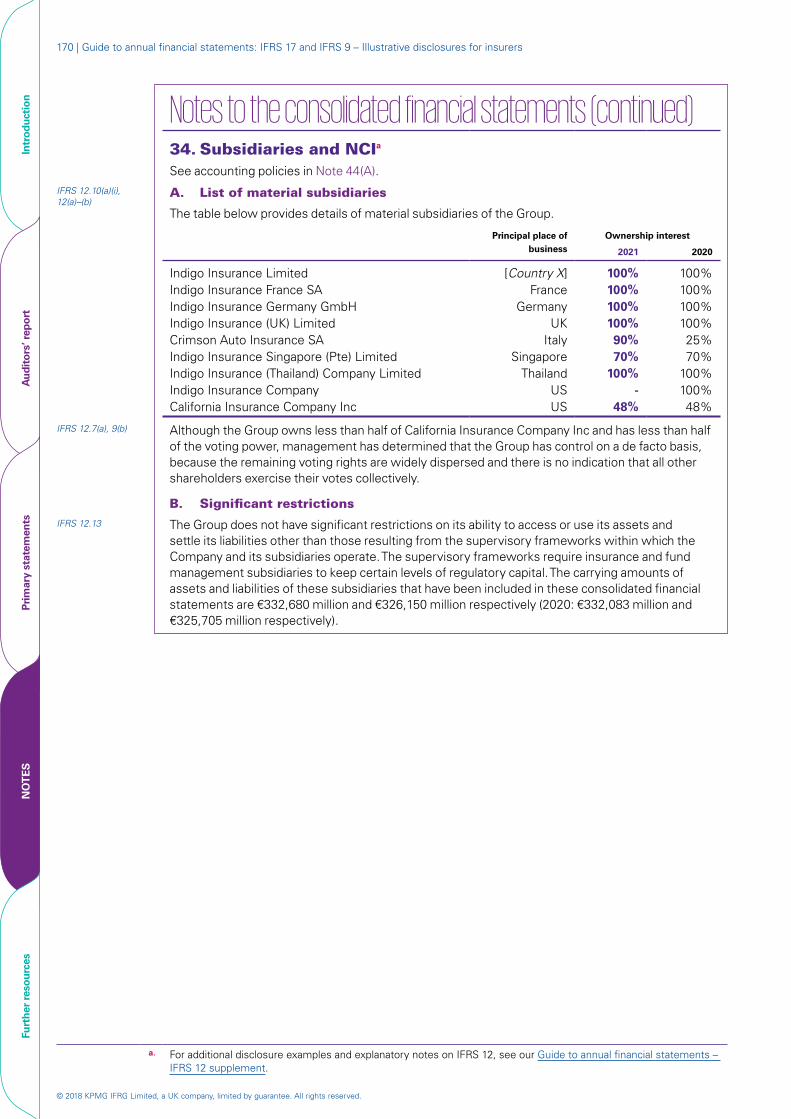
© 2018 KPMG IFRG Limited, a UK company, limited by guarantee. All rights reserved.
170 | Guide to annual financial statements: IFRS 17 and IFRS 9 – Illustrative disclosures for insurers
Notes to the consolidated financial statements (continued)34. Subsidiaries and NCIa See accounting policies in Note 44(A).
IFRS 12.10(a)(i), 12(a)–(b)
A. List of material subsidiaries
The table below provides details of material subsidiaries of the Group.
Principal place of business
Ownership interest
2021 2020
Indigo Insurance Limited [Country X] 100% 100%Indigo Insurance France SA France 100% 100%Indigo Insurance Germany GmbH Germany 100% 100%Indigo Insurance (UK) Limited UK 100% 100%Crimson Auto Insurance SA Italy 90% 25%Indigo Insurance Singapore (Pte) Limited Singapore 70% 70%Indigo Insurance (Thailand) Company Limited Thailand 100% 100%Indigo Insurance Company US - 100%California Insurance Company Inc US 48% 48%
IFRS 12.7(a), 9(b) Although the Group owns less than half of California Insurance Company Inc and has less than half of the voting power, management has determined that the Group has control on a de facto basis, because the remaining voting rights are widely dispersed and there is no indication that all other shareholders exercise their votes collectively.
B. Significant restrictionsIFRS 12.13 The Group does not have significant restrictions on its ability to access or use its assets and
settle its liabilities other than those resulting from the supervisory frameworks within which the Company and its subsidiaries operate. The supervisory frameworks require insurance and fund management subsidiaries to keep certain levels of regulatory capital. The carrying amounts of assets and liabilities of these subsidiaries that have been included in these consolidated financial statements are €332,680 million and €326,150 million respectively (2020: €332,083 million and €325,705 million respectively).
a. For additional disclosure examples and explanatory notes on IFRS 12, see our Guide to annual financial statements – IFRS 12 supplement.
Intr
oduc
tion
Aud
itor
s’ r
epor
tPr
imar
y st
atem
ents
NO
TE
SFu
rthe
r re
sour
ces
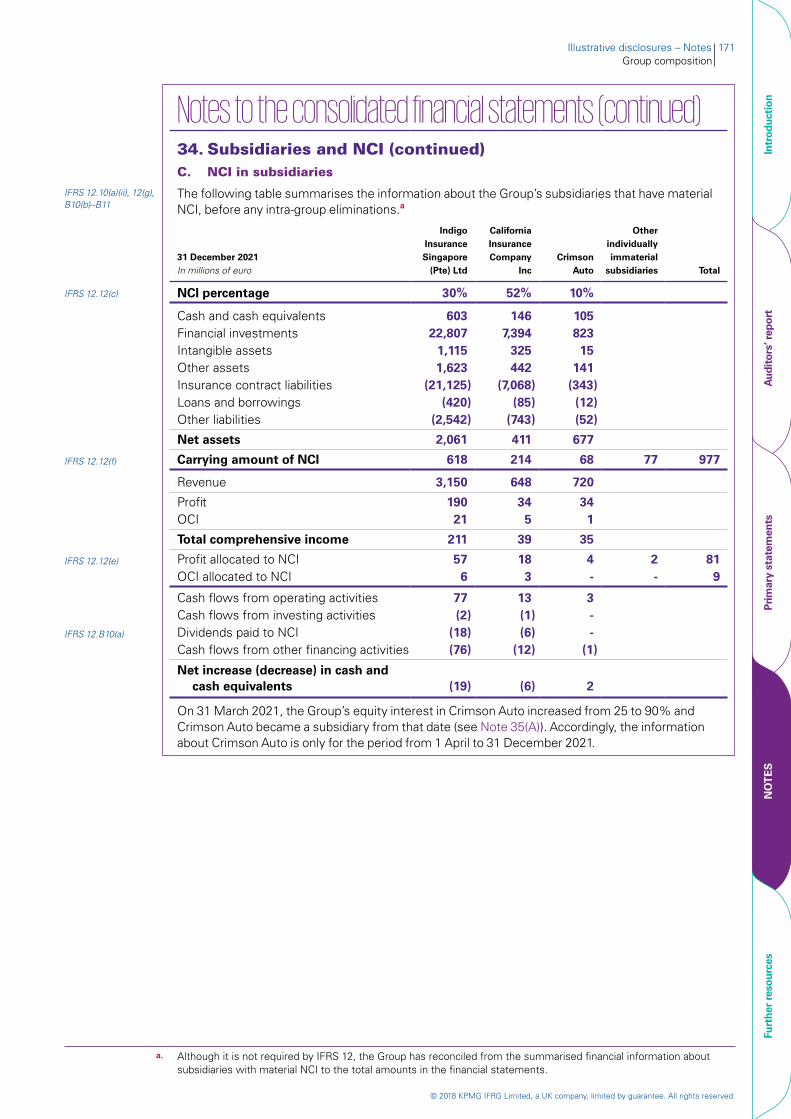
© 2018 KPMG IFRG Limited, a UK company, limited by guarantee. All rights reserved.
Illustrative disclosures – Notes 171Group composition
Notes to the consolidated financial statements (continued)34. Subsidiaries and NCI (continued)C. NCI in subsidiaries
IFRS 12.10(a)(ii), 12(g), B10(b)–B11
The following table summarises the information about the Group’s subsidiaries that have material NCI, before any intra-group eliminations.a
31 December 2021 In millions of euro
Indigo Insurance Singapore
(Pte) Ltd
California Insurance Company
IncCrimson
Auto
Other individually immaterial
subsidiaries Total
IFRS 12.12(c) NCI percentage 30% 52% 10%
Cash and cash equivalents 603 146 105Financial investments 22,807 7,394 823Intangible assets 1,115 325 15Other assets 1,623 442 141Insurance contract liabilities (21,125) (7,068) (343)Loans and borrowings (420) (85) (12)Other liabilities (2,542) (743) (52)
Net assets 2,061 411 677
IFRS 12.12(f) Carrying amount of NCI 618 214 68 77 977
Revenue 3,150 648 720
Profit 190 34 34OCI 21 5 1
Total comprehensive income 211 39 35
IFRS 12.12(e) Profit allocated to NCI 57 18 4 2 81OCI allocated to NCI 6 3 - - 9
Cash flows from operating activities 77 13 3Cash flows from investing activities (2) (1) -
IFRS 12.B10(a) Dividends paid to NCI (18) (6) -Cash flows from other financing activities (76) (12) (1)
Net increase (decrease) in cash and cash equivalents (19) (6) 2
On 31 March 2021, the Group’s equity interest in Crimson Auto increased from 25 to 90% and Crimson Auto became a subsidiary from that date (see Note 35(A)). Accordingly, the information about Crimson Auto is only for the period from 1 April to 31 December 2021.
a. Although it is not required by IFRS 12, the Group has reconciled from the summarised financial information about subsidiaries with material NCI to the total amounts in the financial statements.
Intr
oduc
tion
Aud
itor
s’ r
epor
tPr
imar
y st
atem
ents
NO
TE
SFu
rthe
r re
sour
ces

© 2018 KPMG IFRG Limited, a UK company, limited by guarantee. All rights reserved.
172 | Guide to annual financial statements: IFRS 17 and IFRS 9 – Illustrative disclosures for insurers
Notes to the consolidated financial statements (continued)34. Subsidiaries and NCI (continued)C. NCI in subsidiaries (continued)
31 December 2020 (restated) In millions of euro
Indigo Insurance Singapore
(Pte) Ltd
California Insurance Company
Inc
Other individually immaterial
subsidiaries Total
IFRS 12.12(c) NCI percentage 30% 52%
Cash and cash equivalents 622 152Financial investments 22,783 7,385Intangible assets 1,123 334Other assets 1,530 436Insurance contract liabilities (21,112) (7,059)Loans and borrowings (435) (85)Other liabilities (2,601) (779)
Net assets 1,910 384
IFRS 12.12(f) Carrying amount of NCI 573 200 74 847
Revenue 2,864 596
Profit 136 21OCI 28 5
Total comprehensive income 164 26
IFRS 12.12(e) Profit allocated to NCI 41 11 1 53OCI allocated to NCI 8 3 - 11
Cash flows from operating activities 72 12Cash flows from investing activities 2 (1)
IFRS 12.B10(a) Dividends paid to NCI (16) (5)Cash flows from other financing activities (53) (10)
Net increase (decrease) in cash and cash equivalents 5 (4)
Intr
oduc
tion
Aud
itor
s’ r
epor
tPr
imar
y st
atem
ents
NO
TE
SFu
rthe
r re
sour
ces
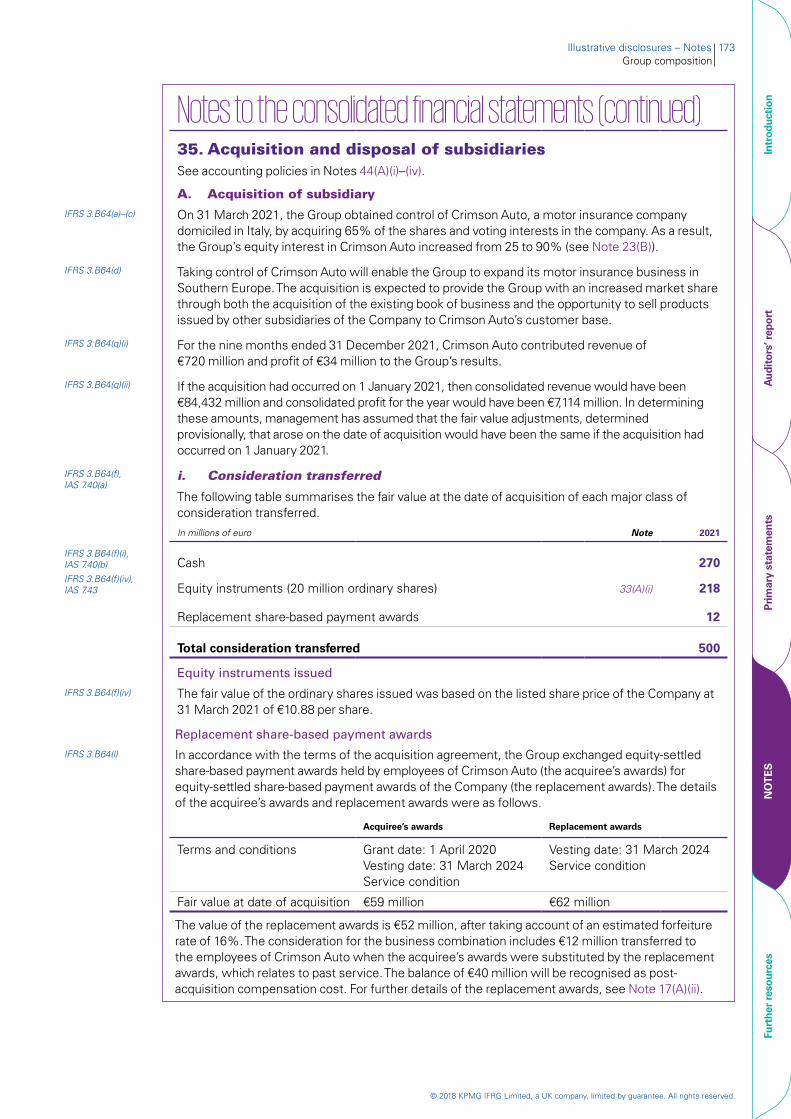
© 2018 KPMG IFRG Limited, a UK company, limited by guarantee. All rights reserved.
Illustrative disclosures – Notes 173Group composition
Notes to the consolidated financial statements (continued)35. Acquisition and disposal of subsidiariesSee accounting policies in Notes 44(A)(i)–(iv).
A. Acquisition of subsidiaryIFRS 3.B64(a)–(c) On 31 March 2021, the Group obtained control of Crimson Auto, a motor insurance company
domiciled in Italy, by acquiring 65% of the shares and voting interests in the company. As a result, the Group’s equity interest in Crimson Auto increased from 25 to 90% (see Note 23(B)).
IFRS 3.B64(d) Taking control of Crimson Auto will enable the Group to expand its motor insurance business in Southern Europe. The acquisition is expected to provide the Group with an increased market share through both the acquisition of the existing book of business and the opportunity to sell products issued by other subsidiaries of the Company to Crimson Auto’s customer base.
IFRS 3.B64(q)(i) For the nine months ended 31 December 2021, Crimson Auto contributed revenue of €720 million and profit of €34 million to the Group’s results.
IFRS 3.B64(q)(ii) If the acquisition had occurred on 1 January 2021, then consolidated revenue would have been €84,432 million and consolidated profit for the year would have been €7,114 million. In determining these amounts, management has assumed that the fair value adjustments, determined provisionally, that arose on the date of acquisition would have been the same if the acquisition had occurred on 1 January 2021.
IFRS 3.B64(f), IAS 7.40(a)
i. Consideration transferred
The following table summarises the fair value at the date of acquisition of each major class of consideration transferred.In millions of euro Note 2021
IFRS 3.B64(f)(i), IAS 7.40(b) Cash 270IFRS 3.B64(f)(iv), IAS 7.43 Equity instruments (20 million ordinary shares) 33(A)(i) 218
Replacement share-based payment awards 12
Total consideration transferred 500
Equity instruments issued
IFRS 3.B64(f)(iv) The fair value of the ordinary shares issued was based on the listed share price of the Company at 31 March 2021 of €10.88 per share.
Replacement share-based payment awards
IFRS 3.B64(l) In accordance with the terms of the acquisition agreement, the Group exchanged equity-settled share-based payment awards held by employees of Crimson Auto (the acquiree’s awards) for equity-settled share-based payment awards of the Company (the replacement awards). The details of the acquiree’s awards and replacement awards were as follows.
Acquiree’s awards Replacement awards
Terms and conditions Grant date: 1 April 2020Vesting date: 31 March 2024Service condition
Vesting date: 31 March 2024Service condition
Fair value at date of acquisition €59 million €62 million
The value of the replacement awards is €52 million, after taking account of an estimated forfeiture rate of 16%. The consideration for the business combination includes €12 million transferred to the employees of Crimson Auto when the acquiree’s awards were substituted by the replacement awards, which relates to past service. The balance of €40 million will be recognised as post-acquisition compensation cost. For further details of the replacement awards, see Note 17(A)(ii).
Intr
oduc
tion
Aud
itor
s’ r
epor
tPr
imar
y st
atem
ents
NO
TE
SFu
rthe
r re
sour
ces
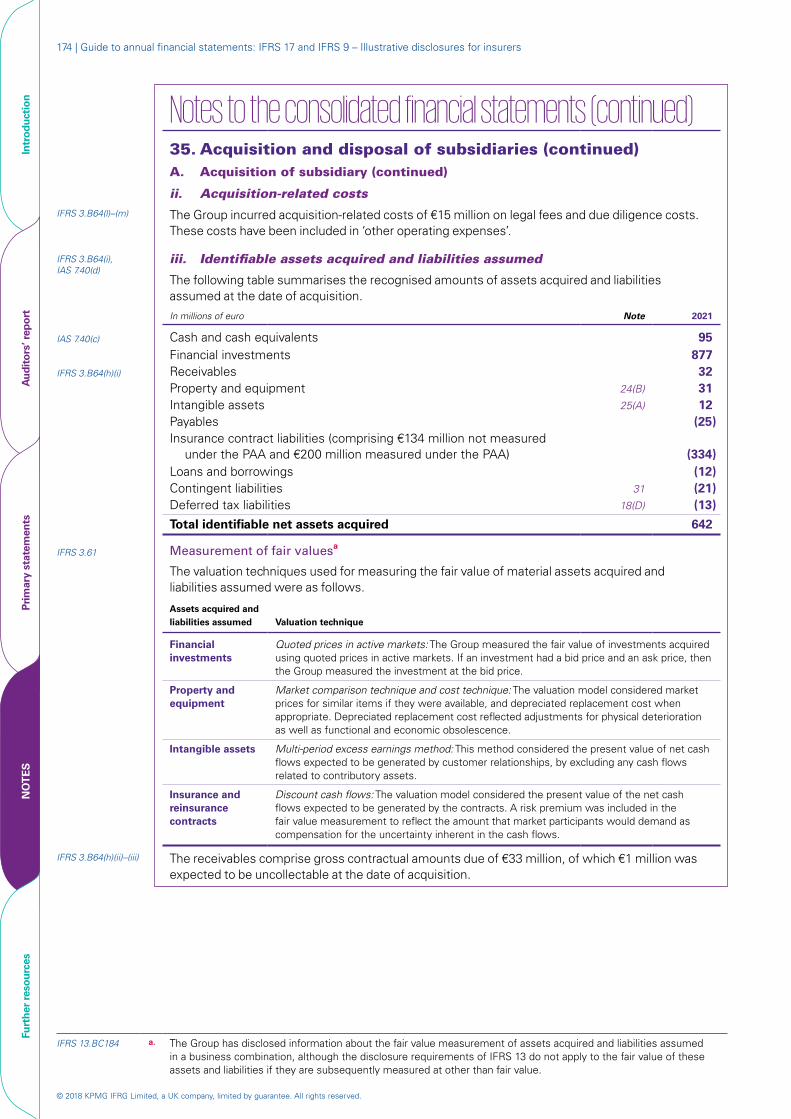
© 2018 KPMG IFRG Limited, a UK company, limited by guarantee. All rights reserved.
174 | Guide to annual financial statements: IFRS 17 and IFRS 9 – Illustrative disclosures for insurers
Notes to the consolidated financial statements (continued)35. Acquisition and disposal of subsidiaries (continued)A. Acquisition of subsidiary (continued)
ii. Acquisition-related costsIFRS 3.B64(l)–(m) The Group incurred acquisition-related costs of €15 million on legal fees and due diligence costs.
These costs have been included in ‘other operating expenses’.
IFRS 3.B64(i), IAS 7.40(d)
iii. Identifiable assets acquired and liabilities assumed
The following table summarises the recognised amounts of assets acquired and liabilities assumed at the date of acquisition.In millions of euro Note 2021
IAS 7.40(c) Cash and cash equivalents 95Financial investments 877
IFRS 3.B64(h)(i) Receivables 32Property and equipment 24(B) 31Intangible assets 25(A) 12Payables (25)Insurance contract liabilities (comprising €134 million not measured
under the PAA and €200 million measured under the PAA) (334)Loans and borrowings (12)Contingent liabilities 31 (21)Deferred tax liabilities 18(D) (13)
Total identifiable net assets acquired 642
IFRS 3.61 Measurement of fair valuesa
The valuation techniques used for measuring the fair value of material assets acquired and liabilities assumed were as follows.
Assets acquired and liabilities assumed Valuation technique
Financial investments
Quoted prices in active markets: The Group measured the fair value of investments acquired using quoted prices in active markets. If an investment had a bid price and an ask price, then the Group measured the investment at the bid price.
Property and equipment
Market comparison technique and cost technique: The valuation model considered market prices for similar items if they were available, and depreciated replacement cost when appropriate. Depreciated replacement cost reflected adjustments for physical deterioration as well as functional and economic obsolescence.
Intangible assets Multi-period excess earnings method: This method considered the present value of net cash flows expected to be generated by customer relationships, by excluding any cash flows related to contributory assets.
Insurance and reinsurance contracts
Discount cash flows: The valuation model considered the present value of the net cash flows expected to be generated by the contracts. A risk premium was included in the fair value measurement to reflect the amount that market participants would demand as compensation for the uncertainty inherent in the cash flows.
IFRS 3.B64(h)(ii)–(iii) The receivables comprise gross contractual amounts due of €33 million, of which €1 million was expected to be uncollectable at the date of acquisition.
IFRS 13.BC184 a. The Group has disclosed information about the fair value measurement of assets acquired and liabilities assumed in a business combination, although the disclosure requirements of IFRS 13 do not apply to the fair value of these assets and liabilities if they are subsequently measured at other than fair value.
Intr
oduc
tion
Aud
itor
s’ r
epor
tPr
imar
y st
atem
ents
NO
TE
SFu
rthe
r re
sour
ces
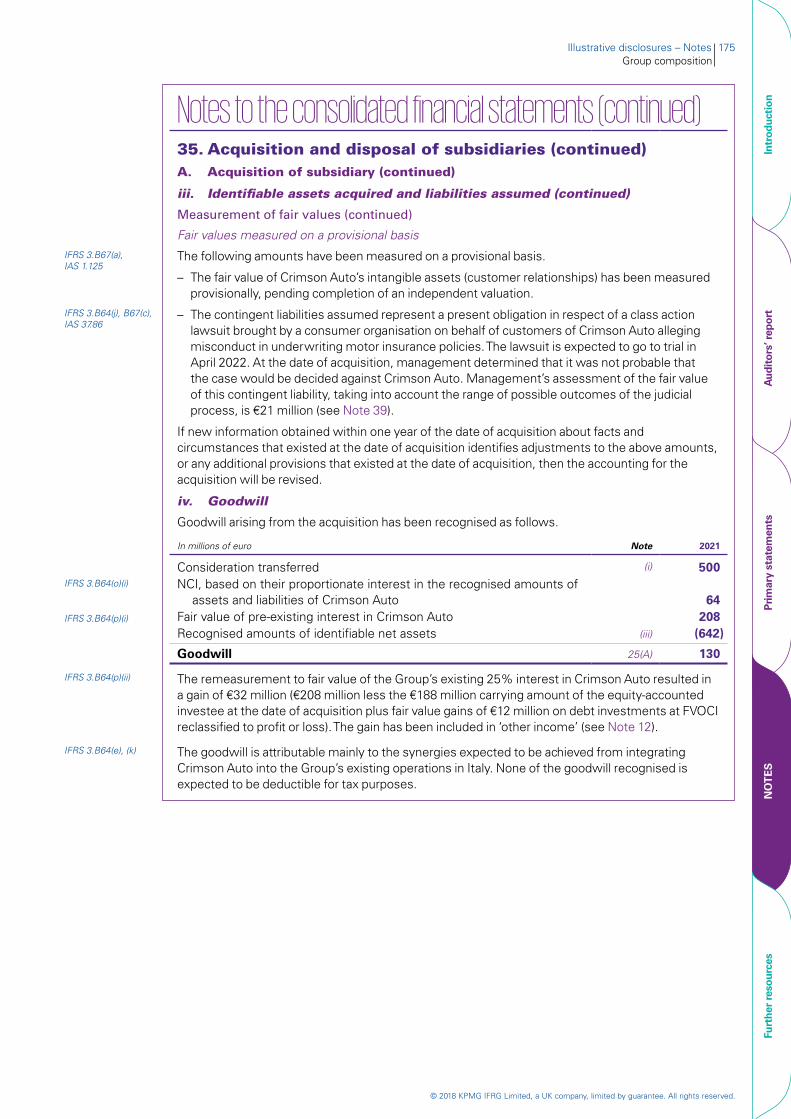
© 2018 KPMG IFRG Limited, a UK company, limited by guarantee. All rights reserved.
Illustrative disclosures – Notes 175Group composition
Notes to the consolidated financial statements (continued)35. Acquisition and disposal of subsidiaries (continued)A. Acquisition of subsidiary (continued)
iii. Identifiable assets acquired and liabilities assumed (continued)
Measurement of fair values (continued)
Fair values measured on a provisional basisIFRS 3.B67(a), IAS 1.125
The following amounts have been measured on a provisional basis.
– The fair value of Crimson Auto’s intangible assets (customer relationships) has been measured provisionally, pending completion of an independent valuation.
IFRS 3.B64(j), B67(c), IAS 37.86
– The contingent liabilities assumed represent a present obligation in respect of a class action lawsuit brought by a consumer organisation on behalf of customers of Crimson Auto alleging misconduct in underwriting motor insurance policies. The lawsuit is expected to go to trial in April 2022. At the date of acquisition, management determined that it was not probable that the case would be decided against Crimson Auto. Management’s assessment of the fair value of this contingent liability, taking into account the range of possible outcomes of the judicial process, is €21 million (see Note 39).
If new information obtained within one year of the date of acquisition about facts and circumstances that existed at the date of acquisition identifies adjustments to the above amounts, or any additional provisions that existed at the date of acquisition, then the accounting for the acquisition will be revised.
iv. Goodwill
Goodwill arising from the acquisition has been recognised as follows.
In millions of euro Note 2021
Consideration transferred (i) 500IFRS 3.B64(o)(i) NCI, based on their proportionate interest in the recognised amounts of
assets and liabilities of Crimson Auto 64IFRS 3.B64(p)(i) Fair value of pre-existing interest in Crimson Auto 208
Recognised amounts of identifiable net assets (iii) (642)
Goodwill 25(A) 130
IFRS 3.B64(p)(ii) The remeasurement to fair value of the Group’s existing 25% interest in Crimson Auto resulted in a gain of €32 million (€208 million less the €188 million carrying amount of the equity-accounted investee at the date of acquisition plus fair value gains of €12 million on debt investments at FVOCI reclassified to profit or loss). The gain has been included in ‘other income’ (see Note 12).
IFRS 3.B64(e), (k) The goodwill is attributable mainly to the synergies expected to be achieved from integrating Crimson Auto into the Group’s existing operations in Italy. None of the goodwill recognised is expected to be deductible for tax purposes.
Intr
oduc
tion
Aud
itor
s’ r
epor
tPr
imar
y st
atem
ents
NO
TE
SFu
rthe
r re
sour
ces
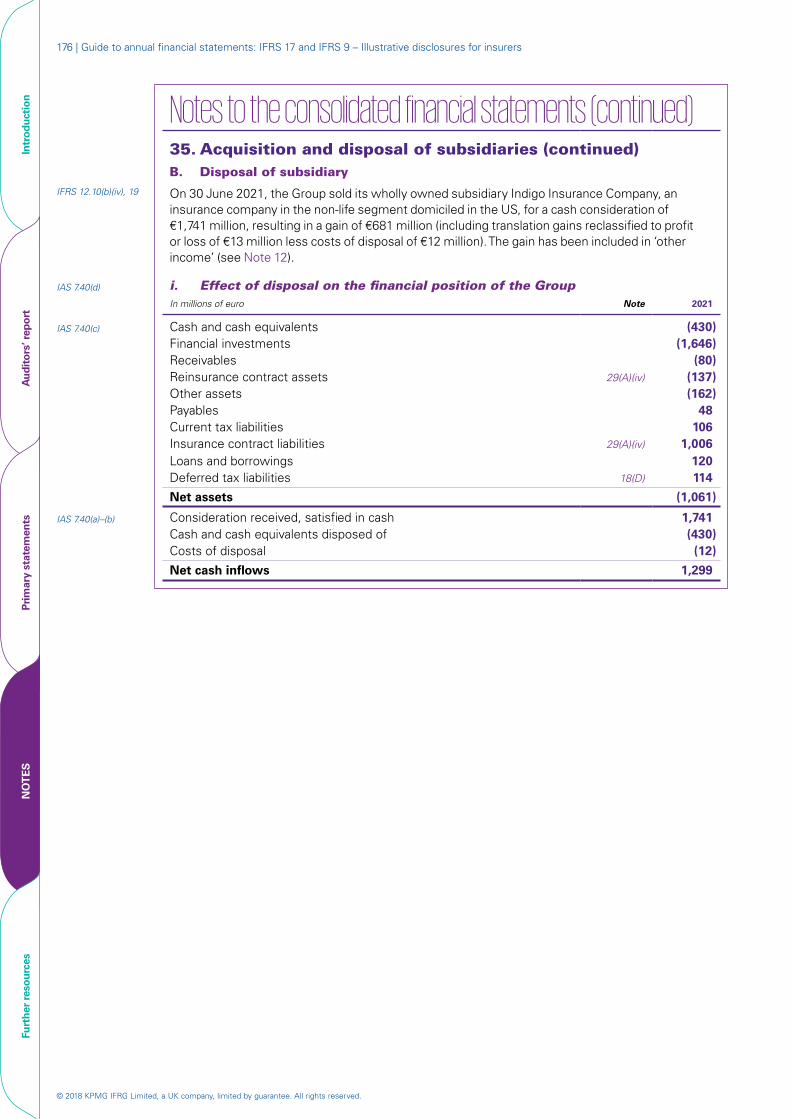
© 2018 KPMG IFRG Limited, a UK company, limited by guarantee. All rights reserved.
176 | Guide to annual financial statements: IFRS 17 and IFRS 9 – Illustrative disclosures for insurers
Notes to the consolidated financial statements (continued)35. Acquisition and disposal of subsidiaries (continued)B. Disposal of subsidiary
IFRS 12.10(b)(iv), 19 On 30 June 2021, the Group sold its wholly owned subsidiary Indigo Insurance Company, an insurance company in the non-life segment domiciled in the US, for a cash consideration of €1,741 million, resulting in a gain of €681 million (including translation gains reclassified to profit or loss of €13 million less costs of disposal of €12 million). The gain has been included in ‘other income’ (see Note 12).
IAS 7.40(d) i. Effect of disposal on the financial position of the GroupIn millions of euro Note 2021
IAS 7.40(c) Cash and cash equivalents (430)Financial investments (1,646)Receivables (80)Reinsurance contract assets 29(A)(iv) (137)Other assets (162)Payables 48Current tax liabilities 106Insurance contract liabilities 29(A)(iv) 1,006Loans and borrowings 120Deferred tax liabilities 18(D) 114
Net assets (1,061)
IAS 7.40(a)–(b) Consideration received, satisfied in cash 1,741Cash and cash equivalents disposed of (430)Costs of disposal (12)
Net cash inflows 1,299
Intr
oduc
tion
Aud
itor
s’ r
epor
tPr
imar
y st
atem
ents
NO
TE
SFu
rthe
r re
sour
ces
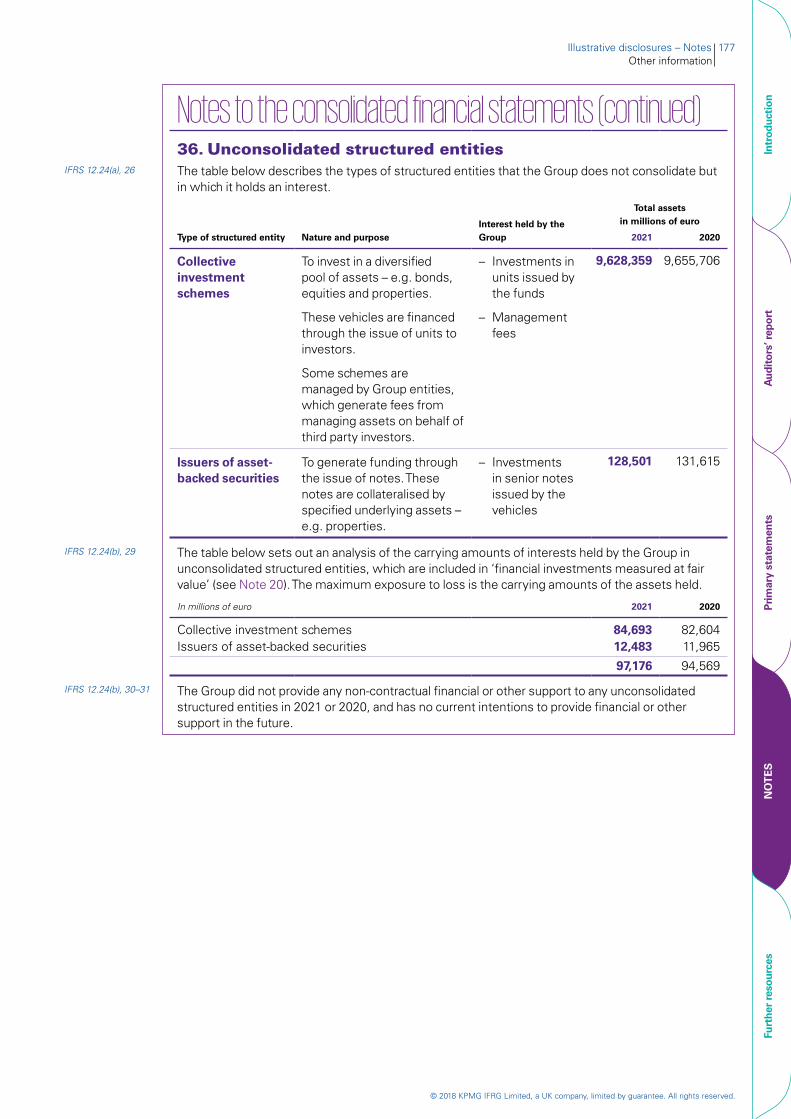
© 2018 KPMG IFRG Limited, a UK company, limited by guarantee. All rights reserved.
Illustrative disclosures – Notes 177Other information
Notes to the consolidated financial statements (continued)36. Unconsolidated structured entities
IFRS 12.24(a), 26 The table below describes the types of structured entities that the Group does not consolidate but in which it holds an interest.
Type of structured entity Nature and purposeInterest held by the Group
Total assets in millions of euro
2021 2020
Collective investment schemes
To invest in a diversified pool of assets – e.g. bonds, equities and properties.
These vehicles are financed through the issue of units to investors.
Some schemes are managed by Group entities, which generate fees from managing assets on behalf of third party investors.
– Investments in units issued by the funds
– Management fees
9,628,359 9,655,706
Issuers of asset-backed securities
To generate funding through the issue of notes. These notes are collateralised by specified underlying assets – e.g. properties.
– Investments in senior notes issued by the vehicles
128,501 131,615
IFRS 12.24(b), 29 The table below sets out an analysis of the carrying amounts of interests held by the Group in unconsolidated structured entities, which are included in ‘financial investments measured at fair value’ (see Note 20). The maximum exposure to loss is the carrying amounts of the assets held.
In millions of euro 2021 2020
Collective investment schemes 84,693 82,604Issuers of asset-backed securities 12,483 11,965
97,176 94,569
IFRS 12.24(b), 30–31 The Group did not provide any non-contractual financial or other support to any unconsolidated structured entities in 2021 or 2020, and has no current intentions to provide financial or other support in the future.
Intr
oduc
tion
Aud
itor
s’ r
epor
tPr
imar
y st
atem
ents
NO
TE
SFu
rthe
r re
sour
ces
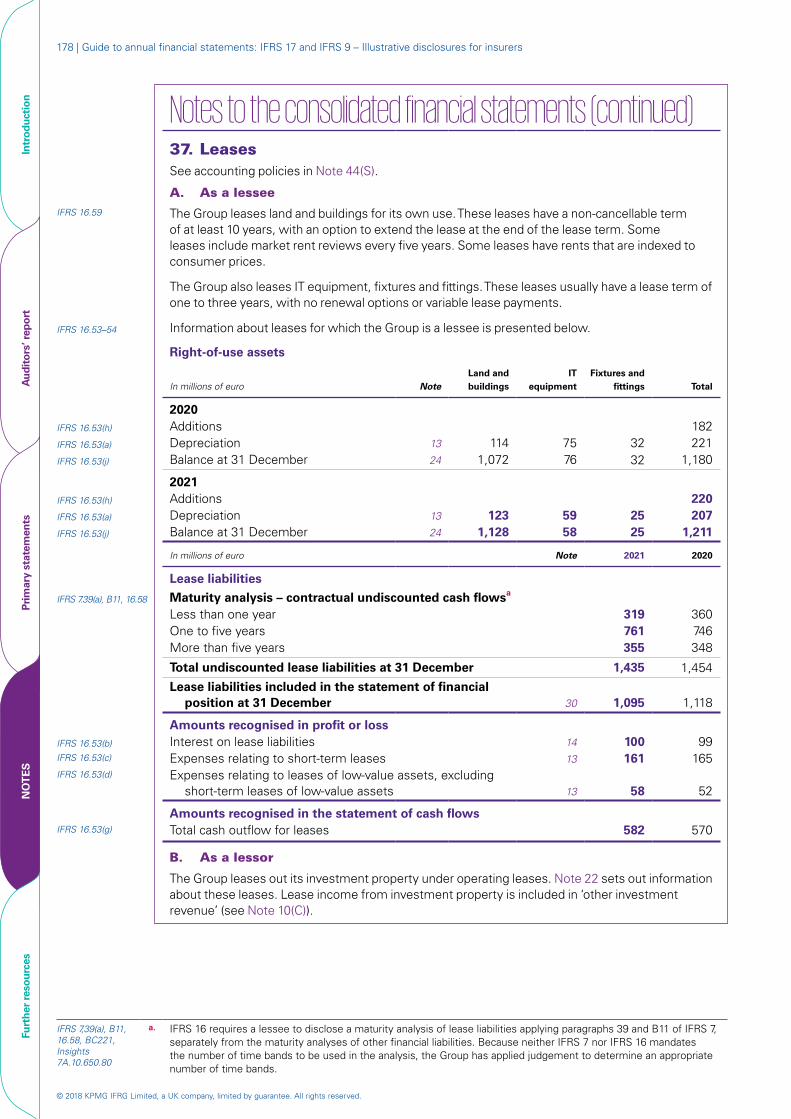
© 2018 KPMG IFRG Limited, a UK company, limited by guarantee. All rights reserved.
178 | Guide to annual financial statements: IFRS 17 and IFRS 9 – Illustrative disclosures for insurers
Notes to the consolidated financial statements (continued)37. LeasesSee accounting policies in Note 44(S).
A. As a lesseeIFRS 16.59 The Group leases land and buildings for its own use. These leases have a non-cancellable term
of at least 10 years, with an option to extend the lease at the end of the lease term. Some leases include market rent reviews every five years. Some leases have rents that are indexed to consumer prices.
The Group also leases IT equipment, fixtures and fittings. These leases usually have a lease term of one to three years, with no renewal options or variable lease payments.
IFRS 16.53–54 Information about leases for which the Group is a lessee is presented below.
Right-of-use assets
In millions of euro NoteLand and buildings
IT equipment
Fixtures and fittings Total
2020IFRS 16.53(h) Additions 182IFRS 16.53(a) Depreciation 13 114 75 32 221IFRS 16.53(j) Balance at 31 December 24 1,072 76 32 1,180
2021IFRS 16.53(h) Additions 220IFRS 16.53(a) Depreciation 13 123 59 25 207IFRS 16.53(j) Balance at 31 December 24 1,128 58 25 1,211
In millions of euro Note 2021 2020
Lease liabilities
IFRS 7.39(a), B11, 16.58 Maturity analysis – contractual undiscounted cash flowsa
Less than one year 319 360One to five years 761 746More than five years 355 348
Total undiscounted lease liabilities at 31 December 1,435 1,454Lease liabilities included in the statement of financial
position at 31 December 30 1,095 1,118
Amounts recognised in profit or lossIFRS 16.53(b) Interest on lease liabilities 14 100 99IFRS 16.53(c) Expenses relating to short-term leases 13 161 165IFRS 16.53(d) Expenses relating to leases of low-value assets, excluding
short-term leases of low-value assets 13 58 52
Amounts recognised in the statement of cash flowsIFRS 16.53(g) Total cash outflow for leases 582 570
B. As a lessor
The Group leases out its investment property under operating leases. Note 22 sets out information about these leases. Lease income from investment property is included in ‘other investment revenue’ (see Note 10(C)).
IFRS 7,39(a), B11, 16.58, BC221, Insights 7A.10.650.80
a. IFRS 16 requires a lessee to disclose a maturity analysis of lease liabilities applying paragraphs 39 and B11 of IFRS 7, separately from the maturity analyses of other financial liabilities. Because neither IFRS 7 nor IFRS 16 mandates the number of time bands to be used in the analysis, the Group has applied judgement to determine an appropriate number of time bands.
Intr
oduc
tion
Aud
itor
s’ r
epor
tPr
imar
y st
atem
ents
NO
TE
SFu
rthe
r re
sour
ces
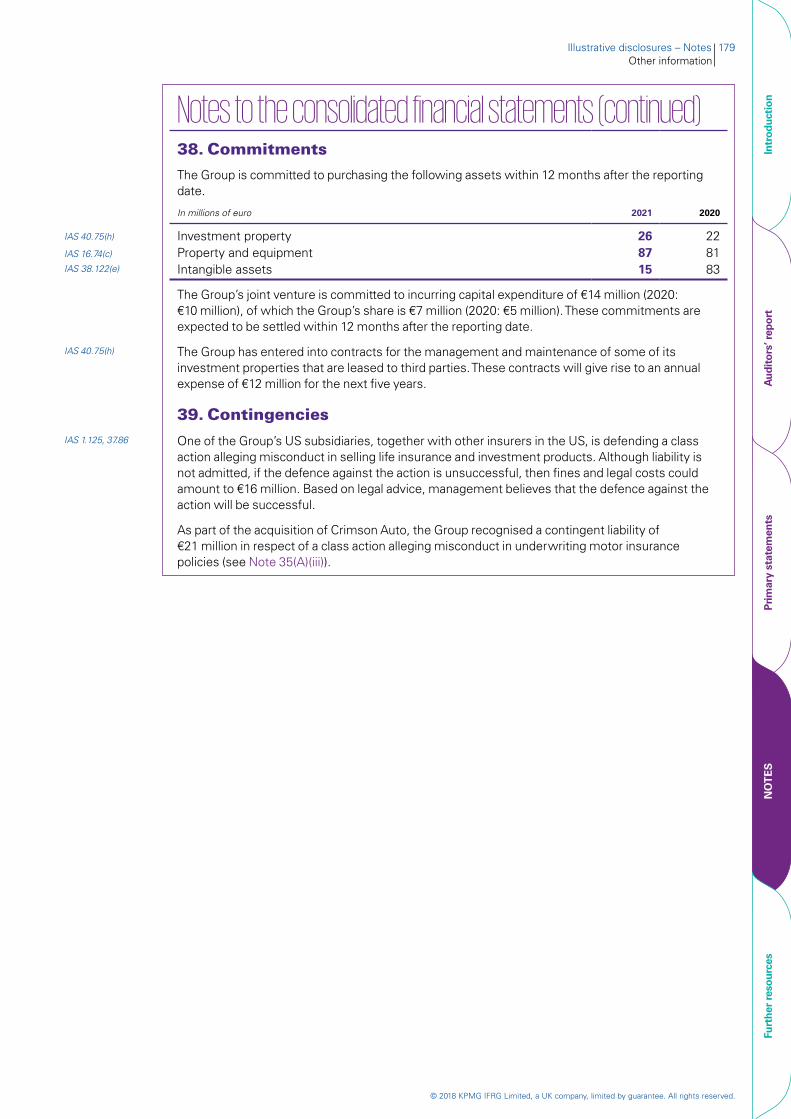
© 2018 KPMG IFRG Limited, a UK company, limited by guarantee. All rights reserved.
Illustrative disclosures – Notes 179Other information
Notes to the consolidated financial statements (continued)38. Commitments
The Group is committed to purchasing the following assets within 12 months after the reporting date.
In millions of euro 2021 2020
IAS 40.75(h) Investment property 26 22IAS 16.74(c) Property and equipment 87 81IAS 38.122(e) Intangible assets 15 83
The Group’s joint venture is committed to incurring capital expenditure of €14 million (2020: €10 million), of which the Group’s share is €7 million (2020: €5 million). These commitments are expected to be settled within 12 months after the reporting date.
IAS 40.75(h) The Group has entered into contracts for the management and maintenance of some of its investment properties that are leased to third parties. These contracts will give rise to an annual expense of €12 million for the next five years.
39. ContingenciesIAS 1.125, 37.86 One of the Group’s US subsidiaries, together with other insurers in the US, is defending a class
action alleging misconduct in selling life insurance and investment products. Although liability is not admitted, if the defence against the action is unsuccessful, then fines and legal costs could amount to €16 million. Based on legal advice, management believes that the defence against the action will be successful.
As part of the acquisition of Crimson Auto, the Group recognised a contingent liability of €21 million in respect of a class action alleging misconduct in underwriting motor insurance policies (see Note 35(A)(iii)).
Intr
oduc
tion
Aud
itor
s’ r
epor
tPr
imar
y st
atem
ents
NO
TE
SFu
rthe
r re
sour
ces
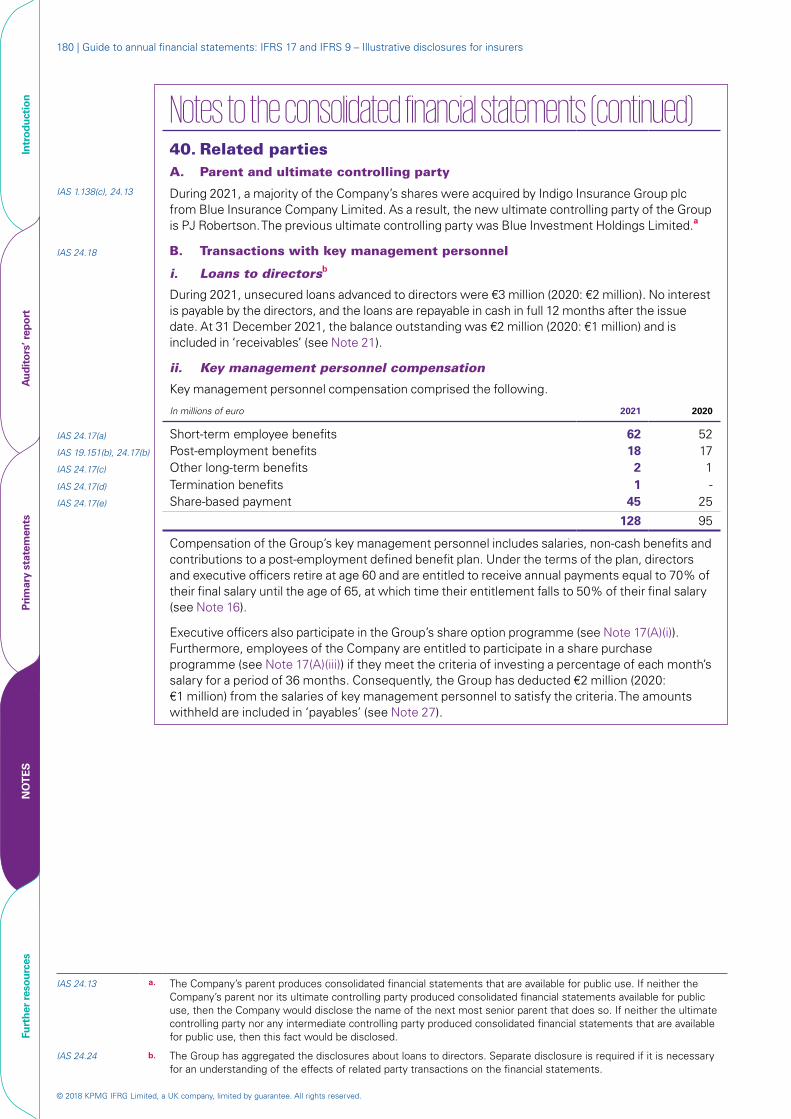
© 2018 KPMG IFRG Limited, a UK company, limited by guarantee. All rights reserved.
180 | Guide to annual financial statements: IFRS 17 and IFRS 9 – Illustrative disclosures for insurers
Notes to the consolidated financial statements (continued)40. Related partiesA. Parent and ultimate controlling party
IAS 1.138(c), 24.13 During 2021, a majority of the Company’s shares were acquired by Indigo Insurance Group plc from Blue Insurance Company Limited. As a result, the new ultimate controlling party of the Group is PJ Robertson. The previous ultimate controlling party was Blue Investment Holdings Limited.a
IAS 24.18 B. Transactions with key management personnel
i. Loans to directorsb
During 2021, unsecured loans advanced to directors were €3 million (2020: €2 million). No interest is payable by the directors, and the loans are repayable in cash in full 12 months after the issue date. At 31 December 2021, the balance outstanding was €2 million (2020: €1 million) and is included in ‘receivables’ (see Note 21).
ii. Key management personnel compensation
Key management personnel compensation comprised the following.
In millions of euro 2021 2020
IAS 24.17(a) Short-term employee benefits 62 52IAS 19.151(b), 24.17(b) Post-employment benefits 18 17IAS 24.17(c) Other long-term benefits 2 1IAS 24.17(d) Termination benefits 1 -IAS 24.17(e) Share-based payment 45 25
128 95
Compensation of the Group’s key management personnel includes salaries, non-cash benefits and contributions to a post-employment defined benefit plan. Under the terms of the plan, directors and executive officers retire at age 60 and are entitled to receive annual payments equal to 70% of their final salary until the age of 65, at which time their entitlement falls to 50% of their final salary (see Note 16).
Executive officers also participate in the Group’s share option programme (see Note 17(A)(i)). Furthermore, employees of the Company are entitled to participate in a share purchase programme (see Note 17(A)(iii)) if they meet the criteria of investing a percentage of each month’s salary for a period of 36 months. Consequently, the Group has deducted €2 million (2020: €1 million) from the salaries of key management personnel to satisfy the criteria. The amounts withheld are included in ‘payables’ (see Note 27).
IAS 24.13 a. The Company’s parent produces consolidated financial statements that are available for public use. If neither the Company’s parent nor its ultimate controlling party produced consolidated financial statements available for public use, then the Company would disclose the name of the next most senior parent that does so. If neither the ultimate controlling party nor any intermediate controlling party produced consolidated financial statements that are available for public use, then this fact would be disclosed.
IAS 24.24 b. The Group has aggregated the disclosures about loans to directors. Separate disclosure is required if it is necessary for an understanding of the effects of related party transactions on the financial statements.
Intr
oduc
tion
Aud
itor
s’ r
epor
tPr
imar
y st
atem
ents
NO
TE
SFu
rthe
r re
sour
ces
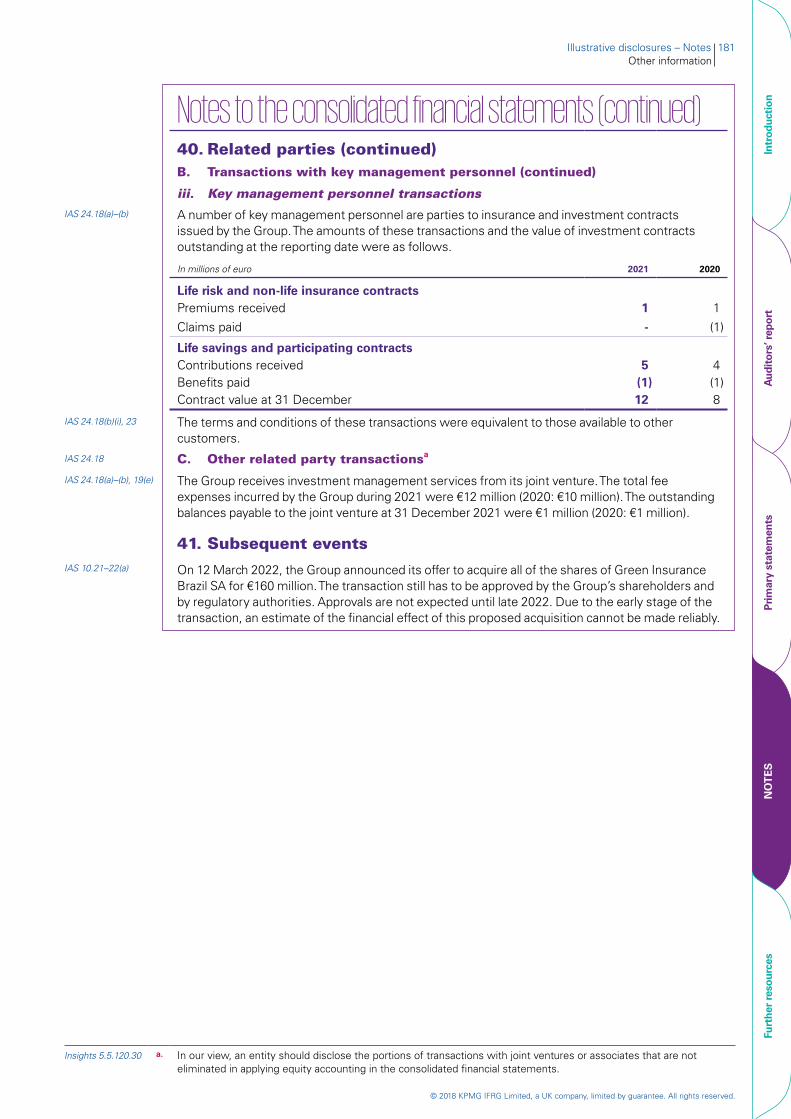
© 2018 KPMG IFRG Limited, a UK company, limited by guarantee. All rights reserved.
Illustrative disclosures – Notes 181Other information
Notes to the consolidated financial statements (continued)40. Related parties (continued)B. Transactions with key management personnel (continued)
iii. Key management personnel transactions
IAS 24.18(a)–(b) A number of key management personnel are parties to insurance and investment contracts issued by the Group. The amounts of these transactions and the value of investment contracts outstanding at the reporting date were as follows.
In millions of euro 2021 2020
Life risk and non-life insurance contractsPremiums received 1 1
Claims paid - (1)
Life savings and participating contractsContributions received 5 4Benefits paid (1) (1)Contract value at 31 December 12 8
IAS 24.18(b)(i), 23 The terms and conditions of these transactions were equivalent to those available to other customers.
IAS 24.18 C. Other related party transactionsa
IAS 24.18(a)–(b), 19(e) The Group receives investment management services from its joint venture. The total fee expenses incurred by the Group during 2021 were €12 million (2020: €10 million). The outstanding balances payable to the joint venture at 31 December 2021 were €1 million (2020: €1 million).
41. Subsequent eventsIAS 10.21–22(a) On 12 March 2022, the Group announced its offer to acquire all of the shares of Green Insurance
Brazil SA for €160 million. The transaction still has to be approved by the Group’s shareholders and by regulatory authorities. Approvals are not expected until late 2022. Due to the early stage of the transaction, an estimate of the financial effect of this proposed acquisition cannot be made reliably.
Insights 5.5.120.30 a. In our view, an entity should disclose the portions of transactions with joint ventures or associates that are not eliminated in applying equity accounting in the consolidated financial statements.
Intr
oduc
tion
Aud
itor
s’ r
epor
tPr
imar
y st
atem
ents
NO
TE
SFu
rthe
r re
sour
ces
© 2018 KPMG IFRG Limited, a UK company, limited by guarantee. All rights reserved.
182 | Guide to annual financial statements: IFRS 17 and IFRS 9 – Illustrative disclosures for insurers
Notes to the consolidated financial statements (continued)42. Basis of measurement
IAS 1.112(a), 117(a) The consolidated financial statements have been prepared on the historical cost basis except for the following items, which are measured on an alternative basis at each reporting date.
Item Measurement basis
Financial instruments at FVTPL, including hedging instruments
Fair value
Financial assets at FVOCI Fair value
Available-for-sale financial assets (derecognised before 1 January 2021)
Fair value
Insurance and reinsurance contracts Fulfilment cash flows and, if any, the CSM
Owner-occupied property at fair value Fair value
Investment property Fair value
Liabilities for cash-settled shared-based payment arrangements
Fair value
Net defined benefit liability (asset) Fair value of plan assets less the present value of the defined benefit obligations, limited as explained in Note 44(K)(ii)
Other impaired non-financial assets Higher of fair value less costs of disposal and value in use
Intr
oduc
tion
Aud
itor
s’ r
epor
tPr
imar
y st
atem
ents
NO
TE
SFu
rthe
r re
sour
ces
© 2018 KPMG IFRG Limited, a UK company, limited by guarantee. All rights reserved.
Illustrative disclosures – Notes 183Accounting policies
Notes to the consolidated financial statements (continued)43. Changes in accounting policiesa
Except for the changes below, the Group has consistently applied the accounting policies as set out in Note 44 to all periods presented in these consolidated financial statements.
The Group has adopted the following new standards, including any consequential amendments to other standards, with a date of initial application of 1 January 2021.
A. IFRS 17 Insurance Contracts.B. IFRS 9 Financial Instruments.
The nature and effects of the key changes in the Group’s accounting policies resulting from its adoption of IFRS 17 and IFRS 9 are summarised below.
IAS 8.28 A. IFRS 17 Insurance Contractsb
i. Recognition, measurement and presentation of insurance contracts
IFRS 17 establishes principles for the recognition, measurement, presentation and disclosure of insurance contracts, reinsurance contracts and investment contracts with discretionary participation features.c It introduces a model that measures groups of contracts based on the Group’s estimates of the present value of future cash flows that are expected to arise as the Group fulfils the contracts, an explicit risk adjustment for non-financial risk and a CSM.
Under IFRS 17, insurance revenue in each reporting period represents the changes in the liabilities for remaining coverage that relate to services for which the Group expects to receive consideration and an allocation of premiums that relate to recovering insurance acquisition cash flows. In addition, investment components are no longer included in insurance revenue and insurance service expenses.
The Group no longer applies shadow accounting to insurance-related assets and liabilities.
Insurance finance income and expenses, disaggregated between profit or loss and OCI for certain life risk and life savings contracts, are presented separately from insurance revenue and insurance service expenses.
The Group applies the PAA to simplify the measurement of contracts in the non-life segment, except for certain groups of acquired contracts because they do not qualify for the PAA. When measuring liabilities for remaining coverage, the PAA is similar to the Group’s previous accounting treatment; however, when measuring liabilities for incurred claims, the Group now discounts cash flows that are expected to occur more than one year after the date on which the claims are incurred and includes an explicit risk adjustment for non-financial risk.
Under IFRS 17, insurance acquisition cash flows are generally included in the estimates of the present value of future cash flows of insurance contracts. Under the PAA, where eligible, the Group has elected to recognise insurance acquisition cash flows in profit or loss as they are incurred. Previously, all acquisition costs were recognised as assets (‘deferred acquisition costs’) separately from the related insurance contracts.
Income and expenses from reinsurance contracts other than insurance finance income and expenses are now presented as a single net amount in profit or loss. Previously, amounts recovered from reinsurers and reinsurance expenses were presented separately.
IAS 8.28 a. The description of the nature and effects of the changes in accounting policies presented is only an example that reflects the business of the Group, and may not be representative of the nature and effects of the changes for other entities.
IFRS 17.C1 b. The effective date of IFRS 17 is 1 January 2021, with early application permitted for entities that apply IFRS 9 and IFRS 15 on or before the date of initial application of IFRS 17. If an entity elects to apply IFRS 17 early, then it discloses that fact.
c. This guide assumes that the Group does not issue any investment contracts with discretionary participation features.
Intr
oduc
tion
Aud
itor
s’ r
epor
tPr
imar
y st
atem
ents
NO
TE
SFu
rthe
r re
sour
ces
© 2018 KPMG IFRG Limited, a UK company, limited by guarantee. All rights reserved.
184 | Guide to annual financial statements: IFRS 17 and IFRS 9 – Illustrative disclosures for insurers
Notes to the consolidated financial statements (continued)43. Changes in accounting policies (continued)A. IFRS 17 Insurance Contracts (continued)
i. Recognition, measurement and presentation of insurance contracts (continued)
The Group now measures owner-occupied properties and the Company’s own shares held that are underlying items of direct participating contracts as assets at FVTPL to reduce accounting mismatches with the measurement of related contracts (see Notes 44(N)(i) and (R)(ii)). Previously, owner-occupied properties were measured at cost less accumulated depreciation less any impairment losses, and the costs of purchasing own shares were accumulated in the treasury share reserve in equity.
For an explanation of how the Group accounts for insurance and reinsurance contracts under IFRS 17, see Note 44(E).
ii. Transition[IFRS 17.C3–C4] Changes in accounting policies resulting from the adoption of IFRS 17 have been applied
retrospectively to the extent practicable. At 1 January 2020, the Group:
– identified, recognised and measured each group of contracts as if IFRS 17 had always applied;
– derecognised previously reported balances that would not have existed if IFRS 17 had always been applied. These included deferred acquisition costs for insurance contracts, intangible assets related to insurance contracts (previously referred to as ‘value of business acquired’), insurance receivables and payables, and provisions for levies that are attributable to existing insurance contracts. Under IFRS 17, these are included in the measurement of the insurance contracts;
– measured owner-occupied properties and the Company’s own shares held that were underlying items of direct participating contracts at fair value (see (i)); and
– recognised any resulting net difference in equity. The carrying amount of goodwill from previous business combinations was not adjusted.
Notwithstanding the above, the following items have not been applied retrospectively.
[IFRS 17.B115, C3(b)] – When the Group uses derivatives to mitigate the financial risk from interest rate guarantees in traditional participating contracts and equity guarantees in variable annuity contracts, the option to exclude changes in the effect of that financial risk from the CSM has not been applied for periods before 1 January 2021 (see Note 29(E)(ii)).
IAS 8.28(b), (d)–(e), (h), [IFRS 17.C5–C19, IAS 8.50]
– For certain groups of contracts in the life risk, life savings and participating segments, it was impracticable for the Group to apply IFRS 17 retrospectively, because data had not been collected in a way that allowed retrospective application. In these cases, the Group applied the modified retrospective approach in IFRS 17 at 1 January 2020 (see Note 44(E)(ix)). To indicate the effect of these groups of contracts on the CSM, insurance revenue and insurance finance income and expenses, the Group has provided additional disclosures in Notes 10(D) and 29(A).
[IFRS 17.C3(a)] The Group has applied the transition provisions in IFRS 17 and has not disclosed the impact of the adoption of IFRS 17 on each financial statement line item and EPS. The effects of adopting IFRS 17 on the consolidated financial statements at 1 January 2020 are presented in the statement of changes in equity.
Intr
oduc
tion
Aud
itor
s’ r
epor
tPr
imar
y st
atem
ents
NO
TE
SFu
rthe
r re
sour
ces
© 2018 KPMG IFRG Limited, a UK company, limited by guarantee. All rights reserved.
Illustrative disclosures – Notes 185Accounting policies
Notes to the consolidated financial statements (continued)43. Changes in accounting policies (continued)
IAS 8.28 B. IFRS 9 Financial Instrumentsa
i. Classification of financial assets and financial liabilities
IFRS 9 includes three principal classification categories for financial assets: measured at amortised cost, FVOCI and FVTPL. The classification of financial assets under IFRS 9 is generally based on the business model in which a financial asset is managed and its contractual cash flow characteristics. IFRS 9 eliminates the previous IAS 39 categories of held-to-maturity investments, loans and receivables, and available-for-sale financial assets. Under IFRS 9, derivatives embedded in contracts where the host is a financial asset in the scope of IFRS 9 are not separated. Instead, the hybrid financial instrument as a whole is assessed for classification.b
For an explanation of how the Group classifies and measures financial assets and accounts for related gains and losses under IFRS 9, see Note 44(G)(ii).
IFRS 9 has not had a significant effect on the Group’s accounting policies for financial liabilities.
ii. Impairment of financial assets
IFRS 9 replaces the ‘incurred loss’ model in IAS 39 with a forward-looking ‘expected credit loss’ model. The new impairment model applies to financial assets measured at amortised cost, debt investments at FVOCI and lease receivables.b Under IFRS 9, credit losses are recognised earlier than under IAS 39 (see Note 44(G)(iii)).
iii. Hedge accounting
The Group has elected to adopt the new general hedge accounting model in IFRS 9. This requires the Group to ensure that hedging relationships are aligned with its risk management objectives and strategy and to apply a more qualitative and forward-looking approach to assessing hedge effectiveness.c
The Group has designated only the change in the value of the spot element of forward exchange contracts as hedging instruments in its net investment hedges. Under IAS 39, the changes in the fair value of the forward points were recognised immediately in profit or loss. However, under IFRS 9 the changes in the fair value of the forward points are separately recognised in OCI and accumulated in the costs of hedging reserve.
For an explanation of how the Group applies hedge accounting under IFRS 9, see Note 44(B)(iii).
IFRS 9.7.1.1–7.1.2 a. The effective date of IFRS 9 is 1 January 2018, with early application permitted. For annual periods beginning before 1 January 2018, an entity may elect to early apply only the requirements for the presentation of gains and losses on financial liabilities designated as at FVTPL without applying the other requirements in IFRS 9.
IFRS 9.7.1.7 In October 2017, the IASB issued Prepayment Features with Negative Compensation (Amendments to IFRS 9). The effective date of the amendments is 1 January 2019, with early application permitted.
IFRS 4.20A–20B An insurer that has not previously applied any version of IFRS 9, other than only the requirements for the presentation of gains and losses on financial liabilities designated as at FVTPL, and whose activities are predominantly connected with insurance at its annual reporting date that immediately precedes 1 April 2016 (or at a later date as specified in paragraph 20G of IFRS 4), may apply IAS 39 Financial Instruments: Recognition and Measurement rather than IFRS 9 for annual periods beginning before 1 January 2021 (temporary exemption from IFRS 9).
The Group has applied the temporary exemption from IFRS 9 and has not previously adopted any version of IFRS 9, including the requirements for the presentation of gains and losses on financial liabilities designated as at FVTPL, for annual periods beginning before 1 January 2021. Consequently, the Group has a single date of initial application of 1 January 2021 for IFRS 9 in its entirety. The date of initial application is relevant to several assessments necessary to apply IFRS 9.
IFRS 9.5.5.1 b. The impairment model in IFRS 9 and associated disclosure requirements in IFRS 7 apply additionally to loan commitments not measured at FVTPL, financial guarantees under IFRS 9 and contract assets under IFRS 15. However, the Group has no such items.
IFRS 9.7.2.21 c. When an entity first applies IFRS 9, it may choose as its accounting policy to defer application of the new general hedge accounting model and continue to apply the hedge accounting requirements of IAS 39 in their entirety until the standard resulting from the IASB’s separate project on macro hedge accounting is effective.
Our Guide to annual financial statements: IFRS 9 – Illustrative disclosures for banks (March 2016) provides disclosure examples and explanations for an entity that elects to apply the hedge accounting requirements of IAS 39.
Intr
oduc
tion
Aud
itor
s’ r
epor
tPr
imar
y st
atem
ents
NO
TE
SFu
rthe
r re
sour
ces
© 2018 KPMG IFRG Limited, a UK company, limited by guarantee. All rights reserved.
186 | Guide to annual financial statements: IFRS 17 and IFRS 9 – Illustrative disclosures for insurers
Notes to the consolidated financial statements (continued)43. Changes in accounting policies (continued)B. IFRS 9 Financial Instruments (continued)
iv. Transition[IFRS 9.7.2.1–7.2.26, 7.2.29–7.2.30]
Changes in accounting policies resulting from the adoption of IFRS 9 have been applied retrospectively, except as described below.
– The comparative period has been restated. However, information about financial instruments that had already been derecognised at 1 January 2021 continues to be reported in accordance with IAS 39 for the comparative period.a
– Changes to hedge accounting policies have been applied prospectively, except for the costs of hedging approach for forward points, which has been applied retrospectively to hedging relationships that existed on or after 1 January 2020. All hedging relationships designated under IAS 39 at 31 December 2020 met the criteria for hedge accounting under IFRS 9 at 1 January 2021 and were therefore regarded as continuing hedging relationships.
– The following assessments have been made on the basis of the facts and circumstances that existed at 1 January 2021.
- The determination of the business model within which a financial asset is held.
- The designation and revocation of previous designations of certain financial assets and financial liabilities as measured at FVTPL.
– If an investment in a debt security had low credit risk at 1 January 2021, then the Group determined that the credit risk on the asset had not increased significantly since initial recognition.
IFRS 7.42Q, IAS 8.28(b), (d)
As permitted by IFRS 7, the Group has not disclosed information about the line item amounts that are reported in accordance with the classification and measurement (including impairment) requirements of IFRS 9 for 2020 and those that would have been reported in accordance with the classification and measurement requirements of IAS 39 for 2021.
IAS 8.28(f)(ii) The adoption of IFRS 9 has not had a material impact on the Group’s basic or diluted EPS for the years ended 31 December 2021 and 2020.
Details of the changes and implications resulting from the adoption of IFRS 9 are presented in (v).
v. Effect of initial application
Classification of financial assets and financial liabilities
IFRS 7.6, 42I The following table shows the original measurement category and carrying amount under IAS 39 and the new measurement category and carrying amount under IFRS 9 for each class of the Group’s financial assets and financial liabilities as at 1 January 2021.
IFRS 9.7.2.15, BC7.34M, Insights 7A.11.30
a. IFRS 9 contains exemptions from full retrospective application for its classification and measurement requirements, including impairment. These include an exception from the requirement to restate comparative information. An entity may restate prior periods if, and only if, it is possible without the use of hindsight. Regardless of whether the entity restates prior periods, it provides the transition disclosures set out in paragraphs 42L–42P of IFRS 7.
Our Guide to annual financial statements: IFRS 9 – Illustrative disclosures for banks (March 2016) provides disclosure examples and explanations for an entity that does not restate prior periods on adoption of IFRS 9.
Intr
oduc
tion
Aud
itor
s’ r
epor
tPr
imar
y st
atem
ents
NO
TE
SFu
rthe
r re
sour
ces
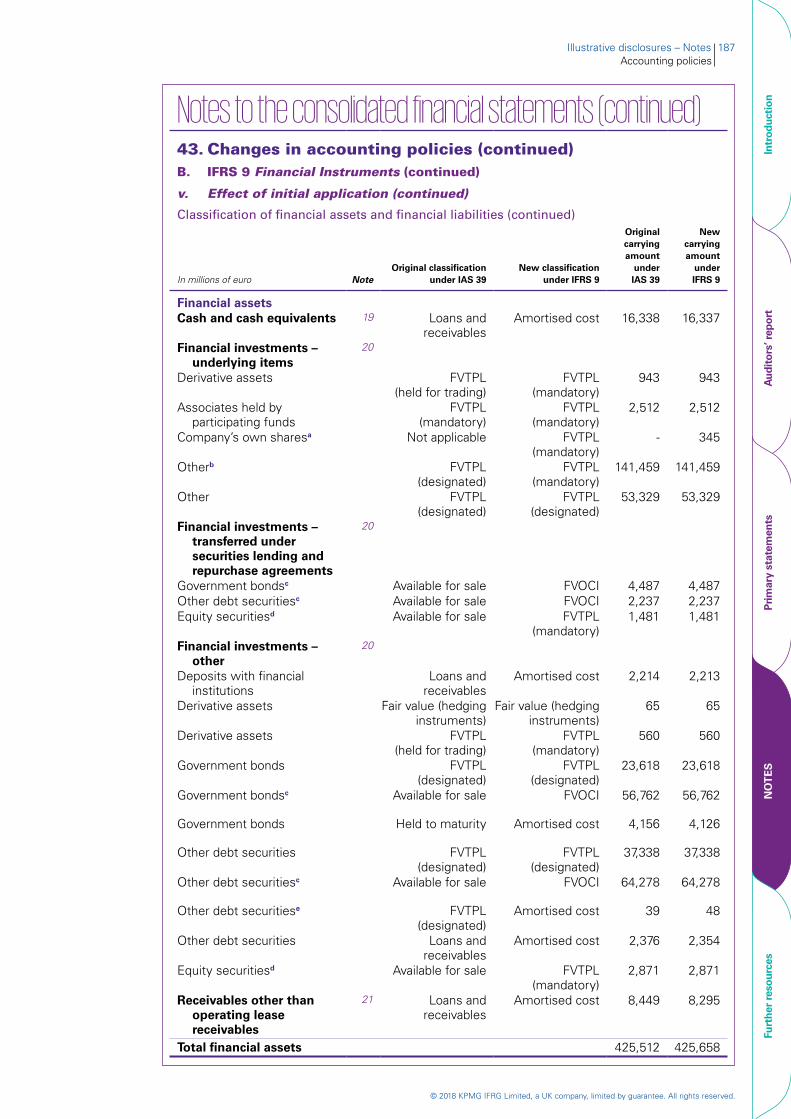
© 2018 KPMG IFRG Limited, a UK company, limited by guarantee. All rights reserved.
Illustrative disclosures – Notes 187Accounting policies
Notes to the consolidated financial statements (continued)
43. Changes in accounting policies (continued)B. IFRS 9 Financial Instruments (continued)
v. Effect of initial application (continued)
Classification of financial assets and financial liabilities (continued)
In millions of euro NoteOriginal classification
under IAS 39New classification
under IFRS 9
Original carrying amount
under IAS 39
New carrying amount
under IFRS 9
Financial assetsCash and cash equivalents 19 Loans and
receivablesAmortised cost 16,338 16,337
Financial investments – underlying items
20
Derivative assets FVTPL (held for trading)
FVTPL (mandatory)
943 943
Associates held by participating funds
FVTPL (mandatory)
FVTPL (mandatory)
2,512 2,512
Company’s own sharesa Not applicable FVTPL (mandatory)
- 345
Otherb FVTPL (designated)
FVTPL (mandatory)
141,459 141,459
Other FVTPL (designated)
FVTPL (designated)
53,329 53,329
Financial investments – transferred under securities lending and repurchase agreements
20
Government bondsc Available for sale FVOCI 4,487 4,487Other debt securitiesc Available for sale FVOCI 2,237 2,237Equity securitiesd Available for sale FVTPL
(mandatory)1,481 1,481
Financial investments – other
20
Deposits with financial institutions
Loans and receivables
Amortised cost 2,214 2,213
Derivative assets Fair value (hedging instruments)
Fair value (hedging instruments)
65 65
Derivative assets FVTPL (held for trading)
FVTPL (mandatory)
560 560
Government bonds FVTPL (designated)
FVTPL (designated)
23,618 23,618
Government bondsc Available for sale FVOCI 56,762 56,762
Government bonds Held to maturity Amortised cost 4,156 4,126
Other debt securities FVTPL (designated)
FVTPL (designated)
37,338 37,338
Other debt securitiesc Available for sale FVOCI 64,278 64,278
Other debt securitiese FVTPL (designated)
Amortised cost 39 48
Other debt securities Loans and receivables
Amortised cost 2,376 2,354
Equity securitiesd Available for sale FVTPL (mandatory)
2,871 2,871
Receivables other than operating lease receivables
21 Loans and receivables
Amortised cost 8,449 8,295
Total financial assets 425,512 425,658
Intr
oduc
tion
Aud
itor
s’ r
epor
tPr
imar
y st
atem
ents
NO
TE
SFu
rthe
r re
sour
ces
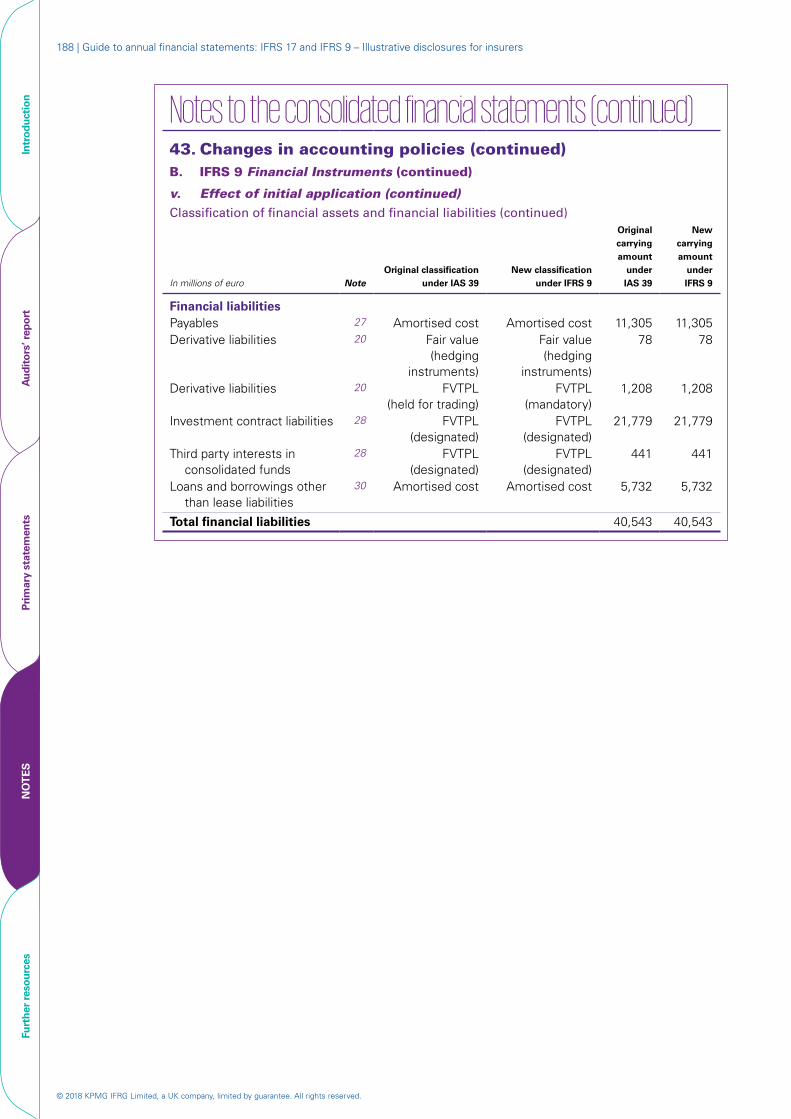
© 2018 KPMG IFRG Limited, a UK company, limited by guarantee. All rights reserved.
188 | Guide to annual financial statements: IFRS 17 and IFRS 9 – Illustrative disclosures for insurers
Notes to the consolidated financial statements (continued)
43. Changes in accounting policies (continued)B. IFRS 9 Financial Instruments (continued)
v. Effect of initial application (continued)
Classification of financial assets and financial liabilities (continued)
In millions of euro NoteOriginal classification
under IAS 39New classification
under IFRS 9
Original carrying amount
under IAS 39
New carrying amount
under IFRS 9
Financial liabilitiesPayables 27 Amortised cost Amortised cost 11,305 11,305Derivative liabilities 20 Fair value
(hedging instruments)
Fair value (hedging
instruments)
78 78
Derivative liabilities 20 FVTPL (held for trading)
FVTPL (mandatory)
1,208 1,208
Investment contract liabilities 28 FVTPL (designated)
FVTPL (designated)
21,779 21,779
Third party interests in consolidated funds
28 FVTPL (designated)
FVTPL (designated)
441 441
Loans and borrowings other than lease liabilities
30 Amortised cost Amortised cost 5,732 5,732
Total financial liabilities 40,543 40,543
Intr
oduc
tion
Aud
itor
s’ r
epor
tPr
imar
y st
atem
ents
NO
TE
SFu
rthe
r re
sour
ces
© 2018 KPMG IFRG Limited, a UK company, limited by guarantee. All rights reserved.
Illustrative disclosures – Notes 189Accounting policies
Notes to the consolidated financial statements (continued)
43. Changes in accounting policies (continued)B. IFRS 9 Financial Instruments (continued)
v. Effect of initial application (continued)
Classification of financial assets and financial liabilities (continued)
IFRS 7.42I–42J The Group’s accounting policies on the classification of financial instruments under IFRS 9 are set out in Note 44(G)(ii). The application of these policies resulted in the reclassifications set out in the table above and explained below.
a. On transition to IFRS 17, the Group elected to recognise the Company’s own shares that are held as underlying items of participating contracts as if they were financial assets. These shares are mandatorily measured at FVTPL. Previously, these shares were treated as treasury shares.
b. Under IAS 39, certain underlying items of participating contracts were designated as at FVTPL because the Group managed them and evaluated their performance on a fair value basis in accordance with a documented investment strategy. Under IFRS 9, these assets are mandatorily measured at FVTPL because they are neither held to collect contractual cash flows nor held both to collect contractual cash flows and to sell financial assets.
c. Certain debt securities are held to meet everyday liquidity needs. Group treasury seeks to minimise the costs of managing these liquidity needs and therefore actively manages the return on the portfolio. That return consists of collecting contractual payments as well as gains and losses from the sale of financial assets. The investment strategy often results in sales activity that is significant in value. The Group considers that under IFRS 9 these securities are held within a business model whose objective is achieved both by collecting contractual cash flows and by selling financial assets. The contractual terms of these financial assets give rise on specified dates to cash flows that are solely payments of principal and interest on the principal amount outstanding. These assets have therefore been classified as financial assets at FVOCI under IFRS 9.
d. Under IAS 39, equity securities that were not designated as at FVTPL were classified as available-for-sale financial assets. Under IFRS 9, these assets are mandatorily measured at FVTPL because they do not give rise to cash flows that are solely payments of principal and interest and the Group has not elected to measure them at FVOCI.
e. Under IAS 39, certain debt securities were designated as at FVTPL because the Group held related derivatives at FVTPL and this designation eliminated or significantly reduced an accounting mismatch that would otherwise have arisen. At 1 January 2021, the Group revoked its previous designation made under IAS 39 for some of these securities, because the related derivative positions had been closed and there was no longer a significant accounting mismatch arising from the securities.
Intr
oduc
tion
Aud
itor
s’ r
epor
tPr
imar
y st
atem
ents
NO
TE
SFu
rthe
r re
sour
ces
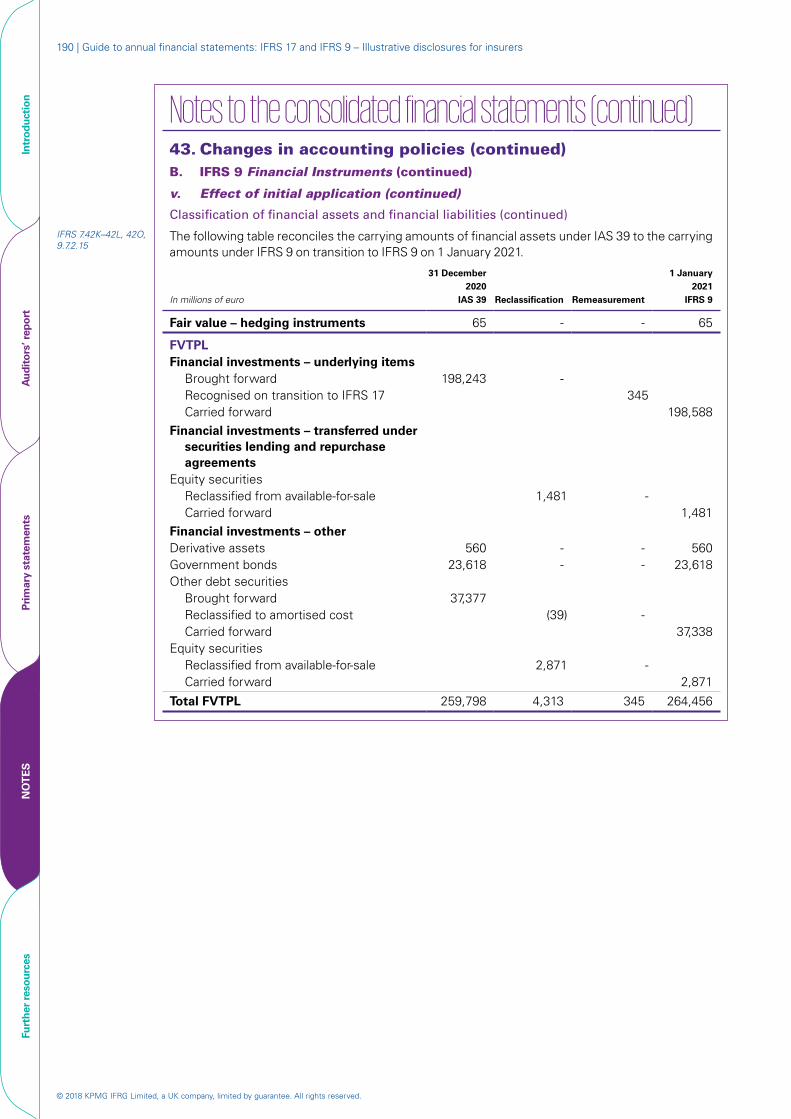
© 2018 KPMG IFRG Limited, a UK company, limited by guarantee. All rights reserved.
190 | Guide to annual financial statements: IFRS 17 and IFRS 9 – Illustrative disclosures for insurers
Notes to the consolidated financial statements (continued)
43. Changes in accounting policies (continued)B. IFRS 9 Financial Instruments (continued)
v. Effect of initial application (continued)
Classification of financial assets and financial liabilities (continued)
IFRS 7.42K–42L, 42O, 9.7.2.15
The following table reconciles the carrying amounts of financial assets under IAS 39 to the carrying amounts under IFRS 9 on transition to IFRS 9 on 1 January 2021.
In millions of euro
31 December 2020
IAS 39 Reclassification Remeasurement
1 January 2021
IFRS 9
Fair value – hedging instruments 65 - - 65
FVTPLFinancial investments – underlying items
Brought forward 198,243 -Recognised on transition to IFRS 17 345Carried forward 198,588
Financial investments – transferred under securities lending and repurchase agreements
Equity securitiesReclassified from available-for-sale 1,481 -Carried forward 1,481
Financial investments – otherDerivative assets 560 - - 560Government bonds 23,618 - - 23,618Other debt securities
Brought forward 37,377Reclassified to amortised cost (39) -Carried forward 37,338
Equity securitiesReclassified from available-for-sale 2,871 -Carried forward 2,871
Total FVTPL 259,798 4,313 345 264,456
Intr
oduc
tion
Aud
itor
s’ r
epor
tPr
imar
y st
atem
ents
NO
TE
SFu
rthe
r re
sour
ces

© 2018 KPMG IFRG Limited, a UK company, limited by guarantee. All rights reserved.
Illustrative disclosures – Notes 191Accounting policies
Notes to the consolidated financial statements (continued) 43. Changes in accounting policies (continued)B. IFRS 9 Financial Instruments (continued)
v. Effect of initial application (continued)
Classification of financial assets and financial liabilities (continued)
In millions of euro
31 December 2020
IAS 39 Reclassification Remeasurement
1 January 2021
IFRS 9
FVOCIFinancial investments – transferred under
securities lending and repurchase agreements
Government bondsReclassified from available-for-sale 4,487 -Carried forward 4,487
Other debt securitiesReclassified from available-for-sale 2,237 -Carried forward 2,237
Financial investments – otherGovernment bonds
Reclassified from available-for-sale 56,762 -Carried forward 56,762
Other debt securitiesReclassified from available-for-sale 64,278 -Carried forward 64,278
Total FVOCI - 127,764 - 127,764
Available-for-saleBrought forward 132,116Reclassified to FVTPL (4,352)Reclassified to FVOCI (127,764)
Intr
oduc
tion
Aud
itor
s’ r
epor
tPr
imar
y st
atem
ents
NO
TE
SFu
rthe
r re
sour
ces
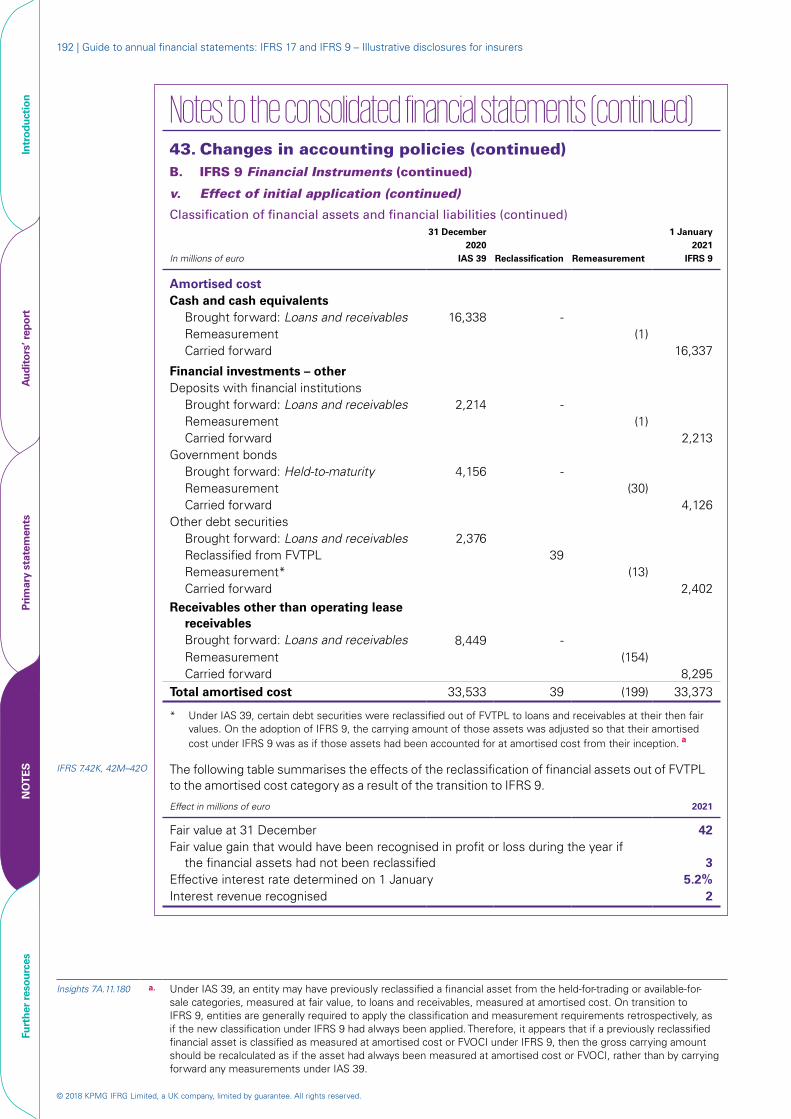
© 2018 KPMG IFRG Limited, a UK company, limited by guarantee. All rights reserved.
192 | Guide to annual financial statements: IFRS 17 and IFRS 9 – Illustrative disclosures for insurers
Notes to the consolidated financial statements (continued)
43. Changes in accounting policies (continued)B. IFRS 9 Financial Instruments (continued)
v. Effect of initial application (continued)
Classification of financial assets and financial liabilities (continued)
In millions of euro
31 December 2020
IAS 39 Reclassification Remeasurement
1 January 2021
IFRS 9
Amortised cost
Cash and cash equivalentsBrought forward: Loans and receivables 16,338 -Remeasurement (1)Carried forward 16,337
Financial investments – otherDeposits with financial institutions
Brought forward: Loans and receivables 2,214 -Remeasurement (1)Carried forward 2,213
Government bondsBrought forward: Held-to-maturity 4,156 -Remeasurement (30)Carried forward 4,126
Other debt securitiesBrought forward: Loans and receivables 2,376Reclassified from FVTPL 39Remeasurement* (13)Carried forward 2,402
Receivables other than operating lease receivablesBrought forward: Loans and receivables 8,449 -Remeasurement (154)Carried forward 8,295
Total amortised cost 33,533 39 (199) 33,373
* Under IAS 39, certain debt securities were reclassified out of FVTPL to loans and receivables at their then fair values. On the adoption of IFRS 9, the carrying amount of those assets was adjusted so that their amortised cost under IFRS 9 was as if those assets had been accounted for at amortised cost from their inception. a
IFRS 7.42K, 42M–42O The following table summarises the effects of the reclassification of financial assets out of FVTPL to the amortised cost category as a result of the transition to IFRS 9.
Effect in millions of euro 2021
Fair value at 31 December 42Fair value gain that would have been recognised in profit or loss during the year if
the financial assets had not been reclassified 3Effective interest rate determined on 1 January 5.2%Interest revenue recognised 2
Insights 7A.11.180 a. Under IAS 39, an entity may have previously reclassified a financial asset from the held-for-trading or available-for-sale categories, measured at fair value, to loans and receivables, measured at amortised cost. On transition to IFRS 9, entities are generally required to apply the classification and measurement requirements retrospectively, as if the new classification under IFRS 9 had always been applied. Therefore, it appears that if a previously reclassified financial asset is classified as measured at amortised cost or FVOCI under IFRS 9, then the gross carrying amount should be recalculated as if the asset had always been measured at amortised cost or FVOCI, rather than by carrying forward any measurements under IAS 39.
Intr
oduc
tion
Aud
itor
s’ r
epor
tPr
imar
y st
atem
ents
NO
TE
SFu
rthe
r re
sour
ces
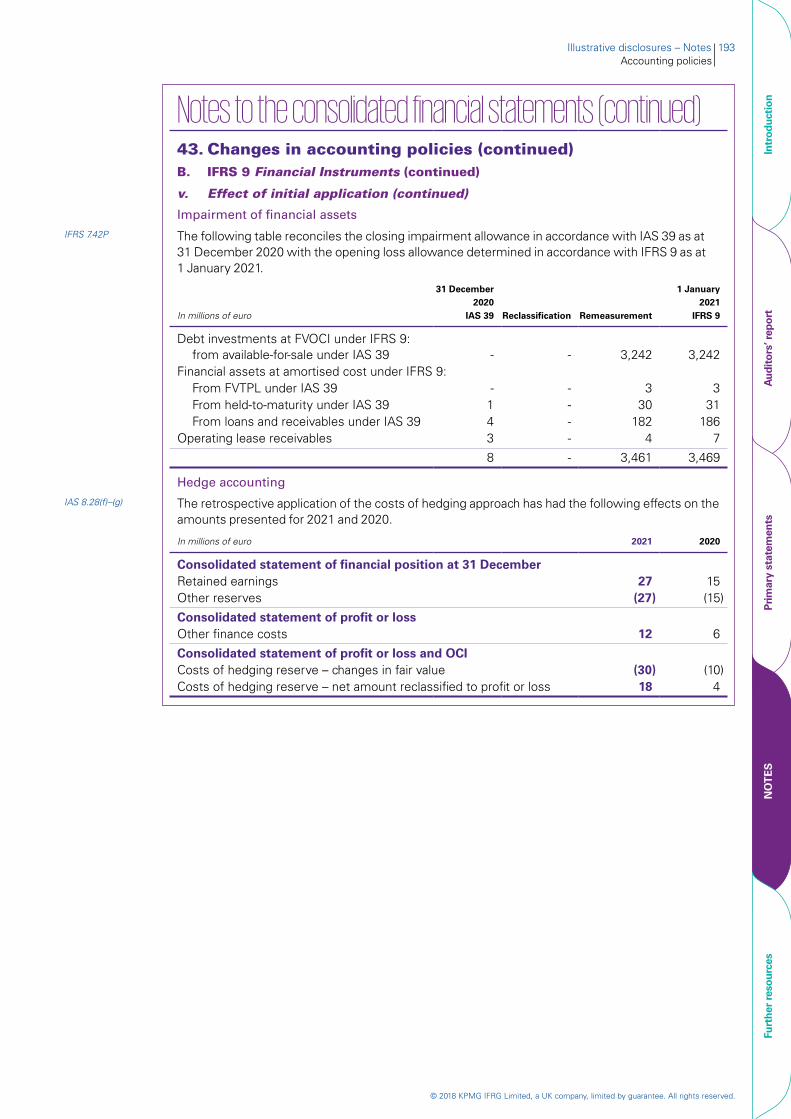
© 2018 KPMG IFRG Limited, a UK company, limited by guarantee. All rights reserved.
Illustrative disclosures – Notes 193Accounting policies
Notes to the consolidated financial statements (continued)
43. Changes in accounting policies (continued)B. IFRS 9 Financial Instruments (continued)
v. Effect of initial application (continued)
Impairment of financial assets
IFRS 7.42P The following table reconciles the closing impairment allowance in accordance with IAS 39 as at 31 December 2020 with the opening loss allowance determined in accordance with IFRS 9 as at 1 January 2021.
In millions of euro
31 December 2020
IAS 39 Reclassification Remeasurement
1 January 2021
IFRS 9
Debt investments at FVOCI under IFRS 9: from available-for-sale under IAS 39 - - 3,242 3,242
Financial assets at amortised cost under IFRS 9:From FVTPL under IAS 39 - - 3 3From held-to-maturity under IAS 39 1 - 30 31From loans and receivables under IAS 39 4 - 182 186
Operating lease receivables 3 - 4 7
8 - 3,461 3,469
Hedge accounting
IAS 8.28(f)–(g) The retrospective application of the costs of hedging approach has had the following effects on the amounts presented for 2021 and 2020.
In millions of euro 2021 2020
Consolidated statement of financial position at 31 DecemberRetained earnings 27 15Other reserves (27) (15)
Consolidated statement of profit or lossOther finance costs 12 6
Consolidated statement of profit or loss and OCICosts of hedging reserve – changes in fair value (30) (10)Costs of hedging reserve – net amount reclassified to profit or loss 18 4
Intr
oduc
tion
Aud
itor
s’ r
epor
tPr
imar
y st
atem
ents
NO
TE
SFu
rthe
r re
sour
ces
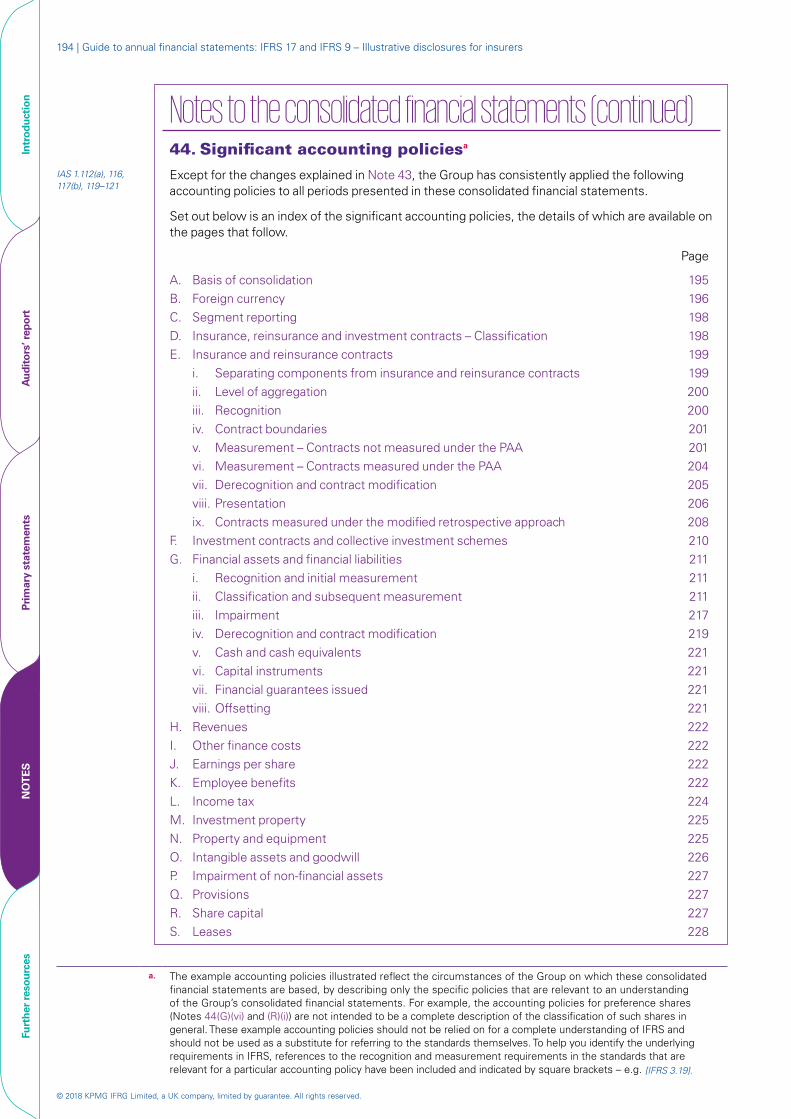
© 2018 KPMG IFRG Limited, a UK company, limited by guarantee. All rights reserved.
194 | Guide to annual financial statements: IFRS 17 and IFRS 9 – Illustrative disclosures for insurers
Notes to the consolidated financial statements (continued)44. Significant accounting policiesa
IAS 1.112(a), 116, 117(b), 119–121
Except for the changes explained in Note 43, the Group has consistently applied the following accounting policies to all periods presented in these consolidated financial statements.
Set out below is an index of the significant accounting policies, the details of which are available on the pages that follow.
Page
A. Basis of consolidation 195B. Foreign currency 196C. Segment reporting 198D. Insurance, reinsurance and investment contracts – Classification 198E. Insurance and reinsurance contracts 199
i. Separating components from insurance and reinsurance contracts 199ii. Level of aggregation 200iii. Recognition 200iv. Contract boundaries 201v. Measurement – Contracts not measured under the PAA 201vi. Measurement – Contracts measured under the PAA 204vii. Derecognition and contract modification 205viii. Presentation 206ix. Contracts measured under the modified retrospective approach 208
F. Investment contracts and collective investment schemes 210G. Financial assets and financial liabilities 211
i. Recognition and initial measurement 211ii. Classification and subsequent measurement 211iii. Impairment 217iv. Derecognition and contract modification 219v. Cash and cash equivalents 221vi. Capital instruments 221vii. Financial guarantees issued 221viii. Offsetting 221
H. Revenues 222I. Other finance costs 222J. Earnings per share 222K. Employee benefits 222L. Income tax 224M. Investment property 225N. Property and equipment 225O. Intangible assets and goodwill 226P. Impairment of non-financial assets 227Q. Provisions 227R. Share capital 227S. Leases 228
a. The example accounting policies illustrated reflect the circumstances of the Group on which these consolidated financial statements are based, by describing only the specific policies that are relevant to an understanding of the Group’s consolidated financial statements. For example, the accounting policies for preference shares (Notes 44(G)(vi) and (R)(i)) are not intended to be a complete description of the classification of such shares in general. These example accounting policies should not be relied on for a complete understanding of IFRS and should not be used as a substitute for referring to the standards themselves. To help you identify the underlying requirements in IFRS, references to the recognition and measurement requirements in the standards that are relevant for a particular accounting policy have been included and indicated by square brackets – e.g. [IFRS 3.19].
Intr
oduc
tion
Aud
itor
s’ r
epor
tPr
imar
y st
atem
ents
NO
TE
SFu
rthe
r re
sour
ces
© 2018 KPMG IFRG Limited, a UK company, limited by guarantee. All rights reserved.
Illustrative disclosures – Notes 195Accounting policies
Notes to the consolidated financial statements (continued)44. Significant accounting policies (continued)A. Basis of consolidation
i. Business combinations
[IFRS 3.4, 32, 34, 53] The Group accounts for business combinations using the acquisition method when control is transferred to the Group (see (ii)). The consideration transferred in the acquisition is generally measured at fair value, as are the identifiable net assets acquired. Any goodwill that arises is tested annually for impairment (see (P)). Any gain on a bargain purchase is recognised in profit or loss immediately. Transaction costs are expensed as they are incurred, except if they are related to the issue of debt or equity securities (see (G)(i) and (R)(i)).
[IFRS 3.B52] The consideration transferred does not include amounts related to the settlement of pre-existing relationships. Such amounts are generally recognised in profit or loss.
[IFRS 3.40, 58] Any contingent consideration is measured at fair value at the date of acquisition. If an obligation to pay contingent consideration that meets the definition of a financial instrument is classified as equity, then it is not remeasured and settlement is accounted for within equity. Other contingent consideration is remeasured at fair value at each reporting date and subsequent changes in the fair value of the contingent consideration are recognised in profit or loss.
[IFRS 3.30, B57–B61] If share-based payment awards (replacement awards) are required to be exchanged for awards held by the acquiree’s employees (acquiree’s awards), then all or a portion of the amount of the acquirer’s replacement awards is included in measuring the consideration transferred in the business combination. This determination is based on the market-based measure of the replacement awards compared with the market-based measure of the acquiree’s awards and the extent to which the replacement awards relate to pre-combination service.
ii. Subsidiaries
[IFRS 10.6, 20] Subsidiaries are entities controlled by the Group. The Group controls an entity when it is exposed to, or has rights to, variable returns from its involvement with the entity and has the ability to affect those returns through its power over the entity. The financial statements of subsidiaries are included in the consolidated financial statements from the date on which control commences until the date on which control ceases.
Collective investment schemes
IFRS 12.7(a), 9(c) The Group acts as scheme manager for a number of collective investment schemes. Determining whether the Group controls a scheme usually focuses on the assessment of the aggregate economic interests of the Group in the scheme (comprising any carried interests and expected management fees) and the investors’ rights to remove the scheme manager. For certain schemes managed by the Group, the investors are able to vote by simple majority to remove the Group as manager without cause, and the Group’s aggregate economic interest is in each case less than 15%. As a result, the Group has concluded that it acts as agent for the investors in these cases, and therefore has not consolidated these schemes.
iii. Non-controlling interests
[IFRS 3.19] NCI are initially measured at their proportionate share of the acquiree’s identifiable net assets at the date of acquisition.a
[IFRS 10.23, B96] Changes in the Group’s interest in a subsidiary that do not result in a loss of control are accounted for as equity transactions.
iv. Loss of control
[IFRS 10.25, B98–B99] When the Group loses control over a subsidiary, it derecognises the assets and liabilities of the subsidiary, and any related NCI and other components of equity. Any resulting gain or loss is recognised in profit or loss. Any interest retained in the former subsidiary is measured at fair value when control is lost.
IFRS 3.19 a. An entity has a choice on a combination-by-combination basis to measure any NCI in the acquiree at either the proportionate share of the acquiree’s identifiable net assets or fair value. The Group has elected the former approach.
Intr
oduc
tion
Aud
itor
s’ r
epor
tPr
imar
y st
atem
ents
NO
TE
SFu
rthe
r re
sour
ces

© 2018 KPMG IFRG Limited, a UK company, limited by guarantee. All rights reserved.
196 | Guide to annual financial statements: IFRS 17 and IFRS 9 – Illustrative disclosures for insurers
Notes to the consolidated financial statements (continued)44. Significant accounting policies (continued)A. Basis of consolidation (continued)
v. Interests in equity-accounted investeesa
The Group’s interests in equity-accounted investees comprise interests in a joint venture and associates that are not underlying items of participating contracts.
[IFRS 11.15–16, IAS 28.3]
A joint venture is an arrangement in which the Group has joint control, whereby the Group has rights to the net assets of the arrangement, rather than rights to its assets and obligations for its liabilities. An associate is an entity in which the Group has significant influence, but not control or joint control, over the financial and operating policies.
[IAS 28.10, 22] Interests in joint ventures and associates that are not underlying items of participating contracts are accounted for using the equity method. They are initially recognised at cost, which includes transaction costs. Subsequent to initial recognition, the consolidated financial statements include the Group’s share of the profit or loss and OCI of equity-accounted investees, until the date on which joint control or significant influence ceases.
[IAS 28.38–39] When the Group’s share of losses exceeds its interest in an equity-accounted investee, the carrying amount of the investment, including any long-term interests that form part of that investment, is reduced to zero. Additional losses are provided for only to the extent that the Group has incurred legal or constructive obligations or made payments on behalf of the investee.
[IAS 28.18] The Group has elected to measure interests in associates that are underlying items of participating contracts at FVTPL on initial recognition (see (G)(ii)).
vi. Transactions eliminated on consolidation[IFRS 10.B86(c), IAS 28.28]
Intra-group balances and transactions, and any unrealised income and expenses arising from intra-group transactions, are eliminated. Unrealised gains arising from transactions with equity-accounted investees are eliminated against the investment to the extent of the Group’s interest in the investee.b Unrealised losses are eliminated in the same way as unrealised gains, but only to the extent that there is no evidence of impairment.
B. Foreign currency
i. Foreign currency transactions[IAS 21.21] Transactions in foreign currencies are translated into the respective functional currencies of Group
companies at the exchange rates at the dates of the transactions.
[IFRS 17.30, IAS 21.23(a)]
Monetary assets and liabilities denominated in foreign currencies are translated into the functional currency at the spot exchange rate at the reporting date. Groups of insurance and reinsurance contracts that generate cash flows in a foreign currency, including the CSM, are treated as monetary items.
[IAS 21.23(b)–(c)] Non-monetary assets and liabilities that are measured at fair value in a foreign currency are translated into the functional currency at the spot exchange rate at the date on which the fair value is determined. Non-monetary items that are measured based on historical cost in a foreign currency are translated using the spot exchange rate at the date of the transaction.
Insights 5.10.140.150
a. Although it is not illustrated, an entity’s equity-accounted investee may have accounting policies for items that do not apply to the investor. In our view, this information should be included in the accounting policy note for equity-accounted investees if it is necessary for an understanding of equity-accounted earnings or the carrying amount of equity-accounted investees.
Insights 3.5.430.30 b. In the absence of specific guidance in IFRS, the Group has elected to eliminate unrealised gains and losses resulting from transactions with equity-accounted investees against the investment in the investees. Alternatively, the elimination may be presented as a reduction in the underlying asset – e.g. property and equipment.
Intr
oduc
tion
Aud
itor
s’ r
epor
tPr
imar
y st
atem
ents
NO
TE
SFu
rthe
r re
sour
ces

© 2018 KPMG IFRG Limited, a UK company, limited by guarantee. All rights reserved.
Illustrative disclosures – Notes 197Accounting policies
Notes to the consolidated financial statements (continued)44. Significant accounting policies (continued)B. Foreign currency (continued)
i. Foreign currency transactions (continued)[IFRS 9.6.5.13(a), B5.7.3, 17.92, IAS 39.102(a), AG83]
Foreign currency differences arising on translation are generally recognised in profit or loss. However, foreign currency differences arising from the translation of the following items are recognised in OCI:
– groups of insurance and reinsurance contracts to the extent that the foreign currency differences relate to changes in the carrying amount of the groups recognised in OCI (see (E)(viii)). The amount included in OCI is the difference between the total foreign currency differences and the amount included in profit or loss. The amount included in profit or loss is the difference between the measurement of the group that is used to determine the insurance finance income and expenses in profit or loss in the period in the functional currency at the beginning of the period, adjusted for accreted interest and payments during the period, and the same measurement in the foreign currency translated at the spot exchange rate at the end of the period;
– equity investments designated as at FVOCIa and available-for-sale equity investments that had been derecognised at 1 January 2021 (except on impairment, in which case foreign currency differences that have been recognised in OCI are reclassified to profit or loss); and
– hedging instruments in a net investment hedge to the extent that the hedge is effective (see (B)(iii)).
[IFRS 9.B5.7.2–B5.7.2A, IG.E.3.2, IG.E.3.4, IAS 39.AG83, IG.E.3.2, IG.E.3.4]
The foreign currency gain or loss on debt investments at FVOCI, financial instruments at amortised cost and available-for-sale debt investments derecognised before 1 January 2021 is the difference between the amortised cost in the functional currency at the beginning of the period, adjusted for effective interest and payments during the period, and the amortised cost in the foreign currency translated at the spot exchange rate at the end of the period.
ii. Foreign operations[IAS 21.39] The assets and liabilities of foreign operations, including goodwill and fair value adjustments
arising on acquisition, are translated into euro at the exchange rates at the reporting date. The income and expenses of foreign operations are translated into euro at the exchange rates at the dates of the transactions.
[IFRS 10.B94, IAS 21.41]
Foreign currency differences are recognised in OCI and accumulated in the translation reserve, except to the extent that the translation difference is allocated to NCI.
[IAS 21.48–48D] When a foreign operation is disposed of in its entirety, or partially such that the Group loses control of a subsidiary or retains neither joint control nor significant influence after the partial disposal of an interest in a joint venture or associate, the cumulative amount in the translation reserve related to that foreign operation is reclassified to profit or loss as part of the gain or loss on disposal. If the Group disposes of part of its interest in a subsidiary but retains control, then the relevant proportion of the cumulative amount is reattributed to NCI. When the Group disposes of part of a joint venture or associate while retaining joint control or significant influence, the relevant proportion of the cumulative amount is reclassified to profit or loss.
a. The Group has not designated any equity investments as at FVOCI. This disclosure is provided for illustrative purposes only.
Intr
oduc
tion
Aud
itor
s’ r
epor
tPr
imar
y st
atem
ents
NO
TE
SFu
rthe
r re
sour
ces
© 2018 KPMG IFRG Limited, a UK company, limited by guarantee. All rights reserved.
198 | Guide to annual financial statements: IFRS 17 and IFRS 9 – Illustrative disclosures for insurers
Notes to the consolidated financial statements (continued)44. Significant accounting policies (continued)B. Foreign currency (continued)
iii. Net investment hedges
The Group designates the spot elements of certain foreign exchange forward contracts as hedging instruments and applies hedge accounting to the designated component of the exposure to currency risk arising from the fluctuation in spot exchange rates between the functional currency of the foreign operation and the functional currency of the Company (euro).
[IFRS 9.6.4.1(b), IAS 39.88(a)]
At inception of designated hedging relationships, the Group formally documents the risk management objective and strategy for undertaking the hedge. It also documents the economic relationship between the hedged item and the hedging instrument, including whether the changes in the values of the hedged item and the hedging instrument are expected to offset each other.
[IFRS 9.6.5.13–6.5.14, IAS 39.102]
The effective portion of changes in the fair value of the hedging instrument is recognised in OCI and presented in the translation reserve within equity. Any ineffective portion of the changes in the fair value of the hedging instrument is recognised immediately in profit or loss. The amount recognised in OCI is reclassified to profit or loss as a reclassification adjustment on disposal of the foreign operation.
[IFRS 9.6.5.16, 7.2.26(b)]
The forward elements of the foreign exchange forward contracts are excluded from designation as hedging instruments. For hedging relationships that existed on 1 January 2020 or were designated thereafter, the changes in the fair value of the forward points are recognised in OCI as costs of hedging and accumulated in the costs of hedging reserve, and are amortised to profit or loss over the period of the hedge. For hedging relationships before 1 January 2020, the changes in the fair value of the forward points were recognised immediately in profit or loss.
C. Segment reporting[IFRS 8.5] An operating segment is a component of the Group that engages in business activities from
which it may earn revenues and incur expenses, including revenues and expenses that relate to transactions with any of the Group’s other components, whose operating results are reviewed regularly by the Group management committee (being the Group’s chief operating decision maker) to make decisions about resources allocated to each operating segment and assess performance, and for which discrete financial information is available.
[IFRS 8.29] If the Group changes its basis of segment reporting, then comparative segment information is restated so that it aligns with the segment information reported for the current year.
D. Insurance, reinsurance and investment contracts – Classification
[IFRS 17.A, B7, B19] Contracts under which the Group accepts significant insurance risk are classified as insurance contracts. Contracts held by the Group under which it transfers significant insurance risk related to insurance contracts are classified as reinsurance contracts. Insurance and reinsurance contracts also expose the Group to financial risk.
The Group does not accept insurance risk from other insurers.
Insurance contracts may be issued and reinsurance contracts may be initiated by the Group, or they may be acquired in a business combination or in a transfer of contracts that do not form a business. All references in these accounting policies to ‘insurance contracts’ and ‘reinsurance contracts’ include contracts issued, initiated or acquired by the Group, unless otherwise stated.
Some contracts entered into by the Group have the legal form of insurance contracts but do not transfer significant insurance risk. These contracts are classified as financial liabilities and are referred to as ‘investment contracts’ (see (F)).a
IFRS 17.3(c) a. The Group does not issue any investment contracts with discretionary participation features, which would be accounted for in accordance with IFRS 17.
The Group does not hold any contracts that have the legal form of reinsurance contracts but do not transfer significant insurance risk.
Intr
oduc
tion
Aud
itor
s’ r
epor
tPr
imar
y st
atem
ents
NO
TE
SFu
rthe
r re
sour
ces

© 2018 KPMG IFRG Limited, a UK company, limited by guarantee. All rights reserved.
Illustrative disclosures – Notes 199Accounting policies
Notes to the consolidated financial statements (continued)44. Significant accounting policies (continued)D. Insurance, reinsurance and investment contracts – Classification
(continued)[IFRS 17.A, B101– B102]
Insurance contracts are classified as direct participating contracts or contracts without direct participation features. Direct participating contracts are contracts for which, at inception:
– the contractual terms specify that the policyholder participates in a share of a clearly identified pool of underlying items;
– the Group expects to pay to the policyholder an amount equal to a substantial share of the fair value returns on the underlying items; and
– the Group expects a substantial proportion of any change in the amounts to be paid to the policyholder to vary with the change in fair value of the underlying items.
[IFRS 17.B109] All other insurance contracts and all reinsurance contracts are classified as contracts without direct participation features. Some of these contracts are measured under the PAA (see (E)(vi)).
E. Insurance and reinsurance contracts
i. Separating components from insurance and reinsurance contracts[IFRS 17.11, B31–B32, 9.2.1(e), 4.3.3]
At inception, the Group separates the following components from an insurance or reinsurance contract and accounts for them as if they were stand-alone financial instruments (see (G)):
– derivatives embedded in the contract whose economic characteristics and risks are not closely related to those of the host contract, and whose terms would not meet the definition of an insurance or reinsurance contract as a stand-alone instrument; and
– distinct investment components – i.e. investment components that are not highly inter-related with the insurance components and for which contracts with equivalent terms are sold, or could be sold, separately in the same market or the same jurisdiction.
[IFRS 17.12, B33–B35] After separating any financial instrument components, the Group separates any promises to transfer distinct goods or non-insurance services to policyholders and accounts for them as separate contracts with customers (i.e. not as insurance contracts). A good or service is distinct if the policyholder can benefit from it either on its own or with other resources that are readily available to the policyholder. A good or service is not distinct and is accounted for together with the insurance component if the cash flows and risks associated with the good or service are highly inter-related with the cash flows and risks associated with the insurance component, and the Group provides a significant service of integrating the good or service with the insurance component.
Intr
oduc
tion
Aud
itor
s’ r
epor
tPr
imar
y st
atem
ents
NO
TE
SFu
rthe
r re
sour
ces

© 2018 KPMG IFRG Limited, a UK company, limited by guarantee. All rights reserved.
200 | Guide to annual financial statements: IFRS 17 and IFRS 9 – Illustrative disclosures for insurers
Notes to the consolidated financial statements (continued)44. Significant accounting policies (continued)E. Insurance and reinsurance contracts (continued)
ii. Level of aggregation[IFRS 17.14, 16, A] The Group identifies portfolios of insurance contracts. Each portfolio comprises contracts that are
subject to similar risks and managed together, and is divided into three groups:
– any contracts that are onerous on initial recognition;
– any contracts that, on initial recognition, have no significant possibility of becoming onerous subsequently; and
– any remaining contracts in the portfolio.
IFRS 17.126, [IFRS 17.20]
Contracts within a portfolio that would fall into different groups only because law or regulation specifically constrains the Group’s practical ability to set a different price or level of benefits for policyholders with different characteristics are included in the same group. This applies to contracts issued in Europe that are required by regulation to be priced on a gender-neutral basis.
[IFRS 17.22, 24] Each group of insurance contracts is further divided by year of issue. The resulting groups represent the level at which the recognition and measurement accounting policies are applied. The groups are established on initial recognition and their composition is not reassessed subsequently.
Each group of reinsurance contracts comprises a single contract.
iii. Recognition[IFRS 17.25–26, A] The Group recognises a group of insurance contracts issued from the earliest of the following.
– The beginning of the coverage period of the group of contracts. The coverage period is the period during which the Group provides coverage for insured events in respect of all premiums within the boundary of an insurance contract.
– The date when the first payment from a policyholder in the group becomes due. If there is no contractual due date, then it is considered to be the date when the first payment is received from the policyholder.
– The date when facts and circumstances indicate that the group to which an insurance contract will belong is onerous.
[IFRS 17.62] The Group recognises a group of reinsurance contracts initiated that provide proportionate coverage at the later of the beginning of the coverage period of the group of reinsurance contracts and the initial recognition of any underlying contract, and recognises all other groups of reinsurance contracts from the beginning of the coverage period of the group of reinsurance contracts. The coverage period is the period during which the Group receives coverage for claims arising from the reinsured portions of the underlying insurance contracts.
[IFRS 17.22, 28] Subsequently, new contracts are added to the group when they are issued or initiated, provided that all contracts in the group are issued or initiated in the same year.
The Group recognises a group of contracts acquired at the date of acquisition.
Intr
oduc
tion
Aud
itor
s’ r
epor
tPr
imar
y st
atem
ents
NO
TE
SFu
rthe
r re
sour
ces
© 2018 KPMG IFRG Limited, a UK company, limited by guarantee. All rights reserved.
Illustrative disclosures – Notes 201Accounting policies
Notes to the consolidated financial statements (continued)44. Significant accounting policies (continued)E. Insurance and reinsurance contracts (continued)
iv. Contract boundaries[IFRS 17.33–34] The measurement of a group of contracts includes all of the future cash flows within the boundary
of each contract in the group. Cash flows are within the boundary of a contract if they arise from substantive rights and obligations that exist during the reporting period under which the Group can compel the policyholder to pay premiums or has a substantive obligation to provide services.
[IFRS 17.34] A substantive obligation to provide services ends when:
– the Group has the practical ability to reassess the risks of the particular policyholder and can set a price or level of benefits that fully reflects those reassessed risks; or
– the Group has the practical ability to reassess the risks of the portfolio that contains the contract and can set a price or level of benefits that fully reflects the risks of that portfolio; and the pricing of the premiums for coverage up to the reassessment date does not take into account risks that relate to periods after the reassessment date.
[IFRS 17.B64] The contract boundary is reassessed at each reporting date and, therefore, may change over time.
v. Measurement – Contracts not measured under the PAA
Insurance contracts – Initial measurement
[IFRS 17.32] On initial recognition, the Group measures a group of insurance contracts as the total of: (a) the fulfilment cash flows, which comprise estimates of future cash flows, adjusted to reflect the time value of money and the associated financial risks, and a risk adjustment for non-financial risk; and (b) the CSM.
[IFRS 17.31] The measurement of the fulfilment cash flows of a group of insurance contracts does not reflect non-performance risk.
[IFRS 17.27, 38(b), 79] Insurance acquisition cash flows that the Group pays before the related group of contracts is recognised are presented as an insurance contract asset. When the group of contracts is recognised, these cash flows are included in the measurement of the group and the previously recognised asset is derecognised.
[IFRS 17.37] The risk adjustment for non-financial risk for a group of insurance contracts is the compensation required for bearing uncertainty about the amount and timing of the cash flows that arises from non-financial risk.
[IFRS 17.38] The CSM of a group of insurance contracts represents the unearned profit that the Group will recognise as it provides services under those contracts. On initial recognition of a group of insurance contracts, if the total of the fulfilment cash flows, any derecognised assets for insurance acquisition cash flows and any cash flows arising at that date is a net inflow, then the group is not onerous. In this case, the CSM is measured as the equal and opposite amount of the net inflow, which results in no income or expenses arising on initial recognition.
[IFRS 17.B94–B95] For groups of contracts acquired, the consideration received for the contracts is included in the fulfilment cash flows as a proxy for the premiums received at the date of acquisition. In a business combination, the consideration received is the fair value of the contracts at that date.
[IFRS 17.47, B95] If the total is a net outflow, then the group is onerous. In this case, the net outflow is recognised as a loss in profit or loss, or as an adjustment to goodwill or a gain on a bargain purchase if the contracts are acquired in a business combination (see (A)(i)). A loss component is created to depict any losses recognised in profit or loss, which determines the amounts that are subsequently presented in profit or loss as reversals of losses on onerous groups (see (viii)).
Intr
oduc
tion
Aud
itor
s’ r
epor
tPr
imar
y st
atem
ents
NO
TE
SFu
rthe
r re
sour
ces
© 2018 KPMG IFRG Limited, a UK company, limited by guarantee. All rights reserved.
202 | Guide to annual financial statements: IFRS 17 and IFRS 9 – Illustrative disclosures for insurers
Notes to the consolidated financial statements (continued)44. Significant accounting policies (continued)E. Insurance and reinsurance contracts (continued)
v. Measurement – Contracts not measured under the PAA (continued)
Insurance contracts – Subsequent measurement
[IFRS 17.40, A] The carrying amount of a group of insurance contracts at each reporting date is the sum of the liability for remaining coverage and the liability for incurred claims. The liability for remaining coverage comprises (a) the fulfilment cash flows that relate to services that will be provided under the contracts in future periods and (b) any remaining CSM at that date. The liability for incurred claims comprises the fulfilment cash flows for incurred claims and expenses that have not yet been paid, including claims that have been incurred but not yet reported.
[IFRS 17.33(c), B72(a), B137]
The fulfilment cash flows of groups of insurance contracts are measured at the reporting date using current estimates of future cash flows, current discount rates and current estimates of the risk adjustment for non-financial risk. The CSM of each group of contracts subsequent to initial recognition is calculated every six months at 30 June at 31 December.a
Insurance contracts without direct participation features[IFRS 17.44, B72(b)] The carrying amount of the CSM at the end of each six-month period is the carrying amount at the
start of the six-month period, adjusted for:
– the CSM of any new contracts that are added to the group in the period;
– interest accreted on the carrying amount of the CSM during the period, measured at the discount rates on nominal cash flows that do not vary based on the returns on any underlying items determined on initial recognition;
– changes in fulfilment cash flows that relate to future services, except to the extent that:
- any increases in the fulfilment cash flows exceed the carrying amount of the CSM, in which case the excess is recognised as a loss in profit or loss and creates a loss component (see (viii)); or
- any decreases in the fulfilment cash flows are allocated to the loss component, reversing losses previously recognised in profit or loss (see (viii));
– the effect of any currency exchange differences on the CSM; and
– the amount recognised as insurance revenue because of the services provided in the period (see (viii)).
[IFRS 17.B72(c), B96] Changes in fulfilment cash flows that relate to future services comprise:
– experience adjustments arising from premiums received in the period that relate to future services and related cash flows, measured at the discount rates determined on initial recognition;
– changes in estimates of the present value of future cash flows in the liability for remaining coverage, measured at the discount rates determined on initial recognition, except for those that relate to the effects of the time value of money, financial risk and changes therein;
– differences between any investment component expected to become payable in the period and the actual investment component that becomes payable in the period, measured at the discount rates determined on initial recognition; and
– changes in the risk adjustment for non-financial risk that relate to future services.
[IFRS 17.B98] Changes in discretionary cash flows are regarded as relating to future services and accordingly adjust the CSM (see Note 29(E)(i)).
IFRS 17.B137, BC236
a. The Group calculates the CSM of groups of contracts at 30 June as well as 31 December because it prepares interim financial statements at 30 June. An entity does not change the treatment of accounting estimates made in previous interim financial statements when applying IFRS 17 in subsequent interim or annual financial statements.
Intr
oduc
tion
Aud
itor
s’ r
epor
tPr
imar
y st
atem
ents
NO
TE
SFu
rthe
r re
sour
ces
© 2018 KPMG IFRG Limited, a UK company, limited by guarantee. All rights reserved.
Illustrative disclosures – Notes 203Accounting policies
Notes to the consolidated financial statements (continued)44. Significant accounting policies (continued)E. Insurance and reinsurance contracts (continued)
v. Measurement – Contracts not measured under the PAA (continued)
Insurance contracts – Subsequent measurement (continued)
Direct participating contracts[IFRS 17.B104] Direct participating contracts (see (D)) are contracts under which the Group’s obligation to the
policyholder is the net of:
– the obligation to pay the policyholder an amount equal to the fair value of the underlying items; and
– a variable fee in exchange for future services provided by the contracts, being the Group’s share of the fair value of the underlying items less fulfilment cash flows that do not vary based on the returns on underlying items.
[IFRS 17.B111–B112] When measuring a group of direct participating contracts, the Group adjusts the fulfilment cash flows for the whole of the changes in the obligation to pay policyholders an amount equal to the fair value of the underlying items. These changes do not relate to future services and are recognised in profit or loss. The Group then adjusts any CSM for changes in the Group’s share of the fair value of the underlying items, which relate to future services, as explained below.
[IFRS 17.45, B115– B118]
The carrying amount of the CSM at the end of each six-month period is the carrying amount at the start of the six-month period, adjusted for:
– the CSM of any new contracts that are added to the group in the period;
– the Group’s share of the change in the fair value of the underlying items and changes in fulfilment cash flows that relate to future services, except to the extent that:
- the Group has chosen to exclude from the CSM changes in the effect of financial risk on its share of the underlying items (see Note 29(E)(ii));
- the Group’s share of a decrease in the fair value of the underlying items, or an increase in the fulfilment cash flows that relate to future services, exceeds the carrying amount of the CSM, giving rise to a loss in profit or loss (included in insurance service expenses) and creating a loss component (see (viii)); or
- the Group’s share of an increase in the fair value of the underlying items, or a decrease in the fulfilment cash flows that relate to future services, is allocated to the loss component, reversing losses previously recognised in profit or loss (included in insurance service expenses) (see (viii));
– the effect of any currency exchange differences on the CSM; and
– the amount recognised as insurance revenue because of the services provided in the period (see (viii)).
[IFRS 17.B113] Changes in fulfilment cash flows that relate to future services include the changes relating to future services specified above for contracts without direct participation features (measured at current discount rates) and the effect of the time value of money and financial risks – e.g. the effect of financial guarantees.
Intr
oduc
tion
Aud
itor
s’ r
epor
tPr
imar
y st
atem
ents
NO
TE
SFu
rthe
r re
sour
ces
© 2018 KPMG IFRG Limited, a UK company, limited by guarantee. All rights reserved.
204 | Guide to annual financial statements: IFRS 17 and IFRS 9 – Illustrative disclosures for insurers
Notes to the consolidated financial statements (continued)44. Significant accounting policies (continued)E. Insurance and reinsurance contracts (continued)
v. Measurement – Contracts not measured under the PAA (continued)
Reinsurance contracts
The Group applies the same accounting policies to measure a group of reinsurance contracts, with the following modifications.
The carrying amount of a group of reinsurance contracts at each reporting date is the sum of the remaining coverage component and the incurred claims component. The remaining coverage component comprises (a) the fulfilment cash flows that relate to services that will be received under the contracts in future periods and (b) any remaining CSM at that date.
[IFRS 17.63, 67, BC309]
The Group measures the estimates of the present value of future cash flows using assumptions that are consistent with those used to measure the estimates of the present value of future cash flows for the underlying insurance contracts, with an adjustment for any risk of non-performance by the reinsurer. The effect of the non-performance risk of the reinsurer is assessed at each reporting date and the effect of changes in the non-performance risk is recognised in profit or loss.
[IFRS 17.64] The risk adjustment for non-financial risk is the amount of the risk transferred by the Group to the reinsurer.
[IFRS 17.65] On initial recognition, the CSM of a group of reinsurance contracts represents a net cost or net gain on purchasing reinsurance. It is measured as the equal and opposite amount of the total of the fulfilment cash flows, any derecognised assets for cash flows occurring before the recognition of the group and any cash flows arising at that date. However, if any net cost on purchasing reinsurance coverage relates to insured events that occurred before the purchase of the group, then the Group recognises the cost immediately in profit or loss as an expense.
[IFRS 17.66, B72(b)] The carrying amount of the CSM at the end of each six-month period is the carrying amount at the start of the six-month period, adjusted for:
– the CSM of any new contracts that are added to the group in the period;
– interest accreted on the carrying amount of the CSM during the period, measured at the discount rates on nominal cash flows that do not vary based on the returns on any underlying items determined on initial recognition;
– changes in fulfilment cash flows that relate to future services, except to the extent that a change results from a change in fulfilment cash flows allocated to a group of underlying insurance contracts that does not adjust the CSM of the group of underlying contracts, in which case the change is recognised in profit or loss;
– the effect of any currency exchange differences on the CSM; and
– the amount recognised in profit or loss because of the services received in the period (see (viii)).
[IFRS 17.68] Reinsurance contracts cannot be onerous.
vi. Measurement – Contracts measured under the PAA
IFRS 17.97(a), [IFRS 17.53, 69]
In the non-life segment, the Group generally uses the PAA to simplify the measurement of groups of contracts on the following bases:
– insurance contracts: the coverage period of each contract in the group of contracts is one year or less; and
– reinsurance contracts: the Group reasonably expects that the resulting measurement would not differ materially from the result of applying the accounting policies in (v).
However, certain groups of insurance contracts are acquired in their claims settlement period. The claims from some of these groups are expected to develop over more than one year. The Group measures these groups under the accounting policies in (v).
Intr
oduc
tion
Aud
itor
s’ r
epor
tPr
imar
y st
atem
ents
NO
TE
SFu
rthe
r re
sour
ces
© 2018 KPMG IFRG Limited, a UK company, limited by guarantee. All rights reserved.
Illustrative disclosures – Notes 205Accounting policies
Notes to the consolidated financial statements (continued)44. Significant accounting policies (continued)E. Insurance and reinsurance contracts (continued)
vi. Measurement – Contracts measured under the PAA (continued)
Insurance contracts
IFRS 17.97(c), [IFRS 17.55(a), 59(a)]
On initial recognition of each group of contracts, the carrying amount of the liability for remaining coverage is measured at the premiums received on initial recognition. Insurance acquisition cash flows are recognised as expenses when they are incurred.a
IFRS 17.97(b), [IFRS 17.55(b)–56]
Subsequently, the carrying amount of the liability for remaining coverage is increased by any premiums received and decreased by the amount recognised as insurance revenue for coverage provided (see (viii)). On initial recognition of each group of contracts, the Group expects that the time between providing each part of the coverage and the related premium due date is no more than a year. Accordingly, the Group has chosen not to adjust the liability for remaining coverage to reflect the time value of money and the effect of financial risk.
IFRS 17.97(b), [IFRS 17.57–58]
If at any time during the coverage period, facts and circumstances indicate that a group of contracts is onerous, then the Group recognises a loss in profit or loss and increases the liability for remaining coverage to the extent that the current estimates of the fulfilment cash flows that relate to remaining coverage (including the risk adjustment for non-financial risk) exceed the carrying amount of the liability for remaining coverage. The fulfilment cash flows are adjusted for the time value of money and the effect of financial risk (using current estimates) if the liability for incurred claims is also adjusted for the time value of money and the effect of financial risk (see below).
IFRS 17.97(b), [IFRS 17.59(b), B72(a)]
The Group recognises the liability for incurred claims of a group of insurance contracts at the amount of the fulfilment cash flows relating to incurred claims. The fulfilment cash flows are discounted (at current rates) unless the cash flows are expected to be paid in one year or less from the date the claims are incurred.
Reinsurance contracts
[IFRS 17.69] The Group applies the same accounting policies to measure a group of reinsurance contracts, adapted where necessary to reflect features that differ from those of insurance contracts.
vii. Derecognition and contract modification
[IFRS 17.74(a)] The Group derecognises a contract when it is extinguished – i.e. when the specified obligations in the contract expire or are discharged or cancelled.
[IFRS 17.72–73, 74(b)] The Group also derecognises a contract if its terms are modified in a way that would have changed the accounting for the contract significantly had the new terms always existed, in which case a new contract based on the modified terms is recognised. If a contract modification does not result in derecognition, then the Group treats the changes in cash flows caused by the modification as changes in estimates of fulfilment cash flows.
[IFRS 17.76] On the derecognition of a contract from within a group of contracts:
– the fulfilment cash flows allocated to the group are adjusted to eliminate those that relate to the rights and obligations derecognised;
– the CSM of the group is adjusted for the change in the fulfilment cash flows, except where such changes are allocated to a loss component; and
– the number of coverage units for the expected remaining coverage is adjusted to reflect the coverage units derecognised from the group (see (viii)).
[IFRS 17.77] If a contract is derecognised because it is transferred to a third party, then the CSM is also adjusted for the premium charged by the third party, unless the group is onerous.
IFRS 17.59(a) a. For contracts measured under the PAA, the coverage period for each contract issued is one year or less and the Group has chosen to recognise insurance acquisition cash flows as an expense when they are incurred. Entities may instead decide to include insurance acquisition cash flows in the measurement of the liability for remaining coverage.
Intr
oduc
tion
Aud
itor
s’ r
epor
tPr
imar
y st
atem
ents
NO
TE
SFu
rthe
r re
sour
ces
© 2018 KPMG IFRG Limited, a UK company, limited by guarantee. All rights reserved.
206 | Guide to annual financial statements: IFRS 17 and IFRS 9 – Illustrative disclosures for insurers
Notes to the consolidated financial statements (continued)44. Significant accounting policies (continued)E. Insurance and reinsurance contracts (continued)
vii. Derecognition and contract modification (continued)
[IFRS 17.77] If a contract is derecognised because its terms are modified, then the CSM is also adjusted for the premium that would have been charged had the Group entered into a contract with the new contract’s terms at the date of modification, less any additional premium charged for the modification. The new contract recognised is measured assuming that, at the date of modification, the issuer received the premium that it would have charged less any additional premium charged for the modification.
viii. Presentation[IFRS 17.78] Groups of insurance contracts that are assets and those that are liabilities, and groups of
reinsurance contracts that are assets and those that are liabilities, are presented separately in the statement of financial position.
[IFRS 17.80] The Group disaggregates amounts recognised in the statement of profit or loss and OCI into (a) an insurance service result, comprising insurance revenue and insurance service expenses, and (b) insurance finance income or expenses.
[IFRS 17.82, 86] Income and expenses from reinsurance contracts are presented separately from income and expenses from insurance contracts. Income and expenses from reinsurance contracts, other than insurance finance income or expenses, are presented on a net basis as ‘net expenses from reinsurance contracts’ in the insurance service result.
IFRS 17.117(c)(ii), [IFRS 17.81]
The Group does not disaggregate changes in the risk adjustment for non-financial risk between the insurance service result and insurance finance income or expenses. All changes in the risk adjustment for non-financial risk are included in the insurance service result.
[IFRS 17.85] Insurance revenue excludes any investment components and is measured as follows.
Insurance revenue – Contracts not measured under the PAA
[IFRS 17.83, B121–B124]
The Group recognises insurance revenue as it satisfies its performance obligations – i.e. as it provides coverage or other services under groups of insurance contracts. For contracts not measured under the PAA, the insurance revenue relating to services provided for each period represents the total of the changes in the liability for remaining coverage that relate to services for which the Group expects to receive consideration.
[IFRS 17.83, B121, B125]
In addition, the Group allocates a portion of premiums that relate to recovering insurance acquisition cash flows to each period in a systematic way based on the passage of time. The Group recognises the allocated amount as insurance revenue and an equal amount as insurance service expenses.
[IFRS 17.B119] The amount of the CSM of a group of insurance contracts that is recognised as insurance revenue in each six-month period is determined by identifying the coverage units in the group, allocating the CSM remaining at the end of the six-month period (before any allocation) equally to each coverage unit provided in the six-month period and expected to be provided in future periods, and recognising in profit or loss the amount of the CSM allocated to coverage units provided in the six-month period. The number of coverage units is the quantity of coverage provided by the contracts in the group, determined by considering for each contract the quantity of benefits provided (see Note 29(E)(ii)) and its expected coverage duration.
Insurance revenue – Contracts measured under the PAA
[IFRS 17.B126] For contracts measured under the PAA, the insurance revenue for each period is the amount of expected premium receipts for providing coverage in the period. The Group allocates the expected premium receipts to each period on the following bases:
– certain property contracts: the expected timing of incurred insurance service expenses; and
– other contracts: the passage of time.
Intr
oduc
tion
Aud
itor
s’ r
epor
tPr
imar
y st
atem
ents
NO
TE
SFu
rthe
r re
sour
ces
© 2018 KPMG IFRG Limited, a UK company, limited by guarantee. All rights reserved.
Illustrative disclosures – Notes 207Accounting policies
Notes to the consolidated financial statements (continued)44. Significant accounting policies (continued)E. Insurance and reinsurance contracts (continued)
viii. Presentation (continued)
Loss components
[IFRS 17.49] For contracts not measured under the PAA, the Group establishes a loss component of the liability for remaining coverage for onerous groups of insurance contracts. The loss component determines the amounts of fulfilment cash flows that are subsequently excluded from insurance revenue when they occur. When the fulfilment cash flows occur, they are allocated between the loss component and the liability for remaining coverage excluding the loss component on a systematic basis.
[IFRS 17.IE93, IE96] The systematic basis is determined by the proportion of the loss component relative to the total estimate of the present value of the future cash outflows plus the risk adjustment for non-financial risk at the beginning of each period (or on initial recognition if a group of contracts is initially recognised in the period).
[IFRS 17.50–51] Changes in estimates of cash flows relating to future services and changes in the Group’s share of the fair value of any underlying items are allocated solely to the loss component. If the loss component is reduced to zero, then any excess over the amount allocated to the loss component creates a new CSM for the group of contracts.
Net expenses from reinsurance contracts
[IFRS 17.86] Net expenses from reinsurance contracts comprise reinsurance service expenses less amounts recovered from reinsurers.
The Group recognises reinsurance service expenses as it receives coverage or other services under groups of reinsurance contracts. For contracts not measured under the PAA, the reinsurance service expenses relating to services received for each reporting period represent the total of the changes in the remaining coverage component that relate to services for which the Group expects to pay consideration.
For contracts measured under the PAA, the reinsurance service expenses for each period are the amount of expected premium payments for receiving coverage in the period.
Insurance finance income and expenses
[IFRS 17.87] Insurance finance income and expenses comprise changes in the carrying amounts of groups of insurance and reinsurance contracts arising from the effects of the time value of money, financial risk and changes therein, unless any such changes for groups of direct participating contracts are allocated to a loss component and included in insurance service expenses (see (v)).
IFRS 17.118, [IFRS 17.88(b)]
For life risk and life savings contracts, the Group has chosen to disaggregate insurance finance income and expenses between profit or loss and OCI.a The amount included in profit or loss is determined by a systematic allocation of the expected total insurance finance income and expenses over the duration of the group of contracts. The systematic allocation is determined using the following rates:
[IFRS 17.B131] – life risk contracts: the discount rates determined on initial recognition of the group of contracts; and
[IFRS 17.B132(a)(i), (c)(i)]
– deferred fixed annuity and universal life contracts: for insurance finance income and expenses arising from the estimates of future cash flows, a rate that allocates the remaining revised expected finance income or expenses over the remaining duration of the group of contracts at a constant rate (i.e. the effective yield); and for finance income or expenses arising from the CSM, the discount rates determined on initial recognition of the group of contracts.
IFRS 17.B129, IAS 8.13
a. The accounting policy choice whether to disaggregate insurance finance income and expenses between profit or loss and OCI is made for each portfolio of insurance or reinsurance contracts. The Group selects and applies consistent accounting policies for similar portfolios of contracts. In assessing whether portfolios of contracts are similar, the Group considers for each portfolio the assets that it holds and how it accounts for them.
Intr
oduc
tion
Aud
itor
s’ r
epor
tPr
imar
y st
atem
ents
NO
TE
SFu
rthe
r re
sour
ces
© 2018 KPMG IFRG Limited, a UK company, limited by guarantee. All rights reserved.
208 | Guide to annual financial statements: IFRS 17 and IFRS 9 – Illustrative disclosures for insurers
Notes to the consolidated financial statements (continued)44. Significant accounting policies (continued)E. Insurance and reinsurance contracts (continued)
viii. Presentation (continued)
Insurance finance income and expenses (continued)
[IFRS 17.91(a)] Amounts presented in OCI are accumulated in the insurance finance reserve. If the Group derecognises a contract without direct participation features as a result of a transfer to a third party or a contract modification, then any remaining amounts of accumulated OCI for the contract are reclassified to profit or loss as a reclassification adjustment.a
[IFRS 17.88(a), 89(a)] The Group presents insurance finance income and expenses for all other contracts in profit or loss.
IFRS 17.115 ix. Contracts measured under the modified retrospective approachb [IFRS 17.C5–C8] On transition to IFRS 17, the Group applied the modified retrospective approach in identifying
and measuring certain groups of contracts in the life risk, life savings and participating segments at 1 January 2020. The objective of this approach was to achieve the closest outcome to retrospective application possible using reasonable and supportable information available without undue cost or effort. The Group applied each of the following modifications only to the extent that it did not have reasonable and supportable information to apply IFRS 17 retrospectively.
The Group applied IFRS 17 retrospectively for all contracts issued or acquired on or after 1 January 2016.
Assessments at inception or on initial recognition
[IFRS 17.C9(c)] For groups of deferred fixed annuity and universal life contracts issued before 1 January 2008, the Group determined how to identify discretionary cash flows (see Note 29(E)(i)) using information available at 1 January 2020. These contracts represented 12% of the total number of deferred fixed annuity and universal life contracts at 1 January 2020.
[IFRS 17.C10, C18(a)] Some groups of immediate fixed annuity contracts issued before 30 September 2006 contain contracts issued more than one year apart. For these groups, the discount rates at 1 January 2020 were used for subsequent measurement instead of the discount rates on initial recognition. These contracts represented 8% of the total number of immediate fixed annuity contracts at 1 January 2020.
Contracts without direct participation features
The Group applied the following modifications to certain groups of contracts.
[IFRS 17.C12] – For groups of contracts issued or acquired before 1 January 2016, the future cash flows on initial recognition were estimated by adjusting the amount at 1 January 2016 or an earlier date (determined retrospectively) for the cash flows that were known to have occurred before that date. The earliest date on which future cash flows could be determined retrospectively for any group of contracts was 1 January 2012.
IFRS 17.91(b) a. The Group does not disaggregate insurance finance income or expenses from direct participating contracts between profit or loss and OCI. When an entity derecognises a direct participating contract as a result of a transfer to a third party or a contract modification, it does not reclassify to profit or loss any remaining amounts for the contract that were previously recognised in OCI.
IFRS 17.115 b. If an entity applies the modified retrospective approach or the fair value approach on transition to IFRS 17, then it explains how it determined the measurement of the contracts at the date of transition. This guide assumes that the Group has not applied the fair value approach to any groups of contracts on transition to IFRS 17.
Intr
oduc
tion
Aud
itor
s’ r
epor
tPr
imar
y st
atem
ents
NO
TE
SFu
rthe
r re
sour
ces
© 2018 KPMG IFRG Limited, a UK company, limited by guarantee. All rights reserved.
Illustrative disclosures – Notes 209Accounting policies
Notes to the consolidated financial statements (continued)44. Significant accounting policies (continued)E. Insurance and reinsurance contracts (continued)
ix. Contracts measured under the modified retrospective approach (continued)
Contracts without direct participation features (continued)
[IFRS 17.C13(b), C15(a), C19(a)]
– For groups of contracts issued or acquired before 1 January 2012 (except for some groups of immediate fixed annuity contracts issued before 30 September 2006 – see above), the illiquidity premiums applied to the risk-free yield curves on initial recognition were estimated by determining an average spread between the risk-free yield curves and the discount rates determined retrospectively for the period between 1 January 2012 and 1 January 2020.a The resulting discount rates were used for subsequent measurement instead of the discount rates on initial recognition.
[IFRS 17.C14] – For some groups of contracts, the risk adjustment for non-financial risk on initial recognition was determined by adjusting the amount at 1 January 2020 for the expected release of risk before 1 January 2020. The expected release of risk was determined with reference to the release of risk for similar insurance contracts that the Group issued at 1 January 2020.
When any of these modifications was used to determine the CSM (or the loss component) on initial recognition:
[IFRS 17.C15(b)] – the amount of the CSM recognised in profit or loss before 1 January 2020 was determined by comparing the coverage units on initial recognition and the remaining coverage units at 1 January 2020; and
[IFRS 17.C16] – the amount allocated to the loss component before 1 January 2020 was determined using the proportion of the loss component relative to the total estimate of the present value of the future cash outflows plus the risk adjustment for non-financial risk on initial recognition.
[IFRS 17.C19(b)(ii)] For all groups of deferred fixed annuity and universal life contracts measured under the modified retrospective approach, the amount of insurance finance income and expenses accumulated in the insurance finance reserve at 1 January 2020 was determined to be zero.
Direct participating contracts
[IFRS 17.C17] For all groups of contracts issued or acquired before 1 January 2016, the Group determined the CSM (or the loss component) at 1 January 2020 by calculating a proxy for the total CSM for all services to be provided under the group as follows.
– The fair value of the underlying items at 1 January 2020 minus the fulfilment cash flows at 1 January 2020, adjusted for:
- amounts charged to the policyholders before 1 January 2020;
- amounts paid before 1 January 2020 that would not have varied based on the underlying items; and
- the change in the risk adjustment for non-financial risk caused by the release from risk before 1 January 2020.
If the calculation resulted in a CSM, then the Group measured the CSM at 1 January 2020 by deducting the CSM related to services provided before 1 January 2020. The CSM related to services provided before 1 January 2020 was determined by comparing the coverage units on initial recognition and the remaining coverage units at 1 January 2020.
If the calculation resulted in a loss component, then the Group adjusted the loss component to zero and increased the liability for remaining coverage excluding the loss component by the same amount at 1 January 2020.
IFRS 17.C2(b), C13 a. Under the modified retrospective approach, an entity determines the discount rates that applied at the date of initial recognition using an observable yield curve that, for at least three years immediately before the date of transition, approximates the yield curve determined retrospectively if such an observable yield curve exists. If it does not exist, then an entity applies an average spread between an observable yield curve and the yield curve determined retrospectively over a period of at least three years immediately before the date of transition to the observable yield curve to estimate the discount rates that applied at the date of initial recognition. The date of transition is the beginning of the annual reporting period immediately preceding the date of initial application.
Intr
oduc
tion
Aud
itor
s’ r
epor
tPr
imar
y st
atem
ents
NO
TE
SFu
rthe
r re
sour
ces

© 2018 KPMG IFRG Limited, a UK company, limited by guarantee. All rights reserved.
210 | Guide to annual financial statements: IFRS 17 and IFRS 9 – Illustrative disclosures for insurers
Notes to the consolidated financial statements (continued)44. Significant accounting policies (continued)F. Investment contracts and collective investment schemes
[IFRS 15.7] Investment contracts comprise unit-linked and other investment-linked contracts that do not transfer significant insurance risk (see (D)). Such contracts are separated into two components: a financial liability (investment contract) and an investment management service contract. Recurring fees are conditional on the provision of investment management services and are attributed to the investment management service contract component. If an amount received from a customer exceeds the fair value of the investment contract issued, then the excess is attributed to the investment services component as an up-front fee.
Group entities also charge recurring fees for investment management services to a number of collective investment schemes. Interests in consolidated funds held by unrelated third parties are classified as financial liabilities (see (G)(vi)).
i. Financial liabilities[IFRS 9.3.1.1, 3.3.1, IAS 39.14, 39]
The Group recognises a financial liability, representing its contractual obligation to pass on the return on the underlying investments after the deduction of investment management fees (see (ii)), when the Group becomes a party to the contractual provisions. It derecognises the financial liability when the obligations specified in the contract expire or are discharged or cancelled. Amounts collected and paid that are attributable to the financial instrument component are adjusted against the financial liability.
IFRS 7.B5(a), [IFRS 13.47]
Financial liabilities arising from investment contracts and third party interests in consolidated funds are designated as at FVTPL on initial recognition. This is because these liabilities as well as the related assets are managed and their performance is evaluated on a fair value basis (see (G)(ii)). The fair value is the amount payable on demand because the holders can cancel their contracts at any time after contract inception.
ii. Investment management service contracts[IFRS 15.31, 46, B43] Recurring fees are calculated and recognised as revenue on a daily basis. Non-refundable up-front
fees give rise to material rights for future investment management services and are recognised as revenue over the period for which a customer is expected to continue receiving investment management services. For more information, see Note 11.
Incremental contract costs
IFRS 15.127, [IFRS 15.91–92, 99, 101]
Commissions and fees paid to brokers for securing new customers are generally recognised as assets (‘contract costs’), unless the Group does not expect to recover these costs. Contract costs are amortised over the estimated duration of the contracts on a straight-line basis and are reviewed for impairment regularly. They are included in ‘other assets’ in the statement of financial position and the amortisation and any impairment losses thereon are included in ‘other operating expenses’ in profit or loss.
Intr
oduc
tion
Aud
itor
s’ r
epor
tPr
imar
y st
atem
ents
NO
TE
SFu
rthe
r re
sour
ces
© 2018 KPMG IFRG Limited, a UK company, limited by guarantee. All rights reserved.
Illustrative disclosures – Notes 211Accounting policies
Notes to the consolidated financial statements (continued)44. Significant accounting policies (continued)
IFRS 7.21 G. Financial assets and financial liabilities
i. Recognition and initial measurementIFRS 7.B5(c), [IFRS 9.3.1.1–3.1.2, B3.1.3–B3.1.6, IAS 39.14, 38, AG53–56]
The Group recognises deposits with financial institutions and loans and borrowings on the date on which they are originated. All other financial instruments (including regular-way purchases and sales of financial assets) are recognised on the trade date, which is the date on which the Group becomes a party to the contractual provisions of the instrument.
[IFRS 9.5.1.1, IAS 39.43]
A financial asset or financial liability is initially measured at fair value plus, for a financial asset or financial liability not measured at FVTPL, transaction costs that are directly attributable to its acquisition or issue.
ii. Classification and subsequent measurement
Financial assets not derecognised before 1 January 2021
Classification[IFRS 9.4.1.1] On initial recognition, a financial asset is classified as measured at amortised cost, FVOCI or FVTPL.
[IFRS 9.4.4.1, 5.6.1] Financial assets are not reclassified subsequent to their initial recognition, unless the Group changes its business model for managing financial assets, in which case all affected financial assets are reclassified on the first day of the first reporting period following the change in the business model.
[IFRS 9.4.1.2] A financial asset is measured at amortised cost if it meets both of the following conditions and is not designated as at FVTPL:
– it is held within a business model whose objective is to hold assets to collect contractual cash flows; and
– its contractual terms give rise on specified dates to cash flows that are solely payments of principal and interest on the principal amount outstanding.
[IFRS 9.4.1.2A] A financial asset is measured at FVOCI if it meets both of the following conditions and is not designated as at FVTPL:
– it is held within a business model whose objective is achieved by both collecting contractual cash flows and selling financial assets; and
– its contractual terms give rise on specified dates to cash flows that are solely payments of principal and interest on the principal amount outstanding.
[IFRS 9.4.1.4, 5.7.5] On initial recognition of an equity investment that is not held for trading, the Group may irrevocably elect to present subsequent changes in fair value in OCI on an investment-by-investment basis.a
[IFRS 9.4.1.4–4.1.5] All financial assets not classified as measured at amortised cost or FVOCI as described above are measured at FVTPL. In addition, on initial recognition the Group may irrevocably designate a financial asset that otherwise meets the requirements to be measured at amortised cost or at FVOCI as at FVTPL if doing so eliminates or significantly reduces an accounting mismatch that would otherwise arise.
IFRS 7.B5(aa) The Group has designated certain debt investments in the participating and non-life segments as at FVTPL on initial recognition, because they relate to insurance contracts that are measured in a way that incorporates current information and all related insurance finance income and expenses are recognised in profit or loss. The assets would otherwise be measured at FVOCI.
[IAS 28.18] The Group’s interests in some associates are underlying items of participating contracts. The Group has elected to measure these investments at FVTPL because it manages them on a fair value basis.
a. The Group has not designated any equity investments as at FVOCI. This disclosure is provided for illustrative purposes only.
Intr
oduc
tion
Aud
itor
s’ r
epor
tPr
imar
y st
atem
ents
NO
TE
SFu
rthe
r re
sour
ces
© 2018 KPMG IFRG Limited, a UK company, limited by guarantee. All rights reserved.
212 | Guide to annual financial statements: IFRS 17 and IFRS 9 – Illustrative disclosures for insurers
Notes to the consolidated financial statements (continued)44. Significant accounting policies (continued)G. Financial assets and financial liabilities (continued)
ii. Classification and subsequent measurement (continued)
Financial assets not derecognised before 1 January 2021 (continued)
Business model assessment[IFRS 9.B4.1.2] The Group assesses the objective of the business model in which a financial asset is held for each
portfolio of financial assetsa because this best reflects the way that the business is managed and information is provided to management. The information considered includes:
[IFRS 9.B4.1.2B–B4.1.2C, B4.1.4A, B4.1.5]
– the stated policies and objectives for the portfolio and the operation of those policies in practice, including whether management’s strategy focuses on earning contractual interest income, maintaining a particular interest rate profile, matching the duration of the financial assets to the duration of any related liabilities or expected cash outflows or realising cash flows through the sale of assets;
– how the performance of the portfolio is evaluated and reported to the Group’s management;
– the risks that affect the performance of the business model (and the financial assets held within that business model) and how those risks are managed;
– how managers of the business are compensated – e.g. whether compensation is based on the fair value of the assets managed or the contractual cash flows collected; and
– the frequency, volume and timing of sales in prior periods, the reasons for such sales and expectations about future sales activity. However, information about sales activity is not considered in isolation, but as part of an overall assessment of how the Group’s stated objective for managing the financial assets is achieved and how cash flows are realised.
Transfers of financial assets to third parties in transactions that do not qualify for derecognition are not considered sales for this purpose, consistent with the Group’s continuing recognition of the assets.b
[IFRS 9.B4.1.6] Financial assets that are managed and whose performance is evaluated on a fair value basis, which include underlying items of participating contracts, and financial assets that are held for trading are measured at FVTPL because they are neither held to collect contractual cash flows nor held both to collect contractual cash flows and to sell financial assets.
IFRS 9.B4.1.1–B4.1.2, Insights 7A.4.70.30
a. The objective of the entity’s business model is not based on management’s intentions with respect to an individual instrument, but rather is determined at a higher level of aggregation. The assessment needs to reflect the way that an entity manages its business or businesses. A single reporting entity may have more than one business model for managing its financial instruments.
Insights 7A.4.110.50 b. IFRS 9 does not provide specific guidance for the business model assessment for portfolios of financial assets for which the entity’s objectives include selling some of those financial assets to third parties in transactions that do not qualify for derecognition of the sold assets. In our view, whether such a portfolio is considered consistent with a held-to-collect business model depends on the circumstances.
Intr
oduc
tion
Aud
itor
s’ r
epor
tPr
imar
y st
atem
ents
NO
TE
SFu
rthe
r re
sour
ces

© 2018 KPMG IFRG Limited, a UK company, limited by guarantee. All rights reserved.
Illustrative disclosures – Notes 213Accounting policies
Notes to the consolidated financial statements (continued)44. Significant accounting policies (continued)G. Financial assets and financial liabilities (continued)
ii. Classification and subsequent measurement (continued)
Financial assets not derecognised before 1 January 2021 (continued)
Assessment whether contractual cash flows are solely payments of principal and interest[IFRS 9.4.1.3(a), B4.1.7B]
For the purposes of this assessment, principal is defined as the fair value of the financial asset on initial recognition. However, the principal may change over time – e.g. if there are repayments of principal.
[IFRS 9.4.1.3(b), B4.1.7A, B4.1.9A–B4.1.9E]
Interest is defined as consideration for the time value of money, for the credit risk associated with the principal amount outstanding during a particular period of time and for other basic lending risks and costs (e.g. liquidity risk and administrative costs), as well as a profit margin.
[IFRS 9.4.1.10] In assessing whether the contractual cash flows are solely payments of principal and interest, the Group considers the contractual terms of the instrument. This includes assessing whether the financial asset contains a contractual term that could change the timing or amount of contractual cash flows such that it would not meet this condition. In making this assessment, the Group considers:
– contingent events that would change the amount or timing of cash flows;
– leverage features;
– prepayment and extension features;
– terms that limit the Group’s claim to cash flows from specified assets – e.g. non-recourse asset arrangements; and
– features that modify consideration of the time value of money – e.g. periodic reset of interest rates.
[IFRS 9.B4.1.11(b), B4.1.12–B4.1.12A]
A prepayment feature is consistent with the ‘solely payments of principal and interest’ criterion if the prepayment amount substantially represents unpaid amounts of principal and interest on the principal amount outstanding, which may include reasonable compensation for early termination of the contract. In addition, for a financial asset acquired at a premium or discount to its contractual par amount, a feature that permits or requires prepayment at an amount that substantially represents the contractual par amount plus accrued (but unpaid) contractual interest (which may also include reasonable compensation for early termination) is treated as consistent with this criterion if the fair value of the prepayment feature is insignificant on initial recognition.
IFRS 7.B5(e) Subsequent measurement and gains and losses
[IFRS 9.5.7.1] Financial assets at FVTPL
Measured at fair value. Net gains and losses, including any interest or dividend income and foreign exchange gains and losses, are recognised in profit or loss, unless they arise from derivatives designated as hedging instruments in net investment hedges (see (B)(iii)).
[IFRS 9.5.7.10–5.7.11] Debt investments at FVOCI
Measured at fair value. Interest income calculated using the effective interest method, foreign exchange gains and losses and impairment are recognised in profit or loss. Other net gains and losses are recognised in OCI and accumulated in the fair value reserve. On derecognition, gains and losses accumulated in OCI are reclassified to profit or loss.
[IFRS 9.5.7.5–5.7.6, B5.7.1]
Equity investments at FVOCI
Measured at fair value. Dividends are recognised as income in profit or loss unless they clearly represent a recovery of part of the cost of the investment. Other net gains and losses are recognised in OCI and are never reclassified to profit or loss.
[IFRS 9.5.7.2] Financial assets at amortised cost
Measured at amortised cost using the effective interest method. Interest income, foreign exchange gains and losses and impairment are recognised in profit or loss. Any gain or loss on derecognition is also recognised in profit or loss.
Intr
oduc
tion
Aud
itor
s’ r
epor
tPr
imar
y st
atem
ents
NO
TE
SFu
rthe
r re
sour
ces
© 2018 KPMG IFRG Limited, a UK company, limited by guarantee. All rights reserved.
214 | Guide to annual financial statements: IFRS 17 and IFRS 9 – Illustrative disclosures for insurers
Notes to the consolidated financial statements (continued)44. Significant accounting policies (continued)G. Financial assets and financial liabilities (continued)
ii. Classification and subsequent measurement (continued)
Financial assets derecognised before 1 January 2021
Classification
[IAS 39.9] The Group classified its financial assets into one of the following categories:
– financial assets at FVTPL, and within this category as:
- held-for-trading;
- derivative hedging instruments; or
- designated as at FVTPL;
– held-to-maturity investments;
– loans and receivables; and
– available-for-sale financial assets.
Subsequent measurement and gains and losses
[IAS 39.46, 55(a)] Financial assets at FVTPL
Measured at fair value. Net gains and losses, including any interest or dividend income and foreign exchange gains and losses, were recognised in profit or loss, unless they arose from derivatives designated as hedging instruments in net investment hedges (see (B)(iii)).
[IAS 39.46(b)] Held-to-maturity investments
Measured at amortised cost using the effective interest method.
[IAS 39.46(a)] Loans and receivables
Measured at amortised cost using the effective interest method.
[IAS 39.46, 55(b)] Available-for-sale financial assets
Measured at fair value. Interest income calculated using the effective interest method, dividends, foreign exchange gains and losses and impairment were recognised in profit or loss. Other net gains and losses were recognised in OCI and accumulated in the fair value reserve. On derecognition, gains and losses accumulated in OCI were reclassified to profit or loss.
Financial liabilities
Classification
[IFRS 9.4.2.1, IAS 39.47]
The Group classifies its financial liabilities, other than financial guarantees (see (vii)), into one of the following categories:
– financial liabilities at FVTPL, and within this category as:
- held-for-trading;
- derivative hedging instruments; or
- designated as at FVTPL; and
– financial liabilities at amortised cost.
IFRS 7.B5(a), [IFRS 9.4.2.2(b)]
The Group has designated investment contract liabilities and third party interests in consolidated funds as at FVTPL on initial recognition. This is because these liabilities as well as the related assets are managed and their performance is evaluated on a fair value basis.
[IFRS 9.B5.7.15(a)] All investment contract liabilities and third party interests in consolidated funds have a unit-linking feature whereby the amount due to contract holders is contractually determined on the basis of specified assets. The effect of the unit-linking feature on the fair value of the liability is asset-specific performance risk and not credit risk, and the liabilities are fully collateralised. The Group has determined that any residual credit risk is insignificant and has not had any impact on the fair value of the liabilities.
Intr
oduc
tion
Aud
itor
s’ r
epor
tPr
imar
y st
atem
ents
NO
TE
SFu
rthe
r re
sour
ces

© 2018 KPMG IFRG Limited, a UK company, limited by guarantee. All rights reserved.
Illustrative disclosures – Notes 215Accounting policies
Notes to the consolidated financial statements (continued)44. Significant accounting policies (continued)G. Financial assets and financial liabilities (continued)
ii. Classification and subsequent measurement (continued)
Financial liabilities (continued)
IFRS 7.B5(e) Subsequent measurement and gains and losses
[IFRS 9.4.2.1(a), 5.7.1, IAS 39.47(a), 55(a)]
Financial liabilities at FVTPL
Measured at fair value. Net gains and losses, including any interest expenses and foreign exchange gains and losses, are recognised in profit or loss, unless they arise from derivatives designated as hedging instruments in net investment hedges (see (B)(iii)).
[IFRS 9.5.7.2] Financial liabilities at amortised cost
Measured at amortised cost using the effective interest method. Interest expenses and foreign exchange gains and losses are recognised in profit or loss. Any gain or loss on derecognition is also recognised in profit or loss.
Interest on financial instruments not derecognised before 1 January 2021
[IFRS 9.5.4.1, A] Interest income and expenses are recognised in profit or loss using the effective interest method. The effective interest rate is the rate that exactly discounts estimated future cash payments or receipts through the expected life of the financial instrument to:
– the gross carrying amount of the financial asset; or
– the amortised cost of the financial liability.
[IFRS 9.A] The amortised cost of a financial asset or financial liability is the amount at which the financial asset or financial liability is measured on initial recognition minus the principal repayments, plus or minus the cumulative amortisation using the effective interest method of any difference between that initial amount and the maturity amount and, for financial assets, adjusted for any loss allowance.
The gross carrying amount of a financial asset is its amortised cost before adjusting for any loss allowance.
[IFRS 9.5.4.1, A] Financial assets not credit-impaired on initial recognition
If the financial asset is not credit-impaired, then interest income is calculated by applying the effective interest rate to the gross carrying amount of the asset. When calculating the effective interest rate, the Group estimates future cash flows considering all contractual terms of the asset, but not ECL.
[IFRS 9.5.4.1(b)–5.4.2]
If the financial asset has become credit-impaired subsequent to initial recognition, then interest income is calculated by applying the effective interest rate to the amortised cost of the asset. If the asset is no longer credit-impaired, then the calculation of interest income reverts to the gross basis.
For information on when financial assets are credit-impaired, see (iii).
[IFRS 9.5.4.1(a), A] Financial assets credit-impaired on initial recognition
Interest income is calculated by applying a credit-adjusted effective interest rate to the amortised cost of the asset. The credit-adjusted effective interest rate is calculated using estimated future cash flows including ECL. The calculation of interest income does not revert to a gross basis, even if the credit risk of the asset improves.
[IFRS 9.A] Financial liabilities Interest expenses are calculated by applying the effective interest rate to the amortised cost of the liability. When calculating the effective interest rate, the Group estimates future cash flows considering all contractual terms of the liability.
[IFRS 9.A] The calculation of the effective interest rate includes transaction costs and fees and points paid or received that are an integral part of the effective interest rate. Transaction costs are incremental costs that are directly attributable to the acquisition or issue of a financial asset or financial liability.
[IFRS 9.5.4.1] Interest revenue on financial assets not measured at FVTPL and other finance costs presented in profit or loss include interest on financial assets and financial liabilities measured at amortised cost and debt investments measured at FVOCI calculated on an effective interest basis.a
Insights 7A.10.70.20
a. IFRS allows significant scope for an entity to select its presentation of items of income and expenses relating to financial assets and financial liabilities as either interest or other line items. The manner of presentation of components of interest income and expenses in this guide is not mandatory, and other presentations are possible.
Intr
oduc
tion
Aud
itor
s’ r
epor
tPr
imar
y st
atem
ents
NO
TE
SFu
rthe
r re
sour
ces
© 2018 KPMG IFRG Limited, a UK company, limited by guarantee. All rights reserved.
216 | Guide to annual financial statements: IFRS 17 and IFRS 9 – Illustrative disclosures for insurers
Notes to the consolidated financial statements (continued)44. Significant accounting policies (continued)G. Financial assets and financial liabilities (continued)
ii. Classification and subsequent measurement (continued)
Interest on financial instruments derecognised before 1 January 2021
[IAS 39.9] Interest income and expenses were recognised in profit or loss using the effective interest method. The effective interest rate was the rate that exactly discounted the estimated future cash payments and receipts through the expected life of the financial asset or financial liability (or, where appropriate, a shorter period) to the carrying amount of the financial asset or financial liability. When calculating the effective interest rate, the Group estimated future cash flows considering all contractual terms of the financial instrument, but not future credit losses.
The calculation of the effective interest rate included transaction costs and fees and points paid or received that were an integral part of the effective interest rate. Transaction costs were incremental costs that were directly attributable to the acquisition or issue of a financial asset or financial liability.
Interest revenue on financial assets not measured at FVTPL and other finance costs presented in profit or loss included interest on financial assets and financial liabilities measured at amortised cost and available-for-sale financial assets calculated on an effective interest basis.a
Derivatives, including embedded derivatives
[IFRS 9.4.1.4, 4.2.1(a), 5.7.1, IAS 39.46, 47(a), 55(a)]
Derivatives, including embedded derivatives separated from their host contracts, are classified as held-for-trading, unless they form part of a qualifying net investment hedging relationship (see (B)(iii)). They are measured at fair value with changes in fair value recognised in profit or loss.
[IFRS 9.4.3.2] Derivatives may be embedded in another contractual arrangement (a host contract). For contracts that have not been derecognised at 1 January 2021 where the host contract is a financial asset in the scope of IFRS 9, the hybrid financial instrument as a whole is assessed for classification and the embedded derivative is not separated from the host contract.
[IFRS 9.2.1(e), IAS 39.2(e)]
A derivative embedded in a host insurance or reinsurance contract is not accounted for separately from the host contract if the embedded derivative itself meets the definition of an insurance or reinsurance contract (see (E)(i)).
[IFRS 9.4.3.3, B4.3.8(h), IAS 39.11, AG33(h)]
For other contracts, the Group accounts for an embedded derivative separately from the host contract when:
– the hybrid contract is not measured at FVTPL;
– the terms of the embedded derivative would have met the definition of a derivative if they were contained in a separate contract; and
– the economic characteristics and risks of the embedded derivative are not closely related to those of the host contract. In particular, an embedded derivative is closely related to a host insurance contract if they are so interdependent that the embedded derivative cannot be measured separately – i.e. without considering the host contract.
Insights 7.8.80.20 a. IFRS allows significant scope for an entity to select its presentation of items of income and expenses relating to financial assets and financial liabilities as either interest or other line items. The manner of presentation of components of interest income and expenses in this guide is not mandatory, and other presentations are possible.
Intr
oduc
tion
Aud
itor
s’ r
epor
tPr
imar
y st
atem
ents
NO
TE
SFu
rthe
r re
sour
ces
© 2018 KPMG IFRG Limited, a UK company, limited by guarantee. All rights reserved.
Illustrative disclosures – Notes 217Accounting policies
Notes to the consolidated financial statements (continued)44. Significant accounting policies (continued)G. Financial assets and financial liabilities (continued)
iii. Impairment
See also Note 5(E)(iv).
Financial assets not derecognised before 1 January 2021
[IFRS 9.2.1(b)(i), 5.5.1]
The Group recognises loss allowances for ECL on:
– financial assets measured at amortised cost;
– debt investments measured at FVOCI; and
– lease receivables.
[IFRS 9.5.5.3, 5.5.5, 5.5.15–5.5.16]
The Group measures loss allowances at an amount equal to lifetime ECL, except in the following cases, for which the amount recognised is 12-month ECL:
– debt securities that are determined to have low credit risk at the reporting date; and
– other financial instruments (other than lease receivables) for which credit risk has not increased significantly since initial recognition.
Loss allowances for lease receivables are always measured at an amount equal to lifetime ECL.a
[IFRS 9.A] Lifetime ECL are the ECL that result from all possible default events over the expected life of a financial instrument, whereas 12-month ECL are the portion of ECL that results from default events that are possible within the 12 months after the reporting date.
[IFRS 9.5.5.19, B5.5.38]
In all cases, the maximum period considered when estimating ECL is the maximum contractual period over which the Group is exposed to credit risk.
Measurement of ECL[IFRS 9.A, B5.5.28–B5.5.33]
ECL are a probability-weighted estimate of credit losses and are measured as follows:
– financial assets that are not credit-impaired at the reporting date: the present value of all cash shortfalls – i.e. the difference between the cash flows due to the entity in accordance with the contract and the cash flows that the Group expects to receive; and
– financial assets that are credit-impaired at the reporting date: the difference between the gross carrying amount and the present value of estimated future cash flows.
IFRS 9.5.5.15–5.5.16
a. For trade receivables and contract assets under IFRS 15 without a significant financing component and those to which the practical expedient in paragraph 63 of IFRS 15 has been applied, an entity is required to measure the loss allowance at an amount equal to lifetime ECL. For trade receivables and contract assets under IFRS 15 with a significant financing component and for lease receivables, an entity can choose as an accounting policy either to apply the general model for measuring loss allowance or always to measure the loss allowance at an amount equal to lifetime ECL. The Group has chosen the latter policy for its lease receivables and does not have any trade receivables or contract assets.
Intr
oduc
tion
Aud
itor
s’ r
epor
tPr
imar
y st
atem
ents
NO
TE
SFu
rthe
r re
sour
ces

© 2018 KPMG IFRG Limited, a UK company, limited by guarantee. All rights reserved.
218 | Guide to annual financial statements: IFRS 17 and IFRS 9 – Illustrative disclosures for insurers
Notes to the consolidated financial statements (continued)44. Significant accounting policies (continued)G. Financial assets and financial liabilities (continued)
iii. Impairment (continued)
Financial assets not derecognised before 1 January 2021 (continued)
Credit-impaired financial assets
IFRS 7.35F(d), 35G(a)(iii), [IFRS 9.A]
At each reporting date, the Group assesses whether financial assets measured at amortised cost and debt investments at FVOCI are credit-impaired. A financial asset is credit-impaired when one or more events that have a detrimental impact on the estimated future cash flows of the financial asset have occurred.
Evidence that a financial asset is credit-impaired includes the following observable data:
– significant financial difficulty of the borrower or issuer;
– a breach of contract such as a default or past-due event;
– the restructuring of an amount due to the Group on terms that the Group would not otherwise consider;
– it becoming probable that the borrower will enter bankruptcy or other financial reorganisation; or
– the disappearance of an active market for a security because of financial difficulties.
A financial asset that has been renegotiated due to a deterioration in the borrower’s condition is usually considered to be credit-impaired unless there is evidence that the risk of not receiving contractual cash flows has reduced significantly and there are no other indicators of impairment.
In assessing whether an investment in sovereign debt is credit-impaired, the Group considers the following factors:
– the market’s assessment of creditworthiness as reflected in the bond yields;
– the rating agencies’ assessments of creditworthiness;
– the country’s ability to access the capital markets for new debt issuance;
– the probability of debt being restructured, resulting in holders suffering losses through voluntary or mandatory debt forgiveness; and
– the international support mechanisms in place to provide the necessary support as ‘lender of last resort’ to that country, as well as the intention, reflected in public statements, of governments and agencies to use those mechanisms, including an assessment of the depth of those mechanisms and, irrespective of the political intent, whether there is the capacity to fulfil the required criteria.
Presentation of loss allowances in the statement of financial position[IFRS 9.5.5.1–5.5.2] Loss allowances for ECL are presented as follows:
– financial assets measured at amortised cost: the loss allowance is deducted from the gross carrying amount of the assets; and
– debt investments measured at FVOCI: the loss allowance is recognised in OCI and does not reduce the carrying amount of the financial asset in the statement of financial position.
Write-offIFRS 7.35F(e), [IFRS 9.5.4.4]
The gross carrying amount of a financial asset is written off (either partially or in full) to the extent that there is no realistic prospect of recovery. This is generally the case when the Group determines that the borrower does not have assets or sources of income that could generate sufficient cash flows to repay the amounts subject to the write-off. However, financial assets that are written off could still be subject to enforcement activities in order to comply with the Group’s procedures for recovery of amounts due.
Intr
oduc
tion
Aud
itor
s’ r
epor
tPr
imar
y st
atem
ents
NO
TE
SFu
rthe
r re
sour
ces
© 2018 KPMG IFRG Limited, a UK company, limited by guarantee. All rights reserved.
Illustrative disclosures – Notes 219Accounting policies
Notes to the consolidated financial statements (continued)44. Significant accounting policies (continued)G. Financial assets and financial liabilities (continued)
iii. Impairment (continued)
Financial assets derecognised before 1 January 2021
[IAS 39.58–59] At each reporting date, the Group assessed whether there was objective evidence that financial assets not measured at FVTPL were impaired. A financial asset or a group of financial assets was impaired when objective evidence demonstrated that a loss event had occurred after the initial recognition of the asset(s) and that the loss event had an impact on the future cash flows of the asset(s) that could be estimated reliably. This assessment was similar to determining whether a financial asset not derecognised before 1 January 2021 is credit-impaired (see above).
[IAS 39.61] In addition, for an investment in an equity instrument, a significant or prolonged decline in its fair value below its cost was objective evidence of impairment. In general, the Group considered a decline of 20% to be significant and a period of nine months to be prolonged. However, in specific circumstances a smaller decline or a shorter period might have been appropriate.a
Impairment losses on financial assets were recognised as follows.
[IAS 39.64] Financial assets at amortised cost
The Group considered evidence of impairment for these assets at both individual asset and collective levels. All individually significant assets were individually assessed for impairment. Those found not to be impaired were then collectively assessed for any impairment that had been incurred but not yet individually identified. Assets that were not individually significant were collectively assessed for impairment. Collective assessment was carried out by grouping together assets with similar risk characteristics.
In assessing collective impairment, the Group used historical information on the timing of recoveries and the amount of loss incurred, and made an adjustment if current economic and credit conditions were such that the actual losses were likely to be greater or lesser than suggested by historical trends.
[IAS 39.63, 65] An impairment loss was calculated as the difference between an asset’s carrying amount and the present value of the estimated future cash flows discounted at the asset’s original effective interest rate. Losses were recognised in profit or loss and reflected in an allowance account. When the Group considered that there were no realistic prospects of recovery of the asset, the relevant amounts were written off. If the amount of impairment loss subsequently decreased and the decrease was related objectively to an event occurring after the impairment was recognised, then the previously recognised impairment loss was reversed through profit or loss.
[IAS 39.67–70] Available-for-sale financial assets
Impairment losses on available-for-sale financial assets were recognised by reclassifying the losses accumulated in the fair value reserve to profit or loss. The amount reclassified was the difference between the acquisition cost (net of any principal repayment and amortisation) and the current fair value, less any impairment loss previously recognised in profit or loss. If the fair value of an impaired available-for-sale debt security subsequently increased and the increase was related objectively to an event occurring after the impairment loss was recognised, then the impairment loss was reversed through profit or loss. Impairment losses recognised in profit or loss for an investment in an equity instrument classified as available-for-sale were not reversed through profit or loss.
iv. Derecognition and contract modification
Financial assets
[IFRS 9.3.2.3–3.2.6, IAS 39.17–20]
The Group derecognises a financial asset when the contractual rights to the cash flows from the financial asset expire, or it transfers the rights to receive the contractual cash flows in a transaction in which substantially all of the risks and rewards of ownership of the financial asset are transferred or in which the Group neither transfers nor retains substantially all of the risks and rewards of ownership and it does not retain control of the financial asset.b
Insights 7.6.430.40 a. IFRS does not contain specific thresholds for ‘significant’ or ‘prolonged’. The Group has disclosed the criteria that it established and applied to determine whether a decline in a quoted market price was significant or prolonged.
Insights 7.8.415.40, 7A.10.700.40
b. The definition of ‘transfer’ in IFRS 9 and IAS 39 for the purpose of determining whether a financial asset should be derecognised is different from the one in IFRS 7 for the purposes of disclosures about transfers of financial assets.
Intr
oduc
tion
Aud
itor
s’ r
epor
tPr
imar
y st
atem
ents
NO
TE
SFu
rthe
r re
sour
ces
© 2018 KPMG IFRG Limited, a UK company, limited by guarantee. All rights reserved.
220 | Guide to annual financial statements: IFRS 17 and IFRS 9 – Illustrative disclosures for insurers
Notes to the consolidated financial statements (continued)44. Significant accounting policies (continued)G. Financial assets and financial liabilities (continued)
iv. Derecognition and contract modification (continued)
Financial assets (continued)
[IFRS 9.3.2.12, 5.7.10, B5.7.1, IAS 39.26, 55(b)]
On derecognition of a financial asset, the difference between the carrying amount at the date of derecognition and the consideration received (including any new asset obtained less any new liability assumed) is recognised in profit or loss. For debt investments at FVOCI and financial assets that had already been derecognised at 1 January 2021, the cumulative gain or loss previously recognised in OCI is reclassified from equity to profit or loss. The cumulative gain or loss on equity investments designated as at FVOCI is not reclassified to profit or loss.
[IFRS 9.3.2.6(b), IAS 39.20(b)]
The Group enters into transactions whereby it transfers assets recognised in its statement of financial position, but retains either all or substantially all of the risks and rewards of the transferred assets. In these cases, the transferred assets are not derecognised. Examples of such transactions are securities lending and sale-and-repurchase transactions (see Note 5(E)(iii)).
[IFRS 9.3.2.6(c)(ii), IAS 39.20(c)(ii)]
In transactions in which the Group neither retains nor transfers substantially all of the risks and rewards of ownership of a financial asset and it retains control over the asset, the Group continues to recognise the asset to the extent of its continuing involvement, determined by the extent to which it is exposed to changes in the value of the transferred asset.
[IFRS 9.B5.5.25] If the terms of a financial asset are modified, then the Group evaluates whether the cash flows of the modified asset are substantially different. If the cash flows are substantially different, then the contractual rights to cash flows from the original financial asset are deemed to have expired. In this case, the original financial asset is derecognised and a new financial asset is recognised at fair value.
[IFRS 9.5.4.3] If a financial asset measured at amortised cost is modified but not substantially, then the financial asset is not derecognised. If the asset had not been derecognised at 1 January 2021, then the Group recalculates the gross carrying amount of the financial asset by discounting the modified contractual cash flows at the original effective interest rate and recognises the resulting adjustment to the gross carrying amount as a modification gain or loss in profit or loss. If such a modification is carried out because of financial difficulties of the borrower (see (iii)), then the gain or loss is presented together with impairment losses; in other cases, it is presented as interest revenue.a
Financial liabilities
[IFRS 9.3.3.1–3.3.2, IAS 39.39–40]
The Group generally derecognises a financial liability when its contractual obligations expire or are discharged or cancelled. The Group also derecognises a financial liability when its terms are modified and the cash flows of the modified liability are substantially different, in which case a new financial liability based on the modified terms is recognised at fair value.
[IFRS 9.3.3.3, IAS 39.41]
On derecognition of a financial liability, the difference between the carrying amount extinguished and the consideration paid (including any non-cash assets transferred or liabilities assumed) is recognised in profit or loss.
[IFRS 9.3.3.5] Notwithstanding the above, when, and only when, the Group repurchases its financial liability and includes it as an underlying item of direct participating contracts, the Group may elect not to derecognise the financial liability. Instead, the Group may elect to continue to account for that instrument as a financial liability and to account for the repurchased instrument as if it were a financial asset and measure it at FVTPL. This election is irrevocable and is made on an instrument-by-instrument basis.
Insights 7A.7.350.70 a. There is no guidance in IFRS 9 on the line item in the statement of profit or loss and OCI in which gains or losses on the modification of financial assets should be presented. A modification gain or loss may not necessarily relate to impairment, because not all modifications are performed for credit risk reasons. Accordingly, an entity exercises judgement to determine an appropriate presentation for the gain or loss. It appears that if the modification is not related to financial difficulties of the borrower, then an entity may present the gain or loss from the modification in interest revenue. This is because the calculation of the modification gain or loss can be considered to be part of the application of the effective interest method.
Intr
oduc
tion
Aud
itor
s’ r
epor
tPr
imar
y st
atem
ents
NO
TE
SFu
rthe
r re
sour
ces
© 2018 KPMG IFRG Limited, a UK company, limited by guarantee. All rights reserved.
Illustrative disclosures – Notes 221Accounting policies
Notes to the consolidated financial statements (continued)44. Significant accounting policies (continued)G. Financial assets and financial liabilities (continued)
iv. Derecognition and contract modification (continued)
Financial liabilities (continued)
If a financial liability measured at amortised cost is modified but not substantially, then it is not derecognised.
[IFRS 9.B3.3.6, BC4.253, IU 03-17]
– For financial liabilities that had not been derecognised at 1 January 2021, the Group recalculates the amortised cost of the financial liability by discounting the modified contractual cash flows at the original effective interest rate and recognises any resulting adjustment to the amortised cost as a modification gain or loss in ‘other finance costs’ in profit or loss. Any costs and fees incurred adjust the carrying amount of the liability and are amortised over the remaining term of the modified liability.
– For financial liabilities that had been derecognised at 1 January 2021, the Group recognised any difference in present value as an adjustment to the effective interest rate and amortised it over the remaining life of the modified financial liability, with no immediate gain or loss recognised.
v. Cash and cash equivalents[IAS 7.46] Cash and cash equivalents include cash balances and call deposits with original maturities of three
months or less from the date of acquisition that are subject to an insignificant risk of changes in their fair value, and are used by the Group in the management of its short-term commitments.
[IAS 7.8] Bank overdrafts that are repayable on demand and form an integral part of the Group’s cash management are included as a component of cash and cash equivalents for the purposes of the statement of cash flows.
vi. Capital instruments
[IAS 32.15] The Group classifies capital instruments as financial liabilities or equity instruments in accordance with the substance of the contractual terms of the instruments.
The Group’s redeemable preference shares are classified as financial liabilities, because they are mandatorily redeemable on maturity and bear non-discretionary coupons. They are measured at amortised cost and are included within ‘loans and borrowings’ in the statement of financial position.
The Group consolidates certain funds over which it has control. The units in these funds are redeemable at any time at the option of the holder. Accordingly, interests in the consolidated funds held by unrelated third parties are classified as financial liabilities. The Group has designated these liabilities as at FVTPL on initial recognition.
The accounting policies for capital instruments classified as equity are set out in (R).
vii. Financial guarantees issued
[IFRS 9.A, IAS 39.9] Financial guarantees are contracts that require the Group to make specified payments to reimburse the holder for a loss that it incurs because a specified debtor fails to make a payment when it is due in accordance with the terms of a debt instrument.
[IFRS 9.2.1(e), IAS 39.2(e)]
Financial guarantees issued by the Group are accounted for as insurance contracts and are included in ‘insurance contract liabilities’ (see (E)).
viii. Offsetting
[IAS 32.42] Financial assets and financial liabilities are offset and the net amount presented in the statement of financial position when, and only when, the Group currently has a legally enforceable right to set off the amounts and it intends either to settle them on a net basis or to realise the asset and settle the liability simultaneously.
[IAS 1.32–35] Income and expenses are presented on a net basis only when it is required or permitted by a standard – e.g. gains and losses arising from a group of similar transactions such as the gains and losses on financial assets measured at FVTPL.
Intr
oduc
tion
Aud
itor
s’ r
epor
tPr
imar
y st
atem
ents
NO
TE
SFu
rthe
r re
sour
ces
© 2018 KPMG IFRG Limited, a UK company, limited by guarantee. All rights reserved.
222 | Guide to annual financial statements: IFRS 17 and IFRS 9 – Illustrative disclosures for insurers
Notes to the consolidated financial statements (continued)44. Significant accounting policies (continued)H. Revenues
Revenues comprise:
– insurance revenue (see (E)(viii));
– investment revenue, which comprises interest revenue on financial assets not measured at FVTPL and other investment revenue. Other investment revenue includes net gains on financial assets at FVTPL and derivatives that do not form part of qualifying hedging relationships, net gains on derecognition of debt investments at FVOCI and lease income from and fair value gains on investment and owner-occupied properties (see (G)(ii), (M) and (N)(i)). Other investment revenue for 2020 also includes the net gains on derecognition and dividends from available-for-sale financial assets; and
– revenue from investment management services (see (F)(ii)).
I. Other finance costs
Other finance costs comprise:
– interest expenses and exchange differences on financial liabilities measured at amortised cost, including dividends on preference shares classified as financial liabilities and interest on lease liabilities (see (G)(ii) and (S)(i));
– unwinding of the discount on provisions (see (Q)); and
– the ineffective portion of the changes in the fair value of hedging instruments in net investment hedges and costs of hedging reclassified from OCI (see (B)(iii)).
J. Earnings per share[IAS 33.10, 31] The Group presents basic and diluted EPS data for its ordinary shares. Basic EPS are calculated
by dividing the profit or loss that is attributable to ordinary shareholders of the Company by the weighted-average number of ordinary shares outstanding during the period. Diluted EPS are determined by adjusting the profit or loss that is attributable to ordinary shareholders and the weighted-average number of ordinary shares outstanding for the effects of all dilutive potential ordinary shares, which comprise share options granted to employees.
K. Employee benefits
i. Defined contribution plans[IAS 19.28, 51] Obligations for contributions to defined contribution plans are expensed as the related service is
provided. Prepaid contributions are recognised as an asset to the extent that a cash refund or a reduction in future payments is available.
ii. Defined benefit plans[IAS 19.57, 83] The Group’s net obligation in respect of defined benefit plans is calculated separately for each plan
by estimating the amount of future benefit that employees have earned in the current and prior periods, discounting that amount and deducting the fair value of any plan assets.
[IAS 19.63–64, IFRIC 14.23–24]
The calculation of defined benefit obligations is performed annually by a qualified actuary using the projected unit credit method. When the calculation results in a potential asset for the Group, the recognised asset is limited to the present value of the economic benefits available in the form of any future refunds from the plan or reductions in future contributions to the plan. To calculate the present value of economic benefits, consideration is given to any applicable minimum funding requirements.
[IAS 19.122–123, 127–130]
Remeasurements of the net defined benefit liability, which comprise actuarial gains and losses, the return on plan assets (excluding interest) and the effect of the asset ceiling (if any, excluding interest), are recognised immediately in OCI. The Group determines the net interest expense (income) on the net defined benefit liability (asset) for the period by applying the discount rate used to measure the defined benefit obligation at the beginning of the annual period to the net defined benefit liability (asset) at that date, taking into account any changes in the net defined benefit liability (asset) during the period as a result of contributions and benefit payments. Net interest expense and other expenses related to defined benefit plans are recognised in profit or loss.
Intr
oduc
tion
Aud
itor
s’ r
epor
tPr
imar
y st
atem
ents
NO
TE
SFu
rthe
r re
sour
ces
© 2018 KPMG IFRG Limited, a UK company, limited by guarantee. All rights reserved.
Illustrative disclosures – Notes 223Accounting policies
Notes to the consolidated financial statements (continued)44. Significant accounting policies (continued)K. Employee benefits (continued)
ii. Defined benefit plans (continued)[IAS 19.103, 109–110, 120(a)]
When the benefits of a plan are changed or when a plan is curtailed, the resulting change in benefit that relates to past service or the gain or loss on curtailment is recognised immediately in profit or loss. The Group recognises gains and losses on the settlement of a defined benefit plan in profit or loss when the settlement occurs.
iii. Other long-term employee benefits[IAS 19.155–156] The Group’s net obligation in respect of other long-term employee benefits is the amount of future
benefit that employees have earned in return for their service in the current and prior periods. That benefit is discounted to determine its present value. Remeasurements are recognised in profit or loss in the period in which they arise.
iv. Termination benefits[IAS 19.165] Termination benefits are expensed at the earlier of when the Group can no longer withdraw the
offer of those benefits and when the Group recognises costs for a restructuring. If benefits are not expected to be settled wholly within 12 months of the reporting date, then they are discounted.
v. Short-term employee benefits[IAS 19.11] Short-term employee benefits are expensed as the related service is provided. A liability is
recognised for the amount expected to be paid if the Group has a present legal or constructive obligation to pay this amount as a result of past service provided by the employee and the obligation can be estimated reliably.
vi. Share-based payment arrangements[IFRS 2.14–15, 19–21A]
The grant-date fair value of equity-settled share-based payment arrangements granted to employees is generally recognised as an expense, with a corresponding increase in equity, over the vesting period of the awards. The amount recognised as an expense is adjusted to reflect the number of awards for which the related service and non-market performance conditions are expected to be met, such that the amount ultimately recognised is based on the number of awards that meet the related service and non-market performance conditions at the vesting date. For share-based payment awards with non-vesting conditions, the grant-date fair value of the share-based payment is measured to reflect such conditions and there is no true-up for differences between expected and actual outcomes.
[IFRS 2.30, 32] The fair value of the amount payable to employees in respect of SARs, which are settled in cash, is recognised as an expense with a corresponding increase in liabilities, over the period during which the employees become unconditionally entitled to payment. The liability is remeasured at each reporting date and at the settlement date based on the fair value of the SARs. Any changes in the liability are recognised in profit or loss.
Intr
oduc
tion
Aud
itor
s’ r
epor
tPr
imar
y st
atem
ents
NO
TE
SFu
rthe
r re
sour
ces
© 2018 KPMG IFRG Limited, a UK company, limited by guarantee. All rights reserved.
224 | Guide to annual financial statements: IFRS 17 and IFRS 9 – Illustrative disclosures for insurers
Notes to the consolidated financial statements (continued)44. Significant accounting policies (continued)L. Income tax
[IAS 12.58] Income tax expense comprises current and deferred tax. It is recognised in profit or loss except to the extent that it relates to a business combination, or items recognised directly in equity or in OCI.
[IU 09-17] The Group has determined that interest and penalties related to income taxes do not meet the definition of an income tax. They are therefore accounted for under the accounting policies in (Q).a
i. Current tax[IAS 12.2, 12, 46] Current tax comprises the expected tax payable or receivable on the taxable income or loss for the
year and any adjustment to the tax payable or receivable in respect of previous years. The amount of current tax payable or receivable is the best estimate of the tax amount expected to be paid or received that reflects uncertainty related to income taxes, if there is any. It is measured using tax rates enacted or substantively enacted at the reporting date.
[IAS 12.57A, 32.35A] Current tax also includes any tax arising from dividends to shareholders. The Group recognises the income tax consequences of dividends according to where it originally recognised the past transactions or events that generated distributable profits – i.e. profit or loss, OCI or equity.
[IAS 12.71] Current tax assets and liabilities are offset only if certain criteria are met.
ii. Deferred tax[IAS 12.15, 24, 39, 44] Deferred tax is recognised in respect of temporary differences between the carrying amounts of
assets and liabilities for financial reporting purposes and the amounts used for taxation purposes. Deferred tax is not recognised for:
– temporary differences on initial recognition of assets or liabilities in a transaction that is not a business combination and that affects neither the accounting nor taxable profit or loss;
– temporary differences related to investments in subsidiaries, associates and joint arrangements to the extent that the Group is able to control the timing of the reversal of the temporary differences and it is probable that they will not reverse in the foreseeable future; and
– taxable temporary differences arising on the initial recognition of goodwill.
[IAS 12.56] Deferred tax assets are recognised for unused tax losses, unused tax credits and deductible temporary differences to the extent that it is probable that future taxable profits will be available against which they can be used. Future taxable profits are determined based on the reversal of relevant taxable temporary differences. If the amount of taxable temporary differences is insufficient to recognise a deferred tax asset in full, then future taxable profits, adjusted for reversals of existing temporary differences, are considered, based on the business plans for individual subsidiaries in the Group. Deferred tax assets are reviewed at each reporting date and are reduced to the extent that it is no longer probable that the related tax benefit will be realised; these reductions are reversed when the probability of future taxable profits improves.
[IAS 12.37] Unrecognised deferred tax assets are reassessed at each reporting date and recognised to the extent that it has become probable that future taxable profits will be available against which they can be used.
[IAS 12.47] Deferred tax is measured at the tax rates that are expected to be applied to temporary differences when they reverse, using tax rates enacted or substantively enacted at the reporting date.
[IAS 12.51, 51C] The measurement of deferred tax reflects the tax consequences that would follow from the manner in which the Group expects, at the reporting date, to recover or settle the carrying amount of its assets and liabilities. For this purpose, the carrying amount of investment property measured at fair value is presumed to be recovered through sale, and the Group has not rebutted this presumption.
[IAS 12.74] Deferred tax assets and liabilities are offset only if certain criteria are met.
Insights 3.13.45.20 a. In our view, an entity should apply judgement, based on the specific facts and circumstances, including the substance of the tax legislation and the process of negotiation with the tax authorities in a specific jurisdiction, to determine if an interest or a penalty related to a particular income tax treatment, in its nature:
– is a separately identifiable financing charge or an operating expense, and therefore is not an income tax; or
– forms part of the tax treatment and therefore itself is an income tax.
Intr
oduc
tion
Aud
itor
s’ r
epor
tPr
imar
y st
atem
ents
NO
TE
SFu
rthe
r re
sour
ces
© 2018 KPMG IFRG Limited, a UK company, limited by guarantee. All rights reserved.
Illustrative disclosures – Notes 225Accounting policies
Notes to the consolidated financial statements (continued)44. Significant accounting policies (continued)M. Investment property
IAS 40.75(a), [IAS 40.7, 33, 35]
Investment property is measured initially at cost and subsequently at fair value with any change therein recognised in profit or loss.
[IAS 40.69] Any gain or loss on disposal of investment property (calculated as the difference between the net proceeds from disposal and the carrying amount of the item) is recognised in profit or loss.
N. Property and equipment
i. Owner-occupied property measured at fair value[IAS 16.29A–29B, 40.7, 33, 35]
When owner-occupied property is held as an underlying item of direct participating contracts, it is measured initially at cost and subsequently at fair value, with any change therein recognised in profit or loss.
[IAS 16.29A–29B, 40.69]
Any gain or loss on disposal of owner-occupied property measured at fair value (calculated as the difference between the net proceeds from disposal and the carrying amount of the item) is recognised in profit or loss.
ii. Other property and equipment owned
Recognition and measurement
IAS 16.73(a), [IAS 16.15, 30]
Other items of property and equipment are measured at cost less accumulated depreciation and accumulated impairment losses.
[IAS 16.45] If significant parts of an item of property and equipment have different useful lives, then they are accounted for as separate items (major components) of property and equipment.
[IAS 16.67, 71] The carrying amount of an item of property and equipment is derecognised on disposal or when no future economic benefits are expected from its use or disposal. Any gain or loss on disposal of an item of property and equipment (calculated as the difference between the net disposal proceeds and the carrying amount of the item) is recognised in profit or loss.
Subsequent expenditure
[IAS 16.13] Subsequent expenditure is capitalised only if it is probable that the future economic benefits associated with the expenditure will flow to the Group.
Depreciation
IAS 16.73(b), [IAS 16.48–49, 53, 58, 60]
Depreciation is calculated to write off the cost of items of property and equipment less their estimated residual values using the straight-line method over their estimated useful lives, and is generally recognised in profit or loss. Land is not depreciated.
IAS 16.73(c) The estimated useful lives of property and equipment for the current and comparative periods are as follows.
– Land and buildings: 50 years.
– IT equipment: 3–5 years.
– Fixtures and fittings: 5–10 years.
[IAS 16.51] Depreciation methods, useful lives and residual values are reviewed at each reporting date and adjusted if appropriate.
iii. Leased property and equipment
See (S)(i).
Intr
oduc
tion
Aud
itor
s’ r
epor
tPr
imar
y st
atem
ents
NO
TE
SFu
rthe
r re
sour
ces

© 2018 KPMG IFRG Limited, a UK company, limited by guarantee. All rights reserved.
226 | Guide to annual financial statements: IFRS 17 and IFRS 9 – Illustrative disclosures for insurers
Notes to the consolidated financial statements (continued)44. Significant accounting policies (continued)O. Intangible assets and goodwill
i. Recognition and measurement
[IAS 38.107–108] Goodwill Goodwill arising on the acquisition of subsidiaries is measured at cost (see (A)(i)) less accumulated impairment losses.
[IAS 38.74] Software Software is measured at cost less accumulated amortisation and accumulated impairment losses.
[IAS 38.57, 66] Expenditure on internally developed software is recognised as an asset only if the Group can demonstrate the technical feasibility to complete the development of the software, its intention and the availability of resources to complete the development and to use the software, and its ability to use the software in a manner that will generate probable future economic benefits and to measure the expenditure reliably.
[IAS 38.18, 20] Subsequent expenditure on internally developed software is capitalised only when it increases the future economic benefits embodied in the specific asset to which it relates. All other expenditure is recognised in profit or loss as it is incurred.
[IAS 38.74] Customer relationships
Customer relationships that are acquired by the Group and have finite useful lives are measured at cost less accumulated amortisation and accumulated impairment losses. These assets include the management service rights for investment contracts acquired, access to distribution networks and customer lists, and renewal rights for acquired portfolios of non-life insurance contracts.
ii. Amortisation[IAS 38.97, 99–100] Amortisation is calculated to write off the cost of intangible assets over their estimated useful lives,
and is generally recognised in profit or loss. None of the intangible assets are assumed to have a residual value. Goodwill is not amortised.
IAS 38.118(a)–(b), [IAS 38.97]
The estimated useful lives of intangible assets and the amortisation methods for the current and comparative periods are as follows.
Software 3–5 years using the straight-line method from the date the software is available for use.
Investment management service rights 3–10 years, being the expected remaining terms of the investment contracts, on a basis that is consistent with the recognition of the related revenue.
Other customer relationships 2–6 years using the straight-line method.
IAS 38.118(d) Amortisation is recognised in ‘insurance service expenses’ if it is directly attributable to insurance acquisition activities or other fulfilment activities (see Note 29(E)(i)); otherwise, it is recognised in ‘other operating expenses’.
[IAS 38.104] The useful lives and amortisation methods are reviewed at each reporting date and adjusted if appropriate.
Intr
oduc
tion
Aud
itor
s’ r
epor
tPr
imar
y st
atem
ents
NO
TE
SFu
rthe
r re
sour
ces
© 2018 KPMG IFRG Limited, a UK company, limited by guarantee. All rights reserved.
Illustrative disclosures – Notes 227Accounting policies
Notes to the consolidated financial statements (continued)44. Significant accounting policies (continued)P. Impairment of non-financial assets
[IAS 36.9–10] At each reporting date, the Group reviews the carrying amounts of its non-financial assets (other than insurance and reinsurance contract assets, investment property, deferred tax assets and employee benefit assets) to determine whether there is any indication of impairment. If any such indication exists, then the asset’s recoverable amount is estimated. Goodwill is tested annually for impairment.
[IAS 36.22, 80] For impairment testing, assets are grouped together into the smallest group of assets that generates cash inflows from continuing use that are largely independent of the cash inflows of other assets or CGUs. Goodwill arising from a business combination is allocated to CGUs or groups of CGUs that are expected to benefit from the synergies of the combination.
[IAS 36.102] The Group’s corporate assets do not generate separate cash inflows and are used by more than one CGU. Corporate assets are allocated to CGUs on a reasonable and consistent basis and tested for impairment as part of the testing of the CGUs to which the corporate assets are allocated.
[IAS 36.6, 18, 30] The recoverable amount of an asset or CGU is the greater of its value in use and its fair value less costs of disposal. Value in use is based on the estimated future cash flows, discounted to their present value using a pre-tax discount rate that reflects current market assessments of the time value of money and the risks specific to the asset or CGU.
[IAS 36.59] An impairment loss is recognised if the carrying amount of an asset or CGU exceeds its recoverable amount.
[IAS 36.104] Impairment losses are recognised in profit or loss. Impairment losses recognised for a CGU are allocated first to reduce the carrying amount of any goodwill allocated to the CGU, and then to reduce the carrying amounts of the other assets in the CGU on a pro rata basis.
[IAS 36.117, 122, 124] An impairment loss in respect of goodwill is not reversed. For other assets, an impairment loss is reversed only to the extent that the asset’s carrying amount does not exceed the carrying amount that would have been determined, net of depreciation or amortisation, if no impairment loss had been recognised.
Q. Provisions[IAS 37.14] A provision is recognised when the Group has a present obligation (legal or constructive) as a result
of a past event, it is probable that an outflow of resources embodying economic benefits will be required to settle the obligation and a reliable estimate can be made of the amount of the obligation.
[IAS 37.45, 47] Provisions are determined by discounting the expected future cash flows at a pre-tax rate that reflects current market assessments of the time value of money and the risks specific to the liability. The unwinding of the discount is recognised as ‘other finance costs’.
[IAS 37.72] A provision for restructuring is recognised when the Group has approved a detailed and formal restructuring plan, and the restructuring either has commenced or has been announced publicly. Future operating losses are not provided for.
R. Share capital
i. Issue of shares[IAS 32.15–16, 35] The Group classifies capital instruments as financial liabilities or equity instruments in accordance
with the substance of the contractual terms of the instruments. The Group’s ordinary shares and non-redeemable preference shares are presented as components of issued capital within equity, because they are not redeemable by holders and bear an entitlement to distributions that is non-cumulative and at the discretion of the board of directors. Distributions thereon are recognised in equity.
[IAS 32.35] Incremental costs that are directly attributable to the issue of an equity instrument are deducted from the initial measurement of the equity instrument.
Intr
oduc
tion
Aud
itor
s’ r
epor
tPr
imar
y st
atem
ents
NO
TE
SFu
rthe
r re
sour
ces
© 2018 KPMG IFRG Limited, a UK company, limited by guarantee. All rights reserved.
228 | Guide to annual financial statements: IFRS 17 and IFRS 9 – Illustrative disclosures for insurers
Notes to the consolidated financial statements (continued)44. Significant accounting policies (continued)R. Share capital (continued)
ii. Repurchase and reissue of shares[IAS 32.33] Generally, when shares recognised as equity are repurchased, the amount of the consideration paid,
which includes incremental costs, is recognised as a deduction from equity. Repurchased shares are classified as treasury shares and are presented in the treasury share reserve. When treasury shares are sold or reissued subsequently, the amount received is recognised as an increase in equity and the resulting surplus or deficit on the transaction is presented within share premium.
[IAS 32.33A] However, when, and only when, the Group reacquires its own equity instrument and includes the share as an underlying item of direct participating contracts, the Group may elect not to deduct the reacquired instrument from equity and instead account for the reacquired instrument as if it were a financial asset and measure it at FVTPL. This election is irrevocable and is made on an instrument-by-instrument basis.
S. Leases[IFRS 16.9, B9, B13] At inception of a contract, the Group assesses whether a contract is, or contains, a lease. A
contract is, or contains, a lease if the contract involves the use of an identified asset and conveys the right to control the use of the asset for a period of time in exchange for consideration – i.e. the customer has the rights to:
– obtain substantially all of the economic benefits from using the asset; and
– direct the use of the asset.
i. As a lessee [IFRS 16.22–24, 26] The Group recognises a right-of-use asset and a lease liability at the commencement date of the
lease. The right-of-use asset is initially measured at cost, which comprises the amount of lease liability, any lease payments made at or before the commencement date, any initial direct costs incurred and an estimate of the costs to dismantle and remove the underlying asset or to restore the underlying asset or the site on which it is located, less any lease incentives received. The lease liability is initially measured at the present value of the lease payments that are not paid at the commencement date, discounted using the interest rate implicit in the lease or, if that rate cannot be readily determined, the Group’s incremental borrowing rate. The Group generally uses its incremental borrowing rate as the discount rate.
[IFRS 16.29–32] Subsequently, the right-of-use asset is depreciated using the straight-line method from the commencement date to the earlier of the end of the useful life of the right-of-use asset or the end of the lease term. The estimated useful lives of right-of-use assets are determined on the same basis as those of property and equipment (see (N)(ii)). In addition, the carrying amount of the right-of-use asset is reduced by any impairment losses and adjusted for certain remeasurements of the lease liability.
[IFRS 16.36] The lease liability is subsequently measured at amortised cost using the effective interest method. It is remeasured to reflect any lease modifications or reassessments.
IFRS 16.47 The Group presents its right-of-use assets in ‘other property and equipment’ and lease liabilities in ‘loans and borrowings’ in the statement of financial position.
Short-term leases and leases of low-value assets
IFRS 16.60, [IFRS 16.5–6, 8]
The Group has elected not to recognise right-of-use assets and lease liabilities for short-term leases that have a lease term of 12 months or less and leases of low-value assets. The Group recognises the lease payments associated with these leases as an expense on a straight-line basis over the lease term.
ii. As a lessor[IFRS 16.61–62] The Group classifies all leases for which it is a lessor as operating leases, because each of these
leases does not transfer substantially all of the risks and rewards incidental to ownership of the underlying asset.
[IFRS 16.81] Lease payments from operating leases are recognised as income on a straight-line basis over the lease term and are included in ‘other investment revenue’.
Intr
oduc
tion
Aud
itor
s’ r
epor
tPr
imar
y st
atem
ents
NO
TE
SFu
rthe
r re
sour
ces
© 2018 KPMG IFRG Limited, a UK company, limited by guarantee. All rights reserved.
Illustrative disclosures – Notes 229Accounting policies
Notes to the consolidated financial statements (continued)45. Standards issued but not yet effective
IAS 8.30–31 A number of new standards are effective for annual periods beginning after 1 January 2021 and earlier application is permitted; however, the Group has not early adopted the new standards in preparing these consolidated financial statements.
The following standards are expected to have a material impact on the Group’s financial statements in the period of initial application.
[Name of new standard]
[Summary of requirements and possible impact on the consolidated financial statements.]
Intr
oduc
tion
Aud
itor
s’ r
epor
tPr
imar
y st
atem
ents
NO
TE
SFu
rthe
r re
sour
ces
© 2018 KPMG IFRG Limited, a UK company, limited by guarantee. All rights reserved.
230 | Guide to annual financial statements: IFRS 17 and IFRS 9 – Illustrative disclosures for insurers
Intr
oduc
tion
Aud
itor
s’ r
epor
tPr
imar
y st
atem
ents
Not
esFU
RT
HE
R R
ES
OU
RC
ES
$
¥
£ €
Keeping in touchFollow ‘KPMG IFRS’ on LinkedIn or visit kpmg.com/ifrs for the latest on IFRS.
Whether you are new to IFRS or a current user, you can find digestible summaries of recent developments, detailed guidance on complex requirements, and practical tools such as illustrative disclosures and checklists.
Delivering insight, analysis and practical guidance on IFRS
IFRS toolkit
Insights into IFRS
Helping you apply IFRS to real transactions and arrangements.
Guides to financial statements
Illustrative IFRS disclosures and checklists of currently effective requirements.
Newly effective standards
IFRS compared to US GAAP
Q&A: Fair Value Measurement
Combined and/or carve-out financial statements
Amendments to existing standards
Business combinations and consolidation
Presentation and disclosures
© 2018 KPMG IFRG Limited, a UK company, limited by guarantee. All rights reserved.
Intr
oduc
tion
Aud
itor
s’ r
epor
tPr
imar
y st
atem
ents
Not
esFU
RT
HE
R R
ES
OU
RC
ES
Insurance contracts
12
6
9 3
Keeping in touch | 231
New requirements for 2018 and beyond
It’s time for action
Practical guidance on the new standards
Are you good to go?
Sector-specific guidance
Revenue Financial instruments
Leases
IFRS news IFRS for banks
For access to an extensive range of accounting, auditing and financial reporting guidance and literature, visit KPMG’s Accounting Research Online. This web-based subscription service is a valuable tool for anyone who wants to stay informed in today’s dynamic environment. For a free 30-day trial, go to aro.kpmg.com and register today.
© 2018 KPMG IFRG Limited, a UK company, limited by guarantee. All rights reserved.
232 | Guide to annual financial statements: IFRS 17 and IFRS 9 – Illustrative disclosures for insurers
Intr
oduc
tion
Aud
itor
s’ r
epor
tPr
imar
y st
atem
ents
Not
esFU
RT
HE
R R
ES
OU
RC
ES
AcknowledgementsWe would like to acknowledge the efforts of the principal authors of this publication:
Albert Chai International Standards GroupDavid Holliday UK
We are grateful to the following reviewers for their input:
Bryce Ehrhardt International Standards GroupStefan Engeländer GermanyBarbara Jaworek UKHagit Keren International Standards Group
We would also like to thank the members of KPMG’s global IFRS insurance contracts topic team for their contribution:
Jennifer Austin USErik Bleekrode Hong KongDana Chaput CanadaDanny Clark UKPaolo Colciago ItalyGerdus Dixon South AfricaFrank Dubois SingaporeBhavesh Gandhi KuwaitAlan Goad (co-deputy leader) USJoachim Kölschbach (leader) GermanyViviane Leflaive FranceCsilla Leposa HungaryIan Moyser AustraliaChris Spall UKDanielle Torres BrazilMary Trussell (co-deputy leader) Germany

kpmg.com/ifrs
Publication name: Guide to annual financial statements: IFRS 17 and IFRS 9 – Illustrative disclosures for insurers
Publication number: 135207
Publication date: January 2018
© 2018 KPMG IFRG Limited, a UK company, limited by guarantee. All rights reserved.
The KPMG name and logo are registered trademarks or trademarks of KPMG International.
KPMG International Standards Group is part of KPMG IFRG Limited.
KPMG International Cooperative (‘KPMG International’) is a Swiss entity that serves as a coordinating entity for a network of independent firms operating under the KPMG name. KPMG International provides no audit or other client services. Such services are provided solely by member firms of KPMG International (including sublicensees and subsidiaries) in their respective geographic areas. KPMG International and its member firms are legally distinct and separate entities. They are not and nothing contained herein shall be construed to place these entities in the relationship of parents, subsidiaries, agents, partners, or joint venturers. No member firm has any authority (actual, apparent, implied or otherwise) to obligate or bind KPMG International or any other member firm, nor does KPMG International have any such authority to obligate or bind KPMG International or any other member firm, nor does KPMG International have any such authority to obligate or bind any member firm, in any manner whatsoever.
The information contained herein is of a general nature and is not intended to address the circumstances of any particular individual or entity. Although we endeavour to provide accurate and timely information, there can be no guarantee that such information is accurate as of the date it is received or that it will continue to be accurate in the future. No one should act upon such information without appropriate professional advice after a thorough examination of the particular situation.
‘IFRS®’ is a registered trade mark of the IFRS Foundation and is used by KPMG IFRG Limited with permission. Please contact the IFRS Foundation for details of countries where its trade marks are in use and/or have been registered.


