25
ILUTE Modelling Duration of Work/School Episodes Using Activity Diary Data for The Specification of Activity-Travel Scheduler K. M. Nurul Habib & Eric J. Miller
| Date post: | 01-Jan-2016 |
| Category: |
Documents |
| Upload: | brooke-mckinney |
| View: | 214 times |
| Download: | 1 times |

ILUTE
Modelling Duration of Work/School Episodes
Using Activity Diary Data for TheSpecification of Activity-Travel
Scheduler
K. M. Nurul Habib & Eric J. Miller

ILUTEIntroduction -1• Concept of Agent Based Modelling:
• Physical Agents: Household --- Individual --- Environment
• Software Agents: Project --- Agenda --- Scheduler
• Projects output--- Frequency of Episodes with the Specifications of the attributes
• Agenda is the collector of episodes • Scheduler starts with the project specifications as
collected in agenda and modifies if necessary• This paper is concerned about the generation of
input specification for scheduler—Specific project is work/school and specific attribute is duration

ILUTEIntroduction -2
• CHASE is exploited to get the data of project specifications (the starting values of the daily scheduling process)
• Simple assumption: • Work/School projects generate Work/School
Episodes• Duration is the most important: Episodes occur
within the duration and the scheduler needs the specification to start with
• Generating such input specification for scheduler is supposed to be the primary stage of activity-travel scheduling

ILUTEIntroduction -3
• So the objective of this research is to make this stage - policy sensitive so to develop duration models with covariates:--- function of Policy Variables (direct or indirect)
• Current TASHA—gets the duration specification from non-parametric duration distribution drawn from trip-diary data: TTS
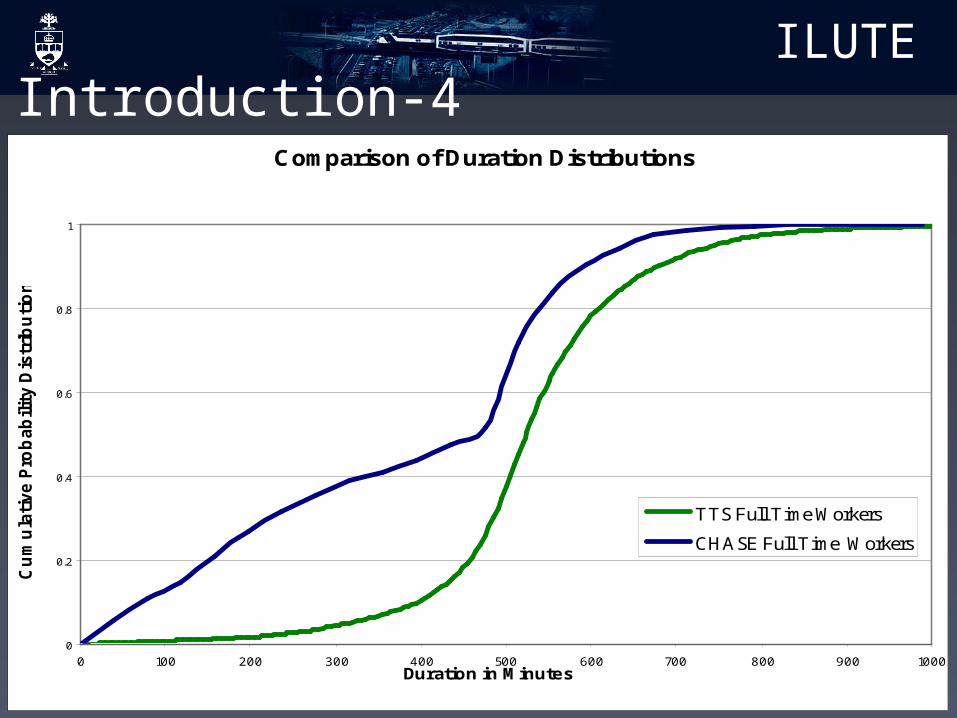
• Two major shortcomings are:• Nonparametric distribution are policy
insensitive—no covariates are accommodated• Trip diary data does not necessarily capture
the minute variations in distributions…see Figure 01:
ILUTEIntroduction-4
Comparison of Duration Distributions
0
0.2
0.4
0.6
0.8
1
0 100 200 300 400 500 600 700 800 900 1000Duration in Minutes
Cu
mu
lati
ve P
rob
ab
ilit
y D
istr
ibu
tio
ns
TTS Full Time Workers
CHASE Full Time Workers

ILUTEIntroduction-5• To replace TASHA input (TTS distribution) CHASE data is
used model the work/school duration• For duration modelling the approaches considered:
• Hazard Model: Semiparametric, Parametric• Ordered Logit Model (can transformed to get flexible
parameter Hazard model)• Limited Dependent Variable Model: Tobit
• Aspects of methodological comparisons:• Semiparametric vs. Parametric vs. Flexible parametric• Proportional hazard assumption vs. Accelerated life
assumption• Discrete time vs. Continuous time
• Aspect of understanding behavioural process: Understanding the distributional pattern of work/school duration and capturing influence of different variables (to ensure reflection of urban policy impacts )
ILUTEData
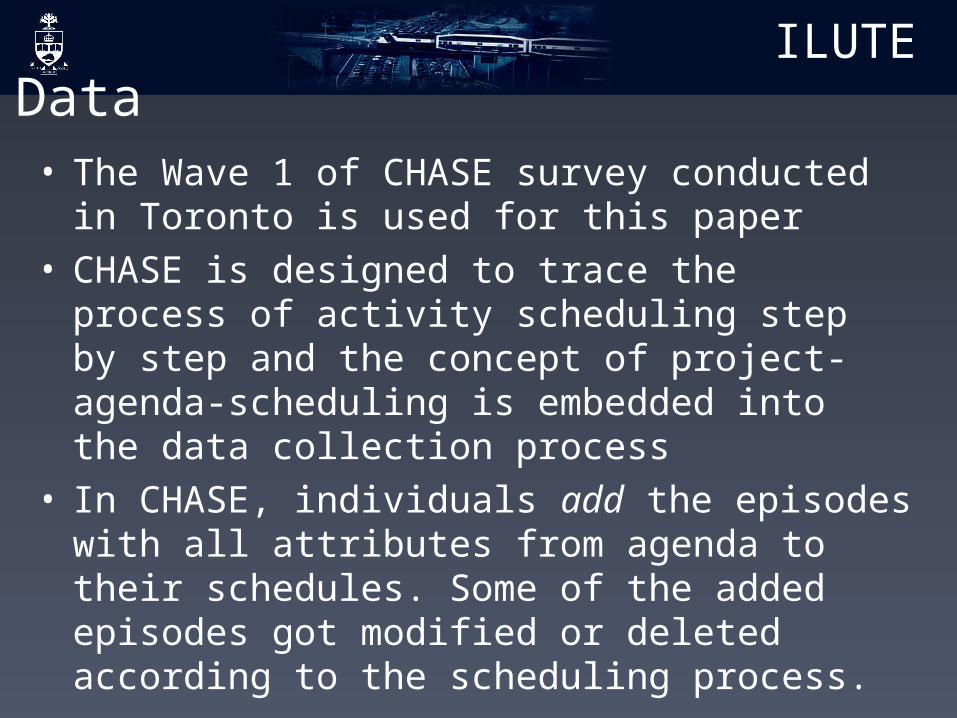
• The Wave 1 of CHASE survey conducted in Toronto is used for this paper
• CHASE is designed to trace the process of activity scheduling step by step and the concept of project-agenda-scheduling is embedded into the data collection process
• In CHASE, individuals add the episodes with all attributes from agenda to their schedules. Some of the added episodes got modified or deleted according to the scheduling process.

ILUTEData
• The reason that we cannot observe the agenda and projects directly, we took a very simple assumption:
• The episodes (with all attributes) that are first ‘added’ are directly derived from the agenda and thereby corresponding Projects
• Thus these added episodes represent output of project to the specification of the scheduler.
• We collected the work episodes that are added only-----(either executed or not executed)

ILUTEData
• The data are divided into there parts:»Full-Time worker»Part-Time worker»Students
Type No. of Episodes
No. of Individual
s
No. of HH
Min Dur. In
Minutes
Mean Dur. In Minutes
Max Dur. In
Minutes
Full-Time 1598 238 192 5 374 989
Part-Time 248 49 44 10 184 720
Students 632 85 72 1 79 810
ILUTEData
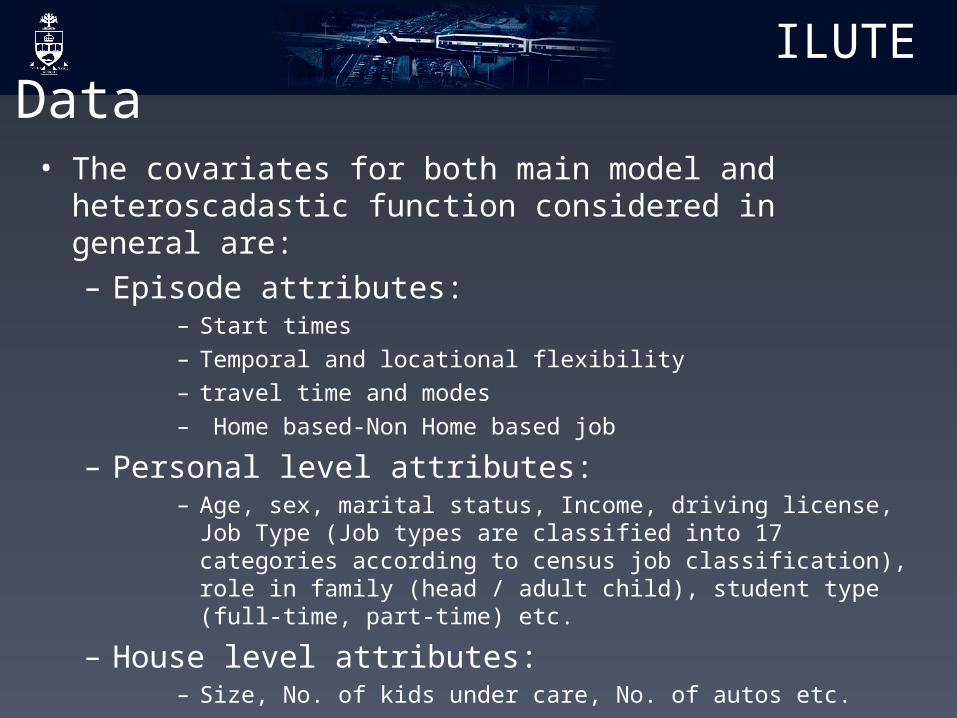
• The covariates for both main model and heteroscadastic function considered in general are:– Episode attributes:
– Start times
– Temporal and locational flexibility
– travel time and modes
– Home based-Non Home based job
– Personal level attributes:– Age, sex, marital status, Income, driving license, Job Type (Job
types are classified into 17 categories according to census job classification), role in family (head / adult child), student type (full-time, part-time) etc.
– House level attributes:– Size, No. of kids under care, No. of autos etc.

ILUTEModels
• Semiparametric Hazard Model: Cox Regression model
» Assumption: Proportional hazard assumption and Homogeneous population assumption
» Cannot consider unobserved heterogeneity » Uses Partial likelihood method » Covariate parameters and baseline hazard rates are
estimated separately» This method is preferable if the duration of event does
not have any distinctive distributional pattern. Or in other word if the duration of the event of concern does have a distinctive distributional form this model cannot fit the observed data
ILUTEModels
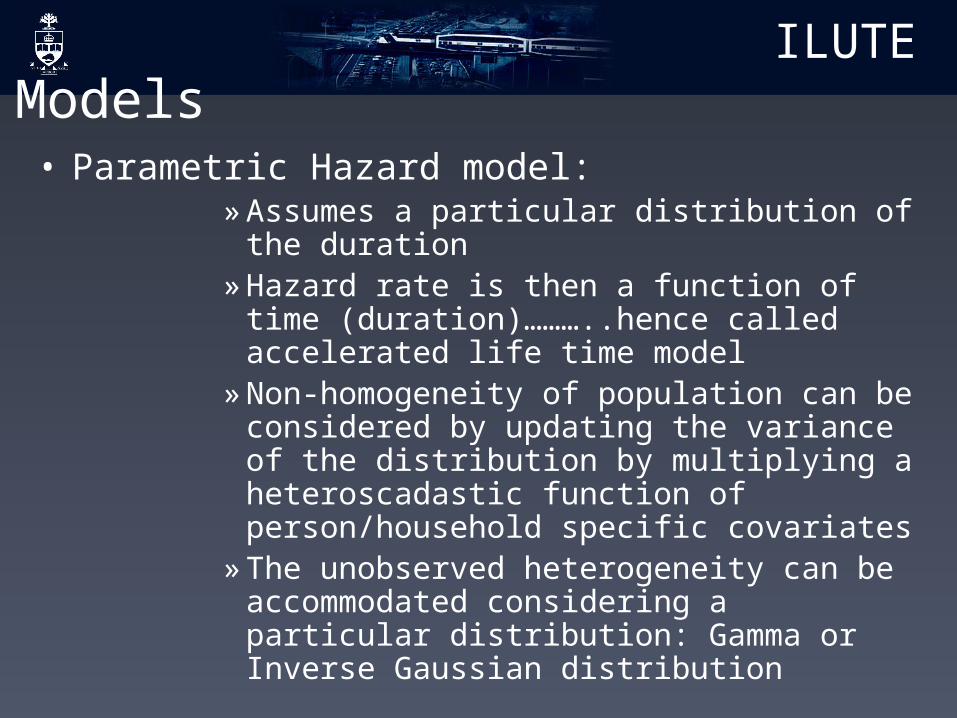
• Parametric Hazard model:» Assumes a particular distribution of the
duration» Hazard rate is then a function of time
(duration)………..hence called accelerated life time model
» Non-homogeneity of population can be considered by updating the variance of the distribution by multiplying a heteroscadastic function of person/household specific covariates
» The unobserved heterogeneity can be accommodated considering a particular distribution: Gamma or Inverse Gaussian distribution

ILUTEModels
» The parametric distribution considered here are: Weibull Distribution, Log-Logistic Distribution, Log-normal distribution
• Ordered Logit model:» It assumes the dependent variable as categorical.» The probability of choosing each category is determined
threshold parameters (cut point) at entry and exit into the category
» The concept is similar to the concept of non-parametric baseline hazard rate with covariates.
» Mathematically it can be proved that the threshold parameters of Ordered logit model is equal to the logarithm of Baseline Cumulative Hazard model
» So Ordered Logit model formulation can be used to develop Hazard model of Non Parametric Baseline with Covariates

ILUTEModels » The first major difference of this model from the
Cox regression model is that the Baseline Distribution is estimated together with the covariate parameters
» The second major difference is that the values of threshold parameters are dependent on the user defined categories of dependent variables (the discretization of the duration) but the covariate parameters are independent. Covariate parameters are indifference of the number of divisions of the duration, Hence it is called Flexible Parameter Hazard model
» Flexible parameter hazard model captures the underlying distributional pattern of the duration nonparametrically but also contain covariates
» The unobserved heterogeneity can also be accommodated either parametrically (Gamma dist) or nonparametrically.

ILUTEModels
• Tobit Model:» Limited dependent variable model: Ensures non-
negativity of duration modelled» Heteroscedasticity can be considered

Semiparametric Hazard Model
0
0.1
0.2
0.3
0.4
0.5
0.6
0.7
0.8
0.9
1
0 1 2 3 4 5 6 7 8 9 10 11 12 13 14 15 16
Duration in Hours
Surv
ival Predicted
Observed
0
0.1
0.2
0.3
0.4
0.5
0.6
0.7
0.8
0.9
1
0 1 2 3 4 5 6 7 8 9 10 11 12
Duration in Hours
Surv
ival
Predicted
Observed
0
0.1
0.2
0.3
0.4
0.5
0.6
0.7
0.8
0.9
1
0 1 2 3 4 5 6 7 8 9 10 11 12
Duration in Hours
Surviv
al
Predicted
Observed
Full-Time Part-Time
School

Parametric Hazard Models-Weibull
0.000
0.100
0.200
0.300
0.400
0.500
0.600
0.700
0.800
0.900
1.000
0 1 2 3 4 5 6 7 8 9 10 11 12 13 14 15 16
Duration in Hours
Surv
ival
Predicted
Observed; 10% Error Offset
0.000
0.100
0.200
0.300
0.400
0.500
0.600
0.700
0.800
0.900
1.000
0 1 2 3 4 5 6 7 8 9 10 11 12
Duration in Hours
Surv
ival
Predicted
Observed; 10% Error Offset
0.000
0.100
0.200
0.300
0.400
0.500
0.600
0.700
0.800
0.900
1.000
0 1 2 3 4 5 6 7 8 9 10 11 12
Duration in Hours
Surviv
al
Predicted
Observed; 10% Error Offset
Full-Time Part-Time
School
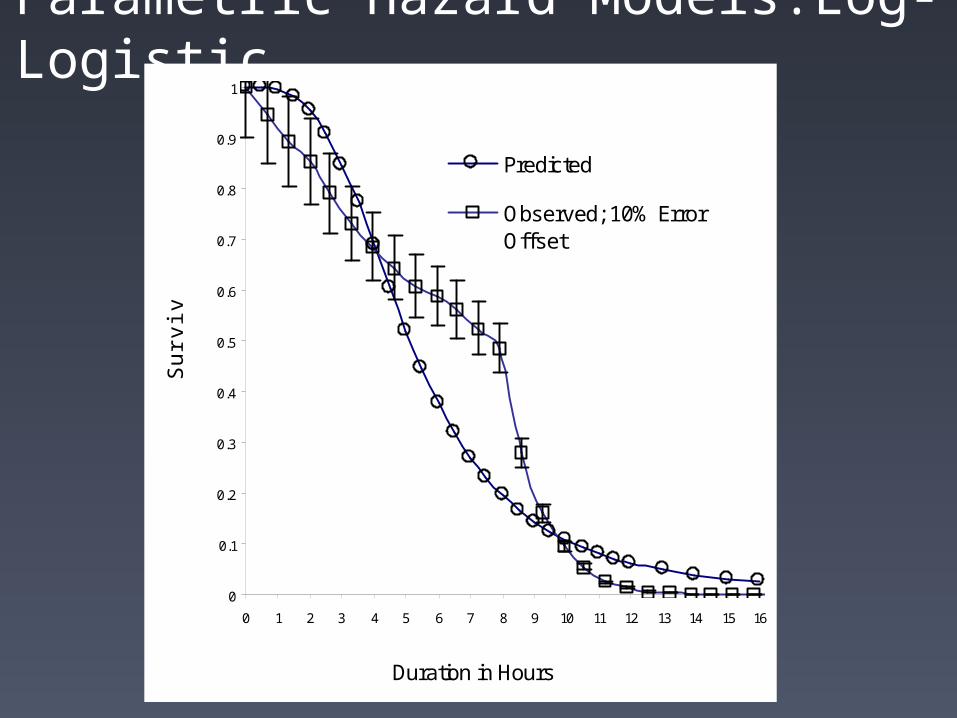
Parametric Hazard Models:Log-Logistic
0
0.1
0.2
0.3
0.4
0.5
0.6
0.7
0.8
0.9
1
0 1 2 3 4 5 6 7 8 9 10 11 12 13 14 15 16
Duration in Hours
Sur
viva
lPredicted
Observed; 10% ErrorOffset

Flexible Parametric Hazard Models
0
0.1
0.2
0.3
0.4
0.5
0.6
0.7
0.8
0.9
1
0 1 2 3 4 5 6 7 8 9 10 11 12 13 14 15 16
Duration in Hours
Surv
ival
Observed; 10% Error Offset
Predicted
0
0.1
0.2
0.3
0.4
0.5
0.6
0.7
0.8
0.9
1
0 1 2 3 4 5 6 7 8 9 10 11 12
Duration in Hours
Surv
ival
Observed; 10% Error Offset
Predicted
0
0.1
0.2
0.3
0.4
0.5
0.6
0.7
0.8
0.9
1
0 1 2 3 4 5 6 7
Duration in Hours
Surviv
al
Observed; 10% Error Offset
Predicted
Full-Time Part-Time
School

Tobit Model
0
0.1
0.2
0.3
0.4
0.5
0.6
0.7
0.8
0.9
1
0 1 2 3 4 5 6 7 8 9 10 11 12 13 14 15 16
Duration in Hours
Surv
ival
Observed; 10% Error Offset
Predicted
0
0.1
0.2
0.3
0.4
0.5
0.6
0.7
0.8
0.9
1
0 1 2 3 4 5 6 7 8 9 10 11 12
Duiration in Hours
Surv
ival
Observed; 10% Error Offset
Predicted
0
0.1
0.2
0.3
0.4
0.5
0.6
0.7
0.8
0.9
1
0 1 2 3 4 5 6 7 8 9 10 11 12 13
Duration in Hour
Surv
ival
Observed; 10% Error Offset
Predicted
Full-Time Part-Time
School
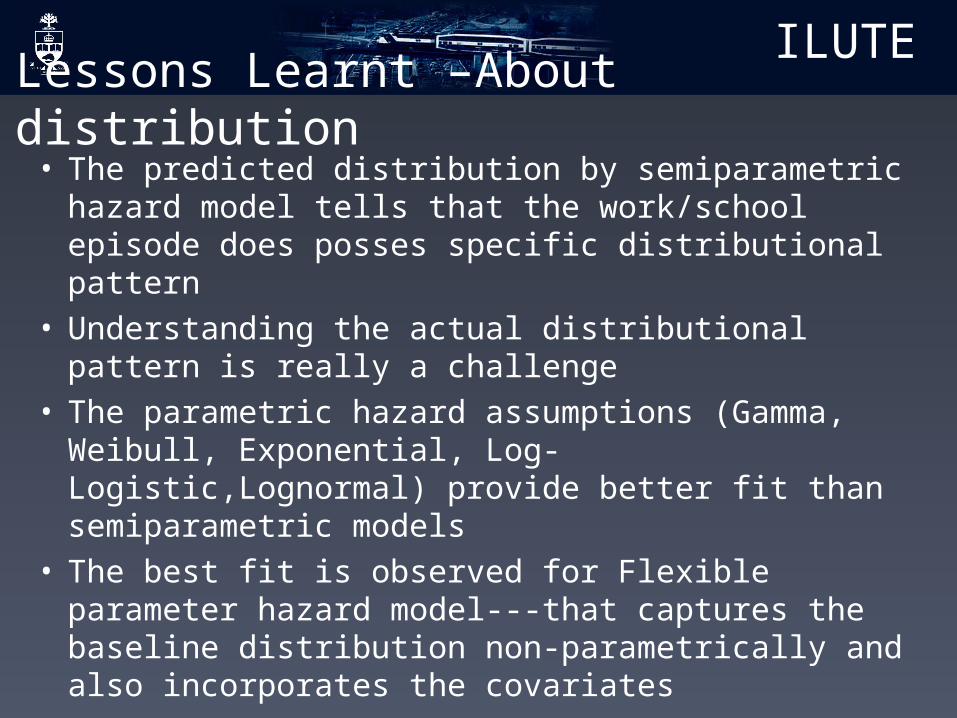
ILUTELessons Learnt –About distribution
• The predicted distribution by semiparametric hazard model tells that the work/school episode does posses specific distributional pattern
• Understanding the actual distributional pattern is really a challenge
• The parametric hazard assumptions (Gamma, Weibull, Exponential, Log-Logistic,Lognormal) provide better fit than semiparametric models
• The best fit is observed for Flexible parameter hazard model---that captures the baseline distribution non-parametrically and also incorporates the covariates

ILUTELessons Learnt About Distribution
• But the problem of such type of model is the discretization of time.
• The finer the discretization the better the result, but the CHASE data permit us to consider minimum 1-hour discretization for work and 30-min discretization for schoolwork---which are pretty course
• The continuous time model—parametric hazard models give the R2
values 0.3 to 0.4• Tobit model considers continuous time but does
not consider any underlying distributional assumption---so it fails to capture the tail end observations (whose frequency are low)

ILUTELessons Learnt About Covariates
• It is seen that the sign of parameters of all corresponding variables are same in all models…although the goodness of fit differs a lot….Important lesson : In addition to the covariates, the understanding of actual underlying distributional pattern is very important (that’s why Tobit model does not perform the best)
• Travel time is found to significantly influence work/school duration; travel time is negatively related to the duration
ILUTELessons Learnt About Covariates
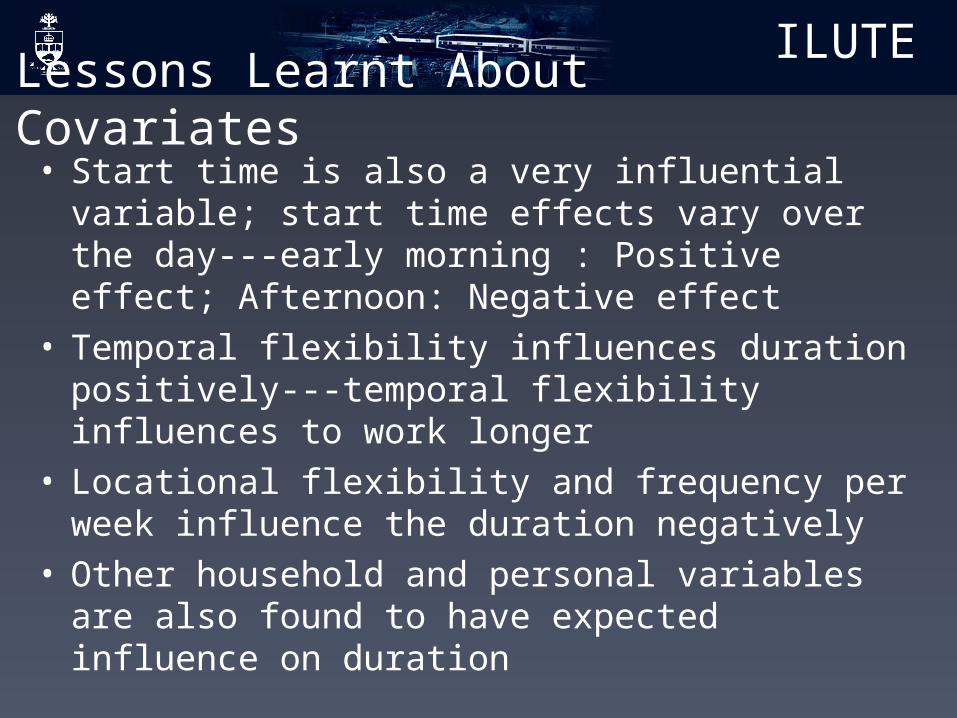
• Start time is also a very influential variable; start time effects vary over the day---early morning : Positive effect; Afternoon: Negative effect
• Temporal flexibility influences duration positively---temporal flexibility influences to work longer
• Locational flexibility and frequency per week influence the duration negatively
• Other household and personal variables are also found to have expected influence on duration

ILUTEConclusions a Future Works
• The specific features of CHASE allows us to separate data as direct output from project and before getting scheduling effects
• The input data of the models represent the planning stage before the staring of the day
• This research is the first step toward the efforts of developing TASHA-II
• Further research is needed to find out more flexible distributional assumptions for underlying distribution: Gompertz distribution may be promising
• Lessons learnt from work/school activity will be applied for modelling other activity types


