Higher Education, Localization and Innovation: Evidence from a Natural Experiment* Roland Andersson Royal Institute of Technology Stockholm, Sweden [email protected]John M. Quigley University of California Berkeley, CA [email protected]Mats Wilhelmsson Royal Institute of Technology Stockholm, Sweden [email protected]Abstract During the past fifteen years, government policy has decentralized post-secondary education in Sweden. We investigate the economic effects of this decentralization policy on the level of innovation and its spatial distribution in the Swedish economy. We rely upon micro data on patent activity over time, which records the home address of each patent awardee during the past eight years. These measures of innovation, together with data documenting the decentralization of university-based researchers and students, permit us to estimate the effects of exogenous changes in educational policy upon the extent and locus of innovative activity. We find important and significant effects of this policy upon the locus of knowledge production, suggesting that the decentralization has affected regional development through local innovation and increased creativity. We also find some evidence that this policy has affected the aggregate output of knowledge industries. January 2005 JEL codes: O31, N34, R11 * A previous version of this paper was presented at the North America Meetings of the Regional Science Association, Seattle, November 2004. We are grateful for the comments of Bronwyn Hall and Gilles Duranton and for the assistance of Henry Hyatt.
Transcript
Higher Education, Localization and Innovation: Evidence from a Natural Experiment*
During the past fifteen years, government policy has decentralized post-secondary education in Sweden. We investigate the economic effects of this decentralization policy on the level of innovation and its spatial distribution in the Swedish economy. We rely upon micro data on patent activity over time, which records the home address of each patent awardee during the past eight years. These measures of innovation, together with data documenting the decentralization of university-based researchers and students, permit us to estimate the effects of exogenous changes in educational policy upon the extent and locus of innovative activity. We find important and significant effects of this policy upon the locus of knowledge production, suggesting that the decentralization has affected regional development through local innovation and increased creativity. We also find some evidence that this policy has affected the aggregate output of �knowledge industries.�
January 2005 JEL codes: O31, N34, R11 * A previous version of this paper was presented at the North America Meetings of the Regional Science Association, Seattle, November 2004. We are grateful for the comments of Bronwyn Hall and Gilles Duranton and for the assistance of Henry Hyatt.
- 1 -
1. Introduction
Sweden undertook a conscious spatial decentralization of its system of higher education
beginning in 1987. This decentralization was motivated by a complex variety of political, social,
and economic factors. In this paper, we analyze one aspect of this policy, its effects on the level
and distribution of innovative activity in the economy. We provide quantitative evidence on the
effects of the decentralization policy upon the award of commercial patents for innovations and
discoveries.
From a broader perspective, there has been intense debate during the past decade about
the role of university research, and the spin-offs of that research, in stimulating regional
development. The popular press in Sweden has documented�endlessly it seems�the role of
Stanford and Berkeley in fostering the growth of the Silicon Valley in Northern California. One
implication seems to be that investment in post-secondary education affects the geographical
distribution of economic activity as well as its level.
The precise mechanisms linking educational investments to regional output remain
unclear. One linkage is through the spatial arrangements in productive activity and the external
economies generated by these patterns (�economies of localized industry� in Marshall�s terms).
The work of Romer (1986, 1990), Lucas (1988), and especially Fujita (1988) suggests that these
external economies are endogenous outcomes caused by the collocation of firms and workers. It
is now quite natural to recognize �productivity gains from the geographical concentration of
human capital� (Rauch, 1993).
A related mechanism linking educational investment to regional output is innovation
itself. If educational investment stimulates local innovation and creativity, productivity gains
may arise from the new knowledge whose production is facilitated by the pattern of spatial
- 2 -
investment in higher education (Jaffe, et al, 1993). In this paper, we analyze this latter
mechanism using the natural experiment of decentralization of higher education in Sweden. We
trace the implications of this exogenous change in policy upon the level and distribution of
innovative activity in the Swedish economy. In conducting this analysis, we rely upon a unique
body of micro data on innovations -- comprehensive records on patent awards, which include the
home address of the inventor.
Section 2 provides a brief review of Swedish university policies and innovation during the
last few decades. Section 3 surveys the literature on university research, knowledge spillovers,
and innovation as they affect economic growth. Section 4 presents the data and the models used
in our statistical analysis. Section 5 summarizes our results and conclusions.
2. Swedish University Policy
As recently as 1977, only six universities operated in Sweden, a country of nine million
people about the size of California. Universities were located in Stockholm, Göteborg, Lund,
Uppsala, Linköping and Umeå. In addition, there were three large technical institutes in
Stockholm: the Royal Institute of Technology; the Karolinska Institute of Medicine; and the
Stockholm School of Economics; as well as two others: the Chalmers Institute of Technology in
Göteborg; and the Institute of Agriculture near Uppsala. The locations of these eleven
institutions, the old established universities, are depicted in Figure 1. In addition, fourteen small
colleges existed; each was affiliated with a university. In 1977, the university structure was
changed, establishing eleven new institutions, raising the status of the fourteen colleges and
placing all 36 universities, institutes and colleges (located in 26 different municipalities) under
one administration. The �new� university structure is also indicated in Figure 1.
- 3 -
Figure 1. Location of �Old� and �New� Universities in Sweden
Luleå
Stockholm
Gotland
Eskilstuna/Västerås
Hörnösand
Umeå
Uppsala
Falun/Borlänge
Jönköping
Karlskrona/Ronneby
Kalmar
Gävle
Sundsvall
Östersund
Växjö
Kristianstad
Trollhättan/Uddevalla Linköping
Skövde
Karlstad
Göteborg
Halmstad
Lund
Malmö
Borås
Note: Locations of �old� institutions are in boldface.
- 4 -
In almost all cases, the sites chosen for the eleven new institutions of higher education
were formerly occupied by teacher training schools, engineering academies, or by military
training facilities. Five sites of university expansion formerly housed institutions of preschool
education; eight formerly housed affiliates of Sweden�s Institute of Education; two had been
schools of naval science (several sites had housed more than one of these facilities). In only one
instance is there any indication that regional economic considerations affected the location
chosen for a new institution.1
Despite the change in status, the new institutions of higher education developed relatively
slowly during the first ten years after reorganization. Thus, the number and distribution of
students between the older institutions and the newly established colleges of higher education was
about the same in 1987 as it had been in 1977. However, beginning in 1987, there was a
substantial expansion. During the subsequent period, the number of students at the newer
colleges more than doubled while the number of students at the older universities increased half
again. Moreover, the resources for research at the newer institutions were increased substantially,
particularly during decade of the 1990s. By 1998, the newly established institutions had grown to
a total of 84,000 students. At that time, more than a third of all the students enrolled in higher
education attended one of these institutions.
The expansion of these regional colleges is generally considered an important part of the
government�s regional policy, perhaps the most important one. During this period, a new college
was established in Södertörn in the south suburbs of Stockholm; another one was established in
1 The college established in Karlskrona-Ronneby was in an area of high unemployment caused by the closing of a major shipyard. In all other cases, the new colleges were located to replace or upgrade existing post secondary school and teacher training activities. See De första 20 åren, 1998, for an extensive discussion.
- 5 -
Malmö. Four of the larger colleges were upgraded to the status of universities: Luleå, Karlstad,
Växjö and Örebro. Today, there are a total of 13 universities and 23 colleges. The policy of
deconcentrating universities and colleges throughout the country was rapid and unprecedented.
The motives for this policy change were political and social as much as economic. One
important motivation for the establishment of these new colleges was the desire to make
undergraduate education geographically more accessible in all parts of Sweden. Another
motivation was to increase the representation in higher education of students from areas
geographically more remote from the established universities. The policy also sought to increase
the access to higher education of different social classes, especially those for which higher
education has not been a tradition. Proponents of this decentralization also claim that the policy
favors those who would like to stay, to live, and to work locally. A premise of this regional
policy is that the allocation of resources to the newer regional colleges will increase not only the
local educational level, but also the number of jobs in these regions. To some extent, the
government�s university policy can thus be interpreted as the expression of a regional
redistribution goal (Andersson, 2001).2
2 As noted above, there is no evidence that the sites chosen for these new institutions were those poised to benefit, for other reasons, from productivity growth and increased economic activity. Indeed, at least one site seems to have been chosen in response to exogenous reversals in economic fortunes. More generally, during 1968-1976, the cities in which the new institutions were located grew by 4.9 percent in population, while those in which the old institutions were located declined by 4.3 percent (and the remaining cities in Sweden increased by 6.3 percent in population). During 1977-1999, the cities in which the new institutions were located grew by 4.6 percent, while those in which the old institutions were located grew by 1.43 percent (and the remaining cities in Sweden increased by 7.1 percent).
- 6 -
The university decentralization can be interpreted simply as Keynesian fiscal policy at the
regional level.3 Two other potential effects of this policy can be identified. The first is the
expectation that the enhanced institutions provide spillovers or local externalities that could
improve productivity and lead to regional expansion by existing companies or by start-up firms.
Alternatively, research at a regional college or university could lead to innovation and increased
entrepreneurial activity. This is the �Silicon Valley model,� and domestic critics suggest that
Swedish policy-makers are obsessed with this vision.
Of course, these two effects are not mutually exclusive. In previous work, we
investigated the effects of this decentralization policy upon local output and productivity
(Andersson, et al, 2004). We found a strong link between exogenous changes in the distribution
of university resources, on the one hand, and economic output and worker productivity measured
at the local level, on the other hand. Somewhat surprisingly, we also found a small net increase
in output and productivity in the economy as a whole resulting from this spatial rearrangement.
That is, the investment in enhanced decentralized university resources increased economic output
and productivity by more than our estimate of the increased output obtained from an equivalent,
but centralized, deployment of university resources.
Increased innovative activity represents one way in which regional output and
productivity could have been increased. In this paper, we investigate this connection, analyzing
the spatial distribution of innovative activity and the level of creativity in the economy. It is
surely true that there are lags between investments in research staff, and facilities and resulting
levels of innovation. There are further lags between creative output, its embodiment in a patent
3 Direct expenditures will increase employment and economic output, and the construction and operation of new facilities will induce more economic activity through the local multiplier (See Florax, 1992)
- 7 -
granted after review, and its effects on productivity and economic output. Even beyond any lags
in observing responses, the relationship between the emphasis chosen for education and research
by the various regional colleges (science, technology, social science, etc.) and the economic
activities in the region probably matters in generating innovative activity. We investigate these
issues.
3. University Research and Innovation
Externalities flowing from human capital in regional development had a scientific revival
with the endogenous growth models starting with Romer (1986, 1990), Lucas (1988) and
Grossman and Helpman (1991). Griliches (1979, 1998) and Jaffe (1986, 1989) have modeled this
effect in a simple production function framework using industry and university research as inputs.
Using aggregate data on US states, Jaffe (1989) found a significant and positive effect of
university research expenditures on corporate patent output, which he interpreted as evidence of
knowledge transfers arising from the presence of the university.
Attila Varga (1998) has investigated directly the determinants of innovative activity in the
U.S. using a production function approach. He related the output of R&D (measured by regional
registrations of more than four thousand product innovations) to annual expenditures on research
in American universities as well as the number of employees in laboratories and research
institutes within private companies. Using aggregate data for US states, he found important
returns to scale and scope. Vargas concluded that there is a critical mass relating the density and
size of a region to the output of innovative activity. In this process, university inputs �matter.�
Fischer and Varga (2003) related patent applications in 99 political districts in Austria to
aggregate research expenditures by private firms in those districts and to estimates of university
- 8 -
research expenditures in those districts, finding significant effects of inputs on patent
applications. The interpretation of the results of this investigation is somewhat problematic, since
direct university research expenditures were made in only 7 districts and since 27 districts which
reported no patents are simply excluded from the analysis. More importantly, patent applications
are linked to the geographical location of the assignee rather than the location of the inventor.
Thus, the locations of firm headquarters rather than the locations of research establishments or
individual inventors are used to allocate the distribution of patents over space. Nevertheless, the
Fischer-Varga results are suggestive of a linkage.
4. Empirical Analysis
A. The Data
We investigate the relationship between the decentralization of post secondary education
to various regions in Sweden and the level of innovative activity in those regions.
Decentralization is measured by the spatial distribution of post graduate university researchers,
and innovative activity is measured by the spatial distribution of patent awards.
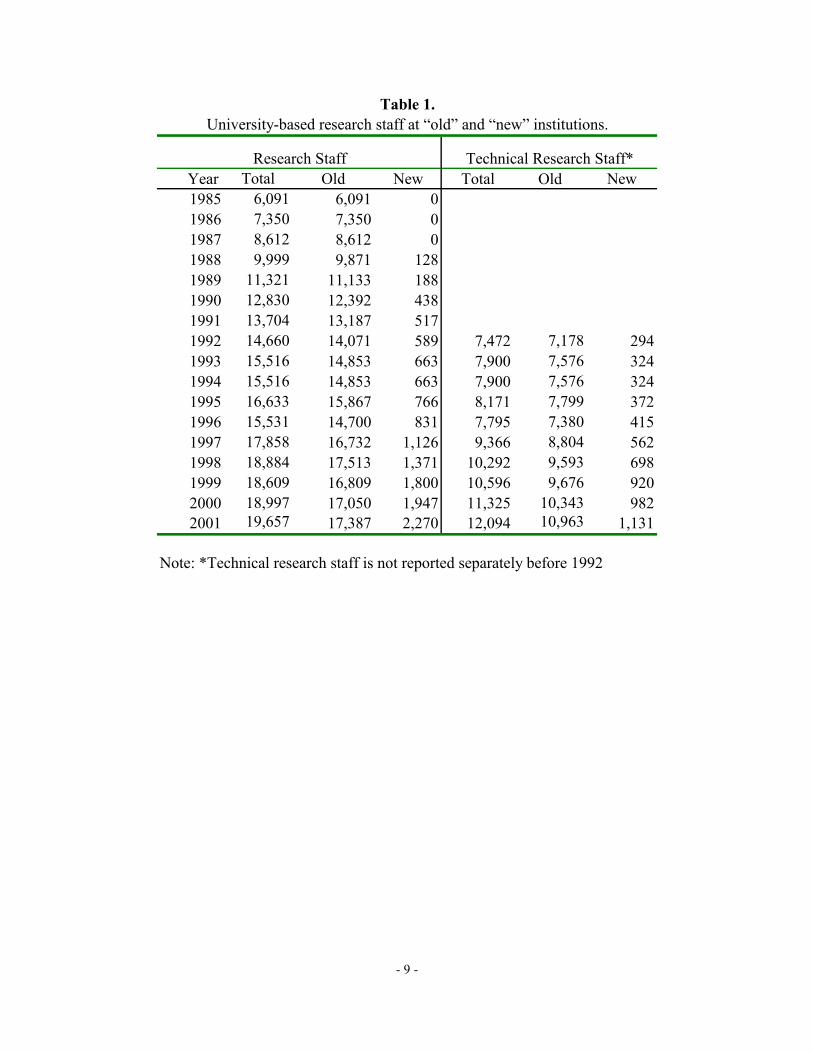
As reported in Table 1, the number of post graduate researchers employed in Swedish
universities tripled from 6,091 in 1985 to 19,657 in 2001. The fifteen percent per year increase in
post graduate researchers includes much larger percentage increases in those employed at the
smaller and newer institutions. Currently about one eighth of research staff positions are located
at these new colleges, and the scale of these positions is expected to grow.4
4 It should be noted that the allocation of staff positions is made centrally by the Ministry of Education, not by the institutions themselves using �soft money.�
Note: *Technical research staff is not reported separately before 1992
Old New6,0917,3508,6129,871
11,13312,39213,18714,071 29414,853 324
17,513 698
15,867 37214,700 41516,732 562
14,853 324
Table 1.University-based research staff at �old� and �new� institutions.
17,387 1,131
Research Staff Technical Research Staff*
16,809 92017,050 982
- 10 -
During this same period, university enrollment increased by almost 90 percent, from 160
thousand students to 306 thousand. There was an increase of roughly 63 thousand students in the
older established universities and 83 thousand students in the newer universities. The capacity of
the newer colleges and universities more than tripled to 114 thousand students.
Patent activity in Sweden varied significantly in the past decade. Between 1994 and 2001,
16,000 commercial patents were approved. Annual approvals ranged from a low of about 1,500
patents granted in 1995, to a high of almost 2,500 patents granted in 2001. Figure 2 reports the
trends in patent awards.
Figure 2. Commercial Patents 1994-2001 Awarded in Sweden by Year.
Patents
0
500
1000
1500
2000
2500
3000
1994 1995 1996 1997 1998 1999 2000 2001
The record for each patent award includes both the date of the award and the date of the
application. It generally takes about three years for a successful application to be approved.
Figure 3 presents the cumulative fraction of patents approved within any time interval. In 1994,
the average time interval from application and award was 2.5 years, and 80 percent of approvals
- 11 -
were made within four years of the initial application. In 2001, the average time interval
increased to 2.9 years, and three quarters of approvals were made within four years of
application.
Figure 3. Cumulative distribution of elapsed time between patent applications and patent awards.
0
10
20
30
40
50
60
70
80
90
100
0 1 2 3 4 5 6 7 8 9 10
Percent
elapsed time (years)
As noted above, one feature of these micro data is a record of the home address of the
innovator (even if the patent is assigned to a corporation located or headquartered elsewhere).
Thus, each patent can be allocated to the labor market area in which the inventor lives and
works.5 Figure 4 provides a summary of this allocation process. For each of the 100 labor
market areas in Sweden, the map indicates the aggregate number of patents per capita awarded
during 1994-2001.
5 Labor market areas are defined in terms of commuting patterns much the same as metropolitan statistical areas are defined in the U.S. (except that the basic building block is the community rather than the county). In the case of multiple inventors in different labor markets, the allocation of invention to labor market areas can be made proportionately.
- 12 -
Figure 4. Patents approved (PA) per thousand inhabitants 1994�2001. The old universities
are denoted by a black dot.
- 13 -
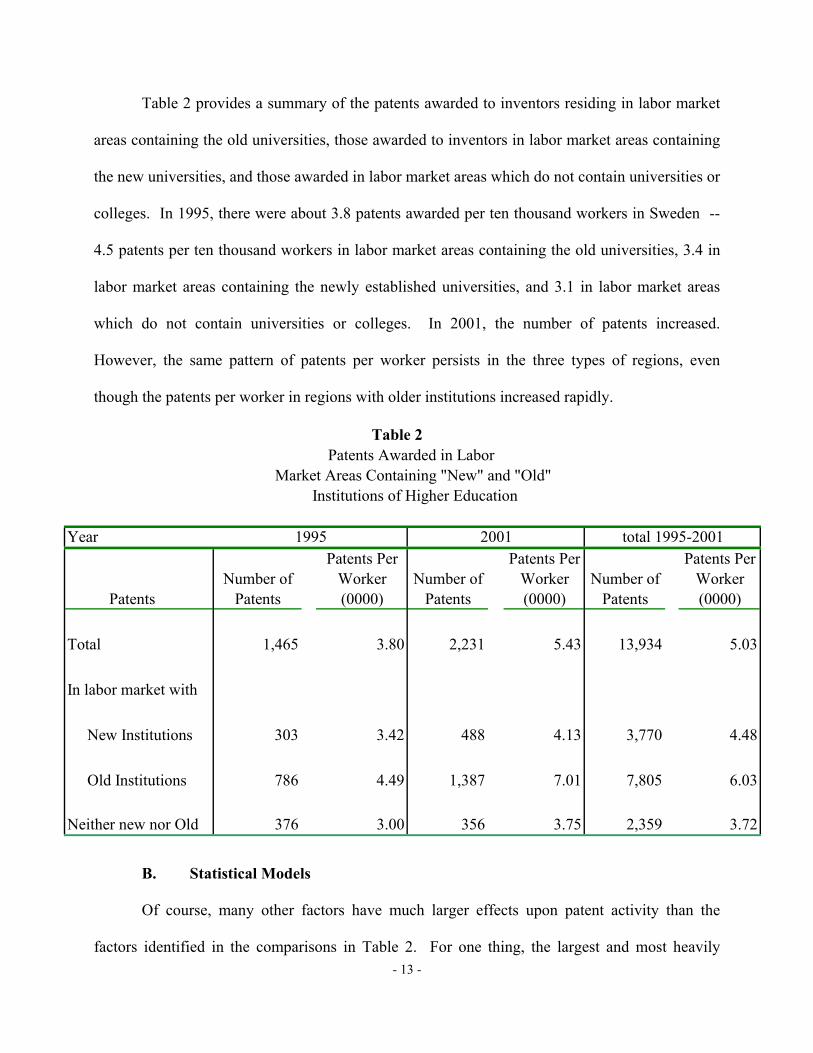
Table 2 provides a summary of the patents awarded to inventors residing in labor market
areas containing the old universities, those awarded to inventors in labor market areas containing
the new universities, and those awarded in labor market areas which do not contain universities or
colleges. In 1995, there were about 3.8 patents awarded per ten thousand workers in Sweden --
4.5 patents per ten thousand workers in labor market areas containing the old universities, 3.4 in
labor market areas containing the newly established universities, and 3.1 in labor market areas
which do not contain universities or colleges. In 2001, the number of patents increased.
However, the same pattern of patents per worker persists in the three types of regions, even
though the patents per worker in regions with older institutions increased rapidly.
Year
Patents
Total 1,465 3.80 2,231 5.43 13,934 5.03
In labor market with
New Institutions 303 3.42 488 4.13 3,770 4.48
Old Institutions 786 4.49 1,387 7.01 7,805 6.03
Neither new nor Old 376 3.00 356 3.75 2,359 3.72
Number of Patents
Patents Per Worker (0000)
Number of Patents
Table 2
Patents Per Worker (0000)
Number of Patents
Patents Per Worker (0000)
Patents Awarded in Labor Market Areas Containing "New" and "Old"
Institutions of Higher Education
1995 2001 total 1995-2001
B. Statistical Models
Of course, many other factors have much larger effects upon patent activity than the
factors identified in the comparisons in Table 2. For one thing, the largest and most heavily
- 14 -
developed metropolitan regions in Sweden are all labor market areas that contain the old
established universities. For another thing, the distribution of firms, particularly large chemical
and pharmaceutical firms with a great deal of patent activity, is heavily concentrated by city and
region.
We analyze the level of patent activity across labor markets and time using a fixed effects
model with indicator variables for each of the one hundred labor market areas and each of the
eight years. In this formulation, the distinctive characteristics of each labor market area are held
constant, as are the distinctive characteristics of each time period.
We assume that the number of patents, itn , awarded in labor market area i in year t
follows a poisson distribution,
(1) ( )!y
yn proby
itit
itit
itite λλ−
== ,
for 2,.... 1, 0, y =it
We further assume that
(2) itX log =itλ ,
that is, the parameter itλ is log linear in a set of regressors describing the labor market area i and
the time period t. We define this set of regressors,
(3) k
2001
1995kk
100
ijjjit it TL E X ∑∑
==
++= γβα
where itE characterizes post secondary educational institutions in labor market area i in year t.
jL is an indicator variable with a value of one for labor market area j=i and zero otherwise; kT is
an indicator variable with a value of one for year t=k and zero otherwise.
- 15 -
The effects of university decentralization upon innovative activity are identified by
changes in measures of university activity within each labor market area over time. To estimate
the model, we include a complete set of fixed effects for each time period and labor market area
using a maximum likelihood estimator. As shown by Blundell, Griffith and Windmeijer (1999,
2002), this is equivalent to the conditional maximum likelihood estimator proposed by Hausman,
Hall, and Griliches, HHG (1984). Subsequently, we test the assumption implicit in the poisson
specification that the mean and variance of the distribution are identical by estimating the
parameters of the negative binomial distribution. We test whether the constant variance is equal
to the mean (See Cameron and Trivedi, 1998, pp 282-284).
C. Exogeneity: A Digression
Of course, the Swedish �experiment� described in Section 2 did not employ random
assignment in the geographical distribution of new institutions of higher education. The 278
communities and 83 labor market areas without a university at the time of the adoption of the
policy were not equally likely to have established a university subsequently.
Although the historical record clearly specifies that the location of only one of the new
facilities was chosen for economic considerations, there may be systematic determinants of the
choices of locations for these new facilities. For our purposes, the most important issue is
whether the sites chosen were those which were poised for economic development and increased
patent activity anyway.
We cannot test for this endogeneity directly in the count models of innovation developed
in Section B, but we can investigate the issue using the continuous measure of productivity
discussed in our previous paper (Andersson, et al, 2004).
- 16 -
Consider the relationship between output per worker, measured at the level of the
community, C, and the set of regressors
(4) ( ) k
1998
1987k
285
jj TC E Xkeroutput/worlog ∑∑==
++==kij
ititit γβα
Here we again include fixed effects, now for each of Sweden�s 285 municipalities, and for each
available time period. We measure the characteristics of post secondary education institutions in
two ways
(5) oo
NN R RE ititit αα +=
(6) oo
NN R RUE ititit it αα ++=
Where Uit signifies the presence of a university in community i in year t, NR it is the number of
post graduate researchers employed in the new universities in community i in the year t, and oR
is the number employed at the older established universities.
We estimate equations 4 and 5 (or 6) by the method of instrumental variables. We rely
upon a vector of indicator variables signifying the presence of one or more of the following
facilities in each community in 1977: a university; a military facility; a nursing school; a
secondary engineering school; a teacher training facility. We also use lagged values of post
graduate researchers in previous years.
- 1
7 -
U x
104
53.5
7416
6.30
9-8
82.4
5759
5.73
2(0
.25)
(0.7
8)(1
.38)
(0.9
0)
Rn x
104
4.58
54.
583
4.95
94.
958
4.74
14.
715
5.14
55.
106
(2.9
9)(2
.99)
(3.2
4)(3
.24)
(2.8
1)(2
.79)
(3.0
6)(3
.03)
Ro x
104
0.57
50.
576
0.60
90.
612
0.57
60.
561
0.60
90.
598
(3.4
3)(3
.44)
(3.6
4)(3
.66)
(3.4
3)(3
.53)
(3.6
4)(3
.82)
Gr x
104
2.34
72.
383
2.35
02.
222
(5.1
8)(5
.23)
(5.1
9)(4
.55)
L8
Not
e: A
ll M
odel
s inc
lude
fixe
d ef
fect
s for
285
mun
icip
aliti
es a
nd 1
3 ye
ars.
The
sam
ple
cons
ists
of a
pan
el
of 3
705
obse
rvat
ions
on
outp
ut p
er w
orke
r by
mun
icip
ality
and
yea
r.
1986
-199
8
OLS
Est
imat
esIV
Est
imat
es
L1L2
L3L4
L5L6
L7
Tab
le 3
In
stru
men
tal V
aria
bles
Est
imat
esof
the
Effe
cts o
f Uni
vers
ities
on
Prod
uctiv
ity, b
y M
unic
ipal
ity
- 18 -
Table 3 reports the coefficients of these models, ordinary least squares regressions and
instrumental variables estimates. The OLS models clearly indicate a link between researchers at
both old and new educational institutions and productivity. Moreover, the coefficient indicating
the importance of post graduate researchers is almost ten times as larger for the new institutions
as for the older institutions. The pattern is unchanged when a dummy variable for the presence of
a university is included, and when the distances between municipalities are controlled for in a
gravity representation.
The results from the IV estimates are essentially the same. These latter estimates utilize
only pre-determined data on the new educational institutions -- data on the location of
infrastructure suitable for conversion to facilities for higher education. Thus the results provide
no evidence that the locations chosen for university expansion were those which were otherwise
poised for economic development and, presumably, increased patent activity.
D. Results
We now relate the decentralization in educational policy to the level of innovative
activity, as measured by patents granted three years after the educational investments (See Figure
3). In particular, for each labor market area and year, we record the presence of a university itU
and the number of university-employed post-graduate researchers itR . We also record the
number of research staff at each university employed in technical research specialties.
Table 4 presents the basic results (reported as model M1 through M7). The table relates
the number of patents in any labor market area and year to a dummy variable (U) indicating the
presence of a university in the labor market area and the number of post graduate researchers
employed at universities in that labor market (R). Research staffs are further disaggregated
- 19 -
between those employed at new (Rn) and old (Ro) universities for all staff and for those in
technical occupations.
Columns 1, 2, and 3 suggest that the presence of a university and the number of post
graduate researchers are associated with higher levels of innovative activity, holding constant the
important unmeasured characteristics of these differing labor market areas. The total number of
patents in any of these regions is 13,934 during the 1995-2001 period or about 200 per year in a
given labor market area. From Column 1, the presence of a university increases the number of
patents awarded in a labor market by [exp (1.78)-1] or by about 2.5 percent in any year. From
column 2, the addition of a single post graduate researcher increases the number of patents in any
labor market area by a factor of exp(.000193) or by almost 0.2 percent in any year.
In column 4 (model M4), we disaggregate the research staff by those employed at the old
universities and those employed at the new institutions. Both measures are highly significant, but
the coefficient estimated for researchers at the new universities (.00203) is larger by an order of
magnitude than the coefficient estimated for researchers at the old established universities
(.00016). When researchers in scientific and technical occupations are considered separately, the
significance of the coefficient measuring post graduate staff is reduced (to the five to ten percent
level for a one-tailed test) at new universities. However, the magnitude of the coefficient for
researchers at new universities is larger by an order of magnitude than is the estimated coefficient
for researchers employed at the older institutions.
It is interesting to observe that the estimates of the importance of the number of
researchers at old institutions do not change at all when the university dummy variable (U) is
included. However, the coefficient measuring researchers at newer institutions is almost doubled
if the university dummy variable is included. Hence, it seems that there is a threshold effect in
- 2
0 -
M1
M2
M3
M4
M5
M6
M7
U1.
775
-1.
675
1.01
1-
1.72
0-
(7.9
6)(7
.48)
(2.7
2)(7
.71)
R x
104
1.93
01.
690
--
--
(5.8
7)(5
.12)
Rn
x 10
4-
--
20.3
0238
.770
--
(2.4
4)(8
.04)
Ro
x 10
4-
--
1.59
01.
540
--
(4.7
7)(4
.64)
Rn-
tech
nica
l x 1
04-
--
--
28.1
7031
.710
(1.4
2)(1
.60)
Ro-
tech
nica
l x 1
04-
--
--
3.01
03.
120
(7.0
7)(7
.36)
Pseu
do R
20.
937
0.93
60.
937
0.93
70.
937
0.93
80.
936
Log
L-1
509.
81-1
527.
99-1
496.
69-1
494.
20-1
497.
96-1
484.
83-1
518.
09
Estim
ated
Par
amet
ers o
f Poi
sson
mod
elT
able
4
Not
e: A
ll m
odel
s inc
lude
fixe
d ef
fect
s for
100
labo
r mar
ket a
reas
and
seve
n tim
e pe
riods
. Th
e sa
mpl
e co
nsis
ts o
f a
pane
l of 7
00 o
bser
vatio
ns o
n pa
tent
cou
nts b
y la
bor m
arke
t are
a an
d ye
ar.
- 21 -
regions where a new university is established (perhaps comparable to the direct investment effect
on output reported by Florax, 1992, for Dutch universities).
Table 5 presents the results from the more general negative binomial model, reported as
models N1 through N7. We relax the maintained hypothesis in Table 4 that the mean and the
variance of the count distribution are equal, but, we follow HHG in estimating separately a
common mean and common variance for the count distribution. As in the previous table, we
relate the number of patents in any labor market area and year to a dummy variable for the
presence of a university (U) and the size of the research staff employed at these universities (R).
Research staffs are further disaggregated between new (Rn) and old (Ro) universities for all staff
and for those in technical occupations.
The more general negative binomial model clearly fits the data better. The estimated
mean of the distribution is significantly smaller than the variance, as indicated by a comparison of
the values of the log likelihood function in Tables 4 and 5. The qualitative results of the model
are similar, but the magnitudes of the coefficients measuring the importance of post graduate
research staffs in affecting patents activity are uniformly larger in these more general models.
The results (from either the poisson or binomial representation) may imply that the
presence of a university has a surprisingly large effect upon regional creativity, as measured by
patent activity. For example, model M3 suggests that the establishment of a university with the
average complement of post graduate researchers observed at the new institutions leads to an
increase in patent activity in the region of about 27 percent.6
6 That is, annual patent activity increases from an average of 19.906 to 25.255
- 2
2 -
N1
N2
N3
N4
N5
N6
N7
U1.
752
-1.
650
1.00
7-
1.72
5-
(7.4
3)(7
.01)
(2.3
5)(7
.44)
R x
104
-31
.460
2.35
0-
--
-(4
.28)
(3.5
8)R
n x
104
--
-20
.500
40.7
50-
-(2
.03)
(7.5
4)R
o x
104
--
-2.
250
2.27
0-
-(3
.44)
(3.4
0)R
n-te
chni
cal x
104
--
--
-35
.930
40.7
10(1
.58)
(1.7
4)R
o-te
chni
cal x
104
--
--
-3.
640
3.90
0(4
.34)
(4.2
2)ln
α-4
.522
-4.4
74-4
.738
-4.7
54-4
.694
-4.9
07-4
.637
α0.
011
0.01
10.
009
0.00
90.
009
0.00
70.
010
Pseu
do R
20.
415
0.40
70.
418
0.41
80.
417
0.41
90.
407
Log
L-1
477.
18-1
497.
18-1
470.
65-1
469.
33-1
472.
11-1
467.
82-1
498.
20
Not
e:A
llm
odel
sin
clud
efix
edef
fect
sfo
r10
0la
bor
mar
ket
area
san
dse
ven
time
perio
ds.
The
sam
ple
cons
ists
ofa
pane
lof
700
obse
rvat
ions
onpa
tent
coun
tsby
labo
rm
arke
tar
eaan
dye
ar.
*Lik
elih
ood
ratio
test
sco
mpa
ring
the
seve
nm
odel
sin
tabl
e3
with
with
thos
ein
tabl
e4
reje
ctth
ehy
poth
esis
thatα=
0by
aw
ide
mar
gin.α≠
0re
ject
sth
epo
isso
nm
odel
infa
vor
ofth
ene
gativ
eex
pone
ntia
ldi
strib
utio
n.α≠
0re
ject
sth
epo
isso
nm
odel
infa
vor
ofth
ene
gativ
eex
pone
ntia
ldi
strib
utio
n.α
mea
sure
sth
edi
ffer
ence
betw
een
the
mea
n(γ
)an
dth
eva
rianc
e(γ
+αγ)
ofth
eco
unt
dist
ribut
ion.
Tab
le 5
Estim
ated
Neg
ativ
e B
inom
ial m
odel
- 23 -
Conditional upon the establishment of an educational institution in a region, the marginal
effect of an increase in the research staff upon patent activity is not trivial. And the marginal
effects on creativity of adding research staff at the new institutions is estimated to be consistently
larger than the effects of adding staff at the older, more established institutions.
For example, from model M3 it is estimated that an additional research complement of ten
individuals at a new institution leads to an increase in patents of about 10.3 percent while a
similar increase in research staff at an older institution leads to an increase in patents of about 0.8
percent.7 This difference does not appear to arise from a different mix of technical and non-
technical research staffs at the two institutions. For example, from model M6 which considers
only post graduate researchers in technical specialties, an increase of ten technicians yields an
increase in patents of 14.4 percent in the newer institutions and about 1.5 percent in the older
established institutions.
Of course all these comparisons abstract from the many other and presumably more
important aspects of these different labor market regions which affect creativity and innovation.
5. Conclusion
During the past fifteen years, Swedish higher education policy encouraged the
decentralization of post secondary education. We investigate the spatial and economic effects of
this decentralization on innovation and creativity. We rely upon a seven-year panel of patent
7 Specifically, at the point of means, from equation M3 ten additional post graduate researchers yield 2.05 patents in the new institutions and 0.16 patents in the old institutions.
- 24 -
awarded to inventors in Sweden�s 100 labor market areas together with data on the location of
university post graduate research staffs, to estimate the effects of exogenous changes in
educational policy upon regional creativity.
We provide several tests of the hypothesis that the establishment or expansion of
university research in a region enhances regional creativity. We find systematic evidence that the
award of patents is greater in regions that have received larger university-based investments as
measured by the number of researchers employed on staff. We also find that patent awards are
more frequent in regions in which the �new� colleges and universities are located.
Our analysis permits us to hold constant the important factors affecting patent activity by
labor market areas and time, thereby improving the precision of estimates. By framing the
analysis at the labor market area, we focus on local effects of university expansion on creativity.
The results are broadly consistent across theoretical models and statistical results. There is strong
evidence that an expansion of university presence in a region, measured by the number of
university-based researchers, is associated with increases in the patents awarded to investors in
that community.
The importance of the university in affecting creativity is consistently larger at the margin
for the new institutions. This could arise if the new institutions specialize more narrowly in
technical specialties than do the more traditional institutions of higher education. Of course,
some of the new institutions are, in fact, expansions of institutions that formerly provided some
technical training (e.g. military facilities). This may explain some of the differences.
It is also possible, at least in principle, to estimate the net change in patent activity arising
from the spatial rearrangement of students and researchers. Using the results presented in Tables
4 and 5, for example, the level of innovation in each region can be computed under the
counterfactual of no decentralization of Swedish universities. To do this, we reallocate the
- 25 -
researchers employed in the 25 newly established institutions during the period 1995-2001, back
to the 11 institutions, which had been in existence in 1987. We reallocate researchers to the pre-
existing institutions in proportion to their distribution in 1987. A comparison of this
counterfactual with actual inventive activity yields the net change in patents arising from the
decentralization of higher education. Using the coefficients in equations (M5) and (N5) in Tables
4 and 5, we estimate that the net effect of this spatial rearrangement to be an increase in patent
activity of between 5.5 percent (M5) and 5.8 percent (N5). If this gain in creativity were
attributable entirely to the decentralization of university researchers, these results suggest that the
incremental patent activity is somewhat larger than the initial number of patents attributable to
these workers.
This finding is consistent with a growing body of empirical research in other countries on
the agglomerative tendencies of so-called �knowledge industries.� Saxenian (1994), for example,
suggested that knowledge generated at a firm is more likely to spill out locally if it originates in a
small firm. Rosenthal and Strange (2003) found that small establishments in the knowledge
industry have larger effects on locational attractiveness than larger ones. In a recent paper using
micro data from Dunn and Bradstreet, Rosenthal and Strange (2001) found that proxies for
knowledge spillovers in the U.S. affect firm agglomeration only at the very local (postal code)
level. Adams (2002) compared the localization of academic and industrial spillovers in the U. S.,
concluding that spillovers from academic institutions are quite localized. Our Swedish data also
suggest significant, but highly localized, productivity effects arising from the geographical
locations chosen for these institutions.
Our findings are consistent with a substantial effect of investment in higher education
augmenting the productivity of local areas and the local economies in which they are situated.
- 26 -
References
Adams, James D. (2002), �Comparative Localization of Academic and Industrial Spillovers,�