55
IMAGE INFORMATICS SOLUTIONS Extracting Information From Images Array-Pro 4.5 Training, May 2003
| Date post: | 28-Dec-2015 |
| Category: |
Documents |
| Upload: | joel-wells |
| View: | 215 times |
| Download: | 0 times |

IMAGE INFORMATICS SOLUTIONSExtracting Information From Images
Array-Pro 4.5 Training, May 2003
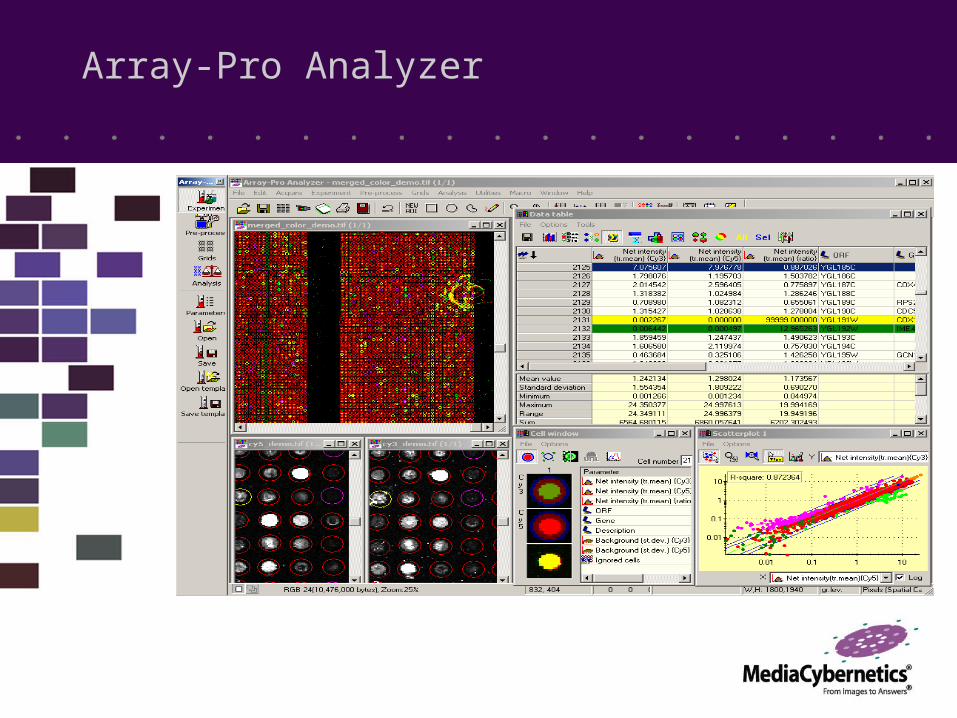
Array-Pro Analyzer
Experiment Model
• Template concept• Experiment definition• Default parameters• Demo macro: Create Grid Finding
Template

Experiment Driven
Image Acquisition
• From scanner• From files

Image Examination
• Overall image quality• On-screen optimization• Understanding the intended grid
layout• Spot shape

General Image Analysis Tools
• Contrast enhancement• AOI• Navigation and zoom• Colorize/color channel• Filters• Operations• Convert/duplicate• Surface plot

Template Method Development
• Conceptual framework• Rotation• Grid location line distance• AOI (bounding rectangle)• Spot location algorithms• Sub-grid definition• Cell boundary definition• Multiple grid zones• Hands on practice

• Spot location definition– On the first image (creating a template)– On other images
• Background correction technique• Normalization technique
Greatest Image Analysis Error Sources

Spot ID Wizard

Auto Grid/Spot Detection Parameters

Advanced Detection
Grid Adjustment
• Manual• Save/load/copy/paste• Auto align• Using Extended auto-align
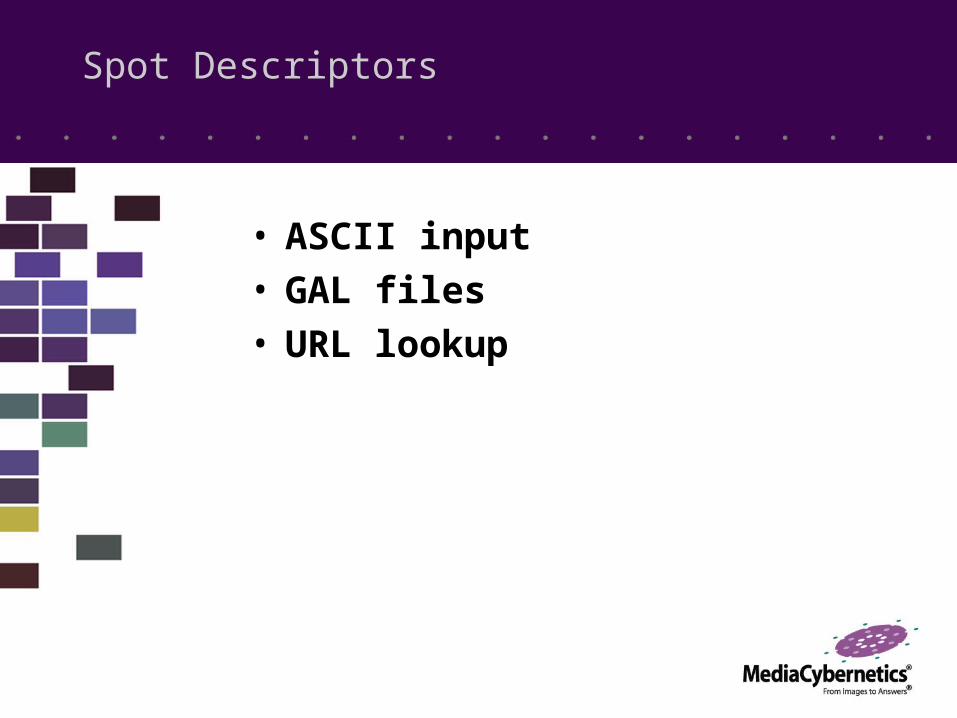
Spot Descriptors
• ASCII input• GAL files• URL lookup

Replicates within an experiment
• Adjacent• Free assignment• By sub-grid• By labels
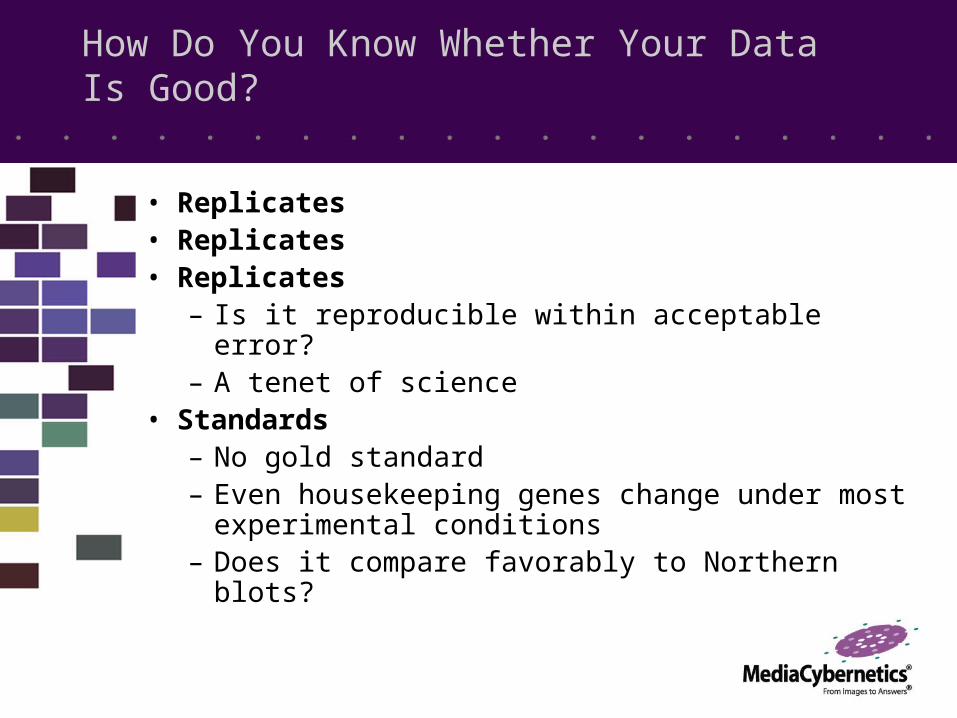
How Do You Know Whether Your Data Is Good?
• Replicates• Replicates• Replicates
– Is it reproducible within acceptable error?– A tenet of science
• Standards– No gold standard– Even housekeeping genes change under most
experimental conditions– Does it compare favorably to Northern blots?

Replicate Handling in Array-Pro

Replicates (Cont)
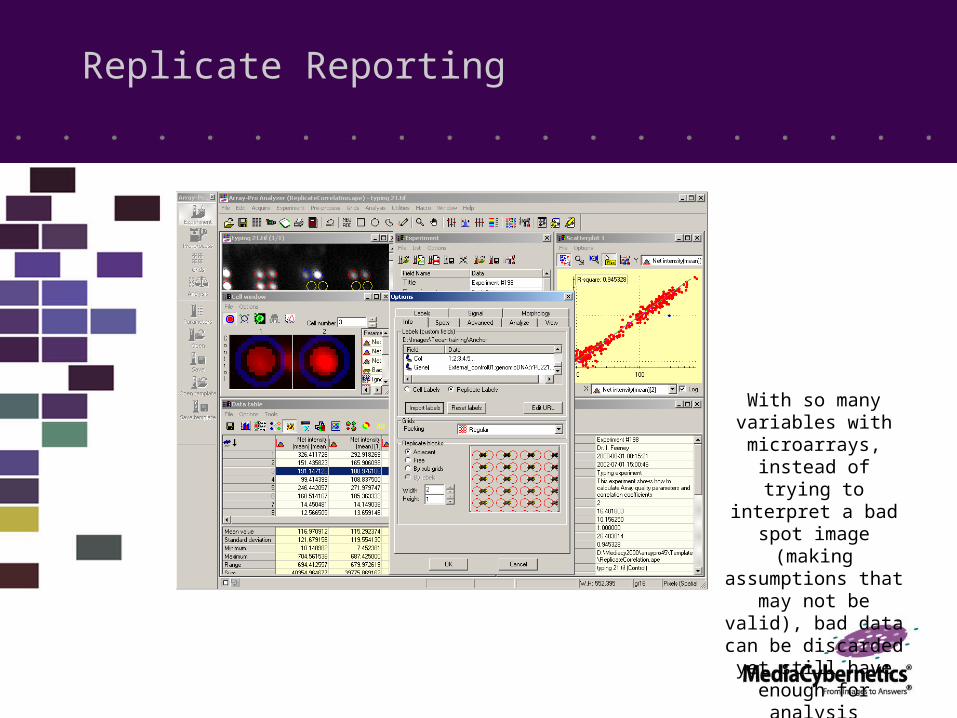
Replicate Reporting
With so many variables with microarrays,
instead of trying to interpret a bad spot
image (making assumptions that may not be valid), bad data
can be discarded yet still have enough for analysis
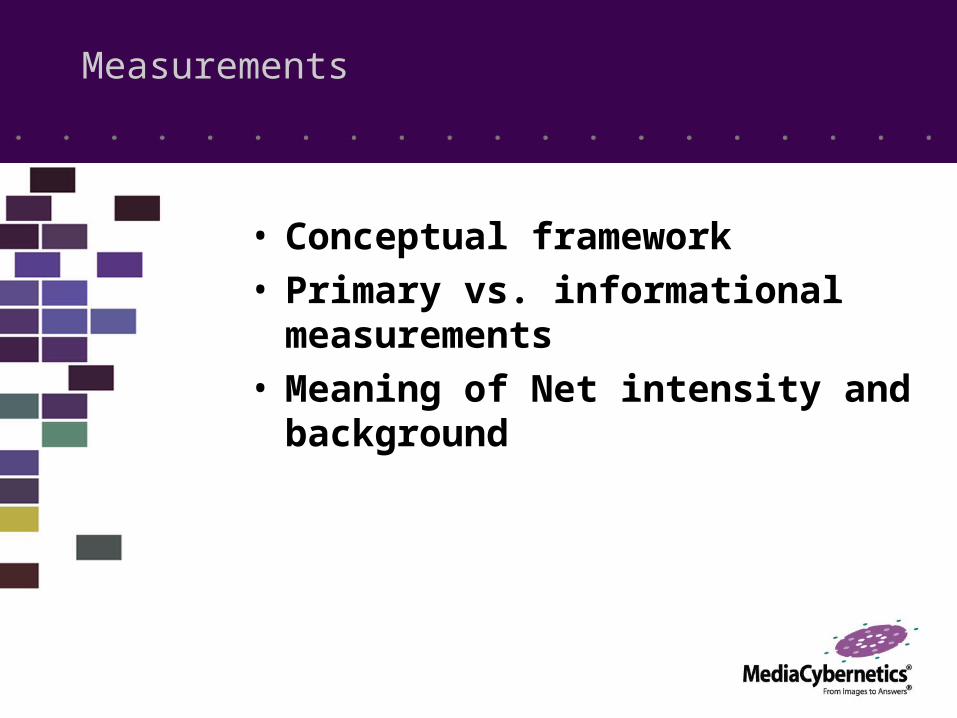
Measurements
• Conceptual framework• Primary vs. informational
measurements• Meaning of Net intensity and
background

Measurements & Statistics
• Available at four levels– Spots– Replicates– Image groups– Collections of image groups
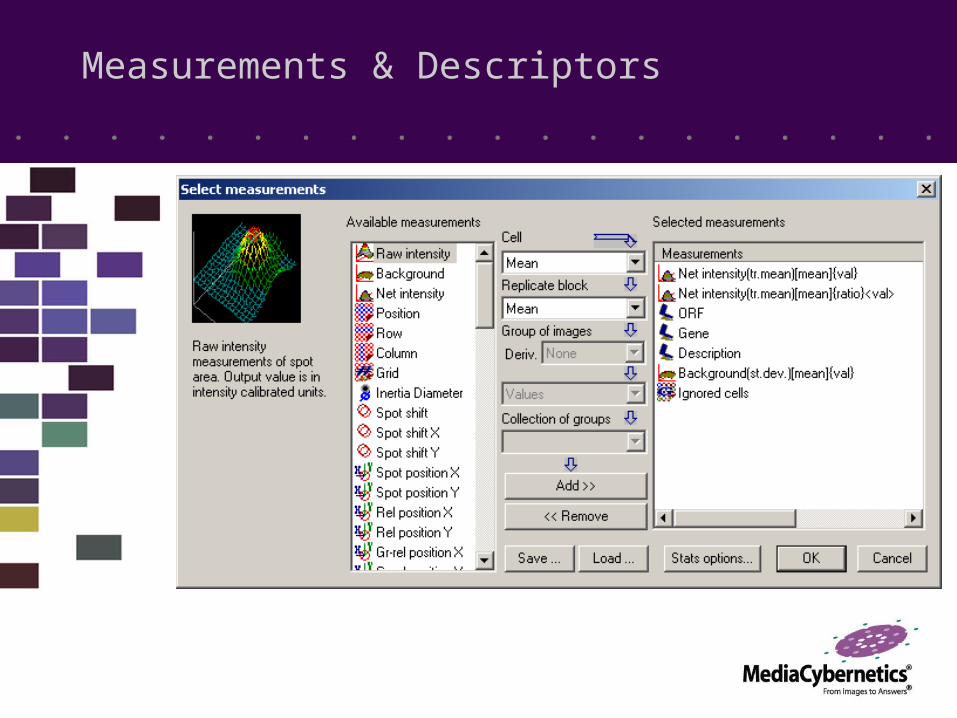
Measurements & Descriptors

Spot Measurements
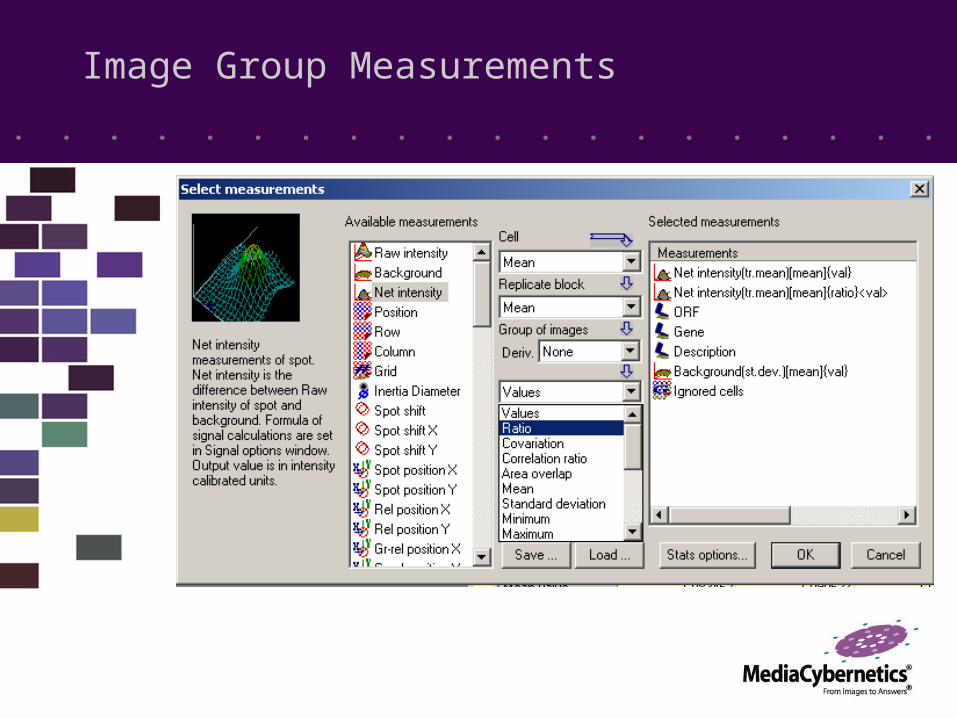
Image Group Measurements

Quality Metrics
• User definable• Some common ones
– Standard deviation of the background pixels
– Inertia diameter (indication of spot shape/uniformity)
– Spot shift– Number of pixels within threshold

Quality Metrics
•Spot quality metrics•User-defined parameters
•Automatic cell flagging
•Array quality metrics

Optimized Results
Only cells failing quality metrics
removed; ratio near expected; mean and median ratio
close

Scatter-plot Display
Default method; good but wide variation at low signal; Cy5 signal
strength causes distortion
Optimized results with much less variance at low signal;
excellent linearity
View and Labels
• User feedback definition• Color assignment

Signal Optimization
• Background concept• Background methods• Net intensity definition as found in
measurements data table

Background Characterization
Appropriate Noise Treatment
Not as many cells ignored
• Using statistical parameters: – Mean, Median, Ranked percentile, Trimmed mean
• Background methods• Pre-filtering• Net intensity definition as found in
measurements data table

Using Local Corners
About the same

Normalization
• Theory• Methods

Normalization methods
Normalization
method Sub-method Statistical
field of Net intensity
Parameters Comments
1. None No normalization 2.1 By all cells 2.2 By signal control cells, flat
Statistical field of the population:
a) Mean b) Median c) Rank d) Trimmed
mean
Normalize Net intensity values of all spots on the image, dividing them by the value of statistical field (mean, median,…) of all cells or signal control cells
2. Single channel normalization
2.3 By signal control cells, normalization surface
Degree of polynomial approximation:
a) Bi-linear b) Bi-quadratic c) Bi-cubic
Normalize Net intensity values of all spots, dividing them by the value of the point in the normalization surface at that coordinate. The normalization surface is created from signal control cells.
3.1 Global linear regression (now called: adjust second channel to ideal correlation)
3. Cross-channel normalization
3.2 Local regression (Loess)
a) Mean b) Median c) Rank d) Trimmed mean e) Sum
Method options: a) Span (0.3) b) Sub-sampling (1) c) Max residual (0.5) d) Population (Select cell groups, default: all cells, except ignored cell group)
Normalize Net intensity values of all spots on the second channel, dividing them by the correction coefficient. The correction coefficient is calculated as the ratio between original Net value of second channel and corrected Net value. Net values of the second channel are corrected to achieve maximum cross-correlation between distributions of Net intensities on first and second channels using linear or Loess regression methods.

Greatest Sources of Image Acquisition Error
• Garbage In Garbage Out– Image analysis can only go so far
• Dynamic range imbalance of Cy5/Cy3– Take advantage of 65,536 counts of a 16-bit
image
• Saturation– Pixels truncate at the top end
• Bleaching – Due to high laser intensity
• Optics• Mechanics

Major Factors Influencing Fluorescent Intensity Readings
• Particulate reflection– Typically 2 to 100 X compared to highest
fluorescent signal• Temperature• pH• Oxygen• Buffer strength• Analyte concentration• Time• Hybridization efficiency
– Kinetics, depletion, etc.

CY3/Cy5 Intensity Curves
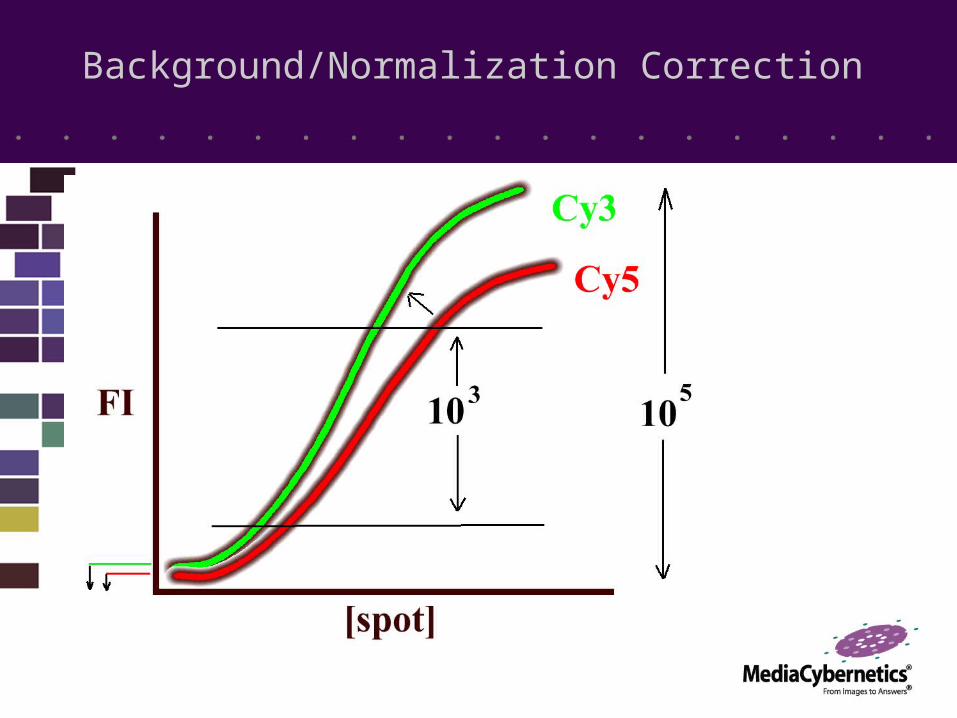
Background/Normalization Correction

Data Windows
• Scatterplot• Data table• Histogram• Cell window• Data Graph• Information table

Cell Groups
• Standard• Custom• Derived• Automatic cell flagging
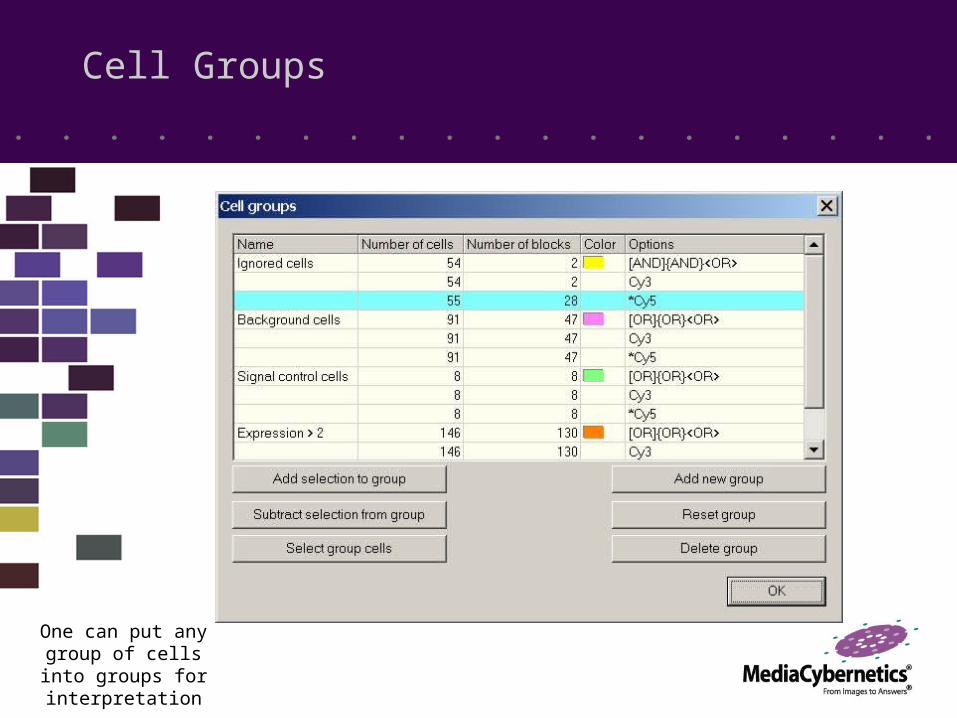
Cell Groups
One can put any group of cells into groups for
interpretation

Histogram
Any measurement or cell group can be
displayed; interactive with all other data display windows

Cell Window

Scatter Plot

Data Graph

Data Table
For information to sort cells and for
reporting

Statistical Feedback

Info Table (Cells)

Info Table (Images)

Cell Group Information
Image Groups
• Hierarchy• Labels

Macro Programming
• Demo macros• Macro recorder• Sample macros

Selling
• Feature/benefits• Demonstration
– Overview presentation• Demo movies• Demo macros
– In-depth technical selling to qualified prospects
HEADQUARTERSMedia Cybernetics, Inc.8484 Georgia Avenue, Suite 200Silver Spring, MD 20910 USAPhone: + 1 301 495 3305Fax: + 1 301 495 5964Email: [email protected] Web: www.mediacy.com


