Image quality and dose analysis for a PA chest X-ray: comparison between AEC mode acquisition and manual mode using the 10 kVp rule Cláudia Reis (PT), João Gonçalves (PT), Corrie Klompmaker (NL), Ana Barbara (PT), Chloe Bloor (UK), Ryan Hegarty (UK), Tania Lagrange (CH), Noëlle Temming (NL), Mathilde Sønnesyn (NO), Henritte Røkeness (NO), Amandine Yamasathien (CH), Peter Hogg (UK)
Transcript
Image quality and dose analysis for a PA chest X-ray: comparison between AEC
mode acquisition and manual mode using the 10 kVp rule
Cláudia Reis (PT), João Gonçalves (PT), Corrie Klompmaker (NL), Ana Barbara (PT), Chloe Bloor (UK), Ryan Hegarty (UK), Tania Lagrange (CH), Noëlle Temming (NL), Mathilde Sønnesyn (NO), Henritte Røkeness (NO), Amandine Yamasathien (CH), Peter Hogg (UK)
Outline
• Introduction
– Motivation
– Research question & Objectives
• Methods
• Results & Discussion
• Conclusion
2
Introduction
• PA chest X-ray: an important radiograph (30-40% of all radiographs)
• The best compromise – Image quality
– Patient dose (ALARP)
Introduction
• Motivation
• Research question & Objectives
Methods
Results &
Discussion
Conclusion
3
1. International commission on radiological protection (2004) Managing patient dose in digital radiology. ICRP publication 93 Annals of the ICRP, Elsevier, p 21; 2. Schaefer-Prokop C, Neitzel U, Venema HW, Uffmann M, Prokop M. Digital chest radiography: an update on modern technology, dose containment and control of image quality. European radiology [Internet] 2008 [cited 2013 Aug 19];18(9):1818–1830. Available from: http://www.pubmedcentral.nih.gov/articlerender.fcgi?artid=2516181&tool=pmcentrez&rendertype=abstract 3. Veldkamp WJH, Kroft LJM, Geleijns J. Dose and perceived image quality in chest radiography. European journal of radiology [Internet] 2009 [cited 2013 Aug 19];72(2):209–217. Available from: http://www.ncbi.nlm.nih.gov/pubmed/19577393
Motivation • Analogue to digital systems
– Adjustment of the technique
• Parameters
• Exposure index (Amount of exposure received by the image
receptor; lgM for AGFA (1.96)
• New guidelines (for technical aspects)
• Advantages of digital systems
– Wider dynamic range
– Postprocessing
• Clinical problems – Overexposure
4
Introduction
• Motivation
• Research question & Objectives
Methods
Results &
Discussion
Conclusion
4. Ng CKC, Sun Z. Development of an online automatic computed radiography dose data mining program: a preliminary study. Computer methods and programs in biomedicine [Internet] 2010 [cited 2013 Aug 20];97(1):48–52. Available from: http://www.ncbi.nlm.nih.gov/pubmed/19640604 6. Stewart BK, Kanal KM, Perdue JR, Mann FA. Computed radiography dose data mining and surveillance as an ongoing quality assurance improvement process. AJR American journal of roentgenology [Internet] 2007 [cited 2013 Aug 20];189(1):7–11. Available from: http://www.ncbi.nlm.nih.gov/pubmed/17579143
– Compare the image quality and dose of a PA chest X-ray using AEC mode and the 10 kVp rule
– Verify if there is a difference between the exposure index
5
Introduction
• Motivation
• Research question & Objectives
Methods
Results &
Discussion
Conclusion
METHODS
Introduction
• Motivation
• Research question & Objectives
Methods
Results &
Discussion
Conclusion
6
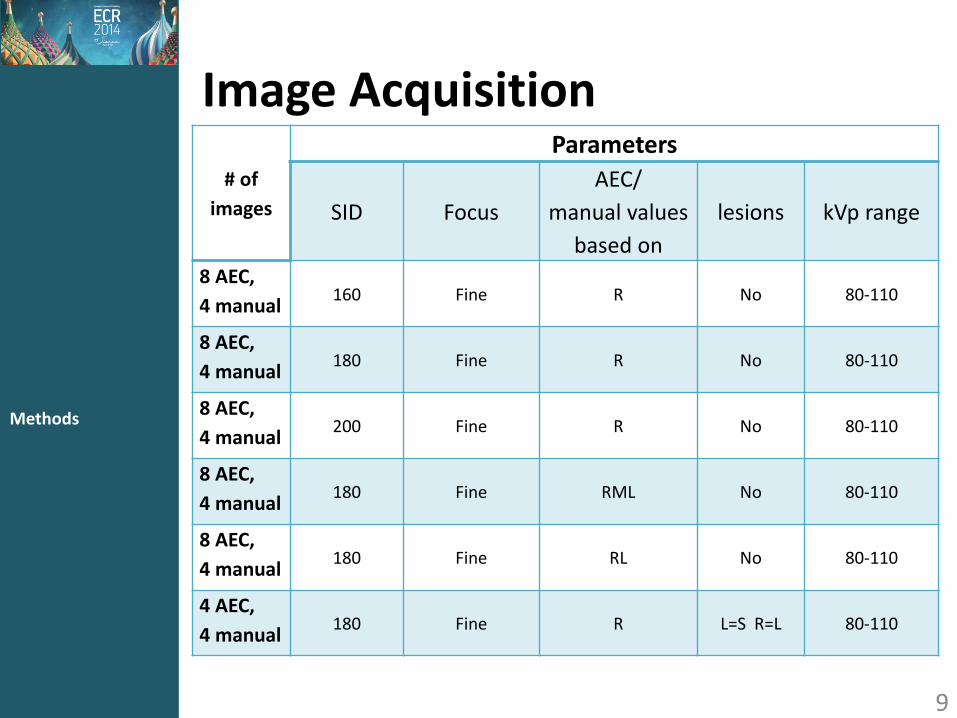
Image Acquisition
7
Introduction
• Motivation
• Research question & Objectives
Methods
Results &
Discussion
Conclusion 8.Warren-Forward H, Arthur L, Hobson L, et al. An assessment of exposure indices in computed radiography for the posterior-anterior chest and the lateral lumbar spine. The British journal of radiology [Internet] 2007 [cited 2013 Aug 20];80(949):26–31. Available from: http://www.ncbi.nlm.nih.gov/pubmed/16916804 9.http://www.rsdphantoms.com/rd_lung.htm
10. Burgess A, Jacobson F, Judy P. Mass discrimination in mammography. Academic Radiology [Internet] 2003 [cited 2013 Aug 20];10(11):1247–1256. Available from: http://linkinghub.elsevier.com/retrieve/pii/S1076633203003830 11. Leong DL, Rainford L, Haygood TM, et al. Trend of Contrast Detection Threshold with and without Localization. Journal of digital imaging [Internet] 2013 [cited 2013 Aug 20]; Available from: http://www.ncbi.nlm.nih.gov/pubmed/23503988 11
Introduction
• Motivation
• Research question & Objectives
Methods
Results &
Discussion
Conclusion
• 2 Alterative Forced Choice (2AFC)
• 5 blinded radiographers
• Likert point scale
Image Quality
12
Introduction
• Motivation
• Research question & Objectives
Methods
Results &
Discussion
Conclusion
Image Quality
12. Ma WK, Hogg P, Tootell A, et al. (2013) Anthropomorphic chest phantom imaging – The potential for dose creep in computed radiography. Radiography 19:207–211. doi: 10.1016/j.radi.2013.04.002
Criteria for images without lesions
Demonstration of vascular pattern in whole lung,
particularly the peripheral vessels.
Visually sharp demonstration of the borders of the
heart.
Visually sharp demonstration of the borders of the
aorta.
Visually sharp demonstration of the diaphragm.
Visualisation of the retrocardiac lung and the
mediastinum.
Visualisation of the spine through the heart
shadow.
13
Introduction
• Motivation
• Research question & Objectives
Methods
Results &
Discussion
Conclusion
Image Quality
12.. Ma WK, Hogg P, Tootell A, et al. (2013) Anthropomorphic chest phantom imaging – The potential for dose creep in computed radiography. Radiography 19:207–211. doi: 10.1016/j.radi.2013.04.002
Criteria for images with lesions Demonstration of vascular pattern in whole lung, particularly the peripheral vessels. Visually sharp demonstration of the borders of the heart. Visually sharp demonstration of the borders of the aorta. Visually sharp demonstration of the diaphragm. Visualisation of the retrocardiac lung and the mediastinum. Visualisation of the spine through the heart shadow.
Contrast of nodule, against background. Brightness of nodule, against background. Sharpness of nodule edge.
RESULTS & DISCUSSION
Introduction
• Motivation
• Research question & Objectives
Methods
Results &
Discussion
Conclusion
14
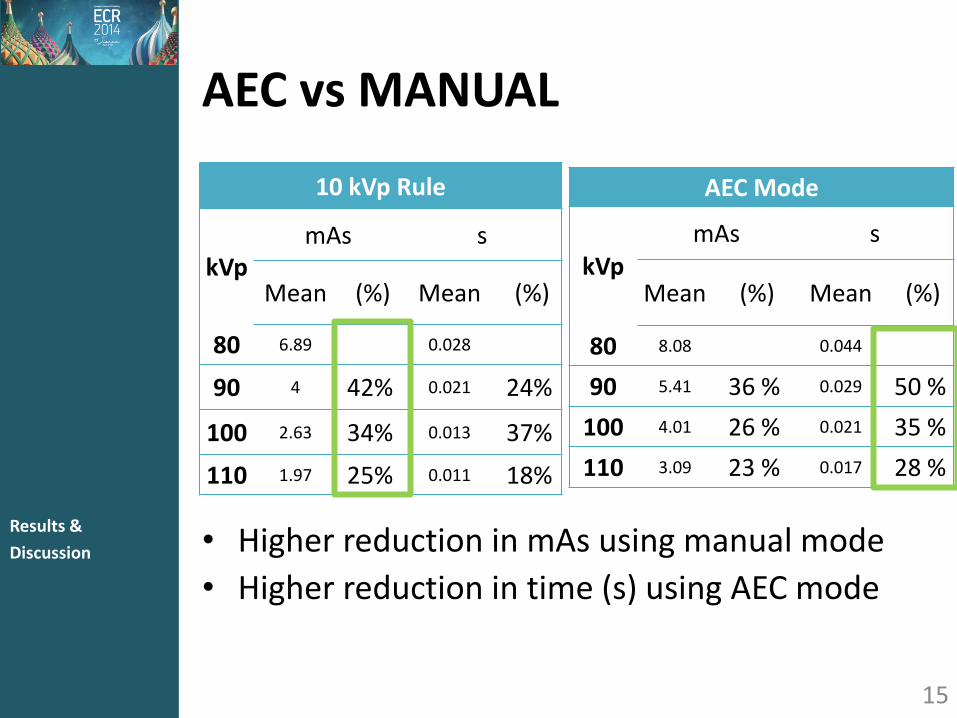
AEC vs MANUAL
• Higher reduction in mAs using manual mode
• Higher reduction in time (s) using AEC mode
Group 3 15
Introduction
• Motivation
• Research question & Objectives
Methods
Results &
Discussion
Conclusion
10 kVp Rule
kVp mAs s
Mean (%) Mean (%)
80 6.89 0.028
90 4 42% 0.021 24%
100 2.63 34% 0.013 37%
110 1.97 25% 0.011 18%
AEC Mode
kVp mAs s
Mean (%) Mean (%)
80 8.08 0.044
90 5.41 36 % 0.029 50 %
100 4.01 26 % 0.021 35 %
110 3.09 23 % 0.017 28 %
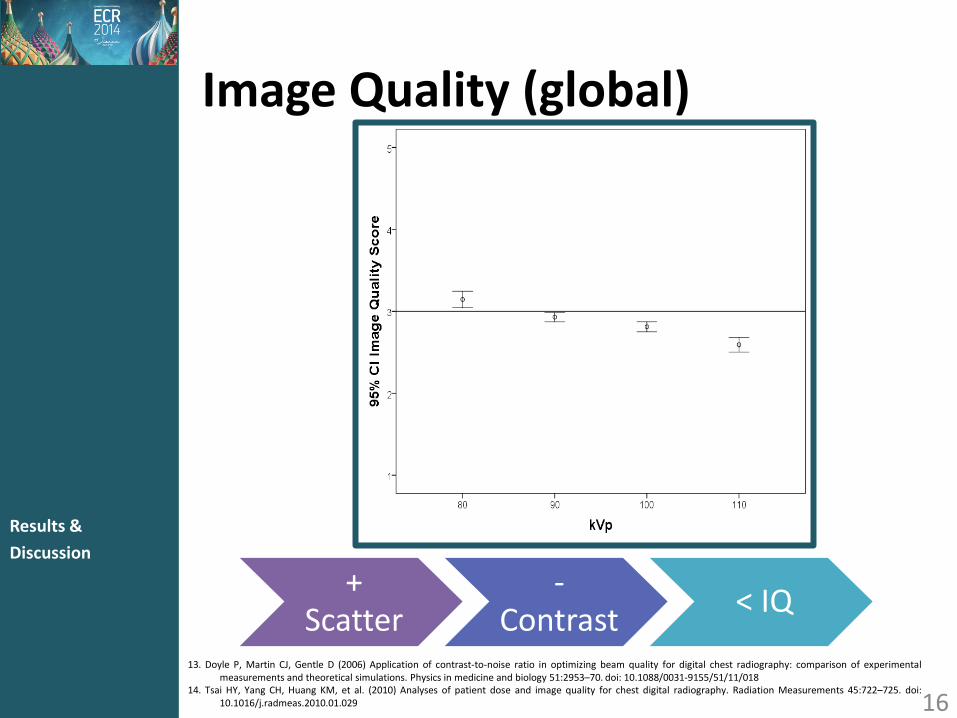
Image Quality (global)
16
Introduction
• Motivation
• Research question & Objectives
Methods
Results &
Discussion
Conclusion
+ Scatter
-Contrast
< IQ
13. Doyle P, Martin CJ, Gentle D (2006) Application of contrast-to-noise ratio in optimizing beam quality for digital chest radiography: comparison of experimental measurements and theoretical simulations. Physics in medicine and biology 51:2953–70. doi: 10.1088/0031-9155/51/11/018
14. Tsai HY, Yang CH, Huang KM, et al. (2010) Analyses of patient dose and image quality for chest digital radiography. Radiation Measurements 45:722–725. doi: 10.1016/j.radmeas.2010.01.029
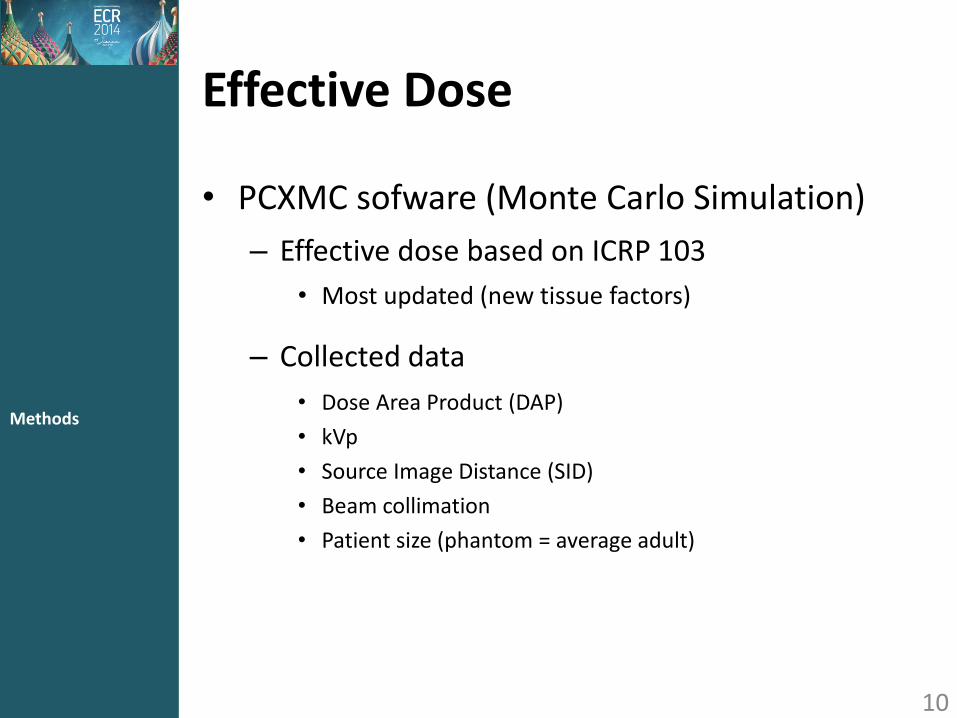
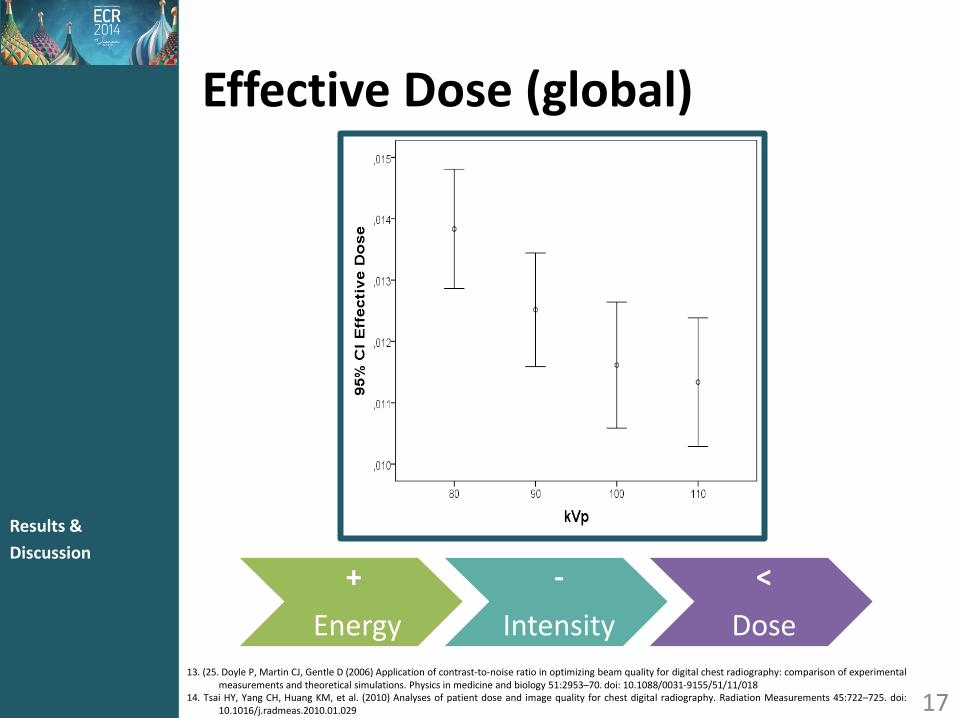
Effective Dose (global)
17
Introduction
• Motivation
• Research question & Objectives
Methods
Results &
Discussion
Conclusion
13. (25. Doyle P, Martin CJ, Gentle D (2006) Application of contrast-to-noise ratio in optimizing beam quality for digital chest radiography: comparison of experimental measurements and theoretical simulations. Physics in medicine and biology 51:2953–70. doi: 10.1088/0031-9155/51/11/018
14. Tsai HY, Yang CH, Huang KM, et al. (2010) Analyses of patient dose and image quality for chest digital radiography. Radiation Measurements 45:722–725. doi: 10.1016/j.radmeas.2010.01.029
+
Energy
-
Intensity
<
Dose
Effective Dose (global)
• Manual mode (better ED); • AEC – R or RL – depending on AEC calibration
and users’ preferences.
Group 3 18
Introduction
• Motivation
• Research question & Objectives
Methods
Results &
Discussion
Conclusion
13. Doyle P, Martin CJ, Gentle D (2006) Application of contrast-to-noise ratio in optimizing beam quality for digital chest radiography: comparison of experimental measurements and theoretical simulations. Physics in medicine and biology 51:2953–70. doi: 10.1088/0031-9155/51/11/018
14. Tsai HY, Yang CH, Huang KM, et al. (2010) Analyses of patient dose and image quality for chest digital radiography. Radiation Measurements 45:722–725. doi: 10.1016/j.radmeas.2010.01.029
lgM (Exposure index – AGFA)
• SID did not influence the lgM variation (p=0.931)
• lgM < reference - 1.96
Group 3 19
Introduction
• Motivation
• Research question & Objectives
Methods
Results &
Discussion
Conclusion
15. (2013) AGFA HealthCare. http://www.agfahealthcare.com/usa/en/main/. 16. Lança L (2011) Radiological imaging in digital systems: the effect of exposure parameters in diagnostic quality and patient
dose. 1–229.
CONCLUSIONS
20
Introduction
• Motivation
• Research question & Objectives
Methods
Results &
Discussion
Conclusion
Conclusions
• AEC vs Manual
– No significant differences between image quality and lgM
– Using the 10 kVp on manual mode shows a lower effective dose
21
Introduction
• Motivation
• Research question & Objectives
Methods
Results &
Discussion
Conclusion
Further work
• More observers
– Also clinical radiographers
• More images for lesion analysis
– Only 8 images
– Use of conspicuity software
• Perform this study using different types of equipment to confirm results