Page 1
HK Kim
Revision: September 2013
DM223764/MedicalPhysics/ImageQuality.doc Available at http://bml.pusan.ac.kr
Image Quality
Contrast
Resolution
Noise
Signal-to-Noise Ratio
Nonrandom Effects
Accuracy
Image quality depends on various factors such as
contrast
- the difference between image characteristics of an object and surrounding objects
or background
resolution
- the ability of a medical imaging system to depict details
noise
- random fluctuations in image intensity that do not contribute to image quality
- reducing object visibility by masking image features
artifacts
- image features that do not represent a valid object or characteristics of the patient
distortion
- inaccurate impression of shape, size, position, and other geometric characteristics
accuracy
- conformity to truth and clinical utility
Page 2
HK Kim
Revision: September 2013
DM223764/MedicalPhysics/ImageQuality.doc Available at http://bml.pusan.ac.kr
Contrast
differences between the image intensity of an object and surrounding objects or background
inherent object contrast
The goal of a medical imaging system is to accurately portray or preserve the true object contrast
Modulation
minmax
minmax
minmax
minmax
2/)(
2/)(
ff
ff
ff
ffm f
- an effective way to quantify contrast for a periodic signal
- the contrast of the periodic signal relative to its average value
- the ratio of the amplitude (or difference) of f(x, y) to the average value (or background)
- 0 mf 1 for nonnegative values of f(x, y)
- nonzero "background" intensity reduces image contrast (note that mf = 1 when fmin = 0)
- no contrast when fmin = fmax
Modulation transfer function
For a sinusoidal object )2sin(),( 0xuBAyxf
where A, B = nonnegative constants (A B)
fmax = A + B, fmin = A – B
Therefore, A
Bm f
See the examples when mf = 0, 0.2, 0.5, 1:
As mf , contrast [much easier to distinguish differences in shades of gray in f(x, y)]
Page 3
HK Kim
Revision: September 2013
DM223764/MedicalPhysics/ImageQuality.doc Available at http://bml.pusan.ac.kr
How does an LSI imaging system with PSF h(x, y) affect the modulation of f(x, y)?
Input: xuxujee
j
BAxuBAyxf 00 22
02
)2sin(),(
Output: )2sin()0,()0,0(),( 00 xuuHBAHyxg
where )0,()0,0( 0max uHBAHg
)0,()0,0( 0min uHBAHg
)0,0(
)0,(
)0,0(
)0,( 00
H
uHm
AH
uHBm fg
- depending on the spatial frequency of input object u0
- scaled version of mf with the scaling factor = the magnitude spectrum )0,( 0uH
- mg < mf if 1)0,0( H & 1)0,( 0 uH
- Less contrast of g(x, y) than the input f(x, y)
because both f(x, y) and g(x, y) have the same average value [= (max + min) / 2]
modulation transfer function (MTF)
- the ratio of the output modulation to the input modulation as a function of spatial frequency
)0,0(
)0,()(MTF
H
uH
m
mu
f
g
- "frequency response" of the system
- directly obtained from the Fourier transform of the PSF of the system
- characterizing contrast; characterizing blurring (or resolution) because it is related to the PSF
blurring reduces contrast
- degradation of contrast as a function of spatial frequency
- 1)0(MTF)(MTF0 u for every u
Page 4
HK Kim
Revision: September 2013
DM223764/MedicalPhysics/ImageQuality.doc Available at http://bml.pusan.ac.kr
We can think of loss of contrast as the result of the blurring action of a medical imaging system.
For a nonisotropic system;
orientation-dependent resolution (e.g., ultrasound imaging systems: range vs. lateral resolutions)
)0,0(
),(),(MTF
H
vuH
m
mvu
f
g
1)0,0(MTF)0,0(
),(),(MTF0
H
vuHvu for every u, v
Page 5
HK Kim
Revision: September 2013
DM223764/MedicalPhysics/ImageQuality.doc Available at http://bml.pusan.ac.kr
Local contrast
- target: an object of interest (e.g., a tumor in the liver)
- background: other objects surrounding the target (e.g., the liver tissue)
obscuring our ability to see or detect the target
local contrast
b
bt
f
ffC
Consider an image showing an organ with intensity I0 & a tumor with intensity It > I0.
What is the local contrast of the tumor if we add a constant intensity Ic > 0?
0
0
I
IIC t without the additional signal
CII
IC
II
II
II
IIII
f
ffC
cc
t
c
cct
b
bt
0
0
0
0
0
0 with the additional signal
Page 6
HK Kim
Revision: September 2013
DM223764/MedicalPhysics/ImageQuality.doc Available at http://bml.pusan.ac.kr
Resolution
the ability of a medical imaging system to accurately depict two distinct events
in space, time, or frequency spatial, temporal, or spectral resolution, respectively
the degree of smearing or blurring introduced to a single event in space, time, or frequency
can be described by the PSF (i.e., impulse response function)
Line spread function
as an alternative to the PSF
Consider an LSI medical imaging system with isotropic PSF h(x, y) that is normalized to 1
line impulse )(),(),( xyxyxf since the system is isotropic
)(d),(
dd)(),(
dd),(),(),(
xlxh
xh
yxfhyxg
- relationship between the LSF and the PSF
- l(x) is symmetric [i.e., l(x) = l(-x)] if the PSF h(x, y) is isotropic
- 1d)(
xxl because the PSF is normalized to 1
- relation between the LSF and the transfer function:
)0,(
dd),(
d)(
)]([)(
2
2
1
uH
xexh
xexl
uluL
uxj
uxj
D
)0(
)()(MTF
L
uLu for every u
Page 7
HK Kim
Revision: September 2013
DM223764/MedicalPhysics/ImageQuality.doc Available at http://bml.pusan.ac.kr
Full width at half maximum (FWHM)
- the (full) width of the LSF (or the PSF) at one-half its maximum value
- the minimum distance that two lines (or points) must be separated in space in order to appear
as separate in the recorded image
Page 8
HK Kim
Revision: September 2013
DM223764/MedicalPhysics/ImageQuality.doc Available at http://bml.pusan.ac.kr
Resolution and modulation transfer function
Consider the output of a medical imaging system for the input of )2sin(),( uxByxf ;
[the separation between two adjacent maxima (or minima) of f(x, y) is 1/u]
)2sin()0,0()(MTF),( uxBHuyxg
- the separation between two adjacent maxima (or minima) of g(x, y) is 1/u as well
- the amplitude of g(x, y) = the amplitude of f(x, y) MTF(u)
- the resolution of the system = 1/ uc when g(x, y) = 0 for every u > uc
because MTF(u) 0 for every u uc and MTF(u) = 0 for every u > uc
MTF
- can be used to compare two competing medical imaging systems
in terms of their contrast and resolution
- if the MTFs are of a similar shape but have a different uc
better system with higher MTF value in terms of contrast and resolution
- complicated if the MTF curves are of different shapes
- contrast is a function of spatial frequency frequency-by-frequency comparison
e.g., better low-frequency contrast of SYSMEM1 & high-frequency contrast of SYSTEM2
- resolution is not frequency-dependent difficult to directly compare MTFs
Page 9
HK Kim
Revision: September 2013
DM223764/MedicalPhysics/ImageQuality.doc Available at http://bml.pusan.ac.kr
Subsystem cascade
The recorded image g(x, y) can be modeled as the convolution of the input object f(x, y) with the PSF of
the corresponding the subsystem because medical imaging systems are often modeled as a cascade of LSI
subsystems.
For K subsystems;
))),(),((),((),(),( 12 yxfyxhyxhyxhyxg K
Using the FWHM;
22
2
2
1 KRRRR
where Rk = FWHM of k-th subsystem
- Overall FWHM R is dominated by the largest (i.e., the poorest resolution) term
Small improvement in Rk does not often yield improvements in R
Using the MTF
),(MTF),(MTF),(MTF),(MTF 21 vuvuvuvu K
- MTF of the overall system MTFk
),(MTF),(MTF vuvu k for every u, v
The overall quality of a medical imaging system, in terms of contrast & resolution,
will be inferior to the quality of each subsystem
Page 10
HK Kim
Revision: September 2013
DM223764/MedicalPhysics/ImageQuality.doc Available at http://bml.pusan.ac.kr
"Spatial resolution" and "image contrast" are tightly linked
- Spatial resolution can be thought of as the ability of an imaging system to preserve
object contrast in the image
Spatially-dependent resolution
- linear but not shift-invariant systems
- e.g., ultrasound imaging systems, nuclear medicine systems
Resolution tool
resolution tool or bar phantom
line pairs per millimeter (lp/mm)
- 6 – 8 lp/mm for a projection radiography system
- 2 lp/mm for a CT scanner
Temporal and spectral resolution
temporal resolution
- the ability to distinguish two events in time as being separate
spectral resolution
- the ability to distinguish two different frequency (or, equivalently, energies)
Page 11
HK Kim
Revision: September 2013
DM223764/MedicalPhysics/ImageQuality.doc Available at http://bml.pusan.ac.kr
Noise
an unwanted characteristic of medical imaging systems
random fluctuation in an image
image quality as noise
in projection radiography
- quanta or photons: discrete packets of energy arriving at the detector from the x-ray source
- quantum mottle: random fluctuation due to the discrete nature of their arrival
a textured or grainy appearance in an x-ray image
in magnetic resonance imaging
- RF pulses generated by nuclear spin systems are sensed by antennas connected to amplifiers
competing with signals being generated in the antenna
from natural unpredictable (i.e., random) thermal vibrations
the source of noise in a medical imaging system depends on
the physics and instrumentation of the particular modality
consider the noise as the numerical outcome of a random event or experiment
think of the noise as the deviation from a nominal value predicted
from purely deterministic arguments
- e.g., random nature radioactive emissions in nuclear medicine
gamma ray photons are emitted at random times in random directions
Page 12
HK Kim
Revision: September 2013
DM223764/MedicalPhysics/ImageQuality.doc Available at http://bml.pusan.ac.kr
Random variables
the numerical quantity associated with a random number or experiment
probability distribution function (PDF)
NPN Pr)(
- the probability that random variable N will take on a value less than or equal to
- 1)(0 NP
- 0)( NP , 1)( NP
- )()( 21 NN PP for 1 2
Continuous random variables
N is a continuous random variable if PN() is a continuous function of
probability density function (pdf)
d
)(d)( N
N
Pp [PN() is cumulative probability function???]
- 0)( Np
- 1d)(
Np
-
uupP NN d)()(
d)(E NN pN expected value or mean
d)()()(EVar 222
NNNN pNN variance
2NN standard deviation
Page 13
HK Kim
Revision: September 2013
DM223764/MedicalPhysics/ImageQuality.doc Available at http://bml.pusan.ac.kr
Uniform random variable over the interval [a, b]
- pdf
otherwise ,0
for ,1
)(ba
abpN
- distribution function
b
baab
aa
PN
for ,1
for ,
for ,0
)(
- expected value 2
baN
- variance 12
)( 22 abN
Gaussian random variable over the interval [a, b]
- pdf 22 2/)(
22
1)(
epN
- distribution function
erf
2
1)(NP
where error function
xu uex
0
2/ d2
1)(erf
2
- expected value N
- variance 22 N
Noise in medical imaging systems is the result of a summation of
a large number of independent noise sources
Central limit theorem of probability
- A random variable that is the sum of a large number of independent causes
tends to be Gaussian
- Often natural to model noise in medical imaging system by means of
a Gaussian random variable
Page 14
HK Kim
Revision: September 2013
DM223764/MedicalPhysics/ImageQuality.doc Available at http://bml.pusan.ac.kr
Discrete random variables
specified by the probability mass function (PMF)
- Pr[N = i] for i = 1, 2, …, k
probability that random variable N will take on the particular value i
- 1Pr0 iN for i = 1, 2, …, k
- 1Pr1
k
i
iN
-
i
iN NNP all
PrPr)(
-
k
i
iiN NN1
PrE expected value or mean
-
k
i
iNiNN NNN1
222 Pr)()(EVar variance
Poisson random variable
ak
ek
akN
!Pr for k = 0, 1, 2, …,
where a > 0 (real-valued parameter)
- aN
- aN 2
Page 15
HK Kim
Revision: September 2013
DM223764/MedicalPhysics/ImageQuality.doc Available at http://bml.pusan.ac.kr
Independent random variables
Consider the collection of random variables N1, N2, …, Nm, having the pdf's p1(), p2(), …, pm(),
respectively.
The sum of these random variables S is another random variable having another pdf, pS();
mS 21
When the random variables are independent;
222
21
2mS
)()()()( 21 mS pppp
Page 16
HK Kim
Revision: September 2013
DM223764/MedicalPhysics/ImageQuality.doc Available at http://bml.pusan.ac.kr
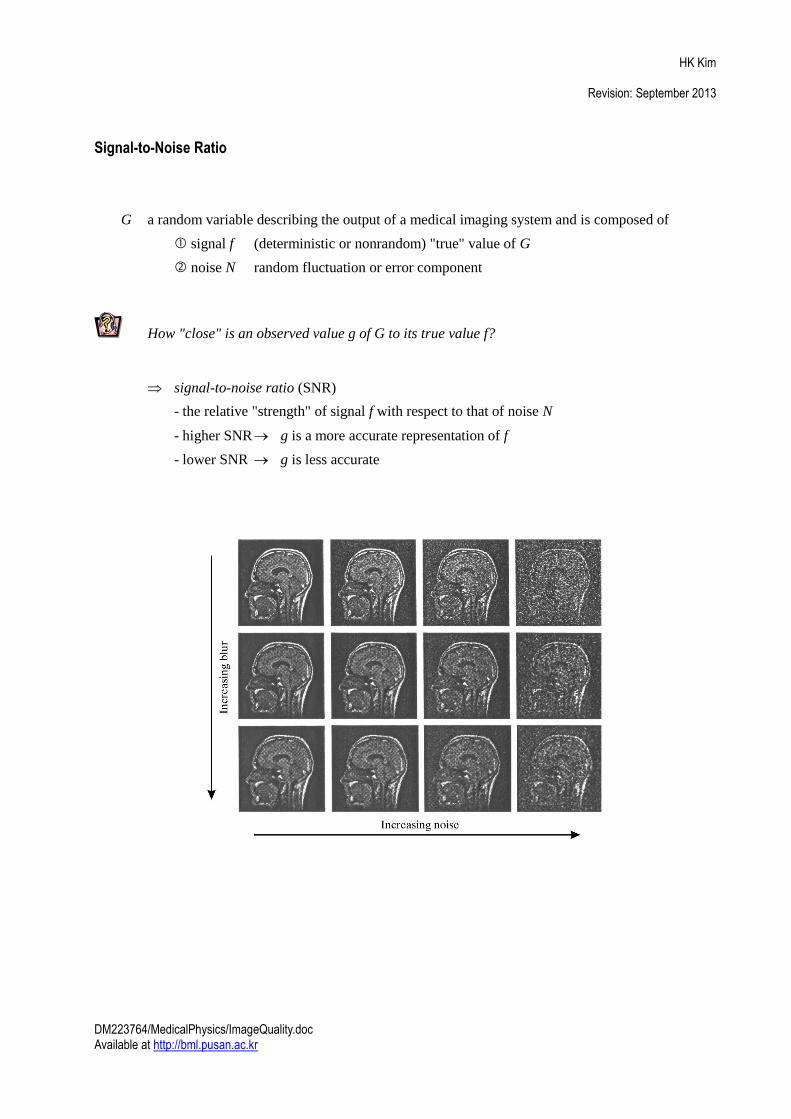
Signal-to-Noise Ratio
G a random variable describing the output of a medical imaging system and is composed of
signal f (deterministic or nonrandom) "true" value of G
noise N random fluctuation or error component
How "close" is an observed value g of G to its true value f?
signal-to-noise ratio (SNR)
- the relative "strength" of signal f with respect to that of noise N
- higher SNR g is a more accurate representation of f
- lower SNR g is less accurate
Page 17
HK Kim
Revision: September 2013
DM223764/MedicalPhysics/ImageQuality.doc Available at http://bml.pusan.ac.kr
Amplitude SNR
)(Amplitude
)(AmplitudeSNR
N
fa
Power SNR
)(Power
)(PowerSNR
N
fp
Power SNR of a system with PSF h(x, y) and noise variance ),(2 yxN for the input f(x, y)
2
2dd),(),(
SNRN
p
yxyxfyxh
with the white noise assumption
White noise: no correlation between noise values in space
0),( yxN (i.e., zero mean) & NN yx ),( for every (x, y)
Correlated noise with the assumption that N & 2N do not depend on (x, y)
wide-sense stationary noise
vuvu
yxyxfyxh
p
dd),(NPS
dd),(),(SNR
2
where
2)(2
00,
0
0
0
000
dd),(E4
1lim),(NPS
x
x
y
y
vyux-jN
yxyxeyxN
yxvu
= noise power spectrum
- Note: frequency-dependent power SNR
)0,0(),(),(NPS
),(MTF
),(NPS
),(),(),(SNR 22
222
HvuFvu
vu
vu
vuFvuHvuP
quantifying, at a given frequency, the relative "strength" of signal to that noise
at the output of the LSI system
providing a relationship between contrast, resolution, noise, and image quality
Page 18
HK Kim
Revision: September 2013
DM223764/MedicalPhysics/ImageQuality.doc Available at http://bml.pusan.ac.kr
With the Parseval's theorem & the freq.-dependent SNRp,
the above SNRp can be reduced to
vuvu
vuvuvu
vuvu
vuvuFvuH p
p
dd),(NPS
dd),(NPS),(SNR
dd),(NPS
dd),(),(SNR
22
Differential SNR
)(
)(SNR
A
ffA
b
btd
where b (A) = the standard deviation of image intensity values
from their mean over an area A of the background
)(
SNRA
CAf
b
td
where b
bt
f
ffC
local contrast
relating the differential SNR to contrast
Rose model
bd AC SNR AC
db 2
2SNR
where b = mean number of background photons counted per unit area (= fb)
AA bb )(
To maintain good image quality, high radiation dose is required
when viewing small, low-contrast object
Decibels (dB)
When the SNR is the ratio of amplitudes, such as with SNRa or SNRd
SNR (in dB) = 20 log10 SNR (ratio of amplitudes)
When the SNR is the ratio of powers, such as with SNRP
SNR (in dB) = 10 log10 SNR (ratio of powers)
Page 19
HK Kim
Revision: September 2013
DM223764/MedicalPhysics/ImageQuality.doc Available at http://bml.pusan.ac.kr
Nonrandom Effects
Artifacts
"Image features" representing "non-valid" anatomical or functional objects
- obscuring important targets
- being falsely interpreted as valid imaging features
- impairing correct detection and characterization of features of interest
by adding "clutter" to images
Due to a variety reasons & at any step of imaging process
- Nonuniformities in x-ray detectors, x-ray source …
- CT
(a) Motion artifacts (appeared as streak artifacts)
(b) Star artifacts by the presence of metallic materials (resulting in incomplete projections)
(c) Beam-hardening artifacts (appeared as broad dark bands or streaks)
due to significant beam attenuation by certain materials
(d) Ring artifact by detectors that go out of calibration
Page 20
HK Kim
Revision: September 2013
DM223764/MedicalPhysics/ImageQuality.doc Available at http://bml.pusan.ac.kr
Distortion
Geometrical problems of a system resulting in inaccurate impression of the shape, size,
and/or position of objects of interest
Examples
(a) size distortion due to magnification
(b) shape distortion due to unequal magnification of the object being imaged or beam divergence
Very difficult to determine and correct
Page 21
HK Kim
Revision: September 2013
DM223764/MedicalPhysics/ImageQuality.doc Available at http://bml.pusan.ac.kr
Accuracy
It should be noted that "image quality ultimately must be judged in the context of a specific clinical
application".
Clinical utility of medical images:
Diagnosis "Is the disease present?"
Prognosis "How will the disease progress, and whit is the expected outcome?"
Treatment planning "Which treatment will work best?"
Treatment monitoring "Is the treatment reversing the disease, and to what extent?"
"Accuracy" = conformity to truth (i.e., freedom from error) and clinical utility
Quantitative accuracy
Quantification of a given anatomic or functional feature within an image in the numerical values
e.g., Tumor dimensions from a radiograph
Glucose metabolic rate from a nuclear medicine image
"Error" or difference from the "true" value
- bias systematic, reproducible difference from the truth
can be corrected through the use of a calibration standard
- imprecision a random, measurement-to-measurement variation
In practice, never error-free!
Page 22
HK Kim
Revision: September 2013
DM223764/MedicalPhysics/ImageQuality.doc Available at http://bml.pusan.ac.kr
Diagnostic accuracy
Define two parameters following Gaussian distributions in a clinical setting:
Sensitivity (= true-positive fraction)
The fraction of patients with disease who are tested*
Specificity (= true-negative fraction)
The fraction of patients without disease who are tested*
*Test = the medical image
Making a 2 2 contingency table after evaluating images from a group of patients
a the number of diseased patients who test calls abnormal
b the number of normal patient who test calls abnormal
c the number of diseased patients who the test calls normal
d the number of normal patients who the test calls normal
Page 23
HK Kim
Revision: September 2013
DM223764/MedicalPhysics/ImageQuality.doc Available at http://bml.pusan.ac.kr
Then, we can calculate
ca
a
ysensitivit &
db
d
yspecificit
Diagnostic accuracy: the fraction of patients that are diagnosed correctly
dcba
da
DA
- To maximize DA, both sensitivity & specificity must be maximized
Threshold, t0
- Sensitivity but specificity as t0
- Sensitivity but specificity as t0
- t0 should be chosen as a balance between sensitivity & specificity
- Dependent upon the "prevalence" or proportion of all patients who have disease
Other two parameters:
Positive predictive value (PPV), ba
a
PPV
The fraction of patients called abnormal who actually have the disease
Negative predictive value (NPV), dc
d
NPV
The fraction of patients called normal who do not have the disease
Prevalence (PR), dcba
ca
PR