5 Image Quality Requirements for Digital Mammography in Breast Cancer Screening Margarita Chevalier 1 , Fernando Leyton 2,3 , Maria Nogueira Tavares 3 , Marcio Oliveira 3 , Teogenes A. da Silva 3 and João Emilio Peixoto 4 1 Complutense University of Madrid 2 Diego Portales University 3 Centro de Desenvolvimento da Tecnologia Nuclear 4 Instituto Nacional do Cáncer 1 Spain 2 Chile 3,4 Brazil 1. Introduction Mammography is currently considered to be the best tool for early detection of breast cancer. The target groups of most of the population-based screening programmes are women aged between 50 and 65 years. A recent study has also shown mortality benefit in the age group 40-49 (Hellquist, et al, 2010). Screen-film mammography has been to date the traditional test for breast screening having been shown its efficacy in reducing breast cancer mortality in large randomised trials (Duffy, et al, 2006). The potential advantages of digital mammography over screen-film techniques have been the subject of several investigations which provides an improved diagnosis in dense breasts and an increase in breast cancer detection rate (Pisano et al, 2006; Hendrick et al, 2010). Breast screening using X-ray mammography only confers a benefit on the screened population if it is able to detect breast cancer at an early stage, whereby the prognosis is improved. This can only be achieved by having high quality breast images to assure as much as possible the detection of small and subtle lesions in the breast (Muller, 1997;Karellas, 2004; Lewin, 2004; ICRU, 2009). High quality mammography must be achieved and maintained by applying rigorous and comprehensive quality assurance and control programmes. The quality of the breast images depends critically on the design and performance of the radiographic unit, the image receptor, and on how that equipment is used to acquire and process the mammogram. The type of display and the conditions under which the image is viewed have an important effect on the ability of the radiologist to extract the information recorded in the mammogram. The diagnostic information is integrally related to the quality of the image and higher image quality will result in more accurate diagnosis (Nishikawa, 2004). The systematic monitoring of both image quality and radiation dose is needed to www.intechopen.com
Transcript
5
Image Quality Requirements for Digital Mammography
in Breast Cancer Screening
Margarita Chevalier1, Fernando Leyton2,3, Maria Nogueira Tavares3, Marcio Oliveira3, Teogenes A. da Silva3 and João Emilio Peixoto4
1Complutense University of Madrid 2Diego Portales University
3Centro de Desenvolvimento da Tecnologia Nuclear 4Instituto Nacional do Cáncer
1Spain 2Chile
3,4Brazil
1. Introduction
Mammography is currently considered to be the best tool for early detection of breast cancer. The target groups of most of the population-based screening programmes are women aged between 50 and 65 years. A recent study has also shown mortality benefit in the age group 40-49 (Hellquist, et al, 2010). Screen-film mammography has been to date the traditional test for breast screening having been shown its efficacy in reducing breast cancer mortality in large randomised trials (Duffy, et al, 2006). The potential advantages of digital mammography over screen-film techniques have been the subject of several investigations which provides an improved diagnosis in dense breasts and an increase in breast cancer detection rate (Pisano et al, 2006; Hendrick et al, 2010).
Breast screening using X-ray mammography only confers a benefit on the screened population if it is able to detect breast cancer at an early stage, whereby the prognosis is improved. This can only be achieved by having high quality breast images to assure as much as possible the detection of small and subtle lesions in the breast (Muller, 1997;Karellas, 2004; Lewin, 2004; ICRU, 2009). High quality mammography must be achieved and maintained by applying rigorous and comprehensive quality assurance and control programmes.
The quality of the breast images depends critically on the design and performance of the radiographic unit, the image receptor, and on how that equipment is used to acquire and process the mammogram. The type of display and the conditions under which the image is viewed have an important effect on the ability of the radiologist to extract the information recorded in the mammogram. The diagnostic information is integrally related to the quality of the image and higher image quality will result in more accurate diagnosis (Nishikawa, 2004). The systematic monitoring of both image quality and radiation dose is needed to
www.intechopen.com
Imaging of the Breast – Technical Aspects and Clinical Implication
116
guarantee a constant high quality of the mammography examination (ICRU, 2009; Ng, 2005). Conventional film/screen mammography is being gradually substituted by digital technology in most countries. Consequently, there is an important activity related with developing quality control protocols adapted to this new digital technologies (CEC,2006; SEFM, 2008;NHSBSP, 2009; IAEA, 2011).
Data retrieved from programmes in the Netherlands (Beckers, 2003), Sweden (Leitz, 2001), Norway (Pedersen, 2000) and the UK (NHSBSP, 2003) show that the levels of DG in screen-film mammography range between 0.8 and 2.5 mGy for a 5.3 cm compressed breast thickness. Thus, several national and international protocols have established an accepted DG limit of 2.5 mGy for a 5.3 cm standard breast thickness. Data from a European survey (Report EUR 14821, 2001) on radiation doses developed in 56 mammography institutions showed DG values ranging from 1.0 to 3.0 mGy for 6.0 cm thick breasts. This value was established from measurements using an acrylic simulator.
This chapter is devoted to describe the relevant parameters and procedures for the quality control of digital mammography systems making the necessary distinctions among the two technologies (computed radiography (CR) and flat panel detectors (DR)).
2. Detectors for digital mammography
2.1 Flat panel Systems – DR
Flat panel systems (DR) have an active matrix of electronic detectors where each element absorbs the radiation transmitted through mammary tissue, producing an electrical signal proportional to the intensity of the X-rays.
2.1.1 Indirect capture of an image
In the indirect capture of an image, a flat screen scintillator, a photodiode circuitry layer, and a TFT array are used (Fig. 1). Caesium iodide crystals (CsI(Tl)) are the scintillators usually employed. CsI(Tl) crystals are structured in an array of thin needles that guide the light photon reducing the light diffusion within the scintillator layer. The light is captured by the elements of the photodiode matrix (amorphous silicon), which converts the light into electrical current. These amorphous silicon sensors (a-Si) are connected to a matrix of thin-film transistors (TFT) which store the information of each pixel up to the moment of its reading by the scan circuit in the detector (Vedantham, 2000; Suryanarayanan, 2004; Peixoto, 2009).
2.1.2 Direct capture of an image
In the direct capture mode, an amorphous selenium plate (a-Se) photoconductor is used to convert the incident X-ray photons into electron-hole pairs (Yaffe, 1997, Peixoto, 2009). Each charge of the electron-hole pair created is attracted by the corresponding electrode under the action of the strong electric field applied between the electrodes. The created charge is accumulated and stored by a TFT matrix (Fig. 2).
2.2 Computed radiography system – CR
Computed radiography (CR) is a process comparatively similar to the conventional screen-film system. The film is replaced by a plate (IP) made up of photostimulable phosphorus
www.intechopen.com
Image Quality Requirements for Digital Mammography in Breast Cancer Screening
117
Fig. 1. Indirect method of image acquisition with CsI(Tl)/a-Si. The CsI scintillators hold needle structures and work as channels which guide the light perpendicularly to the surface of the photodiodes (Peixoto, 2009).
Fig. 2. Method of direct acquisition of an image with a-Se (Peixoto, 2009).
(PSP) which is introduced into a cassette of similar characteristics than the one used with the film.
Inside the cassette, the photostimulable phosphorus plate is used to absorb and store the energy of the X-ray transmitted through the breast, thus producing a ‘latent image’. The energy stored in the phosphorous plate is associated to the electrons raised to excited levels of energy in which they hold trapped (“F-centre”). This is the non-observable electronic latent image, where the number of electrons trapped is proportional to the number of incident X-ray photons (Marcelino V.A. Dantas., 2010). As follows, the cassette is inserted into the reading unit (Fig. 3). Inside this unit, the plate is scanned with a low energy intense laser light (~ 2 eV) which is highly focused. The electrons trapped in the phosphorus photostimulable matrix (PSP) are stimulated by the laser energy, and a significant fraction
www.intechopen.com
Imaging of the Breast – Technical Aspects and Clinical Implication
118
returns to the lowest energy level with a simultaneous emission of a higher energy photo-stimulated luminescence (PSL) (~ 3 eV). The intensity of the PSL, proportional to the number of electrons emitted, is captured by a light guide system near the IP (Fig. 4). A photomultiplier tube (PMT) at the output of the light guide amplifies and converts the PSL into a corresponding output voltage (Rowlands, 2002; Dantas, 2010).
Fig. 3. Image digitiser for CR Systems (Alvarenga, 2008).
Fig. 4. Image acquisition for the CR system: (a) single reading; (b) double reading (Peixoto, 2009).
www.intechopen.com
Image Quality Requirements for Digital Mammography in Breast Cancer Screening
119
The residual latent image information is erased through an intense light which removes the electrons not released by the laser stimulation, and the IP returns to the cassette “reset” and ready to be reused.
The diagram of the whole process involving the image acquisition with a CR system is shown in Fig. 5 (left).
Fig. 5. Acquisition process, processing and visualisation of mammography images CR (Alvarenga, 2008).
3. Parameters with the greatest impact on dose and image quality
The objective of mammography is to provide the early detection of cancer, and therefore the image quality is a fundamental aspect. The image with a suitable diagnostic-quality has to be acquired with a radiation dose as low as possible. Nowadays, it is widely accepted that mean glandular dose (DG) is the best indicator to estimate the risk associated with breast irradiation in mammography (see definition in SectionV). Both factors, image quality and DG, are depending on breast characteristics (glandularity and thickness), exposure factors (beam quality, exposure time and compression force), detector features and mammography system performance (automatic exposure control) and characteristics (geometry, focal spot size).
3.1 Characteristics of the breast
Breast composition varies among women due to different proportion of glandular, fibrous and adipose tissue. The composition also changes with the age of the woman such that the proportion of adipose tissue increases with age.
www.intechopen.com
Imaging of the Breast – Technical Aspects and Clinical Implication
120
Differences among the x-ray attenuation properties of the different breast tissues can be observed at the breast images. Glandular and fibrous tissues are visualised in mammography as radio-opaque whereas the adipose tissues are observed as radio-lucent (dark). Therefore, given the same compressed breast thickness a dense breast (having a higher proportion of glandular tissues) absorbs a higher amount of radiation than an adipose breast.
The lesions of interest for diagnosis are microcalcifications, masses, asymmetries and distortions of the breast architecture. Microcalcifications are small (100 µm) and “easily” detected regardless of breast density. The masses tend to have low contrast, making it difficult to detect. Therefore, mammography must have - besides optimal resolution - good contrast, which makes visible those anatomic structures and pathological signs which have very similar densities.
3.2 The compression system
A proper compression of the breast is fundamental to provide a good quality image. Breast compression brings the structures close to the detector enhancing sharpness, prevents breast movement, reduces the breast thickness penetrated by X-rays and reduces the scattered radiation. All these factors improve the contrast and even reduce the absorbed dose (Karellas, 2004). In addition, the exposure factors in modern mammography systems are automatically selected in base of the compressed breast thickness. Quality control programmes have to include procedures to verify the compression force and the accuracy of the breast thickness determined by the system.
3.3 Automatic exposure control
In mammography, the automatic exposure control (AEC) (also known as “photo timer”)
cuts off the exposure when arrives to the AEC radiation sensor, which lies below the anti-
scatter grid and the image receptor, the necessary dose resulting in optimum optical density
or pixel value. The sensor can be placed at several positions (3 in most of the units) between
the thorax and the nipple in depending of the breast size.
Flat panel detectors of digital mammography units operate as AEC sensors. In this case, the
information can be derived from the whole area of the detector or from predefined
regions.
The AEC of most modern mammography units uses the information associated with a pre-
exposure to determine the attenuation of the breast. This information along with the breast
thickness automatically detected (compressor) determines all the exposure factors
(anode/filter, kV, mAs).
The AEC is committed to provide images with an appropriate optical density,
independently from the beam quality and the characteristics of the breast. Thus, there is a
guarantee that the information will be registered in the linear region of the characteristic
curve of the film.
In digital systems, the main role of the AEC is to assure that signal noise ratio (SNR) and
contrast noise ratio (CNR) are adequate throughout the image and that the dose values
comply with recommendations.
www.intechopen.com
Image Quality Requirements for Digital Mammography in Breast Cancer Screening
121
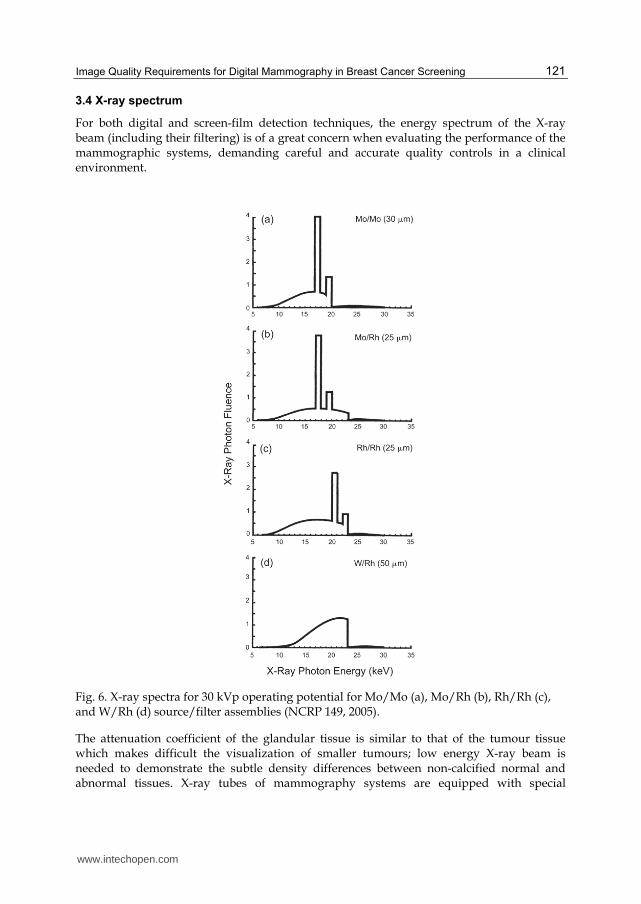
3.4 X-ray spectrum
For both digital and screen-film detection techniques, the energy spectrum of the X-ray beam (including their filtering) is of a great concern when evaluating the performance of the mammographic systems, demanding careful and accurate quality controls in a clinical environment.
Fig. 6. X-ray spectra for 30 kVp operating potential for Mo/Mo (a), Mo/Rh (b), Rh/Rh (c), and W/Rh (d) source/filter assemblies (NCRP 149, 2005).
The attenuation coefficient of the glandular tissue is similar to that of the tumour tissue which makes difficult the visualization of smaller tumours; low energy X-ray beam is needed to demonstrate the subtle density differences between non-calcified normal and abnormal tissues. X-ray tubes of mammography systems are equipped with special
www.intechopen.com
Imaging of the Breast – Technical Aspects and Clinical Implication
122
anode/filter combinations, such as Mo/Mo or Mo/Rh, operating in the 25-35 kVp range. The spectra of several anode/filter combinations (Fig. 6) show the important proportion of of X-rays characteristics (17.5 and 19.7 keV) from the molybdenum target and the strong suppression of the spectrum at energies >20 keV because of the k-shell absorption edge of the molybdenum filter (Fig. 6a) or else higher than 23 keV because of the Rh filter (Fig. 6b). The characteristics of the new digital detectors make it possible to use other anode/filter combinations such as Rh/Rh (Fig. 6c), W/Rh (Fig. 6d), W/Ag and W/Al which have some advantages for imaging dense or thick breasts. In addition, the breast doses associated with these combinations are lower than those delivered with Mo/Mo or Mo/Rh.
The adequate selection of the spectrum (beam) may reduce the dose values above 20% (Young, 2006; Dance, 2000; Riabi, 2010). The threshold value for breast thickness where the spectrum is changed depends on the AEC calibration which is performed by technical services who install the equipment (which should be done together with those medical staff who use the equipment). The correct selection of the X-ray beam will strongly influence the dose and image quality.
4. Image quality in mammography
Image quality is a fundamental concept for the control and optimisation of mammography; it
aims to improve the early detection of cancer and other pathological lesions in the breasts. The
image quality can be quantified by measuring the contrast noise ratio, the signal noise ratio,
the modulation transfer function (MTF) (spatial resolution), the noise, the uniformity and
various artefacts such as the ghost image. In order to assess these physical parameters,
phantoms and more specific devices are needed to perform quality control in mammography.
The current trend is to utilise a contrast-detail phantom (CDMAM) which permits the
assessment of the image quality as a function of the contrast threshold associated with the
circular objects of different diameters and thickness (SEFM, 2008). The “clinical ”assessment of
the image quality is better performed by means of the receiver operating curve (ROC)
methodology. Unfortunately, this type of analysis is far too complex and is time consuming. In
addition, it is required a database with too many images, which makes its application difficult
in the clinical practice of routine image quality control (NCRP, 2005).
4.1 MTF
The modulation transfer function (MTF) is a quantitative and objective measurement of the
image quality that can be provided by a system. MTF gives information about the
magnitude of the object contrast which is transferred to the image as a function of the spatial
frequency. The low spatial frequencies correspond to rough details, whereas the high ones
define the fine details or the edges of the structures. For example, an MTF with a value of 0.5
for a determined frequency means that the inherent modulation (contrast) of the object will
diminish at 50% given the limitations of the image system (ICRU, 2009) (Fig. 7).
In practice, the MTF is determined through the Fourier transform of the line spread function
(LSF), which is obtained through the differentiation of the edge response (ESF).
Spatial resolution is expressed in terms of spatial frequency, which in turn is associated with
a MTF value.
www.intechopen.com
Image Quality Requirements for Digital Mammography in Breast Cancer Screening
123
Fig. 7. Modulation transfer function of mammography systems (ICRU, 2009).
4.2 Noise
The main component of noise in radiographic images is the quantum noise, which is associated with the statistical fluctuations in the photons’ fluence on the detector and with the random variations in the absorption. The simplest way to define the noise is through a measurement of the standard deviation (sd) of the number of photons absorbed (N) in a region of the detector. This figure complies with Poisson statistics, and therefore sd = N0.5
(i.e., the sd is related to the square root of the Kerma) (Chevalier, 2010).
The structural noise in the digital detectors emerges mainly from the lack of homogeneity in the sensitivity of the elementary detectors (i.e., from the fixed spatial variation of the image detecting structure), which means that it is also proportional to the dose. Moreover, this noise causes the appearance of a structured background in the image, which is usually removed through the flat field techniques. These techniques include the creation of a corrective mask from a direct and uniform image of the X-ray beams (Chevalier, 2010).
In digital systems, what has to be added to these two types of noise is the electronic one, which emerges from the electronic readout outside the pixels and in the amplification of the signal and which does not depend on the dose. The electronic noise owes essentially to the dark noise in the detectors and decreases if the temperature of the surroundings is lowered or reduced. Therefore, the digital equipment has to operate in temperatures at intervals between 20-30 ºC.
4.3 Uniformity
The initial operation which usually occurs is a "flat-field", a correction of the uniformity of gain. The non-uniformity of the sensitivity of the detector is corrected through a gain map and is also used to correct all the images acquired. Moreover, if an element of a single (pixel) detector is defective its signal can be replaced with a reasonable combination of adjacent detector signals. This is acceptable if the defective detectors are isolated and only few of them are faulty. Detectors of the CR type presents a lack of uniformity due to the heal effect that is very depending on the X-ray unit.
www.intechopen.com
Imaging of the Breast – Technical Aspects and Clinical Implication
124
4.4 Artefacts
Artefacts are undesirable characteristics which are not related to the mammary anatomic structures of a radiographic image. They can hinder the image by hiding or simulate a lesion on detection.
Artefacts can be caused by the source of X-rays, the beam filter, the compression device,
breast support, grid, and flaws in processing, amongst others. In digital mammography,
besides the sources just cited, the non-uniformity in the response of the elemental detectors
may also generate artefacts, owing to the results of an inadequate flat-fielding. Another
drawback in the digital system is the presence of reminiscent images (ghost images),
resulting from previous exposures (ICRU, 2009). The latest appears more often with CR
systems or aSe based flat panel detectors.
5. Dosimetry in mammography
One of the pillars underpinning the analysis of the risks-benefits of mammography is the
accurate knowledge of the imparted doses, since it is well-established that there is an
association between breast dose and the increased incidence of breast cancer. Assessments
of breast doses are particularly important in breast screening programmes in which large
groups of asymptomatic women undergo mammographic examinations. As in other
radiological examinations, dose values are indicative of the diagnostic adequacy of the
mammography technique selected in clinical practice. In addition, knowledge of dose values
is essential for optimisation strategies developed to minimise doses while maintaining the
necessary image quality.
The X-ray spectrum in mammography is of low energy and the depth dose within the breast
decreases rapidly. Due to this, it is important to use a dosimetric quantity which gives a
measure of the dose to the whole organ. Glandular tissue is the most vulnerable in the breast
as compared to adipose, skin and areolar (nipple) tissues (Hammerstein et al., 1979). At
present, it is widely accepted that mean glandular dose (DG) is the most appropriate
dosimetric quantity to predict the risk of radiation carcinogenesis. Therefore, this quantity
has been recommended by several national and international organisations (NCRP, 1986;
IPSM, 1989; IAEA, 2007) and it is the quantity used in many national protocols for
that affect DG are the X-ray beam quality and breast thickness and composition. These two
latter parameters have a larger variability than the former, varying both within and between
populations, and the latter with women’s age as well. Even when the average glandularity
would be the same, its distribution is unpredictable and changes from breast to breast.
Direct measurements of DG are not possible for individual breasts and, therefore, DG is
derived from the entrance surface dose (or a related quantity) using adequate conversion
factors (ICRU, 2005; NCRP, 2004). These factors were initially measured (Hamerstein, 1979;
Stanton, 1984) and further calculated by means of Monte Carlo techniques (Rosenstein, 1980;
Dance, 1990, 2000, 2009; Wu et al, 1991, 1994; Klein et al., 1997; Boone et al., 2002). This latter
approach allows for the possibility of estimating conversion factors for a wide range of
input spectra and breast features. Differences among the conversion factors (cG) obtained by
several authors mainly arise from differences in breast model geometry, mammographic X-
www.intechopen.com
Image Quality Requirements for Digital Mammography in Breast Cancer Screening
125
ray spectral data, photon interaction cross-sections and Monte Carlo codes. Other important
factors affecting the calculations are the mammography system’s characteristics and the
imaging system components and geometry. The differences in cG values quoted by different
authors were as high as 15-16% (Klein, 1997; ICRU, 2005; Dance 2000).
The breast model most commonly adopted (Fig. 8) has a central region consisting of a homogeneous mixture of adipose and glandular tissue surrounded by a layer at all sides, except for the one corresponding to the chest wall representing the skin. It is assumed that the breast is firmly compressed by a polycarbonate compression paddle. The percentage of breast glandularity is defined as the fraction by weight of glandular tissue at the central region (without skin). Most authors employ the elemental tissue composition published by Hammerstein et al. (1979).
Initially, it was assumed that a 50:50 mixture of adipose and glandular tissues was representative of a typical breast (Hammerstein, 1979). On this basis, phantoms of several thicknesses were constructed assuming this “standard” composition with the aim of facilitating DG estimates in the practice. This assumption implied that the fraction of glandular tissue was independent of compressed breast thickness. On the basis of this data, the standard “phantom” was defined as a 4.5 cm thickness of PMMA, representing the “standard breast” (4 cm thick and 50%/50% glandular/adipose tissue) (IPEM, 1989; CEC, 1996). Data indicating that the composition of the average compressed breast deviates from the 50:50 composition has been published (Geise, 1996; Klein et al., 1997; Young et al., 1998; Chevalier, 1998; Beckett, 2000; Zoetelief et al., 2006). In addition, it was found that breast glandularity decreases when the compressed breast thickness increases. In some of these works it is also determined that the equivalent thickness of PMMA gives the same incident air kerma at its upper surface as for that of a breast of a specified thickness and composition (Geise, 1996; Dance et al., 2000, 2009; Kruger, 2001; Argo, 2004).
Fig. 8. Breast model geometry. The rectangular section represents a vertical cross-section through the breast coplanar with the focal spot of the X-ray tube. The D-shape section represents the breast in craniocaudal projection. The shaded and outer regions represent, respectively, the breast parenchyma and the skin (0.5 cm of adipose tissue). In the work of Dance (2009) it is used as a voxelised breast model.
5.1 Practical issues
DG is generally calculated through the following relationship (ICRU, 2005):
www.intechopen.com
Imaging of the Breast – Technical Aspects and Clinical Implication
126
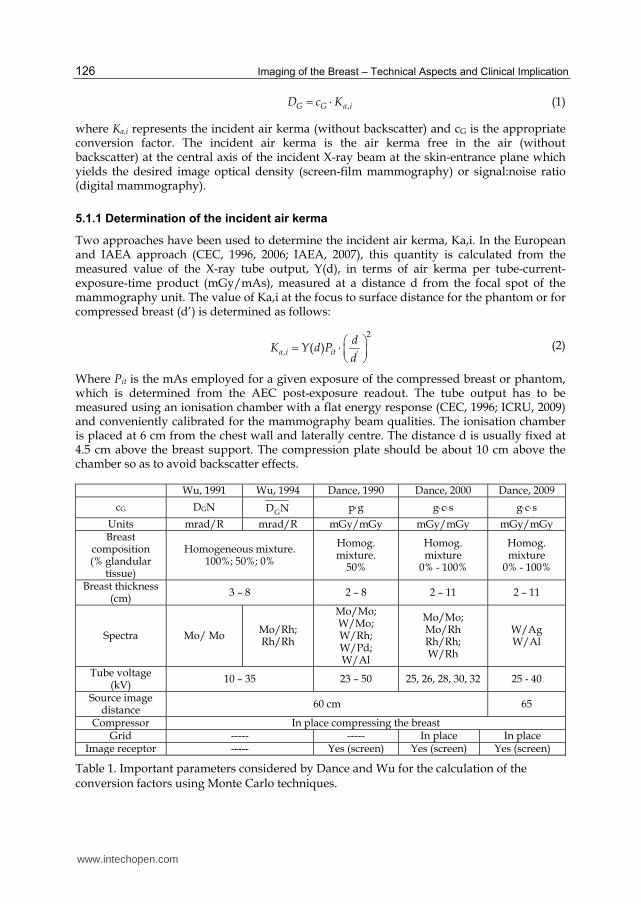
,G G a iD c K
(1)
where Ka,i represents the incident air kerma (without backscatter) and cG is the appropriate conversion factor. The incident air kerma is the air kerma free in the air (without backscatter) at the central axis of the incident X-ray beam at the skin-entrance plane which yields the desired image optical density (screen-film mammography) or signal:noise ratio (digital mammography).
5.1.1 Determination of the incident air kerma
Two approaches have been used to determine the incident air kerma, Ka,i. In the European and IAEA approach (CEC, 1996, 2006; IAEA, 2007), this quantity is calculated from the measured value of the X-ray tube output, Y(d), in terms of air kerma per tube-current-exposure-time product (mGy/mAs), measured at a distance d from the focal spot of the mammography unit. The value of Ka,i at the focus to surface distance for the phantom or for compressed breast (d’) is determined as follows:
2
, '( )a i it
dK Y d P
d
(2)
Where Pit is the mAs employed for a given exposure of the compressed breast or phantom, which is determined from the AEC post-exposure readout. The tube output has to be measured using an ionisation chamber with a flat energy response (CEC, 1996; ICRU, 2009) and conveniently calibrated for the mammography beam qualities. The ionisation chamber is placed at 6 cm from the chest wall and laterally centre. The distance d is usually fixed at 4.5 cm above the breast support. The compression plate should be about 10 cm above the chamber so as to avoid backscatter effects.
Table 1. Important parameters considered by Dance and Wu for the calculation of the conversion factors using Monte Carlo techniques.
www.intechopen.com
Image Quality Requirements for Digital Mammography in Breast Cancer Screening
127
In the ACR approach (ACR, 1999), Ka,i is directly measured by placing the ionisation chamber adjacent to the ACR phantom at the level of the entrance surface of the phantom. The chamber is positioned at 4 cm from the chest wall. The compressor plate is located above the phantom and the chamber. The exposure conditions are those used clinically for a 4 cm compressed breast.
Ka,i can be also measured using TLD dosimeters (ACR, 1999; CEC, 1996) placed on the entrance surface of the phantom or breast. The TLDs have to be calibrated in terms of air kerma free-in-air against a suitable ionisation chamber and dosimeter. Hence, the entrance dose measured by TLDs placed on the phantom or patient surface includes backscatter. Measurements performed with TLD dosimeters are influenced by many factors, including the performance of the instrument and those related to procedure of dosimeter preparation and handling. In addition, TLDs’ response dependence of scatter gives rise to underestimations of Ka,i in a magnitude that is dependent on the dosimeter's thickness and the relative amount of backscatter radiation (Dance at al., 1999). Another factor that limits the use of TLD dosimeters is related with its visibility in the breast image. It is recommended that they be positioned on the upper inner quadrant of the breast so as to minimise interference with breast tissues.
5.1.1.1 Mean glandular dose (DG) estimates
The ACR protocol adopted the cG values calculated by Wu (1991, 1994; Sobol, 1997). The
European and the IAEA protocols (CEC, 1996, 2006; IAEA, 2007) recommended the use of
the cG values from Dance (1990; 2000; 2009). Fig. 8 and Table 1 summarise the details used
by both authors to perform the Monte Carlo calculations. The cG values depend on the beam
quality (half value layer (HVL)), breast thickness and breast composition. It is important to
measure HLV and compressed breast thickness with accuracy in order to minimise the
errors in the DG estimate. Narrow beam geometry is recommended for HVL measurements
with the aim of reducing the influence of scattered radiation (IPEM, 2005; IAEA, 2007). In
addition, Al filters of high purity (>99%) should be used and the compressor plate should be
in place during the measurements. Errors in the compressed breast thickness measurement
are due to the compressor plate which can bend and deform considerably. Several authors
have proposed methods to gain accuracy in these measurements (Burch, A, 1995; Maria S.
Nogueira., 2011).
DG values derived from phantom measurements are useful for 1) simplifying the follow-up
of the mammography system’s performance, 2) comparing with references or limiting
values allowing the checking of the compliance of the equipment with recommendations, 3)
checking if the exposure factors selected by the mammography system are suitable in terms
of radiation dose, 4) for developing optimisation strategies.
The evaluation of the mean glandular dose with large patient’s samples enables a more
direct evaluation of the risk of radiation induced cancer. However, it is difficult to know the
composition of individual breasts needed to determine the conversion factors. A fairly
widespread method is to determine the composition of the breast from its image. To avoid
bias or subjective criteria the BI-RADS criteria are used (ACR, 1998) so that the individual
breasts are classified by the radiologist into one of four possible groups according to its
ascribed glandularity (0%, 25%, 75% and 100%).
www.intechopen.com
Imaging of the Breast – Technical Aspects and Clinical Implication
128
5.1.1.2 The European and the IAEA approach: measurements of phantoms
Dose assessment in mammography initially (CEC, 1996) relied on the estimation of DG for a 4.5 cm thick standard breast model with 50% glandularity in a central region by using a 4.0 cm thickness PMMA phantom. DG was estimated using the cG from Dance (1990) given in Table 1. It was recommended that patient dosimetry be performed by recording the exposure data and compressed breast thickness of at least 50 patients. Ka,i and DG were calculated for each patient using the cG factors tabulated by Dance (1990) for the corresponding HVL value and compressed breast thickness. The main problem associated with this methodology was firstly due to the fact that the average compressed breast thickness of a typical population is 5.5 cm. Secondly, several works showed a breast composition for the standard breast different to that of 50% glandularity. In addition, modern X-ray systems select different spectra as a function of both breast thickness and composition. In order to take into account all these factors, Dance et al. (2000) modify the definition of cG according to the expression given in Table 1. In this expression, the g-factor (unchanged from that initially used) corresponds to a glandularity of 50% and is tabulated for different breast thicknesses and HVL. The c-factor corrects for any difference in breast composition from 50% glandularity and is tabulated for different HVL, breast thicknesses and breast glandularities. The factor s makes a correction for the use of an X-ray spectrum other than that for a Mo/Mo target–filter combination. The value for s depends only on the anode/filter combination, except in the case of W/Al which depends also on the kVp (Dance, 2009).
The equivalence between a range of PMMA thickness (2 - 8 cm) and compressed breast thickness has also been determined (Dance, 2000). According to the resulting equivalences, Ka,i delivered for a 4.5 cm thick PMMA phantom is equivalent to that for a 5.3 cm thick breast with 29% glandularity. This result was deduced from a sample of women in the age range 50-64 (Young, 1998; Becket, 2000). The mean glandular dose for different PMMA thicknesses is estimated using the relationship:
DG, PT = K PT gCBT cCBTs (3)
K PT is the air kerma at the entrance surface of a phantom of PT thickness and the gCBT and cCBT factors are the values tabulated for the equivalent compressed breast thickness.
The DG limits proposed by the European (CEC, 2006) and IAEA (2011) protocols are given in Table 2 for a range of PMMA thickness. These values have been derived from screen/film mammography, since the cost associated with the transition to digital mammography should not imply an increase in the doses.
Table 2. Acceptable and achievable limits for mean glandular dose (DG).
www.intechopen.com
Image Quality Requirements for Digital Mammography in Breast Cancer Screening
129
5.1.1.3 Measurements on patients
The method followed for patient dosimetry relies on the results obtained in two studies (Young et al 1998; Beckett et al., 2000) that have each independently estimated the breast composition of women attending for screening. As a result, the average breast composition as a function of breast thickness was established for two age groups. One age group (aged 50 to 64) corresponds to the ages of women currently invited for breast screening in most of the programmes. The second age group corresponds to women aged between 40 and 49. DG is calculated for each breast thickness by using the c-factors for the corresponding average composition of each age group.
The impact of the new factors c and s on DG values obtained through the patients sample was analysed by recalculating the dose values obtained in previous studies (NHSBSP, 2003). It was found that, for the largest breasts (thickest on compression), the use of the c-factor increases doses by approximately 30%. For the smallest breasts, the dose estimates are decreased by 11%. The overall effect is to increase the average doses by about 11% for craniocaudal views and by about 14% for mediolateral oblique views.
6. Acknowledgments
This work took place within the framework of the Centre of Development of Nuclear Technology in Brazil through the project “Avaliação da Qualidade e Requisitos de Proteção Radiológica em Mamografia Digital e Monitoramento Dos Serviços de Mamografia de Minas Gerais - apoiado pela FAPEMIG e PCI-CNPq.”
7. References
ACR. American College of Radiology. (1998). Illustrated Breast Imaging Reporting and Data System (BI-RADS®), 3rd ed. American College of Radiology, Reston, Virginia, USA
ACR. American College of Radiology. (1999). Mammography Quality Control Manual, American College of Radiology, Reston, Virginia, USA
Alvarenga, FL and Nogueira MS. (2008). Análise de Parâmetros e Controle da Qualidade de Sistemas de Radiologia Computadorizada para Mamografia. Centro de Desenvolvimento da Tecnologia Nuclear, Belo Horizonte, 2008. Available from http://www.dominiopublico.gov.br/pesquisa/DetalheObraForm.do?select_action=&co_obra=125026
American Association of Physicists in Medicine. (2006). Acceptance testing and quality control of photostimulable storage phosphor imaging systems. AAPM Report n° 93, October 2006. ISSN:0271-7344
Argo WP, Hintenlang K, and Hintenlang DE. (2004). A tissue-equivalent phantom series for mammography dosimetry. JACMP. vol 5, N°4: 112-119. ISSN : 1526-9914
Beckers, S.W. et al. (2003). Results of technical quality control in the Dutch breast cancer screening programme(2001-2002). (Nijmegen, The Netherlands). Proc. EFOMP Congress.
Beckett J and Kotre C J. (2000). Dosimetric implications of age related glandular changes in screening mammography. Phys Med Biol, 45 (2000): 801–813. ISSN 1361-6560
Boone, JM. (2002). Normalized glandular dose (DgN) coefficients for arbitrary x-ray spectra in mammography: Computer-fit values of Monte Carlo derived data. Med. Phys. 29(2002):869–875. ISSN: 0094-2405
www.intechopen.com
Imaging of the Breast – Technical Aspects and Clinical Implication
130
Brazil Ministry of Health. Report nb. 453 of June 1, (june 1998). Guidelines for Radiological Protection in Medical and Odontological Radiodiagnostic. Ministry of Health, Official Press, Brasília, Jun 2, 1998.
Burch A, and Law J. (1995). A method for estimating compressed breast thickness during mammography. Br J Radiol. 68: 394–399. ISSN: 1748-880X
CEC. European Commission. (1996). European Protocol on Dosimetry in Mammography, Report EUR 16263. European Commission. Office for Official Publications of the European Communities, Luxembourg
CEC. European Commission. European Guidelines for Quality Assurance in Mammography Screening. (2006). Report EUR 14821 4th ed. European Commission. Office for Official Publications of the European Communities, Luxembourg
Chevalier M, Morán P, Pombar M, Lobato R, Vañó E. (1998). Breast Dose Measurements on a Large Group of Patients: Results from a Four Years Period. Radiat Prot Dosimetry. (1998) 80 (1-3): 187 – 190. ISSN 1742-3406
Chevalier and Torres R. (2010). Mamográfica digital. Rev Fis Med 11(1):11-26 (SEFM, Madrid) Dance DR. (1990). Monte-Carlo calculation of conversion factors for the estimation of mean
glandular breast dose. Phys Med Biol. 35: 1211–1220. ISSN 1361-6560 Dance DR, Skinner CL, Young KC, Beckett J R and Kotre CJ. (2000). Additional factors for the
estimation of mean glandular breast dose using the UK mammography dosimetry protocol. Phys Med Biol. 45: 3225–3240. ISSN 1361-6560
Dance DR., Thilander Klang A, Sandborg M, et al. (2000). Influence of anode/filter material and tube potential on contrast, signal-to-noise ratio and average absorbed dose in mammography: a Montecarlo study. Br J Radiol 73: 1056-1067. ISSN: 1748-880X
Dantas MVA and Nogueira MS. (2010). Dose glandular e controle de qualidade da imagem em serviços de mamografia com sistema de radiografia computadorizada. Comissão Nacional de Energia Nuclear, Centro de Desenvolvimento Da Tecnologia Nuclear, Programa de Pós-Graduação em Ciência e Tecnologia das Radiações Minerais e Materiais, Belo Horizonte, Brasil, 2010. (Available from, http://www.dominiopublico.gov.br/pesquisa/DetalheObraForm.do?select_action=&co_obra=181971)
Duffy SW, Tabar L, Chen THH, Smith RA, Holmberg L, Jonsson H, Lenner P, Nyström L, and Törnberg S. 2006. Reduction in breast cancer mortality from organized service screening with mammography:1.Further consideration with extended data. Cancer Epidemiol. Biomarkers Prev 15: 45–51
Geise RA, and Palchevsky A. (1996). Composition of mammographic phantom materials. Radiology. 198: 347–350. ISSN 1527-1315
Riabi HA, Mehnati P, Mesbahi A. (2010). Evaluation of mean glandular dose in a full-field digital mammography unit in Tabriz, Iran. Radiat Prot Dosimetry 142, 22-227. ISSN 1742-3406
Hammerstein GR, Miller DW, White DR, Masterson ME,Woodard HQ and Laughlin JS. (1979). Absorbed radiation dose in mammography. Radiology. 130, 485–491. ISSN 1527-1315
Hellquist BN, Duffy SW, Abdsaleh S, Björneld L, Bordás P, Tabár L, Viták B, Zackrisson S, Nyström L, and Jonsson H, (2010) Effectiveness of Population-Based Service Screening with Mammography for Women Ages 40 to 49 Years. Evaluation of the Swedish Mammography Screening in Young Women (SCRY) Cohort. Cancer 117: 714–722. doi: 10.1002/cncr. 25650
Hendrick RE, Pisano ED, Averbukh A, Moran C, Berns EA, Yaffe MJ, Herman B, Acharyya S, and Gatsonis C. 2010. Comparison of Acquisition Parameters and Breast Dose in Digital Mammography and Screen-Film Mammography in the American College of
www.intechopen.com
Image Quality Requirements for Digital Mammography in Breast Cancer Screening
131
Radiology Imaging Network Digital Mammographic Imaging Screening Trial. Am. J. Roentgenol 194:362–369. ISSN: 1546-3141
IAEA. International Atomic Energy Agency. (2007). Dosimetry in Diagnostic Radiology: An International Code of Practice, Technical Reports Series No. 457. International Atomic Energy Agency, Vienna ; Austria
IAEA. International Atomic Energy Agency. (2011). Quality Assurance Programme For Digital Mammography. IAEA Human Health Series No 17. International Atomic Energy Agency, (Vienna, Austria). ISBN 978–92–0–111410–5
ICRU. International Commission on Radiation Units and Measurements. (2005). Patient Dosimetry for X Rays Used in Medical Imaging, ICRU Report 74. J. ICRU. 5(2), University Press, Oxford, UK
ICRU. International Commission on Radiation Units and Measurements. (2009). Mammography– Assessment of Image Quality. ICRU Report 82. J. ICRU 9(2), University Press, Oxford, UK
IPEM. Institute of Physical and Engineering in Medicine. (1989). The commissioning and routine testing of mammographic x-ray systems. Report 59 1st ed. IPEM, ISBN : 1 903613 21 3, York, UK
Lewin JM, D’Orsi CJ, Hendrick RE. 2004. Digital mammography. Radiol Clin N Am. 42:871 – 884. ISSN 1557-8275
Karellas A and Giger M L. 2004. Advances in Breast Imaging: Physics, Technology, and Clinical Applications. The Radiological Society of North America (RSNA 2004), Presented at the 90th Scientific Assembly and Annual Meeting of the Radiological Society of North America, November 28–December 3, 2004, Chicago, USA. ISSN 0271-5333
Klein R, Aichinger H, Dierker J, Jansen J T M, Joite-Barfuss S, Säbel M, Schulz-Wendtland R and Zoetelief J. (1997). Determination of average glandular dose with modern mammography units for two large groups of patients. Phys Med Biol. 42:651–671. ISSN 1361-6560
Kruger R L and Schueler B A. (2001). A survey of clinical factors and patient dose in mammography. Med. Phys. 28:1449-1454. ISSN 0094-2405
Leitz, W and Jönsson H (2001). Patientdoser från röntgenundersökningar i Sverige. SSI Rapport 2001:1. Swedish Radiation Protection Authority. (Sweden)
Maria S. Nogueira; Luciana de J. S. Pinheiro; Danille S. Gomes, William José de Castro, Katiane Costa; Marcio A. de Oliveira; Margarita Chevalier del Rio (2011). Development of methodology for estimating thickness of compressed breast in mammography. International Conference on Medical Physics ICMP, April 17-20, 2011. Porto Alegre, Brazil
Muller S. (1997). Full-field digital mammography designed as a complete system. European Journal of Radiology 31: 25–34. ISSN: 0720-048X
NCRP. National Council on Radiation Protection and Measurements. (1986). Mammography – A User’s Guide. NCRP Report 85. National Council on Radiation Protection and Measurements, Bethesda, Maryland, USA. ISBN-10: 0913392790
NCRP. National Council on Radiation Protection and Measurments. (2004). A Guide to Mammography and Other Breast Imaging Procedures, NCRP Report 149. National Council on Radiation Protection and Measurements. Bethesda, Maryland, USA. ISBN 0-929600-84-3
NG, KH, Jamal, N, Dewerd, L. (2006). Global quality control perspective for the physical on technical aspects of screen-film mammography-image quality and radiation dose. Radiat Prot Dosimetry 121(4): 445-451. ISSN 1742-3406
www.intechopen.com
Imaging of the Breast – Technical Aspects and Clinical Implication
132
NHSBSP. National Health Service Breast Screening Programmes. (2003). Review of Radiation Risk in Breast Screening. NHSBSP Publication No 54. NHS Cancer Screening Programmes. ISBN 1 871997 99 2. Sheffield, UK
NHSBSP. National Health Service Breast Screening Programmes. (2009). Commissioning and Routine Testing of Full Field Digital Mammography Systems. NHSBSP Equipment Report 0604. (London, UK).
Nishikawa R M. (2004). Advances in Breast Imaging: Physics, Technology, and Clinical Applications. The Radiological Society of North America (RSNA 2004), Presented at the 90th Scientific Assembly and Annual Meeting of the Radiological Society of North America, November 28–December 3, 2004, Chicago, USA. ISSN 0271-5333.
Pedersen, K Nordanger J (2000). Mammografiscreening. Teknisk kvalitetskontroll – resultater og evaluering etter fire års prøveprosjekt. StrålevernRapport 2000:2. Østerås: Norwegian Radiation Protection Authority (Norway).
Peixoto, J. E. (2009). Controle de Qualidade em Mamografia. In Aguillar VLN, Bauab SP, Maranhão NM. Mama: diagnóstico por Imagem. Revinter, 2009. p. 83-106. ISBN-10: 8537202444. Rio de Janeiro, Brazil
Pisano ED, Gatsonis C, Hendrick E, Yaffe M, Baum JK, Acharyya S, et al. 2005. Diagnostic Performance of Digital versus Film Mammography for Breast-Cancer Screening, New England Journal of Medicine. 353: 1-11.
Rosenstein M, Andersen LW and Warner GG. (1985). Handbook of Glandular Tissue Doses in Mammography, HHS Publication FDA 85-8239. Center for Devices and Radiological Health, Rockville, Maryland, USA
Rowlands JA. (2002). The physics of computed radiography. Phys Med Biol;47: R123–R166. SEFM. Sociedad Española de Física Médica. (2008). Protocolo de Control de Calidad en
Mamografía Digital. Edicomplet (Madrid, Spain) Sobol WT and Wu X. 1997. Parametrization of mammography normalized average glandular
dose tables. Med Phys 24:547–554. ISSN: 0094-2405 Stanton L, Villafana T, Day JL and Lightfoot DA. (1984). Dosage evaluation in mammography.
Radiology.150: 577–584. ISSN :0033-8419 Vedantham S, Karellas A, Suryanarayanan S, Albagli D, Han S, Tkaczyk EJ, Landberg CE et al.
(2000). Full Breast Digital Mammography with an Amorphous Silicon-based Flat Panel Detector: Physical Characteristics of a Clinical Prototype. Med Phys 27:558-567
Suryanarayanan S, Karellas A and Vedanthama S. (2004). Physical characteristics of a full-field digital mammography system. Nuclear Instruments and Methods in Physics Research A. 533:560–570. ISSN: 01689002
Wu X, Barnes G T, and Tucker D M. (1991). Spectral dependence of glandular tissue dose in screen-film mammography. Radiology 179:143–148. ISSN : 1527-1315
Wu X, Gingold E L, Barnes G T, and Tucker D M. (1994). Normalized average glandular dose in molybdenum target-rhodium filter and rhodium target-rhodium filter mammography. Radiology 193:83–89. ISSN : 1527-1315
Yaffe MJ, Rowlands JA. (1997) X-ray detectors for digital radiography. Phys Med Biol;42:1–39. Young KC, Ramsdale ML and Bignall F. (1998). Review of dosimetric methods for
mammography in the UK breast screening programme. Radiat Prot Dosimetry. 80: 183–6. ISSN : 0144-8420
Young KC, Oduko JM, Bosmans H, Nijs K and Martinez L. (2006). Optimal beam quality selection in digital mammography. Br J Radiol 79: 981-990. ISSN: 1748-880X
Zoetelief J, Veldkamp W J H, Thijssen M A O, and Jansen J T M. (2006). Glandularity and mean glandular dose determined for individual women at four regional breast cancer screening units in the Netherlands. Phys Med Biol. 51:1807–1817. ISSN 1361-6560
www.intechopen.com
Imaging of the Breast - Technical Aspects and Clinical ImplicationEdited by Dr. Laszlo Tabar
ISBN 978-953-51-0284-7Hard cover, 224 pagesPublisher InTechPublished online 16, March, 2012Published in print edition March, 2012
InTech ChinaUnit 405, Office Block, Hotel Equatorial Shanghai No.65, Yan An Road (West), Shanghai, 200040, China
Phone: +86-21-62489820 Fax: +86-21-62489821
Early detection of breast cancer combined with targeted therapy offers the best outcome for breast cancerpatients. This volume deal with a wide range of new technical innovations for improving breast cancerdetection, diagnosis and therapy. There is a special focus on improvements in mammographic image quality,image analysis, magnetic resonance imaging of the breast and molecular imaging. A chapter on targetedtherapy explores the option of less radical postoperative therapy for women with early, screen-detected breastcancers.
How to referenceIn order to correctly reference this scholarly work, feel free to copy and paste the following:
Margarita Chevalier, Fernando Leyton, Maria Nogueira Tavares, Marcio Oliveira, Teogenes A. da Silva andJoão Emilio Peixoto (2012). Image Quality Requirements for Digital Mammography in Breast CancerScreening, Imaging of the Breast - Technical Aspects and Clinical Implication, Dr. Laszlo Tabar (Ed.), ISBN:978-953-51-0284-7, InTech, Available from: http://www.intechopen.com/books/imaging-of-the-breast-technical-aspects-and-clinical-implication/quality-requirements-of-image-in-digital-mammography-for-breast-cancer-screening