In the red and near-infrared ~NIR! wavelength re-gions of the optical spectrum ~650 to 1300 nm!, ab-sorption of light by human tissues is low enough thatameasurable flux of diffusely transmitted or reflectedlight can be collected from volumes centimeters belowthe skin surface. Diffuse light transmission allowsfor the possibility of obtaining spatial reconstructionsof the optical properties of effluent regions within thetissue, known as NIR imaging. Techniques that em-ploy NIR imaging are noninvasive, safe, cost-effectivediagnostic tools in clinical studies. Because NIRphotons travel diffusively between source and detec-tor, they probe a relatively large region between thesource and the detector rather than a straight line, asin the x-ray case.Recent advances in laser technology and in the
theoretical understanding of light propagation in tis-sues have encouraged efforts to explore methods for
The authors are with the Department of Physics, Laboratory forFluorescence Dynamics, University of Illinois at Urbana-Champaign, 1110West Green Street, Urbana, Illinois 61801-3080.Received 8 February 1996; revised manuscript received 5 July
170 APPLIED OPTICS y Vol. 36, No. 1 y 1 January 1997
image reconstruction. As a result, considerableprogress has been made, including the developmentof time-resolved techniques that have been success-fully employed in both the frequency and the timedomains to separate and accurately measure the op-tical absorption and reduced scattering coefficients~ma and m9s, respectively! in macroscopically homoge-neous turbid media.1,2 Also it has been shown thatoptical inhomogeneities can be detected from 1 to 5cm below the tissue surface by the use of time-resolved techniques in a reflection geometry.3Many researchers have proposed to apply time-
resolved measurement techniques and a better theo-retical understanding of photon propagation inhomogeneous media to heterogeneous systems.New models have been developed for iteratively solv-ing the inverse problem both experimentally4 andthrough numerical modeling.5–11 Most of the nu-merical inversion techniques are based on the diffu-sion approximation of the Boltzmann transportequation, although some new methods attempt toapply the transport equation directly. These algo-rithms can in principle detect, locate, and character-ize optical inhomogeneities quantitatively. Althoughthese are valuable long-range goals for NIR imaging,these computer-reconstruction methods currentlyhaveweak points in that there is no guarantee that thealgorithm will converge to a unique solution, and so-
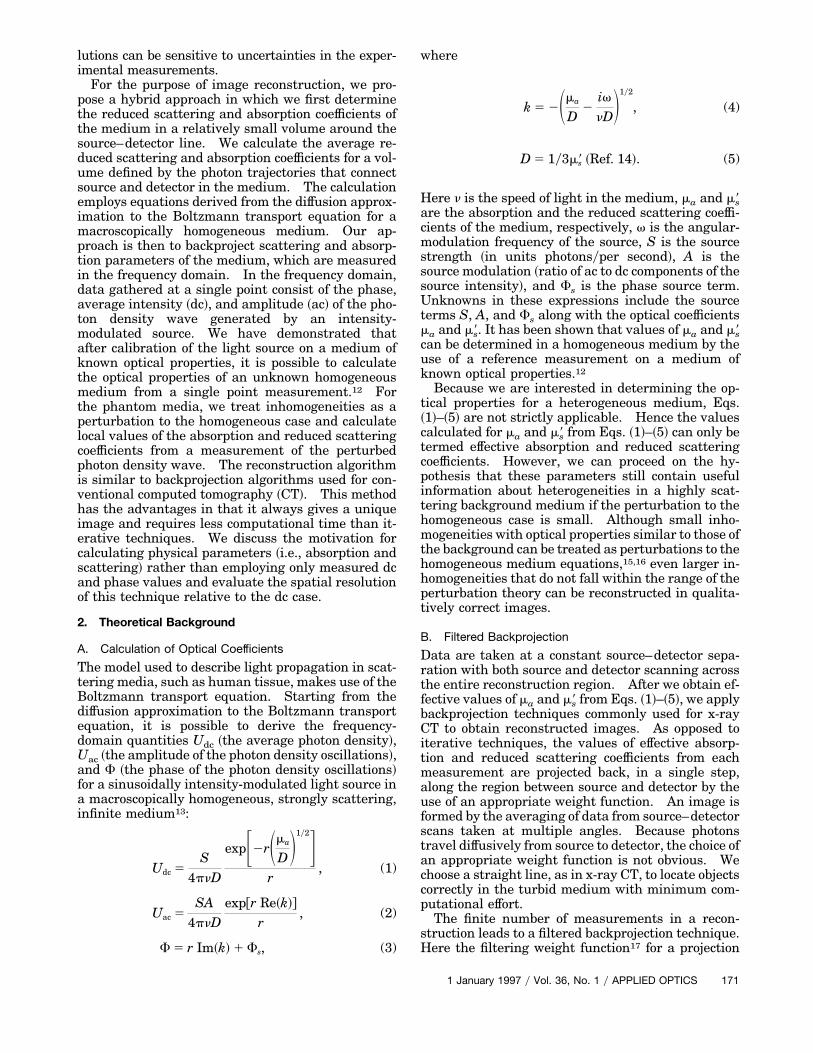
lutions can be sensitive to uncertainties in the exper-imental measurements.For the purpose of image reconstruction, we pro-
pose a hybrid approach in which we first determinethe reduced scattering and absorption coefficients ofthe medium in a relatively small volume around thesource–detector line. We calculate the average re-duced scattering and absorption coefficients for a vol-ume defined by the photon trajectories that connectsource and detector in the medium. The calculationemploys equations derived from the diffusion approx-imation to the Boltzmann transport equation for amacroscopically homogeneous medium. Our ap-proach is then to backproject scattering and absorp-tion parameters of the medium, which are measuredin the frequency domain. In the frequency domain,data gathered at a single point consist of the phase,average intensity ~dc!, and amplitude ~ac! of the pho-ton density wave generated by an intensity-modulated source. We have demonstrated thatafter calibration of the light source on a medium ofknown optical properties, it is possible to calculatethe optical properties of an unknown homogeneousmedium from a single point measurement.12 Forthe phantom media, we treat inhomogeneities as aperturbation to the homogeneous case and calculatelocal values of the absorption and reduced scatteringcoefficients from a measurement of the perturbedphoton density wave. The reconstruction algorithmis similar to backprojection algorithms used for con-ventional computed tomography ~CT!. This methodhas the advantages in that it always gives a uniqueimage and requires less computational time than it-erative techniques. We discuss the motivation forcalculating physical parameters ~i.e., absorption andscattering! rather than employing only measured dcand phase values and evaluate the spatial resolutionof this technique relative to the dc case.
2. Theoretical Background
A. Calculation of Optical Coefficients
The model used to describe light propagation in scat-tering media, such as human tissue, makes use of theBoltzmann transport equation. Starting from thediffusion approximation to the Boltzmann transportequation, it is possible to derive the frequency-domain quantities Udc ~the average photon density!,Uac ~the amplitude of the photon density oscillations!,and F ~the phase of the photon density oscillations!for a sinusoidally intensity-modulated light source ina macroscopically homogeneous, strongly scattering,infinite medium13:
Udc 5S
4pnD
expF2rSma
DD1y2Gr
, (1)
Uac 5SA4pnD
exp@r Re~k!#
r, (2)
F 5 r Im~k! 1 Fs, (3)
where
k 5 2Sma
D2ivnDD
1y2
, (4)
D 5 1y3m9s ~Ref. 14!. (5)
Here n is the speed of light in the medium, ma and m9sare the absorption and the reduced scattering coeffi-cients of the medium, respectively, v is the angular-modulation frequency of the source, S is the sourcestrength ~in units photonsyper second!, A is thesource modulation ~ratio of ac to dc components of thesource intensity!, and Fs is the phase source term.Unknowns in these expressions include the sourceterms S, A, and Fs along with the optical coefficientsma and m9s. It has been shown that values of ma and m9scan be determined in a homogeneous medium by theuse of a reference measurement on a medium ofknown optical properties.12Because we are interested in determining the op-
tical properties for a heterogeneous medium, Eqs.~1!–~5! are not strictly applicable. Hence the valuescalculated for ma and m9s from Eqs. ~1!–~5! can only betermed effective absorption and reduced scatteringcoefficients. However, we can proceed on the hy-pothesis that these parameters still contain usefulinformation about heterogeneities in a highly scat-tering background medium if the perturbation to thehomogeneous case is small. Although small inho-mogeneities with optical properties similar to those ofthe background can be treated as perturbations to thehomogeneous medium equations,15,16 even larger in-homogeneities that do not fall within the range of theperturbation theory can be reconstructed in qualita-tively correct images.
B. Filtered Backprojection
Data are taken at a constant source–detector sepa-ration with both source and detector scanning acrossthe entire reconstruction region. After we obtain ef-fective values of ma and m9s from Eqs. ~1!–~5!, we applybackprojection techniques commonly used for x-rayCT to obtain reconstructed images. As opposed toiterative techniques, the values of effective absorp-tion and reduced scattering coefficients from eachmeasurement are projected back, in a single step,along the region between source and detector by theuse of an appropriate weight function. An image isformed by the averaging of data from source–detectorscans taken at multiple angles. Because photonstravel diffusively from source to detector, the choice ofan appropriate weight function is not obvious. Wechoose a straight line, as in x-ray CT, to locate objectscorrectly in the turbid medium with minimum com-putational effort.The finite number of measurements in a recon-
struction leads to a filtered backprojection technique.Here the filtering weight function17 for a projection
1 January 1997 y Vol. 36, No. 1 y APPLIED OPTICS 171
taken at angle u is defined as
h~t! 512d
sin pp
214d 1sin
p2
p2
22
, (6)
where p 5 ~pt!yd and t 5 x cos u 1 y sin u. Theshape of the weight function h~t! depends on only thesampling interval d used to acquire the data in eachprojection. We note that the FWHM of h~t! in ourcase is roughly 10 times smaller than the width of thevolume sampled by photons traveling from source todetector. This weight function is convoluted withthe measured values in each projection to derive con-tinuous images from discrete measurements in theimage plane ~see Fig. 1!:
muf ~t! 5 *
2`
`
mum~t9!h~t 2 t9!dt9. (7)
Here mum~t! stands for the measured data for a pro-
jection at angle u, and muf ~t! is that projection filtered
by the function h~t!. Finally, the contributions fromprojections at each angle are added together to givethe reconstructed image with spatial coordinates ~x,y!:
m*~x, y! 5 *0
p
muf ~x cos u 1 y sin u!du. (8)
The backprojection techniques used here should bedifferentiated from the methods used by Barbour etal.18 Barbour et al.’s method employs perturbationtheory ~based on the assumption of small perturba-tions to an initial homogeneous map of optical coef-ficients! to solve the forward problem, therebycreating a model system that is iteratively modifiedin order to minimize the differences between simu-lated data and experimental data. Our backprojec-tion scheme makes no attempt to generate a model
Fig. 1. X-ray weight function is filtered to account for the size ofthe sampling period d. Filtered values are then projected backalong the source–detector ray for a projection at angle u. Afterthis step the projections at all angles u are summed.
172 APPLIED OPTICS y Vol. 36, No. 1 y 1 January 1997
system by solving the forward problem. Instead,with the purpose of developing a fast imaging tool, weemploy the Radon transform to directly obtain a qual-itative, calibrated ~see Fig. 4! reconstruction of theregion of interest.
3. Methods
The experimental measurements were conducted in aquasi-infinite geometry with a frequency-domainspectrometer19 and an XYZ positioning scanner ~seeFig. 2!. Briefly, a 120-MHz radio frequency signal isamplified and sent to a 50-mW laser diode coupled toa 1-mm fiber-optic conduit to channel the NIR lightinto the turbid medium. The coupling efficiencywith the laser diode is 20%, giving an output powerof 10 mW. A small fraction of the output lightis sent to a reference photomultiplier tube ~R928Hamamatsu! to correct for drift or intensity fluctua-tions in the source. Detected light is collected by a0.3-cm-diameter fiber-optic bundle and processedwith frequency-domain methods19 ~cross-correlationfrequency 1 kHz! to measure the dc intensity, ac am-plitude, and phase of the photon density wave. Thisprocess is repeated as the source and detector arescanned across the measurement area. Each scantakes place inside a large glass container of Intralipidfat emulsion ~Liposin III from Abbott Laboratories,
Fig. 2. Block diagram of the frequency-domain instrumentation.A 120-MHz radio frequency signal generated by synthesizer S2 isamplified by amplifier A2 and sent to the 793-nm laser diode,producing 50 mW of output light that is then coupled with a 20%efficiency into a fiber-optic conduit, giving an output power in themedium of 10 mW. A small fraction of the light is sent to areference photomultiplier tube ~PMT! to correct for source inten-sity fluctuations. The output light produces a photon densitywave that is perturbed by the objects. The multiply scatteredlight is collected by a fiber-optic bundle that is connected to asample PMT. A cross-correlation electronics system processesthe PMT signal by using a 1-KHz signal generated by synthesizerS1 and amplified by A1. Themeasurement is repeated 41 times asthe source and detector are scanned across the area of interest inthe direction of the arrows. After scan #1 the scanning directionis rotated 30° relative to its original position and the scan is re-peated. The data for each slice consist of seven projections at 30°increments from 0° to 180°.
Table 1. Size and Optical Properties of Background Medium and Objects
Object Type SizeNumber ofObjects ma ~cm21! m9s ~cm21!
Background medium ~Intralipid 1 India ink! 16-L total volume 0.079 6 0.005 7.9 6 0.1Cylindrical object A2 ~hot melt glue! 1.5-cm diameter 1 0.045 6 0.003 7.5 6 0.5
Chicago, Ill.! mixed with black India ink. The vol-ume of the container is 16 L. The concentrations ofIntralipid and India ink are adjusted to give opticalcoefficients ma0 5 0.079 cm21, m9s0 5 7.9 cm21 ~lsource5 793 nm! as measured by a multidistance protocol.2These values of ma0 and m9s0 match typical values ofsoft tissue in the NIR.To introduce inhomogeneities with optical proper-
ties different from those of the background medium,we cast six cylindrical objects ~10 cm long, four witha diameter of 1.0 cm, two with a diameter of 1.5 cm!from hot-melt glue ~Arrow Fastener Co., SaddleBrook, N.J.! mixed with varying amounts of Indiaink. The optical properties of each object were mea-sured from a large block of the same material by theuse of a semi-infinite measurement protocol.20 Op-tical properties of the objects and of the backgroundmedium are shown in Table 1.The reduced scattering coefficients of all six objects
match those of the background medium. Three ob-jects are less absorbing than the background ~and areidentified as A2!, whereas three are more absorbing~and are identified as A1!. Single cylinders of typesA2 and A1 with a diameter of 1.5 cm were scannedin a single projection to obtain Figs. 3~a! and 3~b!.1.0-cm-diameter cylinders were scanned as single cyl-inders ~Figs. 4 and 5!, two cylinders of the same ma-
terial ~Figs. 6 and 7!, and two cylinders of differentmaterials ~Fig. 8!.The cylinders were positioned vertically with re-
spect to the scanning plane in the Intralipid mixtureat different angles relative to the source–detectorscan direction ~see Fig. 9! by means of a glass rod~0.3-cm diameter! connected to a rotational stage.The cylinders, which were twice the length of thesource–detector separation, were effectively treatedas infinite cylinders, and we verified that the glassrod does not affect the measurements.The reconstructions employed data taken in seven
projections at 30° angle increments from 0° to 180°around the region of interest. Each projection em-ployed a linear scan with source and detector facingeach other at a separation of 5 cm. The scan con-sisted of 41 measurement points at 0.2-cm steps for atotal scan length of 8 cm. Because the source–detector separation was 5 cm, only the central 5 cm ofthe scan length were actually used in reconstructingthe images. Values of the effective absorption andreduced scattering coefficients were calculated foreach point, by the use of Eqs. ~1!–~5!, and a referencemeasurement in the absence of inhomogeneities.An image of the object was then reconstructed byfiltered backprojection of the effective ma and m9s op-
Fig. 3. Comparison of directly measured parameters, phase, and dc, with calculated values of effective ma and m9s for 1.5-cm-diametercylinders immersed in a highly scattering background medium ~m9s0 5 7.9 6 0.1 cm21, ma0 5 0.079 6 0.005 cm21!. ~a! Type A2 cylinderis less absorbing than the background, ~b! type A1 cylinder is more absorbing than the background. The parameters dc, effective ma, andeffective m9s are shown in normalized units to illustrate the differences in contrast and sharpness of the perturbation caused by the cylinder.The two peaks in the phase plots are due to the distortion of the photon density wave front by each cylinder.
1 January 1997 y Vol. 36, No. 1 y APPLIED OPTICS 173
Fig. 4. Reconstructed images of calculated parameters, effective ma and m9s, for a 1.0-cm-diameter, type A2 cylinder ~ma 5 0.045 6 0.03cm21! immersed in a highly scattering background medium ~m9s 5 7.9 6 0.1 cm21, ma 5 0.079 6 0.005 cm21!. ~a! Effective ma image, ~b!effective m9s image. Each image is reconstructed from seven projections taken at 30° intervals from 0° to 180°. The reconstruction regionis shown by the thick black line. All images are scaled by calibration factor c 5 25 @mimage 5 ~m* 2 mbackground! c 1 mbackground#.
Fig. 5. Reconstructed images of calculated parameters, effective ma and m9s, for a 1.0-cm-diameter, type A1 cylinder ~ma 5 0.13 6 0.01cm21! immersed in a highly scattering background medium ~m9s 5 7.9 6 0.1 cm21, ma 5 0.079 6 0.005 cm21!. ~a! Effective ma image, ~b!effective m9s image. Each image is reconstructed from seven projections taken at 30° intervals from 0° to 180°. The reconstruction regionis shown by the thick black line.
174 APPLIED OPTICS y Vol. 36, No. 1 y 1 January 1997
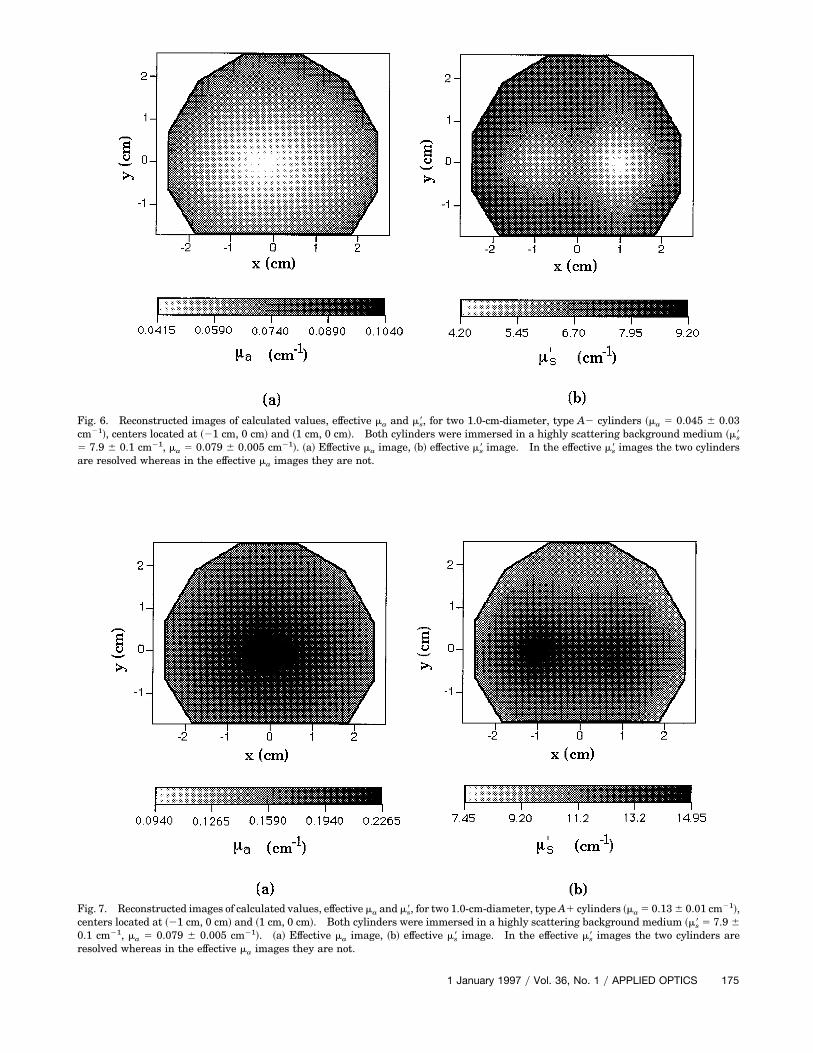
Fig. 6. Reconstructed images of calculated values, effective ma and m9s, for two 1.0-cm-diameter, type A2 cylinders ~ma 5 0.045 6 0.03cm21!, centers located at ~21 cm, 0 cm! and ~1 cm, 0 cm!. Both cylinders were immersed in a highly scattering background medium ~m9s5 7.9 6 0.1 cm21, ma 5 0.079 6 0.005 cm21!. ~a! Effective ma image, ~b! effective m9s image. In the effective m9s images the two cylindersare resolved whereas in the effective ma images they are not.
Fig. 7. Reconstructed images of calculated values, effective ma and m9s, for two 1.0-cm-diameter, typeA1 cylinders ~ma 5 0.136 0.01 cm21!,centers located at ~21 cm, 0 cm! and ~1 cm, 0 cm!. Both cylinders were immersed in a highly scattering background medium ~m9s 5 7.9 60.1 cm21, ma 5 0.079 6 0.005 cm21!. ~a! Effective ma image, ~b! effective m9s image. In the effective m9s images the two cylinders areresolved whereas in the effective ma images they are not.
1 January 1997 y Vol. 36, No. 1 y APPLIED OPTICS 175
Fig. 8. Reconstructed images of calculated values, effective ma and m9s, for two 1.0-cm-diameter cylinders, centers located at ~21 cm, 0 cm!and ~1 cm, 0 cm!. ~a! The left cylinder is less absorbing than the background medium ~type A2! whereas the right cylinder is moreabsorbing than the background medium ~type A1!. The values of the objects are recovered qualitatively correctly in the effective ma map.~b! The increased resolution of the effective m9s images allows a more accurate determination of the cylinder positions.
tical coefficients, separately, as described in Subsec-tion 2.B.
4. Results
The time required for reconstructing a complete two-dimensional image of effective ma and m9s from a set ofseven projections of 41measurements each is roughly
5 s on a 66-MHz 486 personal computer. This timeincludes the calculation of effective ma andm9s from thephase and intensitymeasurements, application of thefiltering function, and integration over all projec-tions. As in x-ray backprojection, the image can beconstructed in parallel with data acquisition, thusdecreasing the total time to generate an image.
Fig. 9. Experimental setup. ~a! Side view of the 16-L glass container filled with IntralipidyIndia ink mixture. Fiber optics carry lightfrom the source and to the detector. The fiber tips are separated by 5 cm inside the tank and scanned by means of an XYZ positioningscanner. The object is suspended in the scatteringmedium by a 3-mm-diameter glass rod. ~b! Top view of cylindrical object. The sourceand the detector make a one-dimensional scan perpendicular to the object across the volume of interest. ~c! Top view of multipleprojectionsmeasured on a single object. Each square denotes a separate projection. In ourmeasurements, projection angles ranged from0° to 180° in 30° steps. ~d! Top view of multiple projections measured on two cylindrical objects.
176 APPLIED OPTICS y Vol. 36, No. 1 y 1 January 1997
Table 2. Contrast and FWHM of Single-Cylinder Calibrated Images with a Diameter of 1.0 cm
Type Cdc ~%! Cma~%! Cm9s
~%! FWHMdc ~cm! FWHMma~cm! FWHMm9s
~cm!
A1 438 100 68 3.0 3.8 1.9A2 275 38 50 3.0 3.0 1.4
To compare the reconstructed images below, wedefine contrast Cx for a specific quantity x as:
Cx 5uxpeak 2 xbackgroundu
xbackground. (9)
Given two objects with the same size and opticalproperties, we can say that they are resolved whentheir reconstructed image shows two maxima sepa-rated by a minimum located between the objects.We can define the resolution of the imaging techniqueas the distance between the centers of two objectsbarely resolved ~i.e., the difference betweenminimumand maxima is greater than the measurement noise!.If the two objects give independent contributions tothe reconstructed image, the distance at which theyare resolved is equal to the FWHM of the image ofeither object measured separately. Thus theFWHM for a single object can be regarded as a roughestimate of the resolution of this technique. Also,we introduce a quantity called relative resolution,which is defined as
Rx 5~xpeak1 1 xpeak2!y2 2 xmin
xmmCx, (10)
where xmin represents the minimum value midwaybetween the two peaks. This definition comparesthe depth of the minimum that separates two sim-ilar objects with the contrast of the image. If thesetwo quantities are equal, the relative resolution is100%.We concentrate on the case of inhomogeneities
with absorption different from that of the back-ground. First we describe the raw data and the cal-culated parameters for a single projection, and thenwe compare contrast and FWHM for images of effec-tive ma and m9swith single objects of typesA2 andA1.We evaluate the resolution for a medium containingtwo objects of the same type ~either A2 or A1! byusing both a reconstructed image and a cross sectionof that image. Finally, this reconstructionmethod isevaluated for two objects of different absorption pa-rameters ~types A2 and A1 together!.
A. Single Projection
Figure 3~a! shows the raw data and effective absorp-tion and reduced scattering coefficients for a cylindri-cal object of type A2 with a diameter of 1.5 cm. Thevalues of the phase and dc of the measured intensityare similar to the background values far away fromthe object. The dc trace shows a peak, located at thecenter of the object, that is considerably broader thanthe object itself ~1.9 cm FWHM!. The phase shows adouble peak with a phase difference of ;1°. This
structure is due to the diffraction and refraction of thephoton density wave and has been measured both forpartially4,21,22 and totally23 absorbing objects. Notethat the phase decreases below the background valuebut this does not affect the sign of either effective maor m9s. In fact, the calculated values of ma and m9s bothhave shapes similar to the dc intensity with minimaat the position of the object. Although ma and m9shave smaller contrasts than the dc intensity ~typeA2: Cdc 5 35%, Cma
5 5%, Cm9s5 5%!, the ma pro-
jection has a larger FWHM ~2.4 cm! and the m9s pro-jection has a smaller FWHM ~1.5 cm! than the dcintensity. Figure 3~b! shows the same informationfor an object of type A1with a diameter 1.5 cm. Thedc trace exhibits the same contrast as in the type A2case; however, the phase increases to ;1.4°, thusincreasing the contrast of the effective ma and m9straces ~type A1: Cdc 5 37%, Cma
5 9.0%, Cm9s5
7.0%!.Note that the effective ma and m9s traces have sim-
ilar contrasts, even though the measured objectshave reduced scattering coefficients that are within6% of the background values whereas the absorptioncoefficients of the objects are 57% or 165% of thebackground. We expect the values of effective maand m9s to be interdependent to some extent as theyare based on homogeneous infinite-medium equa-tions. The size of the perturbation caused by eachobject depends on the object’s dimensions and differ-ence in optical properties from those of the back-ground medium. Finally, because of theexperimental difficulties of producing each object, thevalues of the scattering coefficients of the objects canbe as much as 12% different from the backgroundvalues. This difference could contribute to part ofthe correlation between effective ma and m9s traces.
B. Single-Cylinder Reconstruction
The reconstructed images in Fig. 4 represent recon-structions of a single cylindrical object of type A2with a diameter of 1.0 cm. The gray scales arebounded by the minimum and the maximum valuesof the reconstructed images. Lighter regions denoteareas of lower effective absorption and lower effectivereduced scattering coefficients. The valid recon-struction region ~where all the projections overlap! isshown by the thick black line. Figure 5 representsthe same images generated for an object of type A1with a diameter of 1.0 cm. Although the m9s imageshave a similar contrast to that of the ma images ~seeTable 2!, in both the type A2 and type A1 cases theimage of effective m9s is sharper than the effective maimage ~see Table 2!. The fact that the map of effec-
1 January 1997 y Vol. 36, No. 1 y APPLIED OPTICS 177
Table 3. Contrast and Relative Resolution of Two-Cylinder Images with a Diameter of 1.0 cm
Type Cdc ~%! Cma~%! Cm9s
~%! Rdc ~%! RmaRm9s
~%!
A1, A1 650 190 78 — — 12A2, A2 350 75 50 7.1 — 41
tive ma and effective m9s could significantly differ interms of resolution has been previously suggested.24
C. Two Cylinders: Same Absorption
Figures 6 and 7 show reconstructions of two 1.0-cm-diameter cylinders of the same absorption and re-duced scattering coefficients with centers separatedby 2.0 cm. The effective ma reconstruction of theless-absorbing objects A2 in Fig. 6 show a single dipbetween centers of the objects whereas the cylindersin the effective m9s images are clearly distinguishable.The fact that the minima corresponding to the objectsin the effective m9s reconstruction are not equal couldbe due to slight differences in the objects’ absorptionand scattering properties. Similarly, Fig. 7 showsthat the type A1 objects are unresolved in the effec-tive ma image and resolved in the effective m9s image.The contrast and resolution in these images are re-ported in Table 3.
D. Two Cylinders: Different Absorption
Figure 8 shows the performance of measured andcalculated parameters for two cylinders of similarreduced scattering coefficients, but with one cylinderless absorbing and the other cylinder more absorbingthan the background medium. The type A2 cylin-der is easily visible in the effective m9s reconstruction.
5. Discussion
In this paper we have presented an image-reconstruction scheme based on backprojection of thecalculated effective absorption and reduced scatter-ing parameters of the medium measured at a singlesource–detector position. This scheme representsan experimental approach adapted from x-ray tomog-raphy. Images were reconstructed of objects withcentimeter dimensions that have optical characteris-tics similar to those of human tissue. Both singleand multiple inhomogeneities were measured withsimilar optical scattering parameters and with ab-sorption parameters greater and less than back-ground values.Backprojection has the advantage in that it can
produce images quickly, employing relatively fewcomputational resources compared with iterativetechniques. This makes it ideal for use in real time,in conjunction with a noninvasive monitor. Becauseof the approximations that are made to adapt thelinear theory of x-ray backprojection to the nonlinearpropagation of diffusing photons, the method de-scribed in this paper is not strictly applicable. How-ever, for the cases considered, the reconstructedimages of ma are qualitatively correct. In the pres-ence of both single and multiple objects of different
178 APPLIED OPTICS y Vol. 36, No. 1 y 1 January 1997
absorptions, both the position and the qualitative na-ture ~more absorbing, less absorbing! of the inhomo-geneity are correctly reconstructed. Also, it ispossible to use extra information derived from time-resolved measurements to generate parameters~such as effective m9s! that have a higher resolutionthan reconstructions of the intensity ~represented bythe dc measurements in this paper!. Because of theassumptions used to separate ma and m9s, the twomaps are partially correlated. This leakage of theeffective ma values into the effective m9s values pre-vents the reconstruction of quantitative maps. Wenote that the reconstructed values of the optical co-efficients do not reproduce the actual values in thepresented images. Although the lack of quantita-tive information is a disadvantage for some applica-tions such as determination of blood oxygensaturation or as a screening parameter in breastmammography, most diagnostic imaging techniquesused currently ~magnetic resonance imaging, x-rayCT! employ only qualitative information for impor-tant diagnoses such as detecting and locating tumors.Colak et al. proposed a method to recover increased
resolution and quantitative results for inhomogene-ities by using a set of spatially dependent deconvolu-tions.25 Once the location and the qualitativeoptical properties of an inhomogeneity are deter-mined by the use of filtered backprojection, somequantitative combination of optical properties andsize of the object can be recovered through calibrationby the use of maps generated by the scan of a knownabsorbing or scattering object between source anddetector.
The Laboratory for Fluorescence Dynamics is sup-ported by theU.S. National Institutes of Health grantRR03155 and by the University of Illinois at Urbana-Champaign. This research is also supported by theU.S. National Institutes of Health grant CA57032.
References1. M. S. Patterson, B. Chance, and B. C. Wilson, “Time resolved
reflectance and transmittance for the non-invasive measure-ment of tissue optical properties,” Appl. Opt. 28, 2331–2336~1989!.
2. S. Fantini, M. A. Franceschini, J. B. Fishkin, B. Barbieri, andE. Gratton, “Quantitative determination of the absorptionspectra of chromophores in strongly scattering media: alight-emitting-diode based technique,” Appl. Opt. 33, 5204–5213 ~1994!.
3. B. C. Wilson, M. S. Patterson, and B. W. Pogue, “Instrumen-tation for in vivo tissue spectroscopy and imaging,” inMedicalLasers and Systems II, D. M. Harris, C. M. Penney, and A.Katzir, eds., Proc. SPIE 1892, 132–147 ~1991!.
4. M. S. Patterson, B. W. Pogue, and B. C. Wilson, “Computersimulation and experimental studies of optical imaging with
photon density waves,” in Medical Optical Tomography:Functional Imaging and Monitoring, G. J. Mueller, B. Chance,R. Alfano, S. Arridge, J. Bleuthan, E. Gratton, M. Kaschke, B.Masters, S. Svanberg, P. van der Zee, eds., Vol. IS11 of SPIEInstitute Series ~Society of Photo-Optical Instrumentation En-gineers, Bellingham, Wash., 1993!, pp. 65–86.
5. S. R. Arridge, P. van der Zee, M. Cope, and D. T. Delpy, “Re-construction methods for infra-red absorption imaging,” inTime-Resolved Spectroscopy and Imaging of Tissues, B.Chance and A. Katzir, eds., Proc. SPIE 1431, 204–215 ~1991!.
6. R. L. Barbour, H. L. Graber, R. Aronson, and J. Lubowsky,“Imaging of subsurface regions of random media by remotesensing,” in Time-Resolved Spectroscopy and Imaging of Tis-sues, B. Chance and A. Katzir, eds., Proc. SPIE 1431, 192–203~1991!.
7. J. R. Singer, F. A. Grunbaum, P. Kohn, and J. PassamaniZubelli, “Image reconstruction of the interior of bodies thatdiffuse radiation,” Science 248, 990–993 ~1990!.
8. K. D. Paulsen andH. Jiang, “Spatially varying optical propertyreconstruction using a finite element diffusion equation ap-proximation,” Med. Phys. 22, 691–701 ~1995!.
9. H. Jiang, K. D. Paulsen, U. L. Osterberg, B. W. Pogue, andM. S. Patterson “Optical image reconstruction usingfrequency-domain data: simulations and experiments,” Opt.Image Sci. 13, 253–266 ~1996!.
10. M. A. Oleary, D. A. Boas, B. Chance, and A. G. Yodh “Exper-imental images of heterogeneous turbid media by frequency-domain diffusing-photon tomography,” Opt. Lett. 20, 426–428~1995!.
11. B. W. Pogue, M. S. Patterson, H. Jiang, and K. D. Paulsen,“Initial assessment of a simple system for frequency domaindiffuse optical tomography,” Phys. Med. Biol. 40, 1709–1729~1995!.
12. M. A. Franceschini, S. Fantini, S. A. Walker, J. S. Maier, andE. Gratton, “Multi-channel optical instrument for near-infrared imaging of tissues,” in Optical Tomography, PhotonMigration, and Spectroscopy of Tissue and Model Media:Theory, Human Studies, and Instrumentation, B. Chance andR. Alfano, eds., Proc. SPIE 2389, 264–273 ~1995!.
13. J. B. Fishkin and E. Gratton, “Propagation of photon-densitywaves in strongly scattering media containing an absorbingsemi-infinite plane bounded by a straight edge,” J. Opt. Soc.Am. A 10, 127–140 ~1993!.
14. K. Furutsu and Y. Yamada, “Diffusion approximation for adissipative random medium and the applications,” Phys. Rev.E 50, 3634–3640 ~1994!.
15. J.-M. Kaltenbach and M. Kaschke, “Frequency- and time-domainmodelling of light transport in randommedia,” inMed-ical Optical Tomography: Functional Imaging andMonitoring, G. J. Mueller, B. Chance, R. Alfano, S. Arridge, J.Bleuthan, E. Gratton, M. Kaschke, B. Masters, S. Svanberg, P.
van der Zee, eds., Vol. IS11 of SPIE Institute Series ~Society ofPhoto-Optical Instrumentation Engineers, Bellingham,Wash., 1993!, pp. 65–86.
16. S. F. Feng, F. Zeng, and B. Chance, “Monte Carlo simulationsof photon migration path distributions in multiple scatteringmedia,” in Photon Migration and Imaging in Random Mediaand Tissues, B. Chance and R. Alfano, eds., Proc. SPIE 1888,78–89 ~1993!.
17. A. C. Kak and M. Slaney, Principles of Computerized Tomo-graphic Imaging ~IEEE, New York, 1988!, pp. 49–74.
18. R. L. Barbour, H. L. Graber, Y. Wang, J. Chang, and R. Aron-son, “A perturbation approach for optical diffusion tomographyusing continuous-wave and time-resolved data,” in MedicalOptical Tomography: Functional Imaging and Monitoring,G. J. Mueller, B. Chance, R. Alfano, S. Arridge, J. Bleuthan, E.Gratton, M. Kaschke, B. Masters, S. Svanberg, P. van der Zee,eds., Vol. IS11 of SPIE Institute Series ~Society of Photo-Optical Instrumentation Engineers, Bellingham, Wash.,1993!, pp. 87–120.
19. B. A. Feddersen, D.W. Piston, and E. Gratton, “Digital parallelacquisition in frequency domain fluorimetry,” Rev. Sci. In-strum. 60, 2929–2936 ~1989!.
20. S. Fantini, M. A. Franceschini, and E. Gratton, “Semi-infinite-geometry boundary problem for light migration in highly scat-tering media: a frequency-domain study in the diffusionapproximation,” J. Opt. Soc. Am. B 11, 2128–2138 ~1994!.
21. D. A. Boas, M. A. Oleary, B. Chance, and A. G. Yodh, “Scat-tering of diffuse photon density waves by spherical inhomoge-neities within turbid media: Analytic Solution andapplications,” Proc. Natl. Acad. Sci. USA 91, 4887–4891~1994!.
22. P. Krammer, H. Bartelt, H. Fischer, and B. Schmauss, “Imag-ing in scattering media using the phase of modulated lightsources,” in Photon Propagation in Tissues, B. Chance, D.Delpy, and G. J. Mueller, eds., Proc. SPIE 2626, 65–74 ~1995!.
23. J. S. Maier and E. Gratton, “Frequency-domain methods inoptical tomography: detection of localized absorbers and abackscattering reconstruction scheme,” in Photon Migrationand Imaging in RandomMedia and Tissues, B. Chance and R.Alfano, eds., Proc. SPIE 1888, 440–451 ~1993!.
24. S. Fantini, M. A. Franceschini, S. A. Walker, J. S. Maier, andE. Gratton, “Photon path distributions in turbid media: ap-plications for imaging,” inOptical Tomography, PhotonMigra-tion, and Spectroscopy of Tissue and Model Media: Theory,Human Studies, and Instrumentation, B. Chance and R. Al-fano, eds., Proc. SPIE 2389, 340–349 ~1995!.
25. S. B. Colak, D. G. Papaioannou, G. W. ’t Hooft, and M. B. vander Mark, “Optical image reconstruction with deconvolution inlight diffusing media,” in Photon Propagation in Tissues, B.Chance, D. Delpy, and G. J. Mueller, eds., Proc. SPIE 2626,306–315 ~1995!.
1 January 1997 y Vol. 36, No. 1 y APPLIED OPTICS 179