71
2017 Full-year results 26 February 2018

2017 Full-year results 26 February 2018
Image TBU – WQ light show?
Agenda
01 2017 highlights, market backdrop and strategy David Atkins – Chief Executive
02 Financial results Timon Drakesmith – CFO; Managing Director, Premium Outlets
03 Operational and portfolio review Timon Drakesmith – CFO; Managing Director, Premium Outlets Mark Bourgeois – Managing Director, UK and Ireland Jean-Philippe Mouton – Managing Director, France
04 Transaction update and conclusion David Atkins – Chief Executive
2

Strong financial returns driven by record occupier demand
3
Another year of strong growth
EPS +6.5%
DPS +6.3%
NAVPS +5.0%
Preferred position with shoppers and retailers
Record volume of new leasing, +34%
Highest occupancy for 17 years
Strong footfall outperformance
Positive operational results
LFL NRI: France +2.6%; Ireland +7.4% (1)
Consistently strong Premium outlets sales +9%
Consistent capital recycling
Sold £400m; diversity of buyers
Further £76m investment in Premium outlets announced today
Significant acquisition aligned to strategy
Advancing intu acquisition
(1) Proforma figure assuming properties owned throughout 2016 and 2017
Riverside at The Oracle, Reading
2017 highlights
Brent Cross extension
Cabot Circus
Images TBC
Victoria, Leeds
Dundrum, Dublin
Bicester Village
L’Occitane, Victoria Leeds Les 3 Fontaines, Cergy
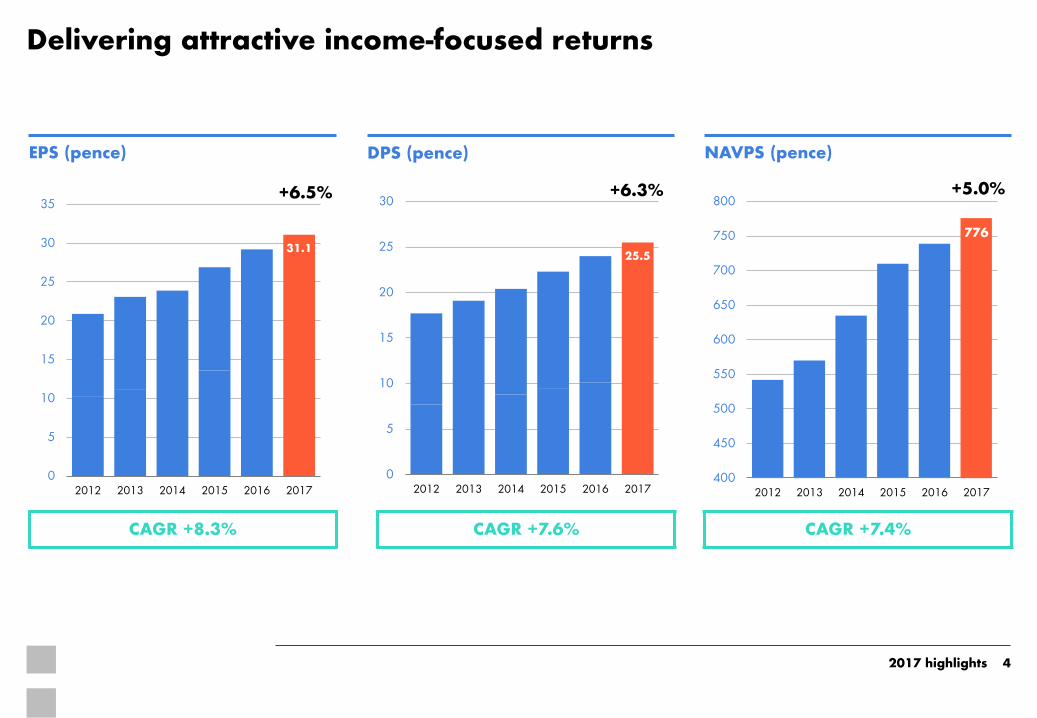
Delivering attractive income-focused returns
4
NAVPS (pence)
776
400
450
500
550
600
650
700
750
800
2012 2013 2014 2015 2016 2017
CAGR +7.4%
EPS (pence) DPS (pence)
31.1
0
5
10
15
20
25
30
35
2012 2013 2014 2015 2016 2017
CAGR +8.3%
25.5
0
5
10
15
20
25
30
2012 2013 2014 2015 2016 2017
CAGR +7.6%
2017 highlights
+6.5% +6.3% +5.0%
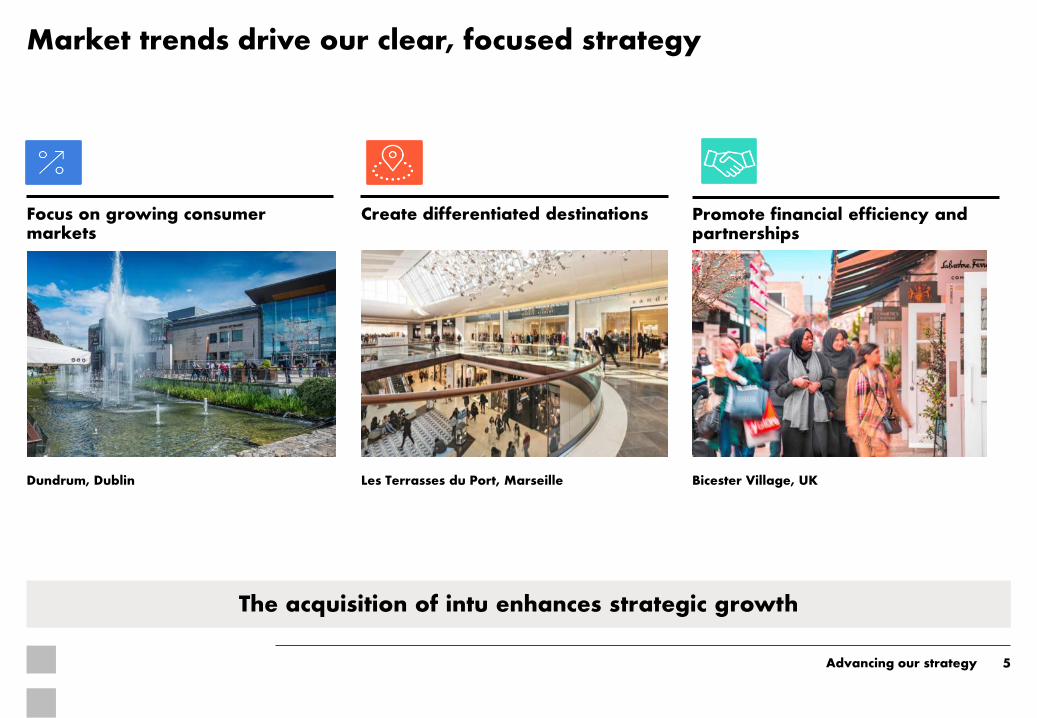
Market trends drive our clear, focused strategy
5
Focus on growing consumer markets
Create differentiated destinations Promote financial efficiency and partnerships
Les Terrasses du Port, Marseille Bicester Village, UK Dundrum, Dublin
The acquisition of intu enhances strategic growth
Advancing our strategy
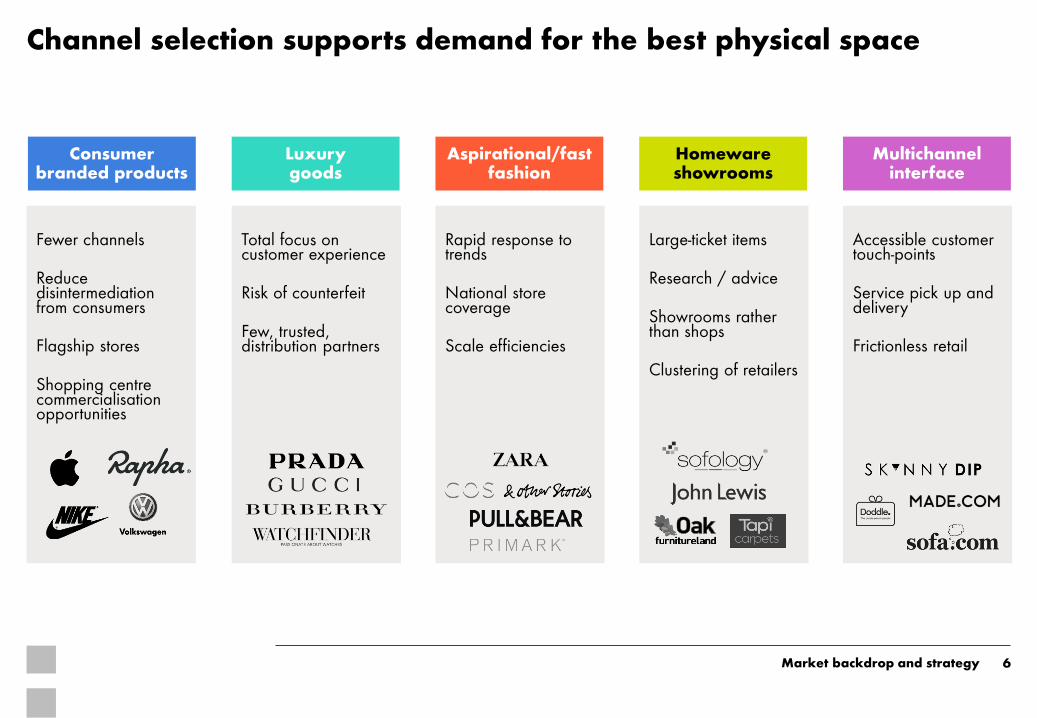
Large-ticket items
Research / advice
Showrooms rather than shops
Clustering of retailers
Rapid response to trends
National store coverage
Scale efficiencies
Channel selection supports demand for the best physical space
6
Consumer branded products
Multichannel interface
Aspirational/fast fashion
Homeware showrooms
Luxury goods
Fewer channels
Reduce disintermediation from consumers
Flagship stores
Shopping centre commercialisation opportunities
Total focus on customer experience
Risk of counterfeit
Few, trusted, distribution partners
Accessible customer touch-points
Service pick up and delivery
Frictionless retail
Market backdrop and strategy

UK catchment spend market-share split (%) (1)
High-quality retail destinations are increasingly valuable in a multichannel landscape
7 (1) Source: MasterCard spend data (collected and analysed by Javelin Group)
0%
10%
20%
30%
40%
50%
60%
70%
Hammerson UK shoppingcentres
Rest of catchment retail Online spend
2015 2017
+2% +6%
-2%
Shoppers are shifting towards large retail destinations and online
Market backdrop and strategy
Other retail locations
0%
5%
10%
15%
20%
25%
30%
35%
40%
45%
1 2 3 4 5 6 7 8 9 10
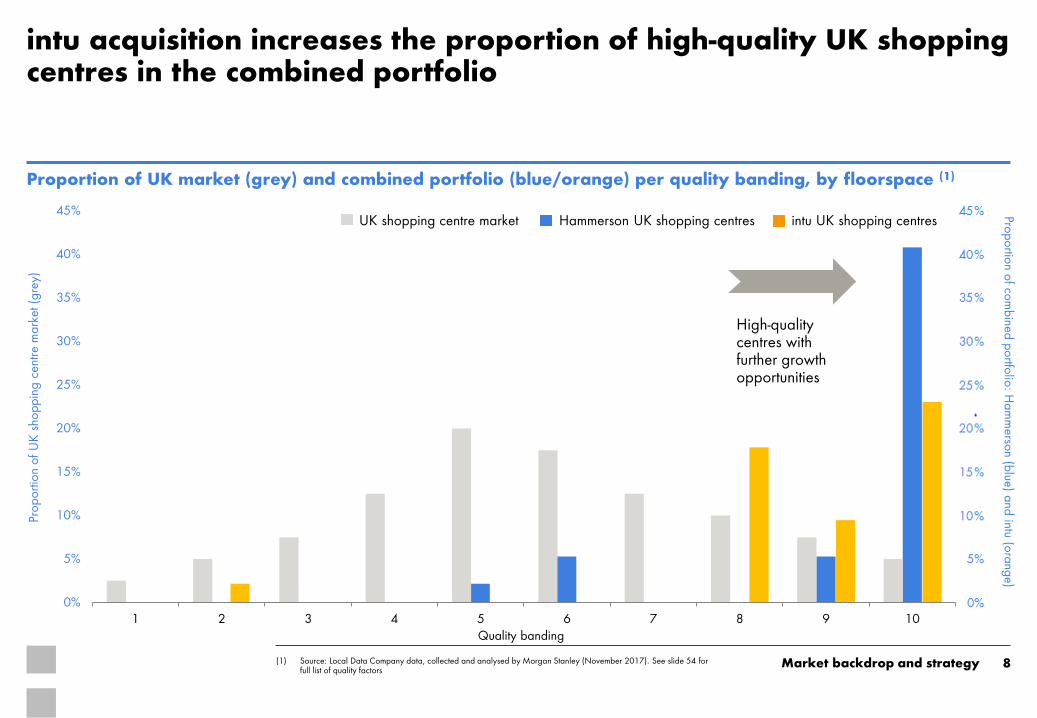
intu acquisition increases the proportion of high-quality UK shopping centres in the combined portfolio
8
Proportion of UK market (grey) and combined portfolio (blue/orange) per quality banding, by floorspace (1)
(1) Source: Local Data Company data, collected and analysed by Morgan Stanley (November 2017). See slide 54 for full list of quality factors
High-quality centres with further growth opportunities
Market backdrop and strategy
Proportio
n of co
mbined
portfo
lio: H
am
merso
n (blue) a
nd intu (o
rang
e)
Footnote to direct to
appendix for full list of properties
Proportio
n of U
K s
hoppin
g c
entre
mark
et (
gre
y)
UK shopping centre market Hammerson UK shopping centres intu UK shopping centres
Quality banding

Successful track-record of capital recycling through varied conditions to a breadth of buyers
9
Hammerson annual disposal proceeds (£m)
2011-2017 total £2.5bn; average £360m disposals p.a.
£1.2bn over last 3 years, 2% below book value
Split of Hammerson’s disposals by category of acquirer (2015-2017)
European institutions
Private equity
Global capital
UK institutions
Local Authorities
Other
33%
24%
17%
13%
8% 5%
0
100
200
300
400
500
600
700
2011 2012 2013 2014 2015 2016 2017
£1.2bn
Market backdrop and strategy
Check disposals total

10 (1) Pro-forma GAV as at 31 December 2017 (2) Darker blue indicates top 10 largest combined group ownerships in UK shopping centres by value (3) Illustrative portfolio mix post disposals and reinvestment into Premium outlets, Ireland, Spain and Developments, assumes organic
growth of 2% p.a. on largest 10 UK shopping centres and growth of 5% p.a. on Premium outlets, Ireland and Spain
2018 combined portfolio split (GAV, £bn) (1,2)
2021+ illustrative portfolio split (£bn) (2,3)
72% higher-growth segments
64% higher-growth segments
intu acquisition allows for agile capital recycling into higher-growth segments
European shopping centres and retail parks (2)
Ireland
Spain
Developments
Premium outlets
£2bn disposals
Market backdrop and strategy

02 Financial results
Timon Drakesmith – CFO; Managing Director, Premium Outlets
- Review of 2017 performance
- Analysis of cost:income ratios
- New debt facility
- 2018 disposal plans
- Drivers of future EPS growth
Image TBC

Headline results
12 (1) Does not include premium outlets. NRI including premium outlets is £468.0m (2) Valuation for total portfolio including premium outlets (3) Change reflects capital return, not absolute increase of 5.9%
Income statement 31 December 2017 31 December 2016 Change
Net rental income (£m) (1) 370.4 346.5 +6.9%
Adjusted profit (£m) 246.3 230.7 +6.8%
Adjusted EPS (p) 31.1 29.2 +6.5%
Total dividend (p) 25.5 24.0 +6.3%
Balance sheet
Portfolio value (£m) (2) 10,560 9,971 +2.2%(3)
EPRA NAVPS (p) 776 739 +5.0%
LTV (%) 36 36 n/a
Financial results

LfL NRI growth
13 (1) Figures on a proportionally consolidated basis (2) Proforma figure assuming properties owned throughout 2016 and 2017 (3) LFL NRI growth includes the impact of extensions due to multiple tenant relocations from the existing scheme into new phases. Hammerson
management estimate that the extensions have contributed approximately 1-2% to LfL NRI growth
2017 NRI growth by sector (1)
LFL NRI growth (%)
UK shopping centres
+1.8
UK retail parks
−2.5
France +2.6
EPRA LfL NRI
+1.0
Ireland (2)
+7.4
LfL NRI incl. Ireland +1.7
Premium outlets (3)
+15.3
Total LfL NRI incl. Ireland and Premium outlets
+4.4
Financial results
UK shopping centres LFL NRI
2017 2016
Net rents, commercialisation and other
2.3% 2.0%
Car parks (business rates) −0.5% 0.4%
Total 1.8% 2.4%
Note - Slide appears as
build
UK retail parks LFL NRI
2017 2016
Net rents, commercialisation and other
2.4% −2.1%
Surrender premiums −4.9% 4.5%
Total −2.5% +2.4%
With VM to check
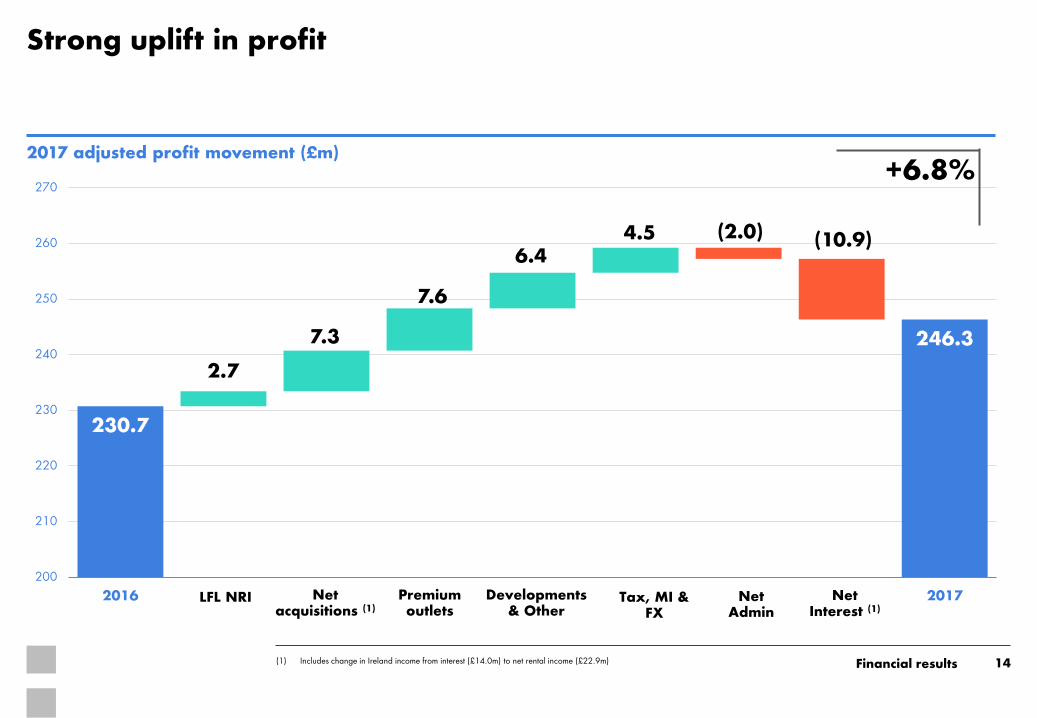
Strong uplift in profit
14
230.7
246.3
2.7
7.3
7.6
6.4 4.5 (2.0) (10.9)
200
210
220
230
240
250
260
270
2016 2017
2017 adjusted profit movement (£m)
Developments & Other
Premium outlets
Net acquisitions (1)
Tax, MI & FX
Net Admin
+6.8%
Financial results
LFL NRI Net Interest (1)
(1) Includes change in Ireland income from interest (£14.0m) to net rental income (£22.9m)
14.6% 13.3% 12.8% 11.8% 11.9% 11.9%
11.9% 10.9%
10.0% 11.3% 10.7% 9.7%
0%
5%
10%
15%
20%
25%
30%
2012 2013 2014 2015 2016 Hammerson Intu
Corporate expenses Operational costs
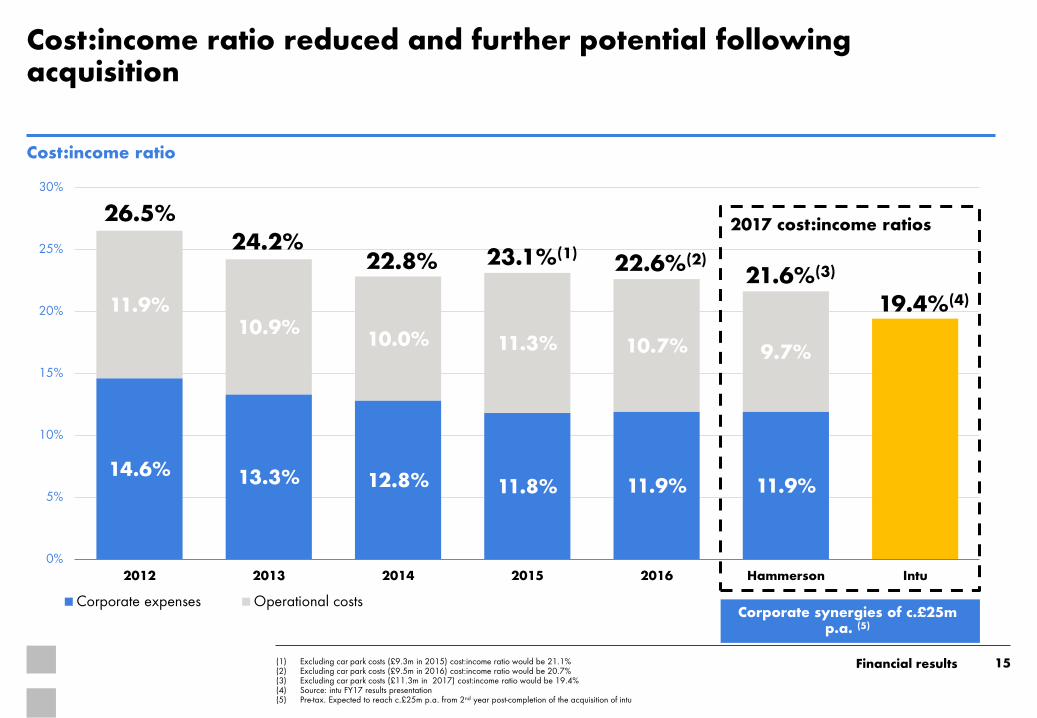
Cost:income ratio reduced and further potential following acquisition
15
Cost:income ratio
26.5% 24.2%
22.8% 23.1%(1)
(1) Excluding car park costs (£9.3m in 2015) cost:income ratio would be 21.1% (2) Excluding car park costs (£9.5m in 2016) cost:income ratio would be 20.7% (3) Excluding car park costs (£11.3m in 2017) cost:income ratio would be 19.4% (4) Source: intu FY17 results presentation (5) Pre-tax. Expected to reach c.£25m p.a. from 2nd year post-completion of the acquisition of intu
22.6%(2) 21.6%(3)
Financial results
19.4%(4)
2017 cost:income ratios
Corporate synergies of c.£25m p.a. (5)

Income growth driving valuation
16 (1) At constant exchange rates. Developments included per geographical segment (2) Figures on a proportionally consolidated basis. Principally assets held for development and non-core (3) Other capital movements reflects the impact of changes in purchasers’ costs, development surpluses and capital expenditure (4) Excluding stamp duty, proforma capital return 3.9%
Financial results
2017 capital return (1)
Drivers of underlying valuation change Value at 31 December
2017 (2)
(%) Yield shift (%) Income (%) Other (%)(4) (£m)
UK shopping centres +0.7 +0.2 +1.1 −0.6 3,528
UK retail parks −2.9 −2.8 −0.1 0.0 1,270
UK other (3) +3.8 +1.2 +1.3 +1.3 422
France +0.3 +0.0 +0.1 +0.2 2,011
Ireland (5) −0.3 +0.4 +3.5 −4.2 1,095
Premium outlets +11.5 +1.2 +10.1 +0.2 2,234
Total +2.2 +0.1 +2.5 −0.4 10,560

Financing ratios underpin our balance sheet strength
17
Financing policy 31 December 2017 31 December 2016
Net debt - £3,501m £3,413m
Gearing <85% 58% 59%
Loan to value <40% 36% 36%
Cash and undrawn facilities - £958m £592m
Weighted average cost of debt - 2.9% 3.1%
Interest cover >2.0x 3.4x 3.5x
Net debt/EBITDA <10x 9.3x 9.5x
Fixed rate debt >50% 78% 70%
GBP/EUR FX balance sheet hedging 70% - 90% 78% 79%
Financial results

35.1
22.5
0
5
10
15
20
25
30
35
40
Intu facilities NewHammerson
RCF
intu debt refinancing opportunities
18 (1) Terms agreed with core Hammerson relationship banks for a new £1.5bn 3 year credit facility, subject to documentation. (2) Assumed fully drawn, based on initial margin of 100bps plus 3month LIBOR of 0.65% (3) Assumed fully drawn, based on in-place coupons and margins of intu credit facilities
Selected intu near-term debt maturities
Facility Maturity
Convertible bonds, 2.5% coupon £160m 2018
SGS bank loan £352m 2021
RCF £600m 2021
Convertible bonds, 2.875% coupon £375m 2022
Total £1,487m
Illustrative annualised interest cost (3) £38.5m
Illustrative annualised interest cost difference (£m)
Financial results
£12.6m
Facility Maturity
New Hammerson RCF (1) £1,500m 2021
Illustrative annualised interest cost (2) £23.4m
Opportunity for significant
refinancing benefit

Capital recycling and funding flexibility
19
Deleverage through disposals ahead of phased development and reinvestment (£m)
0
500
1000
1500
2000
2500
2015-2017 Short to medium term Capex 2018-2020
Financial results
£2.0bn Hammerson and
intu total disposals
£500m Hammerson target disposals in 2018
(1) Includes intu committed capex and Spain (Source: intu FY17 results ). Further detail on slide 62
+£2.0bn Combined group disposals in short-
medium term
£660m Hammerson and
intu annual run-rate of disposals
£1.3bn Combined group
medium term capex (1)
Disposals Capex
c.£440m
Average run-rate capex
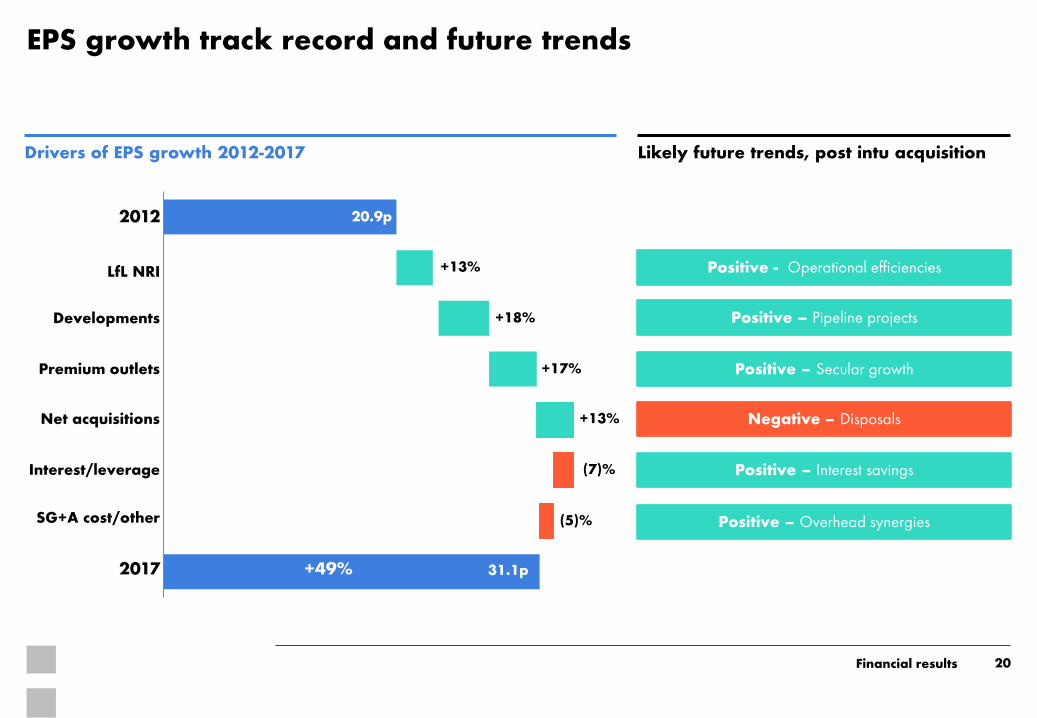
EPS growth track record and future trends
20
Drivers of EPS growth 2012-2017
LfL NRI
2012
+49%
+13%
+18%
+17%
+13%
(7)%
(5)%
20.9p
31.1p
Developments
Premium outlets
Net acquisitions
Interest/leverage
SG+A cost/other
2017
Likely future trends, post intu acquisition
Positive - Operational efficiencies
Positive – Pipeline projects
Positive – Secular growth
Negative – Disposals
Positive – Interest savings
Positive – Overhead synergies
Financial results
03 Portfolio review
Timon Drakesmith - CFO
- Premium Outlets
Mark Bourgeois - MD UK & Ireland
- UK and Ireland operational review
Jean-Philippe Mouton – MD France
- France

Bicester Village, UK
Change image
Portfolio review:
Premium outlets
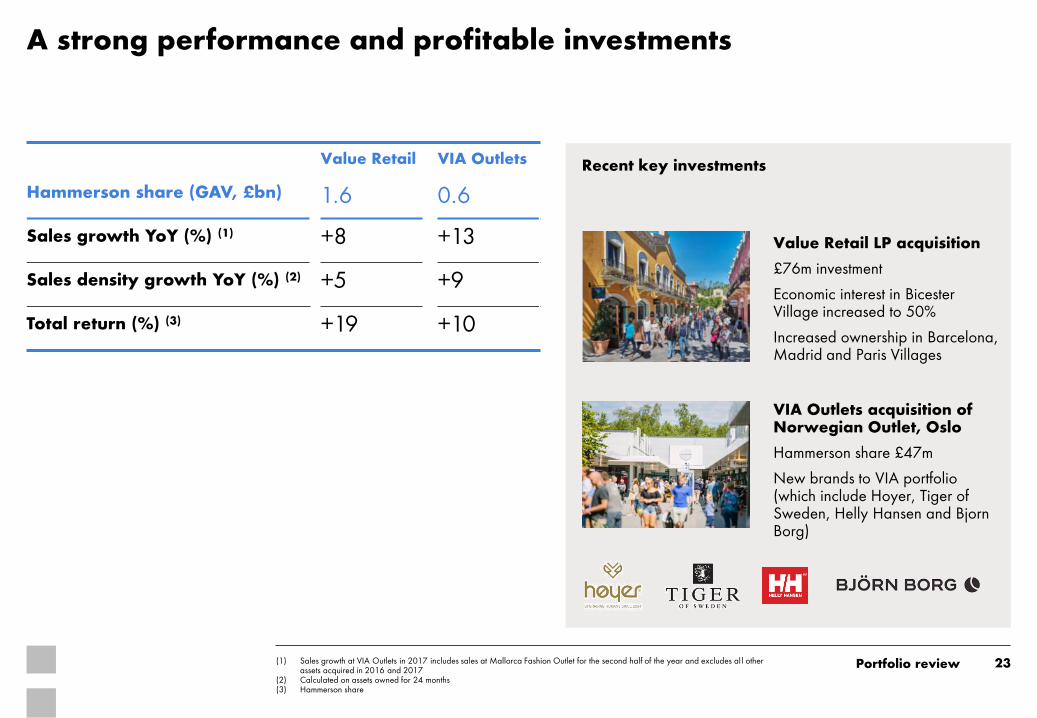
A strong performance and profitable investments
23 (1) Sales growth at VIA Outlets in 2017 includes sales at Mallorca Fashion Outlet for the second half of the year and excludes all other assets acquired in 2016 and 2017
(2) Calculated on assets owned for 24 months (3) Hammerson share
Value Retail VIA Outlets
Hammerson share (GAV, £bn) 1.6 0.6
Sales growth YoY (%) (1) +8 +13
Sales density growth YoY (%) (2) +5 +9
Total return (%) (3) +19 +10
La Vallée Village, Paris
Recent key investments
Value Retail LP acquisition
£76m investment
Economic interest in Bicester Village increased to 50%
Increased ownership in Barcelona, Madrid and Paris Villages
VIA Outlets acquisition of Norwegian Outlet, Oslo
Hammerson share £47m
New brands to VIA portfolio (which include Hoyer, Tiger of Sweden, Helly Hansen and Bjorn Borg)
Portfolio review

Global tourism continues as a growth driver
24 (1) Source: Global Blue, (Value Retail Villages) (2) Other includes countries which are not in the top 15
Breadth of international visitors
Growth in sales to smaller source markets
Partnerships with hotels and tour operators
Promotions targeted to specific traveller groups
2017 European tax refunded sales by nationality (1)
48%
14%
10%
5%
3% 1%
19%
YoY growth (%) (1)
Greater China +16
South and East Asia +17
Gulf/Middle East -2
Russia +28
India +38
USA +22
Other (2) +10
Total +14
update
Portfolio review

Premium outlets offer attractive yields and higher growth
0%
1%
2%
3%
4%
5%
6%
7%
8%
9%
10%
0% 2% 4% 6% 8% 10% 12% 14% 16%
Dec
2017 N
OI
yie
ld (
%)
2017 ERV growth (%)
25 (1) Data as at 31 December 2017 Source: Cushman and Wakefield
Frankfurt
Paris Madrid
Barcelona Porto
Bicester
Amsterdam
Trophy Central London retail
Premium outlets
Spanish super-regional shopping
centres
Zürich Super-regional
UK shopping centres
Jumbo French shopping centres
Local UK shopping
centres
UK Logistics
NOI yield and ERV growth of selected premium outlets (1)
Local UK shopping centres
UK large shopping centres
France large shopping centres
Spain large shopping centres
Trophy central London retail (2)
UK logistics

Portfolio review:
UK and Ireland operational review
The Oracle, Reading

Impressive volume of new leasing across the group
27 (1) Portfolio leasing on a proportionally consolidated basis, excludes developments and premium outlets
Hammerson new leasing volume 2017 (£m) (1)
0
5
10
15
20
25
30
35
40
Jan Feb Mar Apr May Jun Jul Aug Sep Oct Nov Dec
Cumulative 2016 Cumulative 2017
[add additional logos for leases signed in H2
2017]
Discuss best logos to include (RP and UK)
[ ]
Portfolio review
+6.7%
+34%

UK shopping centres
Bullring, Birmingham
UK brands in administration 2008-12: MFI Barratt Shoes Woolworths Comet BHS La Senza
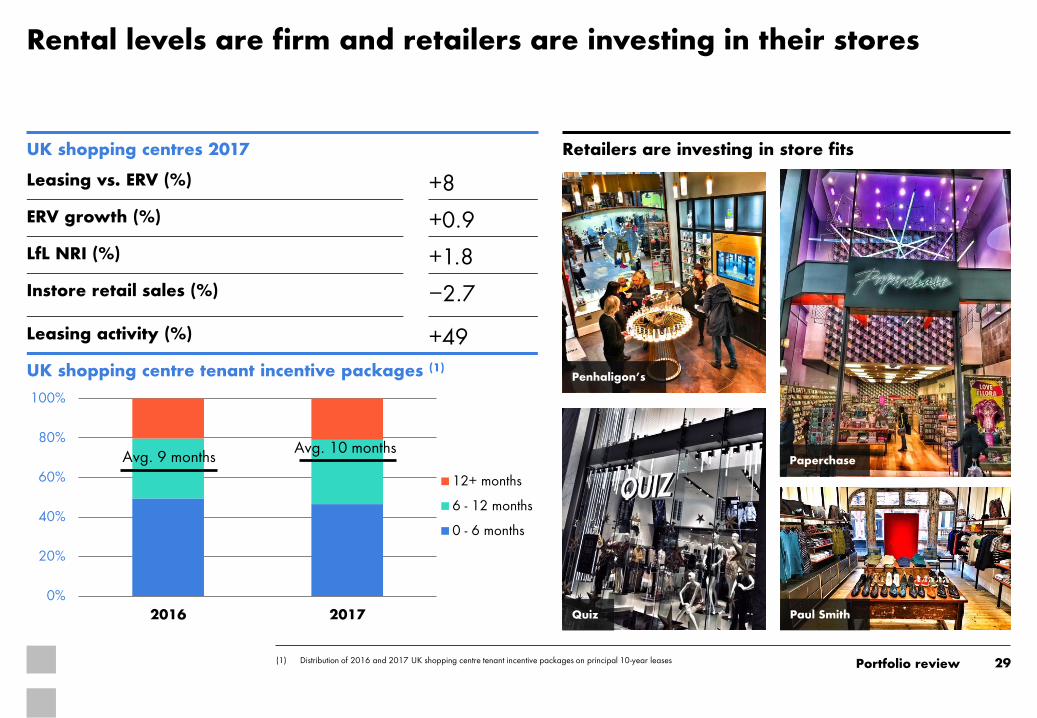
Rental levels are firm and retailers are investing in their stores
Zweibrucken, Germany
[ ]% of Hammerson portfolio at time of
going into administration
New UK brands since 2012: Rituals LuLu Lemon
Retailers are investing in store fits UK shopping centres 2017
Leasing vs. ERV (%) +8
ERV growth (%) +0.9
LfL NRI (%) +1.8
Instore retail sales (%) −2.7
Leasing activity (%) +49
UK shopping centre tenant incentive packages (1)
Avg. [ ] months
Avg. 10 months
Avg. 10 months
0
4
8
12
16
2015 2016 2017
Average Spread
(1) Distribution of 2016 and 2017 UK shopping centre tenant incentive packages on principal 10-year leases
29 Portfolio review
Paperchase
Quiz Paul Smith
Penhaligon’s
Images TBC
0%
20%
40%
60%
80%
100%
2016 2017
12+ months
6 - 12 months
0 - 6 months
Avg. 9 months Avg. 10 months

-8.0%
-6.0%
-4.0%
-2.0%
0.0%
2.0%
4.0%
6.0%
8.0%
-15.0% -10.0% -5.0% 0.0% 5.0% 10.0% 15.0% 20.0%
Cha
nge
in s
hare
of le
asi
ng,
by
ERV
(2015 -1
7)
Hammerson instore sales growth, 2017 (%)
Consumer brands
Ath-leisure
Gifts
Convenient services
Leisure
Personal luxuries
Aspirational homeware
Fast fashion
Aspirational fashion
Menswear
Household Casual dining
Footwear Cosmetics
Jewellers
High street fashion
Lingerie
Confectionary Cafe Toys Hairdresser
Stationer Accessories Books
Takeaway food
Travel agent Health foods Dept
store
Our insights into consumer trends drive our leasing strategy
30 (1) Includes leases signed across all Hammerson UK shopping centres 2015 – 2017, measuring change in proportion of new leasing signed; Hammerson same-centre instore sales YoY
Hammerson UK shopping centre leasing growth and instore sales growth(1)
Portfolio review
Add circles as builds?

Apparel is a dynamic category; we are tilting our mix towards the winning brands
31 (1) ‘Apparel’ includes clothing, footwear and lingerie
UK shopping centre leasing (£m) (1)
Steady volume of fashion leasing; less as a proportion of total
Apparel is lower as a proportion of total leasing
Total fashion leasing 2015: 55% 2017:43%
New brands are replacing old: Evolving consumer preferences inform our leasing strategy
Portfolio review
39%
33%
0%
20%
40%
60%
80%
100%
2015 2017
Apparel Non-apparel
-
0.5
1.0
1.5
2.0
2.5
3.0
3.5
4.0
4.5
High-street and fast-fashion Athleisure Aspirational fashion
2015 2017Example tenants
UK shopping centre apparel leasing (£m)
Ath-leisure High street fashion
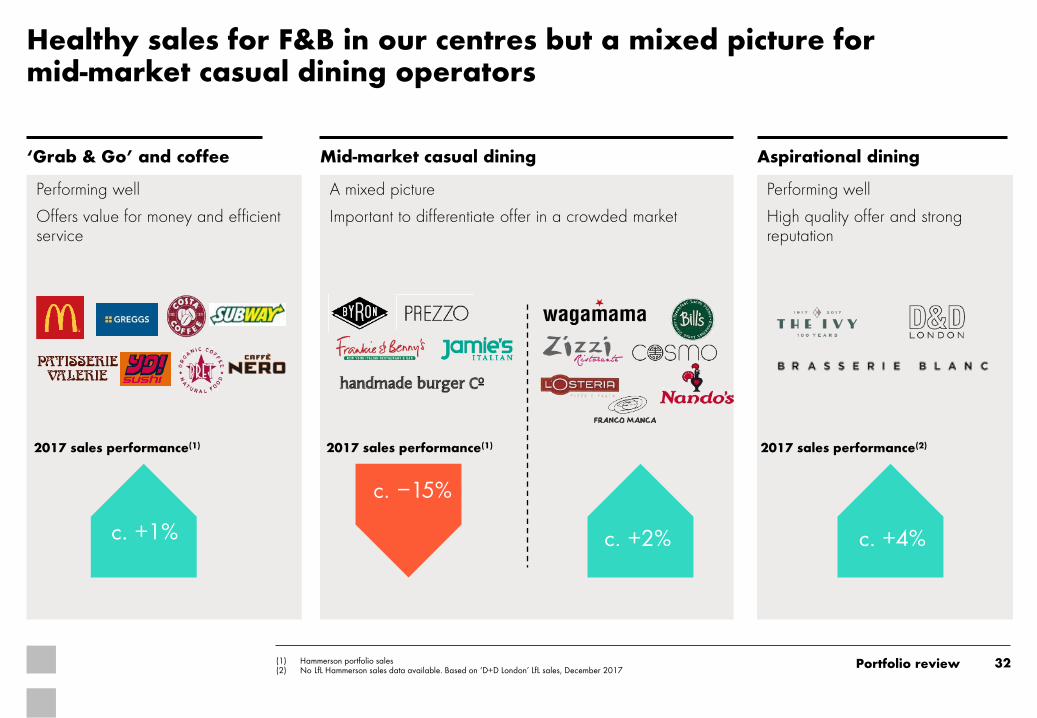
Performing well
High quality offer and strong reputation
Performing well
Offers value for money and efficient service
A mixed picture
Important to differentiate offer in a crowded market
Healthy sales for F&B in our centres but a mixed picture for mid-market casual dining operators
32 (1) Hammerson portfolio sales (2) No LfL Hammerson sales data available. Based on ‘D+D London’ LfL sales, December 2017
‘Grab & Go’ and coffee Mid-market casual dining Aspirational dining
c. +1% c. +2%
c. −15%
2017 sales performance(1)
c. +4%
2017 sales performance(1) 2017 sales performance(2)
Portfolio review

Retailer rotation provides positive opportunities
33
Market data TBC (Source: Deloitte)
UK retail market administrations (no. of stores) and Hammerson impact on income (%)
(1) Source: Centre for Retail Research
Portfolio review
0%
2%
4%
6%
8%
10%
0
500
1,000
1,500
2,000
2,500
3,000
3,500
4,000
4,500
2010 2011 2012 2013 2014 2015 2016 2017%
of H
am
merso
n incom
e
UK
mark
et a
dm
inis
tratio
ns, no
of st
ore
s Brent Cross
Jaeger All Saints / Ernest Jones / JD Sport
Highcross
House of Fraser Zara / JD Sport
Handmade Burger
All 6 units re-let or reassigned
Hammerson UK shopping centre portfolio administrations <1% of income
Selected retail administrations 2011-13:
Less than 1% negative impact on income from tenants in administration, even at the peak in 2012
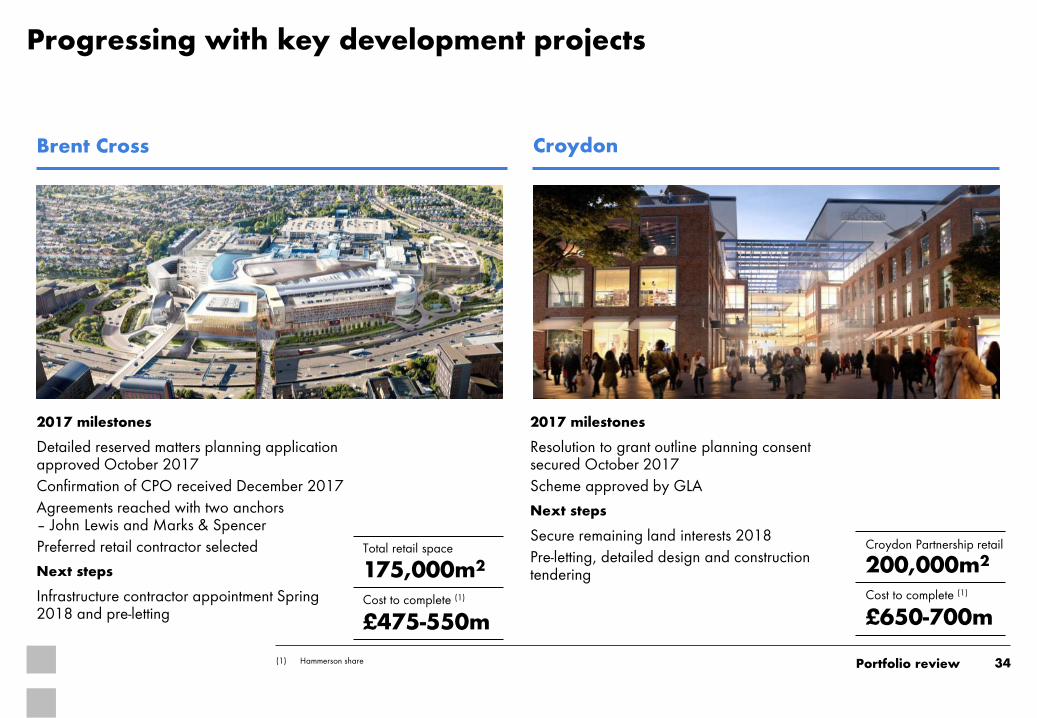
2017 milestones
Resolution to grant outline planning consent secured October 2017
Scheme approved by GLA
Next steps
Secure remaining land interests 2018
Pre-letting, detailed design and construction tendering
Progressing with key development projects
34
Croydon
(1) Hammerson share
Brent Cross
175,000m2 Total retail space
Cost to complete (1)
£475-550m
Portfolio review
200,000m2 Croydon Partnership retail
Cost to complete (1)
£650-700m
2017 milestones
Detailed reserved matters planning application approved October 2017
Confirmation of CPO received December 2017
Agreements reached with two anchors – John Lewis and Marks & Spencer
Preferred retail contractor selected
Next steps
Infrastructure contractor appointment Spring 2018 and pre-letting
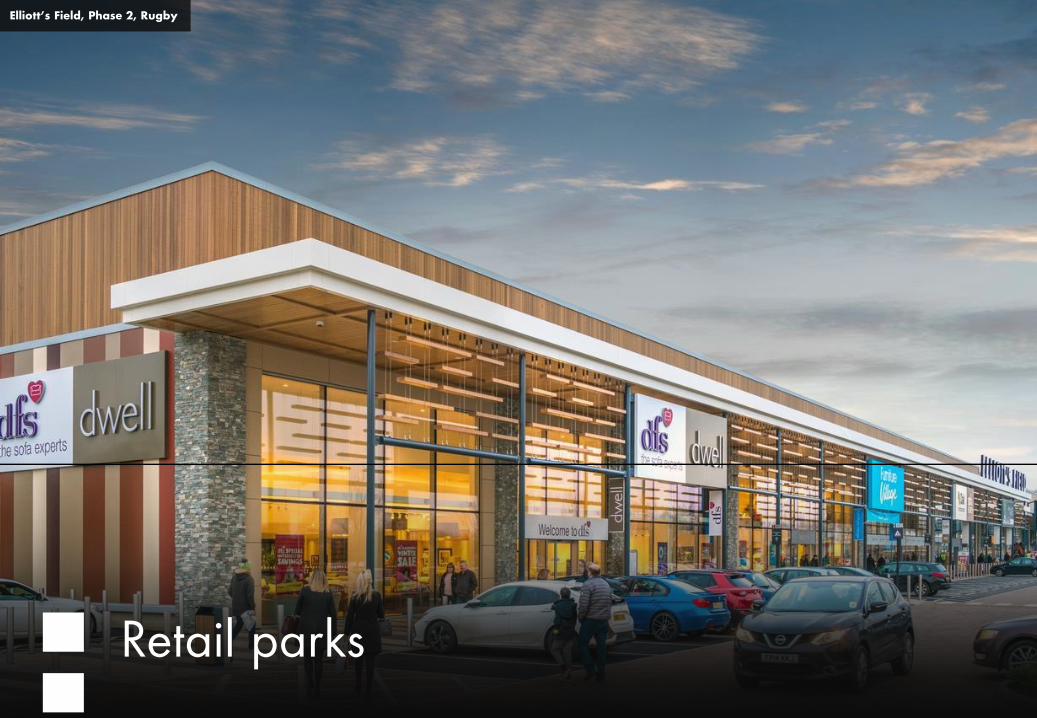
Retail parks
Elliott’s Field, Phase 2, Rugby
UK brands in administration 2008-12: MFI Barratt Shoes Woolworths Comet BHS La Senza
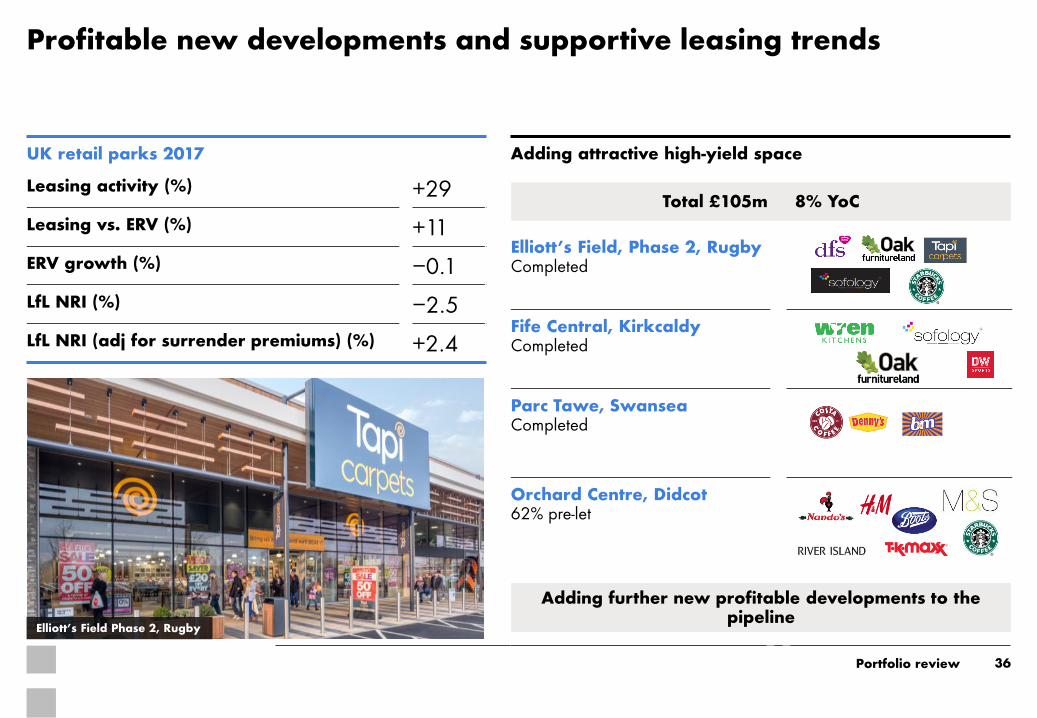
Profitable new developments and supportive leasing trends
Zweibrucken, Germany
[ ]% of Hammerson portfolio at time of
going into administration
New UK brands since 2012: Rituals LuLu Lemon
UK retail parks 2017
Leasing activity (%) +29
Leasing vs. ERV (%) +11
ERV growth (%) −0.1
LfL NRI (%) −2.5
LfL NRI (adj for surrender premiums) (%) +2.4
Elliott’s Field Phase 2, Rugby
36
With retail parks team to
populate
Portfolio review
Elliott’s Field, Phase 2, Rugby Completed
Fife Central, Kirkcaldy Completed
Parc Tawe, Swansea Completed
Orchard Centre, Didcot 62% pre-let
Adding further new profitable developments to the pipeline
Adding attractive high-yield space
Total £105m 8% YoC
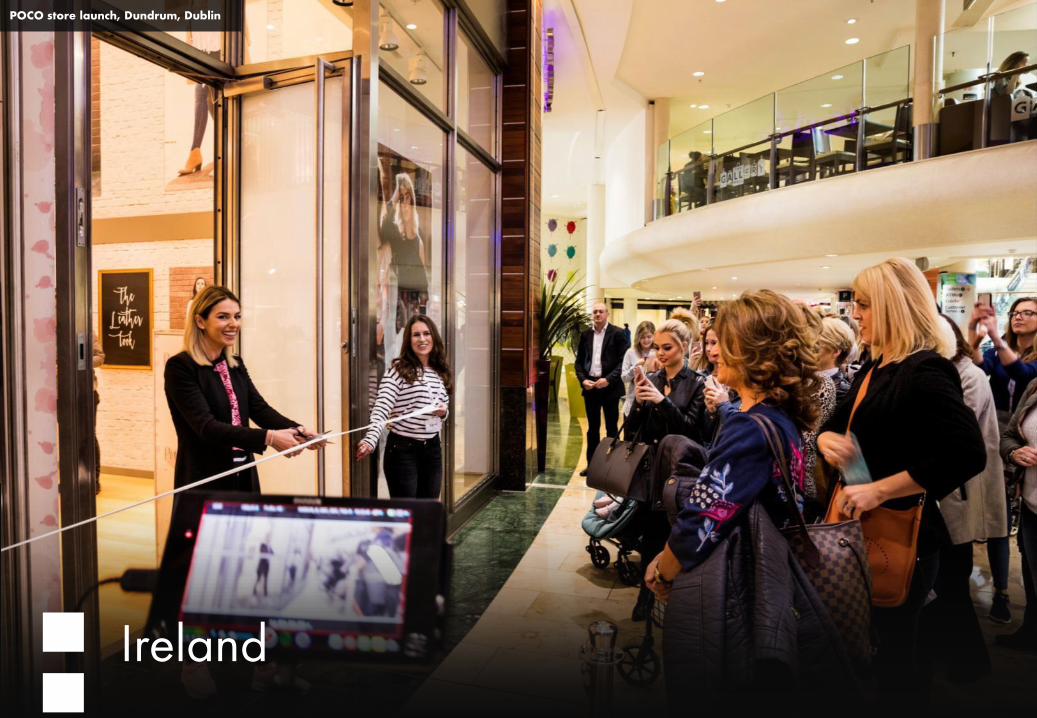
Ireland
POCO store launch, Dundrum, Dublin

20
40
60
80
100
120
Jan-
08
Jan-
09
Jan-
10
Jan-
11
Jan-
12
Jan-
13
Jan-
14
Jan-
15
Jan-
16
Jan-
17
Jan-
18
Consumer Sentiment Monthly Index
Hammerson Ireland portfolio 2017
Leasing vs. ERV (%) +10
ERV growth (%) +2.7
LfL NRI (%) +7.4
Confident consumer backdrop supports continued strong ERV growth
38
Uplift in Dundrum ERV since ownership (2)
Portfolio review
€65m
c.€90m
€9m
Acquisition ERVJuly 2016
Uplift at Dec2017
Expected growth2018-2021
Forecast 2021ERV
+13%
On track with targeted 4-5% ERV CAGR
Consumer confidence at record high (1)
(1) Source: KBC/ESRI (2) Dundrum ERV 100%

Delivering value-add asset management initiatives
39 (1) Cushman and Wakefield
On track with Ireland strategy
1. Short term: rent reviews, leasing and commercialisation
Best-practice customer experience initiatives
New brands introduced
2. Medium term: value-add asset management
Signed Fallon & Byrne food hall
Progressing with plans to redevelop Pavilions food court
Ongoing
3. Long-term: development
Masterplan at Dundrum phase 2. Target planning application 2019
Supportive Court of Appeal ruling at Dublin Central
Planning phase
Fallon & Byrne Food Hall 10,000 sq. ft. speciality food hall
Reconfiguration of Pembroke Square
2. Value-add asset management initiatives
Pavilions food court
Portfolio review
Three new restaurant units
Improving casual dining offer to drive dwell time
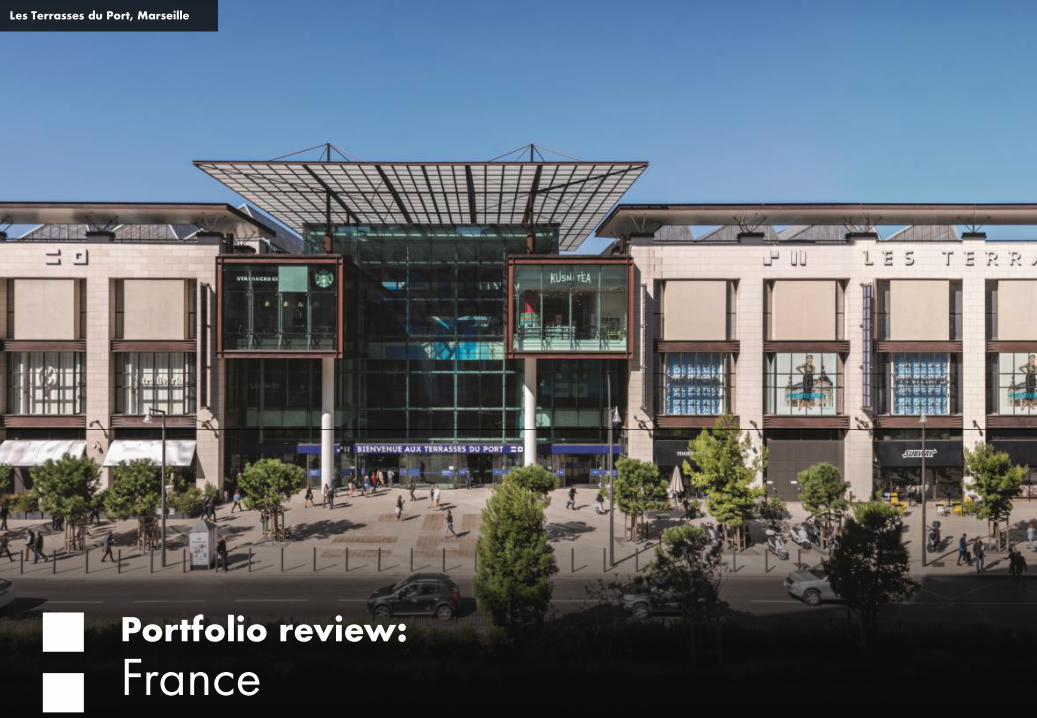
Les Terrasses du Port, Marseille
Portfolio review:
France
Image TBU

Growing consumer confidence translating into sales and footfall outperformance
(1) Source: INSEE (2) By volume (3) CNCC benchmark -1.0%
Consumer confidence index (1)
Portfolio review
Retail leasing index (ILC) (%) Hammerson in-store retail sales +0.1%
Benchmark: -1.0% (1)
Hammerson footfall +1.6%
Benchmark: -1.8% (2)
41
3.3
1.4
0.0 (0.2) 0.1 1.0
1.5
-0.5
0.0
0.5
1.0
1.5
2.0
2.5
3.0
3.5
2012 2013 2014 2015 2016 2017 Q1 2018
Hammerson France portfolio 2017
Leasing activity (%) (2) +9
Leasing vs. ERV (%) +5
ERV growth (%) +0.9
LfL NRI (%) +2.6
Instore retail sales (%) (3) +0.1
70
80
90
100
110
Jan-
13
Jul-1
3
Jan-
14
Jul-1
4
Jan-
15
Jul-1
5
Jan-
16
Jul-1
6
Jan-
17
Jul-1
7
Les Terrasses du Port, Marseille
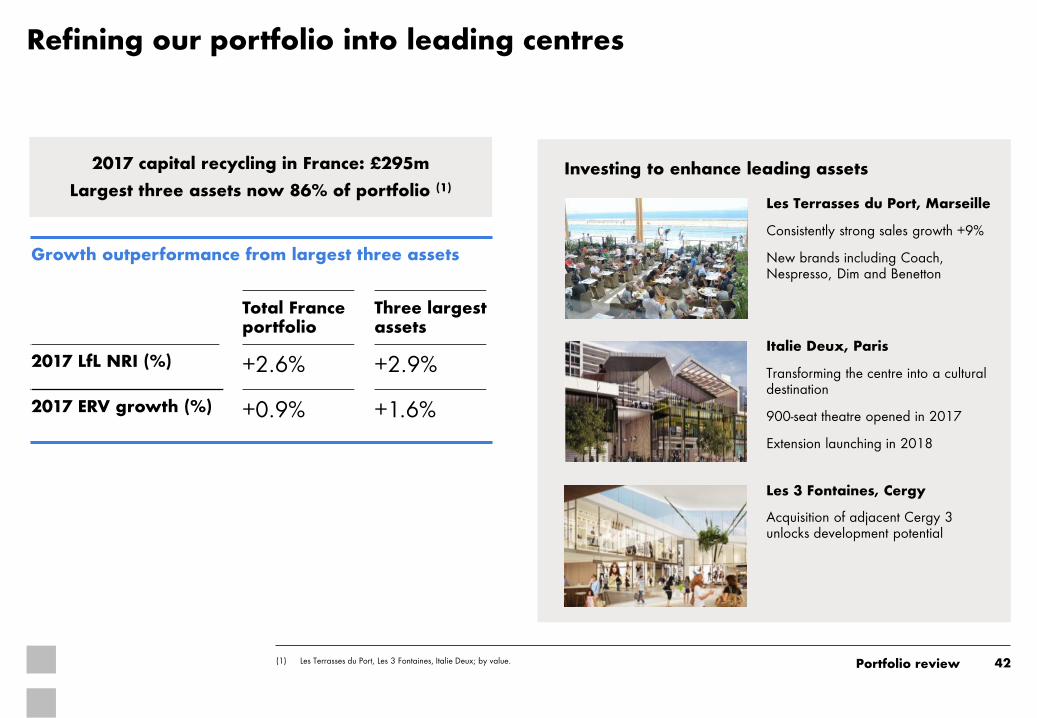
Refining our portfolio into leading centres
42 (1) Les Terrasses du Port, Les 3 Fontaines, Italie Deux; by value.
Investing to enhance leading assets
Les 3 Fontaines, Cergy
Acquisition of adjacent Cergy 3 unlocks development potential
Italie Deux, Paris
Transforming the centre into a cultural destination
900-seat theatre opened in 2017
Extension launching in 2018
Les Terrasses du Port, Marseille
Consistently strong sales growth +9%
New brands including Coach, Nespresso, Dim and Benetton
Portfolio review
Growth outperformance from largest three assets
Total France portfolio
Three largest assets
2017 LfL NRI (%) +2.6% +2.9%
2017 ERV growth (%) +0.9% +1.6%
2017 capital recycling in France: £295m
Largest three assets now 86% of portfolio (1)

Size Size
Italie Deux, Paris Les 3 Fontaines, Cergy
Progressing with key development projects
Co-ownership agreement, building permit and retail consent obtained
Acquired adjacent centre, Cergy 3
Main contractor selected
Good pre-letting to fashion brands and F&B (Pret A Manger, Vapiano)
Project commenced
43
Italie Deux, Paris
Les Trois Fontaines, Cergy
Portfolio review
33,000m2 Total development cost
£225m
6,400m2 Total development cost
£38m
Project to enhance tenant mix and F&B offer at central Paris scheme
Obtained planning consent and agreement with co-owners
Pre-lets include Pret A Manger and M&S Simply Food
Start on site Spring 2018 Target rent
£16m Target rent
£2m
44
04 Transaction update and conclusion
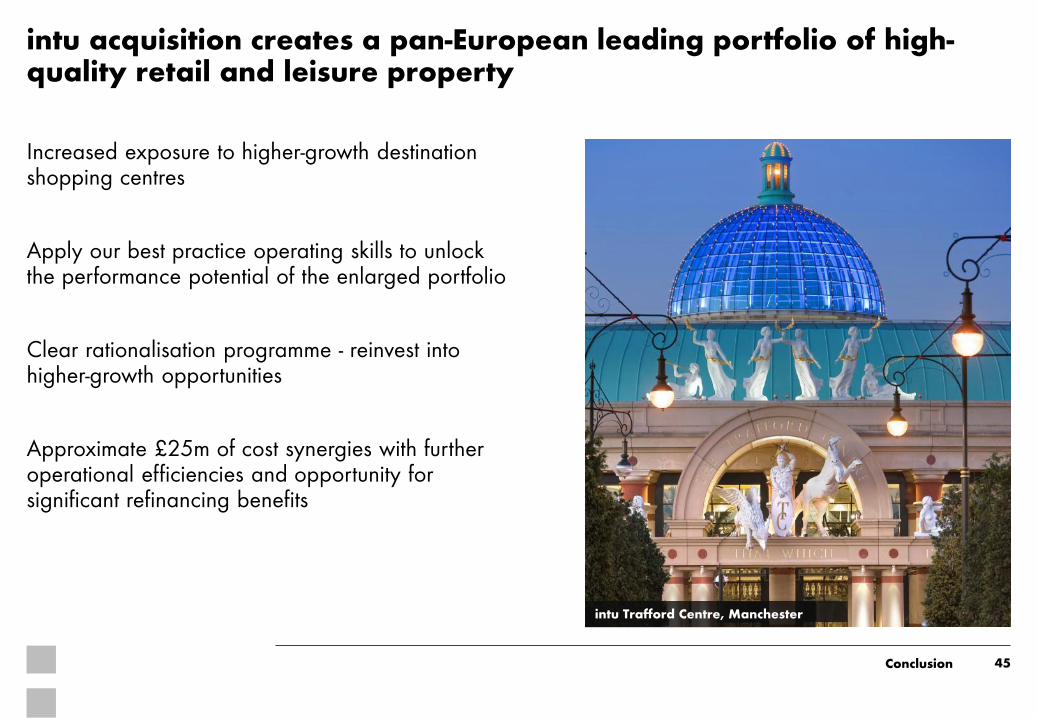
intu acquisition creates a pan-European leading portfolio of high-quality retail and leisure property
45 Conclusion
intu Trafford Centre, Manchester
Increased exposure to higher-growth destination shopping centres
Apply our best practice operating skills to unlock the performance potential of the enlarged portfolio
Clear rationalisation programme - reinvest into higher-growth opportunities
Approximate £25m of cost synergies with further operational efficiencies and opportunity for significant refinancing benefits

Advancing the intu acquisition
46
Shareholder documentation and approval process
Q1 2018 Q2 2018 Q3 2018
Integration
Competition
Shareholder meetings
Year-end company accounts
Combined accounts + shareholder docs
Asset strategy planning
Integration strategy planning
Pre-close integration preparation
Preparatory merger work and planning
Pre-notification engagement with CMA
Q4 2018 Material progress toward the acquisition • Shareholder approval process
• [Met with X% of combined shareholder register]
• Pro-forma combined accounts in preparation • Shareholder documentation to be published
[date] • EGM and shareholder vote scheduled [date]
• Operational • Asset strategy planning started • Commencement of brand review
• Competition • Market reviews and catchment surveys
ongoing • Engaged with the CMA to commence
clearance process • Reviewing learnings from recent Grand
Central transaction (1)
Next steps… • Shareholder documentation published • EGM and vote • CMA commence Phase 1 review process
[See Appendix for timetable of dates]
Publish shareholder documents EGM
CMA Review
Conclusion

Our strategy continues to deliver success
47
Strong financial performance; positioned for structural change in retail
High demand for our premium retail destinations
Strengthening quality and future opportunities through intu acquisition
Victoria, Leeds
Conclusion

48
Questions
Westquay, Southampton

Disclaimer
This presentation contains certain statements that are neither financial results nor other
historical information. These statements are forward-looking in nature and are subject to
risks and uncertainties. Actual future results may differ materially from those expressed or
implied by these statements.
Many of these risks and uncertainties relate to factors that are beyond Hammerson’s
ability to control or estimate precisely, such as future market conditions, currency
fluctuations, the behaviour of other market participants, the actions of governmental
regulators and other risk factors such as the Company’s ability to continue to obtain
financing to meet its liquidity needs, changes in the political, social or regulatory
framework in which the Company operates or in economic or technological trends or
conditions, including inflation and consumer confidence, on a global, national or
regional basis.
Readers are cautioned not to place undue reliance on these forward-looking statements,
which speak only as of the date of this document. Hammerson does not undertake any
obligation to publicly release any revision to these forward-looking statements to reflect
events or circumstances after the date of these materials. Information contained in this
presentation relating to the company or its share price, or the yield on its shares, should
not be relied upon as a guide to future performance.
49

Appendices
Image TBU

2.3m sq m retail space
14 Countries
UK shopping centres - £3.5bn
France - £1.9bn
Ireland - £1.0bn
UK retail parks - £1.2bn
Premium outlets - £2.2bn
Development & UK other - £0.8bn
£10.6 billion leading pan-European retail platform (1)
51
33%
18% 9%
12%
21%
7%
57 European shopping destinations
Top 3 Market position in all chosen sectors
43% non-UK assets
440m visitors
4,900 Tenants
11 - UK shopping centres
8 - France shopping centres
3 - Ireland shopping centres
15 - UK retail parks
20 - Premium outlets
(1) As at 31 December 2017
TBU
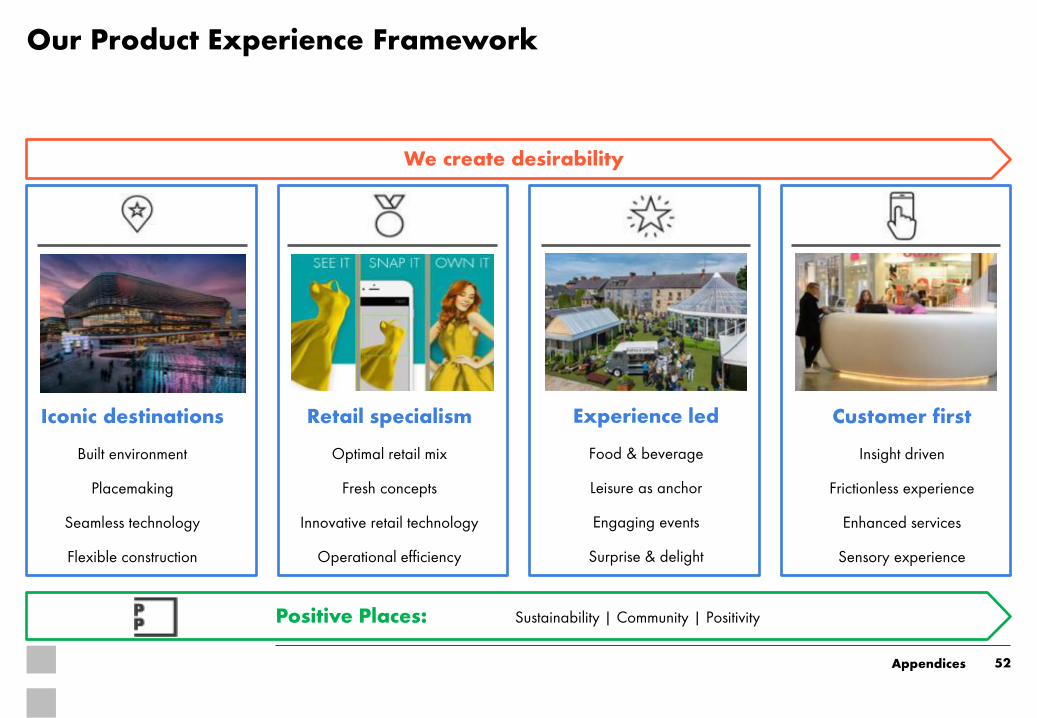
Our Product Experience Framework
52
We create desirability
Iconic destinations
Built environment
Placemaking
Seamless technology
Flexible construction
Customer first
Insight driven
Frictionless experience
Enhanced services
Sensory experience
Experience led
Food & beverage
Leisure as anchor
Engaging events
Surprise & delight
Retail specialism
Optimal retail mix
Fresh concepts
Innovative retail technology
Operational efficiency
Positive Places: Sustainability | Community | Positivity
Appendices

Examples of our Framework in action
53 (1) UK shopping centre portfolio
Victoria Gate awarded Best Shopping Centre at the MIPIM
& MAPIC Awards
New leisure extension & events space at Westquay South attracted over 3.4m visitors
across 2017
Delivered 20 new brands in 2017 across the portfolio(!), including the first VW brand
experience
Launch of Style Seeker AI visual search tool with 90k product impressions since November
2017
Christmas light switch on at Cabot drove a 10.6% increase in daily sales & reached 95k
Facebook users
Award winning Garden of Pure Imagination at Dundrum drove
an 8% uplift in footfall
Nearly 450k downloads of the Plus app with over 3.3m app
opens since launch
Over 130k click & collect parcels handled across our UK
& French centres in 2017
Iconic destinations Retail specialism Experience led Customer first
Appendices
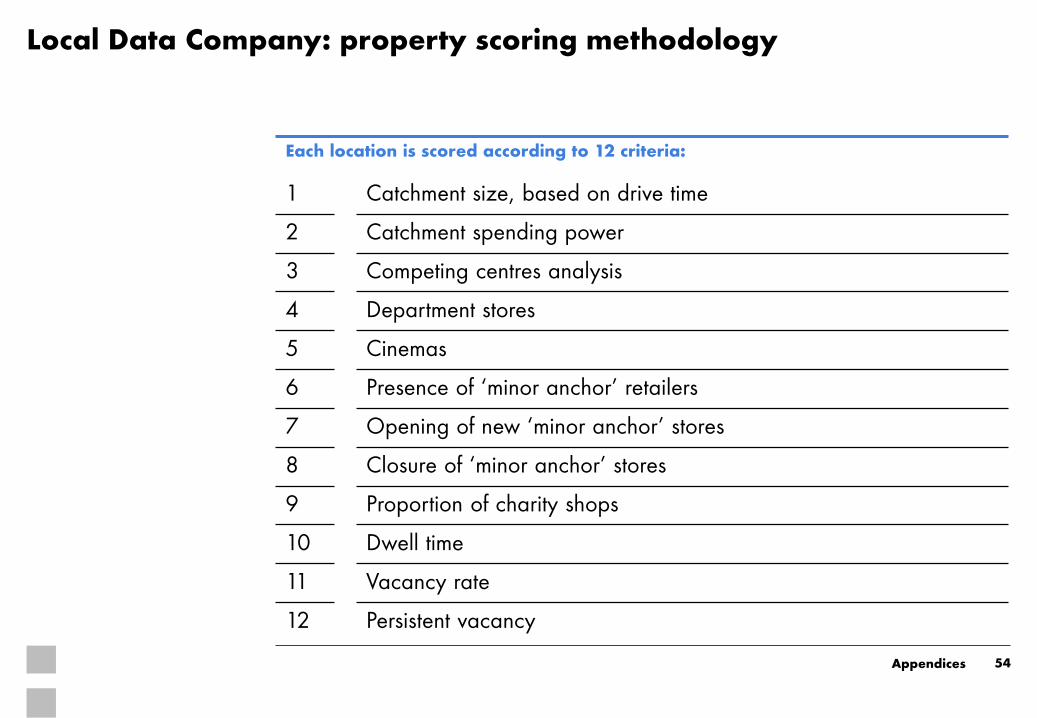
Local Data Company: property scoring methodology
Each location is scored according to 12 criteria:
1 Catchment size, based on drive time
2 Catchment spending power
3 Competing centres analysis
4 Department stores
5 Cinemas
6 Presence of ‘minor anchor’ retailers
7 Opening of new ‘minor anchor’ stores
8 Closure of ‘minor anchor’ stores
9 Proportion of charity shops
10 Dwell time
11 Vacancy rate
12 Persistent vacancy
54 Appendices

Value Retail Villages VIA Outlets centres
Bicester Village, Oxford
GLA: 28,000m2
Boutiques: 157
Batavia Stad Amsterdam Fashion Outlet
GLA: 31,900m2 Units: 119
La Roca Village, Barcelona GLA: 23,500m2 Boutiques: 136
Fashion Arena Prague Outlet GLA: 24,000m2 Units: 99
Las Rozas Village, Madrid GLA: 16,500m2 Boutiques: 102
Freeport Lisbon Fashion Outlet GLA: 35,700m2 Units: 142
La Vallée Village, Paris GLA: 21,900m2 Boutiques: 107
Hede Fashion Outlet, Gothenburg GLA: 16,300m2 Units: 53
Maasmechelen Village, Brussels GLA: 19,800m2 Boutiques: 104
Landquart Fashion Outlet, Zürich GLA: 20,900m2 Units: 75
Fidenza Village, Milan GLA: 20,900m2 Boutiques: 117
Mallorca Fashion Outlet GLA: 33,200m2 Units: 75
Wertheim Village, Frankfurt GLA: 21,200m2 Boutiques: 117
Seville Fashion Outlet GLA: 16,400m2 Units: 62
Ingolstadt Village, Munich GLA: 21,100m2 Boutiques: 112
Wroclaw Fashion Outlet, Poland GLA: 13,700m2 Units: 89
Kildare Village, Dublin GLA: 16,700m2 Boutiques: 91
Zweibrücken Fashion Outlet, Germany GLA: 29,300m2 Units: 112
Vila do Conde Porto Fashion Outlet GLA: 27,800m2 Units: 123
Norwegian Outlet, Oslo GLA: 13,300m2 Units: 77
55
Premium outlets portfolio
Appendices

Hammerson’s total investment in Value Retail (1)
Holding companies 25% equity
Bicester Village
36
50
La Roca Village
26
39
Las Rozas Village
23
35
La Vallée Village
14
26
Maasmechelen Village
14
27
Fidenza Village
23
35
Wertheim Village
33
45
Ingolstadt Village
2
14
Kildare Village
28
41
56 (1) Pro-forma for February 2018 acquisition of LP economic interests (2) Total Village ownership calculated as economic entitlement of directly held and indirectly held interests
Village ownership via LPs (%)
Total Village ownership (%) (2)
Hammerson €2m shareholder loan
Appendices

2017 operational statistics
57 (1) Retail sales on same-centre basis, includes all shopping centres. 2017 UK benchmark -3.0% (Source: Visa Face to Face index); 2017 France benchmark -1.0% (Source: CNCC)
(2) 2017 UK benchmark -2.8% (Source: Tyco Shoppertrak); 2017 France benchmark -1.8% (Source: CNCC) (3) Excludes anchor stores. France data includes VAT (rent:sales and OCR) (4) Excludes anchor stores. France data includes VAT; Jeu de Paume, Beauvais, excluded
Appendices
Occupancy (%) UK shopping centres
UK retail parks
France Ireland Group
31 December 2017 98.1 99.4 97.9 99.7 98.3
30 June 2017 97.2 99.0 96.6 99.9 97.3
31 December 2016 97.8 98.6 96.5 99.5 97.5
UK shopping centres
France
Sales (1) –2.7% 0.1%
Footfall (2) 0.4% 1.6%
Rent:sales (3) 13.3% 11.0%
OCR (3) 21.7% 13.8%
Sales densities(4)
UK £/ft2
France £/ft2
2017 240 – 490 395 – 620
2016 250 – 515 350 – 715
2015 250 – 520 355 – 725 Check number
TBU Add benchmark
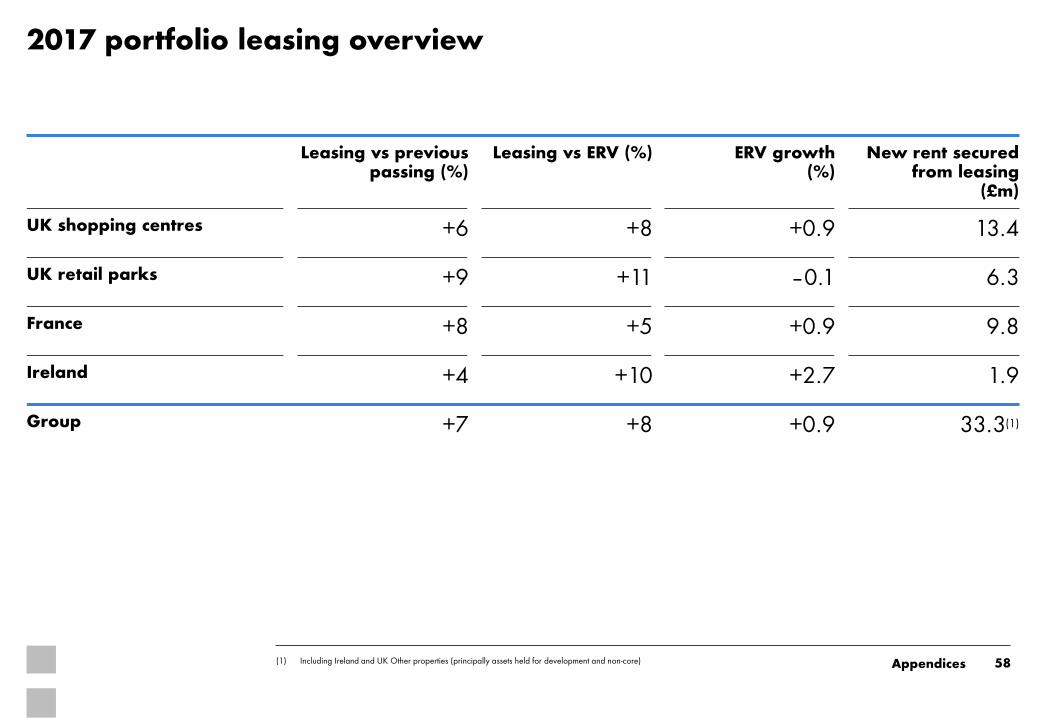
2017 portfolio leasing overview
58 (1) Including Ireland and UK Other properties (principally assets held for development and non-core)
Leasing vs previous passing (%)
Leasing vs ERV (%) ERV growth (%)
New rent secured from leasing
(£m)
UK shopping centres +6 +8 +0.9 13.4
UK retail parks +9 +11 –0.1 6.3
France +8 +5 +0.9 9.8
Ireland +4 +10 +2.7 1.9
Group +7 +8 +0.9 33.3(1)
Appendices
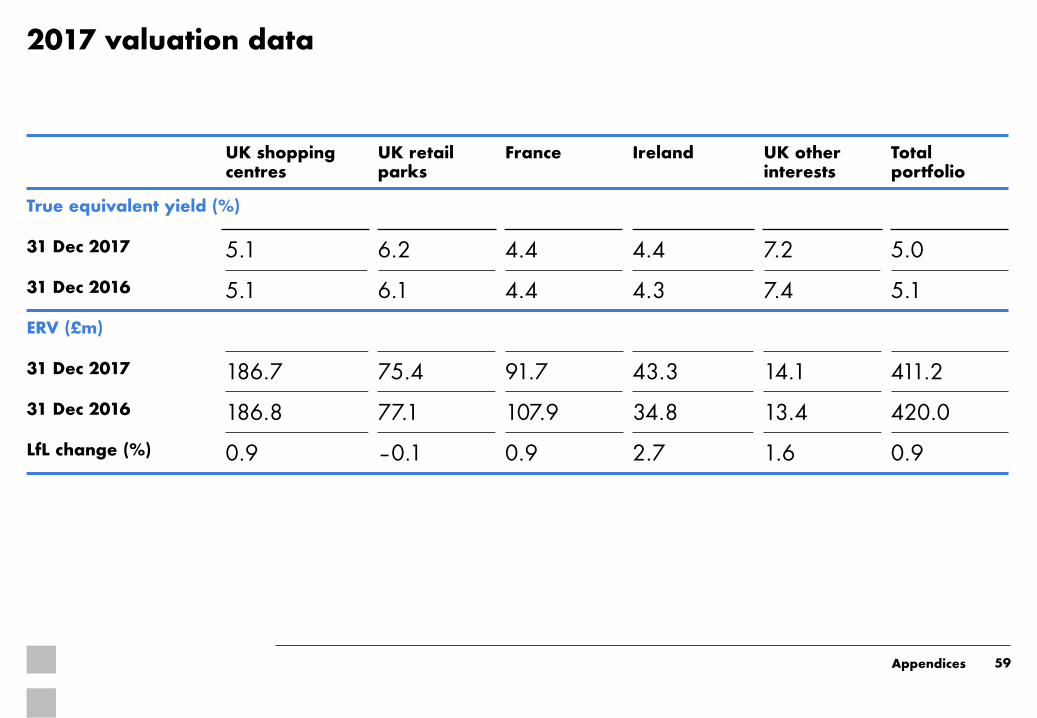
2017 valuation data
59
UK shopping centres
UK retail parks
France Ireland UK other interests
Total portfolio
True equivalent yield (%)
31 Dec 2017 5.1 6.2 4.4 4.4 7.2 5.0
31 Dec 2016 5.1 6.1 4.4 4.3 7.4 5.1
ERV (£m)
31 Dec 2017 186.7 75.4 91.7 43.3 14.1 411.2
31 Dec 2016 186.8 77.1 107.9 34.8 13.4 420.0
LfL change (%) 0.9 –0.1 0.9 2.7 1.6 0.9
Appendices
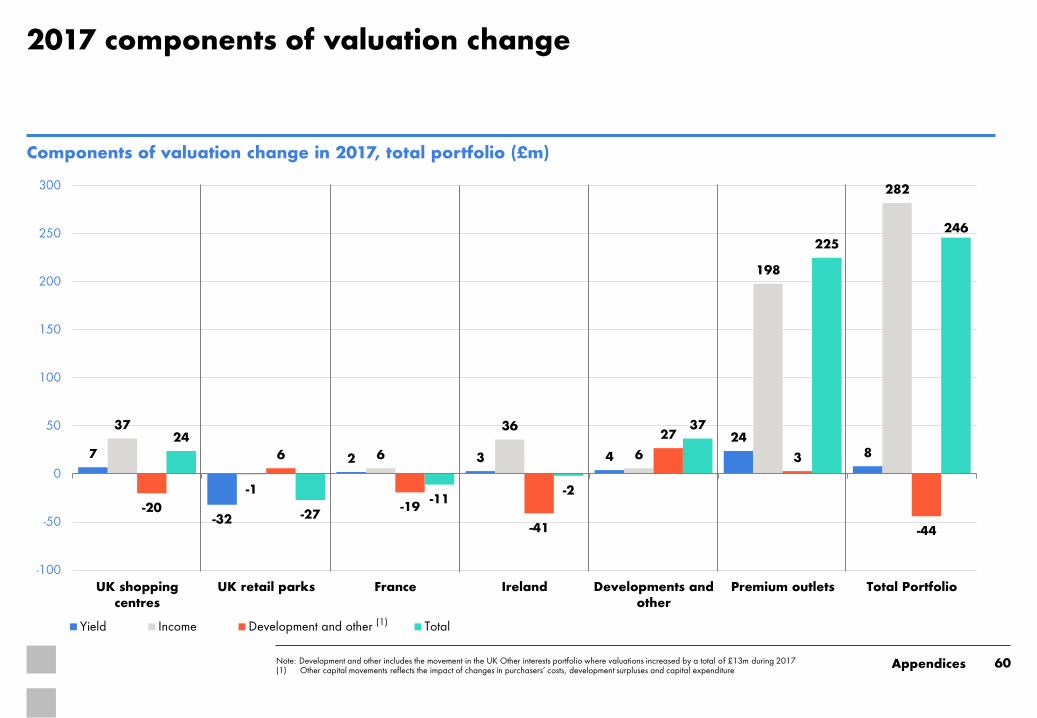
2017 components of valuation change
60 Note: Development and other includes the movement in the UK Other interests portfolio where valuations increased by a total of £13m during 2017 (1) Other capital movements reflects the impact of changes in purchasers’ costs, development surpluses and capital expenditure
Components of valuation change in 2017, total portfolio (£m)
7
-32
2 3 4
24 8
37
-1
6
36
6
198
282
-20
6
-19
-41
27
3
-44
24
-27 -11
-2
37
225 246
-100
-50
0
50
100
150
200
250
300
UK shoppingcentres
UK retail parks France Ireland Developments andother
Premium outlets Total Portfolio
Yield Income Development and other Total
Appendices
(1)
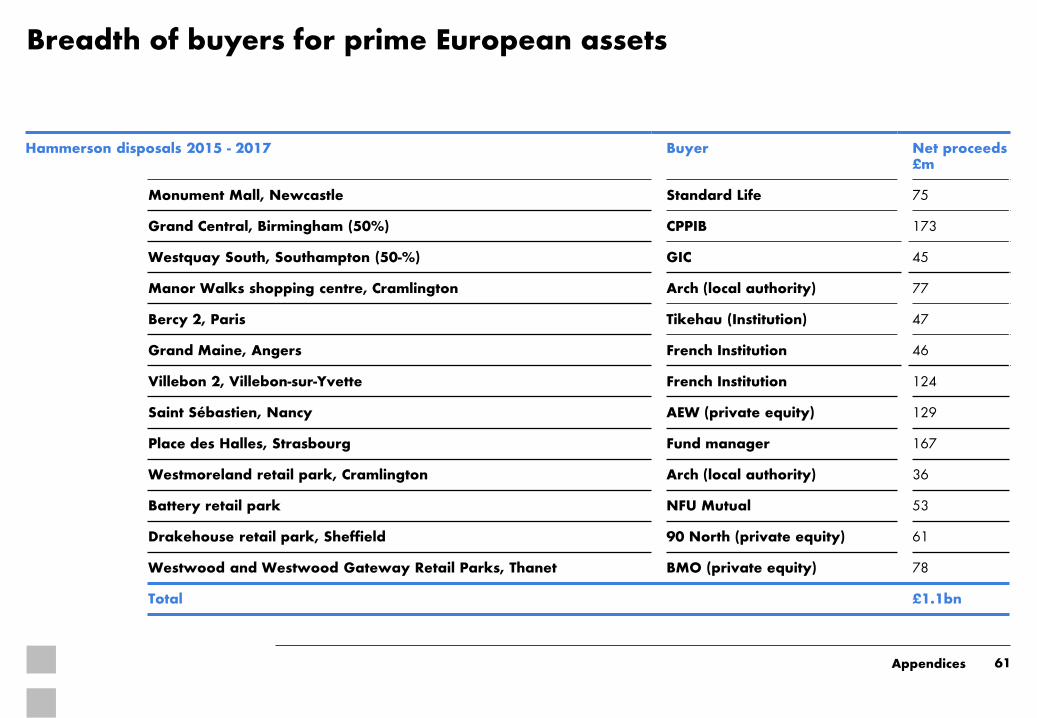
Breadth of buyers for prime European assets
61
Hammerson disposals 2015 - 2017 Buyer Net proceeds £m
Monument Mall, Newcastle Standard Life 75
Grand Central, Birmingham (50%) CPPIB 173
Westquay South, Southampton (50-%) GIC 45
Manor Walks shopping centre, Cramlington Arch (local authority) 77
Bercy 2, Paris Tikehau (Institution) 47
Grand Maine, Angers French Institution 46
Villebon 2, Villebon-sur-Yvette French Institution 124
Saint Sébastien, Nancy AEW (private equity) 129
Place des Halles, Strasbourg Fund manager 167
Westmoreland retail park, Cramlington Arch (local authority) 36
Battery retail park NFU Mutual 53
Drakehouse retail park, Sheffield 90 North (private equity) 61
Westwood and Westwood Gateway Retail Parks, Thanet BMO (private equity) 78
Total £1.1bn
Appendices
Arch – Local Authority (Cramlington, £87m)
Arch – Local Authority (Westmoreland, £36m)
BMO – PE (Thanet, £78m)
NFU Mutual – institution (Battery, £53m)
Drakehouse retial park (90 North – PE £59m)

Hammerson and intu capex 2018-2020
62
Hammerson (£m) 2018 2019 2020
Brent Cross extension 67 94 96
Highcross reconfiguration, Leicester 14 2 0
Whitgift, Croydon 30 10 11
Retail parks schemes 48 34 9
Les 3 Fontaines, Cergy 70 61 56
Italie 2, Paris 35 20 5
Total Hammerson 264 221 176
Intu (£m) 2018 2019 2020
intu Trafford Centre 25 47
intu Watford 77 3
intu Lakeside 52 50
intu Spain 23 157 217
Total intu 177 257 217
2018-2020 1,300
Run-rate 440
Appendices
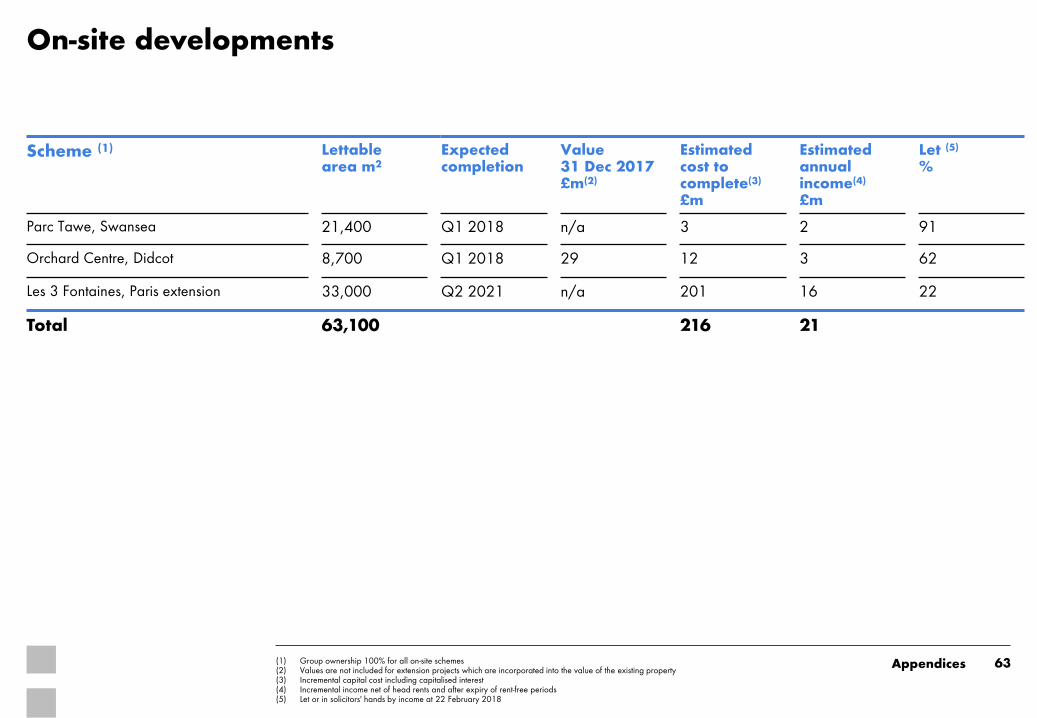
On-site developments
Scheme (1) Lettable area m2
Expected completion
Value 31 Dec 2017 £m(2)
Estimated cost to complete(3)
£m
Estimated annual income(4)
£m
Let (5)
%
Parc Tawe, Swansea 21,400 Q1 2018 n/a 3 2 91
Orchard Centre, Didcot 8,700 Q1 2018 29 12 3 62
Les 3 Fontaines, Paris extension 33,000 Q2 2021 n/a 201 16 22
Total 63,100 216 21
63 (1) Group ownership 100% for all on-site schemes (2) Values are not included for extension projects which are incorporated into the value of the existing property (3) Incremental capital cost including capitalised interest (4) Incremental income net of head rents and after expiry of rent-free periods (5) Let or in solicitors' hands by income at 22 February 2018
Appendices
NB aligned with final press
release
TBC
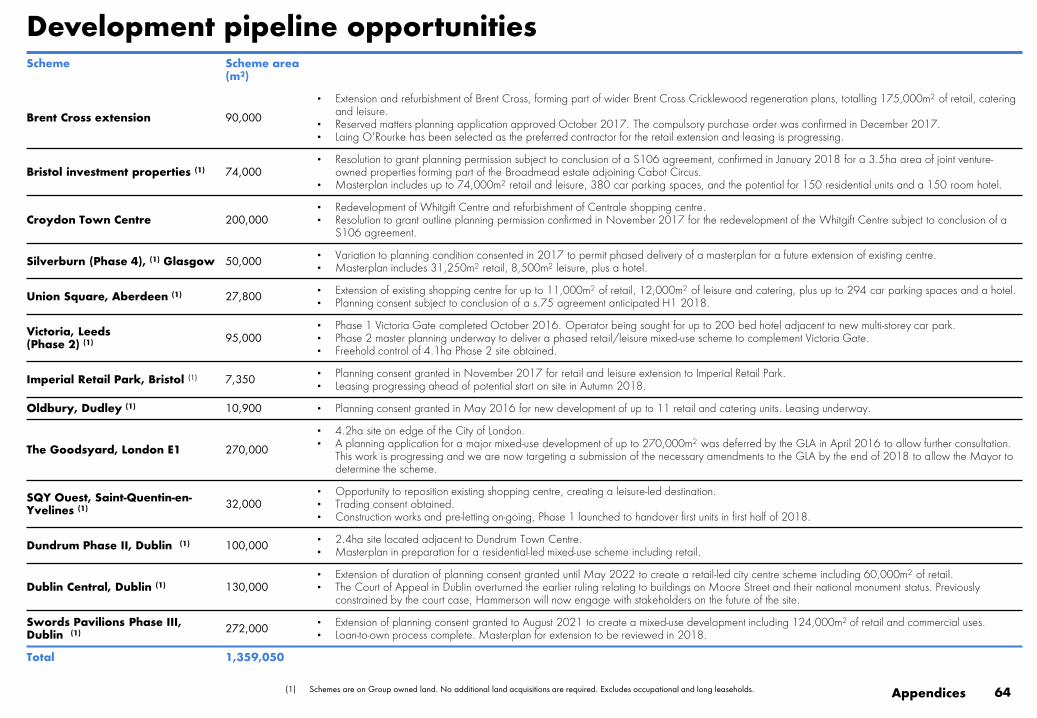
Scheme Scheme area (m2)
Brent Cross extension 90,000
• Extension and refurbishment of Brent Cross, forming part of wider Brent Cross Cricklewood regeneration plans, totalling 175,000m2 of retail, catering and leisure.
• Reserved matters planning application approved October 2017. The compulsory purchase order was confirmed in December 2017. • Laing O'Rourke has been selected as the preferred contractor for the retail extension and leasing is progressing.
Bristol investment properties (1) 74,000 • Resolution to grant planning permission subject to conclusion of a S106 agreement, confirmed in January 2018 for a 3.5ha area of joint venture-
owned properties forming part of the Broadmead estate adjoining Cabot Circus. • Masterplan includes up to 74,000m2 retail and leisure, 380 car parking spaces, and the potential for 150 residential units and a 150 room hotel.
Croydon Town Centre 200,000 • Redevelopment of Whitgift Centre and refurbishment of Centrale shopping centre. • Resolution to grant outline planning permission confirmed in November 2017 for the redevelopment of the Whitgift Centre subject to conclusion of a
S106 agreement.
Silverburn (Phase 4), (1) Glasgow 50,000 • Variation to planning condition consented in 2017 to permit phased delivery of a masterplan for a future extension of existing centre. • Masterplan includes 31,250m2 retail, 8,500m2 leisure, plus a hotel.
Union Square, Aberdeen (1) 27,800 • Extension of existing shopping centre for up to 11,000m2 of retail, 12,000m2 of leisure and catering, plus up to 294 car parking spaces and a hotel. • Planning consent subject to conclusion of a s.75 agreement anticipated H1 2018.
Victoria, Leeds (Phase 2) (1) 95,000
• Phase 1 Victoria Gate completed October 2016. Operator being sought for up to 200 bed hotel adjacent to new multi-storey car park. • Phase 2 master planning underway to deliver a phased retail/leisure mixed-use scheme to complement Victoria Gate. • Freehold control of 4.1ha Phase 2 site obtained.
Imperial Retail Park, Bristol (1) 7,350 • Planning consent granted in November 2017 for retail and leisure extension to Imperial Retail Park. • Leasing progressing ahead of potential start on site in Autumn 2018.
Oldbury, Dudley (1) 10,900 • Planning consent granted in May 2016 for new development of up to 11 retail and catering units. Leasing underway.
The Goodsyard, London E1 270,000
• 4.2ha site on edge of the City of London. • A planning application for a major mixed-use development of up to 270,000m2 was deferred by the GLA in April 2016 to allow further consultation.
This work is progressing and we are now targeting a submission of the necessary amendments to the GLA by the end of 2018 to allow the Mayor to determine the scheme.
SQY Ouest, Saint-Quentin-en-Yvelines (1) 32,000
• Opportunity to reposition existing shopping centre, creating a leisure-led destination. • Trading consent obtained. • Construction works and pre-letting on-going, Phase 1 launched to handover first units in first half of 2018.
Dundrum Phase II, Dublin (1) 100,000 • 2.4ha site located adjacent to Dundrum Town Centre. • Masterplan in preparation for a residential-led mixed-use scheme including retail.
Dublin Central, Dublin (1) 130,000 • Extension of duration of planning consent granted until May 2022 to create a retail-led city centre scheme including 60,000m2 of retail. • The Court of Appeal in Dublin overturned the earlier ruling relating to buildings on Moore Street and their national monument status. Previously
constrained by the court case, Hammerson will now engage with stakeholders on the future of the site.
Swords Pavilions Phase III, Dublin (1) 272,000
• Extension of planning consent granted to August 2021 to create a mixed-use development including 124,000m2 of retail and commercial uses. • Loan-to-own process complete. Masterplan for extension to be reviewed in 2018.
Total 1,359,050
Development pipeline opportunities
(1) Schemes are on Group owned land. No additional land acquisitions are required. Excludes occupational and long leaseholds.
64 Appendices
NB aligned with final press
release
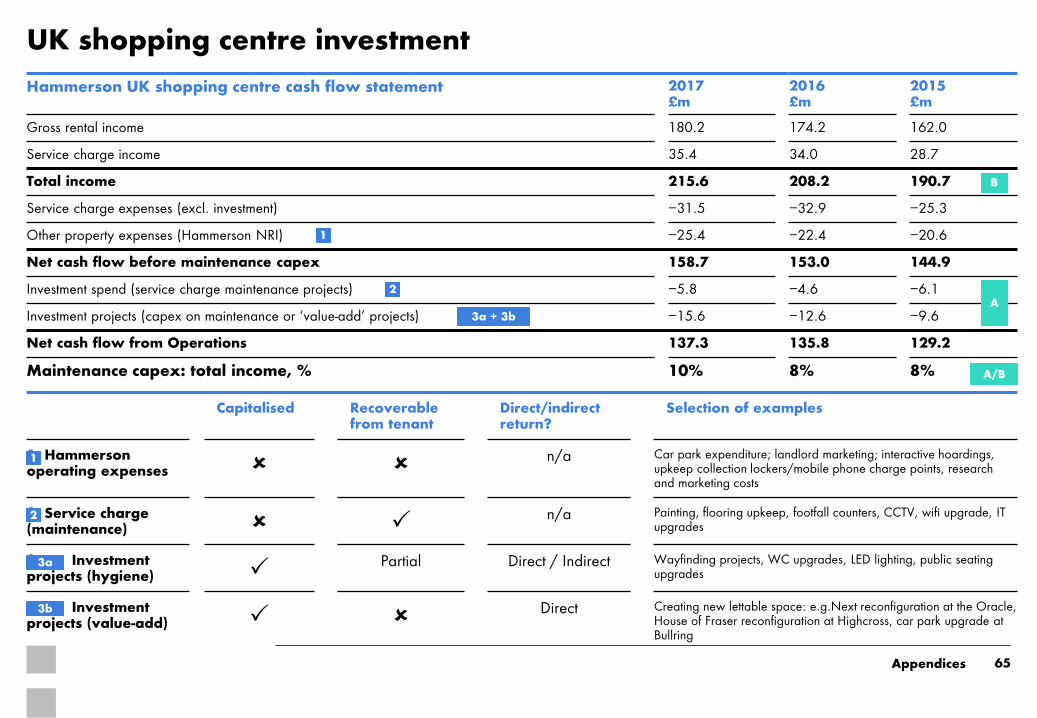
UK shopping centre investment
65
Capitalised Recoverable from tenant
Direct/indirect return?
Selection of examples
1. Hammerson operating expenses n/a Car park expenditure; landlord marketing; interactive hoardings,
upkeep collection lockers/mobile phone charge points, research and marketing costs
2. Service charge (maintenance) n/a Painting, flooring upkeep, footfall counters, CCTV, wifi upgrade, IT
upgrades
3.a Investment projects (hygiene) Partial Direct / Indirect Wayfinding projects, WC upgrades, LED lighting, public seating
upgrades
3.B Investment projects (value-add) Direct Creating new lettable space: e.g.Next reconfiguration at the Oracle,
House of Fraser reconfiguration at Highcross, car park upgrade at Bullring
2014 2015 2016Ref £m £m £m
Gross rental income 149.4 162.0 174.2Service charge income 27.0 28.7 34.0Total income 176.4 190.7 208.2Service charge expenses (excl. maintenance capex) (23.5) (25.3) (32.9)
1 Other property expenses (Hammerson NRI) (19.4) (20.6) (22.4)Net cash flow before maintenance capex 133.5 144.9 153.0
2 Maintenance capex - service charge (Service charge P&L) (5.6) (6.1) (4.6)3 Maintenance capex - land and buildings (Hammerson L&B) (9.7) (9.6) (12.6)
Net "cash flow" from Operations 118.2 129.2 135.8Maintenance capex:Total income, % 9% 8% 8%
Hammerson UK shopping centre cash flow statement 2017 £m
2016 £m
2015 £m
Gross rental income 180.2 174.2 162.0
Service charge income 35.4 34.0 28.7
Total income 215.6 208.2 190.7
Service charge expenses (excl. investment) −31.5 −32.9 −25.3
Other property expenses (Hammerson NRI) −25.4 −22.4 −20.6
Net cash flow before maintenance capex 158.7 153.0 144.9
Investment spend (service charge maintenance projects) −5.8 −4.6 −6.1
Investment projects (capex on maintenance or ‘value-add’ projects) −15.6 −12.6 −9.6
Net cash flow from Operations 137.3 135.8 129.2
Maintenance capex: total income, % 10% 8% 8%
1
2
3a + 3b
1
2
A
B
A/B
3a
3b
Appendices

31 Dec 2017
Net debt
Reported (£m) Fully proportionally consolidated (£m)
Group 3,501 3,501
VIA Outlets - 174
Value Retail - 512
Loan 3,501 4,187
Property values
Group 8,326 8,326
VIA Outlets - 600
Value Retail - 1,634
Less minority interest (14) (14)
VIA Outlets net assets 361 -
Value Retail net assets 1,069 -
Value 9,742 10,546
LTV 36% 40%
LTV methodology
66 Appendices

67
0
100
200
300
400
500
600
700
800
900
1000
2018 2019 2020 2021 2022 2023 2024 2025 2026 2027 2028 2029 2030 2031
Revolving credit facilities
Private placement
Sterling bonds
Euro bonds
Secured debt
Debt maturity profile 31 December 2017 (£m) Continuing to take advantage of refinancing opportunities
TBU
Appendices
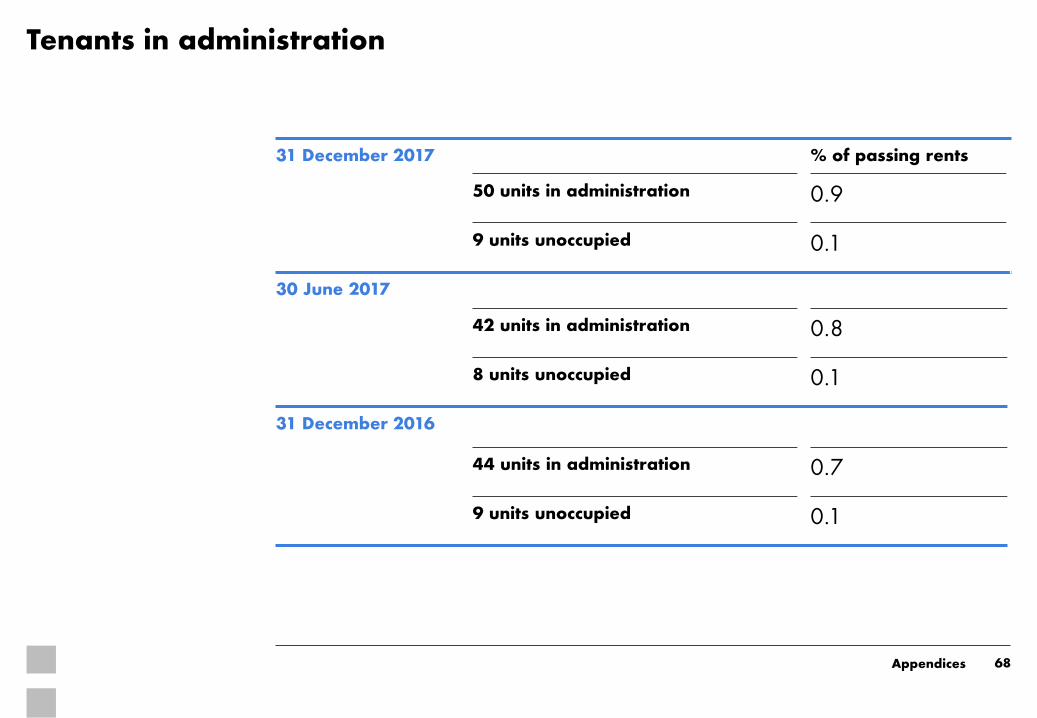
Tenants in administration
68
31 December 2017 % of passing rents
50 units in administration 0.9
9 units unoccupied 0.1
30 June 2017
42 units in administration 0.8
8 units unoccupied 0.1
31 December 2016
44 units in administration 0.7
9 units unoccupied 0.1
Appendices
TBC
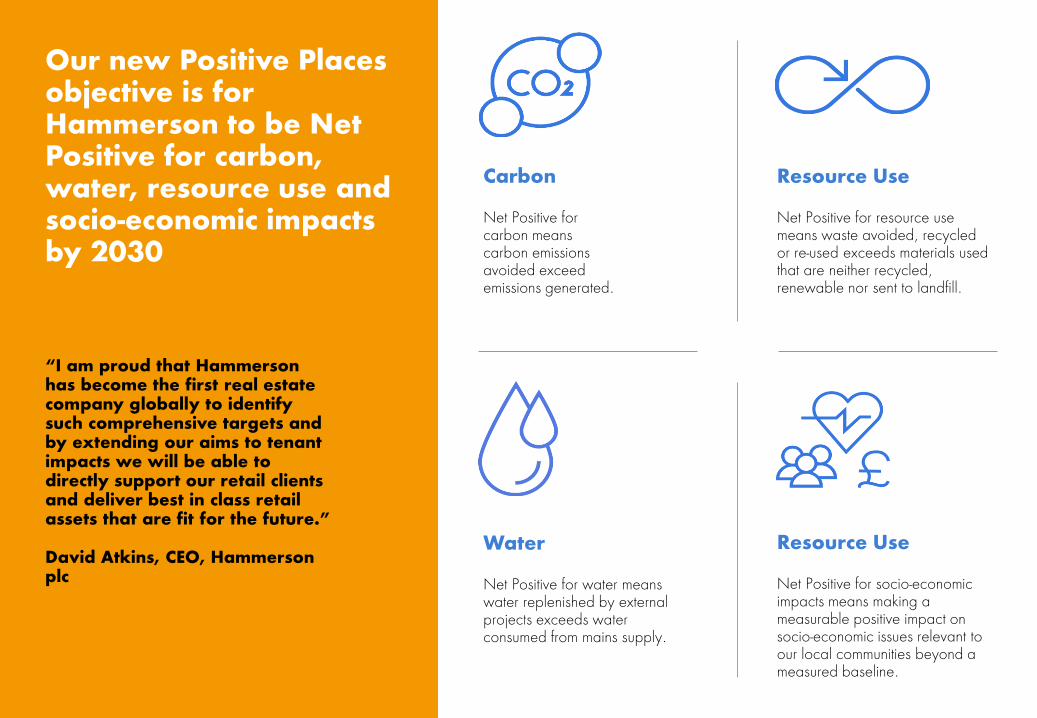
Our new Positive Places objective is for Hammerson to be Net Positive for carbon, water, resource use and socio-economic impacts by 2030
Carbon Net Positive for carbon means carbon emissions avoided exceed emissions generated.
Resource Use Net Positive for resource use means waste avoided, recycled or re-used exceeds materials used that are neither recycled, renewable nor sent to landfill.
Water Net Positive for water means water replenished by external projects exceeds water consumed from mains supply.
Resource Use Net Positive for socio-economic impacts means making a measurable positive impact on socio-economic issues relevant to our local communities beyond a measured baseline.
“I am proud that Hammerson has become the first real estate company globally to identify such comprehensive targets and by extending our aims to tenant impacts we will be able to directly support our retail clients and deliver best in class retail assets that are fit for the future.” David Atkins, CEO, Hammerson plc
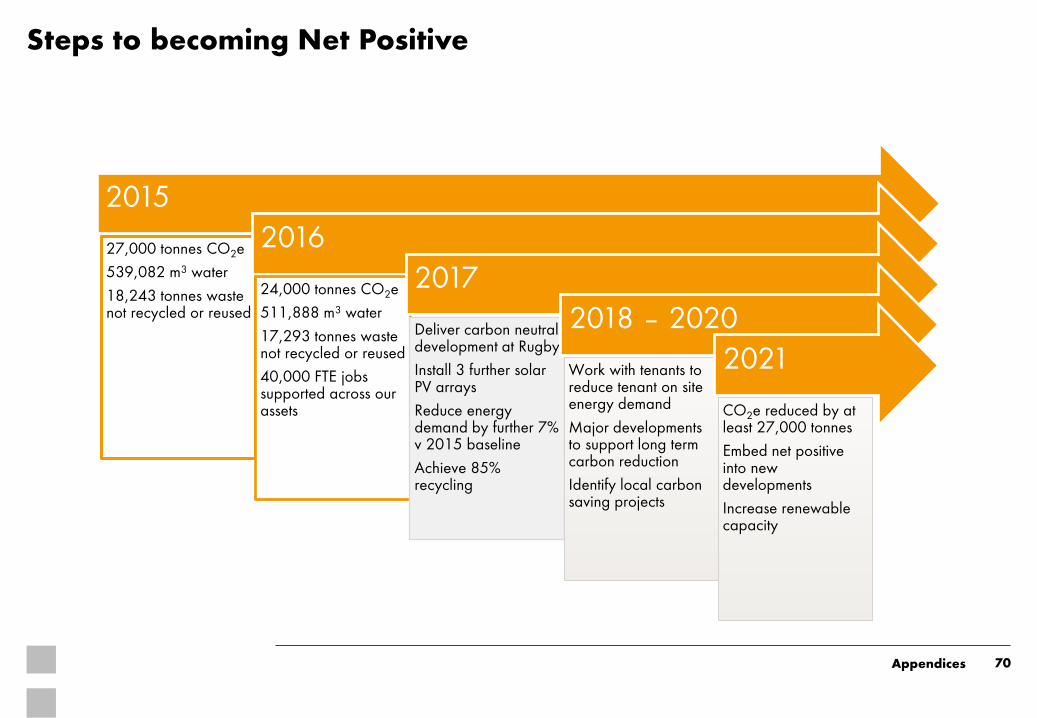
Steps to becoming Net Positive
2015
27,000 tonnes CO2e
539,082 m3 water
18,243 tonnes waste not recycled or reused
2016
24,000 tonnes CO2e
511,888 m3 water
17,293 tonnes waste not recycled or reused
40,000 FTE jobs supported across our assets
2017
Deliver carbon neutral development at Rugby
Install 3 further solar PV arrays
Reduce energy demand by further 7% v 2015 baseline
Achieve 85% recycling
2018 – 2020
Work with tenants to reduce tenant on site energy demand
Major developments to support long term carbon reduction
Identify local carbon saving projects
2021
CO2e reduced by at least 27,000 tonnes
Embed net positive into new developments
Increase renewable capacity
70 Appendices

Our 2017 sustainability highlights
71
Delivered the world’s first BREEAM Outstanding, carbon neutral retail park at Elliott’s Field, Rugby
Developed the second zero energy Costa Coffee EcoPod at Parc Tawe, Swansea
Managed exposure to Mimimum Energy Efficiency Standards (MEES) risk out of the UK portfolio
Installed additional 910 kWp clean electricity capacity
Achieved 3% improvement in the carbon intensity of the business, one of our corporate KPIs
Recycled 73% of waste across our UK, France and Ireland portfolios
Supported over 100 people with skills training and into employment at our shopping centres
Supported over 70 business-start-ups in France and 400+ entrepreneurs in the UK through the Initiative France and Pop-Up Business
Appendices


