73
Imagery Analytics for Natural Resource Management

Imagery Analytics for Natural Resource Management

Professional Imagery & Geospatial
Analysts
Enterprise
Is a Comprehensive Imagery Platform
System ofRecord
Manage and processall your imagery
System ofInsight
Extract Informationfrom Imagery
System ofEngagement
Share imagery products andinformation to those that need it
Content from:ArcGIS Online, Partners, Your Org.
The ArcGIS Platform

Professional Imagery & Geospatial
AnalystsSystem of
Record
Manage and processall your imagery
System ofInsight
Extract Informationfrom Imagery
System ofEngagem
ent
Share imagery products andinformation to those that need it
ArcGISGIS Server
ArcGISGeoEvent Server
ArcGISImage Server
ArcGISGeoAnalytics Server
ArcGIS Business Analyst Server
ArcGISImage Server
Enterprise
The ArcGIS PlatformIs a Comprehensive Imagery Platform

What is Raster Analytics?
• A new way to create and execute spatial analysis models and image processing chains which leverage distributed storage and analytics
- Raster Analytics works with your existing GIS data and imagery
- register your data and go, importing existing data to distributed storage is not mandatory
- Raster Analytics can optimize your data for distributed analytics
- import your data into ArcGIS distributed storage which further improves the scalability of distributed analytics
- Raster Analytics is designed to scale with your organization’s demands
- scale up to get the job done, scale down when resources are no longer needed
Raster Analytics is an Image Server capability

ArcGIS®
ENVI
• Together, offers a complete GIS, remote sensing, geospatial solution
• Makes it easy to add information to a GIS for better decision making
• Esri India is our exclusive authorized distributor
Harris and Esri Partnership
Services & Solutions
Advanced Imagery Analytics

Overview of Harris Geospatial Products and Technology
Whether you are looking for a finished geospatial product, a custom solution, or data and analytics to support a project, we
can meet your needs.
SOFTWARE & TECHNOLOGY
ENVI®
Jagwire™
Geospatial Services Framework (GSF)
IDL
Deep Learning
INDUSTRY SOLUTIONS
Custom Solutions
Defense and Intelligence
Federal and Civil Government
Utilities
Agriculture
Maritime
DATA & IMAGERY
Geiger-mode LiDAR
Satellite & Aerial Imagery
Data Derived Products
Satellite AIS

Software
Geospatial software solutions and supporting technologies to get the most from your data and imagery.
ENVI ®
IDL GSF
Jagwire™

• Enable anyone to find maps, imagery and other spatial data
• Allows data owners to easily contribute and share holdings
• Provides efficiencies and cost savings through data reuse
• Reduces effort and frustration for people needing data
Active Catalog is a geospatial discovery,cataloging and data sharing capability.
Active Catalog

Key Capabilities
• Ingests many different types and formats of spatial data – imagery, maps, elevation models, reports, sensor data, video feeds, handheld photos, and a variety of other types.
• Networks of catalogs synchronize data and metadata across wide area networks.
• 3D Java user interface – users only need a browser and Java.
• High performance query, online product viewing, download manager, etc.
• Deep metadata extraction with a wide variety of ingest agents.

Place image here(13.33” x 3.5”)
PRECISION PASS FOR UAV CAPTURES

Data Collection
• Data collected by UAVs has become invaluable to projects of all scopes and sizes. However, as the number of UAVs collecting data has increased, so have problems related to the quality of the data collected:
• Many different sensor packages
• Different flight platform characteristics
• Varying operator piloting skills
• Multiple analysis workflows means many different configurations needed
• How can you ensure that the data captured meets the needs of your downstream analysis?

PrecisionPass Base Capabilities + Customizations
• PrecisionPass contains critical out of the box assessments:
• Metadata Assessment
• Actual Capture vs. Capture Plan Assessment
• Image Saturation/Contrast
• Data Packaging
• PrecisionPass can also be customized for your particular needs!

Base Capabilities – Coverage Assessment (Frame)
If flying a grid/field capture plan, it is important to determine whether all required data was captured:
• Compare against known capture polygon
• Reports percent coverage against capture polygon
• Passing criteria can be defined as a preference
11
MissingCoverage
CapturePolygon
1 4 5 62 3 7
8910111213
11
14
11
15 18 19 2016 17 21
222324252627
11
28
FlightLine

Precision Pass

Custom Assessments – LiDAR
Harris Can Support Other sensors such as LiDAR
• Perform metadata assessment
• Perform coverage assessment
• Determine point density
• Manual inspection of the data
• Packaging

ENVI OneButton
ENVI OneButton speeds up the time between image captureand decision making by using the most advancedphotogrammetric and computer vision algorithms.
Use ENVI OneButton to create fully georeferenced 2D and 3Dproducts from UAS data, and produce outputs includingorthomosaics, Digital Elevation Models (DEMs), true color 3Dpoint clouds, orthorectified multispectral mosaics, andcontrolled oblique imagery.
These products can be used as inputs for ENVI to supportprojects across industries including precision agriculture,utilities, transportation and more.
Image Processing Made Easy For Your Drone/UAV Data.
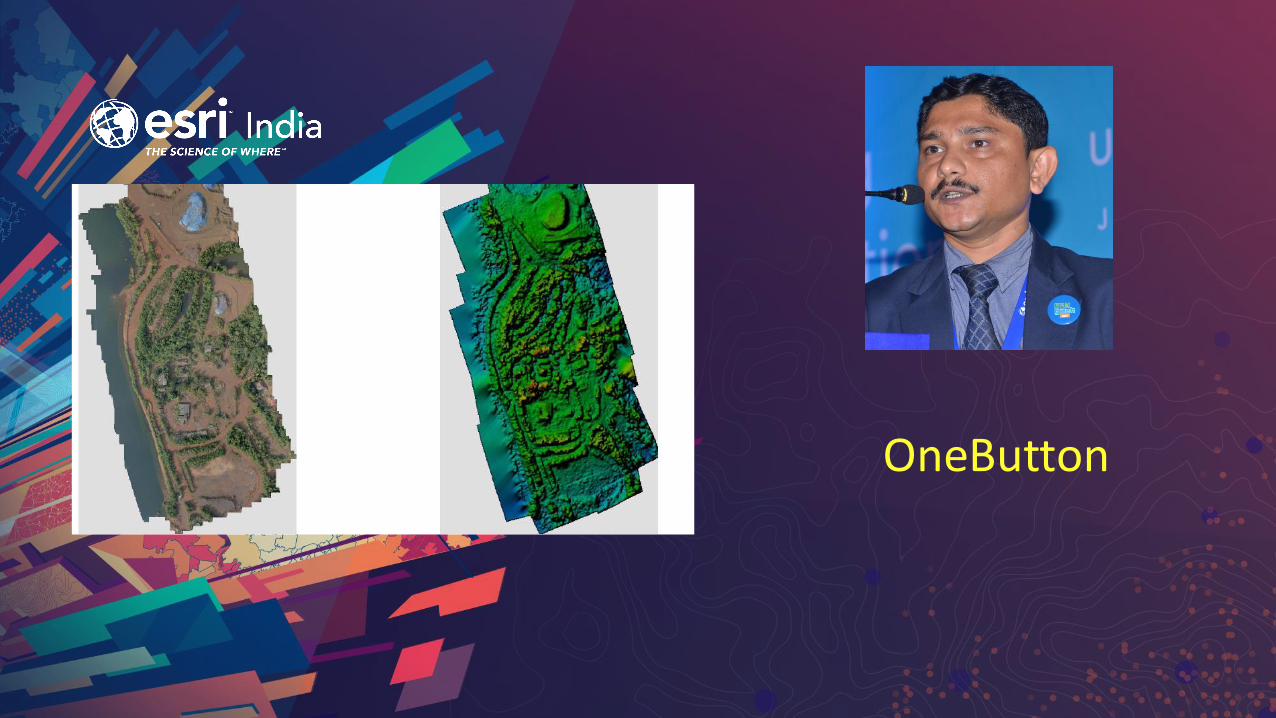
OneButton

ArcGIS Desktop – The ProductMultiple applications
ArcMap ArcGIS Pro
ArcCatalogArcSceneArcGlobe

ArcGIS Pro
ArcGIS Online
ArcGIS Enterprise
ArcGIS Apps
ArcGIS Developer APIs and SDKs

Named
User
Flexible Licensing Options
Single
Use
Concurrent
Use

ArcGIS Pro Analysis and Geoprocessing
• Geoprocessing tools and framework
• ModelBuilder
• Charts and exploratory analysis
• Python and R scripting
• Analytical extensions

Accurate GIS data
Remote sensingimagery / raster
Export training for DL (GP tool)
DL data packageTrain in DL Framework
DL Model
Raster Function
ArcGIS Pro Enterprise
DL Py API + PyRasFunc
Preview &Persist
Large Scale Persist
Deep Learning Support
• Access to selected deep learning frameworks using raster function framework

Stereo Mapping
Multiple Sources
New stereo view
New cursor shapes and modes
Works with Pro Editing UX
Active Shutter Glasses
Anaglyph stereo viewing
Visualize and capture data in 3D using stereo imagery

e
Image Space Analysis
Accurate Image mensuration
Create/Edit features Overlay GIS Data
Imagery in native space, free of distortions
Linked views – Image Space and Map space
Image Analyst extension

DemoImagery in Pro 2.2

Image Analyst

Sensor Support
Image Management
Visualization & Exploitation
Raster Functions
Scientific Data
Ortho Mapping
Imagery in ArcGIS Pro 2.2Key Themes

- New raster types simplify data-use
• Sentinel-1 (Radar)
• Worldview-4
• GOES L1B,L2
- Enhanced raster types
• Kompsat-3 Level1 support added
• Sentinel-2 level2 support added
- Additional Python raster types – distributed through GitHub
• TeLEOS-1
- Native support of multidimensional rasters in ArcGIS Pro
Python raster types are also being added by external developers for additional sensors
Better Sensor Support

Image Analyst Extension Capabilities
• ArcGIS Pro in 2018
− Stereo Display and Capture
− Image Space Display, Capture, and Mensuration
− Advanced Image Analysis
− Full Motion Video (FMV)
• ArcGIS Pro in 2019
− Deep Learning
− Multipatch Editing in Stereo
• ArcGIS Pro - Future
− Pixel Editor

Imagery integrated into GIS
Visualization & Exploitation
Management
Map ProductionAnalysis
ArcGIS

Mosaic DatasetOptimum Data Model for Image Management
• Highly Scalable, from Small to Massive Volumes of Imagery
• Defined in GeoDatabase (File or Enterprise)
• References sources
• Maintains metadata
• Defines processing to be applied
• Scales to Millions of Images/Rasters/Scenes/….

ArcGIS Image Server
• Dynamic Image Services
- Providing Access
-Dynamic Mosaicking and On-The-Fly Processing
• Raster Analytics
- Persisting Products using Distributed Compute and Storage
• Ortho Mapping
- Creating imagery products from Satellite, Aerial and Drones
Provides:

ANALYSISExtracting Information from Imagery
System of Insight
Machine Learning, Prediction, Classification, Deep Learning
Tools built into ArcGIS
Integration with External Toolkits
Scaling using Raster Analytics
ArcGIS Pro Image Analyst Extension

Image Services

Ortho MakerWeb based user interface for uploading and processing Ortho Mapping workflows on Drone Imagery
ArcGIS EnterpriseArcGIS
Image Server
Drone Imagery(local storage)
Upload
Products(Web Image Layer)
Ortho MakerDrone Imagery(in data store)
*Ortho Maker is not a product sold separately, it is a capability of ArcGIS Enterprise + ArcGIS Image Server

Orthomaker

Sarmap - SARSCAPE
Giulia Tessari, Ph.D. Sarmap SA .
She is a Earth Observation Specialist and a Marie Skłodowska-
Curie fellow, MSc in Environmental Engineering and PhD in Earth
Sciences at University of Padova (Italy).
Formerly researcher at the Department of Geosciences at
University of Padova.
Expertise in SAR data Processing and Land Movement
Applications, In Particular In the Domain of Measuring and
Modeling Landslide and Subsidence Motions and Building and
Infrastructure Deformations.

Wildlife biologist with 15 year of working experience in variousagro-pastoral and ecological zones covering fragile ecosystem ofIndia with leading research and conservation organizations of thecountry such as WII, Dehradun; ICFRE, Dehradun; FRI, Dehradunand World Bank, New Delhi.
Zoological Survey of India
Dr. Lalit Kumar SharmaScientist-C & Officer-in-Charge,Wildlife & GIS SectionZoological Survey of India
Publications:
Scientific Research Papers and articles in Pre-Reviewed Journals, Magazinesand Published Reports:
1. Per-reviewed Journal Articles: 142. Popular Articles: 63. Technical Report: 214. Abstracts in International Conferences: 16
Academic Recognitions:
1. IUCN-SSC bear-human conflict expert group member (BSG)
2. Member of International Bear Association (IBA)
3. Member of The Wildlife Society (TWS)
4. World Overview of Conservation Approaches and Technologies (WOCAT)5. LEAD Fellow for the year 2016-176. Member of J&K Government Committee on ESZ planning7. Member of Global Forest Fire Network

Distribution assessment and corridor modeling of Indian Grey Wolf (Canislupus pallipes) in Chotta Nagpur Plateau and Lower Gangetic Plains
Dr. Lalit Kumar SharmaScientist-C & O/C, Wildlife & GIS SectionZoological Survey of India, Kolkata

Wolf Distribution in the world

Wolf – (Canis lupus)
• India is home to two subspecies, i.e. Tibetan Wolf (Canis lupus chanco, Gray, 1983), and Indian Grey Wolf (Canis lupus pallipesSykes, 1983).
• Tibetan Wolf is distributed in the Himalayan landscape with sub-alpine and alpine conditions (3000 to 4000m).
• Indian Grey Wolf occupies grassland, scrublands of semi-arid regions and agro-forestry landscapes (Shahi 1982, Jhala & Giles 1991,
Kumar & Rahmani 1997, Jhala 2000, Jhala 2003; Sharma et al. 2004; Singh and Kumara 2006, Mech 2010).
• It is believed that only about 3,000 Indian Wolves remain in the wild and present in 11 Indian states.
• It has a history w.r.t it involvement in conflicts with human as “Child-lifting” and livestock depredation. (Blanford, 1891; Jhala &
Sharma 1997; Rajpurohit 1999; Shahi 1982; Jhala et al. 1997; Sharma et al. 2004).

Major Conservation issues and threats
• Retaliatory killing to mitigate conflict
• Habitat loss because of Land Use conversion & agricultural intensification
• Canine distemper & rabies diseases
• Habitat fragmentation leading to low of genetic connectivity and gene flow.

Objectives
1. To assess the current distribution of Indian Grey Wolf in Chotta Nagpur Plateau and Lower Gangetic Plains
2. To identify the movement corridors of the species in the study landscape for conservation and management planning

Study area
Two biogeographic provinces i.e. Chotta Nagpur plateau (6b) and Lower Gangetic planes (7b)
Total area 4,16,665 Km2
6 National parks36 Wildlife Sanctuaries

Methodology (sampling)
✓ The primary study was during 2015-2016.
✓ Landscape was into 10 X 10 km grids.
✓ Line transect of 2-5 km was travelled in selected grids with grey wolf habitats.
✓ Opportunistic night surveys were also conducted.
✓ A total n= 36 grids were visited for recording direct as well as indirect (scat, pug marks, denning sites, livestock depredation).


Distribution assessment (MaxEnt version 3.3.3.e)
❑ MaxEnt software implements a maximumentropy algorithm, which generates aprobability distribution map of similarconditions across the landscape consideringthe characteristics of the occurrence GPSlocations.

Predictors
➢Bioclimatic environmental variables obtained from WorldClim database (19 variables).➢Cartosat-DEM (IRS) (Elevation, slope and aspect).➢ The forest cover and forest type layer were generated using Landsat-8 data.➢Anthropogenic variables (Distance to road, Distance to village, Distance to drainage)
using ArcGIS.➢All the spatial data layers were resampled at 30m spatial resolution using ArcGIS. ➢The ENM Tools version 1.3 (Warren et al. 2010) was used to test multi co-linearity
between predictor variables where the variables with r > 0.7 were dropped. ➢Out of total 23 environmental variables 12 variables were used for further analysis.

Model parameters
➢ The maximum number of background points were 5,000 and implementing linear, quadratic and hinge features were used (Phillips and Dudik 2008).
➢ In total 100 replicates for model building (Flory et al. 2012).
➢ About 75% of the locations was used as the training dataset and the remaining 25%for testing the resulting (partitioned) models.
➢ The accuracy of the model was accessed using (AUC) of a Receiver Operating Characteristic (ROC) plot (ranging from 0.5 = random to 1 = perfect discrimination) and to assess the variables importance Jackknife procedure was adopted (Yang et al. 2013).

CLIMATIC TOPOGRAPHICAL
SlopeBioclim1-19
FOREST COVER
ANTHROPOGENIC
Aspect
Elevation
Type
Density
Distance to village
Distance to road
Distance to drainage
SDM
Presence location
MaxEnt Software
Model Flow chart

Corridor modeling (Circuitscape Ver. 4.0.)
• For understanding the connectivity among the habitats of the wolf in the study landscape the Circuitscape Ver. 4.0.
• The connections among the habitat are established by assessing the conductance values of the raster surface.
• The higher value of conductance indicates greater movements (McRae et al. 2008).
Links and raster cells are attributed with resistance values that reflect the degree to which the landscape facilitates or impedes movement. Networks and raster maps can be coded in resistances or conductances.

Corridor modeling (Circuitscape Ver. 4.0.)

Results (SDM)
18,237 Km2 (04%) - High22,801 km2 (06%) - Moderate5,88,24 km2 (14%) - Low 3,16,803 km2 (76%) - Least

Model accuracy Receiver Operating Characteristic (ROC) curve
AUC for the replicate runs is 0.981, and the SD is 0.007

Percent contribution & permutation importance of Predictors

Suitable habitat of Wolf in PAs

Results (Corridors)
Two significant corridors have been identified connecting the biotic provinces: 1. Northern part of Chotta
Nagpur Plateau via Bhimband and KodermaRange
2. Eastern face of the ChottaNagpur plateau via districts of Bankura and West Mednipore

Summary
✓ Among all predictors, the precipitation of the driest quarter and precipitation of seasonality (Coefficient of Variation).
✓ The model predicted suitable in Bankura, Purulia, Midnapore districts of West Bengal, JanjgirChampa, Raigarh, Singhbhum districts of Jharkhand and Sonepur and Angul districts of Odishastates.
✓ Further, the present model predicted that out of 42 PAs in the study landscape only 5 PAs are falls in the suitable habitat of the species in the landscape.
✓ Only 4.37% is highly suitable, followed by 5.47% as moderate, 14.11% low and about 76.03% areas as least suitable for wolves.
✓ Two significant corridors have been identified :
✓ Northern part of Chotta Nagpur Plateau via Bhimband and Koderma Range
✓ Eastern face of the Chotta Nagpur plateau via districts of Bankura and West Mednipore

Recommendations
❖ Adoption of landscape level conservation and management planning through community participation.
❖ We strongly propose changes in the National Working Plan Code 2014 (NWPC 2014) guidelines so that the wildlife management components could be given enough space in action prioritization in non PAs forested areas.
❖ Management of identified movement corridors for the species in the landscape.

Thank you

GSI
Sri Diptansu Sengupta
Dr Pradip Kr Mukherjee

AgNext -Taranjeet

Let me introduce you to Rohit Singh, who has been with Esri
since 2002, and has worked as a lead software architect on theArcGIS Engine, ArcObjects Java API and ArcGIS Enterprise teamsand is currently leading the development of ArcGIS API for Python.He’s passionate about artificial intelligence and machine learningand is also running a deep learning lab integrating ArcGIS with AI.
Rohit graduated from IIT Kharagpur with a degree in Architectureand has extensive experience and passion in the field of softwaredesign and development.
Esri Inc.

Imagery integrated into GIS
Visualization & Exploitation
Management
Map ProductionAnalysis
ArcGIS

Mosaic DatasetOptimum Data Model for Image Management
• Highly Scalable, from Small to Massive Volumes of Imagery
• Defined in GeoDatabase (File or Enterprise)
• References sources
• Maintains metadata
• Defines processing to be applied
• Scales to Millions of Images/Rasters/Scenes/….

ArcGIS Image Server
• Dynamic Image Services
- Providing Access
-Dynamic Mosaicking and On-The-Fly Processing
• Raster Analytics
- Persisting Products using Distributed Compute and Storage
• Ortho Mapping
- Creating imagery products from Satellite, Aerial and Drones
Provides:

ANALYSISExtracting Information from Imagery
System of Insight
Machine Learning, Prediction, Classification, Deep Learning
Tools built into ArcGIS
Integration with External Toolkits
Scaling using Raster Analytics
ArcGIS Pro Image Analyst Extension

Image Services

Ortho MakerWeb based user interface for uploading and processing Ortho Mapping workflows on Drone Imagery
ArcGIS EnterpriseArcGIS
Image Server
Drone Imagery(local storage)
Upload
Products(Web Image Layer)
Ortho MakerDrone Imagery(in data store)
*Ortho Maker is not a product sold separately, it is a capability of ArcGIS Enterprise + ArcGIS Image Server

Orthomaker

Envi Modeler


