Page 1
S1
Imaging Brain Tumor by Dendrimer-based Optical/Paramagnetic
Nanoprobe across the Blood-Brain Barrier
Huihui Yan, Jiyao Wang, Peiwei Yi, Hao Lei,* Changyou Zhan, Cao Xie, Linglin Feng, Jun Qian, Jianhua Zhu,
Weiyue Lu, and Cong Li*
School of Pharmacy, Fudan University, 826 Zhangheng Rd., Shanghai 201203, China, Department of Gastroenterology, Zhongshan Hospital Affiliated to Fudan University, 180 Fenglin Rd., Shanghai 200032, China, State Key Laboratory of Magnetic Resonance and Atomic and Molecular Physics, Wuhan Institute of Physics & Mathematics, The Chinese Academy of Sciences, Wuhan 430071, China, National Population and Family Planning Key Laboratory of Contraceptives Drugs & Devices, Shanghai Institute of Planned Parenthood Research, Shanghai, China E-mail: [email protected] ; [email protected]
Supporting Information
Table of content
1. Materials and General Experimental Methods. S2S3
2. Synthesis S3S7
3. Characterization S7S11
4. In Vitro Cell Culture Studies S11–S13
5. In Vivo Imaging Studies S13–S17
6. Ex Vivo Microscopic Imaging S17–S18
7. References S18
8. Supplemental Spectra S19–S23
Electronic Supplementary Material (ESI) for Chemical CommunicationsThis journal is © The Royal Society of Chemistry 2011
Page 2
S2
Materials and General Experimental Methods
All organic solvents were analytical grade from Aladdin Reagent (Shanghai, China) unless
otherwise specified. PAMAM G5 dendrimer (77.35 mg/mL in methyl alcohol, containing 128 primary
amino groups, MW: 28,826 Da) was purchased from Dendritech Inc (Midland, MI, USA). Rhodamine
succinimidyl ester, Cy5.5 succinimidyl ester, N-succinimidyl 3-(2-pyridyldithio) propionate (SPDP),
fetal bovine serum (FBS), penicillin and streptomycin were purchased from Invitrogen (Carlsbad, CA,
USA). Activated polyethylene glycol derivatives PEG2k
-NHS ester and NH2-PEG2k
-Malemide were
purchased from JenKem Technology Co. Ltd (Beijing, China). DOTA-NHS ester was prepared
according to previous report.1 Peptide TFFYGGSRGKRNNFKTEEYC in which a cysteine residue
modified at the C terminal of angiopep-2 peptide TFFYGGSRGKRNNFKTEEY was prepared by the
solid-phase peptide synthetic method and the purification was performed by a preparative reverse-
phase Waters SymmetryPrepTM
C18 7 µm 19 300 mm column equipped on a Waters 2487 dual
absorbance detector and and a Waters 600 controller with a gradient solvent system of acetonitrile in
water (0.1% trifluoroacetic acid). The molecular weights of the nanoprobes were measured from
Waters UltrahydrogelTM
500 (7.8 mm 300 mm) gel permeable column, which was operated by High
Performance Liquid Chromatography (HPLC) system equipped with a Waters 1525 binary pump and
Waters 2487 dual wavelength absorbance detector (Waters Inc. Milford, MA). Human glioblastoma-
astrocytoma, epithelial-like U87MG cell line and MTT cell proliferation kit were obtained from
American Type Culture Collection (Rockville, MD, USA). Cell culture media (Minimum Essential
Medium, Alpha 1X) was purchased from Mediatech (Manassas, VA). Amicon ultra-15 centrifugal
filter tubes (10,000 MW cutoff) were from Millipore (Bedford, MA, USA). 1H,
13C NMR spectra were
recorded at Varian Mercury400 spectrometer. The Electron Spray Ionization (ESI) mass spectra were
obtained on a SHIMAZDU LCMS-2020 (Kyoto, Japan) LCQ quadrupole ion trap mass spectrometer
with methanol as the carrier solvent. MALDI-TOF mass spectra were collected on an AB SCIEX
TOF/TOFTM
5800 mass spectrometer (Applied Biosystems, CA, USA). The hydrodynamic radius,
Electronic Supplementary Material (ESI) for Chemical CommunicationsThis journal is © The Royal Society of Chemistry 2011
Page 3
S3
particle size distribution and Zeta potentials of the nanoprobes were measured on a Malvern Zetasizer
(Malvern Instruments Inc., Southborough, MA) dynamic light scattering instrument. Gadolinium ion
concentrations were determined with a Hitachi P-4010 (Tokyo, Japan) ICP-AES system in the research
centre for analysis and measurement, Fudan University. The 35-mm glass bottom culture dishes for
live cell microscopic imaging were purchased from MatTek, Ashland, MA. In vitro NIR fluorescence
optical imaging was performed on a Kodark In Vivo Multispectral Imaging System equipped with a
630 nm excitation filter and a 700 nm emission band pass filter set. In vivo MR imaging was carried
out on a Bruker Biospec 47/30 MRI scanner in Wuhan Institute of Physics & Mathematics, The
Chinese Academy of Sciences. Confocal fluorescence images were performed with a Leica TCS SPE
confocal laser-scanning microscope (Leica Inc., Wetzlar, Germany) using a HCXPL APO CS 40 ×
1.25 oil immersion lens and a HCPL APO CS 10 × 0.40 immersion lens. Bio-distribution of the
radiolabeled nanoprobes in selective organs of tumor-bearing mice was measured on a gamma-counter
Synthesis
Synthesis of cysteine modified Angiopep-2 peptide. To conjugate the angiopep-2 peptide into
the G5 dendrimer without the compromising of the receptor binding specificity,
TFFYGGSRGKRNNFKTEEYC (MW = 2402 Da) with a cysteine residue labeled at the C’ terminal of
the angiopep-2 was synthesized via Boc-protected solid-phase peptide synthesis strategy. The
obtained fully protected linear peptide H-Thr(Bzl)-Phe-Phe-Tyr(Br-Z)-Gly-Gly-Ser(Bzl)-Arg(Tos)-
Gly-Lys(Cl-Z)-Arg(Tos)-Asn(Xan)-Asn(Xan)-Phe-Lys(Cl-Z)-Thr(Bzl)-Glu(OcHex)-Glu(OcHex)-
Tyr(Br-Z)-Cys(PMeBzl)-OH was deprotected in hydrofluoric acid (HF) and purified by preparative
HPLC followed lyophilization. The purity was verified by analytic HPLC. ESI-MS: found 802.5
[M3+
], calculated 2404.6 [M + H+].
Synthesis of control nanoprobe Den-PEG. Treatment of N-hydroxysuccinimidyl (NHS) esters
of rhodamine, Cy5.5 and PEG2k
with G5 dendrimer (29 kDa) in 0.1 M HEPES pH 8.3 respectively
Electronic Supplementary Material (ESI) for Chemical CommunicationsThis journal is © The Royal Society of Chemistry 2011
Page 4
S4
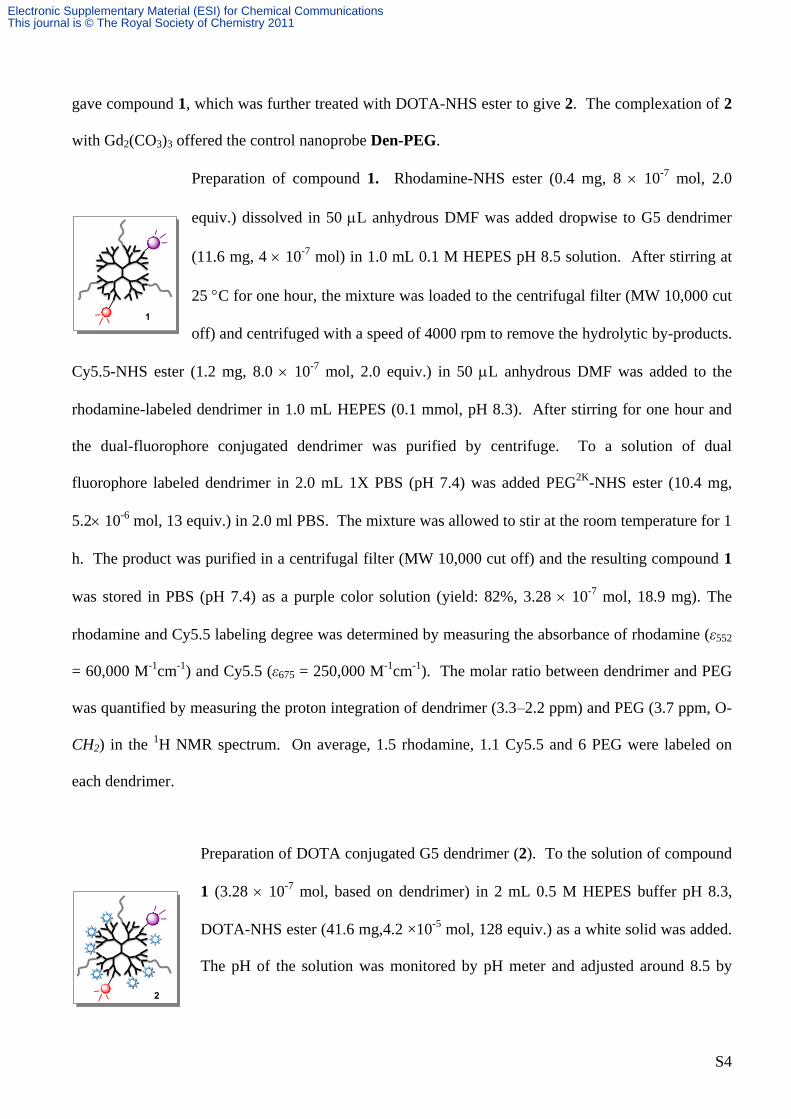
gave compound 1, which was further treated with DOTA-NHS ester to give 2. The complexation of 2
with Gd2(CO3)3 offered the control nanoprobe Den-PEG.
Preparation of compound 1. Rhodamine-NHS ester (0.4 mg, 8 10-7
mol, 2.0
equiv.) dissolved in 50 L anhydrous DMF was added dropwise to G5 dendrimer
(11.6 mg, 4 10-7
mol) in 1.0 mL 0.1 M HEPES pH 8.5 solution. After stirring at
25 C for one hour, the mixture was loaded to the centrifugal filter (MW 10,000 cut
off) and centrifuged with a speed of 4000 rpm to remove the hydrolytic by-products.
Cy5.5-NHS ester (1.2 mg, 8.0 10-7
mol, 2.0 equiv.) in 50 L anhydrous DMF was added to the
rhodamine-labeled dendrimer in 1.0 mL HEPES (0.1 mmol, pH 8.3). After stirring for one hour and
the dual-fluorophore conjugated dendrimer was purified by centrifuge. To a solution of dual
fluorophore labeled dendrimer in 2.0 mL 1X PBS (pH 7.4) was added PEG2K
-NHS ester (10.4 mg,
5.2 10-6
mol, 13 equiv.) in 2.0 ml PBS. The mixture was allowed to stir at the room temperature for 1
h. The product was purified in a centrifugal filter (MW 10,000 cut off) and the resulting compound 1
was stored in PBS (pH 7.4) as a purple color solution (yield: 82%, 3.28 10-7
mol, 18.9 mg). The
rhodamine and Cy5.5 labeling degree was determined by measuring the absorbance of rhodamine (ε552
= 60,000 M-1
cm-1
) and Cy5.5 (ε675 = 250,000 M-1
cm-1
). The molar ratio between dendrimer and PEG
was quantified by measuring the proton integration of dendrimer (3.3–2.2 ppm) and PEG (3.7 ppm, O-
CH2) in the 1H NMR spectrum. On average, 1.5 rhodamine, 1.1 Cy5.5 and 6 PEG were labeled on
each dendrimer.
Preparation of DOTA conjugated G5 dendrimer (2). To the solution of compound
1 (3.28 10-7
mol, based on dendrimer) in 2 mL 0.5 M HEPES buffer pH 8.3,
DOTA-NHS ester (41.6 mg,4.2 ×10-5
mol, 128 equiv.) as a white solid was added.
The pH of the solution was monitored by pH meter and adjusted around 8.5 by
Electronic Supplementary Material (ESI) for Chemical CommunicationsThis journal is © The Royal Society of Chemistry 2011
Page 5
S5
adding 5.0 M NaOH solution. The mixture was stirred at r.t. for further 3 h and the resulting product
was purified into 0.1 M HEPES pH 8.3 by the centrifugal filtration (MW 10,000 cut off) with a yield
of 92% (based on dendrimer). The number of DOTA chelators labeled on dendrimer was quantified as
75 by measuring the proton integration of dendrimer and DOTA in the 1H NMR spectrum of
compound 2.
Preparation of control nanoprobe Den-PEG. The complexation of compound 2 with gadolinium ion
was conducted as our previous work.2 Gd2(CO3)3 ( 9.5mg, 1.93×10
-5 mol, 64
equiv.) was added to 2 (3.0 ×10⁻⁷
mol, based on dendrimer) in 4 mL 0.1 M
HEPES pH 8.3. The suspension was allowed to stir at 60 C for 12 h. The
excess Gd2(CO3)3 was spin down by the centrifugation (2000 rpm) and the clear
supernetant was purified in the centrifugal filter (MW 50,000 cut off) as
described above with a yield of 95% (based on dendrimer).
Synthesis of aiming nanoprobe Den-Angio. Bis-activated PEG moiety NH2-PEG2k
-Malemide
reacted with N-succinimidyl 3-(2-pyridyldithio) propionate (SPDP) to give 3, which further reacted
with G5 dendrimer to obtain 4. Treatments of NHS esters of rhodamine, Cy5.5 and DOTA with 4
respectively gave 5. The condensation between 5 and home-made TFFYGGSRGKRNNFKTEEYC
peptide followed the complexation with Gd2(CO3)3 offered the aiming nanoprobe Den-Angio.
Preparation of SPDP labeled dendrimer derivative (4). N-succinimidyl 3-(2-pyridyldithio) propionate
(SPDP) (2.1 mg, 6.8 10-6
mol, 1.3 equiv.) in
300 L DMF was added to the solution of NH2-
PEG2k
-Malemide (10.4 mg, 5.2 10-6
mol, MW
is considered as 2 kDa) in 1.0 mL 1X PBS (pH
Electronic Supplementary Material (ESI) for Chemical CommunicationsThis journal is © The Royal Society of Chemistry 2011
Page 6
S6
7.4). After reaction at r.t. for 45min, the resulting PEG derivative 3 with malemide and SPDP [3-(2-
pyridyldithio) propionate] modified at its two terminals was added to G5 dendrimer (11.6 mg, 4 10-7
mol) in 1.0 mL 1X PBS (pH 7.4) without further purification. After stirring at r.t. for overnight,
compound 4 in which the dendrimer and SPDP connected through a PEG linker was purified by
centrifugation. The molar ratio between dendrimer and PEG was quantified by measuring the proton
integration of dendrimer and PEG in the 1H NMR spectrum of compound 4. The labeling degree of
SPDP in 4 was quantified by DL-Dithiothreitol (DTT) assay. Briefly, excess DTT was added to
compound 5 in PBS solution and vortexed for 15 min. The absorbance of above solution at 343 nm
was measured. The molar ratio between SPDP to dendrimer was calculated with the equation: R =
∆A343/8080 Cdendrimer, where R represents the molar ratio between SPDP and dendrimer; ∆A343
represents the change of the absorbance at 343 nm before and after DTT addition; Cdendrimer represents
the molar concentration of G5 dendrimer; the value of 8080 represents the extinction coefficient of
pyridine-2-thione at 343 nm. On average, 5.0 SPDP moieties were labeled in each dendrimer.
Preparation of rhodamine, Cy5.5, DOTA and SPDP labeled dendrimer derivative (5). As
demonstrated before, the NHS esters of
rhodamine (0.4 mg, 8 10-7
mol, 2.0 equiv..) and
Cy5.5 (1.2 mg, 8.0 10-7
mol, 2.0 equiv)
dissolved in 50 L anhydrous DMF was added to
5 in 1.0 mL 0.1 M HEPES pH 8.3 solution
consequently. After reaction for 1.0 h, the fluorophore labeled dendrimer was purified via
centrifugation and then concentrated into 2.0 mL 0.5 M HEPES pH 8.5. DOTA-NHS ester (50.7 mg,
5.12 10-5
mol, 128 equiv.) was added to above solution with the pH maintained at 8.5. After stirring
at 25 C for 3 h, the mixture was centrifuged (MW 10,000 cut off) to remove unconjugated DOTA
Electronic Supplementary Material (ESI) for Chemical CommunicationsThis journal is © The Royal Society of Chemistry 2011
Page 7
S7
chelators. The rhodamine, Cy5.5 and DOTA modified dendrimer 6 was stored in PBS (pH 7.4) as a
purple color solution. Averagely, there are 1.4 rhodamine, 1.1 Cy5.5 and 56 DOTA chelators labeled
in compound 5.
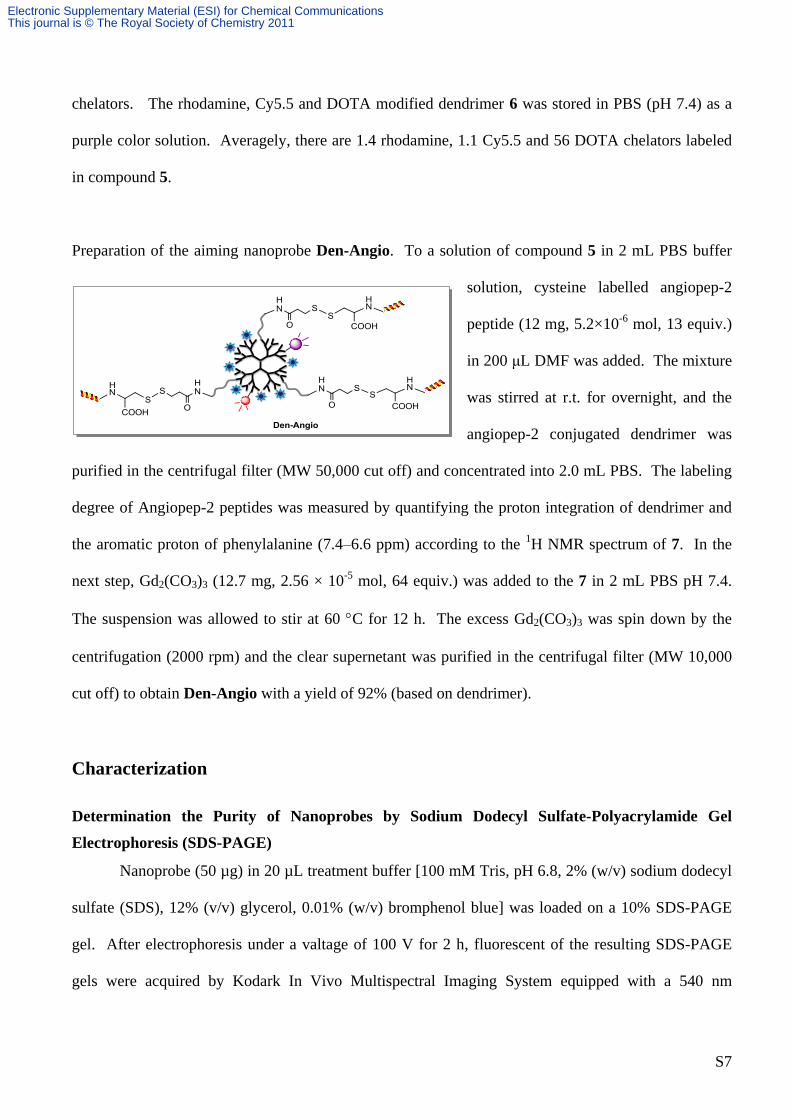
Preparation of the aiming nanoprobe Den-Angio. To a solution of compound 5 in 2 mL PBS buffer
solution, cysteine labelled angiopep-2
peptide (12 mg, 5.2×10⁻⁶
mol, 13 equiv.)
in 200 μL DMF was added. The mixture
was stirred at r.t. for overnight, and the
angiopep-2 conjugated dendrimer was
purified in the centrifugal filter (MW 50,000 cut off) and concentrated into 2.0 mL PBS. The labeling
degree of Angiopep-2 peptides was measured by quantifying the proton integration of dendrimer and
the aromatic proton of phenylalanine (7.4–6.6 ppm) according to the 1H NMR spectrum of 7. In the
next step, Gd2(CO3)3 (12.7 mg, 2.56 × 10⁻⁵
mol, 64 equiv.) was added to the 7 in 2 mL PBS pH 7.4.
The suspension was allowed to stir at 60 C for 12 h. The excess Gd2(CO3)3 was spin down by the
centrifugation (2000 rpm) and the clear supernetant was purified in the centrifugal filter (MW 10,000
cut off) to obtain Den-Angio with a yield of 92% (based on dendrimer).
Characterization
Determination the Purity of Nanoprobes by Sodium Dodecyl Sulfate-Polyacrylamide Gel
Electrophoresis (SDS-PAGE)
Nanoprobe (50 µg) in 20 µL treatment buffer [100 mM Tris, pH 6.8, 2% (w/v) sodium dodecyl
sulfate (SDS), 12% (v/v) glycerol, 0.01% (w/v) bromphenol blue] was loaded on a 10% SDS-PAGE
gel. After electrophoresis under a valtage of 100 V for 2 h, fluorescent of the resulting SDS-PAGE
gels were acquired by Kodark In Vivo Multispectral Imaging System equipped with a 540 nm
Electronic Supplementary Material (ESI) for Chemical CommunicationsThis journal is © The Royal Society of Chemistry 2011
Page 8
S8
excitation filter and a 590 nm emission band pass filter set (FOV = 12.8 cm, f/stop = 4, bin = high
resolution, exposure time = 2 s).
Determination of Molecular Weight of Nanoprobes by Gel Permeation Chromatography
All gel permeation chromatographic (GPC) studies were carried out as the below typical
method if there is not any specific mention. Mobile phase: 1 X PBS, pH 7.4; isocratic flow rate: 0.7
mL/min; operating temperature: 25 C; injected volume: 20 μL. The gel-permeable column was
calibrated by the Gel Filtration Molecular Weight Kit (Aldrich, St. Louis, MO), which comprises a set
of protein markers in the range of 29 kDa to 669 kDa. The void volume (Vo) of the column is
determined by applying the blue dextran at a concentration of 2 mg/mL. The leading peak monitored
at 280 nm indicates the void volume. The elution volumes (Ve) of the different protein standards with
the injection concentration 2.0 mg/mL were measured with the same HPLC method. The molecular
weight calibration curve was obtained by plotting molecular weight vs. Ve/Vo of each protein standard.
The elution volumes (Ve) of nanoprobe were measured with the same method. The effluent peak of
nanoprobe was monitored at 211 (absorbance of dendrimer) and 577 nm (absorbance of rhodamine)
respectively (Figure S2AB). The overlapping peaks monitored at 211 and 577 nm confirm the
conjugation of rhodamine into dendrimer. The molecular weights of Den-PEG and Den-Angio were
obtained as 92 kDa and 83 kDa respectively by applying their Ve/Vo values against the calibration
curve (Figure S2C).
Fluo. image C.C. Fluo. imageA B
72 kDa
95 kDa
Figure S1. Representative fluorescent image of a SDS-PAGE gel loaded with the indicated nanoprobe (50 μg
nanoprobe/well). The fluorescence (A) and color coded (C. C.) fluorescence (B) images of the resolved SDS-
PAGE gel were collected by an optical imaging system with exposure time of 2 second.
Electronic Supplementary Material (ESI) for Chemical CommunicationsThis journal is © The Royal Society of Chemistry 2011
Page 9
S9
Determination of Molecular Weight of Nanoprobes by MALDI-TOF MS
The MALDI-TOF MS were obtained using an AB SCIEX TOF/TOFTM
5800 mass
spectrometer that was calibrated by BSA (Sigma A-0281) and HSA (Sigma A-3782). The specimens
were prepared by mixing 1.0 μL nanoprobe solution (10 μM in methanol) with 1 μL matrix (10 mg/mL
CHCA in a solution of 50% ACN, 50% H2O and 0.1% TFA) on the measuring plate and air-drying.
5 10 15 20
0.00
0.08
0.16
0.24
0.32 monitored @ 211 nm
monitored @ 577 nm
Eluting time (min)
Norm
aliz
ed a
bsorp
tion
Den-Angio
5 10 15 20
0.00
0.05
0.10
0.15
0.20
0.25
Eluting time (min)
Norm
aliz
ed a
bsorp
tion
monitored @ 577 nm
monitored @ 211 nm
Den-PEG
1.36 1.44 1.52 1.60 1.68
0
100k
200k
300k
400k
500k
600k
700k
= Den-Angio, 85 kDa
Carbonic Anhydrase (29 kDa)
Albumin (66 kDa)
Alcohol Dehydrogenase (150 kDa)Amylase (200 kDa)
Apoferritin (443 kDa)
Thyroglobulin (669 kDa)
Ve/V
o (V
o = elution volumn of blue dextrin)
Mo
lecu
lar
we
igh
t
Y = 1.63E7 - 1.94E7X + 5.8E6X2
= Den-PEG, 94 kDa
A B C
Figure S2. Determination of the molecular weight of nanoprobes by GPC. Gel permeable chromatography of
Den-Angio (A) and Den-PEG (B) monitored at 211 nm (black line, dendrimer) and 577 nm (red line,
rhodamine). (C) The molecular weight of nanoprobes was determined by fitting with the calibration curve of
protein markers (molecular weight ranged from 29–669 kDa) that was measured under the indentical HPLC
method.
4 9 9 8 .0 2 8 0 7 3 .6 5 1 1 4 9 .2 7 4 2 2 4 .8 9 7 3 0 0 .4 1 2 0 3 7 6 .0
M a s s (m /z )
3 2 9 .9
0
1 0
2 0
3 0
4 0
5 0
6 0
7 0
8 0
9 0
1 0 0
% I
nte
ns
ity
4700 Linear Spec #1 MC[BP = 39049.4, 330]
100
50
0
4998.0 28073.6 51149.2 74224.8 97300.4
%In
ten
sity
Mass(m/z)
Den-Angio81717
40857
Figure S3. Determination of the molecular weight of Den-Angio by MALDI-TOF MS. Representative
MALDI-TOF MS of nanoprobe Den-Angio. Two main peaks with molecular weight of 41 kDa and 82 kDa
were monitored. The peak at 82 kDa can be attributed to the molecular ion peak and the peak at 41 kDa can be
attributed to the double charged molecular ion peak.
Electronic Supplementary Material (ESI) for Chemical CommunicationsThis journal is © The Royal Society of Chemistry 2011
Page 10
S10
Determination of Hydrodynamic Size Distribution and Zeta Potentials of Nanoprobes
Hydrodynamic radius of nanoprobes and unmodified G5 dendrimer was determined by
dynamic light scattering (DLS) (Figure S1) at room temperature. The standard solution of bovine
serum albumin (BSA) in distilled water with a concentration 2.0 mg/ml was used for the instrument
calibration. The samples were filtered through 0.45 µm filter and diluted to 100 g/mL by PBS pH 7.4.
The hydrodynamic radius and the size distribution were calculated with the regularization algorithm.
To measure the surface charges of nanoprobe, the instrument was calibrated with the standard solution
with a Zeta potential of -50 mV. The nanoprobes were satirized by filtrating through a 0.45 m filter
and diluted to 200 g/mL in 10 mM NaCl solution.
Determination of the Gd3+
Concentration in Nanoprobe by ICP-AES
Gd3+
concentration of nanoprobe was determined by Hitachi P-4010 model ICP-AES
(Inductively Coupled Plasma Atomic Emission Spectroscopy) with RF power at 1100 W and nebulizer
gas flow at 0.9 L/min. The standard solutions with the Gd3+
concentration of 1, 5, 10, 20, 50, 100, 200
ppm in 3% nitric acid were prepared, and a calibration curve was made by plotting the corresponding
chromatographic peaks vs. the Gd3+
concentrations. Stock solution of nanoprobe (0.1 mM) was
Size (d, nm) Zeta Potential (mV)
Zeta Potential (mV)
Den-PEG Den-PEG
Size (d, nm)
Den-Angio Den-Angio
A B
Size (d, nm) Zeta Potential (mV)
Zeta Potential (mV)
Den-PEG Den-PEG
Size (d, nm)
Den-Angio Den-Angio
A B
Figure S4. Hydrodynamic size distributions (A) and the Zeta potentials (B) of nanoprobes measured by dynamic
light scattering (DSL). The average diameters of Den-PEG and Den-Angio were measured as 11.3 and 13.3 nm.
The average Zeta potentials of Den-PEG and Den-Angio were measured as +16.7 and +11.6 mV.
Electronic Supplementary Material (ESI) for Chemical CommunicationsThis journal is © The Royal Society of Chemistry 2011
Page 11
S11
diluted 100 times by 3% nitric acid. The Gd3+
concentration of the sample was obtained by applying
the detected Gd3+
peak against the calibration curve.
Determination of the Relaxivity of Nanoprobes
The longitudinal relaxivities of the nanoprobes and the commercial available MR contrast
agent Gd3+
-DOTA were determined according to the equation of r1p = (1/Tsample-1/TPBS)/[Gd]. The T1
values of PBS and selected compounds with four different concentrations in PBS pH 7.4 were
measured with a 4.7 T MR spectrometer at 25 C. Plotting the (1/Tsample-1/TPBS) values of nanoprobe
with corresponding Gd3+
concentrations measured by ICP-AES provided the relaxivity of the
nanoprobe. The longitudinal relaxivities r1p of Gd3+
-DTPA, Den-Angio and Den-PEG were measured
as 4.7, 6.9 and 7.4 mM-1
s-1
respectively.
In Vitro Studies
Cell Culture
Human glioblastoma U87MG cells were purchased from the American Type Culture Collection
(Manassas, VA, USA). Cells were grown as mono-layers in 75-cm2 flasks containing Minimum
Essential Medium, Alpha 1X (MEM, Mediatech, Manassas, VA) supplemented with 10% fetal bovine
serum (FBS), 2 mM L-glutamine, 1% penicillin and streptomycin (Invitrogen, Carlsbad, CA) in a
fully-humidified incubator containing 5% CO2 at 37 °C. Cells were harvested when they reached 80%
confluence to maintain exponential growth.
Live Cell Confocal Fluorescence Microscopic Imaging
To avoid the artifacts that occur during fixation procedures, all the experiments were conducted
in live U87MG cells. Cells (2 × 10⁴) cultured on 35 mm glass bottom culture dishes (14 mm
microwell, MatTek, Ashland, MA) to approximately 50% confluence were added with 2 µM
Electronic Supplementary Material (ESI) for Chemical CommunicationsThis journal is © The Royal Society of Chemistry 2011
Page 12
S12
nanoprobe in 2 mL media supplemented with 10% FBS for seletcted period at 4 or 37 °C. At the end
of incubation, the cells were washed with Hanks Balance Salt Solution (HBSS) 3× prior to addition of
1 mL phenol red free media, and the cells were immediately imaged by confocal fluorescence
microscopy.
Competitive Studies of Cellular Uptake of Nanoprobes In Vitro.
Live U87MG cells cultured in 35-mm glass bottom culture dishes were pre-incubated with
regular medium supplemented with 2 µM low-density lipoprotein receptor-associated protein (RAP)
that was ultilized as the universal competitor for LRP receptors for 30 min at 4 °C. At the end of
incubation, the cells were washed and the media supplemented with 2 µM RAP and 2 µM Den-Angio
was added and continue to incubate for 15 min at 4 °C. At the end of incubation, cells were washed 3
with HBSS and subjected to microscopy imaging.
Cytotoxicity Studies
The MTT cell proliferation assay was applied to determine the viabilities of the cells treated
with nanoprobes and the unmodified G5 dendrimer used as a control. A cell monolayer in exponential
growth was harvested using 0.25% trypsin, and a single-cell suspension was obtained. Cells were
counted using a hemocytometer and a light microscope (OLYMPUS BH-2). Cell numbers were
optimized to remain in exponential growth phase throughout the entire duration of an MTT assay
experiment. To this purpose, cell suspensions containing cell density of 2 103 cells/well in 100 μL
cell culture medium were added to 96-well plates by serial dilutions. Eight replicates were prepared
under the same condition. 24 h after the cell attachment, the cells were treated with nanoprobe or
unmodified G5 dendrimer that was sterile filtered through MILLEX®
-HV 0.22 μm syringe filter with
final concentrations in a range of 0.0510 M. After incubation for 4 days at 37 °C in 5% CO2, cells
were washed with PBS, and the cell viabilities were measured by MTT assay as we reported
Electronic Supplementary Material (ESI) for Chemical CommunicationsThis journal is © The Royal Society of Chemistry 2011
Page 13
S13
previously2. The cell viabilities after the treatment of nanoprobes or G5 dendrimer were normalized to
the value without any treatment (Figure S5).
Mouse Model and Tumor Implantation
All animal experiments were carried out in accordance with guidelines evaluated and approved
by the ethics committee of Fudan University. Wild type U87MG human glioblastoma cancer cells (1.0
106 suspended in 5 μl PBS) were inoculated into the right striatum (1.8 mm lateral, 0.6 mm anterior
to the bregma and 3 mm of depth) of male Balb/c nude mice by using a stereotactic fixation device
with mouse adaptor. The intracranial tumors with a diameter of 0.20.5 mm were ready for imaging
experiments after the inoculation for 1418 days.
In Vivo and Ex Vivo Optical Imaging Studies
Optical imaging was performed on a Kodark In Vivo Multispectral Imaging System equipped
with a 630 nm excitation filter and a 700 nm emission band pass filter set. Before the imaging, mice
were anesthetized with a mixture of ketamine (25 mg/kg)/acepromazine (2.5 mg/kg) and placed face-
-7.5 -7.0 -6.5 -6.0 -5.5 -5.0
0
20
40
60
80
100
Ce
ll via
bili
ty /
%
Log[concentration (M)]
G5 Dendrimer
Den-PEG
Den-RGD
Figure S5. Both Den-PEG and Den-Angio demonstrated lower cytotoxicity than the unmodified G5 dendrimer
in human brain U87MG cancer cell culture. Data are expressed as mean ± SD (n = 8 for each concentration
tested).
(Edit the figure with larger dots)
Electronic Supplementary Material (ESI) for Chemical CommunicationsThis journal is © The Royal Society of Chemistry 2011
Page 14
S14
up in an imaging plate. X-ray images (exposure time: 30 s), white light photography (exposure time:
0.2 s) and NIR fluorescence images (exposure time: 15.0 s) with the same field of view (FOV) were
acquired (FOV = 12.8 cm, f/stop = 4, Bin = high resolution) respectively before and at selected time-
points after systemic injection of nanoprobe (4.0 nmol based on dendrimer). The X-ray images were
co-registered with the NIR fluorescence images to define the intracranial volume. The time-dependent
fluorescence intensity ratio between tumor and surrounding normal brain tissues (T/N ratio) were
calculated and normalized to the value measured pre-injection of nanoprobe. At the end of in vivo
imaging, the mouse was anesthetized and perfused with saline and 4% paraformaldehyde (PFA) in
succession via heart to douche blood and pre-fix the mouse. Brain was carefully isolated and the main
organs including liver, kidney, lung, spleen, heart and muscle were sectioned with a thickness of 12
mm by a tissue slicer (Braintree Scientific Inc., Braintree, MA). The microscopic fluorescence
intensities in tumor and surrounding healthy brain tissue were quantified by ImageJ (National Institutes
of Health, Bethesda, MD) software.
In Vivo Magnetic Resonance Imaging
In vivo MR imaging was carried out on a Bruker Biospec 47/30 MRI scanner. Before the
experiment, mouse tail vein was catheterized with a home-built catheter system using a small T-
junction (Cole-Parmer, Vernon Hills, IL) devised to minimize the dead volume of nanoprobe solution
(less than 50 L). The head of the anesthetized mice was placed into a home-built solenoid coil. Body
temperature of the animals within the magnet was maintained by a thermostat-regulated heating pad
and the respiration was continuously monitored by a Bruke PhysioGard system. Isoflurane (0.5–2%)
in 100% oxygen was administered upon placement of mouse in the MR coil, and continuously adjusted
by monitoring the respiration. Dynamic T1-weighted images of the brain were collected before and
after intravenous tail vein injection of a total 0.25 mL PBS solution of nanoprobe with a dose of 0.05
mmol/kg [Gd3+
]. T1-weighted MR signal enhancements were monitored up 0–120 min and 24 h post
Electronic Supplementary Material (ESI) for Chemical CommunicationsThis journal is © The Royal Society of Chemistry 2011
Page 15
S15
injection. Coronal images of the brain with 1 mm thick slices were acquired with a spin-echo pulse
sequence, field of view (FOV) 2 cm × 2 cm, matrix size 128 × 128, TR = 300 ms, TE = 11 ms, and
number of average = 8. 3D T1-weighted images were obtained with a fast low-angle shot (FLASH)
sequence, flip angle=45°, FOV = 1.5 cm × 1.5 cm × 1.5 cm, matrix size 128 × 128 × 32, TR = 35 ms,
TE = 6.2 ms, and number of averages = 8. The intensity enhancement (IE) of region of interest (ROI)
at time point t is expressed by IE = (RI(t) – RI(0))/RI(0) × 100%, where RI(t) corresponds to the
normalized signal intensity measured at time point t and RI(0) is the normalized signal intensity before
the nanoprobe injection. The time-dependent fluorescence intensity ratio between tumor and
surrounding normal brain tissues (T/N ratio) were calculated and normalized to the value measured
pre-injection of nanopro
Pre-contrast 30 min 24 h2 h
Den
-PE
GD
en
-An
gio
A
C
0 300 600 900 1200 1500
1.00
1.04
1.08
1.12
Time after injection (min)
Re
l. T
1-M
R s
ign
al in
hip
po
. PAMAM-PEG
PAMAM-Angio
0 300 600 900 1200 1500
1.00
1.02
1.04
1.06
1.08
Time after injection (min)
Re
l. T
1-M
R s
ign
al in
co
rte
x PAMAM-PEG
PAMAM-Angio
B
Figure S6. Den-Angio demonstrated higher cerebra uptake than Den-PEG in healthy mouse brain with intact
BBB. (A) Representative T1-weighted MR images of the mouse brain before and at 30 min, 2 h and 24 h PI of
nanoprobe with a dose corresponding to 0.05 mmol/kg based on Gd3+. Red arrow points to the cerebra
ventricle and white arrow points to the hippocampus. Time dependent T1-weighted MR signal variations in
the cortex (B) and hippocampus (C) area before and after injection of nanoprobe via i.v. (n = 4).
Electronic Supplementary Material (ESI) for Chemical CommunicationsThis journal is © The Royal Society of Chemistry 2011
Page 16
S16
Bio-distribution Studies
Nanoprobes were radiolabeled with 125
I isotope on the primary amines of dendrimer by using the
Bolton-Hunter reagent (Pierce Biotech., USA) following the purification by the 10 kDa centrifugal
tube to remove the unlabeled 125
I isotope. Eight U87MG tumor bearing female nude mice (20 g) were
divided into two groups randomly. Mice in each groups were injected with [125
I]Den-PEG (200 µL,
100 µCi) or [125
I]Den-Angio (200 µL, 100 µCi) through the tail vein. The mice were sacrificed at 24 h
post-injection and perfused with physiological saline. Selected organs (heart, lung, liver, spleen,
kidney, muscle, brain) and tumor were excised and weighted. The radioactivity was counted with an
automatic γ-counter. The percentage of the injected dose per gram (%ID/g) was calculated by
comparing the tissue counts with the injected radioactivity dose.
A B
0 300 600 900 1200 1500
1.0
1.2
1.4
1.6T
/N N
IR flu
o. In
t. r
atio
Time after injection (min)
Den-PEG
Den-Angio
0 400 800 1200 1600
1.0
1.1
1.2
1.3
1.4
T/N
MR
sig
na
l ra
tio
Time after injection (min)
Den-Angio
Den-PEGA B
0 300 600 900 1200 1500
1.0
1.2
1.4
1.6T
/N N
IR flu
o. In
t. r
atio
Time after injection (min)
Den-PEG
Den-Angio
0 400 800 1200 1600
1.0
1.1
1.2
1.3
1.4
T/N
MR
sig
na
l ra
tio
Time after injection (min)
Den-Angio
Den-PEG
Figure S7. Both in vivo MR and optical imaging verified the higher T/N signal ratio of Den-Angio compared
to Den-PEG. In vivo time-dependent normalized NIR fluorescence intensity ratio (A) and T1-weighted MR
signal ratio (B) between tumor and the surrounding healthy brain tissue (T/N ratio) after the nanoprobe
injection via i.v.. T/N values were normalized to the value measured before nanoprobe injection. Data were
presented as mean ± SD (n = 3). The injection dose is 0.05 mmol [Gd3+]/mouse for MR studies and 0.02
mmol [Gd3+]/mouse for the optical imaging studies.
Electronic Supplementary Material (ESI) for Chemical CommunicationsThis journal is © The Royal Society of Chemistry 2011
Page 17
S17
Ex Vivo Confocal Fluorescence Microscopic Imaging
At the end of in vivo imaging, the mice were anesthetized and perfused with physiological
saline and 4% paraformaldehyde (PFA) in succession via heart to douche blood and pre-fix them. The
brains were carefully isolated and immersed in 4% PFA for 12 h. Fixed brains were further immersed
in 30% sucrose solution for 24 h and cryro-sectioned with a thickness of 5 m. Rhodamine was
excited with a 543 nm laser, and fluorescence emission was detected by a photomultiplier tube using a
560 nm band-pass filter. Simultaneously, DAPI was excited with a 405 nm laser and the fluorescence
emission was detected with a second photomultiplier by applying a 490 nm dichroic beam splitter and
a 420480 nm band-pass filter. All the microscopic images were captured with the identical
microscopic setting.
0
1
2
3
%ID
/g
Heart
Liver
Spleen
Lung
Kidney
Brain
Muscle
Tumor
Figure S8. Bio-distribution of ratioactive 125I labeled nanoprobe in U87MG brain tumor bearing mice at 24 h
post-injection. Averagely the nanoprobe with a radioactivity of 100 µCi was injected via i.v. The organs and
tumor tissues were excised after the perfusion with PBS to remove the nanoprobe in the circulation system.
Electronic Supplementary Material (ESI) for Chemical CommunicationsThis journal is © The Royal Society of Chemistry 2011
Page 18
S18
Histological H&E Staining
The brain treated with nanoprobe were excised and immersed in 10% neutral buffered formalin
overnight. Fixed tissues were embedded in wax and sectioned with a thickness of 10 m. The slides
were stained with H&E in the Department of Pathology, Shanghai Medical College of Fudan
University and imaged by a Leica MZ75 high-performance stereomicroscope equipped with 2.5 X and
5.0 X plano objectives.
References
1. Li, C.; Winnard, P.; Bhujwalla, Z. M., Facile synthesis of 1-(acetic acid)-4,7,10-tris(tert-
butoxycarbonylmethyl)-1,4,7,10-tetraaza-cyclododeca ne: a reactive precursor chelating agent.
Tetrahedron Lett. 2009, 50 (24), 2929-2931.
2. Li, C.; Winnard, P. T., Jr.; Takagi, T.; Artemov, D.; Bhujwalla, Z. M., Multimodal image-
guided enzyme/prodrug cancer therapy. J Am Chem Soc 2006, 128 (47), 15072-3.
DAPI Rhodamine Merged
Den
-An
gio
Den
-PE
G
DAPI Rhodamine Merged
Den
-An
gio
Den
-PE
G
Figure S9. Fluorescence microscopic images of mouse brain bearing U87MG tumor xenograft at 24 h PI of
Den-Angio (upper panel) or Den-PEG (low panel) via i.v. (0.02 mmol [Gd3+]/mouse). The fluorescence of
rhodamine labeled in nanoprobe was displayed in red color and the fluorescence of DAPI count-stained in cell
nuclei was displayed in blue color. The nuclear staining in tissue section helps to define the boundary between
tumor and surrounding normal brain tissue.
Electronic Supplementary Material (ESI) for Chemical CommunicationsThis journal is © The Royal Society of Chemistry 2011
Page 19
S19
Supplemental Spectra
Spectrum 1. Mass spectrum of TFFYGGSRGKRNNFKTEEYC peptide (MW: 2404.6 Da). Found
ES-MS 602.45[M+4H]4+
; 611.85[M+4H+K]4+
; 802.55[M+3H]3+
.
Spectrum 2. Analytical HPLC-Vis chromatography of TFFYGGSRGKRNNFKTEEYC peptide.
Flow rate, 0.7 mL/min; solution A: 0.1% TFA in acetonitrile, solution B: 0.1% TFA in H2O. Running
time: 45 min, :monitored at 214 and 280 nm. HPLC method: the solvent system was programmed
linearly from 90 to 65% solvent B from 0 to 26 min. Then a constant solvent system of 10% B was
applied from 27 to 32 min. At last, a constant 90% solvent B was applied to wash the column.
500 750 1000 1250 1500 1750 m/z0e3
250e3
500e3
750e3
Int. 602.45
611.85802.55
437.25497.75 630.40 821.90
659.55 1203.40 1992.10971.80 1078.65 1359.15 1836.351581.80
[M+3H]3+
[M+4H+K]4+
[M+4H]4+
Electronic Supplementary Material (ESI) for Chemical CommunicationsThis journal is © The Royal Society of Chemistry 2011
Page 20
S20
Spectrum 4. 1H NMR spectrum of 1.
1H NMR (400MHz, D2O):δ 3.7 ppm (180H, m, PEG), 3.6-
3.4ppm (266H, m, dendrimer), 3.4–3.15 ppm (273H, m, dendrimer), 3.15-3.0 ppm (281H, m,
dendrimer), 3.0-2.7 ppm (505H, m, dendrimer), 2.7-2.5 ppm (259H, m, dendrimer), 2.5-2.2 ppm
(436H, m, dendrimer).
Spectrum 3.
1H NMR spectrum of G5 dendrimer.
1H NMR (400MHz, D2O): δ 3.3–3.1 ppm (778H, m,
dendrimer), 2.9-2.65 ppm (420H, m, dendrimer), 2.65-2.5 ppm (158H, m, dendrimer), 2.5-2.25 ppm
(296H, m, dendrimer), 2.25-2.1ppm (368H, m, dendrimer).
Electronic Supplementary Material (ESI) for Chemical CommunicationsThis journal is © The Royal Society of Chemistry 2011
Page 21
S21
Spectrum 6. 1H NMR spectrum of angiopep2 peptide.
1H NMR (400MHz, D2O):δ 7.4-7.0 ppm (17H,
m), 6.75 ppm (4H, m), 4.7-4.5 ppm (7H, m), 4.5-4.0 ppm (11H, m), 4.0-3.7 ppm (8H, m), 3.2-2.5 ppm
(22H, m), 2.5-2.0 ppm (5H, m), 2.0-1.5 ppm (21H, m), 1.5-1.0 ppm (11H, m).
Spectrum 5.
1H NMR spectrum of 2.
1H NMR (400MHz,D2O):δ 3.7 ppm (180H, m, PEG), 3.5–2.2
ppm (2020H, m, dendrimer and DOTA).
Electronic Supplementary Material (ESI) for Chemical CommunicationsThis journal is © The Royal Society of Chemistry 2011
Page 22
S22
Spectrum 8. 1H NMR spectrum of 5.
1H NMR (400MHz,D2O):δ 8.4-7.2 ppm (4H, m, SPDP), 3.7
ppm (180H, m, PEG), 3.5–2.2 ppm (about 3220H, m, dendrimer and DOTA).
Spectrum 7.
1H NMR spectrum of 4.
1H NMR (400MHz, D2O):δ 8.4-7.2ppm (4H, m, SPDP), 3.7
ppm (180H, m, PEG), 3.6-3.4 ppm (266H, m, dendrimer), 3.4–3.15 ppm (273H, m, dendrimer), 3.15-
3.0 ppm (281H, m, dendrimer), 3.0-2.7 ppm (505H, m, dendrimer), 2.7-2.5 ppm (259H, m, dendrimer),
2.5-2.2ppm (436H, m, dendrimer).
Electronic Supplementary Material (ESI) for Chemical CommunicationsThis journal is © The Royal Society of Chemistry 2011
Page 23
S23
Spectrum 9.
1H NMR (400MHz,D2O):δ 7.4-7.0 ppm (17H, m), 6.75 ppm (4H, m), 3.7 ppm (180H,
m, PEG), 3.5–2.2 ppm (about 3220H, m, dendrimer and DOTA).
Electronic Supplementary Material (ESI) for Chemical CommunicationsThis journal is © The Royal Society of Chemistry 2011