1. INTRODUCTIONIn the past few years there has been increasing interestin improving the spatial resolution of ophthalmoscopicfundus imaging instruments. Some of the techniquesthat have been implemented for resolving detailed struc-tures in the retina imaged through the optical system ofthe eye are borrowed from the field of astronomy, wherethe aim is to recover the high-spatial-frequency content ofstellar objects observed by large telescopes throughchanging atmospheric turbulence. For example, mea-surements of the wave-front aberration of the eye bymeans of a Hartmann–Shack sensor have beenperformed,1 and active optical compensation of the aber-rations of the eye has already been done.2 Individualphotoreceptors, easily observed through the optical sys-tem in some vertebrates,3,4 cannot be resolved in the hu-man fovea by means of conventional techniques. Artaland Navarro5 proposed to adapt stellar speckleinterferometry6,7 to determine foveal cone spacing. Withthis technique a series of short-exposure images with in-dependent wave-front distortions that containsdiffraction-limited information about the object is regis-tered, and the average power spectrum is computed. Onthe basis of this idea, Williams’s group at the Universityof Rochester8 implemented a related technique, using in-coherent light, to determine the topography of the conemosaic in the living human fovea, which they successfullyapplied outside the foveal center. We recently developeda new experimental imaging system,9 using coherentlight (as proposed by Artal and Navarro5). With this sys-tem we obtained foveal cone spacing data, including thefoveal center. We call this method ocular speckle inter-ferometry, in analogy to stellar speckle interferometry.A detailed description of the method can be found in Ref.
9. Figure 1 shows a schematic diagram of the system.We illuminate small patches of the fovea (5 arcmin) witha coherent green (l 5 0.543 mm) unexpanded narrowGaussian laser beam (undergoing no aberrations). Si-multaneously, short-exposure (5-ms) images are recordedon a high-resolution CCD camera. The average powerspectra of a series of speckle patterns typically presentsrings or hexagons, corresponding to the characteristicspatial frequency of the cone mosaic, which varies amongsubjects and eccentricities.In this study we present the theoretical background,
along with a numerical analysis that we carried out tovalidate and analyze the results of this technique. In ad-dition, the analysis allows us to get some insight into thenature of the reflection off the cone mosaic, paying specialattention to the role of spatially coherent illumination.Atkinson et al.10 suggested that, for the task of resolvingthe human cone mosaic, conventional imaging using co-herent light is likely to be more efficient than using inco-herent light. We shall compare both coherent and inco-herent cases.The paper is structured as follows: In Section 2 we in-
troduce a realistic model of the complex amplitude reflec-tivity of the cone mosaic, based on anatomical data of to-pography and structural parameters of the photo-receptors. The imaging properties of the optical systemof the eye are described in terms of Zernike polynomialsfor optical aberrations, whereas scattering produced byintraocular media is modeled, with complex Gaussian sta-tistics, as a random phase distortion of the wave front atthe pupil plane. In Section 3 we review the theoreticalframework of speckle interferometry for coherent and in-coherent illumination, which is applied in Section 4 tocomputer simulations, with use of the eye model of Sec-
1996 Optical Society of America
2330 J. Opt. Soc. Am. A/Vol. 13, No. 12 /December 1996 S. Marcos and R. Navarro
tion 2. In Section 5 we show how to improve the resultsby deconvolution with the speckle transfer function. Fi-nally, in Section 6 we link the results of this computersimulation with previous experimental findings.
2. MODELA. Cone MosaicThe complex reflectivity of the cone mosaic (amplitudeand phase) was modeled on the basis of the parametersreported in the literature about cone distribution, aper-ture, length, and index of refraction.A photomicrograph of a transverse section of an excised
fovea obtained by Curcio et al.11 was digitized. To simu-late the narrow illuminating beam, the image (having;10 cones in a row) was multiplied by a Gaussian andwas appropriately scaled, so that it represented a fovealpatch of ;5 arcmin (equivalent to the illuminated area ofthe laser spot used in our experiments) with a cone spac-ing corresponding to a retinal eccentricity of ;0.5 deg in anormal subject. Next, a dot lattice was generated by se-lecting the center of each cone, as has been done in otherstudies.12,13 The amplitude reflectivity of the object wassimulated by convolving the array of points with Gauss-ian functions, on the basis of the cone aperture model(Gaussian) proposed by MacLeod et al.,14 according towhich the effective aperture of the cone is given by
a~x, y ! 5 expF2~x2 1 y2!
2sa2 G , (1)
where x, y are coordinates on the plane perpendicular tothe cone axis and a represents the effective aperture ofthe cone and sa the standard deviation of the Gaussianaperture. The width at half-maximum of the Gaussianfunction in Eq. (1) corresponds roughly to half the diam-eter of the inner segment or ;40% of the coneinterdistance.15
The phase of the complex object was assumed to be con-stant within each cone. The phase map was generatedagain as a convolution of the above-mentioned array ofdots (cone center positions) with a circle with diameter of80% of the cone interdistance. The phase of a single conewas calculated by using a three-segment model cone16
with a mean length of 80 mm (30 mm for the myoid, 10 mm
Fig. 1. Schematic diagram of the experimental ocular speckleinterferometry setup. A narrow spatially filtered collimated la-ser beam enters the observer’s eye and for 5 ms illuminates afoveal patch of 5 arcmin diameter. A series of short-exposureimages are registered on a cooled, high-resolution CCD camera.
for the ellipsoid, and a 40-mm outer segment)17 and thefollowing indices of refraction: 1.361 for the myoid,1.390 for the ellipsoid, 1.419 for the outer segment,18,19
and 1.348 for the surrounding medium.20 The light wasassumed to travel twice within the photoreceptors. As inthe model proposed by Atkinson et al.,10 we assumed ran-dom length variations (following Gaussian statistics) ofthe outer segment of ;0.25 mm, which causes randomphase differences between adjacent cones. These valuesyield a mean optical path difference of 15p mm between asingle cone and the surrounding media. The rms for op-tical path differences between adjacent cones is 0.088p, or0.044l rms for phase differences (l 5 0.543 mm in the ex-periments).
B. Optical System of the EyeWe have modeled the eye’s complex pupil function as acircle with constant transmission (we consider a 5-mmpupil diameter) and the phase as a combination of deter-ministic aberrations plus a random variable component.Although the Stiles–Crawford effect causes a nonhomoge-neous pupil transmission21 that has proved to be impor-tant to account for the resolution of the method,22 we didnot consider it for a 5-mm pupil.The wave aberration W(a, b) was described by an ex-
pansion of normalized Zernike polynomials,
W~a, b! 5 a7A8~3r2 2 2 !a 1 a8A8~3r2 2 2 !b
1 a9A8~a2 2 3b2!a 1 a10A8~3a2 2 b2!b
1 a11A5~6r4 2 6r2 1 1 ! 1 . . ., (2)
where r2 5 a2 1 b2 and a7 (lateral coma), a8 (verticalcoma), a9 , a10 (elliptical coma), and a11 (spherical aberra-tion), etc., are the Zernike coefficients expressed in mi-crometers. We borrowed typical coefficients from theliterature.23,24 We considered terms up to the seventhorder: a7 5 0.12, a8 5 20.097, a9 5 0.13, a10 5 0.15,a11 5 0.098, a12 5 21.0 3 1023, a13 5 1.3 3 1024, a145 1.6 3 1023, a15 5 23.8 3 1024, a16 5 8.6 3 1024,a17 5 4.3 3 1024, and a18 5 2.2 3 1024. With these co-efficients the rms phase deviation of the wave aberrationis 1.24p (or 0.62l).Higher-order aberrations, microfluctuations of accom-
modation,25,26 micronystagmus,26 fluctuations within theintraocular media attributed to dead cells rapidly movingin the vitreous humor,26 etc., were represented as an ad-ditional random phase at the pupil plane. This randomphase was treated as a form of turbulence (we call itturbulence in analogy to astronomy—atmosphericturbulence—although in the eye, turbulence is only a mi-nor effect compared with other phase variations such asmicrofluctuations of accommodation) with the commonassumption of complex Gaussian statistics.7 Correlationof nearby points in the phase function was included by fil-tering two-dimensional, white-noise random-number se-quences with a Gaussian filter. The parameters of thefilter were chosen so that the rms phase deviation was0.90p (or 0.45l, l 5 0.543 mm). In this way we assumethat higher-order aberrations, scattering, and time-varying factors are smaller than but of the same order ofmagnitude as aberrations. There is no a priori physical
S. Marcos and R. Navarro Vol. 13, No. 12 /December 1996 /J. Opt. Soc. Am. A 2331
or physiological motivation to choose this magnitude forthe random component. There are probably not enoughdata to model this phase component accurately, and ouraim at this point is only to have a plausible enough modelto test new high-resolution imaging methods, whereas theexact value of numerical parameters is less important.Nevertheless, we tested the plausibility of this pupil func-tion by comparing the resulting modulation transfer func-tion (MTF) with experimental data on human eyes. Wefirst derived a long-exposure point-spread function27 asan average of the 36 images of a point object imagedthrough the ocular optics with 36 different realizations ofthe turbulence (using different random-number seeds inthe computation of the Gaussian random variable) tosimulate double-pass measurements. Figure 2 comparesthe simulated long-exposure MTF with standard data cor-responding to a fit of an average of eight MTF’s measuredon normal observers.28 The agreement between simu-lated and experimental data is sufficient for our purposes.
3. THEORETICAL BACKGROUNDThere is an abundant literature regarding the theory ofspeckle interferometry for resolving self-luminous or inco-herently illuminated objects imaged through turbulence(see Ref. 7 and references therein). The analytical devel-opment for the case of imaging of coherently illuminatedobjects (as in our method9) is more complicated and muchmore recent.29–31 Diffraction-limited information abouta coherently illuminated object can be obtained from theaverage power spectrum of short-exposure images; how-ever, this conclusion is less evident than in standardspeckle interferometry with incoherent light.We have adapted to our problem the analysis of
Mavroidis et al.31 for the imaging of coherently illumi-nated objects through turbulence. As in their approach,we consider the following simplifying assumptions:
1. Obliquity effects are ignored, even if the mosaic isilluminated by the waist of a Gaussian laser beam ratherthan strictly by a unit-amplitude plane wave.2. Isoplanatism is assumed, since only small foveal
patches (5 arcmin) are imaged.9
Fig. 2. Long-exposure MTF.
3. The optical system of the eye is not diffraction lim-ited, but numerical results and experimental observa-tions made with aberrated telescopes show thatdiffraction-limited information of the object can also beextracted, although it is somewhat attenuated.32,33 Weassume diffraction-limited optics to simplify the analyti-cal expressions.4. As mentioned above, the phase statistics of the
light at the pupil plane are taken to be a complex Gauss-ian process added to the wave-front aberration.5. The reflectivity of the mosaic remains unchanged in
magnitude, and all the cones are considered to be equallybright, so that any variations in photopigment bleachingare ignored.6. When treating an ensemble of object statistics, we
also considered it as a Gaussian process, since the opticalroughness of the object (mean optical path differences dueto the differences in lengths of the cones) is of the order ofmagnitude of the optical wavelength (Subsection 2.A).
It is noteworthy that although these simplifying as-sumptions are necessary for obtaining the analytical re-sults, most of them will not be used in the computer simu-lation.As in the analytical study by Mavroidis et al.31 we con-
sider three different cases: (a) The cone mosaic is illumi-nated by incoherent light, (b) the average power spectrumis obtained and analyzed for the coherent case, assumingthat the mosaic is stationary, and (c) the coherent imag-ing is extended to the case in which the mosaic movesslightly from one exposition to the next. (Since the conemosaic has been assumed to be randomly rough, thephase distribution is a statistical function, and it is pos-sible to average the power spectrum over the object en-semble as well.) Other cases were also studied by com-puter simulation, as is described in Section 6.
A. Incoherent ImagingAssuming isoplanatism, conventional incoherent imagingis ruled by the following equation:
i~x! 5 uha~x!u2 ^ o~x!, (3)
where i(x) represents the instantaneous image intensity,o(x) the object intensity, and ha(x) the instantaneousamplitude-spread function (square root of the point-spread function); ^ represents convolution and x a two-dimensional angular coordinate.The Fourier transform of ha(x) represents the pupil
function [or, equivalently, the coherent optical transferfunction, Ha(u), with u being the angular-frequency vari-able]. As described in Subsection 2.B, it contains the in-stantaneous degradation that is due to the turbulence,apart from the deterministic aberrations of the opticalsystem. The instantaneous incoherent transfer functionof the system, T(u), is given by the autocorrelation of thepupil function:
T~u! 5 Ha~u! * Ha~u!. (4)
The imaging equation, Eq. (3), in Fourier space becomes
I~u! 5 T~u! • O~u!. (5)
2332 J. Opt. Soc. Am. A/Vol. 13, No. 12 /December 1996 S. Marcos and R. Navarro
A conventional long-exposure image is obtained by aver-aging over time or over a large number of short-exposureframes, I(u); in the Fourier space it is given by
^I~u!& 5 ^T~u!& • O~u!. (6)
The long-exposure transfer function, ^T(u)&, was com-puted in our model eye and is represented in Fig. 2. Itrepresents the low-pass filtering of the high-frequencycontent of the object.In speckle interferometry, one computes the average of
the power spectra of the short-exposure frames, ^uI(u)u2&,instead of averaging in the image domain:
^uI~u!u2& 5 ^uT~u!u2& • uO~u!u2. (7)
It has been shown (even for the case of aberrated opticalsystems33,34) that the transfer function for average powerspectra, i.e., the speckle transfer function, can be approxi-mated by7
^uT~u!u2& ' u^T~u!&u2 1 kTdl~u!, (8)
where Tdl(u) is the diffraction-limited incoherent transferfunction and k is an attenuating factor related to theproperties of the turbulence. Equations (7) and (8) dem-onstrate that the average power spectrum of the imagecarries diffraction-limited information. Furthermore,the speckle transfer function can be estimated by comput-ing the average power spectrum of a point object, so thatthe object’s power spectrum can be recovered by a stan-dard deconvolution:
uO~u!u2 5^uI~u!u2&
^uT~u!u2&. (9)
B. Coherent Imaging: Averaging over the Statistics ofthe Intraocular MediaCoherent imaging is governed by the following expres-sion:
ia~x! 5 ha~x! ^ oa~x!, (10)
which relates the instantaneous complex amplitude of theimage ia(x) and of the object oa(x) instead of the intensi-ties. The complex amplitude of the object, oa(x), is thecone mosaic in our particular case, as described in Sub-section 2.A. To investigate separately the relative effectsof eye movements and turbulence, we first assume thatthe cone mosaic is static, so that any time-varying changein the wave-front distortion is induced only by changeswithin the intraocular media. The long-exposure imageintensity is given by
^i~x!&a 5 ^uha~x! ^ oa~x!u2&a , (11)
with averaging over the turbulence statistics, denoted by^. . .&a . In Fourier space the long-exposure image inten-sity can be written as31
^I~u!&a 5 Ca~u!@Ia,dl~u! * Ia,dl~u!#. (12)
where Ca(u) is the spectrum of the turbulence,34,35 andIa,dl(u) is the Fourier transform of the diffraction-limitedimage amplitude. As with incoherent imaging, the tur-bulence limits resolution [Ca(u) acts as a low-pass filter],although in this case there is no linear relationship be-tween image and object intensities.
The average power spectrum has been analyticallycomputed by Mavroidis et al.31:
This analytical result was obtained after we made therather strong simplification @Ca(u) 5 d (u)#, which im-plies severe degradation by the turbulence (i.e., no spatialcorrelation between adjacent phase distortions). Thissimplification will not be made in our computer simula-tion, but it was necessary to obtain a relatively simpleanalytical expression showing that the average powerspectrum retains diffraction-limited information aboutthe object. Equation (13) consists of two terms: the firstone is the squared modulus of the Fourier transform ofthe intensity of the long-exposure image; the second is theautocorrelation of the power spectrum of the diffraction-limited object and thus contains diffraction-limited infor-mation about the object, reaching the diffraction-limit in-coherent cutoff frequency.
C. Coherent Imaging: Average over the Statistics ofthe Intraocular Media and of the Object’s PhaseMavroidis et al.31 showed that when the object was ran-domly rough and, instead of being stationary and deter-ministic, moved slightly from one exposure to the next,the average power spectrum in the coherent case re-sembled more that obtained in the incoherent case, al-though the analytical expression is again difficult to in-terpret. In the particular case of coherent imaging of thecone mosaic, this situation would be more realistic, be-cause the cone mosaic is not a static object. As a result ofsmall eye movements and slight fixation errors, partiallyoverlapping or closely adjacent but not exactly the same,foveal patches are irradiated and imaged from one expo-sure to the next. We assumed that these slight move-ments induce changes in the phase distribution betweenframes, with random phase differences introduced by thecones. Such phase differences were assumed to followcomplex Gaussian statistics (Subsection 2.A).Mavroidis et al.31 showed that again in a limiting case,
for Ca(u) 5 d(u) and for a point object,
^^uI~u!u2&a&o 5 2^uI~u!u2&, (14)
where the left side represents the average over the statis-tics of the turbulence, ^. . .&a , and of the object, ^. . .&o , andthe right side represents the average power spectrum of apoint source for incoherent imaging [Eq. (7)]. The sim-plified case represented in Eq. (14) shows that there is aclose connection between speckle interferometry resultsobtained with incoherent objects and results obtainedwith coherent illumination when the average is also per-formed over the object statistics.
4. COMPUTER SIMULATIONIn this section we present the results of a computer simu-lation of the ocular speckle interferometry method for thethree cases considered above: incoherent imaging, (case3A); coherent-image averaging over the intraocular mediastatistics, (case 3B); and coherent-image averaging overthe object’s phase statistics, as well as over the intraocu-lar media statistics (case 3C). Another case of coherent
S. Marcos and R. Navarro Vol. 13, No. 12 /December 1996 /J. Opt. Soc. Am. A 2333
imaging, averaging only over the object’s phase statistics,will be briefly discussed in Section 6.For the simulation of incoherent imaging (case 3A) the
object o(x) is the intensity (squared modulus) of the conemosaic, as modeled in Subsection 2.A. The instanta-neous incoherent MTF, T(u), is computed for 12 differentrealizations of the intraocular turbulence by setting thepupil function, Ha(u), as described in Subsection 2.B.The corresponding series of 12 short-exposure images isthen generated following Eq. (3). Figure 3(a) shows onesample. The regular patterns in each short-exposure im-age appear partially blurred by the instantaneous inco-herent transfer function, and they change from one expo-sure to the next. The appearance of the patternsresembles in some ways the appearance of the patterns inthe short-exposure images of the cone mosaic registeredby Miller et al.,8 which is not surprising since Miller et al.broke the coherence of the laser beam by means of rotat-ing diffusers.
Fig. 3. (a) Typical simulated short-exposure image of the conemosaic registered through the eye’s optics under incoherent lightconditions (case 3A). (b) Logarithm of the average power spec-tra corresponding to a series of 12 computer-generated imageslike the one in (a). To enhance the highest spatial frequencies,the central peak is not displayed.
The average power spectrum is computed with Eq. (7)and is displayed in the same way as our experimentalpower spectra9; the result is shown in Fig. 3(b) on a loga-rithmic scale, with the central peak ignored. Figure 3(b)presents a ring approximately at the characteristic spa-tial frequency of the cone mosaic. The cutoff frequency(beyond which the signal is 0) is that of the diffraction-limited system [160.7 cycles/degree (c/deg) for a 5-mm pu-pil diameter and a 0.543-mm wavelength].Following Eq. (10), we obtained a series of short-
exposure images for the coherent case. We show an ex-ample in Fig. 4(a). In this first case the cone mosaic isassumed to be static, and only disturbances within the in-traocular media give rise to different realizations ofspeckle patterns (Subsection 3.B). The images showfully developed speckle patterns, very similar to the onesobtained in our in vivo experiments.9 The power spec-trum of each individual image also presents a ring orhexagon, which is better revealed in the average power
Fig. 4. (a) Typical simulated short-exposure image of the conemosaic (modeled as a distribution of static amplitude and phase),registered through the eye’s optics under coherent light (case3B). (b) Logarithm of the average power spectrum correspond-ing to a series of 12 simulated images like the one in (a). Theaveraging was done only over the intraocular media statistics.
2334 J. Opt. Soc. Am. A/Vol. 13, No. 12 /December 1996 S. Marcos and R. Navarro
spectrum, shown in Fig. 4(b), although it is less evidentthan in the incoherent case. We mentioned above that itis difficult to state in a quantitative manner that thepower spectrum averaging over the turbulence statistics,when coherent light is used, contains high-resolution in-formation. Nevertheless, the computer simulation showsthat the diffraction-limit cutoff frequency is reached andthat the characteristic spatial frequency of the cone mo-saic can be extracted.To illustrate a more realistic case (3C), we generated a
series of 12 speckle patterns, each corresponding to a dif-ferent realization of the turbulence within the intraocularmedia and now also to different random-phase differencesbetween cones. As stated earlier, this situation wouldcorrespond to slight movements of the eye and thus of thefoveal patch illuminated and imaged. If fixation is accu-rate, the cone topography can be deemed invariant among
Fig. 5. (a) Typical simulated short-exposure image of the conemosaic (considered as having a static amplitude distribution anda randomly variable phase distribution) registered through theeye’s optics under coherent light conditions (case 3C). (b) Loga-rithm of the average power spectrum corresponding to a series of12 simulated images, like the sample shown in (a). The averag-ing has been done over the intraocular media statistics as well asover the phase distribution statistics.
separate exposures. Thus we considered changes of thephase distribution only, keeping the cone distribution andamplitude constant. The speckle patterns [Fig. 5(a)] looksimilar to those in Fig. 4(a). The resulting averagepower spectrum is shown in Fig. 5(b). Now the ring ismuch more evident, more similar to the incoherent result,as predicted by the theory.One-dimensional plots of the logarithm of the average
power spectra present peaks at the spatial frequenciesthat must be close to the characteristic spatial frequencyof the cone mosaic at a given retinal location. Figure 6represents the radial profiles for the average power spec-tra obtained in the three cases tested: case 3A, incoher-ent imaging (solid curve); case 3B, coherent imaging forsingle averaging (short-dashed curve), and case 3C fordouble averaging (long-dashed curve), along with thepower spectrum of the object (dashed–dotted curve). Thepeak values, which vary slightly from one case to another,are shown in Table 1, which also includes the case of co-herent imaging of cones of equal length (no phase varia-tion); this has not been included in Fig. 6 for the sake ofclarity. The value closest to the original is recovered byusing incoherent light. Using coherent imaging, averag-ing over turbulence and phase statistics, causes the recov-ered spatial frequency of the mosaic to approach that ob-tained with incoherent imaging, supporting the analytical
Fig. 6. One-dimensional plots (radial profile) of the logarithm ofthe average power spectrum of the cone mosaic, registered underdifferent conditions: Solid curve, incoherent light [Fig. 3(b)];dotted curve, coherent illumination and a single averaging [Fig.4(b)]; dashed curve, coherent illumination and double averaging[Fig. 5(b)]. Dotted curve, radial profile of the logarithm of thepower spectrum of the original cone mosaic.
Table 1. Mean Characteristic Spatial Frequencyof the Cone Mosaic (c/deg) Ocular Speckle
Interferometry Simulations
CaseBefore
DeconvolutionAfter
Deconvolution
Original 75 —3A 72 753B (magnitude only) 64.7 69.13B (magnitude and phase) 66.2 69.13C (magnitude and phase) 69.1 70.6
S. Marcos and R. Navarro Vol. 13, No. 12 /December 1996 /J. Opt. Soc. Am. A 2335
results predicted by Mavroidis et al.31 The presence ofrandom phase differences in the mosaic’s complex ampli-tude, even in the case of a stationary mosaic, provides bet-ter results with respect to the case of cones with equalphase, as suggested by Atkinson et al.10
These results support the experimental data obtainedwith both incoherent8 and coherent9 light. This simula-tion can explain why for a specific observer tested withina period of 10 months with both the apparatus at the Uni-versity of Rochester and ours, we found that cone spatialfrequencies were lower by a factor of ;8% when mea-sured with coherent light.The explanation for such shifts from the theoretical
value (Table 1, first column) is straightforward. Thepeaks are modulated by a monotonically decreasingspeckle transfer function that lowers the peak maximum,shifting its centroid to a lower spatial frequency. In con-ventional stellar speckle interferometry this effect is com-pensated by deconvolving the average power spectrum ofthe image7 [Eq. (9)].
5. SPECKLE TRANSFERFUNCTION: DECONVOLUTION OF THEAVERAGE POWER SPECTRUMIn Subsection 2.B we estimated the standard long-exposure incoherent MTF, ^T(u)&, by averaging 36 simu-lated short-exposure images of a point source and takingFourier transform of the average. The same set of im-ages was used to calculate the speckle transfer function,^uT(u)u2&, as the average of the power spectra of each indi-vidual image. Figure 7 shows the radial profile in a loga-rithmic scale.
A. Deconvolution of Simulated Average Power SpectraFor incoherent imaging (case 3A), the average powerspectrum of the original mosaic can be recovered just bydividing the average power spectrum of the image by thespeckle transfer function [Eq. (9)] at all frequencies up to
Fig. 7. Radial profile of the simulated speckle transfer function(logarithm). It has been scaled so as to show the recovery ofspatial frequencies up to the diffraction limit of the optical sys-tem of the eye and normalized to 1 (160.7 c/deg for a 5-mm pupilsize and l 5 0.543 mm).
the diffraction-limit cutoff (nonzero spatial frequencies).The deconvolved average power spectrum is shown in Fig.8(a).In the coherent case there is no linear relationship be-
tween the average power spectra of image and object (i.e.,there is no linear transfer function). However, we canapply a pseudodeconvolution (division by the computedspeckle transfer function), as suggested by Mavroidiset al.31 The deconvolved average power spectrum, for themore realistic double-averaging case (3C) is shown in Fig.8(b). It is noteworthy that the higher spatial frequencieshave been so enhanced that a second harmonic of the fun-damental frequency, at a spatial frequency twice the prin-cipal one, is now partially revealed as a vignetted ring.The second column in Table 1 shows the corrected spa-
tial frequencies of the peaks. The amount of improve-ment is ;3%. The correction is complete for the incoher-ent case, and the results are improved for all the casesconsidered for coherent imaging, although the match isnot exact, owing to the lack of a real linear transfer func-tion. Nevertheless, the underestimation is less than7–8%.
Fig. 8. Reconstructed simulated log average power spectra for(a) incoherent and (b) coherent (double-averaging) cases, by de-convolution by the simulated speckle transfer function.
2336 J. Opt. Soc. Am. A/Vol. 13, No. 12 /December 1996 S. Marcos and R. Navarro
B. Deconvolution of Experimental Average PowerSpectraIn astronomical applications it is common to register a se-ries of short-exposure images of a point star near the as-tronomical object under consideration (within theisoplanatic path) to obtain the speckle transfer function ofthe telescope–atmosphere combination. In the case ofthe eye this is not possible. The assumptions consideredin the double-pass technique, which allow us to determinethe long-exposure MTF by projecting a point on the retinaand registering the light reflected back from the eye,27,36
do not hold for the calculation of the speckle transferfunction. As a first rough approximation, we applied theoptical model of Subsection 2.B to deconvolve experimen-tal data. Thus we used the same speckle transfer func-tion as in the computer simulation to perform a pseudode-convolution of our experimental average power spectra.In this way we obtained very similar results and rates ofimprovement of the peak for all subjects and eccentrici-
Fig. 9. Example of the reconstruction of the average power spec-trum corresponding to an experimental series of short-exposureimages (subject MA at 0.5 deg of retinal eccentricity): (a) origi-nal, (b) deconvolved by the simulated speckle transfer function.The mean radius of the elliptical ring appearing in the image in-creases from 63.2 to 66.15 c/deg after reconstruction.
ties. Figure 9 shows a characteristic example, which cor-responds to the average power spectrum for one subject(MA) at 0.5 visual degrees of retinal eccentricity. Figure9(a) is the result before deconvolution, and Fig. 9(b) is theresult after pseudodeconvolution. The contrast of thering is improved, and a slight shift of the peak toward ahigher spatial frequency (from 63.2 to 66.5 c/deg) is pro-duced (4.5% of increment), partially compensating the un-derestimation caused by speckle interferometry.
6. DISCUSSIONThe results obtained in the above simulation are quitesimilar to those obtained experimentally. The simulatedimages of the cone mosaic for the case of coherent illumi-nation closely resemble those registered in our laboratorywith 5-ms laser beam flashes. In addition, the computedaverage power spectra present similar rings, with the ra-dii close (but at slightly lower frequency) to the character-istic spatial frequency of the cone mosaic at the testedretinal location. The images recorded experimentally aresubject to several sources of error (errors in fixation, de-focus, saccadic movements, etc.) that have not been in-cluded in this simple simulation. Nevertheless, our sche-matic model has been able to reproduce the basic facts.We have shown in a previous paper9 that some of the
incertitude produced by uncontrolled factors could becompensated by a preselection of the best speckle pat-terns. This helped to improve the results in the sense ofobtaining a more visible ring or hexagon in the averagepower spectra. In order to evaluate a more difficult case,we also simulated the extreme situation of the cone mo-saic with no modulation in amplitude reflectivity, assum-ing the cone mosaic to be only a phase object. The short-exposure images [Fig. 10(a)] were similar to the onespreviously shown, perhaps with a more random structurethat reminds us of those obtained for specific subjects[e.g., subject MR, Fig. 10(b)]. A faint ring can be dis-cerned in the resulting average power spectrum [shown inFig. 11(a)] at the expected spatial frequency. We found asignificant improvement after rejection of the worstspeckle patterns from the digitally generated series. Thepower spectrum, averaged over the five best images, re-veals a ring of higher contrast [Fig. 11(b)]. In addition,this simulation also demonstrates that even withoutmodulation in the reflectivity, the use of coherent light al-lows the extraction of information about the topographyof the cone mosaic, contained in the local differences of re-fractive index.Although in our model the deterministic aberrations
(rms 5 0.62l) and the random component (rms5 0.45l) have the same order of magnitude, it can be ar-gued that the random phase fluctuations still make arelatively large contribution in the overall wave-front ab-erration. There are no sufficient experimental data inthe literature to model the random time-varying higher-order terms. In any case, our goal was to be realisticabout those aspects relevant to ocular speckle interferom-etry, whereas accuracy in the exact values of the chosenparameters was secondary. Our only test of the plausi-bility of those values was the good agreement of the re-sulting MTF with experimental data (see Fig. 2). A sec-
S. Marcos and R. Navarro Vol. 13, No. 12 /December 1996 /J. Opt. Soc. Am. A 2337
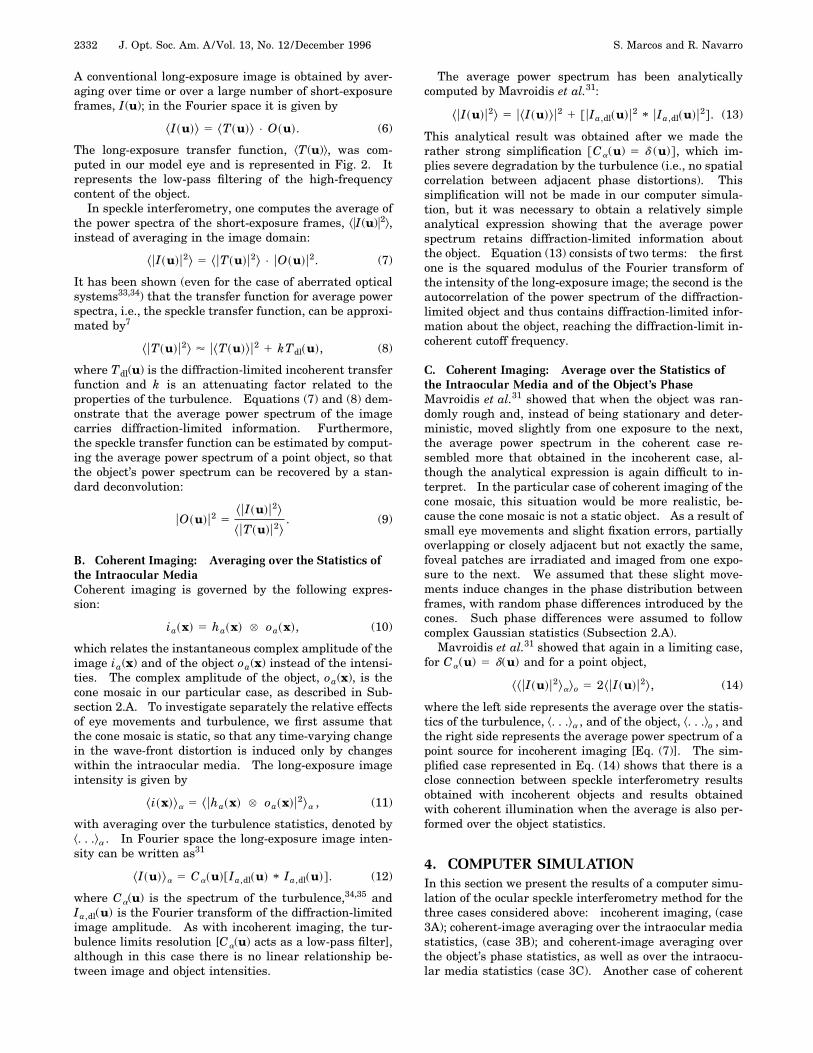
ond support is the good qualitative resemblance betweenthe simulated images and the experimental images, aswell as the good quantitative agreement between thesimulated and the measured power spectra. Neverthe-less, to study how critical the random component is in thewave aberration, we made the random-phase componentat the pupil plane a constant and simulated the coherentprocess averaging only over object statistics (i.e., assum-ing phase differences caused only by the random varia-tions of the cone lengths). We treated the case of randomlength variations of the cones with different standard de-viations: 0.044l (the case described in the model), 0.13l,0.27l, and 0.44l (or the equivalent standard deviations ofthe phase differences: 0.088p, 0.26p, 0.55p, and 0.88p,respectively), following Gaussian statistics. These casesrepresent retinal surfaces of increasing roughness. Forthe flattest surface (0.044l), the speckle patterns werehighly correlated in the same series. Therefore all theindividual power spectra exhibit almost the same rings, aresult that differs from what we found experimentally.Figure 12 shows the results for the last three cases. For
Fig. 10. (a) Typical image of a series of short-exposure imagesgenerated by assuming the cone mosaic to be a pure phase dis-tribution. (b) Typical experimental short-exposure image, reg-istered for subject MR at 1 deg of retinal eccentricity.
the intermediate cases [Figs. 12(a) and 12(b)] the simu-lated speckle patterns are uncorrelated, and the averagepower spectrum exhibits either a clear [Fig. 12(a)] or afaint [Fig. 12(b)] ring. When we consider the highest sur-face roughness (unlikely for the retina26) (0.44l), the evi-dence of the ring in the average power spectrum practi-cally disappears. In summary, for a wide range ofrandom variations of the cone lengths, ocular speckle in-terferometry with use of coherent light allows us to re-cover high-resolution information. However, we thinkthat the case that includes movements at both the retinalplane and the pupil plane is more realistic.In the simulations so far, we assumed that the reflec-
tivity of the cone mosaic and the cone distribution wereidentical in all the exposures of a series, and althoughslight movements were considered, these affected only thephase distribution. This is a simplification that involvesconsidering local homogeneity of the mosaic and neglect-ing the linear Fourier phase associated with a shift of theobject (which in any case is lost when the power spectrumis computed). Fixation errors are assumed to be a minor
Fig. 11. (a) Log average power spectrum, corresponding to a se-ries of 12 computer-generated images, a sample of which appearsin Fig. 10(a). (b) Log average power spectrum after selection ofthe five best patterns from the series.
2338 J. Opt. Soc. Am. A/Vol. 13, No. 12 /December 1996 S. Marcos and R. Navarro
effect during the course of an experiment, especially sincethe participants were trained subjects. Nevertheless, wenoticed that a series registered for the same subject at thesame retinal eccentricity and under the same conditions
Fig. 12. Log average power spectra for a series of images simu-lated assuming coherent illumination and phase variations dueonly to retinal movements, for three different photoreceptorroughnesses: (a) 0.13l, (b) 0.27l, (c) 0.44l.
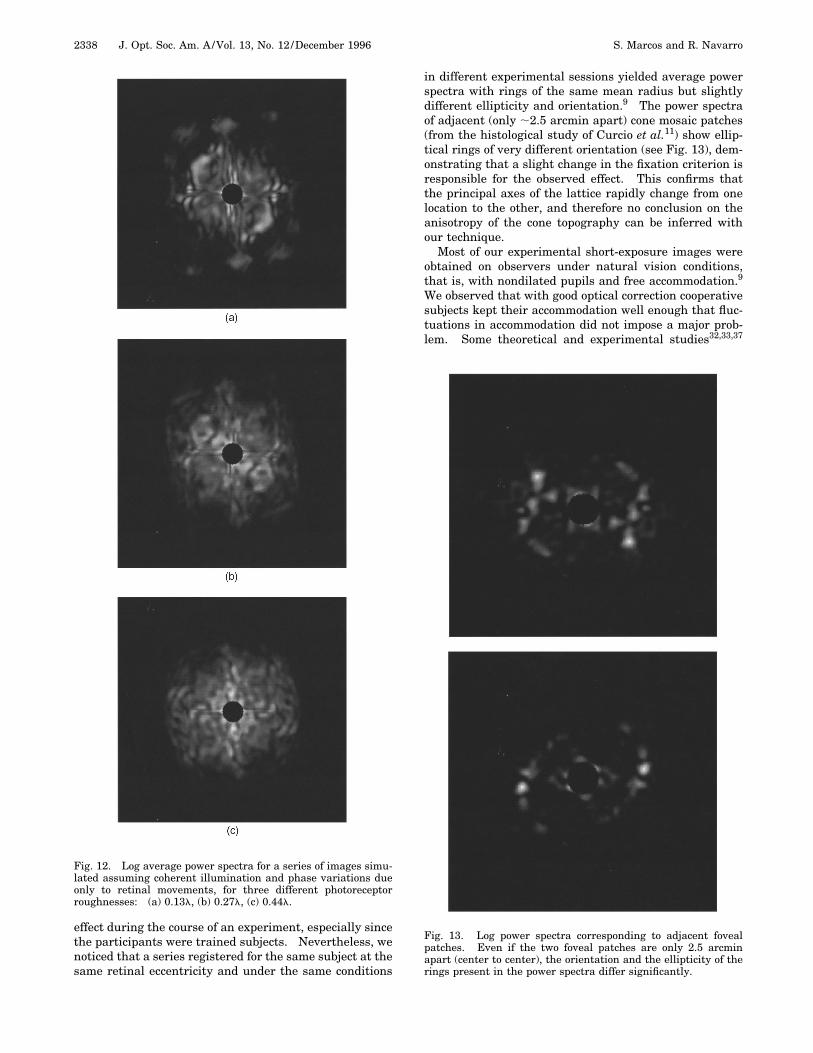
in different experimental sessions yielded average powerspectra with rings of the same mean radius but slightlydifferent ellipticity and orientation.9 The power spectraof adjacent (only ;2.5 arcmin apart) cone mosaic patches(from the histological study of Curcio et al.11) show ellip-tical rings of very different orientation (see Fig. 13), dem-onstrating that a slight change in the fixation criterion isresponsible for the observed effect. This confirms thatthe principal axes of the lattice rapidly change from onelocation to the other, and therefore no conclusion on theanisotropy of the cone topography can be inferred withour technique.Most of our experimental short-exposure images were
obtained on observers under natural vision conditions,that is, with nondilated pupils and free accommodation.9
We observed that with good optical correction cooperativesubjects kept their accommodation well enough that fluc-tuations in accommodation did not impose a major prob-lem. Some theoretical and experimental studies32,33,37
Fig. 13. Log power spectra corresponding to adjacent fovealpatches. Even if the two foveal patches are only 2.5 arcminapart (center to center), the orientation and the ellipticity of therings present in the power spectra differ significantly.
S. Marcos and R. Navarro Vol. 13, No. 12 /December 1996 /J. Opt. Soc. Am. A 2339
have examined the influence of aberrations, particularlydefocus, on the ability of speckle interferometry to providehigh-spatial-frequency resolution of incoherently illumi-nated objects. They demonstrate that information up tothe diffraction limit is still possible to achieve, althoughthe signal-to-noise ratio is decreased. As a control ex-periment we registered a series of short-exposure imageswith different amounts of artificial defocus on a particularsubject with paralyzed accommodation. We showed thatfocusing errors of approximately 61 diopter (D) pre-vented observation of a ring in the power spectrum.Similarly, we repeated the simulation described in Sub-section 3.B with inclusion of a term corresponding to de-focus in the Zernike polynomial expansion of the wave-front aberration. For the particular case of 1 D ofdefocus also, the simulated average power spectrum dis-played a significant decrease of both the effective cutoffspatial frequency and the signal-to-noise ratio; conse-quently, no clear ring could be observed. Both the ex-perimental and the simulated power spectra exhibited aring for slight amounts of defocus, like those produced byfluctuations in accommodation in experimental condi-tions.Another fact that we had observed in the experimental
results was that the average power spectra correspondingto the highest retinal eccentricity tested (1 deg) fre-quently presented a clear hexagon rather than a ring.9
Owing to the rapid decline of the cone density with retinaleccentricity, the number of cones illuminated with thespot of light (unchanged in the experiment) should alsodecrease. Hence we argued that since at 1-deg eccentric-ity fewer cones are being illuminated, fewer changes inthe orientation of the principal axes of the hexagonal ar-ray occur within the sample area. We reproduced thisfinding by means of a computer simulation. In the simu-lations described above, we considered foveal patches of;10 cones in diameter, illuminated by a Gaussian spot oflight of ;5 arcmin angular extension. We evaluated theeffect of reducing the number of cones within the illumi-nated area. Figure 14 compares the power spectra corre-sponding to the same foveal patch, illuminated with a 2.5-arcmin spot of light [Fig. 14(a)] or a 5-arcmin spot [Fig.14(b)]. The power spectrum presents six clear peaksforming a hexagon [Fig. 14(a)] when fewer cones are illu-minated or a ring [Fig. 14(b)] when more cones are illu-minated.In conclusion, we have presented the theoretical and
numerical background of ocular speckle interferometrymethod for determining foveal cone distribution. Wecomputer simulated the method by modeling a fovealpatch, imaged through a simulated optical system with ei-ther incoherent or coherent illumination. The analyticalformulation of speckle interferometry for the coherentcase, which we review here along with the incoherentcase, demonstrates that diffraction-limited informationcan be extracted. The realistic computer simulationsshow that the method can be applied to resolve the conemosaic. The computer-generated speckle patterns re-semble the series of short-exposure images experimen-tally registered in living observers. The resulting aver-age power spectra present a ring whose radiusapproximately corresponds to the characteristic spatial
frequency of the cone mosaic. According to the experi-mental observations, the characteristic spatial frequencyseems to be slightly underestimated. Incoherent imag-ing provides slightly more accurate estimates of the char-acteristic spatial frequency of the mosaic. In all casesthe results improve (and are completely corrected for thecase of incoherent imaging) by deconvolution by a speckletransfer function, which is obtained as the average powerspectrum corresponding to a point source. For the coher-ent case, pseudodeconvolution cannot completely compen-sate for a small shift toward lower frequencies. We ap-plied pseudodeconvolution to experimental data, ob-taining slightly higher values of cone frequency, as pre-dicted by the simulation.In addition, the possible improvement of the visibility
of the rings by image selection, the effect of defocus or ofsmall errors in fixation, and other effects relevant to themethod are discussed with the help of computer simula-tions.
Fig. 14. Log power spectra corresponding to exactly the samesection of cone mosaic, illuminated with concentric laser spots ofdifferent sizes: (a) 2.5 arcmin, (b) 5 arcmin. When a smallnumber of cones is illuminated, the power spectrum is morelikely to exhibit a hexagon.
2340 J. Opt. Soc. Am. A/Vol. 13, No. 12 /December 1996 S. Marcos and R. Navarro
ACKNOWLEDGMENTSThis research was supported by the Comision Interminis-terial de Ciencia y Tecnologıa, Spain, under grant TIC94-0849. We thank Maurice Rynders for kindly reviewingthe English language of the manuscript.
REFERENCES1. J. Liang and D. R. Williams, ‘‘Effect of higher-order aberra-
tions on image quality in the human eye,’’ in Vision Scienceand Its Applications, Vol. 1 of 1995 OSA Technical DigestSeries (Optical Society of America, Washington D.C., 1995),pp. 70–73.
2. A. W. Dreher, J. F. Bille, and R. N. Weinreb, ‘‘Active opticaldepth resolution improvement of the laser tomographicscanner,’’ Appl. Opt. 28, 804–808 (1989).
3. W. S. Jagger, ‘‘Visibility of photoreceptors in the intact liv-ing cane toad eye,’’ Vis. Res. 25, 729–731 (1985).
4. M. F. Land and W. A. Snyder, ‘‘Cone mosaic observed di-rectly through the natural pupil of live vertebrate,’’ Vis.Res. 25, 1519–1523 (1985).
5. P. Artal and R. Navarro, ‘‘High-resolution imaging of theliving human fovea: measurement of the intercenter conedistance by speckle interferometry,’’ Opt. Lett. 14, 1098–1100 (1989).
6. A. Labeyrie, ‘‘Attainment of diffraction-limited resolution inlarge telescopes by Fourier analysing speckle patterns instar images,’’ Astron. Astrophys. 6, 85–87 (1970).
7. J. C. Dainty, ‘‘Stellar speckle interferometry,’’ in LaserSpeckle and Related Phenomena, 2nd ed., J. C. Dainty, ed.(Springer-Verlag, Berlin 1984), pp. 253–315.
8. D. T. Miller, D. R. Williams, G. M. Morris, and J. Liang ,‘‘Images of the cone photoreceptors in the living humaneye,’’ Vis. Res. 36, 1067–1079 (1996).
9. S. Marcos, R. Navarro, and P. Artal, ‘‘Coherent imaging ofthe cone mosaic in the living human eye,’’ J. Opt. Soc. Am.A 13, 897–905 (1996).
10. M. R. Atkinson, A. Roorda, and M. C. W. Campbell, ‘‘Imag-ing of individual photoreceptors beyond the incoherentresolution limit,’’ Invest. Ophthalmol. Visual Sci. 35, S188(1995).
11. C. A. Curcio, K. R. Sloan, R. E. Kalina, and A. E. Hendrick-son, ‘‘Human photoreceptor topography,’’ J. Comp. Neurol.292, 497–523 (1992).
12. J. Y. Yellot, Jr., ‘‘Spectral analysis of spatial sampling byphotoreceptors: topological disorder prevents aliasing,’’ Vis.Res. 22, 1205–1210 (1982).
13. J. Hirsch and W. H. Miller, ‘‘Does positional disorder limitresolution?’’ J. Opt. Soc. Am. A 4, 1481–1492 (1987).
14. D. I. A. MacLeod, D. R. Williams, and W. M. Makous, ‘‘Åvisual non-linearity fed by single cones,’’ Vis. Res. 32, 347–363 (1992).
15. W. H. Miller and G. D. Bernard, ‘‘Averaging over the fovealreceptor aperture curtails aliasing,’’ Vis. Res. 23, 1365–1369 (1983).
16. B. R. Horowitz, ‘‘Theoretical considerations of the retinalreceptor as a waveguide,’’ in Vertebrate Photoreceptor Op-tics, J. M. Enoch and F. L. Tobey, eds. (Springer-Verlag,Berlin 1981), pp. 219–300.
17. R. W. Rodieck, The Vertebrate Retina (Freeman, San Fran-cisco, Calif., 1973).
18. W. H. Miller and A. W. Snyder, ‘‘Optical function of human
peripheral cones,’’ Vis. Res. 13, 2185–2194 (1973).19. A. W. Snyder and C. Pask, ‘‘The Stiles–Crawford effect—
explanation and consequences,’’ Vis. Res. 13, 1115–1137(1973).
20. J. A. Enoch and F. L. Tobey, ‘‘Use of waveguide parameterV to determine the difference in the index of refraction be-tween the rod outer segment and the interstitial matrix,’’ J.Opt. Soc. Am. 68, 1130–1134 (1978).
21. H. Metcalf, ‘‘Stiles–Crawford apodization,’’ J. Opt. Soc. Am.55, 72–74 (1965).
22. S. Marcos and R. Navarro, ‘‘Determination of the fovealcone spacing by ocular speckle interferometry: limitingfactors and acuity predictions,’’ submitted to J. Opt. Soc.Am. A .
23. P. Artal, J. Santamarıa, and J. Bescos, ‘‘Retrieval of waveaberration of human eyes from actual point-spread-functiondata,’’ J. Opt. Soc. Am. A 5, 1203–1206 (1988).
24. H. C. Howland and B. Howland, ‘‘A subjective method forthe measurement of high-order aberrations of the eye,’’ J.Opt. Soc. Am. 67, 1508–1518 (1977).
25. A. Arnulf, J. Santamarıa, and J. Bescos, ‘‘A cinemato-graphic method for the dynamic study of the image forma-tion by the human eye. Microfluctuations of the accommo-dation,’’ J. Opt. (Paris) 12, 123–128 (1981).
26. F. Berny, ‘‘Correlation de phase entre deux sources formeessur une surface diffusante. Application entre deux sourcesformees a la retine humaine,’’ Vis. Res. 12, 1631–1645(1972).
27. J. Santamarıa, P. Artal, and J. Bescos, ‘‘Determination ofthe point-spread function of human eyes using a hybridoptical–digital method,’’ J. Opt. Soc. Am. A 4, 1109–1114(1987).
28. P. Artal and R. Navarro, ‘‘Monochromatic modulationtransfer function of the human eye for different pupil diam-eters: an analytical expression,’’ J. Opt. Soc. Am. A 11,246–249 (1994).
29. Yu. A. Kravtsov and A. Y. Saichev, ‘‘Properties of coherentwaves reflected in a turbulent medium,’’ J. Opt. Soc. Am. A2, 2100–2105 (1985).
30. R. L. Fante, ‘‘Imaging of an arbitrary object behind a ran-dom phase screen using light of arbitrary coherence,’’ J.Opt. Soc. Am. A 2, 2318–2328 (1985).
31. T. Mavroidis, J. C. Dainty, and M. J. Northcott, ‘‘Imaging ofcoherently illuminated objects through turbulence: plane-wave illumination,’’ J. Opt. Soc. Am. A 7, 348–355 (1990).
32. J. C. Dainty, ‘‘Diffraction-limited imaging of stellar objectsusing telescopes of low optical quality,’’ Opt. Commun. 7,129–134 (1973).
33. D. P. Karo and A. M. Schneiderman, ‘‘Speckle interferom-etry with severely aberrated telescopes,’’ J. Opt. Soc. Am.67, 1277–1278 (1977).
34. D. L. Fried, ‘‘Optical resolution through a randomly inho-mogeneous medium for very long and very short expo-sures,’’ J. Opt. Soc. Am. 56, 1372–1379 (1996).
35. D. Korff, ‘‘Analysis of a method for obtaining near-diffraction-limited information in the presence of atmo-spheric turbulence,’’ J. Opt. Soc. Am. 63, 971–980 (1973).
36. P. Artal, S. Marcos, R. Navarro, and D. R. Williams, ‘‘Oddaberrations and double-pass measurements of retinal im-age quality,’’ J. Opt. Soc. Am. A 12, 195–201 (1995).
37. F. Roddier, G. Ricort, and C. Roddier, ‘‘Defocusing effects inastronomical speckle interferometry,’’ Opt. Commun. 24,281–284 (1978).