By installing this software, you accept and agree to be bound by the terms of this agreement. You are free to use and distribute this software for non-commercial purposes. This copyright notice is to be distributed with it, unchanged. By installing this software, you accept and agree to be bound by the terms of this agreement. THE SOFTWARE FURNISHED UNDER THIS AGREEMENT IS PROVIDED ON AN 'AS IS' BASIS, WITHOUT ANY WARRANTIES OR REPRESENTATIONS EXPRESS OR IMPLIED, INCLUDING, BUT NOT LIMITED TO, ANY IMPLIED WARRANTIES OF MERCHANTABILITY OR FITNESS FOR A PARTICULAR PURPOSE. IT IS SOLELY THE RESPONSIBILITY OF THE CONSUMER TO DETERMINE THE SOFTWARE'S SUITABILITY FOR A PARTICULAR PURPOSE OR USE. THE COPYRIGHT HOLDER, IMAGE SCIENCE ASSOCIATES LLC, AND ANYONE ELSE WHO HAS BEEN INVOLVED IN THE CREATION, PRODUCTION, DELIVERY, OR SUPPORT OF THIS SOFTWARE, WILL IN NO EVENT BE LIABLE FOR DIRECT, INDIRECT, SPECIAL, CONSEQUENTIAL, OR INCIDENTAL DAMAGES RESULTING FROM ANY DEFECT, ERROR, OR OMISSION IN THE SOFTWARE OR FROM ANY OTHER EVENTS, INCLUDING, BUT NOT LIMITED TO, ANY INTERRUPTION OF SERVICE, LOSS OF PROFITS OR GOOD WILL, LEGAL ACTION OR ANY OTHER CONSEQUENTIAL DAMAGES. THE USER ASSUMES ALL RESPONSIBILITY ARISING FROM THE USE OF THIS SOFT-WARE, FOR WHICH THE COPYRIGHT HOLDER SHALL HAVE NO LIABILITY, REGARD-LESS OF WHETHER SUCH USE IS LAWFUL OR FORESEEABLE. IMAGE SCIENCE ASSOCIATES LLC SHALL HAVE NO LIABILITY FOR ANY DATA OR PROGRAMS STORED BY OR USED WITH THIS SOFTWARE, INCLUDING THE COSTS OF RECOVERING SUCH DATA OR PROGRAMS. THE AUTHOR AND COPYRIGHT HOLDER RESERVES THE RIGHT TO MAKE CORRECTIONS OR IMPROVEMENTS TO THE INFORMATION PROVIDED AND TO THE RELATED SOFTWARE AT ANY TIME, WITHOUT NOTICE.
ImCheck3 Guide
2
1. Installation of the MCR
1. Locate. MCRInstaller.exe, which is supplied with the ImCheck3 distribution.
2. Double-click on this file.
3. The MCRInstaller opens a command window and begins preparation for the installation.
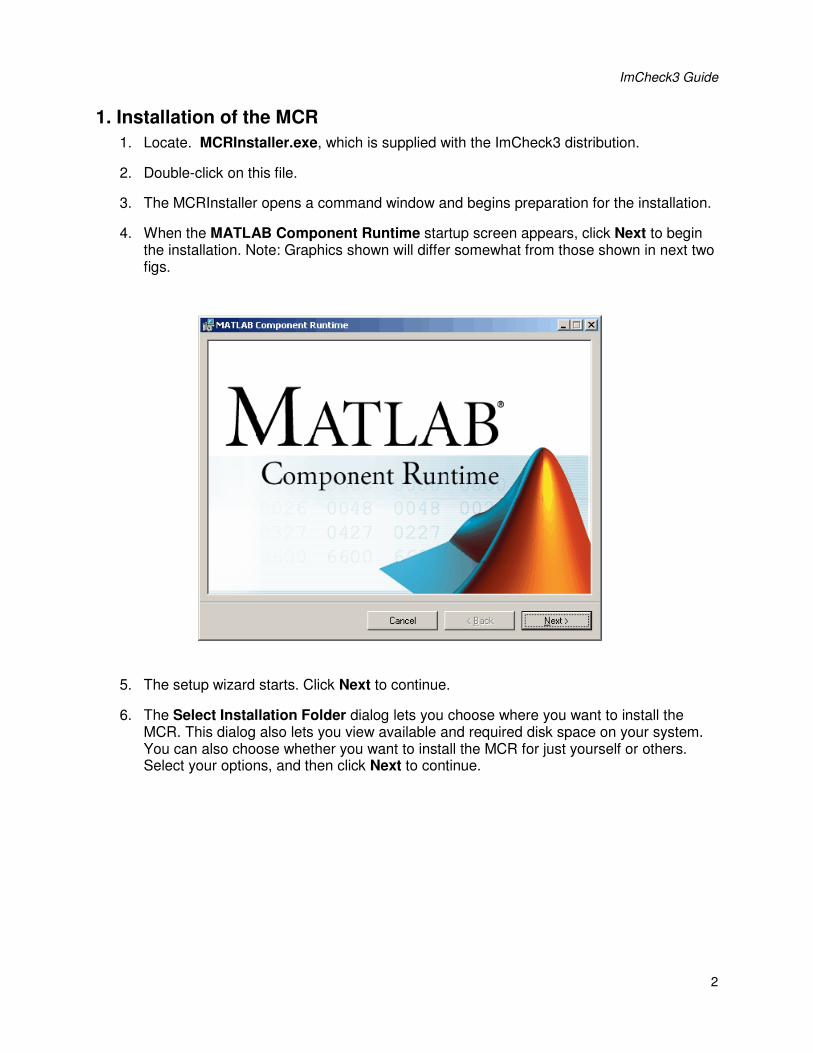
4. When the MATLAB Component Runtime startup screen appears, click Next to begin the installation. Note: Graphics shown will differ somewhat from those shown in next two figs.
5. The setup wizard starts. Click Next to continue.
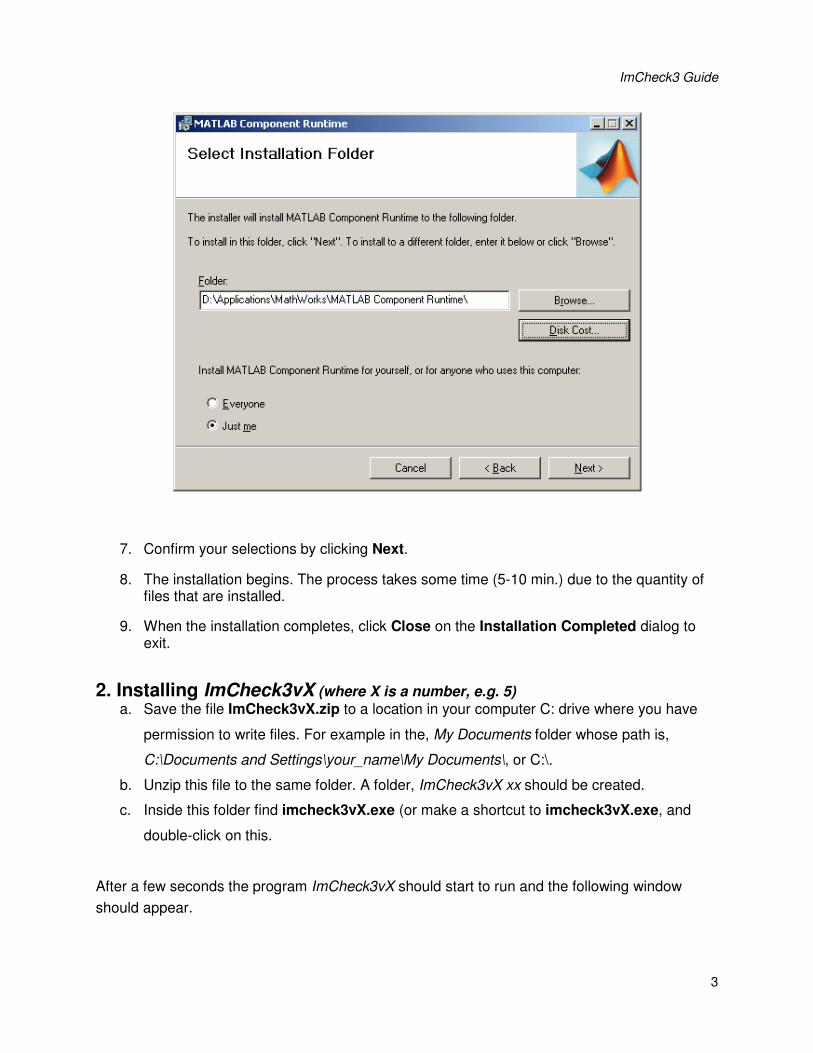
6. The Select Installation Folder dialog lets you choose where you want to install the MCR. This dialog also lets you view available and required disk space on your system. You can also choose whether you want to install the MCR for just yourself or others. Select your options, and then click Next to continue.
ImCheck3 Guide
3
7. Confirm your selections by clicking Next.
8. The installation begins. The process takes some time (5-10 min.) due to the quantity of files that are installed.
9. When the installation completes, click Close on the Installation Completed dialog to exit.
2. Installing ImCheck3vX (where X is a number, e.g. 5) a. Save the file ImCheck3vX.zip to a location in your computer C: drive where you have
permission to write files. For example in the, My Documents folder whose path is,
C:\Documents and Settings\your_name\My Documents\, or C:\.
b. Unzip this file to the same folder. A folder, ImCheck3vX xx should be created.
c. Inside this folder find imcheck3vX.exe (or make a shortcut to imcheck3vX.exe, and
double-click on this.
After a few seconds the program ImCheck3vX should start to run and the following window
should appear.
ImCheck3 Guide
4
Figure 1: Initial ImCheck3v5 console window
If this console window appears, with a title of ImCheck3, things are going well. This window
should have five drop-down menus; File, Q13 test, SFR test, Inspector and Help. In addition,
simple instructions should appear in the window.
3. Running ImCheck3 You will have started ImCheck3 when you unzipped the distribution file and ‘double-clicked’ the
(icon for) the file ImCheck3vX.exe. The windows shown in Fig. 1 should have appeared.
Open and read in image data from a file using the File -> Open. A file selection dialog window
will open for you to select a file. Following file selection and reading a small (preview) image is
displayed in the ImCheck3 console. Reading the data into computer memory can take about 30
sec or more, depending on the file size. When the preview image is shown, you have not started
any analysis of the image data. The next step is to choose from the Q13 test, SFR test or
Inspector menus.
Choose to run one of the tests by selecting from the Q13 test, SFR test, or Inspector
menus. The tests, as you can see in Fig. 2, are for the Q13 step tablet target, or for SFR
analysis using several test targets. If a file has not been already chosen (as in step 1.) from the
File - > Open menu, a file selection dialog window will display. Figure 3 shows the basics steps
ImCheck3 Guide
5
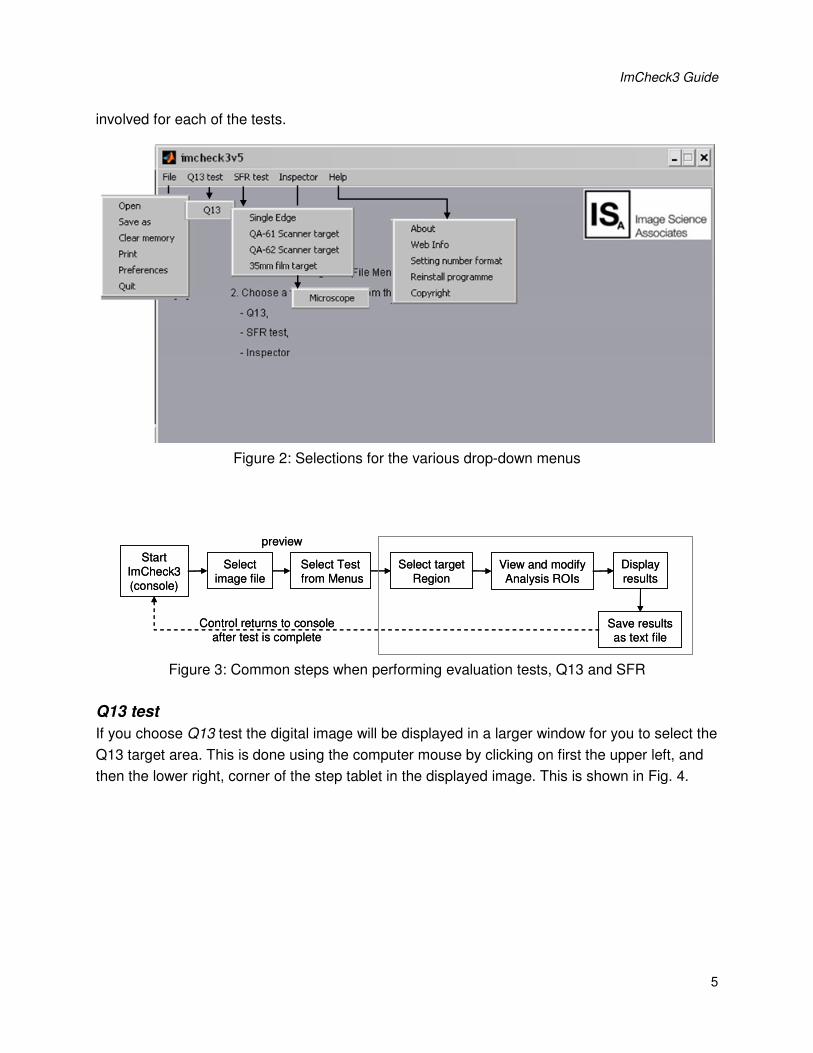
involved for each of the tests.
Figure 2: Selections for the various drop-down menus
Select
image file
Select Test
from Menus
Select target
Region
Display
results
Start
ImCheck3
(console)
Save results as text file
preview
Control returns to console after test is complete
View and modify
Analysis ROIs
Select
image file
Select Test
from Menus
Select target
Region
Display
results
Start
ImCheck3
(console)
Save results as text file
preview
Control returns to console after test is complete
View and modify
Analysis ROIs
Figure 3: Common steps when performing evaluation tests, Q13 and SFR
Q13 test
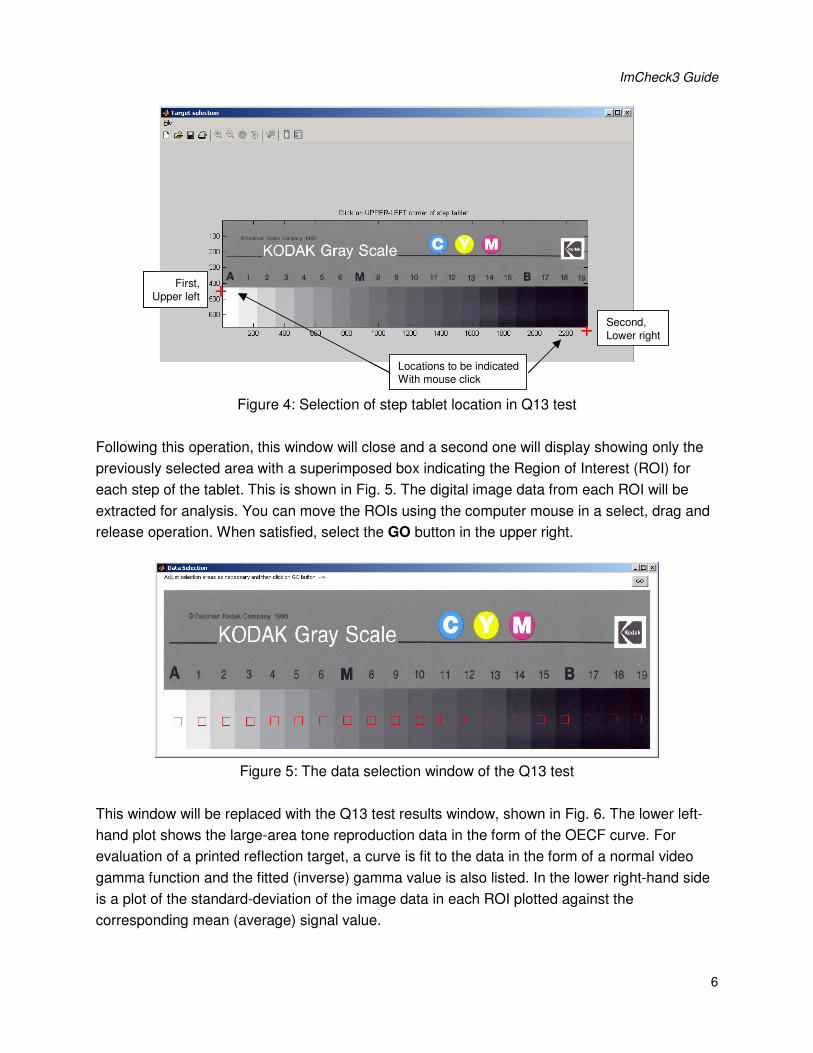
If you choose Q13 test the digital image will be displayed in a larger window for you to select the
Q13 target area. This is done using the computer mouse by clicking on first the upper left, and
then the lower right, corner of the step tablet in the displayed image. This is shown in Fig. 4.
ImCheck3 Guide
6
+
+
Locations to be indicatedWith mouse click
First,
Upper left
Second,
Lower right
+
+
Locations to be indicatedWith mouse click
First,
Upper left
Second,
Lower right
Figure 4: Selection of step tablet location in Q13 test
Following this operation, this window will close and a second one will display showing only the
previously selected area with a superimposed box indicating the Region of Interest (ROI) for
each step of the tablet. This is shown in Fig. 5. The digital image data from each ROI will be
extracted for analysis. You can move the ROIs using the computer mouse in a select, drag and
release operation. When satisfied, select the GO button in the upper right.
Figure 5: The data selection window of the Q13 test
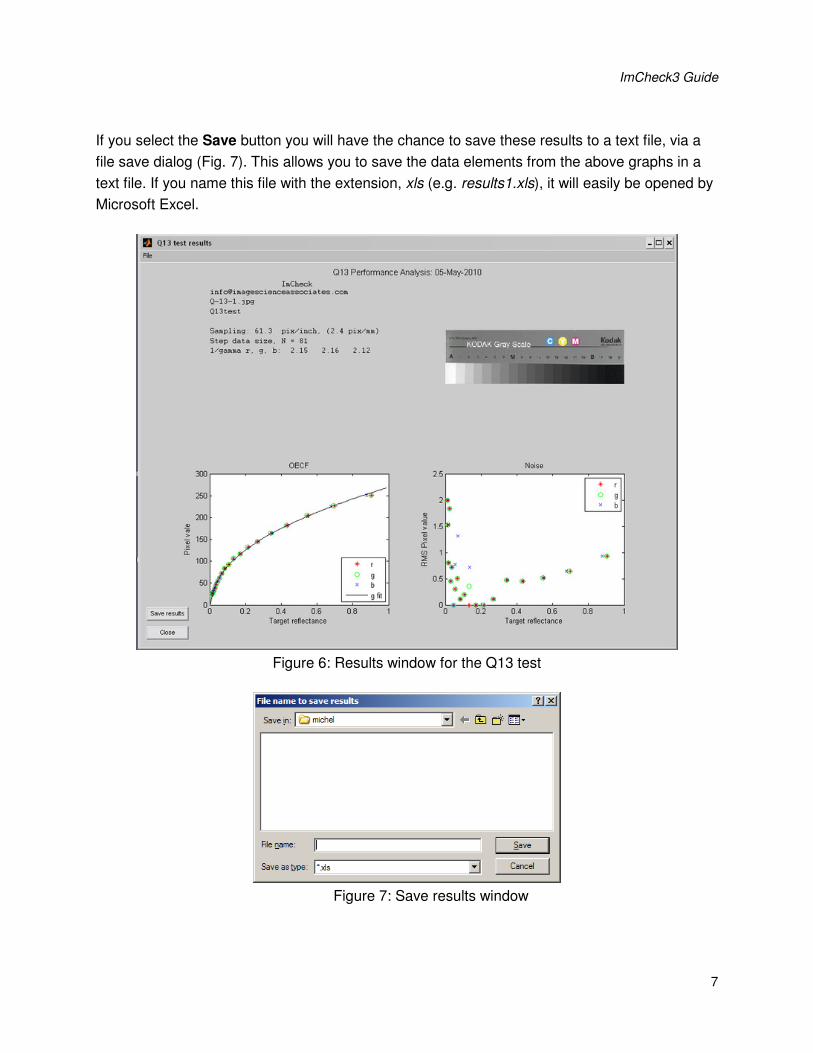
This window will be replaced with the Q13 test results window, shown in Fig. 6. The lower left-
hand plot shows the large-area tone reproduction data in the form of the OECF curve. For
evaluation of a printed reflection target, a curve is fit to the data in the form of a normal video
gamma function and the fitted (inverse) gamma value is also listed. In the lower right-hand side
is a plot of the standard-deviation of the image data in each ROI plotted against the
corresponding mean (average) signal value.
ImCheck3 Guide
7
If you select the Save button you will have the chance to save these results to a text file, via a
file save dialog (Fig. 7). This allows you to save the data elements from the above graphs in a
text file. If you name this file with the extension, xls (e.g. results1.xls), it will easily be opened by
Microsoft Excel.
Figure 6: Results window for the Q13 test
Figure 7: Save results window
ImCheck3 Guide
8
SFR Test
There are four analysis procedures under this menu item;
• Single Edge
• QA-61 Scanner Target
• QA-62 Scanner Target
• 36 mm film Target
The most flexible is the Single Edge method which performs SRF evaluation on any single
edge feature. Candidate test targets to use with this analysis are shown in the Appendix. If you
chose the Single Edge the selected digital image will be displayed in the center of the
ImCheck3 Console window of Fig. 1.
Since this analysis can be done using any edge, the image sampling cannot be inferred
from the image data alone. This is specified using a data sampling dialogue (Fig. 8). This is
done by either indicating pixels/inch (ppi), or sampling interval in mm. If a digital camera is being
evaluated, then the image sampling on the target may be unknown. In this case simply selecting
OK to the sampling of 1.0 (pixels) is recommended. This will cause the results to be reported as
a function of cy/pixel, rather than cy/mm.
Figure 8: Data sampling selection window
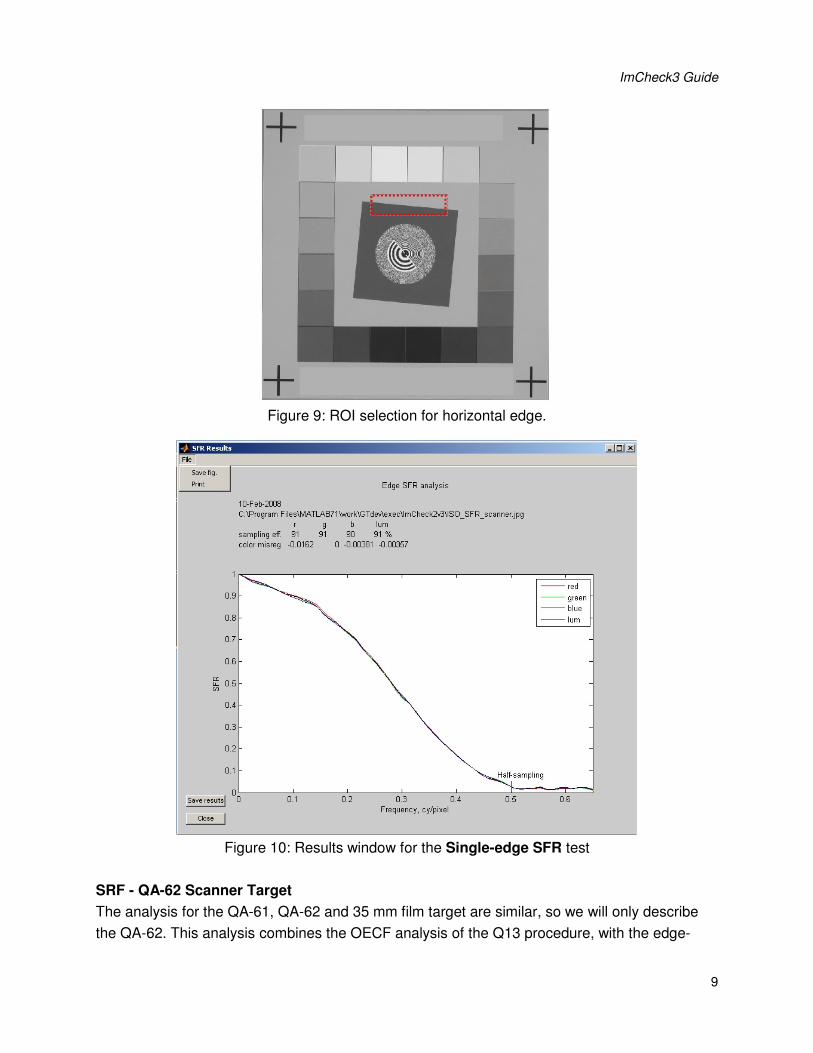
Next a larger window for you to select a region of interest (ROI) will appear. This is done by
using the computer mouse in a ‘rubber-band’ manner. An example is shown in Fig. 9. You can
select a horizontal or vertical edge. After a single edge has been selected, this window will
close.
After a few seconds, the results window will be displayed. Figure 10 shows the summary
results that are displayed after the test is complete. The plot shows the results of the slanted-
edge analysis in the form of Spatial Frequency Response (SFR). From these data, the sampling
efficiency is computed as the ratio of 10%-SFR_frequency and the half-sampling frequency.
You can choose to save the results or close this window using the available buttons.
ImCheck3 Guide
9
Figure 9: ROI selection for horizontal edge.
Figure 10: Results window for the Single-edge SFR test
SRF - QA-62 Scanner Target
The analysis for the QA-61, QA-62 and 35 mm film target are similar, so we will only describe
the QA-62. This analysis combines the OECF analysis of the Q13 procedure, with the edge-
ImCheck3 Guide
10
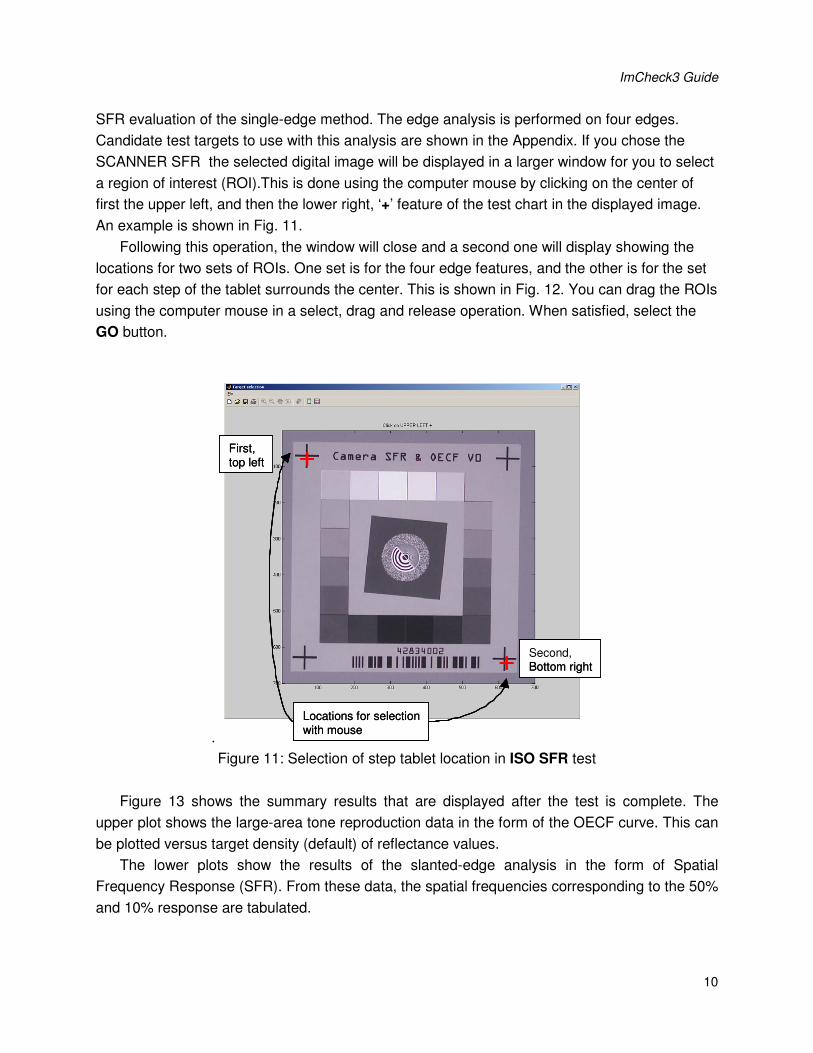
SFR evaluation of the single-edge method. The edge analysis is performed on four edges.
Candidate test targets to use with this analysis are shown in the Appendix. If you chose the
SCANNER SFR the selected digital image will be displayed in a larger window for you to select
a region of interest (ROI).This is done using the computer mouse by clicking on the center of
first the upper left, and then the lower right, ‘+’ feature of the test chart in the displayed image.
An example is shown in Fig. 11.
Following this operation, the window will close and a second one will display showing the
locations for two sets of ROIs. One set is for the four edge features, and the other is for the set
for each step of the tablet surrounds the center. This is shown in Fig. 12. You can drag the ROIs
using the computer mouse in a select, drag and release operation. When satisfied, select the
GO button.
.
Locations for selectionwith mouse
+
+
First,top left
Second,Bottom right
Locations for selectionwith mouse
+
+
First,top left
Bottom right
Locations for selectionwith mouse
+
+
First,top left
Second,Bottom right
Locations for selectionwith mouse
+
+
First,top left
Bottom right
Figure 11: Selection of step tablet location in ISO SFR test
Figure 13 shows the summary results that are displayed after the test is complete. The
upper plot shows the large-area tone reproduction data in the form of the OECF curve. This can
be plotted versus target density (default) of reflectance values.
The lower plots show the results of the slanted-edge analysis in the form of Spatial
Frequency Response (SFR). From these data, the spatial frequencies corresponding to the 50%
and 10% response are tabulated.
ImCheck3 Guide
11
Figure 12: The data selection window of the ISO SFR test
Figure 13: Results window for the SFR QA-62 test
ImCheck3 Guide
12
A Save Results button is displayed, as shown in Fig. 13. After you have saved your results
or decided not to (Cancel), you may close the Results window to continue analyzing other test
image files, or otherwise running ImCheck3 from the console window of Fig. 1
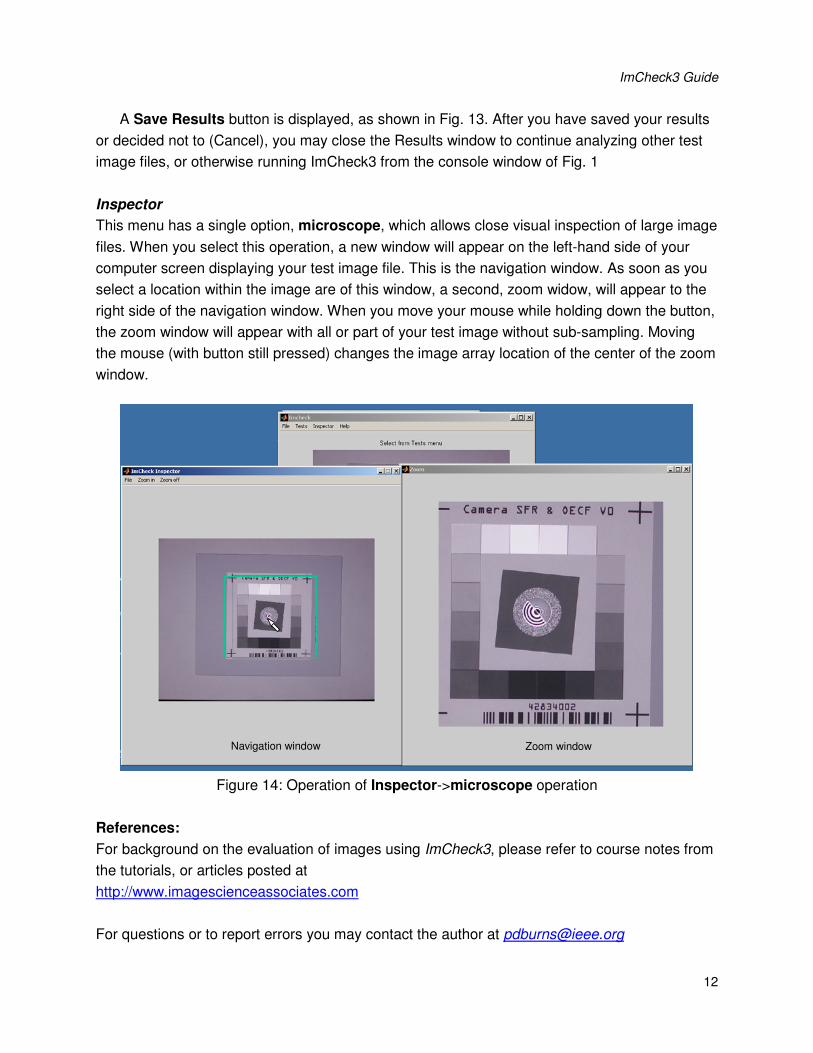
Inspector
This menu has a single option, microscope, which allows close visual inspection of large image
files. When you select this operation, a new window will appear on the left-hand side of your
computer screen displaying your test image file. This is the navigation window. As soon as you
select a location within the image are of this window, a second, zoom widow, will appear to the
right side of the navigation window. When you move your mouse while holding down the button,
the zoom window will appear with all or part of your test image without sub-sampling. Moving
the mouse (with button still pressed) changes the image array location of the center of the zoom