180
IMD WORLD DIGITAL COMPETITIVENESS RANKING 2019 IMD WORLD COMPETITIVENESS CENTER

2019
IMD WORLD
IMD
WOR
LD D
IGIT
AL C
OMPE
TITI
VEN
ESS
RAN
KIN
G
IMD, IMD INTERNATIONAL, REAL LEARNING. REAL IMPACT, IMD BUSINESS SCHOOL and IMD WORLD COMPETITIVENESS YEARBOOK are trademarks of IMD- International Institute for Management Development
DIGITAL COMPETITIVENESSRANKING 2019
IMD is an independent business school,
with Swiss roots and global reach, expert
in developing leaders and transforming
organizations to create ongoing impact.
For the last 8 consecutive years, IMD
has been ranked TOP 3 in executive
education worldwide – FIRST in open
programs (Financial Times 2012-2019).
www.imd.org
IMD WORLDCOMPETITIVENESSCENTER
IMD WORLDCOMPETITIVENESSCENTER

1IMD WORLD DIGITAL COMPETIT IVENESS RANKING 2019
Preface
How prepared are economies to productively use the transformative technologies of our time? Do countries have a feasible framework to facilitate the adoption and use of digitalization? And how ready are they to embrace the implications of digital disruption?
Questions like the above were the trigger to construct the IMD World Digital Competitiveness Ranking (WDCR) in 2017. We are excited to present its 3rd edition!
Technology and its rapid changing nature not only affect how businesses perform, but also how countries function and prepare for the future. Governments around the world are investing heavily in their digital economy to enhance value creation and prosperity. The WDRC assesses the capacity of 63 economies to adopt and explore digital technologies leading to transformation in government practices, business models and society in general.
To evaluate an economy, WDCR examines three factors: knowledge, which measures the know-how necessary to discover, understand and build new technologies; technology, which evaluates the overall context that enables the development of digital technologies; and future readiness, which assesses the level of preparedness to exploit digital transformations.
The latest ranking corroborates a trend that we have acknowledged before: economies based on individuals who adapt new technologies and industries, and show flexibility to innovations, are the ones that perform well in the digital ranking. An additional observation is that there is a correlation between those economies which advance the frontiers of knowledge and those that exhibit high digital competitiveness. An important driver for digital competitiveness is related to the strength of the institutional environment. The aspect of political stability is explored further in the accompanying essay.
Like our other publications, the IMD World Digital Competitiveness Ranking is the beneficiary of the support of many stakeholders. Our Partner Institutes, the IMD Alumni community and our Panel of Experts all generously offer data, insights and time to help materialize such a report. We are indebted and grateful for their support.
Professor Arturo BrisDirectorIMD World Competitiveness Center
Dr Christos CabolisChief Economist & Head of OperationsIMD World Competitiveness Center

IMD WORLD DIGITAL COMPETIT IVENESS RANKING 20192
Table of Contents
Preface ������������������������������������������������������������������������������������������������������������������������������������������������������������������1
User’s Guide to the IMD World Digital Competitiveness Ranking �����������������������������������������������������������������������12Overall and Breakdown Digital Rankings ����������������������������������������������������������������������������������������������������12Digital Competitiveness Country Profiles ����������������������������������������������������������������������������������������������������13
Digital Competitiveness, political stability and investments in technology�����������������������������������������������������������16
IMD World Digital Competitiveness Ranking 2019 ����������������������������������������������������������������������������������������������25
Methodology in a Nutshell �����������������������������������������������������������������������������������������������������������������������������������28
What is the IMD World Digital Competitiveness ranking? �����������������������������������������������������������������������������������29
The 2019 IMD World Competitiveness Rankings: Selected Breakdowns ����������������������������������������������������������30Populations greater than 20 million �������������������������������������������������������������������������������������������������������������30Populations less than 20 million ������������������������������������������������������������������������������������������������������������������31GDP per capita greater than $20,000 ���������������������������������������������������������������������������������������������������������32GDP per capita less than $20,000 ��������������������������������������������������������������������������������������������������������������33Europe- Middle East - Africa ������������������������������������������������������������������������������������������������������������������������34Asia - Pacific ������������������������������������������������������������������������������������������������������������������������������������������������35The Americas ����������������������������������������������������������������������������������������������������������������������������������������������35Knowledge ���������������������������������������������������������������������������������������������������������������������������������������������������36Technology ��������������������������������������������������������������������������������������������������������������������������������������������������37Future Readiness ����������������������������������������������������������������������������������������������������������������������������������������38Factor Rankings - 5 years overview ������������������������������������������������������������������������������������������������������������40Sub-factor Rankings ������������������������������������������������������������������������������������������������������������������������������������42
Digital Competitiveness Country Profiles ������������������������������������������������������������������������������������������������������������43
Appendices and Sources�����������������������������������������������������������������������������������������������������������������������������������170
Notes and Sources by Criteria���������������������������������������������������������������������������������������������������������������������������172Factor I: Knowledge ����������������������������������������������������������������������������������������������������������������������������������172Factor II: Technology ���������������������������������������������������������������������������������������������������������������������������������174Factor III: Future Readiness ����������������������������������������������������������������������������������������������������������������������176
Index to Criteria �������������������������������������������������������������������������������������������������������������������������������������������������178
The IMD World Digital Competitiveness Ranking 2019
3IMD WORLD DIGITAL COMPETIT IVENESS RANKING 2019
World Digital Competitiveness Country Profiles
Argentina ��������������������������������������������������������� 44Australia����������������������������������������������������������� 46Austria ������������������������������������������������������������� 48Belgium������������������������������������������������������������ 50Brazil���������������������������������������������������������������� 52Bulgaria ����������������������������������������������������������� 54Canada ������������������������������������������������������������ 56Chile ���������������������������������������������������������������� 58China ��������������������������������������������������������������� 60Colombia ��������������������������������������������������������� 62Croatia ������������������������������������������������������������� 64Cyprus ������������������������������������������������������������� 66Czech Republic ����������������������������������������������� 68Denmark ���������������������������������������������������������� 70Estonia������������������������������������������������������������� 72Finland ������������������������������������������������������������� 74France ������������������������������������������������������������� 76Germany ���������������������������������������������������������� 78Greece ������������������������������������������������������������� 80Hong Kong SAR ���������������������������������������������� 82Hungary ����������������������������������������������������������� 84Iceland ������������������������������������������������������������� 86India ����������������������������������������������������������������� 88Indonesia ��������������������������������������������������������� 90Ireland�������������������������������������������������������������� 92Israel ���������������������������������������������������������������� 94Italy ������������������������������������������������������������������ 96Japan ��������������������������������������������������������������� 98Jordan������������������������������������������������������������ 100Kazakhstan ���������������������������������������������������� 102Korea Rep ����������������������������������������������������� 104Latvia ������������������������������������������������������������� 106
Lithuania �������������������������������������������������������� 108Luxembourg��������������������������������������������������� 110Malaysia �������������������������������������������������������� 112Mexico ����������������������������������������������������������� 114Mongolia �������������������������������������������������������� 116Netherlands ��������������������������������������������������� 118New Zealand ������������������������������������������������� 120Norway ���������������������������������������������������������� 122Peru ��������������������������������������������������������������� 124Philippines ����������������������������������������������������� 126Poland ����������������������������������������������������������� 128Portugal ��������������������������������������������������������� 130Qatar�������������������������������������������������������������� 132Romania �������������������������������������������������������� 134Russia������������������������������������������������������������ 136Saudi Arabia �������������������������������������������������� 138Singapore ������������������������������������������������������ 140Slovak Republic ��������������������������������������������� 142Slovenia ��������������������������������������������������������� 144South Africa ��������������������������������������������������� 146Spain ������������������������������������������������������������� 148Sweden���������������������������������������������������������� 150Switzerland ���������������������������������������������������� 152Taiwan, China ������������������������������������������������ 154Thailand ��������������������������������������������������������� 156Turkey ������������������������������������������������������������ 158UAE ��������������������������������������������������������������� 160Ukraine ���������������������������������������������������������� 162United Kingdom ��������������������������������������������� 164USA ��������������������������������������������������������������� 166Venezuela ������������������������������������������������������ 168

IMD WORLD DIGITAL COMPETIT IVENESS RANKING 20194

5IMD WORLD DIGITAL COMPETIT IVENESS RANKING 2019
The IMD World Competitiveness Center
For thirty years, the IMD World Competitiveness Center has pioneered research on how countries and companies compete to lay the foundations for sustainable value creation. The competitiveness of nations is probably one of the most significant developments in modern management and IMD is committed to leading the field. The World Competitiveness Center conducts its mission in cooperation with a network of 56 Partner Institutes worldwide to provide the government, business and academic communities with the following services:
• Competitiveness Special Reports• Competitiveness Prognostic Reports• Workshops/Mega Dives on competitiveness• IMD World Competitiveness Yearbook• IMD World Digital Competitiveness Ranking
• IMD World Talent Ranking
The IMD World Competitiveness Center team:
At IMD Professor Arturo Bris Director of The IMD World Competitiveness Center Christos Cabolis Chief Economist & Head of Operations José Caballero Senior Economist Maëlle Desard Marketing Specialist Madeleine Hediger Data Research and Online Services Specialist Catherine Jobin Order and Sales Administrator William Milner Research Projects Associate Manager Marco Pistis Research Specialist Maryam Zargari Research Specialist At KAESCO Jean-François KaeserConsulting
We also have the privilege of collaborating with a unique network of Partner Institutes, and other organizations, which guarantees the relevance of the data gathered�
Contact:Tel: + 41 21/618 02 51E-mail : wccinfo@imd�orgInternet: www�imd�org/wcc

IMD WORLD DIGITAL COMPETIT IVENESS RANKING 20196
Partner Institutes
We would like to express our deep appreciation for the contribution of our Partner Institutes, enabling an extensive coverage of competitiveness in their home countries. The following Institutes and people supplied data from national sources and helped distribute the survey questionnaires:
Argentina
Research Program on Economic Development and Institutions Faculty of Economic SciencesCatholic University of Argentina, Buenos Aireshttp://www.uca.edu.ar
Dr. Alicia Caballero, DeanDr. Marcelo F. Resico, Senior EconomistMr. Ignacio Ramaglio, Research Assistant
Australia
CEDA – Committee for Economic Development of Australiawww.ceda.com.au
Jarrod Ball, Chief EconomistRoxanne Punton, Director, External Affairs
Austria
Federation of Austrian Industries, ViennaAustrian Institute of Economic Research, Viennahttp://www.iv-net.at
Dr. Christian Helmenstein, Chief EconomistMs. Helena ZwicklMr. Michael Oliver
Belgium
FEB - Federation of Enterprises in Belgium, Brusselswww.vbo-feb.be
Ms. Carole Dembour, Economist
Brazil
Fundação Dom Cabral, Innovation and Entrepreneurship Centerhttps://www.fdc.org.br/
Carlos Arruda, Professor and Director FDC Innovation and Entrepreneurship CenterAna Burcharth, ProfessorDebora Rodrigues Dias, Researcher
Bulgaria
Center for the Study of Democracy, Sofiawww.csd.bg
Mr. Ruslan Stefanov, Director, Economic ProgramMs. Daniela Mineva, Research Fellow, Economic ProgramMr. Martin Vladimirov, Analyst, Economic ProgramDr. Todor Galev, Senior Analyst, Economic Program
Canada
Information and Communications Technology Council (ICTC)www.ictc-ctic.ca
Ms. Alexandra Cutean, Director Research & Policy
Chile
Universidad de ChileFacultad de Economía y Negocios (FEN)www.fen.uchile.cl
Dr. Enrique Manzur, Vice DeanDr. Sergio Olavarrieta, Associate ProfessorDr. Pedro Hidalgo, Associate Professor
China
China Institute for Development Planning, Tsinghua University
Prof. Yang Yongheng, Associate Dean of School of Public Policy & Management, Executive Associate Director of China Institute for Development PlanningProf. Wang Youqiang, Associate Director of China Institute for Development PlanningDr. Gong Pu, Research Fellow

7IMD WORLD DIGITAL COMPETIT IVENESS RANKING 2019
Mr. Wang Hongshuai, PhD CandidateMs. Zhang Ruijun, PhD CandidateMs. Song Wenjuan, PhD CandidateMs. Jiang Xueying, PhD CandidateMr. Wang Jiancheng, PhD Candidate
Colombia
National Planning Departmenthttps://www.dnp.gov.co/DNPN/Paginas/default.aspx
Gloria Amparo Alonso Másmela, Director, National Department of PlanningJuan Sebastián Robledo Botero, Director, Innovation and Private Sector Development
Croatia
National Competitiveness Councilhttp://konkurentnost.hr/en/
Ivica Mudrinic, PresidentJadranka Gable, AdvisorKresimir Jurlin,, PhD, Researcher
Cyprus
Economics Research Centre, University of CyprusURL http://ucy.ac.cy/erc/en/
Sofronis Clerides, Professor of EconomicsNicoletta Pashourtidou, Assistant DirectorSofia Andreou, Research Officer
Czech Republic
Consumer Forum (Spotřebitelské fórum)www.spotrebitelskeforum.cz
Dr. Kryštof Kruliš
Denmark
Confederation of Danish Industryhttps://di.dk/English/Pages/English.aspx
Allan Sørensen, Chief analyst
Estonia
Estonian Institute of Economic Research (EKI)www.ki.ee
Enterprise Estonia (EAS)
Ms. Marje Josing, Director
Mr. Tanel Rebane, Director of Trade Development Agency
Finland
ETLA - The Research Institute of the Finnish Economywww.etla.fi
Ville Kaitila, ResearcherMarkku Lehmus, Head of ForecastingAki Kangasharju, Managing Director
France
Business France, Parishttp://en.businessfrance.fr/
Ms. Sylvie Montout, Economist
Greece
Federation of Industries of Greece (SBE), Thessaloniki
Foundation for Economic and Industrial Research (FEIR/IOBE), Athens
Dr. Christos Georgiou, Director, Research and Documentation DepartmentMr. Constantinos Styliaras, Economist, Research and Documentation Department
Aggelos Tsakanikas, Assistant Professor National Technical University of Athens - Head of Entepreneurship Observatory Sophia Stavraki, Research Associate
Hong Kong SAR
Hong Kong Trade Development Councilwww.hktdc.com
Mr. Billy Wong, Deputy Director of ResearchMs. Doris Fung, Economist

IMD WORLD DIGITAL COMPETIT IVENESS RANKING 20198
Hungary
ICEG European Center, Budapesthttp://icegec.org
National University of Public Service,Competitiveness and Fiscal Stability Research Group, Budapest - http://en.uni-nke.hu/
Ms. Renata Anna Jaksa, DirectorDr. Oliver Kovacs, Senior Research Fellow
Prof. Dr. Magdolna Csath, Research Professor
Iceland
Icelandic Chamber of Commerce, Reykjavikwww.chamber.is
Mr. Konrad S. Gudjonsson, Chief EconomistMr. Isak Einar Runarsson, Economic Analyst
India
National Productivity Council, New Delhiwww.npcindia.gov.in
Dr.K.P.Sunny, Director & Head (Economic Services)Mr.Rajesh Sund, Deputy Director (Economic Services)Dr.Rajat Sharma, Deputy Director (Economic Services)
Indonesia
Lembaga Management, Faculty of Economics and Business, University of Indonesia, Jakartahttp://www.lmfeui.com/index.php
NuPMK Consullting, Jakartahttp://nupmk.co.id
Dr. Toto Pranoto, Managing DirectorDr. Willem A. Makaliwe, Associate Director of Research & ConsultingBayuadi Wibowo, Group Head of Research ServicesArza Faldy Prameswara, ResearcherTaufiq Nur, ResearcherHelwa Salsabila, Researcher
Ms. Tini Moeis, Managing Director,Mr. Firmantoko Soetopo, Director
Ireland
IDA Ireland, Investment and Development Agency, Dublinwww.idaireland.com
Karen Law, Strategy & Planning Executive
Israel
The Federation of Israeli Chambers of Commerce, Tel-Avivwww.chamber.org.il
Israela Many – Deputy Managing Director of Economy and TaxItay Boyman – Executive Economist
Italy
CONFINDUSTRIA, Economic Research Department, Rome www.confindustria.it
Dr. Andrea Montanino, Chief Economist Dr. Cristina Pensa, Economist Dr. Lorena Scaperrotta, Economist
Japan
Mitsubishi Research Institute, Inc., TokyoResearch Center for Policy and Economywww.mri.co.jp
Dr. Hirotsugu Sakai, Research Director
Jordan
Ministry of planning and International Cooperationwww.mop.gov.jo
Basem Kanan, Head of Policies and Studies DirectorateGhada Issa, Head of Competitiveness Division
Kazakhstan
Economic Research Institute, JSC of the Ministry of National Economy of the Republic of Kazakhstan, Nur-Sultan www.economy.kz
Yerlik Karazhan, Chairman of the Board;Shakharbanu Zhakupova, Deputy Chairman of the Board; Bakytgul Khambar, Director, Center for Strategic Research and Sustainable Development; Bayan Abdrakhmanova, Deputy Director, Center for Strategic Research and Sustainable Development; Natalya Novokshanova, Leading Expert, Center for

9IMD WORLD DIGITAL COMPETIT IVENESS RANKING 2019
Strategic Research and Sustainable Development; Karlygash Bolat, Leading Expert, Center for Strategic Research and Sustainable Development; Nauryz Baizakov, Senior Expert, Center for Strategic Research and Sustainable Development; Temirlan Otepov, Expert, Center for Strategic Research and Sustainable Development.
Korea Rep.
Korea Institute for International Economic Policy (KIEP)http://www.kiep.go.kr/eng/
Dr. Heungchong Kim, Senior Research FellowMs. Nayoun Park, Researcher
Latvia
University of Latvia Centre for European and Transition Studies, LU CETShttp://www.lu.lv/cets
Mrs. Zane Zeibote
Lithuania
Enterprise Lithuania www.enterpriselithuania.com
Ms. Renata Nedzinskienė, Head of Team
Luxembourg
Chamber of Commerce of the Grand Duchy of Luxembourg www.cc.lu
Mr. Marc Wagener, Member of the Managing Board Mr. Jean-Baptiste Nivet, Economist Ms. Laure Demezet, Economist
Malaysia
Malaysia Productivity Corporation (MPC), Petaling Jaya, Selangorwww.mpc.gov.my
Dato’ Mohd Razali Hussain, Director GeneralDato’ Abdul Latif Abu Seman, Deputy Director GeneralDatin Zainon Bakar, Director Productivity & Competitiveness Development Division
Mexico
Center for Strategic Studies for Competitivenesswww.ceec.edu.mx
M.C. Carlos Maroto CabreraM.S. Carlos Maroto Espinosa
Mongolia
Economic Policy and Competitiveness Research Centerwww.ecrc.mn
Mr.Boldbaatar Tserenpuntsag, FounderMr.Tsagaan Puntsag, FounderMs.Lakshmi Boojoo, Director GeneralMs.Odonchimeg Ikhbayar, Deputy DirectorMr.Ganbat Chuluun, Research EconomistMs.Khulan Jamiyandorj, Research EconomistMr.Otgon-Erdene Khandaa, Research EconomistMs.Tungalag Erdenebat, Research EconomistMs.Yesunchuluu Khuderchuluu, Research EconomistMr.Zolbayar Enkhbaatar, Research Economist
Netherlands
Confederation of Netherlands Industry and Employers (VNO-NCW), The Haguewww.vno-ncw.nl
Mr. Thomas GrosfeldMr. Tim Zandbergen
New Zealand
Kerridge & Partners, Aucklandhttps://kerridgepartners.com/
Mr Peter Kerridge, Partner

IMD WORLD DIGITAL COMPETIT IVENESS RANKING 201910
Peru
CENTRUM PUCP http://centrum.pucp.edu.pe
Mr. Percy Marquina, General DirectorMrs. Beatrice Avolio, Head of the Graduate Business DepartmentMr. Luis Del Carpio, Center of Competitiveness Director Mr. Victor Fajardo, Research Analyst
Philippines
Asian Institute of Management R.S. Navarro Policy Center for Competitivenesspolicy.aim.edu
Jamil Paolo Francisco, Executive DirectorTristan Canare, Associate DirectorChristopher Ed Caboverde, Research Associate
Poland
Warsaw School of Economics, Warsawhttp://www.sgh.waw.pl/en/
Dr. Bogdan A. Radomski, Associate Professor of FinanceDr. Marcin Nowakowski, Professor of International Business and Prorector
Portugal
Porto Business School, University of Porto, Portohttps://www.pbs.up.pt/
Prof Álvaro AlmeidaProf Daniel BessaProf Ramon O’CallaghanDr. Rui Coutinho
Qatar
Planning and Statistics Authority Department of Strategic Planningwww.psa.gov.qa
Dr. Issa Ju’ma Ibrahim, economic expertHissa Alassiry, project manager
Romania
CIT-IRECSON Center of Technological Information, Bucharestwww.cit-irecson.ro
Mr. Bogdan Ciocanel, PhD, DirectorMr. Dan Grigore, Economist
Saudi Arabia
NCC, National Competitiveness Centerhttps://tayseer.gov.sa/
H.E. Dr. Eiman AlMutairi, CEO of National Competitiveness CenterSalman M. AlTukhaifi, Director of Analytical DepartmentWaleed AlRudaian, Director of Execution DepartmentDeema Almudaheem, Senior Execution Specialist
Singapore
Singapore Business Federationwww.sbf.org.sg/
Economics Division, Ministry of Trade and Industry, Singaporewww.mti.gov.
Ms. Cheryl Kong, Assistant Executive Director
Slovak Republic
F.A.Hayek foundation, Bratislavahttp://www.hayek.sk/
Martin Reguli, Project ManagerMatúš Pošvanc, Director
Slovenia
Institute for Economic Research, Ljubljanahttp://www.ier.si/
University of Ljubljana, Faculty of Economicshttp://www.ef.uni-lj.si/en
Mr. Peter Stanovnik, PhD, Associate ProfessorMs. Sonja Ursic, M.A.
Ms. Mateja Drnovsek, PhD, Full Professor Mr. Ales Vahcic, PhD, Full Professor

11IMD WORLD DIGITAL COMPETIT IVENESS RANKING 2019
South Africa
Productivity SAhttps://productivitysa.co.za/
Mr Mothunye Mothiba, CEODr Leroi Raputsoane, Chief EconomistMs Juliet Sebolelo Mashabela, Economist
Spain
Spanish Confederation of Employers, Madridwww.ceoe.es
Ms. Edita Pereira, Head of Economic Research UnitMs. Paloma Blanco, Economic Research Unit
Taiwan, China
National Development Council, Taipeihttp://www.ndc.gov.tw
Mr. Cheng, Cheng-mount, Deputy Minister Ms. Wu, Ming Huei, Director of Economic Development Department Ms. Lee, Cho-Jin, Senior Economist
Thailand
Thailand Management Association (TMA), Bangkokwww.tma.or.th
Ms. Wanweera Rachdawong, Chief Executive Officer, TMAMs. Pornkanok Wipusanawan, Director, TMA Center for CompetitivenessMr. Nussati Khaneekul, Senior Manager, TMA Center for Competitiveness
Turkey
TUSIAD, Turkish Industry and Business AssociationEconomic Research Departmentwww.tusiad.org
Zümrüt İmamoğlu, Chief Economistİsmet Tosunoğlu, Expert
United Arab Emirates (UAE)
Federal Competitiveness & Statistics Authority (FCSA), Dubaihttp://fcsa.gov.ae/en-us
Ukraine
International Management Institute (MIM-Kyiv)https://mim.kiev.ua/en
Dr. Iryna Tykhomyrova, PresidentDr. Volodymyr Danko, ProfessorMs. Oksana Kukuruza, External Relations Director
Venezuela
National Council to Investment Promotion (CONAPRI)www.conapri.org
Mr. Juan Cabral, Executive DirectorMs. Litsay Guerrero A. Economic Affairs & Investor Services ManagerMr. Luis Mariano Rodríguez, Legal Affairs Manager

IMD WORLD DIGITAL COMPETIT IVENESS RANKING 201912
The IMD World Digital Competit iveness Ranking presents the 2019 overall rankings for the 63 economies covered by the WCY. The rankings are calculated on the basis of the 51 ranked criteria: 31 Hard and 20 Survey data. The countries are ranked from the most to the least digital competitive and the results from the previous year’s scoreboard (2018) are shown in brackets. The index value or “score” is also indicated for each country.
The IMD World Digital Competitiveness Ranking
In addition to global digital rankings, other rankings are provided to show comparisons based on different perspectives. These digital rankings include countries split by population size (populations above and below 20 million), by GDP per capita to reflect different peer groups (above and below $20,000) and three regional rankings drawn from different geographical areas (Europe-Middle East-Africa, Asia-Pacific and the Americas).
Selected breakdowns of the IMD World Digital Competitiveness Ranking
The g loba l rank ings fo r each o f the D ig i t a l Competitiveness Factors are then shown as individual ranking tables. Again, the economies are ranked from the most to the least digital competitive and the previous year’s rankings (2018) are shown in brackets. Similar to the Overall Digital Ranking, the values or “scores” are indicated for each Factor. However, there is only one economy that has a score of 100 and one economy with a score of 0 across all four Factors.
Digital Competitiveness Factor Rankings
Overall and Breakdown Digital Rankings
Populations greater than 20 million
USA 1
Korea Rep. 2
Canada 3
Taiwan, China 4
Australia 5
United Kingdom 6
Germany 7
China 8
Japan 9
France 10
Malaysia 11
Spain 12
Poland 13
Russia 14
Saudi Arabia 15
Thailand 16
Italy 17
India 18
South Africa 19
Mexico 20
Turkey 21
Philippines 22
Indonesia 23
Brazil 24
Colombia 25
Argentina 26
Ukraine 27
Peru 28
Venezuela 29
100.000
91.297
90.836
90.194
88.897
88.691
86.216
84.292
82.775
82.522
82.390
78.743
73.707
70.406
69.036
68.434
67.903
64.952
60.865
60.411
59.793
59.439
58.011
57.346
56.126
56.044
55.255
54.029
27.763
0 10 20 30 40 50 60 70 80 90 100
(2018 rankings are in parentheses)
KNOWLEDGEKnow-how necessary to discover, understand and build new technologies
(4) USA 1(6) Switzerland 2(1) Singapore 3
(7) Sweden 4(3) Canada 5
(8) Denmark 6(5) Hong Kong SAR 7
(2) Israel 8(9) Finland 9
(13) Austria 10(11) Korea Rep. 11(14) Germany 12
(12) Netherlands 13(10) United Kingdom 14
(15) Australia 15(16) Norway 16
(19) Taiwan, China 17(30) China 18(17) Malaysia 19
(20) France 20(21) New Zealand 21(24) Russia 22(25) Belgium 23(22) Ireland 24(18) Japan 25
(23) Lithuania 26(26) Slovenia 27
(31) Spain 28(28) Iceland 29
(29) Estonia 30(27) Portugal 31(35) Kazakhstan 32(33) Poland 33
(32) Luxembourg 34(36) UAE 35
(34) Latvia 36(38) Czech Republic 37
(46) India 38(40) Saudi Arabia 39
(39) Ukraine 40(42) Italy 41
(43) Croatia 42(44) Thailand 43(48) Hungary 44
(37) Qatar 45(41) Bulgaria 46
(45) Romania 47(49) Slovak Republic 48
(56) Jordan 49(47) Chile 50(50) Philippines 51(54) Mexico 52
(51) Greece 53(52) South Africa 54
(55) Cyprus 55(61) Indonesia 56(57) Colombia 57
(58) Argentina 58(62) Brazil 59(59) Turkey 60
(60) Peru 61(53) Mongolia 62
(63) Venezuela 63
90.998 90.850 90.503 89.727 87.849 85.987 85.819 84.970 84.462 83.831 83.360 83.072 81.807 81.686 80.702 80.333 78.886 78.067 77.613 76.024 75.187 75.017 74.990 74.805 74.687 72.619 72.409 70.906 70.363 69.599 69.223 68.971 68.614 68.112 67.972 65.643 64.668 63.721 61.401 60.033 59.979 59.075 58.435 58.181 57.539 57.368 56.658 55.261 54.482 53.772 53.539 53.505 52.869 52.148 51.050 48.395 48.331 46.307 45.742 45.497 44.816 43.669 37.017
0 10 20 30 40 50 60 70 80 90 100
User’s Guide to the IMD World Digital Competitiveness Ranking
13IMD WORLD DIGITAL COMPETIT IVENESS RANKING 2019
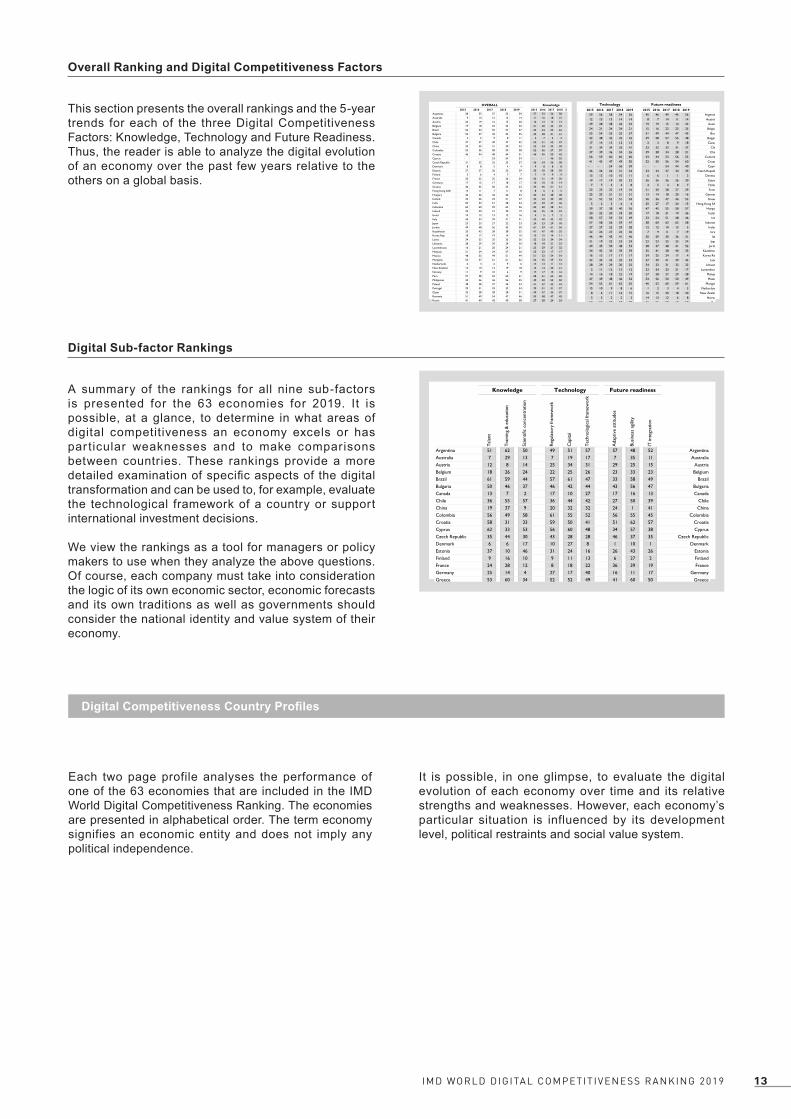
This section presents the overall rankings and the 5-year trends for each of the three Digital Competitiveness Factors: Knowledge, Technology and Future Readiness. Thus, the reader is able to analyze the digital evolution of an economy over the past few years relative to the others on a global basis.
Overall Ranking and Digital Competitiveness Factors
A summary of the rankings for all nine sub-factors is presented for the 63 economies for 2019. It is possible, at a glance, to determine in what areas of digital competitiveness an economy excels or has par ticular weaknesses and to make comparisons between countries. These rankings provide a more detailed examination of specific aspects of the digital transformation and can be used to, for example, evaluate the technological framework of a country or support international investment decisions.
We view the rankings as a tool for managers or policy makers to use when they analyze the above questions. Of course, each company must take into consideration the logic of its own economic sector, economic forecasts and its own traditions as well as governments should consider the national identity and value system of their economy.
Digital Sub-factor Rankings
Digital Competitiveness Country Profiles
Each two page profile analyses the performance of one of the 63 economies that are included in the IMD World Digital Competitiveness Ranking. The economies are presented in alphabetical order. The term economy signifies an economic entity and does not imply any political independence.
It is possible, in one glimpse, to evaluate the digital evolution of each economy over time and its relative strengths and weaknesses. However, each economy’s particular situation is influenced by its development level, political restraints and social value system.
2015 2016 2017 2018 2019 2015 2016 2017 2018 2019Argentina 58 55 57 55 59 57 53 56 58 58 Australia 9 14 15 13 14 11 16 18 15 15 Austria 26 19 16 15 20 16 12 12 13 10 Belgium 19 18 22 23 25 21 20 22 25 23 Brazil 56 54 55 57 57 55 54 55 62 59 Bulgaria 54 47 45 43 45 45 38 41 41 46 Canada 4 5 9 8 11 3 7 3 3 5 Chile 37 37 40 37 42 53 51 52 47 50 China 33 35 31 30 22 22 24 23 30 18 Colombia 53 56 58 59 58 52 56 57 57 57 Croatia 46 44 48 44 51 46 45 50 43 42 Cyprus - - 53 54 54 - - 46 55 55 Czech Republic 31 32 32 33 37 36 34 36 38 37 Denmark 8 8 5 4 4 9 8 8 8 6 Estonia 27 27 26 25 29 30 30 28 29 30 Finland 3 6 4 7 7 7 9 9 9 9 France 20 22 25 26 24 20 21 19 20 20 Germany 17 15 17 18 17 10 10 13 14 12 Greece 40 45 50 53 53 34 46 51 51 53 Hong Kong SAR 14 11 7 11 8 8 6 6 5 7 Hungary 44 42 44 46 43 44 43 48 48 44 Iceland 24 26 23 21 27 33 32 30 28 29 India 50 53 51 48 44 37 39 37 46 38 Indonesia 60 60 59 62 56 60 60 58 61 56 Ireland 25 20 21 20 19 26 25 25 22 24 Israel 10 13 13 12 16 4 5 7 2 8 Italy 36 34 39 41 41 42 40 42 42 41 Japan 23 23 27 22 23 24 23 29 18 25 Jordan 49 48 56 45 50 61 59 61 56 49 Kazakhstan 35 43 38 38 35 41 47 40 35 32 Korea Rep. 18 17 19 14 10 13 15 14 11 11 Latvia 34 33 35 35 36 32 33 34 34 36 Lithuania 28 29 29 29 30 18 18 21 23 26 Luxembourg 16 21 20 24 21 23 29 27 32 34 Malaysia 21 24 24 27 26 25 22 17 17 19 Mexico 48 52 49 51 49 51 52 54 54 52 Mongolia 55 57 61 61 62 56 55 59 53 62 Netherlands 6 4 6 9 6 14 13 11 12 13 New Zealand 13 10 14 19 18 15 14 20 21 21 Norway 11 9 10 6 9 17 17 15 16 16 Peru 57 58 62 60 61 58 61 62 60 61 Philippines 45 46 46 56 55 49 50 53 50 51 Poland 38 38 37 36 33 31 27 32 33 33 Portugal 29 31 33 32 34 29 31 31 27 31 Qatar 32 28 28 28 31 39 37 35 37 45 Romania 51 49 54 47 46 50 48 47 45 47 Russia 41 40 42 40 38 27 28 24 24 22 Saudi Arabia - - 36 42 39 - - 39 40 39 Singapore 1 1 1 2 2 1 1 1 1 3 Slovak Republic 43 41 43 50 47 43 41 43 49 48 Slovenia 39 36 34 34 32 28 26 26 26 27 South Africa 47 51 47 49 48 47 49 49 52 54 Spain 30 30 30 31 28 35 36 33 31 28 Sweden 5 3 2 3 3 2 2 2 7 4 Switzerland 7 7 8 5 5 5 3 4 6 2 Taiwan, China 15 16 12 16 13 19 19 16 19 17 Thailand 42 39 41 39 40 48 42 44 44 43 Turkey 52 50 52 52 52 59 58 60 59 60 UAE 22 25 18 17 12 38 35 38 36 35 Ukraine 59 59 60 58 60 40 44 45 39 40 United Kingdom 12 12 11 10 15 12 11 10 10 14 USA 2 2 3 1 1 6 4 5 4 1 Venezuela 61 61 63 63 63 54 57 63 63 63
OVERALL Knowledge2015 2016 2017 2018 2019 2015 2016 2017 2018 2019
59 56 58 54 56 45 46 49 45 56 Argentina12 15 15 14 14 8 7 14 11 14 Australia29 28 28 26 32 19 19 15 14 23 Austria24 21 24 24 21 15 16 22 23 25 Belgium55 54 55 55 57 51 49 44 47 43 Brazil42 38 42 42 42 59 58 57 55 48 Bulgaria17 14 13 12 13 2 3 8 9 18 Canada31 34 34 35 41 32 32 33 31 37 Chile37 39 36 34 26 39 38 34 28 21 China56 59 60 60 60 43 44 53 56 55 Colombia41 43 47 49 50 52 50 56 54 60 Croatia
- - 54 56 59 - - 54 44 40 Cyprus26 26 26 31 34 33 34 37 34 39 Czech Republic13 12 10 10 11 6 6 1 1 2 Denmark19 17 19 20 22 26 26 26 26 30 Estonia7 7 4 4 8 4 5 4 8 7 Finland
23 23 22 19 16 21 20 28 27 29 France25 25 21 21 31 13 14 18 20 16 Germany51 52 52 51 54 36 36 47 46 53 Greece5 2 3 6 4 25 27 17 24 15 Hong Kong SAR
39 37 38 40 36 47 45 55 58 57 Hungary20 22 20 18 20 17 18 21 19 26 Iceland58 57 59 53 49 53 54 51 48 46 India57 58 56 59 47 58 60 62 62 58 Indonesia27 27 25 29 28 12 12 10 13 5 Ireland22 24 27 25 30 7 9 11 7 19 Israel46 44 45 41 46 30 29 30 36 31 Italy21 19 23 23 24 22 23 25 25 24 Japan49 45 50 48 53 38 37 48 41 52 Jordan34 42 35 39 39 35 41 38 40 35 Kazakhstan16 13 17 17 17 24 25 24 17 4 Korea Rep.32 33 32 32 23 37 39 41 39 45 Latvia28 29 29 30 25 34 33 31 33 32 Lithuania2 11 12 15 12 23 24 23 21 17 Luxembourg
14 16 18 22 19 27 28 27 29 28 Malaysia47 49 48 46 52 54 56 50 50 49 Mexico54 55 61 62 62 46 52 60 59 61 Mongolia15 10 9 8 6 1 2 3 4 3 Netherlands8 6 11 16 15 16 15 20 18 20 New Zealand3 3 2 2 3 14 13 12 6 8 Norway
52 53 57 57 58 56 55 58 60 59 Peru50 50 51 58 55 40 40 43 52 54 Philippines36 36 39 37 37 49 51 39 37 33 Poland30 35 37 36 38 31 31 35 32 34 Portugal38 31 31 27 33 28 21 19 16 22 Qatar45 46 46 44 45 57 57 59 57 51 Romania44 47 44 43 43 55 53 52 51 42 Russia
- - 41 50 40 - - 32 38 38 Saudi Arabia1 1 1 1 1 5 4 6 15 11 Singapore
40 41 43 47 44 44 43 46 53 47 Slovak Republic43 40 40 38 35 41 35 36 35 36 Slovenia53 51 53 52 51 48 47 42 43 44 South Africa35 32 33 33 29 29 30 29 30 27 Spain9 4 5 5 7 9 8 5 5 6 Sweden
11 9 8 9 10 10 10 13 10 10 Switzerland4 8 7 11 9 20 22 16 22 12 Taiwan, China
33 30 30 28 27 50 48 45 49 50 Thailand48 48 49 45 48 42 42 40 42 41 Turkey10 20 14 7 2 18 17 7 12 9 UAE60 60 62 61 61 61 61 61 61 62 Ukraine18 18 16 13 18 11 11 9 3 13 United Kingdom6 5 6 3 5 3 1 2 2 1 USA
61 61 63 63 63 60 59 63 63 63 Venezuela
Future readinessTechnology
Tal
ent
Tra
inin
g &
edu
catio
n
Scie
ntifi
c co
ncen
trat
ion
Reg
ulat
ory
fram
ewor
k
Cap
ital
Tec
hnol
ogic
al fr
amew
ork
Ada
ptiv
e at
titud
es
Busi
ness
agi
lity
IT in
tegr
atio
n
Argentina 51 62 50 49 51 57 57 48 52 ArgentinaAustralia 7 29 13 7 19 17 7 35 11 AustraliaAustria 12 8 14 25 34 31 29 25 15 AustriaBelgium 18 26 24 22 25 26 23 33 23 BelgiumBrazil 61 59 44 57 61 47 33 58 49 BrazilBulgaria 50 46 37 46 42 44 43 56 47 BulgariaCanada 13 7 2 17 10 27 17 16 13 CanadaChile 36 55 57 36 44 42 27 50 39 ChileChina 19 37 9 20 32 32 24 1 41 ChinaColombia 56 49 58 61 55 52 56 55 45 ColombiaCroatia 58 31 33 59 50 41 51 62 57 CroatiaCyprus 62 33 53 56 60 48 34 57 38 CyprusCzech Republic 35 44 30 43 28 28 46 37 35 Czech RepublicDenmark 6 6 17 10 27 8 1 10 1 DenmarkEstonia 37 10 46 31 24 16 26 43 26 EstoniaFinland 9 16 10 9 11 13 6 27 2 FinlandFrance 24 28 12 8 18 22 36 39 19 FranceGermany 25 14 4 27 17 40 16 11 17 GermanyGreece 53 60 34 52 52 49 41 60 50 GreeceHong Kong SAR 4 12 16 12 6 3 12 8 22 Hong Kong SARHungary 47 43 45 35 46 19 62 53 37 HungaryIceland 34 18 39 15 39 15 28 24 28 IcelandIndia 38 47 28 55 3 62 54 29 56 IndiaIndonesia 42 61 52 51 26 56 60 21 60 IndonesiaIreland 10 30 29 13 49 24 3 9 20 IrelandIsrael 27 3 5 32 20 35 21 19 16 IsraelItaly 44 57 23 44 53 46 35 31 34 ItalyJapan 46 19 11 42 37 2 15 41 18 JapanJordan 43 32 63 47 41 55 61 22 54 JordanKazakhstan 39 1 55 16 54 43 39 15 46 KazakhstanKorea Rep. 30 5 6 26 29 7 4 5 21 Korea Rep.Latvia 32 27 47 30 35 14 52 47 44 LatviaLithuania 23 13 41 24 36 21 45 18 32 LithuaniaLuxembourg 31 24 42 4 9 34 22 20 6 LuxembourgMalaysia 22 11 27 29 14 20 30 17 33 MalaysiaMexico 55 53 40 48 47 53 47 51 53 MexicoMongolia 60 45 60 62 58 58 31 63 62 MongoliaNetherlands 3 36 19 6 5 10 9 7 3 NetherlandsNew Zealand 11 34 26 11 15 25 13 32 10 New ZealandNorway 16 17 21 3 7 6 5 23 9 NorwayPeru 59 42 62 50 45 61 49 59 59 PeruPhilippines 41 54 54 60 40 51 53 42 58 PhilippinesPoland 28 35 31 45 38 30 37 28 36 PolandPortugal 26 39 32 21 48 45 32 52 29 PortugalQatar 15 48 61 28 23 38 18 12 27 QatarRomania 48 51 38 41 59 36 48 46 55 RomaniaRussia 45 9 18 40 57 39 40 54 43 RussiaSaudi Arabia 20 38 59 39 13 54 50 36 30 Saudi ArabiaSingapore 1 4 22 2 8 1 19 6 4 SingaporeSlovak Republic 54 52 36 58 43 37 42 61 40 Slovak RepublicSlovenia 33 22 25 37 31 33 44 34 31 SloveniaSouth Africa 49 58 48 53 30 59 55 40 42 South AfricaSpain 29 40 20 34 33 23 25 38 25 SpainSweden 8 2 3 5 4 12 8 13 12 SwedenSwitzerland 2 15 7 14 16 9 11 14 7 SwitzerlandTaiwan, China 21 20 15 23 12 4 14 3 24 Taiwan, ChinaThailand 40 50 35 33 21 29 58 30 51 ThailandTurkey 52 63 43 38 56 50 38 44 48 TurkeyUAE 5 41 56 1 2 5 20 4 8 UAEUkraine 57 21 49 54 62 60 59 45 61 UkraineUnited Kingdom 17 23 8 18 22 18 10 26 14 United KingdomUSA 14 25 1 19 1 11 2 2 5 USAVenezuela 63 56 51 63 63 63 63 49 63 Venezuela
Technology Future readinessKnowledge

IMD WORLD DIGITAL COMPETIT IVENESS RANKING 201914
This page shows the overal l , factors and sub-factors ranking performances of the country in 2019, their 5-years trends and a comparison of between competitiveness and digital competitiveness rankings. The following indicators are presented:
Overall Performance: Overall, factors and sub-factors digital ranking performances of the country in 2019. The direction of the triangles indicates whether there has been an improvement or a decline with respect to the previous year.
Overall & Factors – 5 years: The evolution of the overall and factors digital rankings in the past 5 years.
Competitiveness and Digital Rankings: Comparison of the country’ performances in the World Competitiveness
Page 1: Digital Competitiveness – Overall and factors trends
Ranking and World Digital Competitiveness Ranking in the last 5 years.
Peer Group Rankings: Based on geographical region and population size.
Alpha AlphaLabelBeta BetaLabel Gamma GammaLabel1 2 2 2 2 2 24 4 4 2 2
6.5 4 4 2 28.5 4 4 2 2
10.5 4 4 2 2
2015 2016 2017 2018 2019
4 5 9 8 11
3 7 3 3 5
17 14 13 12 13
2 3 8 9 18
COMPETITIVENESS & DIGITAL RANKINGS
PEER GROUPS RANKINGS
THE AMERICAS (9 countries) POPULATIONS > 20 MILLION (29 countries)
Knowledge
Technology
Future readiness
OVERALL
DIGITAL TRENDS - OVERALL
CANADA
OVERALL PERFORMANCE (63 countries)
OVERALL & FACTORS - 5 years
4 5
9 8
11
5
1012 10
13
2015 2016 2017 2018 2019
Digital
Competitiveness
2 2 2 2 2
2015 2016 2017 2018 2019
2 2 2 23
2015 2016 2017 2018 2019
5 13 7 2
13 17 10 2711
18 17 16 13
Knowledge Talent Training & education Scientific concentration
Technology Regulatory framework Capital Technological framework
Future readiness Adaptive attitudes Business agility IT integrationThe direction of the triangle indicates the performance change from the last year: improved or stabledeclined
Overall Factors Sub-Factors
N.B. This graph provides only a comparison of the country’s performance in the two rankings.
2015 2016 2017 2018 2019 2015 2016 2017 2018 2019Argentina 58 55 57 55 59 57 53 56 58 58 Australia 9 14 15 13 14 11 16 18 15 15 Austria 26 19 16 15 20 16 12 12 13 10 Belgium 19 18 22 23 25 21 20 22 25 23 Brazil 56 54 55 57 57 55 54 55 62 59 Bulgaria 54 47 45 43 45 45 38 41 41 46 Canada 4 5 9 8 11 3 7 3 3 5 Chile 37 37 40 37 42 53 51 52 47 50 China 33 35 31 30 22 22 24 23 30 18 Colombia 53 56 58 59 58 52 56 57 57 57 Croatia 46 44 48 44 51 46 45 50 43 42 Cyprus - - 53 54 54 - - 46 55 55 Czech Republic 31 32 32 33 37 36 34 36 38 37 Denmark 8 8 5 4 4 9 8 8 8 6 Estonia 27 27 26 25 29 30 30 28 29 30 Finland 3 6 4 7 7 7 9 9 9 9 France 20 22 25 26 24 20 21 19 20 20 Germany 17 15 17 18 17 10 10 13 14 12 Greece 40 45 50 53 53 34 46 51 51 53 Hong Kong SAR 14 11 7 11 8 8 6 6 5 7 Hungary 44 42 44 46 43 44 43 48 48 44 Iceland 24 26 23 21 27 33 32 30 28 29 India 50 53 51 48 44 37 39 37 46 38 Indonesia 60 60 59 62 56 60 60 58 61 56 Ireland 25 20 21 20 19 26 25 25 22 24 Israel 10 13 13 12 16 4 5 7 2 8 Italy 36 34 39 41 41 42 40 42 42 41 Japan 23 23 27 22 23 24 23 29 18 25 Jordan 49 48 56 45 50 61 59 61 56 49 Kazakhstan 35 43 38 38 35 41 47 40 35 32 Korea Rep. 18 17 19 14 10 13 15 14 11 11 Latvia 34 33 35 35 36 32 33 34 34 36 Lithuania 28 29 29 29 30 18 18 21 23 26 Luxembourg 16 21 20 24 21 23 29 27 32 34 Malaysia 21 24 24 27 26 25 22 17 17 19 Mexico 48 52 49 51 49 51 52 54 54 52 Mongolia 55 57 61 61 62 56 55 59 53 62 Netherlands 6 4 6 9 6 14 13 11 12 13 New Zealand 13 10 14 19 18 15 14 20 21 21 Norway 11 9 10 6 9 17 17 15 16 16 Peru 57 58 62 60 61 58 61 62 60 61 Philippines 45 46 46 56 55 49 50 53 50 51 Poland 38 38 37 36 33 31 27 32 33 33 Portugal 29 31 33 32 34 29 31 31 27 31 Qatar 32 28 28 28 31 39 37 35 37 45 Romania 51 49 54 47 46 50 48 47 45 47 Russia 41 40 42 40 38 27 28 24 24 22 Saudi Arabia - - 36 42 39 - - 39 40 39 Singapore 1 1 1 2 2 1 1 1 1 3 Slovak Republic 43 41 43 50 47 43 41 43 49 48 Slovenia 39 36 34 34 32 28 26 26 26 27 South Africa 47 51 47 49 48 47 49 49 52 54 Spain 30 30 30 31 28 35 36 33 31 28 Sweden 5 3 2 3 3 2 2 2 7 4 Switzerland 7 7 8 5 5 5 3 4 6 2 Taiwan, China 15 16 12 16 13 19 19 16 19 17 Thailand 42 39 41 39 40 48 42 44 44 43 Turkey 52 50 52 52 52 59 58 60 59 60 UAE 22 25 18 17 12 38 35 38 36 35 Ukraine 59 59 60 58 60 40 44 45 39 40 United Kingdom 12 12 11 10 15 12 11 10 10 14 USA 2 2 3 1 1 6 4 5 4 1 Venezuela 61 61 63 63 63 54 57 63 63 63
OVERALL Knowledge
IMD WORLD DIGITAL COMPETIT IVENESS RANKING 201930
T he 2019 IM D Wor ld D ig i ta l Compet i t i veness Rank ings : Se lec ted Brea kdowns
Populations greater than 20 millionPopulations greater than 20 million
USA 1
Korea Rep. 2
Canada 3
Taiwan, China 4
Australia 5
United Kingdom 6
Germany 7
China 8
Japan 9
France 10
Malaysia 11
Spain 12
Poland 13
Russia 14
Saudi Arabia 15
Thailand 16
Italy 17
India 18
South Africa 19
Mexico 20
Turkey 21
Philippines 22
Indonesia 23
Brazil 24
Colombia 25
Argentina 26
Ukraine 27
Peru 28
Venezuela 29
100.000
91.297
90.836
90.194
88.897
88.691
86.216
84.292
82.775
82.522
82.390
78.743
73.707
70.406
69.036
68.434
67.903
64.952
60.865
60.411
59.793
59.439
58.011
57.346
56.126
56.044
55.255
54.029
27.763
0 10 20 30 40 50 60 70 80 90 100
Overall Ranking
Factor Rankings
Breakdown Rankings

15IMD WORLD DIGITAL COMPETIT IVENESS RANKING 2019
This page shows the country’s performance over time for each of the nine sub-factors composing the three Digital Competitiveness Factors (Knowledge, Technology and Future Readiness) and their 51 criteria rankings for 2019.
Factors Breakdown: shows the 5-years evolution of the sub-factors rankings composing the three factors of Knowledge, Technology and Future Readiness.
Strengths and Weaknesses: this section highlights the economy’s strongest and weakest criteria included in the World Digital Competitiveness Ranking. The triangles (►) identify the five top criteria in which the economy ranks best (strengths – filled triangle) and the five criteria in which its performance is the worst (weaknesses – empty triangle) compared to the other countriesincluded in the WCY sample. The selection of indicators is determined by the standard deviation values (STD) of the country for that specific criteria. In other words, the criteria selected represent the highest STD values and the lowest STD values among the 51 indicators
Page 2: Factors breakdown & Strengths and Weaknesses
composing the World Digital Competitiveness Ranking and can thus be considered the digital competitive advantages and disadvantages of the economy.
The full criteria names can be found in the Appendix and the statistical tables are available for subscribers of the IMD World Competitiveness Online.
It is important to note that what constitutes a strength or weakness is relative to each economy’s circumstances or development. Also, the ranking position of a country may not necessarily improve or decline as a consequence of its own evolution since it is always relative to the performance of the other economies. Therefore, an improvement may not be reflected by a higher ranking position if other economies have performed better for the criterion in question. The same can be said for any declines in performance – the economy’s ranking position relative to the others may or may not fall, depending on how the other economies have performed.
u Overall top strengths
w Overall top weaknesses
Subfactors 2015 2016 2017 2018 20198 10 9 7 13
12 13 10 4 7
4 4 4 4 2
Talent Rank Rank Rank
Educational assessment PISA - Math 9 22 23w International experience 40 w 35 20 Foreign highly-skilled personnel 13 u 5 - Management of cities 22 6 13 Digital/Technological skills 19 w 39 u 5 Net flow of international students 11 u 2 11
9
Subfactors 2015 2016 2017 2018 201912 17 21 11 17
8 5 1 5 10
26 24 27 24 27
Regulatory framework Rank Rank Rank
u Starting a business 2 19 35w Enforcing contracts 48 16 38 Immigration laws 11 15 w 54 Development and application of technology12 u 1 17 Scientific research legislation 17 14 12 Intellectual property rights 18 13 27
Subfactors 2015 2016 2017 2018 201916 16 13 15 17
1 1 5 4 16
3 7 15 12 13
Adaptive attitudes Rank Rank Rank
E-Participation 26 23 23 Internet retailing 12 14 8 Tablet possession 22 21 18 Smartphone possession 32 13 13 Attitudes toward globalization 12 11
Talent
Robots in Education and R&D
Training & education Scientific concentration
TECHNOLOGY
Scientific concentration
Capital Technological framework
FUTURE READINESS
IT integration
Business agility IT integration
FACTORS BREAKDOWN - STRENGTHS AND WEAKNESSES
CANADA
Technological framework
Opportunities and threats E-GovernmentWorld robots distribution Public-private partnerships
Total expenditure on R&D (%)Total public expenditure on education Total R&D personnel per capita
Training & education
Adaptive attitudes
Business agility
Venture capital Internet bandwidth speedInvestment in Telecommunications High-tech exports (%)
Regulatory framework
Capital
IT & media stock market capitalization Communications technologyFunding for technological development Mobile Broadband subscribersBanking and financial services Wireless broadbandCountry credit rating Internet users
Higher education achievement Female researchersPupil-teacher ratio (tertiary education) R&D productivity by publicationGraduates in Sciences Scientific and technical employmentWomen with degrees High-tech patent grants
Employee training
KNOWLEDGE
Agility of companies Cyber securityUse of big data and analytics Sofware piracyKnowledge transfer
Tal
ent
Tra
inin
g &
edu
catio
n
Scie
ntifi
c co
ncen
trat
ion
Reg
ulat
ory
fram
ewor
k
Cap
ital
Tec
hnol
ogic
al fr
amew
ork
Ada
ptiv
e at
titud
es
Busi
ness
agi
lity
IT in
tegr
atio
n
Argentina 47 63 41 48 48 53 49 37 52 ArgentinaAustralia 8 32 11 6 18 19 2 28 6 AustraliaAustria 12 7 18 24 38 21 25 5 10 AustriaBelgium 17 30 29 17 23 33 19 21 21 BelgiumBrazil 61 57 54 59 56 47 38 52 51 BrazilBulgaria 53 42 33 52 50 36 48 59 54 BulgariaCanada 7 4 4 11 5 24 15 4 12 CanadaChile 31 49 61 33 26 41 27 39 38 ChileChina Mainland 18 46 21 26 30 40 23 19 41 China MainlandColombia 57 45 57 62 57 55 57 54 48 ColombiaCroatia 59 36 32 55 52 43 37 63 49 CroatiaCyprus 62 29 52 51 60 49 45 45 46 CyprusCzech Republic 29 55 36 44 19 18 34 25 34 Czech RepublicDenmark 6 3 14 8 22 5 5 6 5 DenmarkEstonia 34 17 39 25 21 15 24 29 22 EstoniaFinland 13 9 9 4 9 6 6 22 1 FinlandFrance 21 33 17 5 25 28 32 36 19 FranceGermany 22 19 10 23 16 27 22 20 18 GermanyGreece 50 58 37 47 54 48 50 49 47 GreeceHong Kong SAR 5 13 5 14 6 11 11 26 25 Hong Kong SARHungary 46 48 51 35 51 46 62 56 36 HungaryIceland 37 18 35 18 40 12 18 11 28 IcelandIndia 43 59 26 56 3 62 54 33 56 IndiaIndonesia 51 61 58 57 34 60 61 46 60 IndonesiaIreland 14 34 24 20 53 13 10 3 24 IrelandIsrael 19 2 2 30 20 20 17 2 4 IsraelItaly 41 56 28 41 49 44 36 32 32 ItalyJapan 36 14 12 40 33 4 13 55 15 JapanJordan 39 41 63 43 39 54 58 23 42 JordanKazakhstan 44 6 55 22 59 42 47 43 44 KazakhstanKorea Rep. 26 8 7 27 44 2 3 47 20 Korea Rep.Latvia 28 28 46 31 36 26 52 41 37 LatviaLithuania 27 16 31 28 35 22 41 24 31 LithuaniaLuxembourg 33 26 44 9 4 35 29 17 13 LuxembourgMalaysia 24 10 30 29 12 32 30 15 35 MalaysiaMexico 52 51 53 45 42 50 40 57 53 MexicoMongolia 60 24 60 58 55 61 31 61 62 MongoliaNetherlands 3 31 16 10 7 14 7 12 7 NetherlandsNew Zealand 16 37 15 13 14 25 14 35 17 New ZealandNorway 20 11 20 1 2 3 8 14 9 NorwayPeru 58 43 62 49 47 59 59 50 59 PeruPhilippines 48 52 50 61 43 52 60 31 57 PhilippinesPoland 30 35 38 46 32 37 33 40 40 PolandPortugal 23 27 34 19 45 39 35 27 30 PortugalQatar 15 38 59 32 24 30 16 8 26 QatarRomania 45 50 43 39 62 31 46 60 58 RomaniaRussia 40 12 23 38 58 38 39 62 43 RussiaSaudi Arabia 38 39 49 50 31 56 43 48 33 Saudi ArabiaSingapore 1 1 19 2 8 1 20 18 3 SingaporeSlovak Republic 56 47 42 60 46 34 51 58 45 Slovak RepublicSlovenia 35 23 25 42 29 45 44 30 29 SloveniaSouth Africa 54 54 47 53 27 58 56 38 39 South AfricaSpain 32 40 27 36 37 29 26 44 27 SpainSweden 10 5 3 12 10 7 9 10 11 SwedenSwitzerland 2 15 6 15 15 8 12 7 16 SwitzerlandTaiwan 25 25 13 21 13 10 28 13 23 TaiwanThailand 42 44 45 34 28 23 55 34 55 ThailandTurkey 49 62 48 37 41 51 42 42 50 TurkeyUAE 4 53 56 3 11 16 21 1 14 UAEUkraine 55 22 40 54 61 57 53 53 61 UkraineUnited Kingdom 9 20 8 7 17 17 4 16 2 United KingdomUSA 11 21 1 16 1 9 1 9 8 USAVenezuela 63 60 22 63 63 63 63 51 63 Venezuela
Future readinessTechnologyKnowledge
Sub-factor Rankings
2014 2015 2016 2017 2018 2014 2015 2016 2017 2018Argentina 58 58 55 57 55 54 57 53 56 58 Australia 10 9 14 15 13 9 11 16 18 15 Austria 24 26 19 16 15 14 16 12 12 13 Belgium 25 19 18 22 23 26 21 20 22 25 Brazil 55 56 54 55 57 52 55 54 55 62 Bulgaria 53 54 47 45 43 47 45 38 41 41 Canada 8 4 5 9 8 3 3 7 3 3 Chile 34 37 37 40 37 55 53 51 52 47 China Mainland 38 33 35 31 30 27 22 24 23 30 Colombia 49 53 56 58 59 51 52 56 57 57 Croatia 45 46 44 48 44 49 46 45 50 43 Cyprus - - - 53 54 - - - 46 55 Czech Republic 31 31 32 32 33 38 36 34 36 38 Denmark 7 8 8 5 4 8 9 8 8 8 Estonia 23 27 27 26 25 23 30 30 28 29 Finland 4 3 6 4 7 5 7 9 9 9 France 22 20 22 25 26 15 20 21 19 20 Germany 14 17 15 17 18 16 10 10 13 14 Greece 48 40 45 50 53 44 34 46 51 51 Hong Kong SAR 13 14 11 7 11 10 8 6 6 5 Hungary 36 44 42 44 46 42 44 43 48 48 Iceland 27 24 26 23 21 24 33 32 30 28 India 56 50 53 51 48 39 37 39 37 46 Indonesia 57 60 60 59 62 57 60 60 58 61 Ireland 17 25 20 21 20 21 26 25 25 22 Israel 11 10 13 13 12 7 4 5 7 2 Italy 41 36 34 39 41 46 42 40 42 42 Japan 20 23 23 27 22 20 24 23 29 18 Jordan 46 49 48 56 45 60 61 59 61 56 Kazakhstan 35 35 43 38 38 43 41 47 40 35 Korea Rep. 21 18 17 19 14 12 13 15 14 11 Latvia 33 34 33 35 35 33 32 33 34 34 Lithuania 32 28 29 29 29 25 18 18 21 23 Luxembourg 19 16 21 20 24 28 23 29 27 32 Malaysia 15 21 24 24 27 19 25 22 17 17 Mexico 51 48 52 49 51 53 51 52 54 54 Mongolia - 55 57 61 61 - 56 55 59 53 Netherlands 6 6 4 6 9 11 14 13 11 12 New Zealand 18 13 10 14 19 18 15 14 20 21 Norway 9 11 9 10 6 17 17 17 15 16 Peru 59 57 58 62 60 58 58 61 62 60 Philippines 43 45 46 46 56 41 49 50 53 50 Poland 39 38 38 37 36 36 31 27 32 33 Portugal 30 29 31 33 32 31 29 31 31 27 Qatar 28 32 28 28 28 34 39 37 35 37 Romania 54 51 49 54 47 56 50 48 47 45 Russia 42 41 40 42 40 30 27 28 24 24 Saudi Arabia - - - 36 42 - - - 39 40 Singapore 1 1 1 1 2 1 1 1 1 1 Slovak Republic 40 43 41 43 50 40 43 41 43 49 Slovenia 37 39 36 34 34 32 28 26 26 26 South Africa 47 47 51 47 49 45 47 49 49 52 Spain 29 30 30 30 31 35 35 36 33 31 Sweden 3 5 3 2 3 2 2 2 2 7 Switzerland 5 7 7 8 5 6 5 3 4 6 Taiwan 16 15 16 12 16 22 19 19 16 19 Thailand 44 42 39 41 39 50 48 42 44 44 Turkey 52 52 50 52 52 59 59 58 60 59 UAE 26 22 25 18 17 37 38 35 38 36 Ukraine 50 59 59 60 58 29 40 44 45 39 United Kingdom 12 12 12 11 10 13 12 11 10 10 USA 2 2 2 3 1 4 6 4 5 4 Venezuela 60 61 61 63 63 48 54 57 63 63
OVERALL Knowledge
Factor Rankings

IMD WORLD DIGITAL COMPETIT IVENESS RANKING 201916
Introduction
Now in its third year, the IMD World Digital Competitiveness Ranking (WDCR) measures the capacity and readiness of 63 economies to adopt and explore digital technologies as a key driver for economic transformation in business, government and wider society.
The structure of the WDCR is built on three factors. The first factor, knowledge, refers to the intangible infrastructure, which underlines the process of digital transformation through the discovery, understanding and learning of new technologies. The technology factor assesses the overall context through which the development of digital technologies is enabled. Finally, the future readiness factor which examines the level of preparedness of an economy to assume its digital transformation.
In this edition of the WDCR, we introduce two new variables related to robotics in the calculation of the digital ranking: “industrial robots” which measures the total number of robots in operation, and “robots in education and R&D” worldwide. The first is included among the indicators used to calculate the business agility sub-factor (under the future readiness factor). The latter is incorporated as part of the scientific concentration sub-factor, within the knowledge factor. The International Federation of Robotics is the provider of the robotics data.
In 2019, the United States held on to the number one spot in the WDCR, with all top five economies in the
index unchanged: USA, Singapore, Sweden, Denmark and Switzerland. The Top 5 share a common thread in terms of their focus on knowledge generation, but they each approach digital competitiveness differently. The United States and Sweden follow a balanced approach between knowledge generation, the creation of a supportive environment for technology development and a readiness to adopt innovation. Singapore, Denmark and Switzerland give priority to one or two factors. In the Top 10, the Netherlands, Hong Kong SAR and Republic of Korea moved up (to 6th, 8th and 10th, respectively), while Norway dropped to 9th and Canada fell from 8th to 11th.
Several Asian economies advanced significantly in the ranking compared to 2018. Hong Kong SAR and the Republic of Korea entered the top ten while China and Taiwan, China moved up to 22nd and 13th respectively. All these countries experienced marked progress in their technological infrastructure and the agility of their businesses. Further down the ranking, India and Indonesia jumped four and six positions respectively, supported by positive results in talent, training and education as well as the enhancement of technological infrastructure.
In the following sections, we review the main facts and trends in digital competitiveness at sub-regional and country level. We then explore the role of political stability in the context of the WDCR, examining how it affects enterprises’ access to capital to finance technological development.
Main facts in Digital Competitiveness
The WDCR studies 63 economies most of which have a high or middle level of income per capita. Figure 1 provides a visualization of the changes in the ranking between 2018 and 2019. Most of the economies in the study (27) progressed in the ranking, 24 experienced a decline while 12 confirmed their position compared to last year.
The largest improvements in the ranking have been experienced by Asian economies such as China, Indonesia, Korea and India. These changes had a marked effect on the digital performance of their sub-regions.
Digital Competitiveness, political stability and investments in technology
Arturo BrisDirectorIMD World Competitiveness Center
José CaballeroSenior EconomistIMD World Competitiveness Center
Christos CabolisChief Economist IMD World Competitiveness Center
Marco PistisResearch SpecialistIMD World Competitiveness Center

17IMD WORLD DIGITAL COMPETIT IVENESS RANKING 2019
Figure 1: Changes in ranking positions between 2018-2019
Figure 2 presents the evolution of the average digital competitiveness ranks at sub-regional level for the last six years. In 2019, countries in Eastern Asia, North America and Western Europe keep their leadership in the development, adoption and exploration of digital technologies. However, while North America and Western Europe averages remain stable around 20, Eastern Asia increased its advantage reaching an average rank of 15.2, up from an average of 18.6 in 2018.
Digital competitiveness average performances increase also in Southern Asia and the Pacific (which scores an average of 31.9, up from 33.3 in 2018) and Ex-CIS and Central Asia (average moves from 46.3 to 45 in 2019). Western Asia and Africa and Eastern Europe averages instead are in line with last year. Finally, South American economies continue to lag behind the other sub-regions, experiencing a further, albeit small, decline in digitalization compared to 2018.
In the following subsections, we describe the most significant shifts in the ranking within each sub-region.
10
20
30
40
50
60
Aver
age
Com
petit
iven
ess
rank
ing
2015 2016 2017 2018 2019Year
Eastern AsiaNorth America Western Europe
Southern Asia & the Pacific
Eastern Europe
Western Asia & Africa
South America
Ex-CIS and Central Asia
Figure 2: Overall Digital Competitiveness trends at sub-re-gional level 2015-2019.
Source: IMD World Competitiveness Center (2019)

IMD WORLD DIGITAL COMPETIT IVENESS RANKING 201918
Eastern Asia
Hong Kong SAR moves up to 8th from 11th in 2018. Hong Kong ranked the highest in technology (4th) and placed 7th in knowledge. Under knowledge, its highest spot was in talent - 4th - and its lowest in scientific concentration, 16th. In technology, Hong Kong ranked 3rd in the technological framework sub-factor and 12th in the regulatory framework.
Republic of Korea broke into and rounded up the top 10, rising from 14th in 2018. Its strongest performance was in the future readiness factor (4th) in which it ranked 4th in the adaptive attitudes sub-factor and 5th in business agility but placed at 21st in IT integration.
For Taiwan, China there was a positive trend in executive perceptions about talent availability and access to capital. Taiwan also experienced improvements in the future readiness factor (22nd to 12th) particularly in terms of business agility (13th to 3rd).
The largest increase in the overall ranking was experienced by China, moving from 30th to 22nd. The improvement originated mainly in the knowledge factor (18th) in which it progressed in the training & education sub-factor (from 46th to 37th) and in scientific concentration (21st to 9th).
North America
The USA ranks 1st in the overall digital ranking, while topping the knowledge and future readiness factors, it reaches the 5th position in the technology factor. At the sub-factor level, under knowledge, the USA is 1st in scientific concentration but in talent is 14th and in training and education 25th (its lowest sub-factor ranking). In technology, the USA tops the capital sub-factor only reaching the 19th place in the regulatory framework sub-factor and 11th in the technological framework. Future readiness offers the USA’s strongest performance at the sub-factor level ranking 2nd in adaptive attitudes and business agility, and 5th in IT integration.
Canada’s slide out of the top ten originated mainly in the executive perceptions about the availability of the relevant talent and the effectiveness of the regulatory framework. It was negatively affected by the prioritization assigned to the training of employees and issues related to the technological framework such as high-tech exports.
Mexico moved up by two places to 49th. The country ranks 11th worldwide both in terms of operative robots in industry and in R&D. However, several indicators related to the quality of education (e.g., pupil teacher ratio in tertiary education), technological infrastructure and executives’ perceptions on the agility of firms all showed a decline compared to last year.
Western Europe
Sweden ranked 3rd overall, placing 4th, 7th and 6th for knowledge, technology and future readiness (respectively). The country’s highest ranking at the sub-factor level was in training and education (2nd). It performed strongly in scientific concentration (3rd), capital (4th) and regulatory
framework (5th) Sweden’s lowest sub-factor ranking is in business agility (13th).
Denmark ranked 4th. At the factor level, it placed at 6th, 11th and 2nd in knowledge, technology and future readiness, respectively. Its strongest performance among the sub-factor was in adaptive attitudes and IT integration (1st in both). It also performed well in talent, and training & education (6th in both).
Switzerland held on to 5th place. In the knowledge factor, it placed 2nd, in technology it ranked 10th, and in future readiness 10th. At the sub-factor level. Switzerland’s highest ranking was in talent (2nd) and it performed well in scientific concentration and IT integration (7th in both). Switzerland’s weakest ranking among sub-factors was for capital (16th), and training and education (15th).
The Netherlands rose from 9th in 2018 to 6th. Its strongest performance came in the future readiness factor (3rd) in which it ranks 3rd in IT integration, 7th in business agility and 9th in adaptive attitudes. In the technology factor, it ranked 6th reaching 5th in capital, 6th in regulatory framework and 10th in the technological framework sub-factor.
Finland ranked 7th. In knowledge, it came 9th, 8th in technology, and 7th in future readiness. Its highest ranking at the sub-factor level was in IT integration (2nd) and adaptive attitudes (6th). Finland’s lowest sub-factor ranking was 27th in business agility.
Norway dropped from 6th to 9th. Its strengths were in the technology factor (3rd), in which it ranked 3rd in regulatory framework, 6th in technological framework and 7th in capital. Norway came 8th in the future readiness factor, placing 5th in adaptive attitudes and 9th for IT integration. Norway’s weakest sub-factor ranking was 23rd in business agility.
France progressed from 26th to 24th. Its strengths originated in a supportive regulatory environment (Regulatory Framework sub-factor, 8th) and focus on R&D (scientific concentration sub-factor, 12th). France is in the top 10 for utilisation of robots in industry (8th), and in robots employed in education and R&D (5th).
Germany rose to 17th. Despite important declines in executive’s perceptions about companies’ agility and flexibility to changing market conditions, the country strengthened its leadership in scientific concentration (4th), training and education (14th) and in the adoption of digital technologies by its citizens (adaptive attitudes, 16th).
Ireland advanced from 20th to 19th. This result stemmed from improvements in e-government indicators as well as positive executives’ perceptions on aspects related to supportive legislation for innovation, talent and capital availability. Investments in R&D as well as average internet bandwidth speed and wireless broadband penetration experienced a decline compared to 2018.
Austria slipped from 15th to 20th. The country experienced a decline in the technological framework sub-factor, particularly in high-tech exports. In addition, its performance in business agility was affected by negative
19IMD WORLD DIGITAL COMPETIT IVENESS RANKING 2019
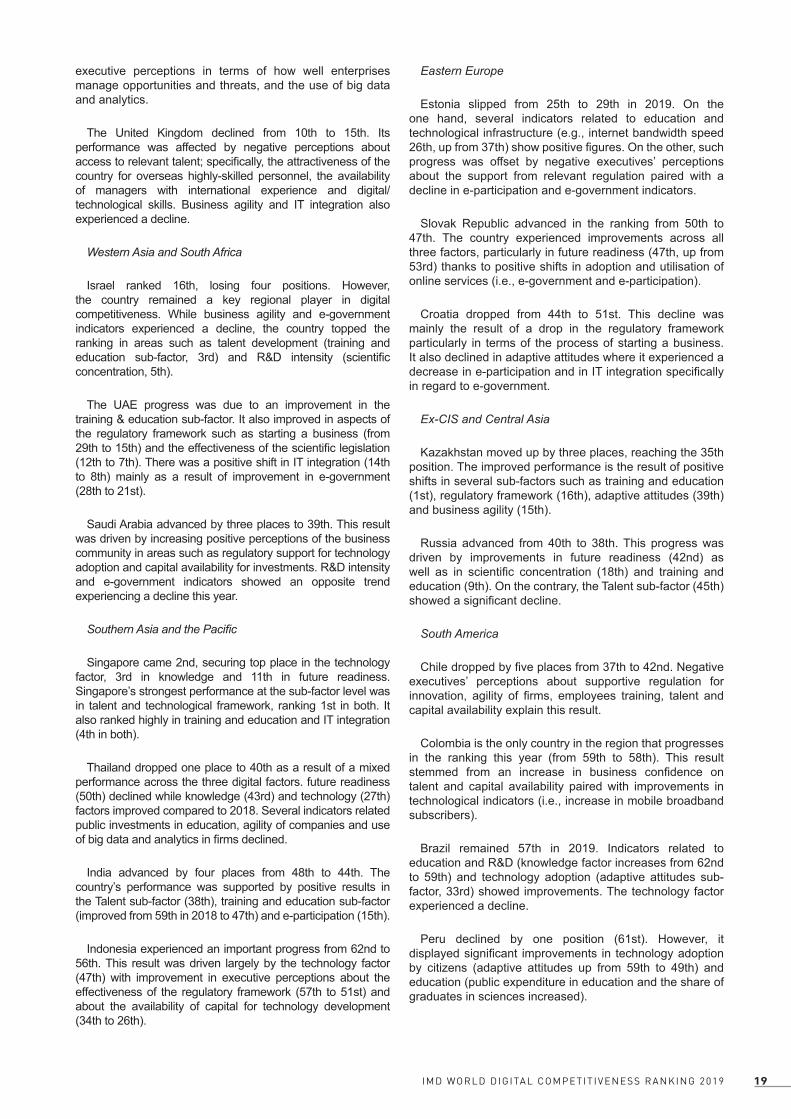
executive perceptions in terms of how well enterprises manage opportunities and threats, and the use of big data and analytics.
The United Kingdom declined from 10th to 15th. Its performance was affected by negative perceptions about access to relevant talent; specifically, the attractiveness of the country for overseas highly-skilled personnel, the availability of managers with international experience and digital/technological skills. Business agility and IT integration also experienced a decline.
Western Asia and South Africa
Israel ranked 16th, losing four positions. However, the country remained a key regional player in digital competitiveness. While business agility and e-government indicators experienced a decline, the country topped the ranking in areas such as talent development (training and education sub-factor, 3rd) and R&D intensity (scientific concentration, 5th).
The UAE progress was due to an improvement in the training & education sub-factor. It also improved in aspects of the regulatory framework such as starting a business (from 29th to 15th) and the effectiveness of the scientific legislation (12th to 7th). There was a positive shift in IT integration (14th to 8th) mainly as a result of improvement in e-government (28th to 21st).
Saudi Arabia advanced by three places to 39th. This result was driven by increasing positive perceptions of the business community in areas such as regulatory support for technology adoption and capital availability for investments. R&D intensity and e-government indicators showed an opposite trend experiencing a decline this year.
Southern Asia and the Pacific
Singapore came 2nd, securing top place in the technology factor, 3rd in knowledge and 11th in future readiness. Singapore’s strongest performance at the sub-factor level was in talent and technological framework, ranking 1st in both. It also ranked highly in training and education and IT integration (4th in both).
Thailand dropped one place to 40th as a result of a mixed performance across the three digital factors. future readiness (50th) declined while knowledge (43rd) and technology (27th) factors improved compared to 2018. Several indicators related public investments in education, agility of companies and use of big data and analytics in firms declined.
India advanced by four places from 48th to 44th. The country’s performance was supported by positive results in the Talent sub-factor (38th), training and education sub-factor (improved from 59th in 2018 to 47th) and e-participation (15th).
Indonesia experienced an important progress from 62nd to 56th. This result was driven largely by the technology factor (47th) with improvement in executive perceptions about the effectiveness of the regulatory framework (57th to 51st) and about the availability of capital for technology development (34th to 26th).
Eastern Europe
Estonia slipped from 25th to 29th in 2019. On the one hand, several indicators related to education and technological infrastructure (e.g., internet bandwidth speed 26th, up from 37th) show positive figures. On the other, such progress was offset by negative executives’ perceptions about the support from relevant regulation paired with a decline in e-participation and e-government indicators.
Slovak Republic advanced in the ranking from 50th to 47th. The country experienced improvements across all three factors, particularly in future readiness (47th, up from 53rd) thanks to positive shifts in adoption and utilisation of online services (i.e., e-government and e-participation).
Croatia dropped from 44th to 51st. This decline was mainly the result of a drop in the regulatory framework particularly in terms of the process of starting a business. It also declined in adaptive attitudes where it experienced a decrease in e-participation and in IT integration specifically in regard to e-government.
Ex-CIS and Central Asia
Kazakhstan moved up by three places, reaching the 35th position. The improved performance is the result of positive shifts in several sub-factors such as training and education (1st), regulatory framework (16th), adaptive attitudes (39th) and business agility (15th).
Russia advanced from 40th to 38th. This progress was driven by improvements in future readiness (42nd) as well as in scientific concentration (18th) and training and education (9th). On the contrary, the Talent sub-factor (45th) showed a significant decline.
South America
Chile dropped by five places from 37th to 42nd. Negative executives’ perceptions about supportive regulation for innovation, agility of firms, employees training, talent and capital availability explain this result.
Colombia is the only country in the region that progresses in the ranking this year (from 59th to 58th). This result stemmed from an increase in business confidence on talent and capital availability paired with improvements in technological indicators (i.e., increase in mobile broadband subscribers).
Brazil remained 57th in 2019. Indicators related to education and R&D (knowledge factor increases from 62nd to 59th) and technology adoption (adaptive attitudes sub-factor, 33rd) showed improvements. The technology factor experienced a decline.
Peru declined by one position (61st). However, it displayed significant improvements in technology adoption by citizens (adaptive attitudes up from 59th to 49th) and education (public expenditure in education and the share of graduates in sciences increased).

IMD WORLD DIGITAL COMPETIT IVENESS RANKING 201920
Political stability, capital for innovation and firms’ size
Strong and high-quality institutions are a driver for competitiveness performance. This relationship has been supported by our data. In the 2019 edition of the IMD World Competitiveness Yearbook we argued that economies with low risk of political instability, among other criteria associated with institutional aspects, are the economies that perform well in the overall competitiveness ranking. In the 2018 edition of the WDCR, we demonstrated that countries with an effective rule of law, are the economies that perform strongly in developing local talent as well as attracting talent from the international pool. In other words, we show that political stability and predictability, are associated with countries that attract physical and human capital.
In this section we explore the role of political stability within the context of the digital competitiveness ranking.
In the IMD Executive Opinion Survey high level managers are asked to evaluate the risk of political instability in their country. In Figure 3, the vertical axis captures such a risk with low figures reflecting a high level of political instability. The horizontal axis depicts the overall digital competitiveness ranking with low numbers reflecting stronger economies. The association is strongly negative with a correlation coefficient equal to -0.74. The economies that are characterized by political stability are the ones that perform well in the digital competitiveness as well.
A different way to interpret Figure 3 is that on average, countries that are perceived by high level executives to be politically stable are the ones that are most advanced in terms of adopting and developing digital technology.
The association above is in accordance with the literature studying political instability and economic growth and finding a deteriorating effect of the former on the latter (Alesina et al., 1996). Furthermore, it has been shown that political instability negatively affects investments (Alesina and Perotti, 1996; Aisen and Veiga, 2011). The element of investments is of particular importance in technology due to the capital intensive and high uncertainty nature of the industry.
The IMD World Competitiveness data are in line with the results of the literature. Figure 4 captures the relationship
between the Risk of Political Instability in the vertical axis and the Country Credit Ratings in the horizontal. The latter is a composite index of the three country credit ratings provided by Fitch, Moody’s and S&P with the higher value reflecting the higher credit rating. The relationship is positive with a correlation coefficient equal to 0.76.
This strong association between countries that are politically stable and financially reliable is revealed when we study the financing specifically for technological development. Figure 5 captures the relationship between the Risk of Political Instability and the perception of high-level managers to the availability of funds for technological development where the higher value reflects more availability. Economies with a political stable environment enjoy higher availability of capital for technological development.
AE
AR
AT
AU
BE BG
BR
CA
CH
CLCN
CO
CYCZ
DE
EE
DK
ES
FI
FR
GBGR
HK
HR
HU
ID
IE
IL INIS
IT
JO
JP
KR
KZLT
LU
LV
MN
MX
MY
NL
NONZ
PEPH
PL
PT
QA
RO
RU
SASE
SG
SI
SKTH
TR
TW
UA
US
VE
ZA
0
2
4
6
8
10
12
0 10 20 30 40 50 60 70
Risk
of p
oli�
cal i
nsta
bilit
y is
low
(sur
vey
0-10
)
Overall Digital Compe��veness ranking (1-63)
Figure 3: Risk of Political Instability and Overall Digital Competitiveness Ranking (correlation coefficient -0.74)
Source: IMD World Competitiveness Center Dataset
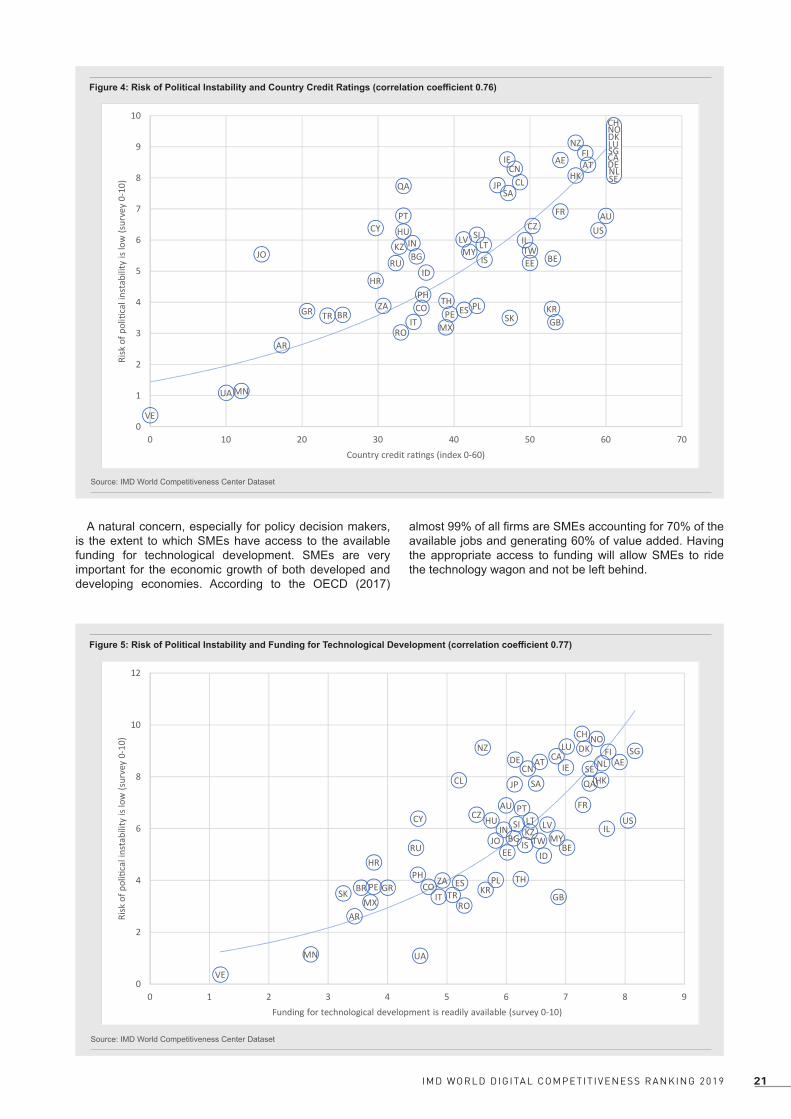
21IMD WORLD DIGITAL COMPETIT IVENESS RANKING 2019
A natural concern, especially for policy decision makers, is the extent to which SMEs have access to the available funding for technological development. SMEs are very important for the economic growth of both developed and developing economies. According to the OECD (2017)
almost 99% of all firms are SMEs accounting for 70% of the available jobs and generating 60% of value added. Having the appropriate access to funding will allow SMEs to ride the technology wagon and not be left behind.
AE
AR
AT
AU
BEBG
BR
CLCN
CO
CY CZ
EE
ES
FI
FR
GBGR
HK
HR
HU
ID
IE
ILIN
IS
IT
JO
JP
KR
KZ LTLV
MN
MX
MY
NZ
PE
PHPL
PT
QA
RO
RU
SA
CA
CH
DE
DKLU
NL
NO
SE
SG
SI
SK
THTR
TW
UA
US
VE
ZA
0
1
2
3
4
5
6
7
8
9
10
0 10 20 30 40 50 60 70
Risk
of p
oli�
cal i
nsta
bilit
y is
low
(sur
vey
0-10
)
Country credit ra�ngs (index 0-60)
Figure 4: Risk of Political Instability and Country Credit Ratings (correlation coefficient 0.76)
Source: IMD World Competitiveness Center Dataset
AE
AR
AT
AU
BEBG
BR
CA
CH
CLCN
CO
CY CZ
DEDK
EE
ES
FI
FR
GBGR
HK
HR
HU
ID
IE
ILINIS
IT
JO
JP
KR
KZLT
LU
LV
MN
MX
MY
NL
NONZ
PEPH PL
PT
QA
RO
RU
SASE
SG
SI
SKTH
TR
TW
UA
US
VE
ZA
0
2
4
6
8
10
12
0 1 2 3 4 5 6 7 8 9
Risk
of p
oli�
cal i
nsta
bilit
y is
low
(sur
vey
0-10
)
Funding for technological development is readily available (survey 0-10)
Figure 5: Risk of Political Instability and Funding for Technological Development (correlation coefficient 0.77)
Source: IMD World Competitiveness Center Dataset

IMD WORLD DIGITAL COMPETIT IVENESS RANKING 201922
Figure 6 provides some interesting insights from our dataset. The two columns of the graph represent the perceptions of the approximate 6,400 respondents in 63 economies with respect to the political instability of their country. Those who perceive the country to be politically stable (by responding between 6 and 10 in the scale) are recorded in the right part. Those who believe that they operate in politically unstable economy (responding 1-5 in the scale) are captured in the left part. Then we group the responses by the size of the firm: small enterprises are those with less than 50 employees; medium size firms with 51 to 250 employees; and large size that depicts the enterprises with more than 250 employees.
Each panel provides the percentage of the people who agree or not to the statement that funding for technological development is readily available. A very interesting insight is projected in Figure 6. In economies perceived to be politically stable, financing for technology is generally available irrespective of the size of the firm. About 80% of
the respondents will agree that funding is available while the remaining disagree.
This is not the case for those who perceive that their economy is characterized by political instability. In the upper panel of the left side, only about 55% of the executives employed in large firms feel that funding is readily available. Importantly, the difference of 10% with those who disagree with the statement is statistically significant.
Interestingly this is exactly the opposite with the perceptions of the executives employed in medium and small size enterprises. In the lower panel almost 60% of the respondents feel that funding is not readily available.
Therefore, in countries that are perceived to be politically unstable, the small size firms are constrained from accessing important funding for technological development.
An important source of funding for technology is venture capital. We ask high-level executives about their perception on the availability of such funds in their economy. Figure 7 presents an outline of their responses. Again, executives who perceive their economy as politically stable feel that venture capital is easily available. Note, however, that this time the difference between those who agree with the statement and those who disagree is much smaller than before with the least difference being recorded in the small size firms. Similarly to the funding for technological development question, also in this case SMEs executives tend to have higher concerns compared to top managers
in large companies about venture capital availability in politically unstable countries.
Political stability of a country is an important driver of technological advancement. With respect to financing technological development, in politically stable economies the availability of funds and venture capital is attainable irrespective of the size of the firms with respect to people employed. In contrast, in economies that are high in political instability, financing is more challenging especially for small size firms.
0
.2
.4
.6
.8
0
.2
.4
.6
.8
0
.2
.4
.6
.8
Disagree Agree Disagree Agree
Large (more than 250 employees), High risk Large (more than 250 employees), Low risk
Medium (from 50 to 250 employees), High risk Medium (from 50 to 250 employees), Low risk
Small (less than 50 employees), High risk Small (less than 50 employees), Low risk
Perc
enta
ge
Funding for technological development is readily available
Politically unstable 1-5 Politically stable 6-10
Figure 6: Survey question: “Funding for technological development is readily available” for different size SMEs
Source: IMD World Competitiveness Center Dataset
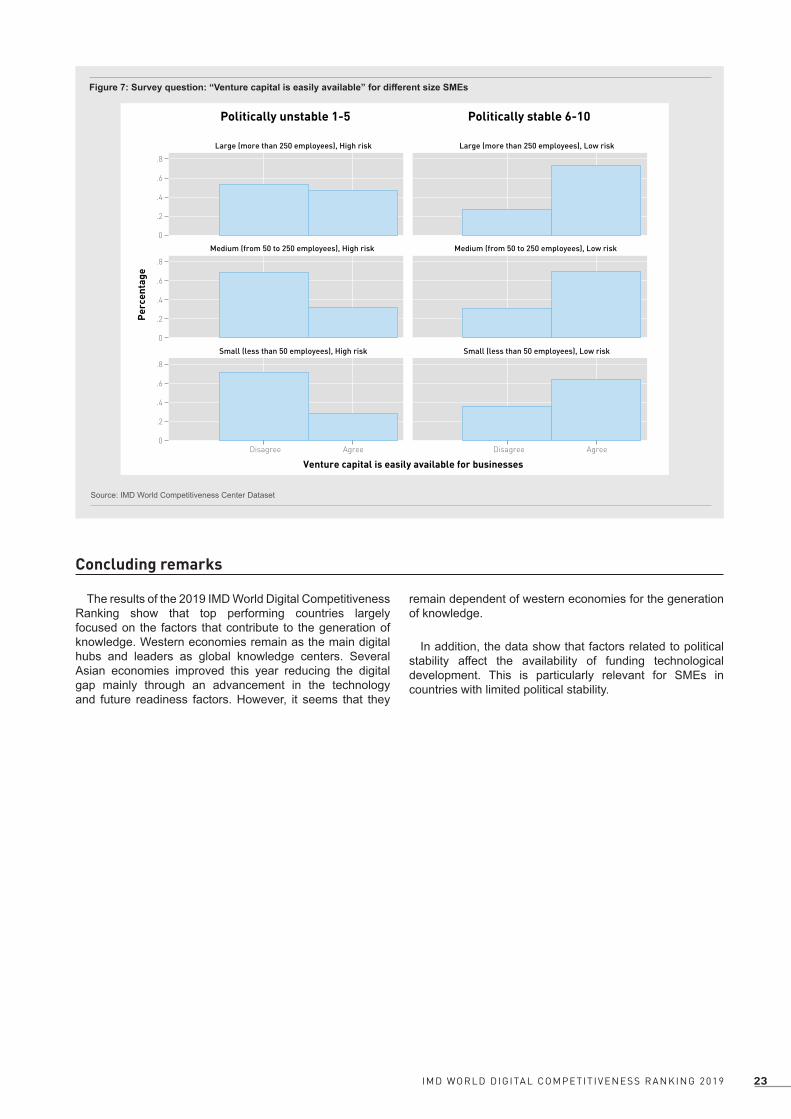
23IMD WORLD DIGITAL COMPETIT IVENESS RANKING 2019
0
.2
.4
.6
.8
0
.2
.4
.6
.8
0
.2
.4
.6
.8
Disagree Agree Disagree Agree
Large (more than 250 employees), High risk Large (more than 250 employees), Low risk
Medium (from 50 to 250 employees), High risk Medium (from 50 to 250 employees), Low risk
Small (less than 50 employees), High risk Small (less than 50 employees), Low risk
Perc
enta
ge
Venture capital is easily available for businesses
Politically unstable 1-5 Politically stable 6-10
Figure 7: Survey question: “Venture capital is easily available” for different size SMEs
Source: IMD World Competitiveness Center Dataset
Concluding remarks
The results of the 2019 IMD World Digital Competitiveness Ranking show that top performing countries largely focused on the factors that contribute to the generation of knowledge. Western economies remain as the main digital hubs and leaders as global knowledge centers. Several Asian economies improved this year reducing the digital gap mainly through an advancement in the technology and future readiness factors. However, it seems that they
remain dependent of western economies for the generation of knowledge.
In addition, the data show that factors related to political stability affect the availability of funding technological development. This is particularly relevant for SMEs in countries with limited political stability.

IMD WORLD DIGITAL COMPETIT IVENESS RANKING 201924
References
Aisen, A. and F. J. Veiga. 2011. “How Does Political Instability Affect Economic Growth?” IMF Working Paper WP/11/12Alesina, A. and R. Perotti. 1996. “Income distribution, political instability, and investment” European Economic Review 40, 1203- 1228Alesina, A., S. Ozler, N. Roubini and P. Swagel 1996. “Political instability and economic growth” Journal of Economic Growth 1, 189–211OECD. 2017. “Enhancing the Contributions of SMEs in a Global and Digitalised Economy”. Report for the Meeting of the OECD Council at Ministerial Level (Paris, 7-8 June 2017). Retrieved from https://www.oecd.org/mcm/documents/C-MIN-2017-8-EN.pdf
Appendices
Composition of sub-regions and regions.
Austria Italy Belgium Luxembourg Cyprus Netherlands Denmark Norway Finland Portugal France Spain Germany Sweden Greece Switzerland Iceland United Kingdom Ireland Bulgaria Latvia Czech Republic Poland Estonia Romania Croatia Slovenia Hungary Slovak Republic Lithuania Ukraine Israel South Africa Jordan Turkey Qatar UAE Saudi Arabia Kazakhstan Russia Mongolia China Mainland Korea Rep. Hong Kong SAR Taiwan Japan Australia New Zealand India Philippines Indonesia Singapore Malaysia Thailand Canada USA Mexico Argentina Colombia Brazil Peru Chile Venezuela
Europe, Middle East & Africa
Asia & Pacific
The Americas
Western Europe
Eastern Europe
Western Asia & Africa
Ex-CIS &Central Asia
Eastern Asia
Southern Asia & The Pacific
North America
South America

25IMD WORLD DIGITAL COMPETIT IVENESS RANKING 2019
IMD WORLD DIGITAL COMPETITIVENESS
RANKING 2019
The statistical tables are available for subscribers of the IMD World Competitiveness Online.
Visit our eShop

IMD WORLD DIGITAL COMPETIT IVENESS RANKING 201926
The 2019 IMD Wor ld D ig i ta l
(2018 rankings are in parentheses)
DIGITAL COMPETITIVENESS RANKING (Ranks 1 - 30)
(1) USA 1
(2) Singapore 2
(3) Sweden 3
(4) Denmark 4
(5) Switzerland 5
(9) Netherlands 6
(7) Finland 7
(11) Hong Kong SAR 8
(6) Norway 9
(14) Korea Rep. 10
(8) Canada 11
(17) UAE 12
(16) Taiwan, China 13
(13) Australia 14
(10) United Kingdom 15
(12) Israel 16
(18) Germany 17
(19) New Zealand 18
(20) Ireland 19
(15) Austria 20
(24) Luxembourg 21
(30) China 22
(22) Japan 23
(26) France 24
(23) Belgium 25
(27) Malaysia 26
(21) Iceland 27
(31) Spain 28
(25) Estonia 29
(29) Lithuania 30
100.000
99.373
96.070
95.225
94.648
94.261
93.732
93.686
93.671
91.297
90.836
90.295
90.194
88.897
88.691
86.373
86.216
86.026
85.863
84.473
84.368
84.292
82.775
82.522
82.491
82.390
79.935
78.743
78.669
77.578
0 10 20 30 40 50 60 70 80 90 100

27IMD WORLD DIGITAL COMPETIT IVENESS RANKING 2019
Compet i t i veness Rank ing
(2018 rankings are in parentheses)
DIGITAL COMPETITIVENESS RANKING (Ranks 31 - 63)
(28) Qatar 31
(34) Slovenia 32
(36) Poland 33
(32) Portugal 34
(38) Kazakhstan 35
(35) Latvia 36
(33) Czech Republic 37
(40) Russia 38
(42) Saudi Arabia 39
(39) Thailand 40
(41) Italy 41
(37) Chile 42
(46) Hungary 43
(48) India 44
(43) Bulgaria 45
(47) Romania 46
(50) Slovak Republic 47
(49) South Africa 48
(51) Mexico 49
(45) Jordan 50
(44) Croatia 51
(52) Turkey 52
(53) Greece 53
(54) Cyprus 54
(56) Philippines 55
(62) Indonesia 56
(57) Brazil 57
(59) Colombia 58
(55) Argentina 59
(58) Ukraine 60
(60) Peru 61
(61) Mongolia 62
(63) Venezuela 63
75.897
75.174
73.707
73.007
72.623
72.437
71.812
70.406
69.036
68.434
67.903
66.724
65.472
64.952
63.663
62.755
62.624
60.865
60.411
60.399
59.993
59.793
59.633
59.536
59.439
58.011
57.346
56.126
56.044
55.255
54.029
49.846
27.763
0 10 20 30 40 50 60 70 80 90 100
The IMD Digital World Competitiveness Ranking presents the 2019 overall ranking for the 63 economies covered by the WCY. The economies are ranked from the most to the least competitive and the results from the previous year’s ranking (2018) are shown in brackets. The Scores shown to the left are actually indices (0 to 100) generated for the unique purpose of constructing charts and graphics.

Methodology in a Nutshe l l
1. The IMD World Digital Competitiveness (WDC) ranking analyzes and ranks the extent to which countries adopt and explore digital technologies leading to transformation in government practices, business models and society in general.
2. As in the case of the IMD World Competitiveness ranking, we assume that digital transformation takes place primarily at enterprise level (whether private or state-owned) but it also occurs at the government and society levels.
3. Basedonourresearch,themethodologyoftheWDCrankingdefinesdigitalcompetitivenessintothreemainfactors:
- Knowledge - Technology - Future readiness
4. In turn, each of these factors is divided into 3 sub-factors which highlight every facet of the areas analyzed. Altogether, the WDC features 9 such sub-factors.
5. These 9 sub-factors comprise 51 criteria, although each sub-factor does not necessarily have the same number of criteria (for example, it takes more criteria to assess Training and Education than to evaluate IT integration).
6. Each sub-factor, independently of the number of criteria it contains, has the same weight in the overall consolidation of results, that is approximately 11.1% (100 ÷ 9 ~ 11.1).
7. Criteria can be hard data, which analyze digital competitiveness as it can be measured (e.g. Internet bandwidth speed) or soft data, which analyze competitiveness as it can be perceived (e.g. Agility of companies). Hard criteria represent a weight of 2/3 in the overall ranking whereas the survey data represent a weight of 1/3.
8. The 50 criteria include 19 new indicators which are only used in the assessment of the WDC ranking. The rest of the indicators are shared with the IMD World Competitiveness Ranking.
9. In addition, some criteria are for background information only, which means that they are not used in calculating the overall competitiveness ranking (i.e., Population and GDP).
10. Finally, aggregating the results of the 9 sub-factors makes the total consolidation, which leads to the overall ranking of the WDC.
IMD WORLD DIGITAL COMPETIT IVENESS RANKING 201928
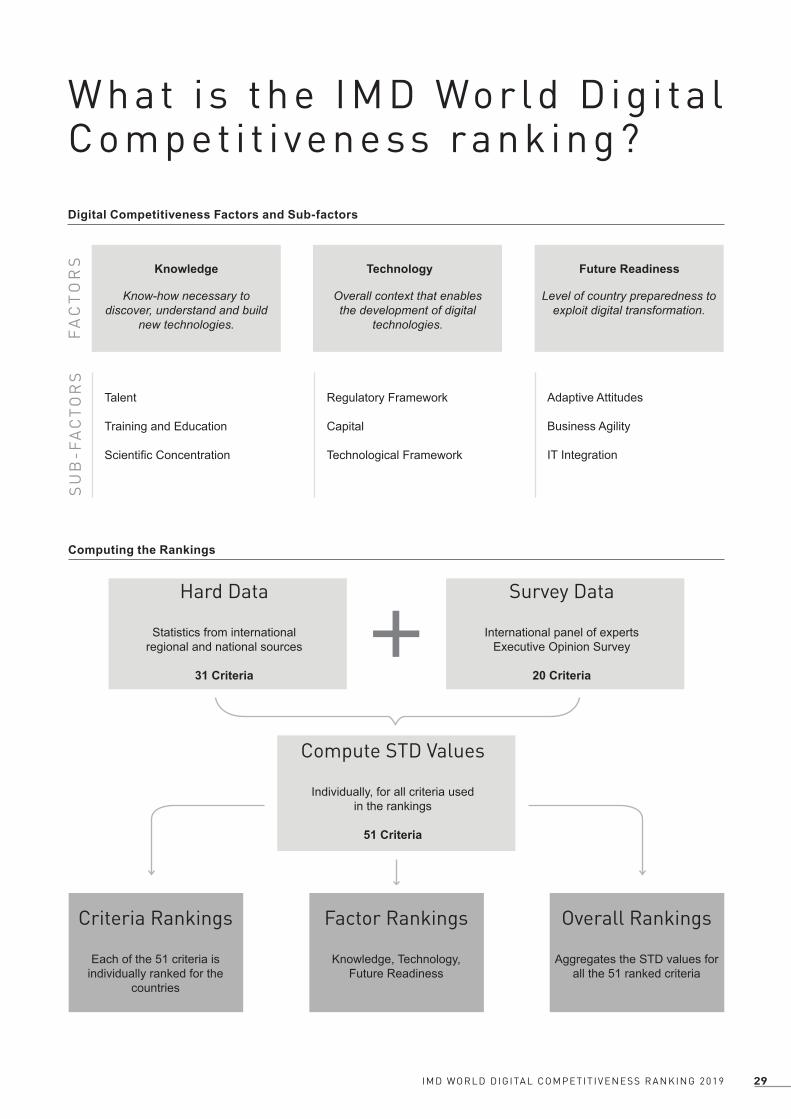
What i s the IMD Wor ld D ig i ta l Compet i t i veness rank ing?
Knowledge Technology Future Readiness
Know-how necessary to discover, understand and build
new technologies.
Overall context that enables the development of digital
technologies.
Level of country preparedness to exploit digital transformation.
Talent
Training and Education
ScientificConcentration
FA
CT
OR
SS
UB
-FA
CT
OR
S
Regulatory Framework
Capital
Technological Framework
Adaptive Attitudes
Business Agility
IT Integration
Digital Competitiveness Factors and Sub-factors
Computing the Rankings
Hard Data
Statistics from internationalregional and national sources
31 Criteria
Survey Data
International panel of experts Executive Opinion Survey
20 Criteria
Compute STD Values
Individually, for all criteria usedin the rankings
51 Criteria
Criteria Rankings
Each of the 51 criteria is individually ranked for the
countries
Factor Rankings
Knowledge, Technology, Future Readiness
Overall Rankings
Aggregates the STD values for all the 51 ranked criteria
29IMD WORLD DIGITAL COMPETIT IVENESS RANKING 2019

IMD WORLD DIGITAL COMPETIT IVENESS RANKING 201930
The 2019 IMD Wor ld D ig i ta l Compet i t i veness Rank ings : Se lec ted Breakdowns
Populations greater than 20 millionPopulations greater than 20 million
USA 1
Korea Rep. 2
Canada 3
Taiwan, China 4
Australia 5
United Kingdom 6
Germany 7
China 8
Japan 9
France 10
Malaysia 11
Spain 12
Poland 13
Russia 14
Saudi Arabia 15
Thailand 16
Italy 17
India 18
South Africa 19
Mexico 20
Turkey 21
Philippines 22
Indonesia 23
Brazil 24
Colombia 25
Argentina 26
Ukraine 27
Peru 28
Venezuela 29
100.000
91.297
90.836
90.194
88.897
88.691
86.216
84.292
82.775
82.522
82.390
78.743
73.707
70.406
69.036
68.434
67.903
64.952
60.865
60.411
59.793
59.439
58.011
57.346
56.126
56.044
55.255
54.029
27.763
0 10 20 30 40 50 60 70 80 90 100

31IMD WORLD DIGITAL COMPETIT IVENESS RANKING 2019
Populations less than 20 millionPopulations less than 20 million
Singapore 1
Sweden 2
Denmark 3
Switzerland 4
Netherlands 5
Finland 6
Hong Kong SAR 7
Norway 8
UAE 9
Israel 10
New Zealand 11
Ireland 12
Austria 13
Luxembourg 14
Belgium 15
Iceland 16
Estonia 17
Lithuania 18
Qatar 19
Slovenia 20
Portugal 21
Kazakhstan 22
Latvia 23
Czech Republic 24
Chile 25
Hungary 26
Bulgaria 27
Romania 28
Slovak Republic 29
Jordan 30
Croatia 31
Greece 32
Cyprus 33
Mongolia 34
99.373
96.070
95.225
94.648
94.261
93.732
93.686
93.671
90.295
86.373
86.026
85.863
84.473
84.368
82.491
79.935
78.669
77.578
75.897
75.174
73.007
72.623
72.437
71.812
66.724
65.472
63.663
62.755
62.624
60.399
59.993
59.633
59.536
49.846
0 10 20 30 40 50 60 70 80 90 100

IMD WORLD DIGITAL COMPETIT IVENESS RANKING 201932
GDP per capita greater than $20,000 GDP per capita greater than $20,000
USA 1
Singapore 2
Sweden 3
Denmark 4
Switzerland 5
Netherlands 6
Finland 7
Hong Kong SAR 8
Norway 9
Korea Rep. 10
Canada 11
UAE 12
Taiwan, China 13
Australia 14
United Kingdom 15
Israel 16
Germany 17
New Zealand 18
Ireland 19
Austria 20
Luxembourg 21
Japan 22
France 23
Belgium 24
Iceland 25
Spain 26
Estonia 27
Qatar 28
Slovenia 29
Portugal 30
Czech Republic 31
Saudi Arabia 32
Italy 33
Greece 34
Cyprus 35
100.000
99.373
96.070
95.225
94.648
94.261
93.732
93.686
93.671
91.297
90.836
90.295
90.194
88.897
88.691
86.373
86.216
86.026
85.863
84.473
84.368
82.775
82.522
82.491
79.935
78.743
78.669
75.897
75.174
73.007
71.812
69.036
67.903
59.633
59.536
0 10 20 30 40 50 60 70 80 90 100
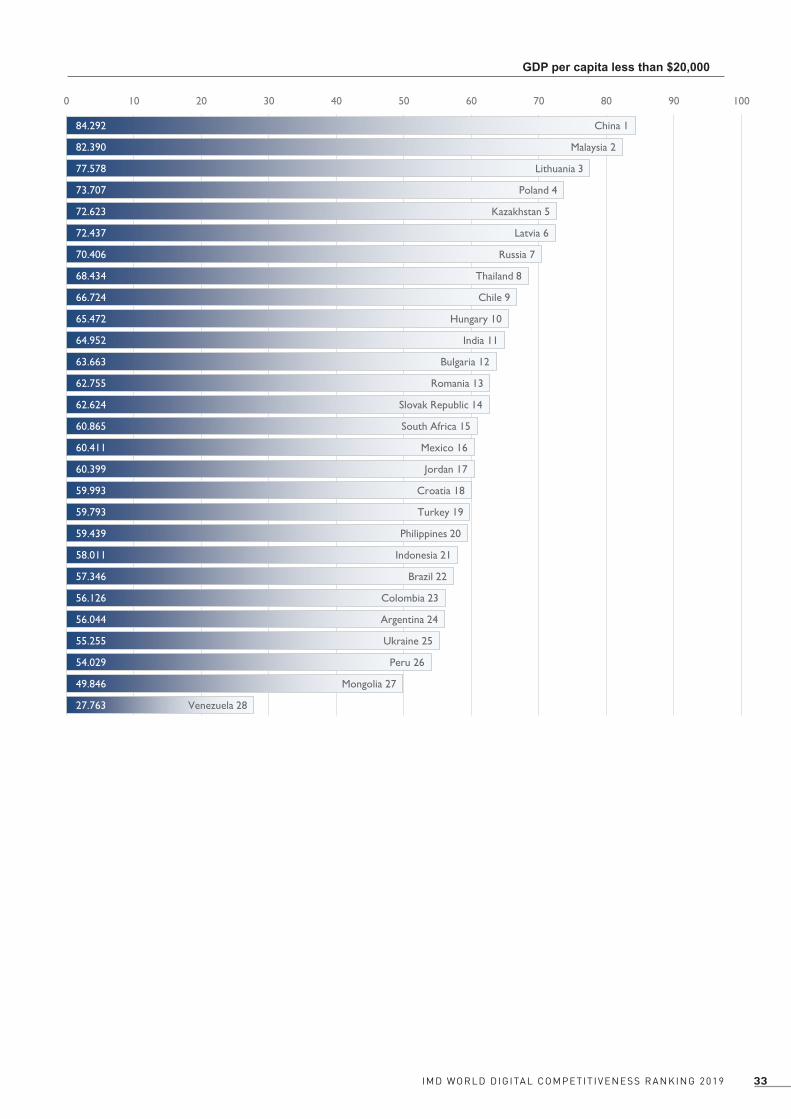
33IMD WORLD DIGITAL COMPETIT IVENESS RANKING 2019
GDP per capita less than $20,000 GDP per capita less than $20,000
China 1
Malaysia 2
Lithuania 3
Poland 4
Kazakhstan 5
Latvia 6
Russia 7
Thailand 8
Chile 9
Hungary 10
India 11
Bulgaria 12
Romania 13
Slovak Republic 14
South Africa 15
Mexico 16
Jordan 17
Croatia 18
Turkey 19
Philippines 20
Indonesia 21
Brazil 22
Colombia 23
Argentina 24
Ukraine 25
Peru 26
Mongolia 27
Venezuela 28
84.292
82.390
77.578
73.707
72.623
72.437
70.406
68.434
66.724
65.472
64.952
63.663
62.755
62.624
60.865
60.411
60.399
59.993
59.793
59.439
58.011
57.346
56.126
56.044
55.255
54.029
49.846
27.763
0 10 20 30 40 50 60 70 80 90 100

IMD WORLD DIGITAL COMPETIT IVENESS RANKING 201934
Europe - Middle East - AfricaEurope - Middle East - Africa
Sweden 1
Denmark 2
Switzerland 3
Netherlands 4
Finland 5
Norway 6
UAE 7
United Kingdom 8
Israel 9
Germany 10
Ireland 11
Austria 12
Luxembourg 13
France 14
Belgium 15
Iceland 16
Spain 17
Estonia 18
Lithuania 19
Qatar 20
Slovenia 21
Poland 22
Portugal 23
Kazakhstan 24
Latvia 25
Czech Republic 26
Russia 27
Saudi Arabia 28
Italy 29
Hungary 30
Bulgaria 31
Romania 32
Slovak Republic 33
South Africa 34
Jordan 35
Croatia 36
Turkey 37
Greece 38
Cyprus 39
Ukraine 40
96.070
95.225
94.648
94.261
93.732
93.671
90.295
88.691
86.373
86.216
85.863
84.473
84.368
82.522
82.491
79.935
78.743
78.669
77.578
75.897
75.174
73.707
73.007
72.623
72.437
71.812
70.406
69.036
67.903
65.472
63.663
62.755
62.624
60.865
60.399
59.993
59.793
59.633
59.536
55.255
0 10 20 30 40 50 60 70 80 90 100

35IMD WORLD DIGITAL COMPETIT IVENESS RANKING 2019
Asia - Pacific
The Americas
Asia - Pacific
Singapore 1
Hong Kong SAR 2
Korea Rep. 3
Taiwan, China 4
Australia 5
New Zealand 6
China 7
Japan 8
Malaysia 9
Thailand 10
India 11
Philippines 12
Indonesia 13
Mongolia 14
99.373
93.686
91.297
90.194
88.897
86.026
84.292
82.775
82.390
68.434
64.952
59.439
58.011
49.846
0 10 20 30 40 50 60 70 80 90 100
The Americas
USA 1
Canada 2
Chile 3
Mexico 4
Brazil 5
Colombia 6
Argentina 7
Peru 8
Venezuela 9
100.000
90.836
66.724
60.411
57.346
56.126
56.044
54.029
27.763
0 10 20 30 40 50 60 70 80 90 100

IMD WORLD DIGITAL COMPETIT IVENESS RANKING 201936
Knowledge
(2018 rankings are in parentheses)
KNOWLEDGEKnow-how necessary to discover, understand and build new technologies
(4) USA 1(6) Switzerland 2(1) Singapore 3
(7) Sweden 4(3) Canada 5
(8) Denmark 6(5) Hong Kong SAR 7
(2) Israel 8(9) Finland 9
(13) Austria 10(11) Korea Rep. 11(14) Germany 12
(12) Netherlands 13(10) United Kingdom 14
(15) Australia 15(16) Norway 16
(19) Taiwan, China 17(30) China 18(17) Malaysia 19
(20) France 20(21) New Zealand 21(24) Russia 22(25) Belgium 23(22) Ireland 24(18) Japan 25
(23) Lithuania 26(26) Slovenia 27
(31) Spain 28(28) Iceland 29
(29) Estonia 30(27) Portugal 31(35) Kazakhstan 32(33) Poland 33
(32) Luxembourg 34(36) UAE 35
(34) Latvia 36(38) Czech Republic 37
(46) India 38(40) Saudi Arabia 39
(39) Ukraine 40(42) Italy 41
(43) Croatia 42(44) Thailand 43(48) Hungary 44
(37) Qatar 45(41) Bulgaria 46
(45) Romania 47(49) Slovak Republic 48
(56) Jordan 49(47) Chile 50(50) Philippines 51(54) Mexico 52
(51) Greece 53(52) South Africa 54
(55) Cyprus 55(61) Indonesia 56(57) Colombia 57
(58) Argentina 58(62) Brazil 59(59) Turkey 60
(60) Peru 61(53) Mongolia 62
(63) Venezuela 63
90.998 90.850 90.503 89.727 87.849 85.987 85.819 84.970 84.462 83.831 83.360 83.072 81.807 81.686 80.702 80.333 78.886 78.067 77.613 76.024 75.187 75.017 74.990 74.805 74.687 72.619 72.409 70.906 70.363 69.599 69.223 68.971 68.614 68.112 67.972 65.643 64.668 63.721 61.401 60.033 59.979 59.075 58.435 58.181 57.539 57.368 56.658 55.261 54.482 53.772 53.539 53.505 52.869 52.148 51.050 48.395 48.331 46.307 45.742 45.497 44.816 43.669 37.017
0 10 20 30 40 50 60 70 80 90 100
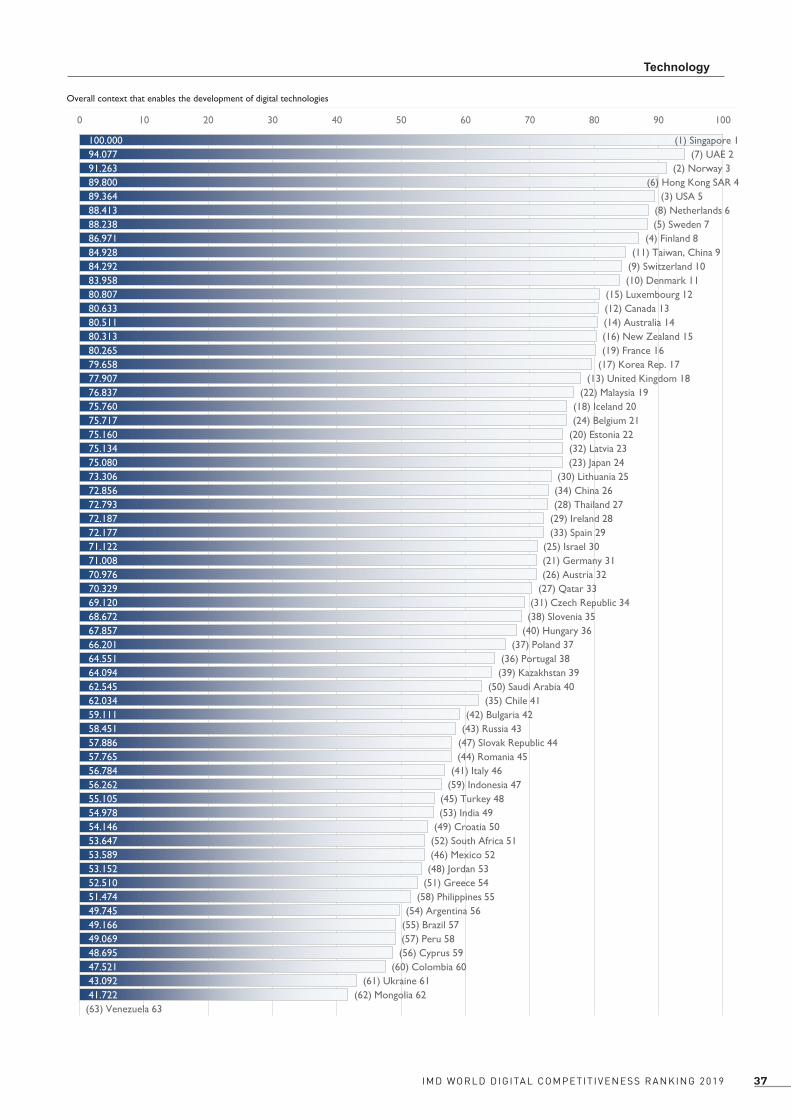
37IMD WORLD DIGITAL COMPETIT IVENESS RANKING 2019
Technology
(2018 rankings are in parentheses)
TECHNOLOGYOverall context that enables the development of digital technologies
(1) Singapore 1(7) UAE 2
(2) Norway 3(6) Hong Kong SAR 4
(3) USA 5(8) Netherlands 6(5) Sweden 7
(4) Finland 8(11) Taiwan, China 9
(9) Switzerland 10(10) Denmark 11
(15) Luxembourg 12(12) Canada 13(14) Australia 14(16) New Zealand 15(19) France 16
(17) Korea Rep. 17(13) United Kingdom 18
(22) Malaysia 19(18) Iceland 20(24) Belgium 21
(20) Estonia 22(32) Latvia 23(23) Japan 24
(30) Lithuania 25(34) China 26(28) Thailand 27
(29) Ireland 28(33) Spain 29
(25) Israel 30(21) Germany 31(26) Austria 32
(27) Qatar 33(31) Czech Republic 34(38) Slovenia 35
(40) Hungary 36(37) Poland 37
(36) Portugal 38(39) Kazakhstan 39
(50) Saudi Arabia 40(35) Chile 41
(42) Bulgaria 42(43) Russia 43
(47) Slovak Republic 44(44) Romania 45
(41) Italy 46(59) Indonesia 47
(45) Turkey 48(53) India 49
(49) Croatia 50(52) South Africa 51(46) Mexico 52
(48) Jordan 53(51) Greece 54
(58) Philippines 55(54) Argentina 56
(55) Brazil 57(57) Peru 58(56) Cyprus 59
(60) Colombia 60(61) Ukraine 61
(62) Mongolia 62(63) Venezuela 63
100.000 94.077 91.263 89.800 89.364 88.413 88.238 86.971 84.928 84.292 83.958 80.807 80.633 80.511 80.313 80.265 79.658 77.907 76.837 75.760 75.717 75.160 75.134 75.080 73.306 72.856 72.793 72.187 72.177 71.122 71.008 70.976 70.329 69.120 68.672 67.857 66.201 64.551 64.094 62.545 62.034 59.111 58.451 57.886 57.765 56.784 56.262 55.105 54.978 54.146 53.647 53.589 53.152 52.510 51.474 49.745 49.166 49.069 48.695 47.521 43.092 41.722 -
0 10 20 30 40 50 60 70 80 90 100

IMD WORLD DIGITAL COMPETIT IVENESS RANKING 201938
Future Readiness
(2018 rankings are in parentheses)
FUTURE READINESSLevel of country preparedness to exploit digital transformation
(2) USA 1(1) Denmark 2
(4) Netherlands 3(17) Korea Rep. 4(13) Ireland 5(5) Sweden 6
(8) Finland 7(6) Norway 8
(12) UAE 9(10) Switzerland 10
(15) Singapore 11(22) Taiwan, China 12(3) United Kingdom 13
(11) Australia 14(24) Hong Kong SAR 15
(20) Germany 16(21) Luxembourg 17(9) Canada 18
(7) Israel 19(18) New Zealand 20
(28) China 21(16) Qatar 22
(14) Austria 23(25) Japan 24
(23) Belgium 25(19) Iceland 26
(30) Spain 27(29) Malaysia 28
(27) France 29(26) Estonia 30
(36) Italy 31(33) Lithuania 32
(37) Poland 33(32) Portugal 34(40) Kazakhstan 35(35) Slovenia 36(31) Chile 37
(38) Saudi Arabia 38(34) Czech Republic 39
(44) Cyprus 40(42) Turkey 41
(51) Russia 42(47) Brazil 43(43) South Africa 44(39) Latvia 45(48) India 46
(53) Slovak Republic 47(55) Bulgaria 48(50) Mexico 49(49) Thailand 50(57) Romania 51(41) Jordan 52(46) Greece 53(52) Philippines 54
(56) Colombia 55(45) Argentina 56
(58) Hungary 57(62) Indonesia 58
(60) Peru 59(54) Croatia 60
(59) Mongolia 61(61) Ukraine 62
(63) Venezuela 63
98.427 94.519 91.352 89.662 89.388 89.034 88.552 88.206 87.626 87.593 86.407 85.556 85.270 84.269 84.230 83.358 82.974 82.816 81.816 81.367 80.743 78.612 77.401 77.347 75.554 72.470 71.935 71.509 70.066 70.039 65.736 65.599 65.095 64.037 63.595 63.230 63.156 61.950 60.437 57.652 57.567 56.539 55.919 55.588 55.324 54.946 53.513 53.300 52.930 52.864 52.633 52.352 52.310 52.093 51.316 50.869 49.168 48.166 46.993 45.547 42.936 41.430 25.061
0 10 20 30 40 50 60 70 80 90 100

39IMD WORLD DIGITAL COMPETIT IVENESS RANKING 2019

IMD WORLD DIGITAL COMPETIT IVENESS RANKING 201940
Factor Rankings - 5 years overview
2015 2016 2017 2018 2019 2015 2016 2017 2018 2019Argentina 58 55 57 55 59 57 53 56 58 58 Australia 9 14 15 13 14 11 16 18 15 15 Austria 26 19 16 15 20 16 12 12 13 10 Belgium 19 18 22 23 25 21 20 22 25 23 Brazil 56 54 55 57 57 55 54 55 62 59 Bulgaria 54 47 45 43 45 45 38 41 41 46 Canada 4 5 9 8 11 3 7 3 3 5 Chile 37 37 40 37 42 53 51 52 47 50 China 33 35 31 30 22 22 24 23 30 18 Colombia 53 56 58 59 58 52 56 57 57 57 Croatia 46 44 48 44 51 46 45 50 43 42 Cyprus - - 53 54 54 - - 46 55 55 Czech Republic 31 32 32 33 37 36 34 36 38 37 Denmark 8 8 5 4 4 9 8 8 8 6 Estonia 27 27 26 25 29 30 30 28 29 30 Finland 3 6 4 7 7 7 9 9 9 9 France 20 22 25 26 24 20 21 19 20 20 Germany 17 15 17 18 17 10 10 13 14 12 Greece 40 45 50 53 53 34 46 51 51 53 Hong Kong SAR 14 11 7 11 8 8 6 6 5 7 Hungary 44 42 44 46 43 44 43 48 48 44 Iceland 24 26 23 21 27 33 32 30 28 29 India 50 53 51 48 44 37 39 37 46 38 Indonesia 60 60 59 62 56 60 60 58 61 56 Ireland 25 20 21 20 19 26 25 25 22 24 Israel 10 13 13 12 16 4 5 7 2 8 Italy 36 34 39 41 41 42 40 42 42 41 Japan 23 23 27 22 23 24 23 29 18 25 Jordan 49 48 56 45 50 61 59 61 56 49 Kazakhstan 35 43 38 38 35 41 47 40 35 32 Korea Rep. 18 17 19 14 10 13 15 14 11 11 Latvia 34 33 35 35 36 32 33 34 34 36 Lithuania 28 29 29 29 30 18 18 21 23 26 Luxembourg 16 21 20 24 21 23 29 27 32 34 Malaysia 21 24 24 27 26 25 22 17 17 19 Mexico 48 52 49 51 49 51 52 54 54 52 Mongolia 55 57 61 61 62 56 55 59 53 62 Netherlands 6 4 6 9 6 14 13 11 12 13 New Zealand 13 10 14 19 18 15 14 20 21 21 Norway 11 9 10 6 9 17 17 15 16 16 Peru 57 58 62 60 61 58 61 62 60 61 Philippines 45 46 46 56 55 49 50 53 50 51 Poland 38 38 37 36 33 31 27 32 33 33 Portugal 29 31 33 32 34 29 31 31 27 31 Qatar 32 28 28 28 31 39 37 35 37 45 Romania 51 49 54 47 46 50 48 47 45 47 Russia 41 40 42 40 38 27 28 24 24 22 Saudi Arabia - - 36 42 39 - - 39 40 39 Singapore 1 1 1 2 2 1 1 1 1 3 Slovak Republic 43 41 43 50 47 43 41 43 49 48 Slovenia 39 36 34 34 32 28 26 26 26 27 South Africa 47 51 47 49 48 47 49 49 52 54 Spain 30 30 30 31 28 35 36 33 31 28 Sweden 5 3 2 3 3 2 2 2 7 4 Switzerland 7 7 8 5 5 5 3 4 6 2 Taiwan, China 15 16 12 16 13 19 19 16 19 17 Thailand 42 39 41 39 40 48 42 44 44 43 Turkey 52 50 52 52 52 59 58 60 59 60 UAE 22 25 18 17 12 38 35 38 36 35 Ukraine 59 59 60 58 60 40 44 45 39 40 United Kingdom 12 12 11 10 15 12 11 10 10 14 USA 2 2 3 1 1 6 4 5 4 1 Venezuela 61 61 63 63 63 54 57 63 63 63
OVERALL Knowledge

41IMD WORLD DIGITAL COMPETIT IVENESS RANKING 2019
2015 2016 2017 2018 2019 2015 2016 2017 2018 201959 56 58 54 56 45 46 49 45 56 Argentina12 15 15 14 14 8 7 14 11 14 Australia29 28 28 26 32 19 19 15 14 23 Austria24 21 24 24 21 15 16 22 23 25 Belgium55 54 55 55 57 51 49 44 47 43 Brazil42 38 42 42 42 59 58 57 55 48 Bulgaria17 14 13 12 13 2 3 8 9 18 Canada31 34 34 35 41 32 32 33 31 37 Chile37 39 36 34 26 39 38 34 28 21 China56 59 60 60 60 43 44 53 56 55 Colombia41 43 47 49 50 52 50 56 54 60 Croatia
- - 54 56 59 - - 54 44 40 Cyprus26 26 26 31 34 33 34 37 34 39 Czech Republic13 12 10 10 11 6 6 1 1 2 Denmark19 17 19 20 22 26 26 26 26 30 Estonia7 7 4 4 8 4 5 4 8 7 Finland
23 23 22 19 16 21 20 28 27 29 France25 25 21 21 31 13 14 18 20 16 Germany51 52 52 51 54 36 36 47 46 53 Greece5 2 3 6 4 25 27 17 24 15 Hong Kong SAR
39 37 38 40 36 47 45 55 58 57 Hungary20 22 20 18 20 17 18 21 19 26 Iceland58 57 59 53 49 53 54 51 48 46 India57 58 56 59 47 58 60 62 62 58 Indonesia27 27 25 29 28 12 12 10 13 5 Ireland22 24 27 25 30 7 9 11 7 19 Israel46 44 45 41 46 30 29 30 36 31 Italy21 19 23 23 24 22 23 25 25 24 Japan49 45 50 48 53 38 37 48 41 52 Jordan34 42 35 39 39 35 41 38 40 35 Kazakhstan16 13 17 17 17 24 25 24 17 4 Korea Rep.32 33 32 32 23 37 39 41 39 45 Latvia28 29 29 30 25 34 33 31 33 32 Lithuania2 11 12 15 12 23 24 23 21 17 Luxembourg
14 16 18 22 19 27 28 27 29 28 Malaysia47 49 48 46 52 54 56 50 50 49 Mexico54 55 61 62 62 46 52 60 59 61 Mongolia15 10 9 8 6 1 2 3 4 3 Netherlands8 6 11 16 15 16 15 20 18 20 New Zealand3 3 2 2 3 14 13 12 6 8 Norway
52 53 57 57 58 56 55 58 60 59 Peru50 50 51 58 55 40 40 43 52 54 Philippines36 36 39 37 37 49 51 39 37 33 Poland30 35 37 36 38 31 31 35 32 34 Portugal38 31 31 27 33 28 21 19 16 22 Qatar45 46 46 44 45 57 57 59 57 51 Romania44 47 44 43 43 55 53 52 51 42 Russia
- - 41 50 40 - - 32 38 38 Saudi Arabia1 1 1 1 1 5 4 6 15 11 Singapore
40 41 43 47 44 44 43 46 53 47 Slovak Republic43 40 40 38 35 41 35 36 35 36 Slovenia53 51 53 52 51 48 47 42 43 44 South Africa35 32 33 33 29 29 30 29 30 27 Spain9 4 5 5 7 9 8 5 5 6 Sweden
11 9 8 9 10 10 10 13 10 10 Switzerland4 8 7 11 9 20 22 16 22 12 Taiwan, China
33 30 30 28 27 50 48 45 49 50 Thailand48 48 49 45 48 42 42 40 42 41 Turkey10 20 14 7 2 18 17 7 12 9 UAE60 60 62 61 61 61 61 61 61 62 Ukraine18 18 16 13 18 11 11 9 3 13 United Kingdom6 5 6 3 5 3 1 2 2 1 USA
61 61 63 63 63 60 59 63 63 63 Venezuela
Future readinessTechnology

IMD WORLD DIGITAL COMPETIT IVENESS RANKING 201942
Tal
ent
Tra
inin
g &
edu
catio
n
Scie
ntifi
c co
ncen
trat
ion
Reg
ulat
ory
fram
ewor
k
Cap
ital
Tec
hnol
ogic
al fr
amew
ork
Ada
ptiv
e at
titud
es
Busi
ness
agi
lity
IT in
tegr
atio
n
Argentina 51 62 50 49 51 57 57 48 52 ArgentinaAustralia 7 29 13 7 19 17 7 35 11 AustraliaAustria 12 8 14 25 34 31 29 25 15 AustriaBelgium 18 26 24 22 25 26 23 33 23 BelgiumBrazil 61 59 44 57 61 47 33 58 49 BrazilBulgaria 50 46 37 46 42 44 43 56 47 BulgariaCanada 13 7 2 17 10 27 17 16 13 CanadaChile 36 55 57 36 44 42 27 50 39 ChileChina 19 37 9 20 32 32 24 1 41 ChinaColombia 56 49 58 61 55 52 56 55 45 ColombiaCroatia 58 31 33 59 50 41 51 62 57 CroatiaCyprus 62 33 53 56 60 48 34 57 38 CyprusCzech Republic 35 44 30 43 28 28 46 37 35 Czech RepublicDenmark 6 6 17 10 27 8 1 10 1 DenmarkEstonia 37 10 46 31 24 16 26 43 26 EstoniaFinland 9 16 10 9 11 13 6 27 2 FinlandFrance 24 28 12 8 18 22 36 39 19 FranceGermany 25 14 4 27 17 40 16 11 17 GermanyGreece 53 60 34 52 52 49 41 60 50 GreeceHong Kong SAR 4 12 16 12 6 3 12 8 22 Hong Kong SARHungary 47 43 45 35 46 19 62 53 37 HungaryIceland 34 18 39 15 39 15 28 24 28 IcelandIndia 38 47 28 55 3 62 54 29 56 IndiaIndonesia 42 61 52 51 26 56 60 21 60 IndonesiaIreland 10 30 29 13 49 24 3 9 20 IrelandIsrael 27 3 5 32 20 35 21 19 16 IsraelItaly 44 57 23 44 53 46 35 31 34 ItalyJapan 46 19 11 42 37 2 15 41 18 JapanJordan 43 32 63 47 41 55 61 22 54 JordanKazakhstan 39 1 55 16 54 43 39 15 46 KazakhstanKorea Rep. 30 5 6 26 29 7 4 5 21 Korea Rep.Latvia 32 27 47 30 35 14 52 47 44 LatviaLithuania 23 13 41 24 36 21 45 18 32 LithuaniaLuxembourg 31 24 42 4 9 34 22 20 6 LuxembourgMalaysia 22 11 27 29 14 20 30 17 33 MalaysiaMexico 55 53 40 48 47 53 47 51 53 MexicoMongolia 60 45 60 62 58 58 31 63 62 MongoliaNetherlands 3 36 19 6 5 10 9 7 3 NetherlandsNew Zealand 11 34 26 11 15 25 13 32 10 New ZealandNorway 16 17 21 3 7 6 5 23 9 NorwayPeru 59 42 62 50 45 61 49 59 59 PeruPhilippines 41 54 54 60 40 51 53 42 58 PhilippinesPoland 28 35 31 45 38 30 37 28 36 PolandPortugal 26 39 32 21 48 45 32 52 29 PortugalQatar 15 48 61 28 23 38 18 12 27 QatarRomania 48 51 38 41 59 36 48 46 55 RomaniaRussia 45 9 18 40 57 39 40 54 43 RussiaSaudi Arabia 20 38 59 39 13 54 50 36 30 Saudi ArabiaSingapore 1 4 22 2 8 1 19 6 4 SingaporeSlovak Republic 54 52 36 58 43 37 42 61 40 Slovak RepublicSlovenia 33 22 25 37 31 33 44 34 31 SloveniaSouth Africa 49 58 48 53 30 59 55 40 42 South AfricaSpain 29 40 20 34 33 23 25 38 25 SpainSweden 8 2 3 5 4 12 8 13 12 SwedenSwitzerland 2 15 7 14 16 9 11 14 7 SwitzerlandTaiwan, China 21 20 15 23 12 4 14 3 24 Taiwan, ChinaThailand 40 50 35 33 21 29 58 30 51 ThailandTurkey 52 63 43 38 56 50 38 44 48 TurkeyUAE 5 41 56 1 2 5 20 4 8 UAEUkraine 57 21 49 54 62 60 59 45 61 UkraineUnited Kingdom 17 23 8 18 22 18 10 26 14 United KingdomUSA 14 25 1 19 1 11 2 2 5 USAVenezuela 63 56 51 63 63 63 63 49 63 Venezuela
Technology Future readinessKnowledge
Sub-factor Rankings
43IMD WORLD DIGITAL COMPETIT IVENESS RANKING 2019
DIGITAL COMPETITIVENESS
COUNTRY PROFILES
The statistical tables are available for subscribers of the IMD World Competitiveness Online.
Visit our eShop

IMD WORLD DIGITAL COMPETIT IVENESS RANKING 201944
Alpha AlphaLabelBeta BetaLabel Gamma GammaLabel1 2 2 2 2 2 24 4 4 2 2
6.5 4 4 2 28.5 4 4 2 2
10.5 4 4 2 2
2015 2016 2017 2018 2019
58 55 57 55 59
57 53 56 58 58
59 56 58 54 56
45 46 49 45 56
COMPETITIVENESS & DIGITAL RANKINGS
PEER GROUPS RANKINGS
THE AMERICAS (9 countries) POPULATIONS > 20 MILLION (29 countries)
Future readiness
Knowledge
Technology
OVERALL
DIGITAL TRENDS - OVERALL
ARGENTINA
OVERALL PERFORMANCE (63 countries)
OVERALL & FACTORS - 5 years
58
55
57
55
5959
55
58
56
61
2015 2016 2017 2018 2019
Digital
Competitiveness
86 6 5
7
2015 2016 2017 2018 2019
2523 24
2226
2015 2016 2017 2018 2019
58 51 62 50
56 49 51 5759
56 57 48 52
Knowledge Talent Training & education Scientific concentration
Technology Regulatory framework Capital Technological framework
Future readiness Adaptive attitudes Business agility IT integrationThe direction of the triangle indicates the performance change from the last year: improved or stabledeclined
Overall Factors Sub-Factors
N.B. This graph provides only a comparison of the country’s performance in the two rankings.

45IMD WORLD DIGITAL COMPETIT IVENESS RANKING 2019
u Overall top strengths
w Overall top weaknesses
Subfactors 2015 2016 2017 2018 201959 50 54 47 51
56 57 61 63 62
42 40 42 41 50
Talent Rank Rank Rank
Educational assessment PISA - Math 49 56 48 International experience 30 w 62 42 Foreign highly-skilled personnel 47 55 u 4 Management of cities 49 23 22 Digital/Technological skills 52 58 50u Net flow of international students 18 43 59 35
Subfactors 2015 2016 2017 2018 201954 46 46 48 49
59 59 59 48 51
56 54 56 53 57
Regulatory framework Rank Rank Rank
Starting a business 56 28 w 60 Enforcing contracts 51 60 53u Immigration laws 4 w 62 50 Development and application of technology54 w 60 53 Scientific research legislation 56 w 62 57 Intellectual property rights 55 u 2 40
Subfactors 2015 2016 2017 2018 201949 49 49 49 57
33 42 36 37 48
54 51 54 52 52
Adaptive attitudes Rank Rank Rank
E-Participation 57 u 18 36 Internet retailing 39 38 43 Tablet possession 42 51 48 Smartphone possession 44 47 58 Attitudes toward globalization 58 48
Opportunities and threats E-GovernmentWorld robots distribution Public-private partnerships
Total expenditure on R&D (%)Total public expenditure on education Total R&D personnel per capita
Robots in Education and R&D
FUTURE READINESS
FACTORS BREAKDOWN - STRENGTHS AND WEAKNESSES
ARGENTINA
Training & education Scientific concentration
TECHNOLOGY
Technological framework
Talent
Training & education
Adaptive attitudes
Business agility
Venture capital Internet bandwidth speedInvestment in Telecommunications High-tech exports (%)
Scientific concentration
Regulatory framework
Capital
IT & media stock market capitalization Communications technologyFunding for technological development Mobile Broadband subscribersBanking and financial services Wireless broadbandCountry credit rating Internet users
Higher education achievement Female researchersPupil-teacher ratio (tertiary education) R&D productivity by publicationGraduates in Sciences Scientific and technical employmentWomen with degrees High-tech patent grants
Capital Technological framework
Employee training
KNOWLEDGE
Agility of companies Cyber securityUse of big data and analytics Sofware piracyKnowledge transfer
IT integration
Business agility IT integration

IMD WORLD DIGITAL COMPETIT IVENESS RANKING 201946
Alpha AlphaLabelBeta BetaLabel Gamma GammaLabel1 2 2 2 2 2 24 4 4 2 2
6.5 4 4 2 28.5 4 4 2 2
10.5 4 4 2 2
2015 2016 2017 2018 2019
9 14 15 13 14
11 16 18 15 15
12 15 15 14 14
8 7 14 11 14
COMPETITIVENESS & DIGITAL RANKINGS
PEER GROUPS RANKINGS
ASIA - PACIFIC (14 countries) POPULATIONS > 20 MILLION (29 countries)
Knowledge
Technology
Future readiness
OVERALL
DIGITAL TRENDS - OVERALL
AUSTRALIA
OVERALL PERFORMANCE (63 countries)
OVERALL & FACTORS - 5 years
9
14 1513 14
1817 21
1918
2015 2016 2017 2018 2019
Digital
Competitiveness
24
53
5
2015 2016 2017 2018 2019
34
54
5
2015 2016 2017 2018 2019
15 7 29 13
14 7 19 1714
14 7 35 11
Knowledge Talent Training & education Scientific concentration
Technology Regulatory framework Capital Technological framework
Future readiness Adaptive attitudes Business agility IT integrationThe direction of the triangle indicates the performance change from the last year: improved or stabledeclined
Overall Factors Sub-Factors
N.B. This graph provides only a comparison of the country’s performance in the two rankings.

47IMD WORLD DIGITAL COMPETIT IVENESS RANKING 2019
u Overall top strengths
w Overall top weaknesses
Subfactors 2015 2016 2017 2018 20193 6 8 8 7
38 47 51 32 29
10 12 14 11 13
Talent Rank Rank Rank
Educational assessment PISA - Math 23 w 44 19 International experience 35 21 - Foreign highly-skilled personnel 10 13 - Management of cities 26 32 17w Digital/Technological skills 44 w 53 6u Net flow of international students 1 10 42 24
Subfactors 2015 2016 2017 2018 20198 6 11 6 7
15 15 16 18 19
13 17 21 19 17
Regulatory framework Rank Rank Rank
Starting a business 5 37 w 54u Enforcing contracts 5 36 5 Immigration laws 23 28 9 Development and application of technology22 u 1 29 Scientific research legislation 20 34 38 Intellectual property rights 14 14 28
Subfactors 2015 2016 2017 2018 20192 2 4 2 7
26 22 42 28 35
6 8 10 6 11
Adaptive attitudes Rank Rank Rank
E-Participation 5 38 u 2 Internet retailing 9 29 26u Tablet possession 3 w 45 39 Smartphone possession 9 28 5 Attitudes toward globalization 32 30
Talent
Robots in Education and R&D
Training & education Scientific concentration
TECHNOLOGY
Scientific concentration
Capital Technological framework
FUTURE READINESS
IT integration
Business agility IT integration
FACTORS BREAKDOWN - STRENGTHS AND WEAKNESSES
Technological framework
Opportunities and threats E-GovernmentWorld robots distribution Public-private partnerships
Total expenditure on R&D (%)Total public expenditure on education Total R&D personnel per capita
Training & education
Adaptive attitudes
Business agility
Venture capital Internet bandwidth speedInvestment in Telecommunications High-tech exports (%)
Regulatory framework
Capital
IT & media stock market capitalization Communications technologyFunding for technological development Mobile Broadband subscribersBanking and financial services Wireless broadbandCountry credit rating Internet users
Higher education achievement Female researchersPupil-teacher ratio (tertiary education) R&D productivity by publicationGraduates in Sciences Scientific and technical employmentWomen with degrees High-tech patent grants
Employee training
KNOWLEDGE
AUSTRALIA
Agility of companies Cyber securityUse of big data and analytics Sofware piracyKnowledge transfer

IMD WORLD DIGITAL COMPETIT IVENESS RANKING 201948
Alpha AlphaLabelBeta BetaLabel Gamma GammaLabel1 2 2 2 2 2 24 4 4 2 2
6.5 4 4 2 28.5 4 4 2 2
10.5 4 4 2 2
2015 2016 2017 2018 2019
26 19 16 15 20
16 12 12 13 10
29 28 28 26 32
19 19 15 14 23
COMPETITIVENESS & DIGITAL RANKINGS
PEER GROUPS RANKINGS
EUROPE - MIDDLE EAST - AFRICA (40 countries) POPULATIONS < 20 MILLION (34 countries)
Knowledge
Technology
Future readiness
OVERALL
DIGITAL TRENDS - OVERALL
AUSTRIA
OVERALL PERFORMANCE (63 countries)
OVERALL & FACTORS - 5 years
26
1916 15
20
26 24 25 18
19
2015 2016 2017 2018 2019
Digital
Competitiveness
1611 9 9 12
2015 2016 2017 2018 2019
1612 11 10 13
2015 2016 2017 2018 2019
10 12 8 14
32 25 34 3120
23 29 25 15
Knowledge Talent Training & education Scientific concentration
Technology Regulatory framework Capital Technological framework
Future readiness Adaptive attitudes Business agility IT integrationThe direction of the triangle indicates the performance change from the last year: improved or stabledeclined
Overall Factors Sub-Factors
N.B. This graph provides only a comparison of the country’s performance in the two rankings.

49IMD WORLD DIGITAL COMPETIT IVENESS RANKING 2019
u Overall top strengths
w Overall top weaknesses
Subfactors 2015 2016 2017 2018 201917 13 12 12 12
16 4 4 7 8
22 22 21 18 14
Talent Rank Rank Rank
Educational assessment PISA - Math 19 u 1 7 International experience 13 27 9 Foreign highly-skilled personnel 17 36 43 Management of cities 15 u 2 w 50w Digital/Technological skills 45 8 19u Net flow of international students 4 36 25 10
Subfactors 2015 2016 2017 2018 201931 29 25 24 25
47 39 38 38 34
18 19 22 21 31
Regulatory framework Rank Rank Rank
w Starting a business 50 39 30 Enforcing contracts 9 21 20w Immigration laws 51 15 31 Development and application of technology27 12 30 Scientific research legislation 16 37 37 Intellectual property rights 10 w 60 37
Subfactors 2015 2016 2017 2018 201931 30 25 25 29
10 9 8 5 25
15 16 9 10 15
Adaptive attitudes Rank Rank Rank
E-Participation 40 20 20 Internet retailing 17 23 38 Tablet possession 20 15 u 5 Smartphone possession 36 41 u 6 Attitudes toward globalization 36 12
Technological framework
Talent
Robots in Education and R&D
Training & education Scientific concentration
TECHNOLOGY
Opportunities and threats E-GovernmentWorld robots distribution Public-private partnerships
FUTURE READINESS
IT integration
Business agility IT integration
FACTORS BREAKDOWN - STRENGTHS AND WEAKNESSES
Total expenditure on R&D (%)Total public expenditure on education Total R&D personnel per capita
Capital Technological framework
Scientific concentration
Training & education
Adaptive attitudes
Business agility
Venture capital Internet bandwidth speedInvestment in Telecommunications High-tech exports (%)
Regulatory framework
Capital
IT & media stock market capitalization Communications technologyFunding for technological development Mobile Broadband subscribersBanking and financial services Wireless broadbandCountry credit rating Internet users
Higher education achievement Female researchersPupil-teacher ratio (tertiary education) R&D productivity by publicationGraduates in Sciences Scientific and technical employmentWomen with degrees High-tech patent grants
Employee training
KNOWLEDGE
AUSTRIA
Agility of companies Cyber securityUse of big data and analytics Sofware piracyKnowledge transfer

IMD WORLD DIGITAL COMPETIT IVENESS RANKING 201950
Alpha AlphaLabelBeta BetaLabel Gamma GammaLabel1 2 2 2 2 2 24 4 4 2 2
6.5 4 4 2 28.5 4 4 2 2
10.5 4 4 2 2
2015 2016 2017 2018 2019
19 18 22 23 25
21 20 22 25 23
24 21 24 24 21
15 16 22 23 25
COMPETITIVENESS & DIGITAL RANKINGS
PEER GROUPS RANKINGS
EUROPE - MIDDLE EAST - AFRICA (40 countries) POPULATIONS < 20 MILLION (34 countries)
Knowledge
Technology
Future readiness
OVERALL
DIGITAL TRENDS - OVERALL
BELGIUM
OVERALL PERFORMANCE (63 countries)
OVERALL & FACTORS - 5 years
19 1822 23 25
23 22 2326 27
2015 2016 2017 2018 2019
Digital
Competitiveness
11 1014 14 15
2015 2016 2017 2018 2019
12 1115 15 15
2015 2016 2017 2018 2019
23 18 26 24
21 22 25 2625
25 23 33 23
Knowledge Talent Training & education Scientific concentration
Technology Regulatory framework Capital Technological framework
Future readiness Adaptive attitudes Business agility IT integrationThe direction of the triangle indicates the performance change from the last year: improved or stabledeclined
Overall Factors Sub-Factors
N.B. This graph provides only a comparison of the country’s performance in the two rankings.

51IMD WORLD DIGITAL COMPETIT IVENESS RANKING 2019
u Overall top strengths
w Overall top weaknesses
Subfactors 2015 2016 2017 2018 201911 12 17 17 18
26 24 29 30 26
31 30 27 29 24
Talent Rank Rank Rank
Educational assessment PISA - Math 14 29 12u International experience 10 u 7 14 Foreign highly-skilled personnel 28 24 33 Management of cities 40 39 40 Digital/Technological skills 36 w 57 23u Net flow of international students 10 21 w 45 18
Subfactors 2015 2016 2017 2018 201915 13 16 17 22
24 19 23 23 25
30 29 31 33 26
Regulatory framework Rank Rank Rank
Starting a business 20 32 28 Enforcing contracts 40 17 21u Immigration laws 10 24 w 46 Development and application of technology33 19 19 Scientific research legislation 18 17 19 Intellectual property rights 23 38 38
Subfactors 2015 2016 2017 2018 201920 18 21 19 23
7 7 21 21 33
22 23 19 21 23
Adaptive attitudes Rank Rank Rank
w E-Participation 47 w 48 25 Internet retailing 11 24 29u Tablet possession 10 39 33 Smartphone possession 20 35 13 Attitudes toward globalization 39 16
Talent
Robots in Education and R&D
Training & education Scientific concentration
TECHNOLOGY
Scientific concentration
Capital Technological framework
FUTURE READINESS
IT integration
Business agility IT integration
FACTORS BREAKDOWN - STRENGTHS AND WEAKNESSES
BELGIUM
Technological framework
Opportunities and threats E-GovernmentWorld robots distribution Public-private partnerships
Total expenditure on R&D (%)Total public expenditure on education Total R&D personnel per capita
Training & education
Adaptive attitudes
Business agility
Venture capital Internet bandwidth speedInvestment in Telecommunications High-tech exports (%)
Regulatory framework
Capital
IT & media stock market capitalization Communications technologyFunding for technological development Mobile Broadband subscribersBanking and financial services Wireless broadbandCountry credit rating Internet users
Higher education achievement Female researchersPupil-teacher ratio (tertiary education) R&D productivity by publicationGraduates in Sciences Scientific and technical employmentWomen with degrees High-tech patent grants
Employee training
KNOWLEDGE
Agility of companies Cyber securityUse of big data and analytics Sofware piracyKnowledge transfer

IMD WORLD DIGITAL COMPETIT IVENESS RANKING 201952
Alpha AlphaLabelBeta BetaLabel Gamma GammaLabel1 2 2 2 2 2 24 4 4 2 2
6.5 4 4 2 28.5 4 4 2 2
10.5 4 4 2 2
2015 2016 2017 2018 2019
56 54 55 57 57
55 54 55 62 59
55 54 55 55 57
51 49 44 47 43
COMPETITIVENESS & DIGITAL RANKINGS
PEER GROUPS RANKINGS
THE AMERICAS (9 countries) POPULATIONS > 20 MILLION (29 countries)
Knowledge
Technology
Future readiness
OVERALL
DIGITAL TRENDS - OVERALL
BRAZIL
OVERALL PERFORMANCE (63 countries)
OVERALL & FACTORS - 5 years
5654
5557 57
5657
6160
59
2015 2016 2017 2018 2019
Digital
Competitiveness
65 5
65
2015 2016 2017 2018 2019
2322
2324 24
2015 2016 2017 2018 2019
59 61 59 44
57 57 61 4757
43 33 58 49
Knowledge Talent Training & education Scientific concentration
Technology Regulatory framework Capital Technological framework
Future readiness Adaptive attitudes Business agility IT integrationThe direction of the triangle indicates the performance change from the last year: improved or stabledeclined
Overall Factors Sub-Factors
N.B. This graph provides only a comparison of the country’s performance in the two rankings.

53IMD WORLD DIGITAL COMPETIT IVENESS RANKING 2019
u Overall top strengths
w Overall top weaknesses
Subfactors 2015 2016 2017 2018 201960 59 60 61 61
52 49 48 57 59
40 43 44 54 44
Talent Rank Rank Rank
Educational assessment PISA - Math 56 53 30 International experience 58 u 8 44 Foreign highly-skilled personnel 58 57 51w Management of cities 60 48 u 8w Digital/Technological skills 62 56 - Net flow of international students 38 51 46 u 14
Subfactors 2015 2016 2017 2018 201957 58 60 59 57
55 54 56 56 61
49 47 48 47 47
Regulatory framework Rank Rank Rank
w Starting a business 60 44 w 61 Enforcing contracts 36 59 u 27 Immigration laws 46 58 33 Development and application of technology59 56 46w Scientific research legislation 60 55 52 Intellectual property rights 57 39 30
Subfactors 2015 2016 2017 2018 201943 44 45 38 33
54 51 46 52 58
51 48 49 51 49
Adaptive attitudes Rank Rank Rank
u E-Participation 12 50 37 Internet retailing 42 19 58 Tablet possession 48 57 58 Smartphone possession 28 60 36 Attitudes toward globalization 47 59
Talent
Robots in Education and R&D
Training & education Scientific concentration
TECHNOLOGY
Scientific concentration
Capital Technological framework
FUTURE READINESS
IT integration
Business agility IT integration
FACTORS BREAKDOWN - STRENGTHS AND WEAKNESSES
BRAZIL
Technological framework
Opportunities and threats E-GovernmentWorld robots distribution Public-private partnerships
Total expenditure on R&D (%)Total public expenditure on education Total R&D personnel per capita
Training & education
Adaptive attitudes
Business agility
Venture capital Internet bandwidth speedInvestment in Telecommunications High-tech exports (%)
Regulatory framework
Capital
IT & media stock market capitalization Communications technologyFunding for technological development Mobile Broadband subscribersBanking and financial services Wireless broadbandCountry credit rating Internet users
Higher education achievement Female researchersPupil-teacher ratio (tertiary education) R&D productivity by publicationGraduates in Sciences Scientific and technical employmentWomen with degrees High-tech patent grants
Employee training
KNOWLEDGE
Agility of companies Cyber securityUse of big data and analytics Sofware piracyKnowledge transfer

IMD WORLD DIGITAL COMPETIT IVENESS RANKING 201954
Alpha AlphaLabelBeta BetaLabel Gamma GammaLabel1 2 2 2 2 2 24 4 4 2 2
6.5 4 4 2 28.5 4 4 2 2
10.5 4 4 2 2
2015 2016 2017 2018 2019
54 47 45 43 45
45 38 41 41 46
42 38 42 42 42
59 58 57 55 48
COMPETITIVENESS & DIGITAL RANKINGS
PEER GROUPS RANKINGS
EUROPE - MIDDLE EAST - AFRICA (40 countries) POPULATIONS < 20 MILLION (34 countries)
Knowledge
Technology
Future readiness
OVERALL
DIGITAL TRENDS - OVERALL
BULGARIA
OVERALL PERFORMANCE (63 countries)
OVERALL & FACTORS - 5 years
5447 45 43 45
55 50 49 48 48
2015 2016 2017 2018 2019
Digital
Competitiveness
37 33 32 30 31
2015 2016 2017 2018 2019
32 30 28 26 27
2015 2016 2017 2018 2019
46 50 46 37
42 46 42 4445
48 43 56 47
Knowledge Talent Training & education Scientific concentration
Technology Regulatory framework Capital Technological framework
Future readiness Adaptive attitudes Business agility IT integrationThe direction of the triangle indicates the performance change from the last year: improved or stabledeclined
Overall Factors Sub-Factors
N.B. This graph provides only a comparison of the country’s performance in the two rankings.
55

55IMD WORLD DIGITAL COMPETIT IVENESS RANKING 2019
u Overall top strengths
w Overall top weaknesses
Subfactors 2015 2016 2017 2018 201954 52 51 53 50
47 40 39 42 46
32 31 30 33 37
Talent Rank Rank Rank
Educational assessment PISA - Math 43 w 55 46w International experience 55 47 29 Foreign highly-skilled personnel 50 42 u 8 Management of cities 39 u 16 52 Digital/Technological skills 32 47 39 Net flow of international students 52 u 25 u 15 49
Subfactors 2015 2016 2017 2018 201951 48 50 52 46
43 36 46 50 42
35 34 34 36 44
Regulatory framework Rank Rank Rank
Starting a business 44 36 37 Enforcing contracts 32 43 42 Immigration laws 44 41 24 Development and application of technology52 45 44 Scientific research legislation 50 32 45 Intellectual property rights 49 u 24 47
Subfactors 2015 2016 2017 2018 201959 58 47 48 43
60 60 61 59 56
52 53 55 54 47
Adaptive attitudes Rank Rank Rank
E-Participation 33 w 55 39 Internet retailing 50 45 44 Tablet possession 45 w 56 46 Smartphone possession 38 38 50 Attitudes toward globalization 55 w 55
Talent
Robots in Education and R&D
Training & education Scientific concentration
TECHNOLOGY
Scientific concentration
Capital Technological framework
FUTURE READINESS
IT integration
Business agility IT integration
FACTORS BREAKDOWN - STRENGTHS AND WEAKNESSES
BULGARIA
Technological framework
Opportunities and threats E-GovernmentWorld robots distribution Public-private partnerships
Total expenditure on R&D (%)Total public expenditure on education Total R&D personnel per capita
Training & education
Adaptive attitudes
Business agility
Venture capital Internet bandwidth speedInvestment in Telecommunications High-tech exports (%)
Regulatory framework
Capital
IT & media stock market capitalization Communications technologyFunding for technological development Mobile Broadband subscribersBanking and financial services Wireless broadbandCountry credit rating Internet users
Higher education achievement Female researchersPupil-teacher ratio (tertiary education) R&D productivity by publicationGraduates in Sciences Scientific and technical employmentWomen with degrees High-tech patent grants
Employee training
KNOWLEDGE
Agility of companies Cyber securityUse of big data and analytics Sofware piracyKnowledge transfer

IMD WORLD DIGITAL COMPETIT IVENESS RANKING 201956
Alpha AlphaLabelBeta BetaLabel Gamma GammaLabel1 2 2 2 2 2 24 4 4 2 2
6.5 4 4 2 28.5 4 4 2 2
10.5 4 4 2 2
2015 2016 2017 2018 2019
4 5 9 8 11
3 7 3 3 5
17 14 13 12 13
2 3 8 9 18
COMPETITIVENESS & DIGITAL RANKINGS
PEER GROUPS RANKINGS
THE AMERICAS (9 countries) POPULATIONS > 20 MILLION (29 countries)
Knowledge
Technology
Future readiness
OVERALL
DIGITAL TRENDS - OVERALL
CANADA
OVERALL PERFORMANCE (63 countries)
OVERALL & FACTORS - 5 years
4 5
9 8
11
5
1012 10
13
2015 2016 2017 2018 2019
Digital
Competitiveness
2 2 2 2 2
2015 2016 2017 2018 2019
2 2 2 23
2015 2016 2017 2018 2019
5 13 7 2
13 17 10 2711
18 17 16 13
Knowledge Talent Training & education Scientific concentration
Technology Regulatory framework Capital Technological framework
Future readiness Adaptive attitudes Business agility IT integrationThe direction of the triangle indicates the performance change from the last year: improved or stabledeclined
Overall Factors Sub-Factors
N.B. This graph provides only a comparison of the country’s performance in the two rankings.

57IMD WORLD DIGITAL COMPETIT IVENESS RANKING 2019
u Overall top strengths
w Overall top weaknesses
Subfactors 2015 2016 2017 2018 20198 10 9 7 13
12 13 10 4 7
4 4 4 4 2
Talent Rank Rank Rank
Educational assessment PISA - Math 9 22 23w International experience 40 w 35 20 Foreign highly-skilled personnel 13 u 5 - Management of cities 22 6 13 Digital/Technological skills 19 w 39 u 5 Net flow of international students 11 u 2 11 9
Subfactors 2015 2016 2017 2018 201912 17 21 11 17
8 5 1 5 10
26 24 27 24 27
Regulatory framework Rank Rank Rank
u Starting a business 2 19 35w Enforcing contracts 48 16 38 Immigration laws 11 15 w 54 Development and application of technology12 u 1 17 Scientific research legislation 17 14 12 Intellectual property rights 18 13 27
Subfactors 2015 2016 2017 2018 201916 16 13 15 17
1 1 5 4 16
3 7 15 12 13
Adaptive attitudes Rank Rank Rank
E-Participation 26 23 23 Internet retailing 12 14 8 Tablet possession 22 21 18 Smartphone possession 32 13 13 Attitudes toward globalization 12 11
Talent
Robots in Education and R&D
Training & education Scientific concentration
TECHNOLOGY
Scientific concentration
Capital Technological framework
FUTURE READINESS
IT integration
Business agility IT integration
FACTORS BREAKDOWN - STRENGTHS AND WEAKNESSES
CANADA
Technological framework
Opportunities and threats E-GovernmentWorld robots distribution Public-private partnerships
Total expenditure on R&D (%)Total public expenditure on education Total R&D personnel per capita
Training & education
Adaptive attitudes
Business agility
Venture capital Internet bandwidth speedInvestment in Telecommunications High-tech exports (%)
Regulatory framework
Capital
IT & media stock market capitalization Communications technologyFunding for technological development Mobile Broadband subscribersBanking and financial services Wireless broadbandCountry credit rating Internet users
Higher education achievement Female researchersPupil-teacher ratio (tertiary education) R&D productivity by publicationGraduates in Sciences Scientific and technical employmentWomen with degrees High-tech patent grants
Employee training
KNOWLEDGE
Agility of companies Cyber securityUse of big data and analytics Sofware piracyKnowledge transfer

IMD WORLD DIGITAL COMPETIT IVENESS RANKING 201958
Alpha AlphaLabelBeta BetaLabel Gamma GammaLabel1 2 2 2 2 2 24 4 4 2 2
6.5 4 4 2 28.5 4 4 2 2
10.5 4 4 2 2
2015 2016 2017 2018 2019
37 37 40 37 42
53 51 52 47 50
31 34 34 35 41
32 32 33 31 37
COMPETITIVENESS & DIGITAL RANKINGS
PEER GROUPS RANKINGS
THE AMERICAS (9 countries) POPULATIONS < 20 MILLION (34 countries)
Knowledge
Technology
Future readiness
OVERALL
DIGITAL TRENDS - OVERALL
CHILE
OVERALL PERFORMANCE (63 countries)
OVERALL & FACTORS - 5 years
37 37
40
37
42
35 3635
35
42
2015 2016 2017 2018 2019
Digital
Competitiveness
3 3 3 3 3
2015 2016 2017 2018 2019
24 2425
2425
2015 2016 2017 2018 2019
50 36 55 57
41 36 44 4242
37 27 50 39
Knowledge Talent Training & education Scientific concentration
Technology Regulatory framework Capital Technological framework
Future readiness Adaptive attitudes Business agility IT integrationThe direction of the triangle indicates the performance change from the last year: improved or stabledeclined
Overall Factors Sub-Factors
N.B. This graph provides only a comparison of the country’s performance in the two rankings.
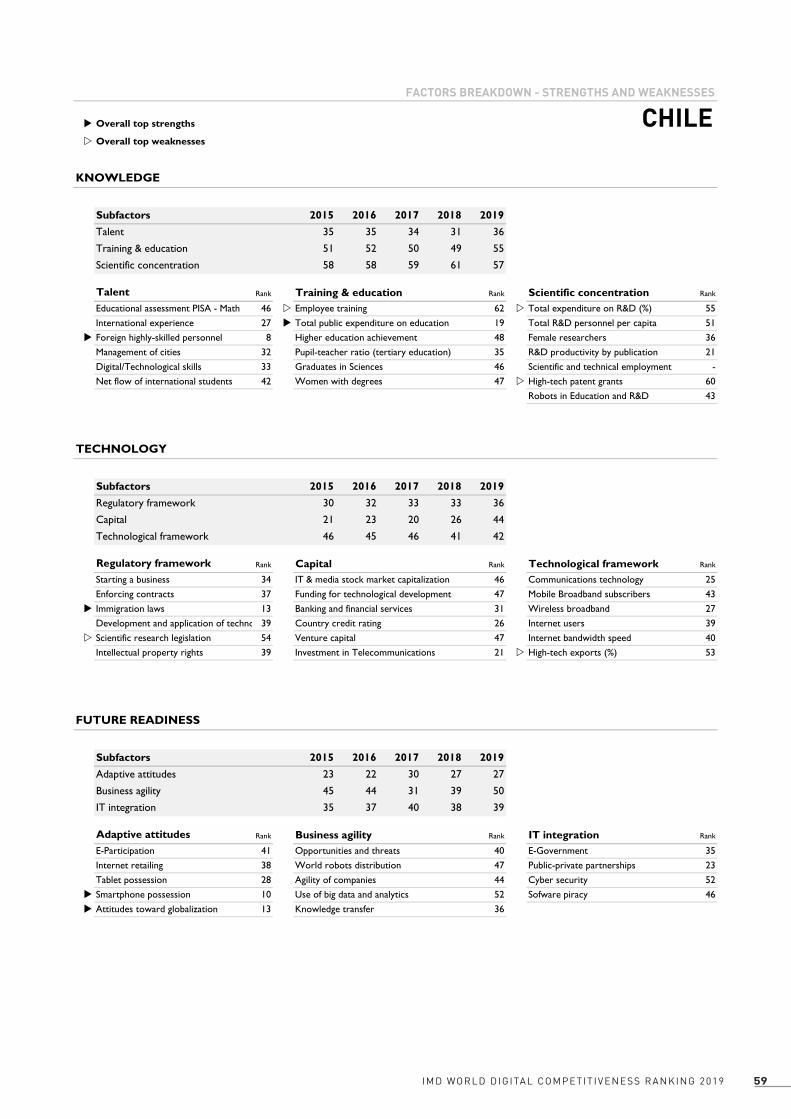
59IMD WORLD DIGITAL COMPETIT IVENESS RANKING 2019
u Overall top strengths
w Overall top weaknesses
Subfactors 2015 2016 2017 2018 201935 35 34 31 36
51 52 50 49 55
58 58 59 61 57
Talent Rank Rank Rank
Educational assessment PISA - Math 46 w 62 w 55 International experience 27 u 19 51u Foreign highly-skilled personnel 8 48 36 Management of cities 32 35 21 Digital/Technological skills 33 46 - Net flow of international students 42 47 w 60 43
Subfactors 2015 2016 2017 2018 201930 32 33 33 36
21 23 20 26 44
46 45 46 41 42
Regulatory framework Rank Rank Rank
Starting a business 34 46 25 Enforcing contracts 37 47 43u Immigration laws 13 31 27 Development and application of technology39 26 39w Scientific research legislation 54 47 40 Intellectual property rights 39 21 w 53
Subfactors 2015 2016 2017 2018 201923 22 30 27 27
45 44 31 39 50
35 37 40 38 39
Adaptive attitudes Rank Rank Rank
E-Participation 41 40 35 Internet retailing 38 47 23 Tablet possession 28 44 52u Smartphone possession 10 52 46u Attitudes toward globalization 13 36
Talent
Robots in Education and R&D
Training & education Scientific concentration
TECHNOLOGY
Scientific concentration
Capital Technological framework
FUTURE READINESS
IT integration
Business agility IT integration
FACTORS BREAKDOWN - STRENGTHS AND WEAKNESSES
CHILE
Technological framework
Opportunities and threats E-GovernmentWorld robots distribution Public-private partnerships
Total expenditure on R&D (%)Total public expenditure on education Total R&D personnel per capita
Training & education
Adaptive attitudes
Business agility
Venture capital Internet bandwidth speedInvestment in Telecommunications High-tech exports (%)
Regulatory framework
Capital
IT & media stock market capitalization Communications technologyFunding for technological development Mobile Broadband subscribersBanking and financial services Wireless broadbandCountry credit rating Internet users
Higher education achievement Female researchersPupil-teacher ratio (tertiary education) R&D productivity by publicationGraduates in Sciences Scientific and technical employmentWomen with degrees High-tech patent grants
Employee training
KNOWLEDGE
Agility of companies Cyber securityUse of big data and analytics Sofware piracyKnowledge transfer
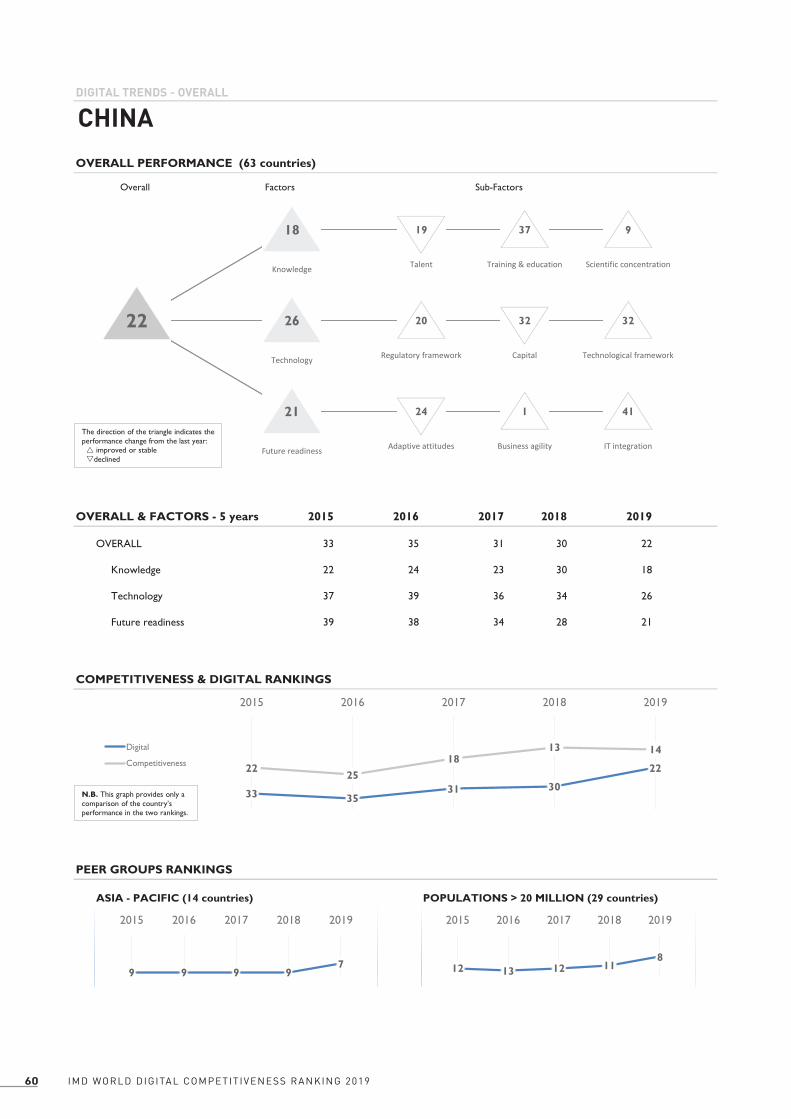
IMD WORLD DIGITAL COMPETIT IVENESS RANKING 201960
Alpha AlphaLabelBeta BetaLabel Gamma GammaLabel1 2 2 2 2 2 24 4 4 2 2
6.5 4 4 2 28.5 4 4 2 2
10.5 4 4 2 2
2015 2016 2017 2018 2019
33 35 31 30 22
22 24 23 30 18
37 39 36 34 26
39 38 34 28 21
COMPETITIVENESS & DIGITAL RANKINGS
PEER GROUPS RANKINGS
ASIA - PACIFIC (14 countries) POPULATIONS > 20 MILLION (29 countries)
Knowledge
Technology
Future readiness
DIGITAL TRENDS - OVERALL
CHINA
OVERALL PERFORMANCE (63 countries)
OVERALL & FACTORS - 5 years
OVERALL
33 3531 30
222225
1813 14
2015 2016 2017 2018 2019
Digital
Competitiveness
9 9 9 97
2015 2016 2017 2018 2019
12 13 12 118
2015 2016 2017 2018 2019
18 19 37 9
26 20 32 3222
21 24 1 41
Knowledge Talent Training & education Scientific concentration
Technology Regulatory framework Capital Technological framework
Future readiness Adaptive attitudes Business agility IT integrationThe direction of the triangle indicates the performance change from the last year: improved or stabledeclined
Overall Factors Sub-Factors
N.B. This graph provides only a comparison of the country’s performance in the two rankings.

61IMD WORLD DIGITAL COMPETIT IVENESS RANKING 2019
u Overall top strengths
w Overall top weaknesses
Subfactors 2015 2016 2017 2018 201918 21 23 18 19
55 54 53 46 37
3 3 3 21 9
Talent Rank Rank Rank
u Educational assessment PISA - Math 5 13 14 International experience 45 46 35 Foreign highly-skilled personnel 27 25 - Management of cities 13 40 u 1 Digital/Technological skills 15 - w 49 Net flow of international students 47 - 14 u 1
Subfactors 2015 2016 2017 2018 201934 38 32 26 20
27 27 22 30 32
45 46 47 40 32
Regulatory framework Rank Rank Rank
Starting a business 16 33 15u Enforcing contracts 6 24 35 Immigration laws 36 42 30 Development and application of technology24 27 w 56 Scientific research legislation 19 38 25w Intellectual property rights 48 17 6
Subfactors 2015 2016 2017 2018 201938 36 32 23 24
34 32 24 19 1
49 50 44 41 41
Adaptive attitudes Rank Rank Rank
E-Participation 28 19 w 50 Internet retailing 21 u 1 15 Tablet possession 31 25 16 Smartphone possession 16 12 w 56 Attitudes toward globalization 10 31
Talent
Robots in Education and R&D
Training & education Scientific concentration
TECHNOLOGY
Scientific concentration
Capital Technological framework
FUTURE READINESS
IT integration
Business agility IT integration
FACTORS BREAKDOWN - STRENGTHS AND WEAKNESSES
CHINA
Technological framework
Opportunities and threats E-GovernmentWorld robots distribution Public-private partnerships
Total expenditure on R&D (%)Total public expenditure on education Total R&D personnel per capita
Training & education
Adaptive attitudes
Business agility
Venture capital Internet bandwidth speedInvestment in Telecommunications High-tech exports (%)
Regulatory framework
Capital
IT & media stock market capitalization Communications technologyFunding for technological development Mobile Broadband subscribersBanking and financial services Wireless broadbandCountry credit rating Internet users
Higher education achievement Female researchersPupil-teacher ratio (tertiary education) R&D productivity by publicationGraduates in Sciences Scientific and technical employmentWomen with degrees High-tech patent grants
Employee training
KNOWLEDGE
Agility of companies Cyber securityUse of big data and analytics Sofware piracyKnowledge transfer

IMD WORLD DIGITAL COMPETIT IVENESS RANKING 201962
Alpha AlphaLabelBeta BetaLabel Gamma GammaLabel1 2 2 2 2 2 24 4 4 2 2
6.5 4 4 2 28.5 4 4 2 2
10.5 4 4 2 2
2015 2016 2017 2018 2019
53 56 58 59 58
52 56 57 57 57
56 59 60 60 60
43 44 53 56 55
COMPETITIVENESS & DIGITAL RANKINGS
PEER GROUPS RANKINGS
THE AMERICAS (9 countries) POPULATIONS > 20 MILLION (29 countries)
Knowledge
Technology
DIGITAL TRENDS - OVERALL
COLOMBIA
OVERALL PERFORMANCE (63 countries)
OVERALL & FACTORS - 5 years
Future readiness
OVERALL
53
5658 59 58
5151
5458
52
2015 2016 2017 2018 2019
Digital
Competitiveness
57 7 7 6
2015 2016 2017 2018 2019
2224 25 26 25
2015 2016 2017 2018 2019
57 56 49 58
60 61 55 5258
55 56 55 45
Knowledge Talent Training & education Scientific concentration
Technology Regulatory framework Capital Technological framework
Future readiness Adaptive attitudes Business agility IT integrationThe direction of the triangle indicates the performance change from the last year: improved or stabledeclined
Overall Factors Sub-Factors
N.B. This graph provides only a comparison of the country’s performance in the two rankings.

63IMD WORLD DIGITAL COMPETIT IVENESS RANKING 2019
u Overall top strengths
w Overall top weaknesses
Subfactors 2015 2016 2017 2018 201953 55 58 57 56
42 46 45 45 49
50 57 58 57 58
Talent Rank Rank Rank
Educational assessment PISA - Math 52 41 57 International experience 41 40 52 Foreign highly-skilled personnel 34 49 25 Management of cities 50 36 u 19 Digital/Technological skills 47 31 53 Net flow of international students 48 44 w 58 49
Subfactors 2015 2016 2017 2018 201956 57 58 62 61
53 53 55 57 55
52 55 55 55 52
Regulatory framework Rank Rank Rank
Starting a business 45 49 53w Enforcing contracts 63 49 u 8 Immigration laws 43 48 w 62 Development and application of technology43 44 51 Scientific research legislation 53 49 w 60 Intellectual property rights 51 u 8 41
Subfactors 2015 2016 2017 2018 201940 42 53 57 56
47 47 54 54 55
43 44 45 48 45
Adaptive attitudes Rank Rank Rank
u E-Participation 23 57 48 Internet retailing 46 50 u 31 Tablet possession 53 48 54w Smartphone possession 60 49 40 Attitudes toward globalization 34 40
Talent
Robots in Education and R&D
Training & education Scientific concentration
TECHNOLOGY
Scientific concentration
Capital Technological framework
FUTURE READINESS
IT integration
Business agility IT integration
FACTORS BREAKDOWN - STRENGTHS AND WEAKNESSES
COLOMBIA
Technological framework
Opportunities and threats E-GovernmentWorld robots distribution Public-private partnerships
Total expenditure on R&D (%)Total public expenditure on education Total R&D personnel per capita
Training & education
Adaptive attitudes
Business agility
Venture capital Internet bandwidth speedInvestment in Telecommunications High-tech exports (%)
Regulatory framework
Capital
IT & media stock market capitalization Communications technologyFunding for technological development Mobile Broadband subscribersBanking and financial services Wireless broadbandCountry credit rating Internet users
Higher education achievement Female researchersPupil-teacher ratio (tertiary education) R&D productivity by publicationGraduates in Sciences Scientific and technical employmentWomen with degrees High-tech patent grants
Employee training
KNOWLEDGE
Agility of companies Cyber securityUse of big data and analytics Sofware piracyKnowledge transfer

IMD WORLD DIGITAL COMPETIT IVENESS RANKING 201964
Alpha AlphaLabelBeta BetaLabel Gamma GammaLabel1 2 2 2 2 2 24 4 4 2 2
6.5 4 4 2 28.5 4 4 2 2
10.5 4 4 2 2
2015 2016 2017 2018 2019
46 44 48 44 51
46 45 50 43 42
41 43 47 49 50
52 50 56 54 60
OVERALL
Future readiness
COMPETITIVENESS & DIGITAL RANKINGS
PEER GROUPS RANKINGS
EUROPE - MIDDLE EAST - AFRICA (40 countries) POPULATIONS < 20 MILLION (34 countries)
Knowledge
Technology
DIGITAL TRENDS - OVERALL
CROATIA
OVERALL PERFORMANCE (63 countries)
OVERALL & FACTORS - 5 years
46 44 48 4451
58 5859
6160
2015 2016 2017 2018 2019
Digital
Competitiveness
32 3134
3136
2015 2016 2017 2018 2019
29 28 2927
31
2015 2016 2017 2018 2019
42 58 31 33
50 59 50 4151
60 51 62 57
Knowledge Talent Training & education Scientific concentration
Technology Regulatory framework Capital Technological framework
Future readiness Adaptive attitudes Business agility IT integrationThe direction of the triangle indicates the performance change from the last year: improved or stabledeclined
Overall Factors Sub-Factors
N.B. This graph provides only a comparison of the country’s performance in the two rankings.

65IMD WORLD DIGITAL COMPETIT IVENESS RANKING 2019
u Overall top strengths
w Overall top weaknesses
Subfactors 2015 2016 2017 2018 201957 56 59 59 58
39 37 41 36 31
35 36 35 32 33
Talent Rank Rank Rank
Educational assessment PISA - Math 38 w 63 42w International experience 62 29 38w Foreign highly-skilled personnel 62 43 u 11 Management of cities 58 u 8 48 Digital/Technological skills 57 23 27 Net flow of international students 55 u 5 u 9 40
Subfactors 2015 2016 2017 2018 201947 47 52 55 59
42 48 52 52 50
39 40 40 43 41
Regulatory framework Rank Rank Rank
Starting a business 53 - 49 Enforcing contracts 23 57 25w Immigration laws 63 55 44w Development and application of technology62 54 37 Scientific research legislation 59 57 44 Intellectual property rights 60 u 4 46
Subfactors 2015 2016 2017 2018 201954 54 43 37 51
50 45 62 63 62
44 46 46 49 57
Adaptive attitudes Rank Rank Rank
E-Participation 46 62 46 Internet retailing 44 48 61 Tablet possession 35 62 56 Smartphone possession 35 61 43 Attitudes toward globalization 62 61
Scientific concentration
Training & education Scientific concentration
Talent
Robots in Education and R&D
FUTURE READINESS
IT integration
Business agility IT integration
FACTORS BREAKDOWN - STRENGTHS AND WEAKNESSES
CROATIA
TECHNOLOGY
Technological framework
Capital Technological framework
Opportunities and threats E-GovernmentWorld robots distribution Public-private partnerships
Total expenditure on R&D (%)Total public expenditure on education Total R&D personnel per capita
Training & education
Adaptive attitudes
Business agility
Venture capital Internet bandwidth speedInvestment in Telecommunications High-tech exports (%)
Regulatory framework
Capital
IT & media stock market capitalization Communications technologyFunding for technological development Mobile Broadband subscribersBanking and financial services Wireless broadbandCountry credit rating Internet users
Higher education achievement Female researchersPupil-teacher ratio (tertiary education) R&D productivity by publicationGraduates in Sciences Scientific and technical employmentWomen with degrees High-tech patent grants
Employee training
KNOWLEDGE
Agility of companies Cyber securityUse of big data and analytics Sofware piracyKnowledge transfer

IMD WORLD DIGITAL COMPETIT IVENESS RANKING 201966
Alpha AlphaLabelBeta BetaLabel Gamma GammaLabel1 2 2 2 2 2 24 4 4 2 2
6.5 4 4 2 28.5 4 4 2 2
10.5 4 4 2 2
2015 2016 2017 2018 2019
53 54 54
46 55 55
54 56 59
54 44 40
COMPETITIVENESS & DIGITAL RANKINGS
PEER GROUPS RANKINGS
EUROPE - MIDDLE EAST - AFRICA (40 countries) POPULATIONS < 20 MILLION (34 countries)
Knowledge
Technology
DIGITAL TRENDS - OVERALL
CYPRUS
OVERALL PERFORMANCE (63 countries)
OVERALL & FACTORS - 5 years
Future readiness
OVERALL
53 54 54
37 41 41
2015 2016 2017 2018 2019
Digital
Competitiveness
37
39 39
2015 2016 2017 2018 2019
31
33 33
2015 2016 2017 2018 2019
55 62 33 53
59 56 60 4854
40 34 57 38
Knowledge Talent Training & education Scientific concentration
Technology Regulatory framework Capital Technological framework
Future readiness Adaptive attitudes Business agility IT integrationThe direction of the triangle indicates the performance change from the last year: improved or stabledeclined
Overall Factors Sub-Factors
N.B. This graph provides only a comparison of the country’s performance in the two rankings.

67IMD WORLD DIGITAL COMPETIT IVENESS RANKING 2019
u Overall top strengths
w Overall top weaknesses
Subfactors 2015 2016 2017 2018 201956 62 62
22 29 33
51 52 53
Talent Rank Rank Rank
Educational assessment PISA - Math 44 57 52 International experience 47 u 13 46 Foreign highly-skilled personnel 42 u 10 26 Management of cities 46 22 58 Digital/Technological skills 43 w 59 u 10w Net flow of international students 61 u 18 43 -
Subfactors 2015 2016 2017 2018 201945 51 56
54 60 60
54 49 48
Regulatory framework Rank Rank Rank
Starting a business 28 38 41 Enforcing contracts 58 54 w 61 Immigration laws 55 53 49 Development and application of technology53 54 42 Scientific research legislation 44 w 59 54 Intellectual property rights 44 55 u 18
Subfactors 2015 2016 2017 2018 201956 45 34
51 45 57
47 46 38
Adaptive attitudes Rank Rank Rank
E-Participation 41 47 31 Internet retailing - - 56 Tablet possession 29 52 55 Smartphone possession - w 62 34 Attitudes toward globalization 54 52
Talent
Robots in Education and R&D
Training & education Scientific concentration
TECHNOLOGY
Scientific concentration
Capital Technological framework
FUTURE READINESS
IT integration
Business agility IT integration
FACTORS BREAKDOWN - STRENGTHS AND WEAKNESSES
CYPRUS
Technological framework
Opportunities and threats E-GovernmentWorld robots distribution Public-private partnerships
Total expenditure on R&D (%)Total public expenditure on education Total R&D personnel per capita
Training & education
Adaptive attitudes
Business agility
Venture capital Internet bandwidth speedInvestment in Telecommunications High-tech exports (%)
Regulatory framework
Capital
IT & media stock market capitalization Communications technologyFunding for technological development Mobile Broadband subscribersBanking and financial services Wireless broadbandCountry credit rating Internet users
Higher education achievement Female researchersPupil-teacher ratio (tertiary education) R&D productivity by publicationGraduates in Sciences Scientific and technical employmentWomen with degrees High-tech patent grants
Employee training
KNOWLEDGE
Agility of companies Cyber securityUse of big data and analytics Sofware piracyKnowledge transfer

IMD WORLD DIGITAL COMPETIT IVENESS RANKING 201968
Alpha AlphaLabelBeta BetaLabel Gamma GammaLabel1 2 2 2 2 2 24 4 4 2 2
6.5 4 4 2 28.5 4 4 2 2
10.5 4 4 2 2
2015 2016 2017 2018 2019
31 32 32 33 37
36 34 36 38 37
26 26 26 31 34
33 34 37 34 39
COMPETITIVENESS & DIGITAL RANKINGS
PEER GROUPS RANKINGS
EUROPE - MIDDLE EAST - AFRICA (40 countries) POPULATIONS < 20 MILLION (34 countries)
Knowledge
Technology
DIGITAL TRENDS - OVERALL
CZECH REPUBLIC
OVERALL PERFORMANCE (63 countries)
OVERALL & FACTORS - 5 years
Future readiness
OVERALL
31 32 32 3337
29 27 28 2933
2015 2016 2017 2018 2019
Digital
Competitiveness
21 22 21 22 26
2015 2016 2017 2018 2019
20 21 20 2124
2015 2016 2017 2018 2019
37 35 44 30
34 43 28 2837
39 46 37 35
Knowledge Talent Training & education Scientific concentration
Technology Regulatory framework Capital Technological framework
Future readiness Adaptive attitudes Business agility IT integrationThe direction of the triangle indicates the performance change from the last year: improved or stabledeclined
Overall Factors Sub-Factors
N.B. This graph provides only a comparison of the country’s performance in the two rankings.

69IMD WORLD DIGITAL COMPETIT IVENESS RANKING 2019
u Overall top strengths
w Overall top weaknesses
Subfactors 2015 2016 2017 2018 201920 22 26 29 35
50 50 49 55 44
36 33 34 36 30
Talent Rank Rank Rank
Educational assessment PISA - Math 26 40 21w International experience 51 31 u 17 Foreign highly-skilled personnel 43 40 47 Management of cities 38 45 32 Digital/Technological skills 39 20 24u Net flow of international students 14 42 32 23
Subfactors 2015 2016 2017 2018 201935 39 43 44 43
20 17 15 19 28
24 15 15 18 28
Regulatory framework Rank Rank Rank
w Starting a business 49 u 14 48w Enforcing contracts 49 41 u 17 Immigration laws 33 39 32 Development and application of technology44 21 28 Scientific research legislation 38 31 28 Intellectual property rights 25 25 29
Subfactors 2015 2016 2017 2018 201946 48 42 34 46
30 29 33 25 37
31 36 33 34 35
Adaptive attitudes Rank Rank Rank
w E-Participation 58 41 45 Internet retailing 19 u 16 49 Tablet possession 47 35 28 Smartphone possession 29 36 20 Attitudes toward globalization 41 w 51
Talent
Robots in Education and R&D
Training & education Scientific concentration
TECHNOLOGY
Scientific concentration
Capital Technological framework
FUTURE READINESS
IT integration
Business agility IT integration
FACTORS BREAKDOWN - STRENGTHS AND WEAKNESSES
CZECH REPUBLIC
Technological framework
Opportunities and threats E-GovernmentWorld robots distribution Public-private partnerships
Total expenditure on R&D (%)Total public expenditure on education Total R&D personnel per capita
Training & education
Adaptive attitudes
Business agility
Venture capital Internet bandwidth speedInvestment in Telecommunications High-tech exports (%)
Regulatory framework
Capital
IT & media stock market capitalization Communications technologyFunding for technological development Mobile Broadband subscribersBanking and financial services Wireless broadbandCountry credit rating Internet users
Higher education achievement Female researchersPupil-teacher ratio (tertiary education) R&D productivity by publicationGraduates in Sciences Scientific and technical employmentWomen with degrees High-tech patent grants
Employee training
KNOWLEDGE
Agility of companies Cyber securityUse of big data and analytics Sofware piracyKnowledge transfer

IMD WORLD DIGITAL COMPETIT IVENESS RANKING 201970
Alpha AlphaLabelBeta BetaLabel Gamma GammaLabel1 2 2 2 2 2 24 4 4 2 2
6.5 4 4 2 28.5 4 4 2 2
10.5 4 4 2 2
2015 2016 2017 2018 2019
8 8 5 4 4
9 8 8 8 6
13 12 10 10 11
6 6 1 1 2
OVERALL
COMPETITIVENESS & DIGITAL RANKINGS
PEER GROUPS RANKINGS
EUROPE - MIDDLE EAST - AFRICA (40 countries) POPULATIONS < 20 MILLION (34 countries)
Knowledge
Technology
DIGITAL TRENDS - OVERALL
DENMARK
OVERALL PERFORMANCE (63 countries)
OVERALL & FACTORS - 5 years
Future readiness
8 8
54 4
8
67
6
8
2015 2016 2017 2018 2019
Digital
Competitiveness
5 53
2 2
2015 2016 2017 2018 2019
6 64 3 3
2015 2016 2017 2018 2019
6 6 6 17
11 10 27 84
2 1 10 1
Knowledge Talent Training & education Scientific concentration
Technology Regulatory framework Capital Technological framework
Future readiness Adaptive attitudes Business agility IT integrationThe direction of the triangle indicates the performance change from the last year: improved or stabledeclined
Overall Factors Sub-Factors
N.B. This graph provides only a comparison of the country’s performance in the two rankings.

71IMD WORLD DIGITAL COMPETIT IVENESS RANKING 2019
u Overall top strengths
w Overall top weaknesses
Subfactors 2015 2016 2017 2018 201910 8 6 6 6
9 7 5 3 6
16 18 19 14 17
Talent Rank Rank Rank
Educational assessment PISA - Math 11 u 2 8 International experience 14 6 u 1 Foreign highly-skilled personnel 20 23 38 Management of cities 3 4 w 49 Digital/Technological skills 11 w 43 21 Net flow of international students 6 19 39 25
Subfactors 2015 2016 2017 2018 20199 9 8 8 10
23 26 25 22 27
8 8 5 5 8
Regulatory framework Rank Rank Rank
Starting a business 24 w 45 6 Enforcing contracts 13 9 13w Immigration laws 42 13 10 Development and application of technology6 u 1 8 Scientific research legislation 6 9 11 Intellectual property rights 4 w 43 33
Subfactors 2015 2016 2017 2018 20194 5 1 5 1
14 15 11 6 10
9 10 11 5 1
Adaptive attitudes Rank Rank Rank
u E-Participation 1 8 u 1 Internet retailing 4 30 6 Tablet possession 9 6 17 Smartphone possession 7 17 8 Attitudes toward globalization 9 8
Training & education Scientific concentration
Talent
Robots in Education and R&D
Scientific concentration
Capital Technological framework
FUTURE READINESS
IT integration
Business agility IT integration
FACTORS BREAKDOWN - STRENGTHS AND WEAKNESSES
DENMARK
TECHNOLOGY
Technological framework
Opportunities and threats E-GovernmentWorld robots distribution Public-private partnerships
Total expenditure on R&D (%)Total public expenditure on education Total R&D personnel per capita
Training & education
Adaptive attitudes
Business agility
Venture capital Internet bandwidth speedInvestment in Telecommunications High-tech exports (%)
Regulatory framework
Capital
IT & media stock market capitalization Communications technologyFunding for technological development Mobile Broadband subscribersBanking and financial services Wireless broadbandCountry credit rating Internet users
Higher education achievement Female researchersPupil-teacher ratio (tertiary education) R&D productivity by publicationGraduates in Sciences Scientific and technical employmentWomen with degrees High-tech patent grants
Employee training
KNOWLEDGE
Agility of companies Cyber securityUse of big data and analytics Sofware piracyKnowledge transfer

IMD WORLD DIGITAL COMPETIT IVENESS RANKING 201972
Alpha AlphaLabelBeta BetaLabel Gamma GammaLabel1 2 2 2 2 2 24 4 4 2 2
6.5 4 4 2 28.5 4 4 2 2
10.5 4 4 2 2
2015 2016 2017 2018 2019
27 27 26 25 29
30 30 28 29 30
19 17 19 20 22
26 26 26 26 30
OVERALL
Future readiness
COMPETITIVENESS & DIGITAL RANKINGS
PEER GROUPS RANKINGS
EUROPE - MIDDLE EAST - AFRICA (40 countries) POPULATIONS < 20 MILLION (34 countries)
Knowledge
Technology
DIGITAL TRENDS - OVERALL
ESTONIA
OVERALL PERFORMANCE (63 countries)
OVERALL & FACTORS - 5 years
27 27 26 2529
31 31 30 3135
2015 2016 2017 2018 2019
Digital
Competitiveness
17 17 1716
18
2015 2016 2017 2018 2019
17 17 17 17 17
2015 2016 2017 2018 2019
30 37 10 46
22 31 24 1629
30 26 43 26
Knowledge Talent Training & education Scientific concentration
Technology Regulatory framework Capital Technological framework
Future readiness Adaptive attitudes Business agility IT integrationThe direction of the triangle indicates the performance change from the last year: improved or stabledeclined
Overall Factors Sub-Factors
N.B. This graph provides only a comparison of the country’s performance in the two rankings.

73IMD WORLD DIGITAL COMPETIT IVENESS RANKING 2019
u Overall top strengths
w Overall top weaknesses
Subfactors 2015 2016 2017 2018 201951 46 40 34 37
1 3 2 17 10
38 38 38 39 46
Talent Rank Rank Rank
u Educational assessment PISA - Math 8 11 28 International experience 46 u 11 27 Foreign highly-skilled personnel 37 30 17 Management of cities 43 30 w 60w Digital/Technological skills 50 16 29 Net flow of international students 46 12 20 w 52
Subfactors 2015 2016 2017 2018 201924 19 23 25 31
16 16 18 21 24
14 14 18 15 16
Regulatory framework Rank Rank Rank
u Starting a business 8 - 26 Enforcing contracts 12 37 41w Immigration laws 62 26 u 7 Development and application of technology32 22 11 Scientific research legislation 39 19 26 Intellectual property rights 36 26 16
Subfactors 2015 2016 2017 2018 201929 28 31 24 26
21 20 19 29 43
25 25 25 22 26
Adaptive attitudes Rank Rank Rank
E-Participation 26 34 16 Internet retailing 22 49 w 53u Tablet possession 7 26 14 Smartphone possession 34 43 30 Attitudes toward globalization 45 46
Scientific concentration
Training & education Scientific concentration
Talent
Robots in Education and R&D
FUTURE READINESS
IT integration
Business agility IT integration
FACTORS BREAKDOWN - STRENGTHS AND WEAKNESSES
ESTONIA
TECHNOLOGY
Technological framework
Capital Technological framework
Opportunities and threats E-GovernmentWorld robots distribution Public-private partnerships
Total expenditure on R&D (%)Total public expenditure on education Total R&D personnel per capita
Training & education
Adaptive attitudes
Business agility
Venture capital Internet bandwidth speedInvestment in Telecommunications High-tech exports (%)
Regulatory framework
Capital
IT & media stock market capitalization Communications technologyFunding for technological development Mobile Broadband subscribersBanking and financial services Wireless broadbandCountry credit rating Internet users
Higher education achievement Female researchersPupil-teacher ratio (tertiary education) R&D productivity by publicationGraduates in Sciences Scientific and technical employmentWomen with degrees High-tech patent grants
Employee training
KNOWLEDGE
Agility of companies Cyber securityUse of big data and analytics Sofware piracyKnowledge transfer

IMD WORLD DIGITAL COMPETIT IVENESS RANKING 201974
Alpha AlphaLabelBeta BetaLabel Gamma GammaLabel1 2 2 2 2 2 24 4 4 2 2
6.5 4 4 2 28.5 4 4 2 2
10.5 4 4 2 2
2015 2016 2017 2018 2019
3 6 4 7 7
7 9 9 9 9
7 7 4 4 8
4 5 4 8 7
OVERALL
Future readiness
COMPETITIVENESS & DIGITAL RANKINGS
PEER GROUPS RANKINGS
EUROPE - MIDDLE EAST - AFRICA (40 countries) POPULATIONS < 20 MILLION (34 countries)
Knowledge
Technology
DIGITAL TRENDS - OVERALL
FINLAND
OVERALL PERFORMANCE (63 countries)
OVERALL & FACTORS - 5 years
36
47 7
20 20
15 16 15
2015 2016 2017 2018 2019
Digital
Competitiveness
13
2
5 5
2015 2016 2017 2018 2019
24 3
6 6
2015 2016 2017 2018 2019
9 9 16 10
8 9 11 137
7 6 27 2
Knowledge Talent Training & education Scientific concentration
Technology Regulatory framework Capital Technological framework
Future readiness Adaptive attitudes Business agility IT integrationThe direction of the triangle indicates the performance change from the last year: improved or stabledeclined
Overall Factors Sub-Factors
N.B. This graph provides only a comparison of the country’s performance in the two rankings.
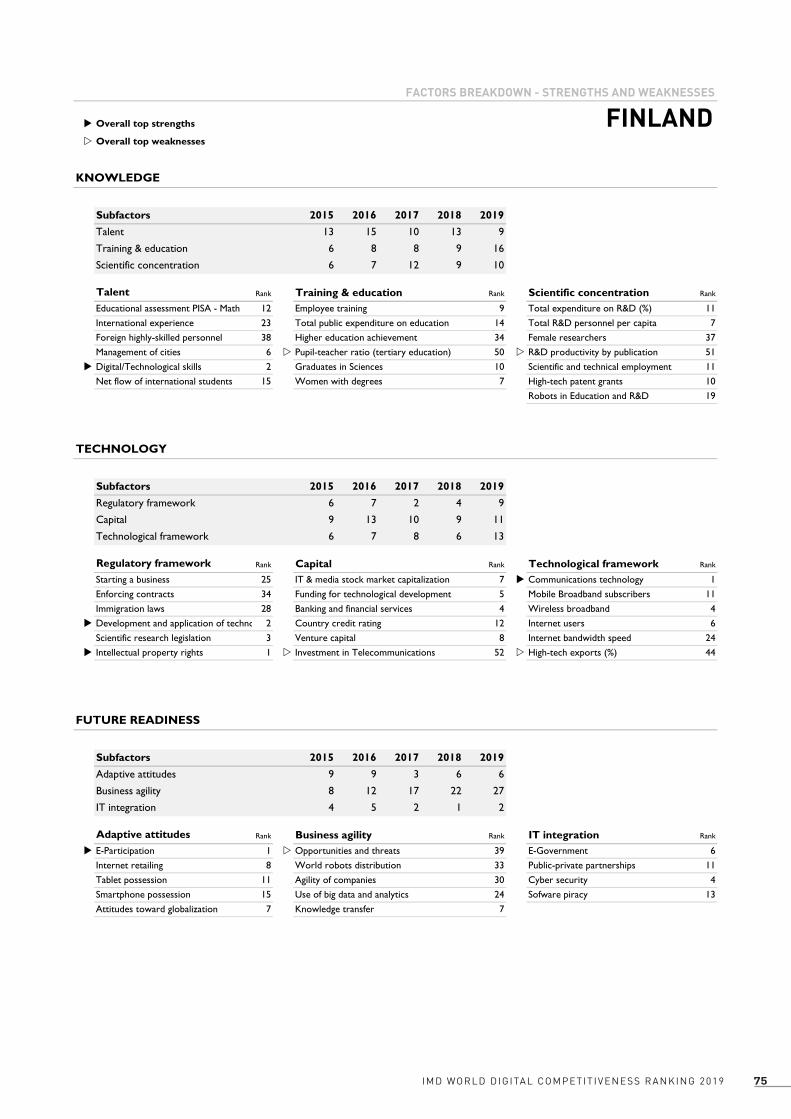
75IMD WORLD DIGITAL COMPETIT IVENESS RANKING 2019
u Overall top strengths
w Overall top weaknesses
Subfactors 2015 2016 2017 2018 201913 15 10 13 9
6 8 8 9 16
6 7 12 9 10
Talent Rank Rank Rank
Educational assessment PISA - Math 12 9 11 International experience 23 14 7 Foreign highly-skilled personnel 38 34 37 Management of cities 6 w 50 w 51u Digital/Technological skills 2 10 11 Net flow of international students 15 7 10 19
Subfactors 2015 2016 2017 2018 20196 7 2 4 9
9 13 10 9 11
6 7 8 6 13
Regulatory framework Rank Rank Rank
Starting a business 25 7 u 1 Enforcing contracts 34 5 11 Immigration laws 28 4 4u Development and application of technology2 12 6 Scientific research legislation 3 8 24u Intellectual property rights 1 w 52 w 44
Subfactors 2015 2016 2017 2018 20199 9 3 6 6
8 12 17 22 27
4 5 2 1 2
Adaptive attitudes Rank Rank Rank
u E-Participation 1 w 39 6 Internet retailing 8 33 11 Tablet possession 11 30 4 Smartphone possession 15 24 13 Attitudes toward globalization 7 7
Scientific concentration
Training & education Scientific concentration
Talent
Robots in Education and R&D
FUTURE READINESS
IT integration
Business agility IT integration
FACTORS BREAKDOWN - STRENGTHS AND WEAKNESSES
FINLAND
TECHNOLOGY
Technological framework
Capital Technological framework
Opportunities and threats E-GovernmentWorld robots distribution Public-private partnerships
Total expenditure on R&D (%)Total public expenditure on education Total R&D personnel per capita
Training & education
Adaptive attitudes
Business agility
Venture capital Internet bandwidth speedInvestment in Telecommunications High-tech exports (%)
Regulatory framework
Capital
IT & media stock market capitalization Communications technologyFunding for technological development Mobile Broadband subscribersBanking and financial services Wireless broadbandCountry credit rating Internet users
Higher education achievement Female researchersPupil-teacher ratio (tertiary education) R&D productivity by publicationGraduates in Sciences Scientific and technical employmentWomen with degrees High-tech patent grants
Employee training
KNOWLEDGE
Agility of companies Cyber securityUse of big data and analytics Sofware piracyKnowledge transfer

IMD WORLD DIGITAL COMPETIT IVENESS RANKING 201976
Alpha AlphaLabelBeta BetaLabel Gamma GammaLabel1 2 2 2 2 2 24 4 4 2 2
6.5 4 4 2 28.5 4 4 2 2
10.5 4 4 2 2
2015 2016 2017 2018 2019
20 22 25 26 24
20 21 19 20 20
23 23 22 19 16
21 20 28 27 29
OVERALL
Future readiness
COMPETITIVENESS & DIGITAL RANKINGS
PEER GROUPS RANKINGS
EUROPE - MIDDLE EAST - AFRICA (40 countries) POPULATIONS > 20 MILLION (29 countries)
Knowledge
Technology
DIGITAL TRENDS - OVERALL
FRANCE
OVERALL PERFORMANCE (63 countries)
OVERALL & FACTORS - 5 years
20 2225 26 24
32 32 3128
31
2015 2016 2017 2018 2019
Digital
Competitiveness
12 14 16 17 14
2015 2016 2017 2018 2019
8 8 9 9 10
2015 2016 2017 2018 2019
20 24 28 12
16 8 18 2224
29 36 39 19
Knowledge Talent Training & education Scientific concentration
Technology Regulatory framework Capital Technological framework
Future readiness Adaptive attitudes Business agility IT integrationThe direction of the triangle indicates the performance change from the last year: improved or stabledeclined
Overall Factors Sub-Factors
N.B. This graph provides only a comparison of the country’s performance in the two rankings.

77IMD WORLD DIGITAL COMPETIT IVENESS RANKING 2019
u Overall top strengths
w Overall top weaknesses
Subfactors 2015 2016 2017 2018 201924 24 24 21 24
37 34 35 33 28
8 9 10 17 12
Talent Rank Rank Rank
Educational assessment PISA - Math 24 35 13 International experience 48 17 18 Foreign highly-skilled personnel 30 27 46 Management of cities 9 44 14 Digital/Technological skills 29 21 16 Net flow of international students 16 31 19 u 5
Subfactors 2015 2016 2017 2018 201918 15 15 5 8
31 31 26 25 18
20 22 25 28 22
Regulatory framework Rank Rank Rank
Starting a business 17 25 13 Enforcing contracts 11 11 50 Immigration laws 12 40 35 Development and application of technology29 16 24 Scientific research legislation 11 18 16u Intellectual property rights 8 30 u 7
Subfactors 2015 2016 2017 2018 201925 23 26 32 36
18 21 44 36 39
19 19 20 19 19
Adaptive attitudes Rank Rank Rank
E-Participation 13 w 53 u 9 Internet retailing 14 u 8 19w Tablet possession 50 w 55 22 Smartphone possession 41 w 53 20w Attitudes toward globalization 63 26
Scientific concentration
Training & education Scientific concentration
Talent
Robots in Education and R&D
FUTURE READINESS
IT integration
Business agility IT integration
FACTORS BREAKDOWN - STRENGTHS AND WEAKNESSES
FRANCE
TECHNOLOGY
Technological framework
Capital Technological framework
Opportunities and threats E-GovernmentWorld robots distribution Public-private partnerships
Total expenditure on R&D (%)Total public expenditure on education Total R&D personnel per capita
Training & education
Adaptive attitudes
Business agility
Venture capital Internet bandwidth speedInvestment in Telecommunications High-tech exports (%)
Regulatory framework
Capital
IT & media stock market capitalization Communications technologyFunding for technological development Mobile Broadband subscribersBanking and financial services Wireless broadbandCountry credit rating Internet users
Higher education achievement Female researchersPupil-teacher ratio (tertiary education) R&D productivity by publicationGraduates in Sciences Scientific and technical employmentWomen with degrees High-tech patent grants
Employee training
KNOWLEDGE
Agility of companies Cyber securityUse of big data and analytics Sofware piracyKnowledge transfer
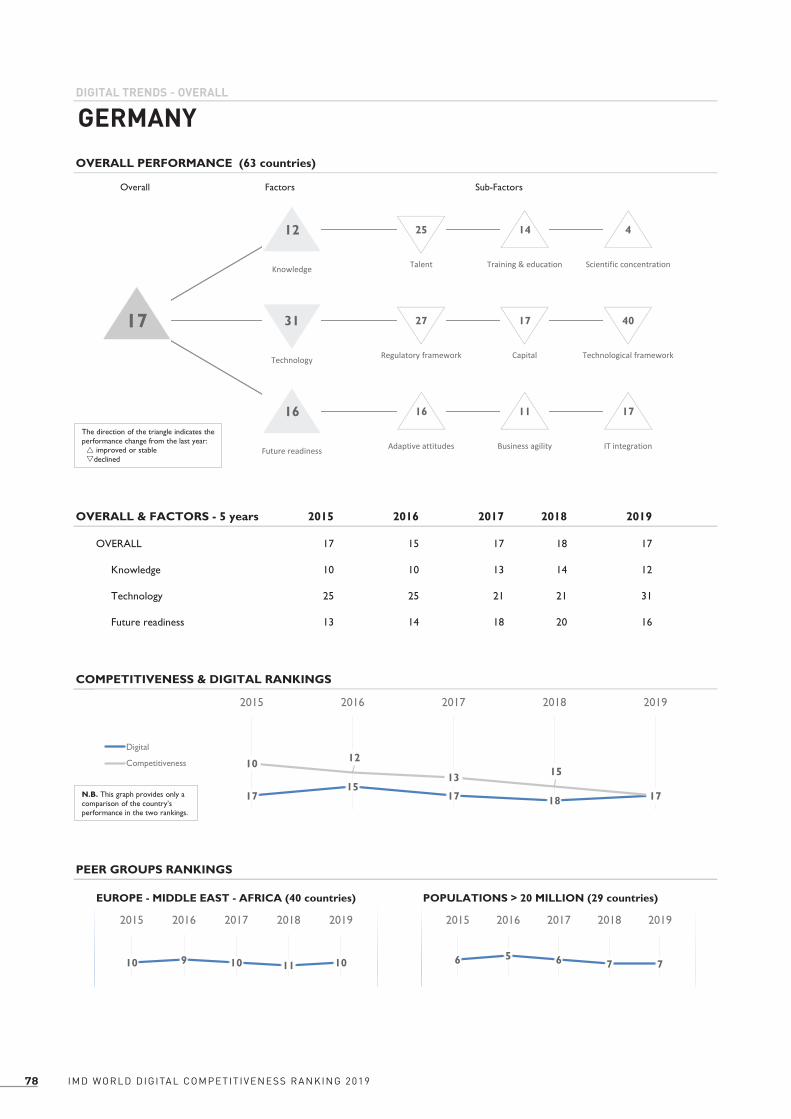
IMD WORLD DIGITAL COMPETIT IVENESS RANKING 201978
Alpha AlphaLabelBeta BetaLabel Gamma GammaLabel1 2 2 2 2 2 24 4 4 2 2
6.5 4 4 2 28.5 4 4 2 2
10.5 4 4 2 2
2015 2016 2017 2018 2019
17 15 17 18 17
10 10 13 14 12
25 25 21 21 31
13 14 18 20 16
COMPETITIVENESS & DIGITAL RANKINGS
PEER GROUPS RANKINGS
EUROPE - MIDDLE EAST - AFRICA (40 countries) POPULATIONS > 20 MILLION (29 countries)
Knowledge
Technology
DIGITAL TRENDS - OVERALL
GERMANY
OVERALL PERFORMANCE (63 countries)
OVERALL & FACTORS - 5 years
Future readiness
OVERALL
1715
17 18 17
10 12
13 15
17
2015 2016 2017 2018 2019
Digital
Competitiveness
10 9 10 11 10
2015 2016 2017 2018 2019
6 5 6 7 7
2015 2016 2017 2018 2019
12 25 14 4
31 27 17 4017
16 16 11 17
Knowledge Talent Training & education Scientific concentration
Technology Regulatory framework Capital Technological framework
Future readiness Adaptive attitudes Business agility IT integrationThe direction of the triangle indicates the performance change from the last year: improved or stabledeclined
Overall Factors Sub-Factors
N.B. This graph provides only a comparison of the country’s performance in the two rankings.

79IMD WORLD DIGITAL COMPETIT IVENESS RANKING 2019
u Overall top strengths
w Overall top weaknesses
Subfactors 2015 2016 2017 2018 201915 16 16 22 25
4 2 15 19 14
17 15 15 10 4
Talent Rank Rank Rank
Educational assessment PISA - Math 15 u 3 9 International experience 21 38 11 Foreign highly-skilled personnel 18 46 45 Management of cities 23 u 3 11w Digital/Technological skills 55 u 1 18 Net flow of international students 20 41 24 u 2
Subfactors 2015 2016 2017 2018 201927 23 20 23 27
19 22 19 16 17
31 30 26 27 40
Regulatory framework Rank Rank Rank
Starting a business 48 9 w 55 Enforcing contracts 24 33 w 54 Immigration laws 25 24 48 Development and application of technology41 u 1 18 Scientific research legislation 24 26 23 Intellectual property rights 3 w 51 24
Subfactors 2015 2016 2017 2018 201918 20 22 22 16
5 6 18 20 11
18 17 16 18 17
Adaptive attitudes Rank Rank Rank
E-Participation 23 w 56 12 Internet retailing 13 5 40 Tablet possession 25 36 26 Smartphone possession 22 46 8 Attitudes toward globalization 33 10
Talent
Robots in Education and R&D
Training & education Scientific concentration
TECHNOLOGY
Scientific concentration
Capital Technological framework
FUTURE READINESS
IT integration
Business agility IT integration
FACTORS BREAKDOWN - STRENGTHS AND WEAKNESSES
GERMANY
Technological framework
Opportunities and threats E-GovernmentWorld robots distribution Public-private partnerships
Total expenditure on R&D (%)Total public expenditure on education Total R&D personnel per capita
Training & education
Adaptive attitudes
Business agility
Venture capital Internet bandwidth speedInvestment in Telecommunications High-tech exports (%)
Regulatory framework
Capital
IT & media stock market capitalization Communications technologyFunding for technological development Mobile Broadband subscribersBanking and financial services Wireless broadbandCountry credit rating Internet users
Higher education achievement Female researchersPupil-teacher ratio (tertiary education) R&D productivity by publicationGraduates in Sciences Scientific and technical employmentWomen with degrees High-tech patent grants
Employee training
KNOWLEDGE
Agility of companies Cyber securityUse of big data and analytics Sofware piracyKnowledge transfer

IMD WORLD DIGITAL COMPETIT IVENESS RANKING 201980
Alpha AlphaLabelBeta BetaLabel Gamma GammaLabel1 2 2 2 2 2 24 4 4 2 2
6.5 4 4 2 28.5 4 4 2 2
10.5 4 4 2 2
2015 2016 2017 2018 2019
40 45 50 53 53
34 46 51 51 53
51 52 52 51 54
36 36 47 46 53
OVERALL
Future readiness
COMPETITIVENESS & DIGITAL RANKINGS
PEER GROUPS RANKINGS
EUROPE - MIDDLE EAST - AFRICA (40 countries) POPULATIONS < 20 MILLION (34 countries)
Knowledge
Technology
DIGITAL TRENDS - OVERALL
GREECE
OVERALL PERFORMANCE (63 countries)
OVERALL & FACTORS - 5 years
40 45 50 53 5350
56 57 57 58
2015 2016 2017 2018 2019
Digital
Competitiveness
28 32 35 38 38
2015 2016 2017 2018 2019
26 29 30 32 32
2015 2016 2017 2018 2019
53 53 60 34
54 52 52 4953
53 41 60 50
Knowledge Talent Training & education Scientific concentration
Technology Regulatory framework Capital Technological framework
Future readiness Adaptive attitudes Business agility IT integrationThe direction of the triangle indicates the performance change from the last year: improved or stabledeclined
Overall Factors Sub-Factors
N.B. This graph provides only a comparison of the country’s performance in the two rankings.

81IMD WORLD DIGITAL COMPETIT IVENESS RANKING 2019
u Overall top strengths
w Overall top weaknesses
Subfactors 2015 2016 2017 2018 201938 47 47 50 53
28 51 55 58 60
29 34 33 37 34
Talent Rank Rank Rank
Educational assessment PISA - Math 40 w 60 33 International experience 37 41 28w Foreign highly-skilled personnel 61 32 u 23 Management of cities 54 w 59 30 Digital/Technological skills 34 u 14 u 20 Net flow of international students 51 34 40 38
Subfactors 2015 2016 2017 2018 201940 51 49 47 52
57 55 58 54 52
48 49 49 48 49
Regulatory framework Rank Rank Rank
Starting a business 26 u 10 45 Enforcing contracts 57 55 57 Immigration laws 31 w 61 55 Development and application of technology55 w 59 40 Scientific research legislation 52 58 49 Intellectual property rights 50 u 5 36
Subfactors 2015 2016 2017 2018 201932 33 41 50 41
39 40 53 49 60
39 43 48 47 50
Adaptive attitudes Rank Rank Rank
E-Participation 32 54 30 Internet retailing 28 44 57 Tablet possession 41 59 53 Smartphone possession 48 54 52 Attitudes toward globalization 57 58
Scientific concentration
Training & education Scientific concentration
Talent
Robots in Education and R&D
FUTURE READINESS
IT integration
Business agility IT integration
FACTORS BREAKDOWN - STRENGTHS AND WEAKNESSES
GREECE
TECHNOLOGY
Technological framework
Capital Technological framework
Opportunities and threats E-GovernmentWorld robots distribution Public-private partnerships
Total expenditure on R&D (%)Total public expenditure on education Total R&D personnel per capita
Training & education
Adaptive attitudes
Business agility
Venture capital Internet bandwidth speedInvestment in Telecommunications High-tech exports (%)
Regulatory framework
Capital
IT & media stock market capitalization Communications technologyFunding for technological development Mobile Broadband subscribersBanking and financial services Wireless broadbandCountry credit rating Internet users
Higher education achievement Female researchersPupil-teacher ratio (tertiary education) R&D productivity by publicationGraduates in Sciences Scientific and technical employmentWomen with degrees High-tech patent grants
Employee training
KNOWLEDGE
Agility of companies Cyber securityUse of big data and analytics Sofware piracyKnowledge transfer

IMD WORLD DIGITAL COMPETIT IVENESS RANKING 201982
Alpha AlphaLabelBeta BetaLabel Gamma GammaLabel1 2 2 2 2 2 24 4 4 2 2
6.5 4 4 2 28.5 4 4 2 2
10.5 4 4 2 2
2015 2016 2017 2018 2019
14 11 7 11 8
8 6 6 5 7
5 2 3 6 4
25 27 17 24 15
OVERALL
Future readiness
COMPETITIVENESS & DIGITAL RANKINGS
PEER GROUPS RANKINGS
ASIA - PACIFIC (14 countries) POPULATIONS < 20 MILLION (34 countries)
Knowledge
Technology
DIGITAL TRENDS - OVERALL
HONG KONG SAR
OVERALL PERFORMANCE (63 countries)
OVERALL & FACTORS - 5 years
14
11
7
11
8
2 1 1 2 2
2015 2016 2017 2018 2019
Digital
Competitiveness
43
2 2 2
2015 2016 2017 2018 2019
10 96 8 7
2015 2016 2017 2018 2019
7 4 12 16
4 12 6 38
15 12 8 22
Knowledge Talent Training & education Scientific concentration
Technology Regulatory framework Capital Technological framework
Future readiness Adaptive attitudes Business agility IT integrationThe direction of the triangle indicates the performance change from the last year: improved or stabledeclined
Overall Factors Sub-Factors
N.B. This graph provides only a comparison of the country’s performance in the two rankings.

83IMD WORLD DIGITAL COMPETIT IVENESS RANKING 2019
u Overall top strengths
w Overall top weaknesses
Subfactors 2015 2016 2017 2018 20194 3 4 5 4
31 26 27 13 12
7 6 7 5 16
Talent Rank Rank Rank
u Educational assessment PISA - Math 2 20 w 44 International experience 7 w 53 32 Foreign highly-skilled personnel 11 8 - Management of cities 7 28 18 Digital/Technological skills 14 5 u 2w Net flow of international students 43 - u 2 w 54
Subfactors 2015 2016 2017 2018 20197 4 6 14 12
5 2 6 6 6
10 11 9 11 3
Regulatory framework Rank Rank Rank
Starting a business 4 5 7 Enforcing contracts 25 13 18 Immigration laws 16 9 6 Development and application of technology11 14 13 Scientific research legislation 22 11 u 3 Intellectual property rights 11 w 41 31
Subfactors 2015 2016 2017 2018 20196 6 9 11 12
46 57 25 26 8
20 20 21 25 22
Adaptive attitudes Rank Rank Rank
E-Participation - u 2 - Internet retailing 24 36 4 Tablet possession 4 5 10 Smartphone possession 13 19 28 Attitudes toward globalization 8 15
Scientific concentration
Training & education Scientific concentration
Talent
Robots in Education and R&D
FUTURE READINESS
IT integration
Business agility IT integration
FACTORS BREAKDOWN - STRENGTHS AND WEAKNESSES
HONG KONG SAR
TECHNOLOGY
Technological framework
Capital Technological framework
Opportunities and threats E-GovernmentWorld robots distribution Public-private partnerships
Total expenditure on R&D (%)Total public expenditure on education Total R&D personnel per capita
Training & education
Adaptive attitudes
Business agility
Venture capital Internet bandwidth speedInvestment in Telecommunications High-tech exports (%)
Regulatory framework
Capital
IT & media stock market capitalization Communications technologyFunding for technological development Mobile Broadband subscribersBanking and financial services Wireless broadbandCountry credit rating Internet users
Higher education achievement Female researchersPupil-teacher ratio (tertiary education) R&D productivity by publicationGraduates in Sciences Scientific and technical employmentWomen with degrees High-tech patent grants
Employee training
KNOWLEDGE
Agility of companies Cyber securityUse of big data and analytics Sofware piracyKnowledge transfer

IMD WORLD DIGITAL COMPETIT IVENESS RANKING 201984
Alpha AlphaLabelBeta BetaLabel Gamma GammaLabel1 2 2 2 2 2 24 4 4 2 2
6.5 4 4 2 28.5 4 4 2 2
10.5 4 4 2 2
2015 2016 2017 2018 2019
44 42 44 46 43
44 43 48 48 44
39 37 38 40 36
47 45 55 58 57
OVERALL
Future readiness
COMPETITIVENESS & DIGITAL RANKINGS
PEER GROUPS RANKINGS
EUROPE - MIDDLE EAST - AFRICA (40 countries) POPULATIONS < 20 MILLION (34 countries)
Knowledge
Technology
DIGITAL TRENDS - OVERALL
HUNGARY
OVERALL PERFORMANCE (63 countries)
OVERALL & FACTORS - 5 years
44 42 44 46 43
48 4652
47 47
2015 2016 2017 2018 2019
Digital
Competitiveness
3129
3133
30
2015 2016 2017 2018 2019
2826
2729
26
2015 2016 2017 2018 2019
44 47 43 45
36 35 46 1943
57 62 53 37
Knowledge Talent Training & education Scientific concentration
Technology Regulatory framework Capital Technological framework
Future readiness Adaptive attitudes Business agility IT integrationThe direction of the triangle indicates the performance change from the last year: improved or stabledeclined
Overall Factors Sub-Factors
N.B. This graph provides only a comparison of the country’s performance in the two rankings.

85IMD WORLD DIGITAL COMPETIT IVENESS RANKING 2019
u Overall top strengths
w Overall top weaknesses
Subfactors 2015 2016 2017 2018 201946 43 46 46 47
46 41 43 48 43
48 46 46 51 45
Talent Rank Rank Rank
Educational assessment PISA - Math 34 48 26 International experience 33 u 20 30 Foreign highly-skilled personnel 52 47 41 Management of cities 41 27 46w Digital/Technological skills 61 36 34u Net flow of international students 21 39 38 31
Subfactors 2015 2016 2017 2018 201932 30 29 35 35
49 47 44 51 46
44 44 45 46 19
Regulatory framework Rank Rank Rank
Starting a business 38 31 47u Enforcing contracts 21 39 u 6 Immigration laws 21 46 w 57 Development and application of technology47 49 31 Scientific research legislation 49 40 u 10 Intellectual property rights 43 37 22
Subfactors 2015 2016 2017 2018 201951 50 57 62 62
51 50 58 56 53
36 35 38 36 37
Adaptive attitudes Rank Rank Rank
E-Participation 51 w 59 38 Internet retailing 37 26 42 Tablet possession 51 50 51w Smartphone possession 59 50 27w Attitudes toward globalization 61 39
Scientific concentration
Training & education Scientific concentration
Talent
Robots in Education and R&D
FUTURE READINESS
IT integration
Business agility IT integration
FACTORS BREAKDOWN - STRENGTHS AND WEAKNESSES
HUNGARY
TECHNOLOGY
Technological framework
Capital Technological framework
Opportunities and threats E-GovernmentWorld robots distribution Public-private partnerships
Total expenditure on R&D (%)Total public expenditure on education Total R&D personnel per capita
Training & education
Adaptive attitudes
Business agility
Venture capital Internet bandwidth speedInvestment in Telecommunications High-tech exports (%)
Regulatory framework
Capital
IT & media stock market capitalization Communications technologyFunding for technological development Mobile Broadband subscribersBanking and financial services Wireless broadbandCountry credit rating Internet users
Higher education achievement Female researchersPupil-teacher ratio (tertiary education) R&D productivity by publicationGraduates in Sciences Scientific and technical employmentWomen with degrees High-tech patent grants
Employee training
KNOWLEDGE
Agility of companies Cyber securityUse of big data and analytics Sofware piracyKnowledge transfer

IMD WORLD DIGITAL COMPETIT IVENESS RANKING 201986
Alpha AlphaLabelBeta BetaLabel Gamma GammaLabel1 2 2 2 2 2 24 4 4 2 2
6.5 4 4 2 28.5 4 4 2 2
10.5 4 4 2 2
2015 2016 2017 2018 2019
24 26 23 21 27
33 32 30 28 29
20 22 20 18 20
17 18 21 19 26
OVERALL
Future readiness
COMPETITIVENESS & DIGITAL RANKINGS
PEER GROUPS RANKINGS
EUROPE - MIDDLE EAST - AFRICA (40 countries) POPULATIONS < 20 MILLION (34 countries)
Knowledge
Technology
DIGITAL TRENDS - OVERALL
ICELAND
OVERALL PERFORMANCE (63 countries)
OVERALL & FACTORS - 5 years
24 2623 21
2724
2320
24
20
2015 2016 2017 2018 2019
Digital
Competitiveness
14 16 15 13 16
2015 2016 2017 2018 2019
1416 16
1416
2015 2016 2017 2018 2019
29 34 18 39
20 15 39 1527
26 28 24 28
Knowledge Talent Training & education Scientific concentration
Technology Regulatory framework Capital Technological framework
Future readiness Adaptive attitudes Business agility IT integrationThe direction of the triangle indicates the performance change from the last year: improved or stabledeclined
Overall Factors Sub-Factors
N.B. This graph provides only a comparison of the country’s performance in the two rankings.

87IMD WORLD DIGITAL COMPETIT IVENESS RANKING 2019
u Overall top strengths
w Overall top weaknesses
Subfactors 2015 2016 2017 2018 201940 41 38 37 34
8 10 7 18 18
47 37 37 35 39
Talent Rank Rank Rank
Educational assessment PISA - Math 29 34 15 International experience 50 u 2 u 4 Foreign highly-skilled personnel 44 20 12 Management of cities 16 - w 63u Digital/Technological skills 3 49 14w Net flow of international students 59 9 w 54 w 54
Subfactors 2015 2016 2017 2018 201911 22 22 18 15
37 43 43 40 39
9 10 11 12 15
Regulatory framework Rank Rank Rank
Starting a business 32 - u 2 Enforcing contracts 26 27 19 Immigration laws 9 33 14 Development and application of technology15 32 10 Scientific research legislation 26 39 46 Intellectual property rights 19 47 23
Subfactors 2015 2016 2017 2018 201921 25 16 18 28
4 5 10 11 24
27 27 28 28 28
Adaptive attitudes Rank Rank Rank
E-Participation 53 u 5 19 Internet retailing 25 w 55 36 Tablet possession 23 13 34 Smartphone possession 11 26 34 Attitudes toward globalization 14 22
Scientific concentration
Training & education Scientific concentration
Talent
Robots in Education and R&D
FUTURE READINESS
IT integration
Business agility IT integration
FACTORS BREAKDOWN - STRENGTHS AND WEAKNESSES
ICELAND
TECHNOLOGY
Technological framework
Capital Technological framework
Opportunities and threats E-GovernmentWorld robots distribution Public-private partnerships
Total expenditure on R&D (%)Total public expenditure on education Total R&D personnel per capita
Training & education
Adaptive attitudes
Business agility
Venture capital Internet bandwidth speedInvestment in Telecommunications High-tech exports (%)
Regulatory framework
Capital
IT & media stock market capitalization Communications technologyFunding for technological development Mobile Broadband subscribersBanking and financial services Wireless broadbandCountry credit rating Internet users
Higher education achievement Female researchersPupil-teacher ratio (tertiary education) R&D productivity by publicationGraduates in Sciences Scientific and technical employmentWomen with degrees High-tech patent grants
Employee training
KNOWLEDGE
Agility of companies Cyber securityUse of big data and analytics Sofware piracyKnowledge transfer
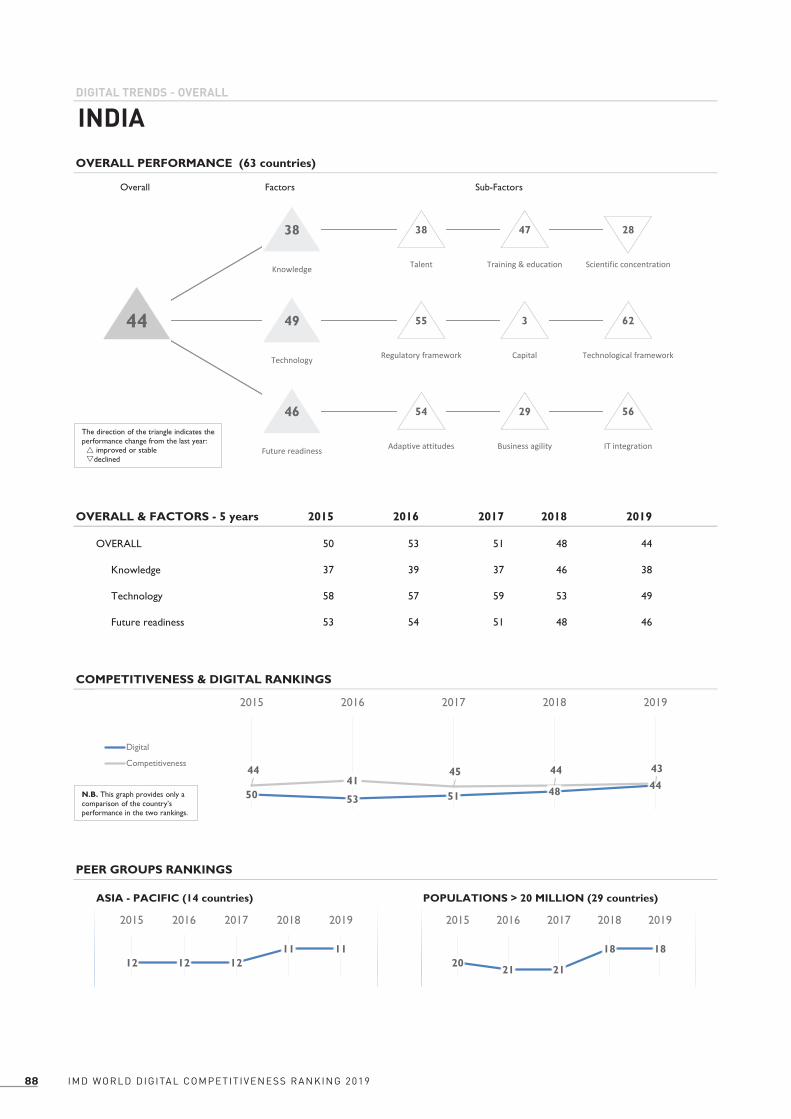
IMD WORLD DIGITAL COMPETIT IVENESS RANKING 201988
Alpha AlphaLabelBeta BetaLabel Gamma GammaLabel1 2 2 2 2 2 24 4 4 2 2
6.5 4 4 2 28.5 4 4 2 2
10.5 4 4 2 2
2015 2016 2017 2018 2019
50 53 51 48 44
37 39 37 46 38
58 57 59 53 49
53 54 51 48 46
OVERALL
Future readiness
COMPETITIVENESS & DIGITAL RANKINGS
PEER GROUPS RANKINGS
ASIA - PACIFIC (14 countries) POPULATIONS > 20 MILLION (29 countries)
Knowledge
Technology
DIGITAL TRENDS - OVERALL
INDIA
OVERALL PERFORMANCE (63 countries)
OVERALL & FACTORS - 5 years
50 53 51 48 4444
4145 44 43
2015 2016 2017 2018 2019
Digital
Competitiveness
12 12 1211 11
2015 2016 2017 2018 2019
2021 21
18 18
2015 2016 2017 2018 2019
38 38 47 28
49 55 3 6244
46 54 29 56
Knowledge Talent Training & education Scientific concentration
Technology Regulatory framework Capital Technological framework
Future readiness Adaptive attitudes Business agility IT integrationThe direction of the triangle indicates the performance change from the last year: improved or stabledeclined
Overall Factors Sub-Factors
N.B. This graph provides only a comparison of the country’s performance in the two rankings.

89IMD WORLD DIGITAL COMPETIT IVENESS RANKING 2019
u Overall top strengths
w Overall top weaknesses
Subfactors 2015 2016 2017 2018 201939 38 43 43 38
45 56 57 59 47
21 21 6 26 28
Talent Rank Rank Rank
Educational assessment PISA - Math - 39 47 International experience 34 36 55 Foreign highly-skilled personnel 40 59 - Management of cities 51 56 u 2 Digital/Technological skills 22 u 4 - Net flow of international students 40 - 26 17
Subfactors 2015 2016 2017 2018 201959 56 59 56 55
34 30 28 3 3
61 61 63 62 62
Regulatory framework Rank Rank Rank
Starting a business 59 u 13 40w Enforcing contracts 62 35 w 62 Immigration laws 32 27 w 63 Development and application of technology28 47 w 63 Scientific research legislation 32 30 59 Intellectual property rights 46 u 1 49
Subfactors 2015 2016 2017 2018 201956 57 59 54 54
37 35 29 33 29
53 54 56 56 56
Adaptive attitudes Rank Rank Rank
E-Participation 15 25 58 Internet retailing 55 u 13 27w Tablet possession 61 32 37 Smartphone possession 55 30 48 Attitudes toward globalization 22 42
Scientific concentration
Training & education Scientific concentration
Talent
Robots in Education and R&D
FUTURE READINESS
IT integration
Business agility IT integration
FACTORS BREAKDOWN - STRENGTHS AND WEAKNESSES
INDIA
TECHNOLOGY
Technological framework
Capital Technological framework
Opportunities and threats E-GovernmentWorld robots distribution Public-private partnerships
Total expenditure on R&D (%)Total public expenditure on education Total R&D personnel per capita
Training & education
Adaptive attitudes
Business agility
Venture capital Internet bandwidth speedInvestment in Telecommunications High-tech exports (%)
Regulatory framework
Capital
IT & media stock market capitalization Communications technologyFunding for technological development Mobile Broadband subscribersBanking and financial services Wireless broadbandCountry credit rating Internet users
Higher education achievement Female researchersPupil-teacher ratio (tertiary education) R&D productivity by publicationGraduates in Sciences Scientific and technical employmentWomen with degrees High-tech patent grants
Employee training
KNOWLEDGE
Agility of companies Cyber securityUse of big data and analytics Sofware piracyKnowledge transfer

IMD WORLD DIGITAL COMPETIT IVENESS RANKING 201990
Alpha AlphaLabelBeta BetaLabel Gamma GammaLabel1 2 2 2 2 2 24 4 4 2 2
6.5 4 4 2 28.5 4 4 2 2
10.5 4 4 2 2
2015 2016 2017 2018 2019
60 60 59 62 56
60 60 58 61 56
57 58 56 59 47
58 60 62 62 58
OVERALL
Future readiness
COMPETITIVENESS & DIGITAL RANKINGS
PEER GROUPS RANKINGS
ASIA - PACIFIC (14 countries) POPULATIONS > 20 MILLION (29 countries)
Knowledge
Technology
DIGITAL TRENDS - OVERALL
INDONESIA
OVERALL PERFORMANCE (63 countries)
OVERALL & FACTORS - 5 years
60 60 59 6256
4248
42 4332
2015 2016 2017 2018 2019
Digital
Competitiveness
14 1413
1413
2015 2016 2017 2018 2019
27 27 26 2823
2015 2016 2017 2018 2019
56 42 61 52
47 51 26 5656
58 60 21 60
Knowledge Talent Training & education Scientific concentration
Technology Regulatory framework Capital Technological framework
Future readiness Adaptive attitudes Business agility IT integrationThe direction of the triangle indicates the performance change from the last year: improved or stabledeclined
Overall Factors Sub-Factors
N.B. This graph provides only a comparison of the country’s performance in the two rankings.

91IMD WORLD DIGITAL COMPETIT IVENESS RANKING 2019
u Overall top strengths
w Overall top weaknesses
Subfactors 2015 2016 2017 2018 201952 54 48 51 42
59 60 59 61 61
56 53 54 58 52
Talent Rank Rank Rank
Educational assessment PISA - Math 54 17 58 International experience 19 57 49 Foreign highly-skilled personnel 19 58 14 Management of cities 37 58 u 9 Digital/Technological skills 41 50 - Net flow of international students 39 53 57 45
Subfactors 2015 2016 2017 2018 201960 60 61 57 51
35 42 37 34 26
59 57 58 60 56
Regulatory framework Rank Rank Rank
Starting a business 57 18 44 Enforcing contracts 59 20 49 Immigration laws 34 u 6 18 Development and application of technology26 42 w 61 Scientific research legislation 33 u 13 w 61 Intellectual property rights 42 35 54
Subfactors 2015 2016 2017 2018 201961 61 63 61 60
41 48 35 46 21
59 59 61 60 60
Adaptive attitudes Rank Rank Rank
E-Participation 58 u 13 w 61 Internet retailing 58 25 17w Tablet possession 60 24 27 Smartphone possession 53 u 8 w 61 Attitudes toward globalization 17 24
Scientific concentration
Training & education Scientific concentration
Talent
Robots in Education and R&D
FUTURE READINESS
IT integration
Business agility IT integration
FACTORS BREAKDOWN - STRENGTHS AND WEAKNESSES
INDONESIA
TECHNOLOGY
Technological framework
Capital Technological framework
Opportunities and threats E-GovernmentWorld robots distribution Public-private partnerships
Total expenditure on R&D (%)Total public expenditure on education Total R&D personnel per capita
Training & education
Adaptive attitudes
Business agility
Venture capital Internet bandwidth speedInvestment in Telecommunications High-tech exports (%)
Regulatory framework
Capital
IT & media stock market capitalization Communications technologyFunding for technological development Mobile Broadband subscribersBanking and financial services Wireless broadbandCountry credit rating Internet users
Higher education achievement Female researchersPupil-teacher ratio (tertiary education) R&D productivity by publicationGraduates in Sciences Scientific and technical employmentWomen with degrees High-tech patent grants
Employee training
KNOWLEDGE
Agility of companies Cyber securityUse of big data and analytics Sofware piracyKnowledge transfer

IMD WORLD DIGITAL COMPETIT IVENESS RANKING 201992
Alpha AlphaLabelBeta BetaLabel Gamma GammaLabel1 2 2 2 2 2 24 4 4 2 2
6.5 4 4 2 28.5 4 4 2 2
10.5 4 4 2 2
2015 2016 2017 2018 2019
25 20 21 20 19
26 25 25 22 24
27 27 25 29 28
12 12 10 13 5
OVERALL
Future readiness
COMPETITIVENESS & DIGITAL RANKINGS
PEER GROUPS RANKINGS
EUROPE - MIDDLE EAST - AFRICA (40 countries) POPULATIONS < 20 MILLION (34 countries)
Knowledge
Technology
DIGITAL TRENDS - OVERALL
IRELAND
OVERALL PERFORMANCE (63 countries)
OVERALL & FACTORS - 5 years
2520 21 20 19
16
7 6
127
2015 2016 2017 2018 2019
Digital
Competitiveness
15 12 13 12 11
2015 2016 2017 2018 2019
15 13 14 13 12
2015 2016 2017 2018 2019
24 10 30 29
28 13 49 2419
5 3 9 20
Knowledge Talent Training & education Scientific concentration
Technology Regulatory framework Capital Technological framework
Future readiness Adaptive attitudes Business agility IT integrationThe direction of the triangle indicates the performance change from the last year: improved or stabledeclined
Overall Factors Sub-Factors
N.B. This graph provides only a comparison of the country’s performance in the two rankings.

93IMD WORLD DIGITAL COMPETIT IVENESS RANKING 2019
u Overall top strengths
w Overall top weaknesses
Subfactors 2015 2016 2017 2018 201921 18 15 14 10
29 25 34 34 30
34 32 31 24 29
Talent Rank Rank Rank
Educational assessment PISA - Math 17 19 35 International experience 6 w 54 21u Foreign highly-skilled personnel 3 12 29 Management of cities 36 w 53 42 Digital/Technological skills 24 24 17 Net flow of international students 28 13 13 37
Subfactors 2015 2016 2017 2018 201913 18 14 20 13
51 49 49 53 49
21 18 13 13 24
Regulatory framework Rank Rank Rank
Starting a business 6 48 w 51w Enforcing contracts 50 15 28 Immigration laws 7 23 23 Development and application of technology10 30 20 Scientific research legislation 8 12 33 Intellectual property rights 9 w 61 10
Subfactors 2015 2016 2017 2018 201914 13 12 10 3
6 8 2 3 9
24 22 24 24 20
Adaptive attitudes Rank Rank Rank
E-Participation 22 u 3 22u Internet retailing 5 43 16 Tablet possession 18 u 2 21 Smartphone possession 8 18 19u Attitudes toward globalization 1 9
Scientific concentration
Training & education Scientific concentration
Talent
Robots in Education and R&D
FUTURE READINESS
IT integration
Business agility IT integration
FACTORS BREAKDOWN - STRENGTHS AND WEAKNESSES
IRELAND
TECHNOLOGY
Technological framework
Capital Technological framework
Opportunities and threats E-GovernmentWorld robots distribution Public-private partnerships
Total expenditure on R&D (%)Total public expenditure on education Total R&D personnel per capita
Training & education
Adaptive attitudes
Business agility
Venture capital Internet bandwidth speedInvestment in Telecommunications High-tech exports (%)
Regulatory framework
Capital
IT & media stock market capitalization Communications technologyFunding for technological development Mobile Broadband subscribersBanking and financial services Wireless broadbandCountry credit rating Internet users
Higher education achievement Female researchersPupil-teacher ratio (tertiary education) R&D productivity by publicationGraduates in Sciences Scientific and technical employmentWomen with degrees High-tech patent grants
Employee training
KNOWLEDGE
Agility of companies Cyber securityUse of big data and analytics Sofware piracyKnowledge transfer

IMD WORLD DIGITAL COMPETIT IVENESS RANKING 201994
Alpha AlphaLabelBeta BetaLabel Gamma GammaLabel1 2 2 2 2 2 24 4 4 2 2
6.5 4 4 2 28.5 4 4 2 2
10.5 4 4 2 2
2015 2016 2017 2018 2019
10 13 13 12 16
4 5 7 2 8
22 24 27 25 30
7 9 11 7 19
OVERALL
Future readiness
COMPETITIVENESS & DIGITAL RANKINGS
PEER GROUPS RANKINGS
EUROPE - MIDDLE EAST - AFRICA (40 countries) POPULATIONS < 20 MILLION (34 countries)
Knowledge
Technology
DIGITAL TRENDS - OVERALL
ISRAEL
OVERALL PERFORMANCE (63 countries)
OVERALL & FACTORS - 5 years
1013 13 12
1621 21 22 21
24
2015 2016 2017 2018 2019
Digital
Competitiveness
68 8 8 9
2015 2016 2017 2018 2019
710 9 9 10
2015 2016 2017 2018 2019
8 27 3 5
30 32 20 3516
19 21 19 16
Knowledge Talent Training & education Scientific concentration
Technology Regulatory framework Capital Technological framework
Future readiness Adaptive attitudes Business agility IT integrationThe direction of the triangle indicates the performance change from the last year: improved or stabledeclined
Overall Factors Sub-Factors
N.B. This graph provides only a comparison of the country’s performance in the two rankings.

95IMD WORLD DIGITAL COMPETIT IVENESS RANKING 2019
u Overall top strengths
w Overall top weaknesses
Subfactors 2015 2016 2017 2018 201925 23 21 19 27
7 6 11 2 3
2 2 2 2 5
Talent Rank Rank Rank
Educational assessment PISA - Math 36 w 46 u 2 International experience 17 4 - Foreign highly-skilled personnel 35 18 - Management of cities 42 - w 54 Digital/Technological skills 4 - 9 Net flow of international students 45 6 6 40
Subfactors 2015 2016 2017 2018 201926 26 26 30 32
18 20 27 20 20
25 26 28 20 35
Regulatory framework Rank Rank Rank
Starting a business 27 21 33w Enforcing contracts 47 u 3 45w Immigration laws 58 34 20 Development and application of technology17 25 34 Scientific research legislation 15 u 2 34 Intellectual property rights 21 w 59 26
Subfactors 2015 2016 2017 2018 201917 17 18 17 21
11 11 9 2 19
2 3 7 4 16
Adaptive attitudes Rank Rank Rank
E-Participation 39 29 27 Internet retailing 23 39 24 Tablet possession 17 16 u 1 Smartphone possession 14 u 3 17 Attitudes toward globalization 5 6
Scientific concentration
Training & education Scientific concentration
Talent
Robots in Education and R&D
FUTURE READINESS
IT integration
Business agility IT integration
FACTORS BREAKDOWN - STRENGTHS AND WEAKNESSES
ISRAEL
TECHNOLOGY
Technological framework
Capital Technological framework
Opportunities and threats E-GovernmentWorld robots distribution Public-private partnerships
Total expenditure on R&D (%)Total public expenditure on education Total R&D personnel per capita
Training & education
Adaptive attitudes
Business agility
Venture capital Internet bandwidth speedInvestment in Telecommunications High-tech exports (%)
Regulatory framework
Capital
IT & media stock market capitalization Communications technologyFunding for technological development Mobile Broadband subscribersBanking and financial services Wireless broadbandCountry credit rating Internet users
Higher education achievement Female researchersPupil-teacher ratio (tertiary education) R&D productivity by publicationGraduates in Sciences Scientific and technical employmentWomen with degrees High-tech patent grants
Employee training
KNOWLEDGE
Agility of companies Cyber securityUse of big data and analytics Sofware piracyKnowledge transfer

IMD WORLD DIGITAL COMPETIT IVENESS RANKING 201996
Alpha AlphaLabelBeta BetaLabel Gamma GammaLabel1 2 2 2 2 2 24 4 4 2 2
6.5 4 4 2 28.5 4 4 2 2
10.5 4 4 2 2
2015 2016 2017 2018 2019
36 34 39 41 41
42 40 42 42 41
46 44 45 41 46
30 29 30 36 31
OVERALL
Future readiness
COMPETITIVENESS & DIGITAL RANKINGS
PEER GROUPS RANKINGS
EUROPE - MIDDLE EAST - AFRICA (40 countries) POPULATIONS > 20 MILLION (29 countries)
Knowledge
Technology
DIGITAL TRENDS - OVERALL
ITALY
OVERALL PERFORMANCE (63 countries)
OVERALL & FACTORS - 5 years
36 3439 41 41
38 3544 42 44
2015 2016 2017 2018 2019
Digital
Competitiveness
25 24 28 28 29
2015 2016 2017 2018 2019
13 12 15 16 17
2015 2016 2017 2018 2019
41 44 57 23
46 44 53 4641
31 35 31 34
Knowledge Talent Training & education Scientific concentration
Technology Regulatory framework Capital Technological framework
Future readiness Adaptive attitudes Business agility IT integrationThe direction of the triangle indicates the performance change from the last year: improved or stabledeclined
Overall Factors Sub-Factors
N.B. This graph provides only a comparison of the country’s performance in the two rankings.

97IMD WORLD DIGITAL COMPETIT IVENESS RANKING 2019
u Overall top strengths
w Overall top weaknesses
Subfactors 2015 2016 2017 2018 201947 44 44 41 44
49 48 46 56 57
30 29 32 28 23
Talent Rank Rank Rank
Educational assessment PISA - Math 28 50 25 International experience 43 43 25w Foreign highly-skilled personnel 55 w 52 31 Management of cities 47 w 52 u 6w Digital/Technological skills 54 32 u 13 Net flow of international students 30 48 47 u 12
Subfactors 2015 2016 2017 2018 201943 41 42 41 44
52 51 53 49 53
43 43 42 44 46
Regulatory framework Rank Rank Rank
Starting a business 33 41 52w Enforcing contracts 54 48 46 Immigration laws 30 51 42 Development and application of technology49 46 25 Scientific research legislation 45 52 39 Intellectual property rights 32 29 50
Subfactors 2015 2016 2017 2018 201928 27 27 36 35
20 16 30 32 31
32 33 35 32 34
Adaptive attitudes Rank Rank Rank
u E-Participation 15 37 24 Internet retailing 27 u 6 51 Tablet possession 36 46 45 Smartphone possession 50 51 33 Attitudes toward globalization 52 37
Scientific concentration
Training & education Scientific concentration
Talent
Robots in Education and R&D
FUTURE READINESS
IT integration
Business agility IT integration
FACTORS BREAKDOWN - STRENGTHS AND WEAKNESSES
ITALY
TECHNOLOGY
Technological framework
Capital Technological framework
Opportunities and threats E-GovernmentWorld robots distribution Public-private partnerships
Total expenditure on R&D (%)Total public expenditure on education Total R&D personnel per capita
Training & education
Adaptive attitudes
Business agility
Venture capital Internet bandwidth speedInvestment in Telecommunications High-tech exports (%)
Regulatory framework
Capital
IT & media stock market capitalization Communications technologyFunding for technological development Mobile Broadband subscribersBanking and financial services Wireless broadbandCountry credit rating Internet users
Higher education achievement Female researchersPupil-teacher ratio (tertiary education) R&D productivity by publicationGraduates in Sciences Scientific and technical employmentWomen with degrees High-tech patent grants
Employee training
KNOWLEDGE
Agility of companies Cyber securityUse of big data and analytics Sofware piracyKnowledge transfer

IMD WORLD DIGITAL COMPETIT IVENESS RANKING 201998
Alpha AlphaLabelBeta BetaLabel Gamma GammaLabel1 2 2 2 2 2 24 4 4 2 2
6.5 4 4 2 28.5 4 4 2 2
10.5 4 4 2 2
2015 2016 2017 2018 2019
23 23 27 22 23
24 23 29 18 25
21 19 23 23 24
22 23 25 25 24
OVERALL
Future readiness
COMPETITIVENESS & DIGITAL RANKINGS
PEER GROUPS RANKINGS
ASIA - PACIFIC (14 countries) POPULATIONS > 20 MILLION (29 countries)
Knowledge
Technology
DIGITAL TRENDS - OVERALL
JAPAN
OVERALL PERFORMANCE (63 countries)
OVERALL & FACTORS - 5 years
23 2327
22 23
27 26
26
25 30
2015 2016 2017 2018 2019
Digital
Competitiveness
87
87
8
2015 2016 2017 2018 2019
10 9 10 8 9
2015 2016 2017 2018 2019
25 46 19 11
24 42 37 223
24 15 41 18
Knowledge Talent Training & education Scientific concentration
Technology Regulatory framework Capital Technological framework
Future readiness Adaptive attitudes Business agility IT integrationThe direction of the triangle indicates the performance change from the last year: improved or stabledeclined
Overall Factors Sub-Factors
N.B. This graph provides only a comparison of the country’s performance in the two rankings.

99IMD WORLD DIGITAL COMPETIT IVENESS RANKING 2019
u Overall top strengths
w Overall top weaknesses
Subfactors 2015 2016 2017 2018 201931 30 41 36 46
27 28 31 14 19
14 14 16 12 11
Talent Rank Rank Rank
Educational assessment PISA - Math 4 15 6w International experience 63 55 16 Foreign highly-skilled personnel 51 6 54 Management of cities 11 u 1 15w Digital/Technological skills 60 42 36 Net flow of international students 25 8 4 4
Subfactors 2015 2016 2017 2018 201939 37 37 40 42
26 29 33 33 37
3 3 6 4 2
Regulatory framework Rank Rank Rank
Starting a business 42 17 36 Enforcing contracts 38 32 u 1 Immigration laws 56 45 u 2 Development and application of technology37 31 5 Scientific research legislation 41 36 14 Intellectual property rights 31 57 21
Subfactors 2015 2016 2017 2018 201913 15 14 13 15
35 33 57 55 41
10 15 18 15 18
Adaptive attitudes Rank Rank Rank
E-Participation 5 w 63 10 Internet retailing 16 u 2 37 Tablet possession 24 w 63 41 Smartphone possession 19 w 63 u 2 Attitudes toward globalization 44 45
Scientific concentration
Training & education Scientific concentration
Talent
Robots in Education and R&D
FUTURE READINESS
IT integration
Business agility IT integration
FACTORS BREAKDOWN - STRENGTHS AND WEAKNESSES
JAPAN
TECHNOLOGY
Technological framework
Capital Technological framework
Opportunities and threats E-GovernmentWorld robots distribution Public-private partnerships
Total expenditure on R&D (%)Total public expenditure on education Total R&D personnel per capita
Training & education
Adaptive attitudes
Business agility
Venture capital Internet bandwidth speedInvestment in Telecommunications High-tech exports (%)
Regulatory framework
Capital
IT & media stock market capitalization Communications technologyFunding for technological development Mobile Broadband subscribersBanking and financial services Wireless broadbandCountry credit rating Internet users
Higher education achievement Female researchersPupil-teacher ratio (tertiary education) R&D productivity by publicationGraduates in Sciences Scientific and technical employmentWomen with degrees High-tech patent grants
Employee training
KNOWLEDGE
Agility of companies Cyber securityUse of big data and analytics Sofware piracyKnowledge transfer

IMD WORLD DIGITAL COMPETIT IVENESS RANKING 2019100
Alpha AlphaLabelBeta BetaLabel Gamma GammaLabel1 2 2 2 2 2 24 4 4 2 2
6.5 4 4 2 28.5 4 4 2 2
10.5 4 4 2 2
2015 2016 2017 2018 2019
49 48 56 45 50
61 59 61 56 49
49 45 50 48 53
38 37 48 41 52
OVERALL
Future readiness
COMPETITIVENESS & DIGITAL RANKINGS
PEER GROUPS RANKINGS
EUROPE - MIDDLE EAST - AFRICA (40 countries) POPULATIONS < 20 MILLION (34 countries)
Knowledge
Technology
DIGITAL TRENDS - OVERALL
JORDAN
OVERALL PERFORMANCE (63 countries)
OVERALL & FACTORS - 5 years
49 4856
4550
52 5356
52 57
2015 2016 2017 2018 2019
Digital
Competitiveness
34 34 39 32 35
2015 2016 2017 2018 2019
30 3133
2830
2015 2016 2017 2018 2019
49 43 32 63
53 47 41 5550
52 61 22 54
Knowledge Talent Training & education Scientific concentration
Technology Regulatory framework Capital Technological framework
Future readiness Adaptive attitudes Business agility IT integrationThe direction of the triangle indicates the performance change from the last year: improved or stabledeclined
Overall Factors Sub-Factors
N.B. This graph provides only a comparison of the country’s performance in the two rankings.

101IMD WORLD DIGITAL COMPETIT IVENESS RANKING 2019
u Overall top strengths
w Overall top weaknesses
Subfactors 2015 2016 2017 2018 201945 40 55 39 43
60 59 58 41 32
60 61 62 63 63
Talent Rank Rank Rank
Educational assessment PISA - Math 55 31 56u International experience 16 50 56 Foreign highly-skilled personnel 36 - 52 Management of cities 44 21 47 Digital/Technological skills 28 u 18 44u Net flow of international students 19 - 50 -
Subfactors 2015 2016 2017 2018 201945 50 53 43 47
29 24 30 39 41
54 50 53 54 55
Regulatory framework Rank Rank Rank
Starting a business 46 - 42 Enforcing contracts 52 38 30 Immigration laws 47 30 25 Development and application of technology31 58 w 60 Scientific research legislation 36 24 48 Intellectual property rights 41 27 w 62
Subfactors 2015 2016 2017 2018 201944 43 55 58 61
28 31 34 23 22
48 40 50 42 54
Adaptive attitudes Rank Rank Rank
w E-Participation 60 32 w 59w Internet retailing 60 - 30 Tablet possession 58 31 u 19 Smartphone possession 26 u 5 46 Attitudes toward globalization 37 29
Scientific concentration
Training & education Scientific concentration
Talent
Robots in Education and R&D
FUTURE READINESS
IT integration
Business agility IT integration
FACTORS BREAKDOWN - STRENGTHS AND WEAKNESSES
JORDAN
TECHNOLOGY
Technological framework
Capital Technological framework
Opportunities and threats E-GovernmentWorld robots distribution Public-private partnerships
Total expenditure on R&D (%)Total public expenditure on education Total R&D personnel per capita
Training & education
Adaptive attitudes
Business agility
Venture capital Internet bandwidth speedInvestment in Telecommunications High-tech exports (%)
Regulatory framework
Capital
IT & media stock market capitalization Communications technologyFunding for technological development Mobile Broadband subscribersBanking and financial services Wireless broadbandCountry credit rating Internet users
Higher education achievement Female researchersPupil-teacher ratio (tertiary education) R&D productivity by publicationGraduates in Sciences Scientific and technical employmentWomen with degrees High-tech patent grants
Employee training
KNOWLEDGE
Agility of companies Cyber securityUse of big data and analytics Sofware piracyKnowledge transfer

IMD WORLD DIGITAL COMPETIT IVENESS RANKING 2019102
Alpha AlphaLabelBeta BetaLabel Gamma GammaLabel1 2 2 2 2 2 24 4 4 2 2
6.5 4 4 2 28.5 4 4 2 2
10.5 4 4 2 2
2015 2016 2017 2018 2019
35 43 38 38 35
41 47 40 35 32
34 42 35 39 39
35 41 38 40 35
OVERALL
Future readiness
COMPETITIVENESS & DIGITAL RANKINGS
PEER GROUPS RANKINGS
EUROPE - MIDDLE EAST - AFRICA (40 countries) POPULATIONS < 20 MILLION (34 countries)
Knowledge
Technology
DIGITAL TRENDS - OVERALL
KAZAKHSTAN
OVERALL PERFORMANCE (63 countries)
OVERALL & FACTORS - 5 years
3543
38 38 3534
47
32
38
34
2015 2016 2017 2018 2019
Digital
Competitiveness
24 30 27 26 24
2015 2016 2017 2018 2019
23 27 24 25 22
2015 2016 2017 2018 2019
32 39 1 55
39 16 54 4335
35 39 15 46
Knowledge Talent Training & education Scientific concentration
Technology Regulatory framework Capital Technological framework
Future readiness Adaptive attitudes Business agility IT integrationThe direction of the triangle indicates the performance change from the last year: improved or stabledeclined
Overall Factors Sub-Factors
N.B. This graph provides only a comparison of the country’s performance in the two rankings.

103IMD WORLD DIGITAL COMPETIT IVENESS RANKING 2019
u Overall top strengths
w Overall top weaknesses
Subfactors 2015 2016 2017 2018 201937 45 36 44 39
25 31 21 6 1
55 55 56 55 55
Talent Rank Rank Rank
Educational assessment PISA - Math 39 7 w 61 International experience 26 52 50 Foreign highly-skilled personnel 23 u 1 u 2 Management of cities 28 25 29 Digital/Technological skills 51 33 43w Net flow of international students 58 u 1 w 62 -
Subfactors 2015 2016 2017 2018 201925 27 18 22 16
50 56 51 59 54
32 37 35 42 43
Regulatory framework Rank Rank Rank
Starting a business 21 - 46u Enforcing contracts 4 26 37 Immigration laws 17 37 53 Development and application of technology25 47 52 Scientific research legislation 30 41 47 Intellectual property rights 40 w 62 8
Subfactors 2015 2016 2017 2018 201941 41 48 47 39
29 36 27 43 15
40 45 39 44 46
Adaptive attitudes Rank Rank Rank
E-Participation 38 22 33 Internet retailing 53 - 21 Tablet possession 43 20 42 Smartphone possession 30 u 4 w 59 Attitudes toward globalization 31 27
Scientific concentration
Training & education Scientific concentration
Talent
Robots in Education and R&D
FUTURE READINESS
IT integration
Business agility IT integration
FACTORS BREAKDOWN - STRENGTHS AND WEAKNESSES
KAZAKHSTAN
TECHNOLOGY
Technological framework
Capital Technological framework
Opportunities and threats E-GovernmentWorld robots distribution Public-private partnerships
Total expenditure on R&D (%)Total public expenditure on education Total R&D personnel per capita
Training & education
Adaptive attitudes
Business agility
Venture capital Internet bandwidth speedInvestment in Telecommunications High-tech exports (%)
Regulatory framework
Capital
IT & media stock market capitalization Communications technologyFunding for technological development Mobile Broadband subscribersBanking and financial services Wireless broadbandCountry credit rating Internet users
Higher education achievement Female researchersPupil-teacher ratio (tertiary education) R&D productivity by publicationGraduates in Sciences Scientific and technical employmentWomen with degrees High-tech patent grants
Employee training
KNOWLEDGE
Agility of companies Cyber securityUse of big data and analytics Sofware piracyKnowledge transfer

IMD WORLD DIGITAL COMPETIT IVENESS RANKING 2019104
Alpha AlphaLabelBeta BetaLabel Gamma GammaLabel1 2 2 2 2 2 24 4 4 2 2
6.5 4 4 2 28.5 4 4 2 2
10.5 4 4 2 2
2015 2016 2017 2018 2019
18 17 19 14 10
13 15 14 11 11
16 13 17 17 17
24 25 24 17 4
OVERALL
Future readiness
COMPETITIVENESS & DIGITAL RANKINGS
PEER GROUPS RANKINGS
ASIA - PACIFIC (14 countries) POPULATIONS > 20 MILLION (29 countries)
Knowledge
Technology
DIGITAL TRENDS - OVERALL
KOREA REP.
OVERALL PERFORMANCE (63 countries)
OVERALL & FACTORS - 5 years
18 17 1914
10
2529 29 27 28
2015 2016 2017 2018 2019
Digital
Competitiveness
6 6 64 3
2015 2016 2017 2018 2019
7 7 75
2
2015 2016 2017 2018 2019
11 30 5 6
17 26 29 710
4 4 5 21
Knowledge Talent Training & education Scientific concentration
Technology Regulatory framework Capital Technological framework
Future readiness Adaptive attitudes Business agility IT integrationThe direction of the triangle indicates the performance change from the last year: improved or stabledeclined
Overall Factors Sub-Factors
N.B. This graph provides only a comparison of the country’s performance in the two rankings.

105IMD WORLD DIGITAL COMPETIT IVENESS RANKING 2019
u Overall top strengths
w Overall top weaknesses
Subfactors 2015 2016 2017 2018 201923 27 25 26 30
10 14 13 8 5
9 8 9 7 6
Talent Rank Rank Rank
Educational assessment PISA - Math 6 33 u 1w International experience 52 22 5 Foreign highly-skilled personnel 49 3 w 53 Management of cities 17 34 25 Digital/Technological skills 26 9 30 Net flow of international students 50 20 3 13
Subfactors 2015 2016 2017 2018 201923 28 28 27 26
32 35 41 44 29
2 2 2 2 7
Regulatory framework Rank Rank Rank
Starting a business 7 3 12u Enforcing contracts 2 42 10w Immigration laws 61 w 54 19w Development and application of technology50 19 16 Scientific research legislation 34 48 u 2 Intellectual property rights 37 46 19
Subfactors 2015 2016 2017 2018 20198 8 10 3 4
38 43 48 47 5
17 21 23 20 21
Adaptive attitudes Rank Rank Rank
u E-Participation 1 43 3u Internet retailing 1 3 41 Tablet possession 13 28 23 Smartphone possession 17 40 20 Attitudes toward globalization 19 35
Scientific concentration
Training & education Scientific concentration
Talent
Robots in Education and R&D
FUTURE READINESS
IT integration
Business agility IT integration
FACTORS BREAKDOWN - STRENGTHS AND WEAKNESSES
KOREA REP.
TECHNOLOGY
Technological framework
Capital Technological framework
Opportunities and threats E-GovernmentWorld robots distribution Public-private partnerships
Total expenditure on R&D (%)Total public expenditure on education Total R&D personnel per capita
Training & education
Adaptive attitudes
Business agility
Venture capital Internet bandwidth speedInvestment in Telecommunications High-tech exports (%)
Regulatory framework
Capital
IT & media stock market capitalization Communications technologyFunding for technological development Mobile Broadband subscribersBanking and financial services Wireless broadbandCountry credit rating Internet users
Higher education achievement Female researchersPupil-teacher ratio (tertiary education) R&D productivity by publicationGraduates in Sciences Scientific and technical employmentWomen with degrees High-tech patent grants
Employee training
KNOWLEDGE
Agility of companies Cyber securityUse of big data and analytics Sofware piracyKnowledge transfer

IMD WORLD DIGITAL COMPETIT IVENESS RANKING 2019106
Alpha AlphaLabelBeta BetaLabel Gamma GammaLabel1 2 2 2 2 2 24 4 4 2 2
6.5 4 4 2 28.5 4 4 2 2
10.5 4 4 2 2
2015 2016 2017 2018 2019
34 33 35 35 36
32 33 34 34 36
32 33 32 32 23
37 39 41 39 45
OVERALL
Future readiness
COMPETITIVENESS & DIGITAL RANKINGS
PEER GROUPS RANKINGS
EUROPE - MIDDLE EAST - AFRICA (40 countries) POPULATIONS < 20 MILLION (34 countries)
Knowledge
Technology
DIGITAL TRENDS - OVERALL
LATVIA
OVERALL PERFORMANCE (63 countries)
OVERALL & FACTORS - 5 years
34 33 35 35 3643 37 40 40 40
2015 2016 2017 2018 2019
Digital
Competitiveness
23 2324 24
25
2015 2016 2017 2018 2019
22 2223 23 23
2015 2016 2017 2018 2019
36 32 27 47
23 30 35 1436
45 52 47 44
Knowledge Talent Training & education Scientific concentration
Technology Regulatory framework Capital Technological framework
Future readiness Adaptive attitudes Business agility IT integrationThe direction of the triangle indicates the performance change from the last year: improved or stabledeclined
Overall Factors Sub-Factors
N.B. This graph provides only a comparison of the country’s performance in the two rankings.
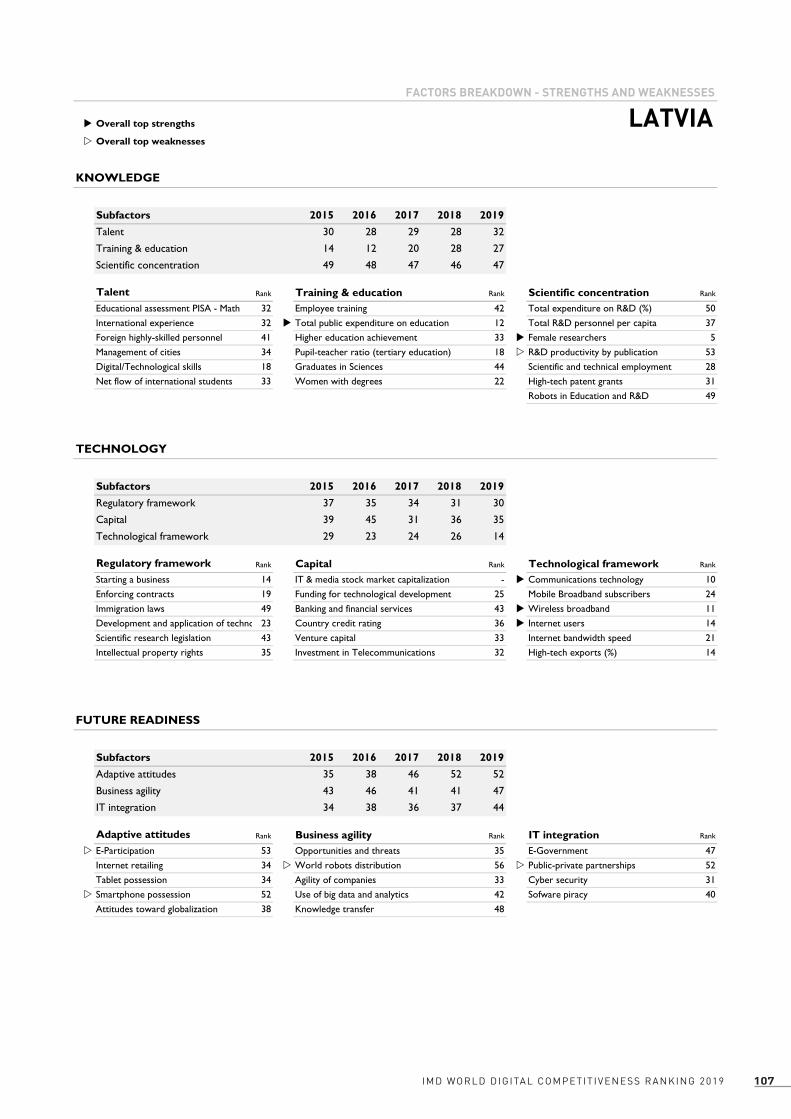
107IMD WORLD DIGITAL COMPETIT IVENESS RANKING 2019
u Overall top strengths
w Overall top weaknesses
Subfactors 2015 2016 2017 2018 201930 28 29 28 32
14 12 20 28 27
49 48 47 46 47
Talent Rank Rank Rank
Educational assessment PISA - Math 32 42 50 International experience 32 u 12 37 Foreign highly-skilled personnel 41 33 u 5 Management of cities 34 18 w 53 Digital/Technological skills 18 44 28 Net flow of international students 33 22 31 49
Subfactors 2015 2016 2017 2018 201937 35 34 31 30
39 45 31 36 35
29 23 24 26 14
Regulatory framework Rank Rank Rank
Starting a business 14 - u 10 Enforcing contracts 19 25 24 Immigration laws 49 43 u 11 Development and application of technology23 36 u 14 Scientific research legislation 43 33 21 Intellectual property rights 35 32 14
Subfactors 2015 2016 2017 2018 201935 38 46 52 52
43 46 41 41 47
34 38 36 37 44
Adaptive attitudes Rank Rank Rank
w E-Participation 53 35 47 Internet retailing 34 w 56 w 52 Tablet possession 34 33 31w Smartphone possession 52 42 40 Attitudes toward globalization 38 48
Technological framework
Talent
Robots in Education and R&D
Scientific concentration
Training & education Scientific concentration
FUTURE READINESS
IT integration
Business agility IT integration
FACTORS BREAKDOWN - STRENGTHS AND WEAKNESSES
LATVIA
TECHNOLOGY
Technological framework
Capital
Opportunities and threats E-GovernmentWorld robots distribution Public-private partnerships
Total expenditure on R&D (%)Total public expenditure on education Total R&D personnel per capita
Training & education
Adaptive attitudes
Business agility
Venture capital Internet bandwidth speedInvestment in Telecommunications High-tech exports (%)
Regulatory framework
Capital
IT & media stock market capitalization Communications technologyFunding for technological development Mobile Broadband subscribersBanking and financial services Wireless broadbandCountry credit rating Internet users
Higher education achievement Female researchersPupil-teacher ratio (tertiary education) R&D productivity by publicationGraduates in Sciences Scientific and technical employmentWomen with degrees High-tech patent grants
Employee training
KNOWLEDGE
Agility of companies Cyber securityUse of big data and analytics Sofware piracyKnowledge transfer

IMD WORLD DIGITAL COMPETIT IVENESS RANKING 2019108
Alpha AlphaLabelBeta BetaLabel Gamma GammaLabel1 2 2 2 2 2 24 4 4 2 2
6.5 4 4 2 28.5 4 4 2 2
10.5 4 4 2 2
2015 2016 2017 2018 2019
28 29 29 29 30
18 18 21 23 26
28 29 29 30 25
34 33 31 33 32
OVERALL
Future readiness
COMPETITIVENESS & DIGITAL RANKINGS
PEER GROUPS RANKINGS
EUROPE - MIDDLE EAST - AFRICA (40 countries) POPULATIONS < 20 MILLION (34 countries)
Knowledge
Technology
DIGITAL TRENDS - OVERALL
LITHUANIA
OVERALL PERFORMANCE (63 countries)
OVERALL & FACTORS - 5 years
2829 29 29
30
28
3033
32
29
2015 2016 2017 2018 2019
Digital
Competitiveness
1819 19 19 19
2015 2016 2017 2018 2019
1819 19 19
18
2015 2016 2017 2018 2019
26 23 13 41
25 24 36 2130
32 45 18 32
Knowledge Talent Training & education Scientific concentration
Technology Regulatory framework Capital Technological framework
Future readiness Adaptive attitudes Business agility IT integrationThe direction of the triangle indicates the performance change from the last year: improved or stabledeclined
Overall Factors Sub-Factors
N.B. This graph provides only a comparison of the country’s performance in the two rankings.

109IMD WORLD DIGITAL COMPETIT IVENESS RANKING 2019
u Overall top strengths
w Overall top weaknesses
Subfactors 2015 2016 2017 2018 201928 29 33 27 23
3 5 6 16 13
25 24 28 31 41
Talent Rank Rank Rank
Educational assessment PISA - Math 33 21 41 International experience 15 26 31 Foreign highly-skilled personnel 39 11 u 6 Management of cities 27 12 w 55u Digital/Technological skills 1 29 32w Net flow of international students 54 16 30 46
Subfactors 2015 2016 2017 2018 201928 24 27 28 24
30 37 42 35 36
28 25 17 22 21
Regulatory framework Rank Rank Rank
Starting a business 18 - u 4u Enforcing contracts 7 28 34w Immigration laws 53 38 39 Development and application of technology30 33 32 Scientific research legislation 27 21 17 Intellectual property rights 27 w 48 32
Subfactors 2015 2016 2017 2018 201936 37 35 41 45
42 39 28 24 18
28 29 29 31 32
Adaptive attitudes Rank Rank Rank
E-Participation 45 7 34 Internet retailing 29 46 25 Tablet possession 46 u 4 15w Smartphone possession 56 11 43 Attitudes toward globalization 28 25
Scientific concentration
Training & education Scientific concentration
Talent
Robots in Education and R&D
FUTURE READINESS
IT integration
Business agility IT integration
FACTORS BREAKDOWN - STRENGTHS AND WEAKNESSES
LITHUANIA
TECHNOLOGY
Technological framework
Capital Technological framework
Opportunities and threats E-GovernmentWorld robots distribution Public-private partnerships
Total expenditure on R&D (%)Total public expenditure on education Total R&D personnel per capita
Training & education
Adaptive attitudes
Business agility
Venture capital Internet bandwidth speedInvestment in Telecommunications High-tech exports (%)
Regulatory framework
Capital
IT & media stock market capitalization Communications technologyFunding for technological development Mobile Broadband subscribersBanking and financial services Wireless broadbandCountry credit rating Internet users
Higher education achievement Female researchersPupil-teacher ratio (tertiary education) R&D productivity by publicationGraduates in Sciences Scientific and technical employmentWomen with degrees High-tech patent grants
Employee training
KNOWLEDGE
Agility of companies Cyber securityUse of big data and analytics Sofware piracyKnowledge transfer

IMD WORLD DIGITAL COMPETIT IVENESS RANKING 2019110
Alpha AlphaLabelBeta BetaLabel Gamma GammaLabel1 2 2 2 2 2 24 4 4 2 2
6.5 4 4 2 28.5 4 4 2 2
10.5 4 4 2 2
2015 2016 2017 2018 2019
16 21 20 24 21
23 29 27 32 34
2 11 12 15 12
23 24 23 21 17
OVERALL
Future readiness
COMPETITIVENESS & DIGITAL RANKINGS
PEER GROUPS RANKINGS
EUROPE - MIDDLE EAST - AFRICA (40 countries) POPULATIONS < 20 MILLION (34 countries)
Knowledge
Technology
DIGITAL TRENDS - OVERALL
LUXEMBOURG
OVERALL PERFORMANCE (63 countries)
OVERALL & FACTORS - 5 years
1621 20
2421
611
811 12
2015 2016 2017 2018 2019
Digital
Competitiveness
913 12 15 13
2015 2016 2017 2018 2019
11 14 13 16 14
2015 2016 2017 2018 2019
34 31 24 42
12 4 9 3421
17 22 20 6
Knowledge Talent Training & education Scientific concentration
Technology Regulatory framework Capital Technological framework
Future readiness Adaptive attitudes Business agility IT integrationThe direction of the triangle indicates the performance change from the last year: improved or stabledeclined
Overall Factors Sub-Factors
N.B. This graph provides only a comparison of the country’s performance in the two rankings.

111IMD WORLD DIGITAL COMPETIT IVENESS RANKING 2019
u Overall top strengths
w Overall top weaknesses
Subfactors 2015 2016 2017 2018 201927 33 31 33 31
13 29 30 26 24
27 25 23 44 42
Talent Rank Rank Rank
Educational assessment PISA - Math 31 12 31 International experience 8 30 6 Foreign highly-skilled personnel 6 15 44 Management of cities 12 7 w 61 Digital/Technological skills 37 w 55 26w Net flow of international students 60 24 23 -
Subfactors 2015 2016 2017 2018 20194 8 10 9 4
1 3 3 4 9
22 28 32 35 34
Regulatory framework Rank Rank Rank
Starting a business 35 u 1 16 Enforcing contracts 14 14 w 55u Immigration laws 2 21 40 Development and application of technology16 u 1 9u Scientific research legislation 4 29 9 Intellectual property rights 16 w 54 51
Subfactors 2015 2016 2017 2018 201934 34 33 29 22
17 19 16 17 20
7 12 5 13 6
Adaptive attitudes Rank Rank Rank
E-Participation 19 21 18 Internet retailing - - 13 Tablet possession - 14 9 Smartphone possession - 32 u 4 Attitudes toward globalization 26 21
Scientific concentration
Training & education Scientific concentration
Talent
Robots in Education and R&D
FUTURE READINESS
IT integration
Business agility IT integration
FACTORS BREAKDOWN - STRENGTHS AND WEAKNESSES
LUXEMBOURG
TECHNOLOGY
Technological framework
Capital Technological framework
Opportunities and threats E-GovernmentWorld robots distribution Public-private partnerships
Total expenditure on R&D (%)Total public expenditure on education Total R&D personnel per capita
Training & education
Adaptive attitudes
Business agility
Venture capital Internet bandwidth speedInvestment in Telecommunications High-tech exports (%)
Regulatory framework
Capital
IT & media stock market capitalization Communications technologyFunding for technological development Mobile Broadband subscribersBanking and financial services Wireless broadbandCountry credit rating Internet users
Higher education achievement Female researchersPupil-teacher ratio (tertiary education) R&D productivity by publicationGraduates in Sciences Scientific and technical employmentWomen with degrees High-tech patent grants
Employee training
KNOWLEDGE
Agility of companies Cyber securityUse of big data and analytics Sofware piracyKnowledge transfer

IMD WORLD DIGITAL COMPETIT IVENESS RANKING 2019112
Alpha AlphaLabelBeta BetaLabel Gamma GammaLabel1 2 2 2 2 2 24 4 4 2 2
6.5 4 4 2 28.5 4 4 2 2
10.5 4 4 2 2
2015 2016 2017 2018 2019
21 24 24 27 26
25 22 17 17 19
14 16 18 22 19
27 28 27 29 28
OVERALL
Future readiness
COMPETITIVENESS & DIGITAL RANKINGS
PEER GROUPS RANKINGS
ASIA - PACIFIC (14 countries) POPULATIONS > 20 MILLION (29 countries)
Knowledge
Technology
DIGITAL TRENDS - OVERALL
MALAYSIA
OVERALL PERFORMANCE (63 countries)
OVERALL & FACTORS - 5 years
2124 24
27 26
1419
24 2222
2015 2016 2017 2018 2019
Digital
Competitiveness
7 8 7 8 9
2015 2016 2017 2018 2019
9 10 8 10 11
2015 2016 2017 2018 2019
19 22 11 27
19 29 14 2026
28 30 17 33
Knowledge Talent Training & education Scientific concentration
Technology Regulatory framework Capital Technological framework
Future readiness Adaptive attitudes Business agility IT integrationThe direction of the triangle indicates the performance change from the last year: improved or stabledeclined
Overall Factors Sub-Factors
N.B. This graph provides only a comparison of the country’s performance in the two rankings.

113IMD WORLD DIGITAL COMPETIT IVENESS RANKING 2019
u Overall top strengths
w Overall top weaknesses
Subfactors 2015 2016 2017 2018 201926 26 27 24 22
17 11 3 10 11
28 27 26 30 27
Talent Rank Rank Rank
w Educational assessment PISA - Math 41 18 24 International experience 12 33 36 Foreign highly-skilled personnel 16 37 10 Management of cities 20 29 27 Digital/Technological skills 21 u 6 w 41 Net flow of international students 23 u 4 18 19
Subfactors 2015 2016 2017 2018 201921 21 30 29 29
7 7 9 12 14
17 21 19 32 20
Regulatory framework Rank Rank Rank
w Starting a business 52 22 38 Enforcing contracts 28 18 29 Immigration laws 19 19 15 Development and application of technology20 36 41 Scientific research legislation 25 20 36 Intellectual property rights 28 u 6 u 4
Subfactors 2015 2016 2017 2018 201927 29 28 30 30
15 17 12 15 17
29 30 34 35 33
Adaptive attitudes Rank Rank Rank
E-Participation 31 14 40w Internet retailing 48 22 u 9 Tablet possession 26 19 20 Smartphone possession 27 9 w 45 Attitudes toward globalization 16 20
Technological framework
Capital Technological framework
Scientific concentration
Training & education Scientific concentration
Talent
Robots in Education and R&D
FUTURE READINESS
IT integration
Business agility IT integration
FACTORS BREAKDOWN - STRENGTHS AND WEAKNESSES
MALAYSIA
Opportunities and threats E-GovernmentWorld robots distribution Public-private partnerships
Total expenditure on R&D (%)Total public expenditure on education Total R&D personnel per capita
TECHNOLOGY
Training & education
Adaptive attitudes
Business agility
Venture capital Internet bandwidth speedInvestment in Telecommunications High-tech exports (%)
Regulatory framework
Capital
IT & media stock market capitalization Communications technologyFunding for technological development Mobile Broadband subscribersBanking and financial services Wireless broadbandCountry credit rating Internet users
Higher education achievement Female researchersPupil-teacher ratio (tertiary education) R&D productivity by publicationGraduates in Sciences Scientific and technical employmentWomen with degrees High-tech patent grants
Employee training
KNOWLEDGE
Agility of companies Cyber securityUse of big data and analytics Sofware piracyKnowledge transfer

IMD WORLD DIGITAL COMPETIT IVENESS RANKING 2019114
Alpha AlphaLabelBeta BetaLabel Gamma GammaLabel1 2 2 2 2 2 24 4 4 2 2
6.5 4 4 2 28.5 4 4 2 2
10.5 4 4 2 2
2015 2016 2017 2018 2019
48 52 49 51 49
51 52 54 54 52
47 49 48 46 52
54 56 50 50 49
OVERALL
Future readiness
COMPETITIVENESS & DIGITAL RANKINGS
PEER GROUPS RANKINGS
THE AMERICAS (9 countries) POPULATIONS > 20 MILLION (29 countries)
Knowledge
Technology
DIGITAL TRENDS - OVERALL
MEXICO
OVERALL PERFORMANCE (63 countries)
OVERALL & FACTORS - 5 years
48 52 49 51 49
3945 48
5150
2015 2016 2017 2018 2019
Digital
Competitiveness
4 4 4 4 4
2015 2016 2017 2018 2019
1920 20 20 20
2015 2016 2017 2018 2019
52 55 53 40
52 48 47 5349
49 47 51 53
Knowledge Talent Training & education Scientific concentration
Technology Regulatory framework Capital Technological framework
Future readiness Adaptive attitudes Business agility IT integrationThe direction of the triangle indicates the performance change from the last year: improved or stabledeclined
Overall Factors Sub-Factors
N.B. This graph provides only a comparison of the country’s performance in the two rankings.

115IMD WORLD DIGITAL COMPETIT IVENESS RANKING 2019
u Overall top strengths
w Overall top weaknesses
Subfactors 2015 2016 2017 2018 201944 51 53 52 55
43 42 44 51 53
57 56 57 53 40
Talent Rank Rank Rank
Educational assessment PISA - Math 50 49 53 International experience 22 56 54 Foreign highly-skilled personnel 31 53 30 Management of cities 55 u 15 u 16w Digital/Technological skills 58 22 - Net flow of international students 36 52 52 u 11
Subfactors 2015 2016 2017 2018 201941 42 39 45 48
40 44 45 42 47
51 52 52 50 53
Regulatory framework Rank Rank Rank
Starting a business 43 u 16 w 58 Enforcing contracts 33 56 39 Immigration laws 35 52 w 58 Development and application of technology56 40 57 Scientific research legislation 55 53 53 Intellectual property rights 53 36 17
Subfactors 2015 2016 2017 2018 201953 53 40 40 47
57 58 55 57 51
45 49 52 53 53
Adaptive attitudes Rank Rank Rank
E-Participation 17 w 58 49 Internet retailing 49 u 11 47 Tablet possession 49 53 w 59 Smartphone possession 56 56 42 Attitudes toward globalization 35 53
Scientific concentration
Training & education Scientific concentration
Talent
Robots in Education and R&D
FUTURE READINESS
IT integration
Business agility IT integration
FACTORS BREAKDOWN - STRENGTHS AND WEAKNESSES
MEXICO
TECHNOLOGY
Technological framework
Capital Technological framework
Opportunities and threats E-GovernmentWorld robots distribution Public-private partnerships
Total expenditure on R&D (%)Total public expenditure on education Total R&D personnel per capita
Training & education
Adaptive attitudes
Business agility
Venture capital Internet bandwidth speedInvestment in Telecommunications High-tech exports (%)
Regulatory framework
Capital
IT & media stock market capitalization Communications technologyFunding for technological development Mobile Broadband subscribersBanking and financial services Wireless broadbandCountry credit rating Internet users
Higher education achievement Female researchersPupil-teacher ratio (tertiary education) R&D productivity by publicationGraduates in Sciences Scientific and technical employmentWomen with degrees High-tech patent grants
Employee training
KNOWLEDGE
Agility of companies Cyber securityUse of big data and analytics Sofware piracyKnowledge transfer

IMD WORLD DIGITAL COMPETIT IVENESS RANKING 2019116
Alpha AlphaLabelBeta BetaLabel Gamma GammaLabel1 2 2 2 2 2 24 4 4 2 2
6.5 4 4 2 28.5 4 4 2 2
10.5 4 4 2 2
2015 2016 2017 2018 2019
55 57 61 61 62
56 55 59 53 62
54 55 61 62 62
46 52 60 59 61
OVERALL
Future readiness
COMPETITIVENESS & DIGITAL RANKINGS
PEER GROUPS RANKINGS
ASIA - PACIFIC (14 countries) POPULATIONS < 20 MILLION (34 countries)
Knowledge
Technology
DIGITAL TRENDS - OVERALL
MONGOLIA
OVERALL PERFORMANCE (63 countries)
OVERALL & FACTORS - 5 years
5557
61 61 62
57 60
62 6262
2015 2016 2017 2018 2019
Digital
Competitiveness
13 1314
1314
2015 2016 2017 2018 2019
33 3334 34 34
2015 2016 2017 2018 2019
62 60 45 60
62 62 58 5862
61 31 63 62
Knowledge Talent Training & education Scientific concentration
Technology Regulatory framework Capital Technological framework
Future readiness Adaptive attitudes Business agility IT integrationThe direction of the triangle indicates the performance change from the last year: improved or stabledeclined
Overall Factors Sub-Factors
N.B. This graph provides only a comparison of the country’s performance in the two rankings.

117IMD WORLD DIGITAL COMPETIT IVENESS RANKING 2019
u Overall top strengths
w Overall top weaknesses
Subfactors 2015 2016 2017 2018 201956 57 62 60 60
35 36 38 24 45
59 60 60 60 60
Talent Rank Rank Rank
Educational assessment PISA - Math - u 24 60 International experience 61 34 47 Foreign highly-skilled personnel 56 44 u 9 Management of cities 62 46 w 62 Digital/Technological skills 56 48 46 Net flow of international students 56 32 w 63 -
Subfactors 2015 2016 2017 2018 201950 53 57 58 62
54 52 61 55 58
53 53 59 61 58
Regulatory framework Rank Rank Rank
Starting a business 41 - 56 Enforcing contracts 44 62 58 Immigration laws 54 60 45 Development and application of technology61 61 w 62 Scientific research legislation 62 60 50 Intellectual property rights 62 u 3 u 15
Subfactors 2015 2016 2017 2018 201930 32 39 31 31
48 54 63 61 63
58 58 62 62 62
Adaptive attitudes Rank Rank Rank
E-Participation 48 61 57 Internet retailing - - 62 Tablet possession - 61 w 63u Smartphone possession 6 57 - Attitudes toward globalization 56 w 63
Training & education Scientific concentration
Talent
Robots in Education and R&D
FUTURE READINESS
IT integration
Business agility IT integration
Scientific concentration
Capital Technological framework
TECHNOLOGY
Technological framework
FACTORS BREAKDOWN - STRENGTHS AND WEAKNESSES
MONGOLIA
Opportunities and threats E-GovernmentWorld robots distribution Public-private partnerships
Total expenditure on R&D (%)Total public expenditure on education Total R&D personnel per capita
Training & education
Adaptive attitudes
Business agility
Venture capital Internet bandwidth speedInvestment in Telecommunications High-tech exports (%)
Regulatory framework
Capital
IT & media stock market capitalization Communications technologyFunding for technological development Mobile Broadband subscribersBanking and financial services Wireless broadbandCountry credit rating Internet users
Higher education achievement Female researchersPupil-teacher ratio (tertiary education) R&D productivity by publicationGraduates in Sciences Scientific and technical employmentWomen with degrees High-tech patent grants
Employee training
KNOWLEDGE
Agility of companies Cyber securityUse of big data and analytics Sofware piracyKnowledge transfer

IMD WORLD DIGITAL COMPETIT IVENESS RANKING 2019118
Alpha AlphaLabelBeta BetaLabel Gamma GammaLabel1 2 2 2 2 2 24 4 4 2 2
6.5 4 4 2 28.5 4 4 2 2
10.5 4 4 2 2
2015 2016 2017 2018 2019
6 4 6 9 6
14 13 11 12 13
15 10 9 8 6
1 2 3 4 3
OVERALL
Future readiness
COMPETITIVENESS & DIGITAL RANKINGS
PEER GROUPS RANKINGS
EUROPE - MIDDLE EAST - AFRICA (40 countries) POPULATIONS < 20 MILLION (34 countries)
Knowledge
Technology
DIGITAL TRENDS - OVERALL
NETHERLANDS
OVERALL PERFORMANCE (63 countries)
OVERALL & FACTORS - 5 years
64
6
9
6
15
8
54
6
2015 2016 2017 2018 2019
Digital
Competitiveness
3 24
64
2015 2016 2017 2018 2019
4 35
75
2015 2016 2017 2018 2019
13 3 36 19
6 6 5 106
3 9 7 3
Knowledge Talent Training & education Scientific concentration
Technology Regulatory framework Capital Technological framework
Future readiness Adaptive attitudes Business agility IT integrationThe direction of the triangle indicates the performance change from the last year: improved or stabledeclined
Overall Factors Sub-Factors
N.B. This graph provides only a comparison of the country’s performance in the two rankings.

119IMD WORLD DIGITAL COMPETIT IVENESS RANKING 2019
u Overall top strengths
w Overall top weaknesses
Subfactors 2015 2016 2017 2018 20195 4 3 3 3
33 33 32 31 36
15 16 18 16 19
Talent Rank Rank Rank
Educational assessment PISA - Math 10 8 17u International experience 3 18 12 Foreign highly-skilled personnel 4 22 w 48 Management of cities 4 24 24 Digital/Technological skills 5 w 60 12 Net flow of international students 9 30 16 27
Subfactors 2015 2016 2017 2018 201917 14 9 10 6
12 9 5 7 5
16 13 14 14 10
Regulatory framework Rank Rank Rank
Starting a business 12 8 u 3w Enforcing contracts 46 6 15u Immigration laws 3 5 w 34 Development and application of technology5 u 1 4 Scientific research legislation 9 4 8 Intellectual property rights 5 w 44 12
Subfactors 2015 2016 2017 2018 20193 3 5 7 9
3 2 7 12 7
5 2 3 7 3
Adaptive attitudes Rank Rank Rank
E-Participation 4 10 13 Internet retailing 6 18 3 Tablet possession 13 10 8 Smartphone possession 24 10 13 Attitudes toward globalization 6 u 2
Scientific concentration
Training & education Scientific concentration
Talent
Robots in Education and R&D
FUTURE READINESS
IT integration
Business agility IT integration
FACTORS BREAKDOWN - STRENGTHS AND WEAKNESSES
NETHERLANDS
Opportunities and threats E-GovernmentWorld robots distribution Public-private partnerships
Total expenditure on R&D (%)Total public expenditure on education Total R&D personnel per capita
TECHNOLOGY
Technological framework
Capital Technological framework
Training & education
Adaptive attitudes
Business agility
Venture capital Internet bandwidth speedInvestment in Telecommunications High-tech exports (%)
Regulatory framework
Capital
IT & media stock market capitalization Communications technologyFunding for technological development Mobile Broadband subscribersBanking and financial services Wireless broadbandCountry credit rating Internet users
Higher education achievement Female researchersPupil-teacher ratio (tertiary education) R&D productivity by publicationGraduates in Sciences Scientific and technical employmentWomen with degrees High-tech patent grants
Employee training
KNOWLEDGE
Agility of companies Cyber securityUse of big data and analytics Sofware piracyKnowledge transfer

IMD WORLD DIGITAL COMPETIT IVENESS RANKING 2019120
Alpha AlphaLabelBeta BetaLabel Gamma GammaLabel1 2 2 2 2 2 24 4 4 2 2
6.5 4 4 2 28.5 4 4 2 2
10.5 4 4 2 2
2015 2016 2017 2018 2019
13 10 14 19 18
15 14 20 21 21
8 6 11 16 15
16 15 20 18 20
OVERALL
Future readiness
COMPETITIVENESS & DIGITAL RANKINGS
PEER GROUPS RANKINGS
ASIA - PACIFIC (14 countries) POPULATIONS < 20 MILLION (34 countries)
Knowledge
Technology
DIGITAL TRENDS - OVERALL
NEW ZEALAND
OVERALL PERFORMANCE (63 countries)
OVERALL & FACTORS - 5 years
1310
14
19 1817
1616
23 21
2015 2016 2017 2018 2019
Digital
Competitiveness
3 24
6 6
2015 2016 2017 2018 2019
9 8 10 12 11
2015 2016 2017 2018 2019
21 11 34 26
15 11 15 2518
20 13 32 10
Knowledge Talent Training & education Scientific concentration
Technology Regulatory framework Capital Technological framework
Future readiness Adaptive attitudes Business agility IT integrationThe direction of the triangle indicates the performance change from the last year: improved or stabledeclined
Overall Factors Sub-Factors
N.B. This graph provides only a comparison of the country’s performance in the two rankings.

121IMD WORLD DIGITAL COMPETIT IVENESS RANKING 2019
u Overall top strengths
w Overall top weaknesses
Subfactors 2015 2016 2017 2018 20199 9 14 16 11
30 32 36 37 34
18 17 20 15 26
Talent Rank Rank Rank
Educational assessment PISA - Math 20 36 29 International experience 24 16 22 Foreign highly-skilled personnel 15 28 - Management of cities 33 38 w 43 Digital/Technological skills 35 40 u 1u Net flow of international students 2 26 w 48 w 46
Subfactors 2015 2016 2017 2018 20192 1 7 13 11
3 4 4 14 15
23 20 20 25 25
Regulatory framework Rank Rank Rank
u Starting a business 1 24 27 Enforcing contracts 20 34 31 Immigration laws 22 12 21 Development and application of technology14 14 23 Scientific research legislation 21 35 20 Intellectual property rights 20 12 w 42
Subfactors 2015 2016 2017 2018 201922 24 20 14 13
16 14 26 35 32
8 6 17 17 10
Adaptive attitudes Rank Rank Rank
u E-Participation 5 26 8 Internet retailing 18 w 42 32 Tablet possession 19 29 25 Smartphone possession 17 21 u 2 Attitudes toward globalization 21 23
Training & education Scientific concentration
Talent
Robots in Education and R&D
FUTURE READINESS
IT integration
Business agility IT integration
Scientific concentration
Capital Technological framework
TECHNOLOGY
Technological framework
FACTORS BREAKDOWN - STRENGTHS AND WEAKNESSES
NEW ZEALAND
Opportunities and threats E-GovernmentWorld robots distribution Public-private partnerships
Total expenditure on R&D (%)Total public expenditure on education Total R&D personnel per capita
Training & education
Adaptive attitudes
Business agility
Venture capital Internet bandwidth speedInvestment in Telecommunications High-tech exports (%)
Regulatory framework
Capital
IT & media stock market capitalization Communications technologyFunding for technological development Mobile Broadband subscribersBanking and financial services Wireless broadbandCountry credit rating Internet users
Higher education achievement Female researchersPupil-teacher ratio (tertiary education) R&D productivity by publicationGraduates in Sciences Scientific and technical employmentWomen with degrees High-tech patent grants
Employee training
KNOWLEDGE
Agility of companies Cyber securityUse of big data and analytics Sofware piracyKnowledge transfer

IMD WORLD DIGITAL COMPETIT IVENESS RANKING 2019122
Alpha AlphaLabelBeta BetaLabel Gamma GammaLabel1 2 2 2 2 2 24 4 4 2 2
6.5 4 4 2 28.5 4 4 2 2
10.5 4 4 2 2
2015 2016 2017 2018 2019
11 9 10 6 9
17 17 15 16 16
3 3 2 2 3
14 13 12 6 8
OVERALL
Future readiness
COMPETITIVENESS & DIGITAL RANKINGS
PEER GROUPS RANKINGS
EUROPE - MIDDLE EAST - AFRICA (40 countries) POPULATIONS < 20 MILLION (34 countries)
Knowledge
Technology
DIGITAL TRENDS - OVERALL
NORWAY
OVERALL PERFORMANCE (63 countries)
OVERALL & FACTORS - 5 years
119
10
6
97
9
11
8
11
2015 2016 2017 2018 2019
Digital
Competitiveness
7 6 64
6
2015 2016 2017 2018 2019
8 7 85
8
2015 2016 2017 2018 2019
16 16 17 21
3 3 7 69
8 5 23 9
Knowledge Talent Training & education Scientific concentration
Technology Regulatory framework Capital Technological framework
Future readiness Adaptive attitudes Business agility IT integrationThe direction of the triangle indicates the performance change from the last year: improved or stabledeclined
Overall Factors Sub-Factors
N.B. This graph provides only a comparison of the country’s performance in the two rankings.

123IMD WORLD DIGITAL COMPETIT IVENESS RANKING 2019
u Overall top strengths
w Overall top weaknesses
Subfactors 2015 2016 2017 2018 201916 20 20 20 16
11 15 12 11 17
24 23 22 20 21
Talent Rank Rank Rank
Educational assessment PISA - Math 18 6 16 International experience 18 15 8 Foreign highly-skilled personnel 12 17 24 Management of cities 10 9 w 45 Digital/Technological skills 12 w 45 15w Net flow of international students 53 15 29 30
Subfactors 2015 2016 2017 2018 20191 5 3 1 3
11 8 7 2 7
7 4 3 3 6
Regulatory framework Rank Rank Rank
Starting a business 12 11 19u Enforcing contracts 3 12 7 Immigration laws 8 10 17 Development and application of technology13 u 1 u 2 Scientific research legislation 12 10 u 4 Intellectual property rights 15 w 31 13
Subfactors 2015 2016 2017 2018 20197 7 8 8 5
27 28 20 14 23
14 9 14 9 9
Adaptive attitudes Rank Rank Rank
E-Participation 11 17 14 Internet retailing 7 w 41 10 Tablet possession 5 11 24u Smartphone possession 3 15 10 Attitudes toward globalization 23 18
Talent
Robots in Education and R&D
Scientific concentration
Training & education Scientific concentration
FUTURE READINESS
IT integration
Business agility IT integration
FACTORS BREAKDOWN - STRENGTHS AND WEAKNESSES
NORWAY
Opportunities and threats E-GovernmentWorld robots distribution Public-private partnerships
Total expenditure on R&D (%)Total public expenditure on education Total R&D personnel per capita
TECHNOLOGY
Technological framework
Capital Technological framework
Training & education
Adaptive attitudes
Business agility
Venture capital Internet bandwidth speedInvestment in Telecommunications High-tech exports (%)
Regulatory framework
Capital
IT & media stock market capitalization Communications technologyFunding for technological development Mobile Broadband subscribersBanking and financial services Wireless broadbandCountry credit rating Internet users
Higher education achievement Female researchersPupil-teacher ratio (tertiary education) R&D productivity by publicationGraduates in Sciences Scientific and technical employmentWomen with degrees High-tech patent grants
Employee training
KNOWLEDGE
Agility of companies Cyber securityUse of big data and analytics Sofware piracyKnowledge transfer

IMD WORLD DIGITAL COMPETIT IVENESS RANKING 2019124
Alpha AlphaLabelBeta BetaLabel Gamma GammaLabel1 2 2 2 2 2 24 4 4 2 2
6.5 4 4 2 28.5 4 4 2 2
10.5 4 4 2 2
2015 2016 2017 2018 2019
57 58 62 60 61
58 61 62 60 61
52 53 57 57 58
56 55 58 60 59
OVERALL
Future readiness
COMPETITIVENESS & DIGITAL RANKINGS
PEER GROUPS RANKINGS
THE AMERICAS (9 countries) POPULATIONS > 20 MILLION (29 countries)
Knowledge
Technology
DIGITAL TRENDS - OVERALL
PERU
OVERALL PERFORMANCE (63 countries)
OVERALL & FACTORS - 5 years
57 58
6260 61
54 54 55 54 55
2015 2016 2017 2018 2019
Digital
Competitiveness
78 8 8 8
2015 2016 2017 2018 2019
24 2528 27 28
2015 2016 2017 2018 2019
61 59 42 62
58 50 45 6161
59 49 59 59
Knowledge Talent Training & education Scientific concentration
Technology Regulatory framework Capital Technological framework
Future readiness Adaptive attitudes Business agility IT integrationThe direction of the triangle indicates the performance change from the last year: improved or stabledeclined
Overall Factors Sub-Factors
N.B. This graph provides only a comparison of the country’s performance in the two rankings.

125IMD WORLD DIGITAL COMPETIT IVENESS RANKING 2019
u Overall top strengths
w Overall top weaknesses
Subfactors 2015 2016 2017 2018 201958 60 61 58 59
58 58 60 43 42
59 63 62 62
Talent Rank Rank Rank
Educational assessment PISA - Math 53 w 61 w 62 International experience 44 42 58u Foreign highly-skilled personnel 26 u 7 39w Management of cities 61 43 36 Digital/Technological skills 59 30 52 Net flow of international students - 37 w 61 43
Subfactors 2015 2016 2017 2018 201948 49 51 49 50
38 40 48 47 45
58 60 61 59 61
Regulatory framework Rank Rank Rank
Starting a business 54 34 59 Enforcing contracts 45 58 52u Immigration laws 6 44 59 Development and application of technology58 39 55 Scientific research legislation 57 42 56 Intellectual property rights 54 u 20 57
Subfactors 2015 2016 2017 2018 201950 52 61 59 49
53 49 50 50 59
55 56 59 59 59
Adaptive attitudes Rank Rank Rank
E-Participation 34 51 55 Internet retailing 57 54 50 Tablet possession 54 49 w 61 Smartphone possession 47 59 53u Attitudes toward globalization 20 54
Scientific concentration
Training & education Scientific concentration
Talent
Robots in Education and R&D
FUTURE READINESS
IT integration
Business agility IT integration
FACTORS BREAKDOWN - STRENGTHS AND WEAKNESSES
PERU
TECHNOLOGY
Technological framework
Capital Technological framework
Opportunities and threats E-GovernmentWorld robots distribution Public-private partnerships
Total expenditure on R&D (%)Total public expenditure on education Total R&D personnel per capita
Training & education
Adaptive attitudes
Business agility
Venture capital Internet bandwidth speedInvestment in Telecommunications High-tech exports (%)
Regulatory framework
Capital
IT & media stock market capitalization Communications technologyFunding for technological development Mobile Broadband subscribersBanking and financial services Wireless broadbandCountry credit rating Internet users
Higher education achievement Female researchersPupil-teacher ratio (tertiary education) R&D productivity by publicationGraduates in Sciences Scientific and technical employmentWomen with degrees High-tech patent grants
Employee training
KNOWLEDGE
Agility of companies Cyber securityUse of big data and analytics Sofware piracyKnowledge transfer

IMD WORLD DIGITAL COMPETIT IVENESS RANKING 2019126
Alpha AlphaLabelBeta BetaLabel Gamma GammaLabel1 2 2 2 2 2 24 4 4 2 2
6.5 4 4 2 28.5 4 4 2 2
10.5 4 4 2 2
2015 2016 2017 2018 2019
45 46 46 56 55
49 50 53 50 51
50 50 51 58 55
40 40 43 52 54
OVERALL
Future readiness
COMPETITIVENESS & DIGITAL RANKINGS
PEER GROUPS RANKINGS
ASIA - PACIFIC (14 countries) POPULATIONS > 20 MILLION (29 countries)
Knowledge
Technology
DIGITAL TRENDS - OVERALL
PHILIPPINES
OVERALL PERFORMANCE (63 countries)
OVERALL & FACTORS - 5 years
45 46 4656 55
41 42 4150 46
2015 2016 2017 2018 2019
Digital
Competitiveness
11 11 1112 12
2015 2016 2017 2018 2019
17 17 1823 22
2015 2016 2017 2018 2019
51 41 54 54
55 60 40 5155
54 53 42 58
Knowledge Talent Training & education Scientific concentration
Technology Regulatory framework Capital Technological framework
Future readiness Adaptive attitudes Business agility IT integrationThe direction of the triangle indicates the performance change from the last year: improved or stabledeclined
Overall Factors Sub-Factors
N.B. This graph provides only a comparison of the country’s performance in the two rankings.

127IMD WORLD DIGITAL COMPETIT IVENESS RANKING 2019
u Overall top strengths
w Overall top weaknesses
Subfactors 2015 2016 2017 2018 201932 32 39 48 41
57 55 54 52 54
46 49 53 50 54
Talent Rank Rank Rank
Educational assessment PISA - Math - 27 w 59 International experience 31 49 57 Foreign highly-skilled personnel 32 54 u 7 Management of cities 53 55 34 Digital/Technological skills 48 u 13 48 Net flow of international students 35 49 u 12 52
Subfactors 2015 2016 2017 2018 201958 59 62 61 60
33 28 29 43 40
47 48 50 52 51
Regulatory framework Rank Rank Rank
w Starting a business 62 40 w 62w Enforcing contracts 61 53 51 Immigration laws 20 29 41 Development and application of technology46 43 58 Scientific research legislation 46 43 w 62 Intellectual property rights 56 u 15 u 1
Subfactors 2015 2016 2017 2018 201948 46 50 60 53
23 23 23 31 42
56 57 57 57 58
Adaptive attitudes Rank Rank Rank
E-Participation 19 28 54 Internet retailing 59 40 35 Tablet possession 55 34 49 Smartphone possession 58 39 55 Attitudes toward globalization 25 41
Technological framework
Capital Technological framework
Scientific concentration
Training & education Scientific concentration
Talent
Robots in Education and R&D
FUTURE READINESS
IT integration
Business agility IT integration
FACTORS BREAKDOWN - STRENGTHS AND WEAKNESSES
PHILIPPINES
TECHNOLOGY
Opportunities and threats E-GovernmentWorld robots distribution Public-private partnerships
Total expenditure on R&D (%)Total public expenditure on education Total R&D personnel per capita
Training & education
Adaptive attitudes
Business agility
Venture capital Internet bandwidth speedInvestment in Telecommunications High-tech exports (%)
Regulatory framework
Capital
IT & media stock market capitalization Communications technologyFunding for technological development Mobile Broadband subscribersBanking and financial services Wireless broadbandCountry credit rating Internet users
Higher education achievement Female researchersPupil-teacher ratio (tertiary education) R&D productivity by publicationGraduates in Sciences Scientific and technical employmentWomen with degrees High-tech patent grants
Employee training
KNOWLEDGE
Agility of companies Cyber securityUse of big data and analytics Sofware piracyKnowledge transfer
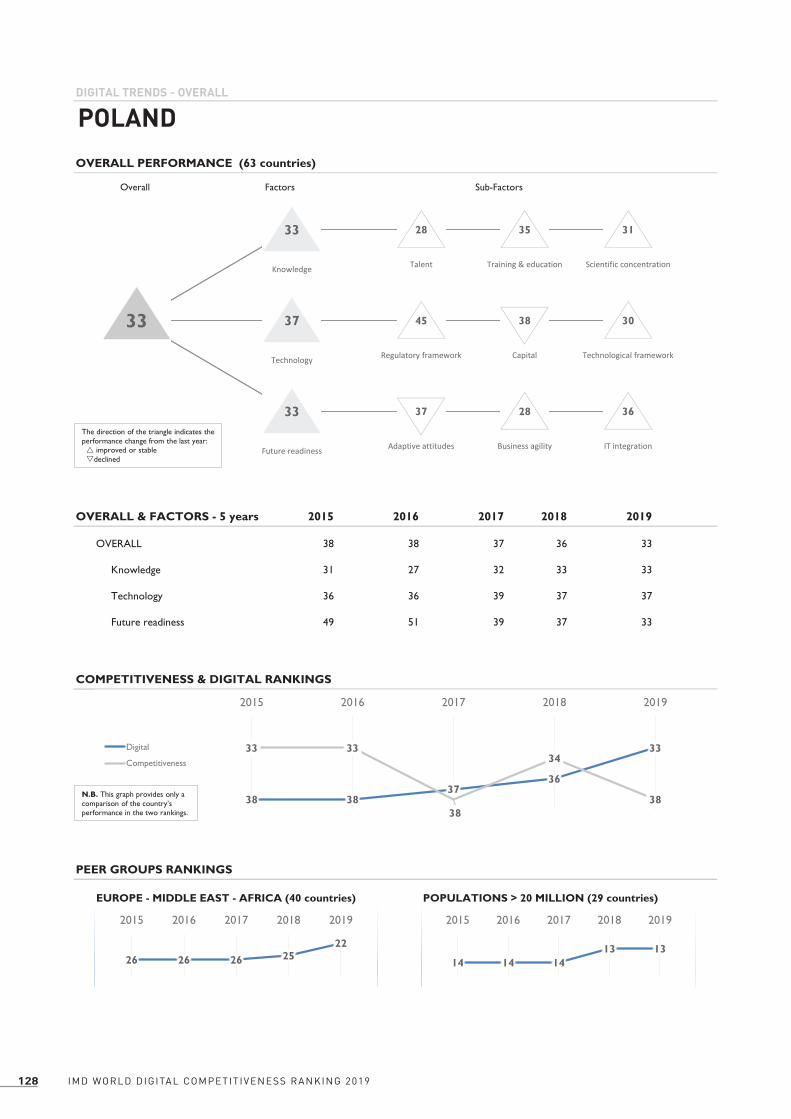
IMD WORLD DIGITAL COMPETIT IVENESS RANKING 2019128
Alpha AlphaLabelBeta BetaLabel Gamma GammaLabel1 2 2 2 2 2 24 4 4 2 2
6.5 4 4 2 28.5 4 4 2 2
10.5 4 4 2 2
2015 2016 2017 2018 2019
38 38 37 36 33
31 27 32 33 33
36 36 39 37 37
49 51 39 37 33
OVERALL
Future readiness
COMPETITIVENESS & DIGITAL RANKINGS
PEER GROUPS RANKINGS
EUROPE - MIDDLE EAST - AFRICA (40 countries) POPULATIONS > 20 MILLION (29 countries)
Knowledge
Technology
DIGITAL TRENDS - OVERALL
POLAND
OVERALL PERFORMANCE (63 countries)
OVERALL & FACTORS - 5 years
38 3837
36
3333 33
38
34
38
2015 2016 2017 2018 2019
Digital
Competitiveness
26 26 26 2522
2015 2016 2017 2018 2019
14 14 1413 13
2015 2016 2017 2018 2019
33 28 35 31
37 45 38 3033
33 37 28 36
Knowledge Talent Training & education Scientific concentration
Technology Regulatory framework Capital Technological framework
Future readiness Adaptive attitudes Business agility IT integrationThe direction of the triangle indicates the performance change from the last year: improved or stabledeclined
Overall Factors Sub-Factors
N.B. This graph provides only a comparison of the country’s performance in the two rankings.

129IMD WORLD DIGITAL COMPETIT IVENESS RANKING 2019
u Overall top strengths
w Overall top weaknesses
Subfactors 2015 2016 2017 2018 201922 17 28 30 28
34 22 23 35 35
41 39 40 38 31
Talent Rank Rank Rank
u Educational assessment PISA - Math 16 23 36 International experience 25 25 34 Foreign highly-skilled personnel 45 29 28 Management of cities 25 42 u 12 Digital/Technological skills 46 35 33 Net flow of international students 26 33 36 u 16
Subfactors 2015 2016 2017 2018 201938 45 47 46 45
28 32 32 32 38
34 39 39 37 30
Regulatory framework Rank Rank Rank
w Starting a business 51 35 39 Enforcing contracts 39 40 40w Immigration laws 50 22 u 3 Development and application of technology42 34 38 Scientific research legislation 40 23 30 Intellectual property rights 38 42 45
Subfactors 2015 2016 2017 2018 201952 51 38 33 37
55 55 45 40 28
41 41 41 40 36
Adaptive attitudes Rank Rank Rank
E-Participation 30 27 29 Internet retailing 33 21 w 48 Tablet possession 32 u 17 40w Smartphone possession 46 27 36w Attitudes toward globalization 51 38
TECHNOLOGY
Technological framework
Capital Technological framework
Scientific concentration
Training & education Scientific concentration
Talent
Robots in Education and R&D
FUTURE READINESS
IT integration
Business agility IT integration
FACTORS BREAKDOWN - STRENGTHS AND WEAKNESSES
POLAND
Opportunities and threats E-GovernmentWorld robots distribution Public-private partnerships
Total expenditure on R&D (%)Total public expenditure on education Total R&D personnel per capita
Training & education
Adaptive attitudes
Business agility
Venture capital Internet bandwidth speedInvestment in Telecommunications High-tech exports (%)
Regulatory framework
Capital
IT & media stock market capitalization Communications technologyFunding for technological development Mobile Broadband subscribersBanking and financial services Wireless broadbandCountry credit rating Internet users
Higher education achievement Female researchersPupil-teacher ratio (tertiary education) R&D productivity by publicationGraduates in Sciences Scientific and technical employmentWomen with degrees High-tech patent grants
Employee training
KNOWLEDGE
Agility of companies Cyber securityUse of big data and analytics Sofware piracyKnowledge transfer

IMD WORLD DIGITAL COMPETIT IVENESS RANKING 2019130
Alpha AlphaLabelBeta BetaLabel Gamma GammaLabel1 2 2 2 2 2 24 4 4 2 2
6.5 4 4 2 28.5 4 4 2 2
10.5 4 4 2 2
2015 2016 2017 2018 2019
29 31 33 32 34
29 31 31 27 31
30 35 37 36 38
31 31 35 32 34
OVERALL
Future readiness
COMPETITIVENESS & DIGITAL RANKINGS
PEER GROUPS RANKINGS
EUROPE - MIDDLE EAST - AFRICA (40 countries) POPULATIONS < 20 MILLION (34 countries)
Knowledge
Technology
DIGITAL TRENDS - OVERALL
PORTUGAL
OVERALL PERFORMANCE (63 countries)
OVERALL & FACTORS - 5 years
29 31 33 32 34
36 39 3933
39
2015 2016 2017 2018 2019
Digital
Competitiveness
19 21 22 21 23
2015 2016 2017 2018 2019
1920
2120
21
2015 2016 2017 2018 2019
31 26 39 32
38 21 48 4534
34 32 52 29
Knowledge Talent Training & education Scientific concentration
Technology Regulatory framework Capital Technological framework
Future readiness Adaptive attitudes Business agility IT integrationThe direction of the triangle indicates the performance change from the last year: improved or stabledeclined
Overall Factors Sub-Factors
N.B. This graph provides only a comparison of the country’s performance in the two rankings.
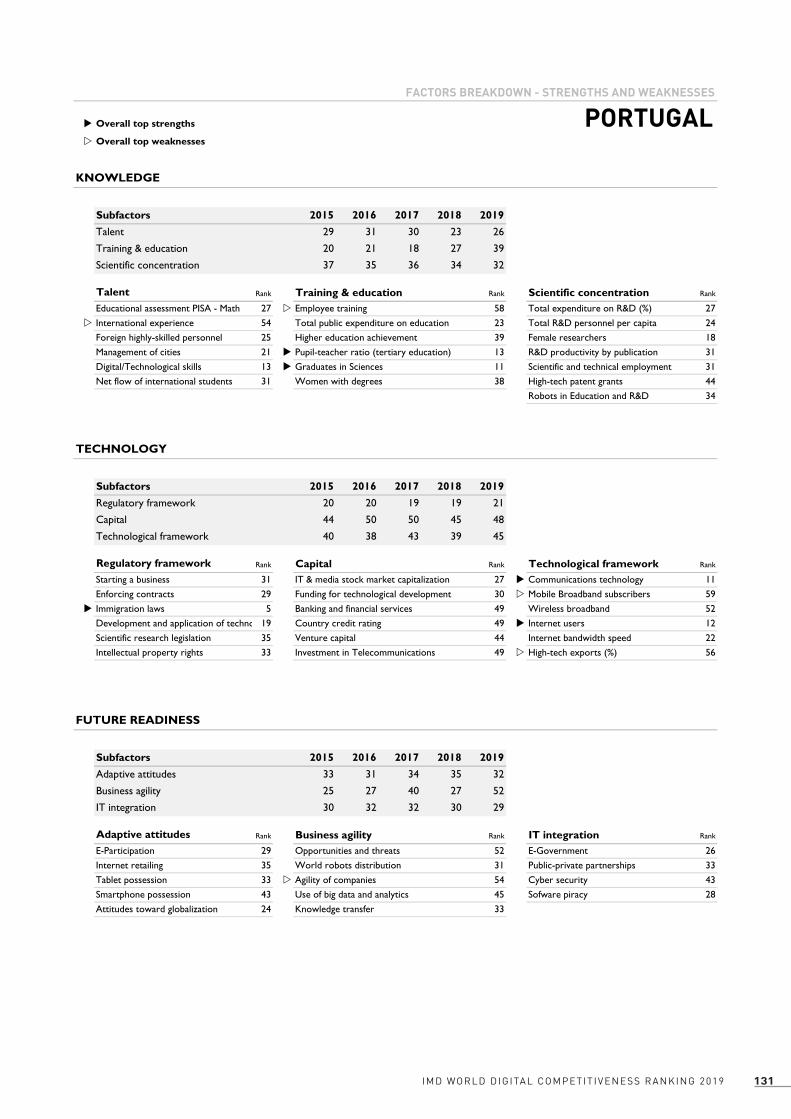
131IMD WORLD DIGITAL COMPETIT IVENESS RANKING 2019
u Overall top strengths
w Overall top weaknesses
Subfactors 2015 2016 2017 2018 201929 31 30 23 26
20 21 18 27 39
37 35 36 34 32
Talent Rank Rank Rank
Educational assessment PISA - Math 27 w 58 27w International experience 54 23 24 Foreign highly-skilled personnel 25 39 18 Management of cities 21 u 13 31 Digital/Technological skills 13 u 11 31 Net flow of international students 31 38 44 34
Subfactors 2015 2016 2017 2018 201920 20 19 19 21
44 50 50 45 48
40 38 43 39 45
Regulatory framework Rank Rank Rank
Starting a business 31 27 u 11 Enforcing contracts 29 30 w 59u Immigration laws 5 49 52 Development and application of technology19 49 u 12 Scientific research legislation 35 44 22 Intellectual property rights 33 49 w 56
Subfactors 2015 2016 2017 2018 201933 31 34 35 32
25 27 40 27 52
30 32 32 30 29
Adaptive attitudes Rank Rank Rank
E-Participation 29 52 26 Internet retailing 35 31 33 Tablet possession 33 w 54 43 Smartphone possession 43 45 28 Attitudes toward globalization 24 33
TECHNOLOGY
Technological framework
Capital Technological framework
Scientific concentration
Training & education Scientific concentration
Talent
Robots in Education and R&D
FUTURE READINESS
IT integration
Business agility IT integration
FACTORS BREAKDOWN - STRENGTHS AND WEAKNESSES
PORTUGAL
Opportunities and threats E-GovernmentWorld robots distribution Public-private partnerships
Total expenditure on R&D (%)Total public expenditure on education Total R&D personnel per capita
Training & education
Adaptive attitudes
Business agility
Venture capital Internet bandwidth speedInvestment in Telecommunications High-tech exports (%)
Regulatory framework
Capital
IT & media stock market capitalization Communications technologyFunding for technological development Mobile Broadband subscribersBanking and financial services Wireless broadbandCountry credit rating Internet users
Higher education achievement Female researchersPupil-teacher ratio (tertiary education) R&D productivity by publicationGraduates in Sciences Scientific and technical employmentWomen with degrees High-tech patent grants
Employee training
KNOWLEDGE
Agility of companies Cyber securityUse of big data and analytics Sofware piracyKnowledge transfer

IMD WORLD DIGITAL COMPETIT IVENESS RANKING 2019132
Alpha AlphaLabelBeta BetaLabel Gamma GammaLabel1 2 2 2 2 2 24 4 4 2 2
6.5 4 4 2 28.5 4 4 2 2
10.5 4 4 2 2
2015 2016 2017 2018 2019
32 28 28 28 31
39 37 35 37 45
38 31 31 27 33
28 21 19 16 22
OVERALL
Future readiness
COMPETITIVENESS & DIGITAL RANKINGS
PEER GROUPS RANKINGS
EUROPE - MIDDLE EAST - AFRICA (40 countries) POPULATIONS < 20 MILLION (34 countries)
Knowledge
Technology
DIGITAL TRENDS - OVERALL
QATAR
OVERALL PERFORMANCE (63 countries)
OVERALL & FACTORS - 5 years
3228 28 28
31
13 1317
1410
2015 2016 2017 2018 2019
Digital
Competitiveness
22 18 18 18 20
2015 2016 2017 2018 2019
21
18 18 1819
2015 2016 2017 2018 2019
45 15 48 61
33 28 23 3831
22 18 12 27
Knowledge Talent Training & education Scientific concentration
Technology Regulatory framework Capital Technological framework
Future readiness Adaptive attitudes Business agility IT integrationThe direction of the triangle indicates the performance change from the last year: improved or stabledeclined
Overall Factors Sub-Factors
N.B. This graph provides only a comparison of the country’s performance in the two rankings.

133IMD WORLD DIGITAL COMPETIT IVENESS RANKING 2019
u Overall top strengths
w Overall top weaknesses
Subfactors 2015 2016 2017 2018 201934 25 19 15 15
24 27 24 38 48
53 54 55 59 61
Talent Rank Rank Rank
Educational assessment PISA - Math 51 16 49u International experience 4 w 58 48 Foreign highly-skilled personnel 9 w 56 40 Management of cities 8 26 56 Digital/Technological skills 6 34 45 Net flow of international students 17 - 35 54
Subfactors 2015 2016 2017 2018 201946 33 31 32 28
25 18 17 24 23
36 42 36 30 38
Regulatory framework Rank Rank Rank
Starting a business 39 - 13w Enforcing contracts 56 8 35 Immigration laws 15 17 12 Development and application of technology9 22 36 Scientific research legislation 13 16 35 Intellectual property rights 22 56 w 61
Subfactors 2015 2016 2017 2018 201910 12 15 16 18
32 26 15 8 12
37 28 27 26 27
Adaptive attitudes Rank Rank Rank
E-Participation 49 6 42 Internet retailing 47 w 58 7u Tablet possession 1 8 u 3u Smartphone possession 1 u 2 38 Attitudes toward globalization 15 13
TECHNOLOGY
Technological framework
Capital Technological framework
Scientific concentration
Training & education Scientific concentration
Talent
Robots in Education and R&D
FUTURE READINESS
IT integration
Business agility IT integration
FACTORS BREAKDOWN - STRENGTHS AND WEAKNESSES
QATAR
Opportunities and threats E-GovernmentWorld robots distribution Public-private partnerships
Total expenditure on R&D (%)Total public expenditure on education Total R&D personnel per capita
Training & education
Adaptive attitudes
Business agility
Venture capital Internet bandwidth speedInvestment in Telecommunications High-tech exports (%)
Regulatory framework
Capital
IT & media stock market capitalization Communications technologyFunding for technological development Mobile Broadband subscribersBanking and financial services Wireless broadbandCountry credit rating Internet users
Higher education achievement Female researchersPupil-teacher ratio (tertiary education) R&D productivity by publicationGraduates in Sciences Scientific and technical employmentWomen with degrees High-tech patent grants
Employee training
KNOWLEDGE
Agility of companies Cyber securityUse of big data and analytics Sofware piracyKnowledge transfer

IMD WORLD DIGITAL COMPETIT IVENESS RANKING 2019134
Alpha AlphaLabelBeta BetaLabel Gamma GammaLabel1 2 2 2 2 2 24 4 4 2 2
6.5 4 4 2 28.5 4 4 2 2
10.5 4 4 2 2
2015 2016 2017 2018 2019
51 49 54 47 46
50 48 47 45 47
45 46 46 44 45
57 57 59 57 51
OVERALL
Future readiness
COMPETITIVENESS & DIGITAL RANKINGS
PEER GROUPS RANKINGS
EUROPE - MIDDLE EAST - AFRICA (40 countries) POPULATIONS < 20 MILLION (34 countries)
Knowledge
Technology
DIGITAL TRENDS - OVERALL
ROMANIA
OVERALL PERFORMANCE (63 countries)
OVERALL & FACTORS - 5 years
5149
54
47 464749 50
4949
2015 2016 2017 2018 2019
Digital
Competitiveness
35 3538
34 32
2015 2016 2017 2018 2019
31 32 3230
28
2015 2016 2017 2018 2019
47 48 51 38
45 41 59 3646
51 48 46 55
Knowledge Talent Training & education Scientific concentration
Technology Regulatory framework Capital Technological framework
Future readiness Adaptive attitudes Business agility IT integrationThe direction of the triangle indicates the performance change from the last year: improved or stabledeclined
Overall Factors Sub-Factors
N.B. This graph provides only a comparison of the country’s performance in the two rankings.

135IMD WORLD DIGITAL COMPETIT IVENESS RANKING 2019
u Overall top strengths
w Overall top weaknesses
Subfactors 2015 2016 2017 2018 201949 49 45 45 48
48 45 52 50 51
43 42 41 43 38
Talent Rank Rank Rank
Educational assessment PISA - Math 42 43 51 International experience 42 w 59 45 Foreign highly-skilled personnel 46 50 u 13w Management of cities 59 49 u 20 Digital/Technological skills 23 u 12 42 Net flow of international students 44 - 27 36
Subfactors 2015 2016 2017 2018 201929 31 41 39 41
58 58 60 62 59
37 36 33 31 36
Regulatory framework Rank Rank Rank
Starting a business 47 47 32u Enforcing contracts 16 45 47 Immigration laws 45 w 55 43 Development and application of technology48 51 43 Scientific research legislation 47 51 u 6 Intellectual property rights 45 50 39
Subfactors 2015 2016 2017 2018 201958 59 60 46 48
59 56 60 60 46
47 42 58 58 55
Adaptive attitudes Rank Rank Rank
w E-Participation 51 49 51 Internet retailing 40 35 w 60 Tablet possession 36 43 32 Smartphone possession 39 34 51 Attitudes toward globalization 49 50
TECHNOLOGY
Technological framework
Capital Technological framework
Scientific concentration
Training & education Scientific concentration
Talent
Robots in Education and R&D
FUTURE READINESS
IT integration
Business agility IT integration
FACTORS BREAKDOWN - STRENGTHS AND WEAKNESSES
ROMANIA
Opportunities and threats E-GovernmentWorld robots distribution Public-private partnerships
Total expenditure on R&D (%)Total public expenditure on education Total R&D personnel per capita
Training & education
Adaptive attitudes
Business agility
Venture capital Internet bandwidth speedInvestment in Telecommunications High-tech exports (%)
Regulatory framework
Capital
IT & media stock market capitalization Communications technologyFunding for technological development Mobile Broadband subscribersBanking and financial services Wireless broadbandCountry credit rating Internet users
Higher education achievement Female researchersPupil-teacher ratio (tertiary education) R&D productivity by publicationGraduates in Sciences Scientific and technical employmentWomen with degrees High-tech patent grants
Employee training
KNOWLEDGE
Agility of companies Cyber securityUse of big data and analytics Sofware piracyKnowledge transfer

IMD WORLD DIGITAL COMPETIT IVENESS RANKING 2019136
Alpha AlphaLabelBeta BetaLabel Gamma GammaLabel1 2 2 2 2 2 24 4 4 2 2
6.5 4 4 2 28.5 4 4 2 2
10.5 4 4 2 2
2015 2016 2017 2018 2019
41 40 42 40 38
27 28 24 24 22
44 47 44 43 43
55 53 52 51 42
OVERALL
Future readiness
COMPETITIVENESS & DIGITAL RANKINGS
PEER GROUPS RANKINGS
EUROPE - MIDDLE EAST - AFRICA (40 countries) POPULATIONS > 20 MILLION (29 countries)
Knowledge
Technology
DIGITAL TRENDS - OVERALL
RUSSIA
OVERALL PERFORMANCE (63 countries)
OVERALL & FACTORS - 5 years
41 40 42 40 38
45 44 46 45 45
2015 2016 2017 2018 2019
Digital
Competitiveness
29
27
29
27 27
2015 2016 2017 2018 2019
15 16 17 15 14
2015 2016 2017 2018 2019
22 45 9 18
43 40 57 3938
42 40 54 43
Knowledge Talent Training & education Scientific concentration
Technology Regulatory framework Capital Technological framework
Future readiness Adaptive attitudes Business agility IT integrationThe direction of the triangle indicates the performance change from the last year: improved or stabledeclined
Overall Factors Sub-Factors
N.B. This graph provides only a comparison of the country’s performance in the two rankings.

137IMD WORLD DIGITAL COMPETIT IVENESS RANKING 2019
u Overall top strengths
w Overall top weaknesses
Subfactors 2015 2016 2017 2018 201936 37 35 40 45
19 17 14 12 9
23 26 25 23 18
Talent Rank Rank Rank
Educational assessment PISA - Math 21 45 34w International experience 59 48 23 Foreign highly-skilled personnel 54 u 9 21 Management of cities 52 10 u 5 Digital/Technological skills 42 u 7 - Net flow of international students 22 u 3 33 u 8
Subfactors 2015 2016 2017 2018 201936 36 36 38 40
56 57 57 58 57
41 35 37 38 39
Regulatory framework Rank Rank Rank
Starting a business 19 43 43 Enforcing contracts 17 51 33 Immigration laws 38 w 57 36 Development and application of technology51 52 45 Scientific research legislation 51 56 43 Intellectual property rights 52 33 34
Subfactors 2015 2016 2017 2018 201942 40 44 39 40
61 61 59 62 54
42 39 43 43 43
Adaptive attitudes Rank Rank Rank
E-Participation 23 46 28 Internet retailing 41 34 46 Tablet possession 39 w 60 44 Smartphone possession 30 31 53w Attitudes toward globalization 60 w 57
TECHNOLOGY
Technological framework
Capital Technological framework
Scientific concentration
Training & education Scientific concentration
Talent
Robots in Education and R&D
FUTURE READINESS
IT integration
Business agility IT integration
FACTORS BREAKDOWN - STRENGTHS AND WEAKNESSES
RUSSIA
Opportunities and threats E-GovernmentWorld robots distribution Public-private partnerships
Total expenditure on R&D (%)Total public expenditure on education Total R&D personnel per capita
Training & education
Adaptive attitudes
Business agility
Venture capital Internet bandwidth speedInvestment in Telecommunications High-tech exports (%)
Regulatory framework
Capital
IT & media stock market capitalization Communications technologyFunding for technological development Mobile Broadband subscribersBanking and financial services Wireless broadbandCountry credit rating Internet users
Higher education achievement Female researchersPupil-teacher ratio (tertiary education) R&D productivity by publicationGraduates in Sciences Scientific and technical employmentWomen with degrees High-tech patent grants
Employee training
KNOWLEDGE
Agility of companies Cyber securityUse of big data and analytics Sofware piracyKnowledge transfer

IMD WORLD DIGITAL COMPETIT IVENESS RANKING 2019138
Alpha AlphaLabelBeta BetaLabel Gamma GammaLabel1 2 2 2 2 2 24 4 4 2 2
6.5 4 4 2 28.5 4 4 2 2
10.5 4 4 2 2
2015 2016 2017 2018 2019
36 42 39
39 40 39
41 50 40
32 38 38
OVERALL
Future readiness
COMPETITIVENESS & DIGITAL RANKINGS
PEER GROUPS RANKINGS
EUROPE - MIDDLE EAST - AFRICA (40 countries) POPULATIONS > 20 MILLION (29 countries)
Knowledge
Technology
DIGITAL TRENDS - OVERALL
SAUDI ARABIA
OVERALL PERFORMANCE (63 countries)
OVERALL & FACTORS - 5 years
3642 393639
26
2015 2016 2017 2018 2019
Digital
Competitiveness
25
29 28
2015 2016 2017 2018 2019
1317 15
2015 2016 2017 2018 2019
39 20 38 59
40 39 13 5439
38 50 36 30
Knowledge Talent Training & education Scientific concentration
Technology Regulatory framework Capital Technological framework
Future readiness Adaptive attitudes Business agility IT integrationThe direction of the triangle indicates the performance change from the last year: improved or stabledeclined
Overall Factors Sub-Factors
N.B. This graph provides only a comparison of the country’s performance in the two rankings.

139IMD WORLD DIGITAL COMPETIT IVENESS RANKING 2019
u Overall top strengths
w Overall top weaknesses
Subfactors 2015 2016 2017 2018 201922 38 20
16 39 38
61 49 59
Talent Rank Rank Rank
Educational assessment PISA - Math - 32 43u International experience 11 u 1 -u Foreign highly-skilled personnel 14 50 49 Management of cities 29 51 33 Digital/Technological skills 20 38 - Net flow of international students 41 46 51 w 54
Subfactors 2015 2016 2017 2018 201948 50 39
36 31 13
41 56 54
Regulatory framework Rank Rank Rank
w Starting a business 61 - 31 Enforcing contracts 43 22 w 56 Immigration laws 37 20 28 Development and application of technology18 27 47 Scientific research legislation 29 25 51 Intellectual property rights 34 u 10 w 59
Subfactors 2015 2016 2017 2018 201929 43 50
38 48 36
31 33 30
Adaptive attitudes Rank Rank Rank
E-Participation 49 42 43 Internet retailing 45 w 52 14 Tablet possession 44 27 u 7 Smartphone possession 41 22 38 Attitudes toward globalization 29 28
TECHNOLOGY
Technological framework
Capital Technological framework
Scientific concentration
Training & education Scientific concentration
Talent
Robots in Education and R&D
FUTURE READINESS
IT integration
Business agility IT integration
FACTORS BREAKDOWN - STRENGTHS AND WEAKNESSES
SAUDI ARABIA
Opportunities and threats E-GovernmentWorld robots distribution Public-private partnerships
Total expenditure on R&D (%)Total public expenditure on education Total R&D personnel per capita
Training & education
Adaptive attitudes
Business agility
Venture capital Internet bandwidth speedInvestment in Telecommunications High-tech exports (%)
Regulatory framework
Capital
IT & media stock market capitalization Communications technologyFunding for technological development Mobile Broadband subscribersBanking and financial services Wireless broadbandCountry credit rating Internet users
Higher education achievement Female researchersPupil-teacher ratio (tertiary education) R&D productivity by publicationGraduates in Sciences Scientific and technical employmentWomen with degrees High-tech patent grants
Employee training
KNOWLEDGE
Agility of companies Cyber securityUse of big data and analytics Sofware piracyKnowledge transfer
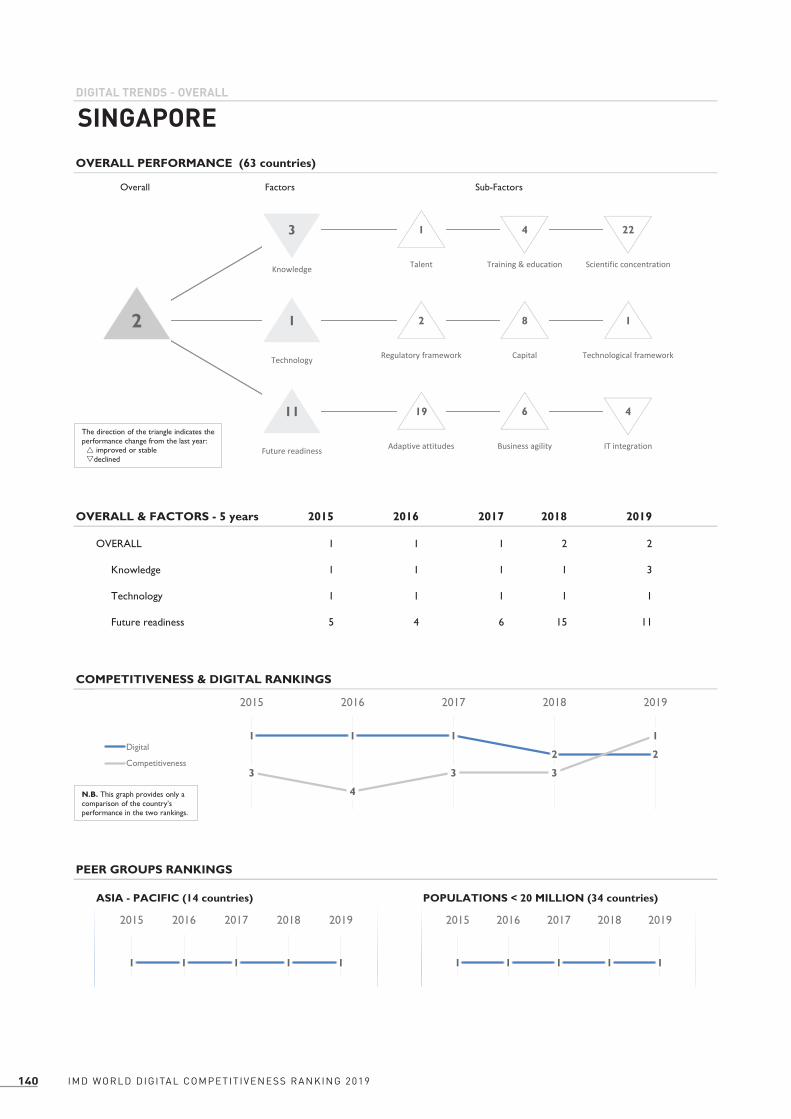
IMD WORLD DIGITAL COMPETIT IVENESS RANKING 2019140
Alpha AlphaLabelBeta BetaLabel Gamma GammaLabel1 2 2 2 2 2 24 4 4 2 2
6.5 4 4 2 28.5 4 4 2 2
10.5 4 4 2 2
2015 2016 2017 2018 2019
1 1 1 2 2
1 1 1 1 3
1 1 1 1 1
5 4 6 15 11
OVERALL
Future readiness
COMPETITIVENESS & DIGITAL RANKINGS
PEER GROUPS RANKINGS
ASIA - PACIFIC (14 countries) POPULATIONS < 20 MILLION (34 countries)
Knowledge
Technology
DIGITAL TRENDS - OVERALL
SINGAPORE
OVERALL PERFORMANCE (63 countries)
OVERALL & FACTORS - 5 years
1 1 1
2 2
3
4
3 3
1
2015 2016 2017 2018 2019
Digital
Competitiveness
1 1 1 1 1
2015 2016 2017 2018 2019
1 1 1 1 1
2015 2016 2017 2018 2019
3 1 4 22
1 2 8 12
11 19 6 4
Knowledge Talent Training & education Scientific concentration
Technology Regulatory framework Capital Technological framework
Future readiness Adaptive attitudes Business agility IT integrationThe direction of the triangle indicates the performance change from the last year: improved or stabledeclined
Overall Factors Sub-Factors
N.B. This graph provides only a comparison of the country’s performance in the two rankings.

141IMD WORLD DIGITAL COMPETIT IVENESS RANKING 2019
u Overall top strengths
w Overall top weaknesses
Subfactors 2015 2016 2017 2018 20191 1 1 1 1
5 9 9 1 4
13 11 8 19 22
Talent Rank Rank Rank
u Educational assessment PISA - Math 1 28 18 International experience 9 w 60 13 Foreign highly-skilled personnel 2 2 w 42u Management of cities 1 31 w 44 Digital/Technological skills 8 2 w 51 Net flow of international students 7 - u 1 32
Subfactors 2015 2016 2017 2018 20193 2 1 2 2
10 10 14 8 8
1 1 1 1 1
Regulatory framework Rank Rank Rank
Starting a business 2 26 5u Enforcing contracts 1 1 1w Immigration laws 48 2 5 Development and application of technology1 1 1 Scientific research legislation 1 5 u 1 Intellectual property rights 6 40 2
Subfactors 2015 2016 2017 2018 201912 11 11 20 19
12 13 14 18 6
1 1 1 3 4
Adaptive attitudes Rank Rank Rank
E-Participation 13 9 7 Internet retailing 26 15 2 Tablet possession 15 7 6 Smartphone possession 32 15 17 Attitudes toward globalization 2 5
TECHNOLOGY
Technological framework
Capital Technological framework
Scientific concentration
Training & education Scientific concentration
Talent
Robots in Education and R&D
FUTURE READINESS
IT integration
Business agility IT integration
FACTORS BREAKDOWN - STRENGTHS AND WEAKNESSES
SINGAPORE
Opportunities and threats E-GovernmentWorld robots distribution Public-private partnerships
Total expenditure on R&D (%)Total public expenditure on education Total R&D personnel per capita
Training & education
Adaptive attitudes
Business agility
Venture capital Internet bandwidth speedInvestment in Telecommunications High-tech exports (%)
Regulatory framework
Capital
IT & media stock market capitalization Communications technologyFunding for technological development Mobile Broadband subscribersBanking and financial services Wireless broadbandCountry credit rating Internet users
Higher education achievement Female researchersPupil-teacher ratio (tertiary education) R&D productivity by publicationGraduates in Sciences Scientific and technical employmentWomen with degrees High-tech patent grants
Employee training
KNOWLEDGE
Agility of companies Cyber securityUse of big data and analytics Sofware piracyKnowledge transfer

IMD WORLD DIGITAL COMPETIT IVENESS RANKING 2019142
Alpha AlphaLabelBeta BetaLabel Gamma GammaLabel1 2 2 2 2 2 24 4 4 2 2
6.5 4 4 2 28.5 4 4 2 2
10.5 4 4 2 2
2015 2016 2017 2018 2019
43 41 43 50 47
43 41 43 49 48
40 41 43 47 44
44 43 46 53 47
OVERALL
Future readiness
COMPETITIVENESS & DIGITAL RANKINGS
PEER GROUPS RANKINGS
EUROPE - MIDDLE EAST - AFRICA (40 countries) POPULATIONS < 20 MILLION (34 countries)
Knowledge
Technology
DIGITAL TRENDS - OVERALL
SLOVAK REPUBLIC
OVERALL PERFORMANCE (63 countries)
OVERALL & FACTORS - 5 years
43 41 4350 47
46
40
51 55 53
2015 2016 2017 2018 2019
Digital
Competitiveness
30 28 30 36 33
2015 2016 2017 2018 2019
27 25 26 31 29
2015 2016 2017 2018 2019
48 54 52 36
44 58 43 3747
47 42 61 40
Knowledge Talent Training & education Scientific concentration
Technology Regulatory framework Capital Technological framework
Future readiness Adaptive attitudes Business agility IT integrationThe direction of the triangle indicates the performance change from the last year: improved or stabledeclined
Overall Factors Sub-Factors
N.B. This graph provides only a comparison of the country’s performance in the two rankings.

143IMD WORLD DIGITAL COMPETIT IVENESS RANKING 2019
u Overall top strengths
w Overall top weaknesses
Subfactors 2015 2016 2017 2018 201950 48 50 56 54
40 35 40 47 52
45 44 39 42 36
Talent Rank Rank Rank
Educational assessment PISA - Math 35 54 40 International experience 56 44 33w Foreign highly-skilled personnel 60 38 u 19 Management of cities 45 33 38u Digital/Technological skills 25 41 35 Net flow of international students 57 40 28 33
Subfactors 2015 2016 2017 2018 201952 52 55 60 58
41 34 39 46 43
33 33 38 34 37
Regulatory framework Rank Rank Rank
Starting a business 55 - 29 Enforcing contracts 35 w 61 44 Immigration laws 59 50 37w Development and application of technology60 29 u 27 Scientific research legislation 58 50 29 Intellectual property rights 59 u 16 35
Subfactors 2015 2016 2017 2018 201939 39 52 51 42
56 53 52 58 61
38 34 37 45 40
Adaptive attitudes Rank Rank Rank
E-Participation 44 w 60 41 Internet retailing 31 28 55 Tablet possession 38 58 57 Smartphone possession 36 48 u 26 Attitudes toward globalization 59 w 60
TECHNOLOGY
Technological framework
Capital Technological framework
Scientific concentration
Training & education Scientific concentration
Talent
Robots in Education and R&D
FUTURE READINESS
IT integration
Business agility IT integration
FACTORS BREAKDOWN - STRENGTHS AND WEAKNESSES
SLOVAK REPUBLIC
Opportunities and threats E-GovernmentWorld robots distribution Public-private partnerships
Total expenditure on R&D (%)Total public expenditure on education Total R&D personnel per capita
Training & education
Adaptive attitudes
Business agility
Venture capital Internet bandwidth speedInvestment in Telecommunications High-tech exports (%)
Regulatory framework
Capital
IT & media stock market capitalization Communications technologyFunding for technological development Mobile Broadband subscribersBanking and financial services Wireless broadbandCountry credit rating Internet users
Higher education achievement Female researchersPupil-teacher ratio (tertiary education) R&D productivity by publicationGraduates in Sciences Scientific and technical employmentWomen with degrees High-tech patent grants
Employee training
KNOWLEDGE
Agility of companies Cyber securityUse of big data and analytics Sofware piracyKnowledge transfer

IMD WORLD DIGITAL COMPETIT IVENESS RANKING 2019144
Alpha AlphaLabelBeta BetaLabel Gamma GammaLabel1 2 2 2 2 2 24 4 4 2 2
6.5 4 4 2 28.5 4 4 2 2
10.5 4 4 2 2
2015 2016 2017 2018 2019
39 36 34 34 32
28 26 26 26 27
43 40 40 38 35
41 35 36 35 36
OVERALL
Future readiness
COMPETITIVENESS & DIGITAL RANKINGS
PEER GROUPS RANKINGS
EUROPE - MIDDLE EAST - AFRICA (40 countries) POPULATIONS < 20 MILLION (34 countries)
Knowledge
Technology
DIGITAL TRENDS - OVERALL
SLOVENIA
OVERALL PERFORMANCE (63 countries)
OVERALL & FACTORS - 5 years
39 36 34 34 32
49 43 4337 37
2015 2016 2017 2018 2019
Digital
Competitiveness
27 25 23 23 21
2015 2016 2017 2018 2019
25 23 22 22 20
2015 2016 2017 2018 2019
27 33 22 25
35 37 31 3332
36 44 34 31
Knowledge Talent Training & education Scientific concentration
Technology Regulatory framework Capital Technological framework
Future readiness Adaptive attitudes Business agility IT integrationThe direction of the triangle indicates the performance change from the last year: improved or stabledeclined
Overall Factors Sub-Factors
N.B. This graph provides only a comparison of the country’s performance in the two rankings.

145IMD WORLD DIGITAL COMPETIT IVENESS RANKING 2019
u Overall top strengths
w Overall top weaknesses
Subfactors 2015 2016 2017 2018 201943 39 37 35 33
18 16 17 23 22
20 20 24 25 25
Talent Rank Rank Rank
u Educational assessment PISA - Math 13 26 20 International experience 49 28 15w Foreign highly-skilled personnel 53 26 32 Management of cities 30 14 w 59 Digital/Technological skills 16 25 25 Net flow of international students 37 27 u 7 29
Subfactors 2015 2016 2017 2018 201949 44 44 42 37
46 41 40 29 31
42 41 44 45 33
Regulatory framework Rank Rank Rank
Starting a business 22 29 18w Enforcing contracts 53 31 u 12 Immigration laws 29 35 51 Development and application of technology40 34 33 Scientific research legislation 28 46 27 Intellectual property rights 26 u 9 w 52
Subfactors 2015 2016 2017 2018 201945 45 37 44 44
49 37 43 30 34
33 31 30 29 31
Adaptive attitudes Rank Rank Rank
E-Participation 43 24 32 Internet retailing 36 37 45 Tablet possession 30 22 u 13w Smartphone possession 54 33 30 Attitudes toward globalization 48 34
TECHNOLOGY
Technological framework
Capital Technological framework
Scientific concentration
Training & education Scientific concentration
Talent
Robots in Education and R&D
FUTURE READINESS
IT integration
Business agility IT integration
FACTORS BREAKDOWN - STRENGTHS AND WEAKNESSES
SLOVENIA
Opportunities and threats E-GovernmentWorld robots distribution Public-private partnerships
Total expenditure on R&D (%)Total public expenditure on education Total R&D personnel per capita
Training & education
Adaptive attitudes
Business agility
Venture capital Internet bandwidth speedInvestment in Telecommunications High-tech exports (%)
Regulatory framework
Capital
IT & media stock market capitalization Communications technologyFunding for technological development Mobile Broadband subscribersBanking and financial services Wireless broadbandCountry credit rating Internet users
Higher education achievement Female researchersPupil-teacher ratio (tertiary education) R&D productivity by publicationGraduates in Sciences Scientific and technical employmentWomen with degrees High-tech patent grants
Employee training
KNOWLEDGE
Agility of companies Cyber securityUse of big data and analytics Sofware piracyKnowledge transfer

IMD WORLD DIGITAL COMPETIT IVENESS RANKING 2019146
Alpha AlphaLabelBeta BetaLabel Gamma GammaLabel1 2 2 2 2 2 24 4 4 2 2
6.5 4 4 2 28.5 4 4 2 2
10.5 4 4 2 2
2015 2016 2017 2018 2019
47 51 47 49 48
47 49 49 52 54
53 51 53 52 51
48 47 42 43 44
OVERALL
Future readiness
COMPETITIVENESS & DIGITAL RANKINGS
PEER GROUPS RANKINGS
EUROPE - MIDDLE EAST - AFRICA (40 countries) POPULATIONS > 20 MILLION (29 countries)
Knowledge
Technology
DIGITAL TRENDS - OVERALL
SOUTH AFRICA
OVERALL PERFORMANCE (63 countries)
OVERALL & FACTORS - 5 years
47
51
4749 48
5352
53 53
56
2015 2016 2017 2018 2019
Digital
Competitiveness
3337
3335 34
2015 2016 2017 2018 2019
1819 19 19 19
2015 2016 2017 2018 2019
54 49 58 48
51 53 30 5948
44 55 40 42
Knowledge Talent Training & education Scientific concentration
Technology Regulatory framework Capital Technological framework
Future readiness Adaptive attitudes Business agility IT integrationThe direction of the triangle indicates the performance change from the last year: improved or stabledeclined
Overall Factors Sub-Factors
N.B. This graph provides only a comparison of the country’s performance in the two rankings.

147IMD WORLD DIGITAL COMPETIT IVENESS RANKING 2019
u Overall top strengths
w Overall top weaknesses
Subfactors 2015 2016 2017 2018 201948 53 52 54 49
36 38 37 54 58
51 50 49 47 48
Talent Rank Rank Rank
Educational assessment PISA - Math - 30 45 International experience 53 u 3 53 Foreign highly-skilled personnel 33 w 60 u 15 Management of cities 56 47 26 Digital/Technological skills 53 52 - Net flow of international students 27 54 53 38
Subfactors 2015 2016 2017 2018 201953 54 54 53 53
45 33 35 27 30
55 56 57 58 59
Regulatory framework Rank Rank Rank
Starting a business 57 u 4 57 Enforcing contracts 55 50 48 Immigration laws 57 36 47 Development and application of technology38 53 w 59 Scientific research legislation 31 45 w 58 Intellectual property rights 30 u 7 w 58
Subfactors 2015 2016 2017 2018 201955 55 54 56 55
36 38 37 38 40
46 47 42 39 42
Adaptive attitudes Rank Rank Rank
E-Participation 36 45 52 Internet retailing 56 32 54w Tablet possession 57 37 47 Smartphone possession 40 20 u 20 Attitudes toward globalization 43 47
TECHNOLOGY
Technological framework
Capital Technological framework
Scientific concentration
Training & education Scientific concentration
Talent
Robots in Education and R&D
FUTURE READINESS
IT integration
Business agility IT integration
FACTORS BREAKDOWN - STRENGTHS AND WEAKNESSES
SOUTH AFRICA
Opportunities and threats E-GovernmentWorld robots distribution Public-private partnerships
Total expenditure on R&D (%)Total public expenditure on education Total R&D personnel per capita
Training & education
Adaptive attitudes
Business agility
Venture capital Internet bandwidth speedInvestment in Telecommunications High-tech exports (%)
Regulatory framework
Capital
IT & media stock market capitalization Communications technologyFunding for technological development Mobile Broadband subscribersBanking and financial services Wireless broadbandCountry credit rating Internet users
Higher education achievement Female researchersPupil-teacher ratio (tertiary education) R&D productivity by publicationGraduates in Sciences Scientific and technical employmentWomen with degrees High-tech patent grants
Employee training
KNOWLEDGE
Agility of companies Cyber securityUse of big data and analytics Sofware piracyKnowledge transfer

IMD WORLD DIGITAL COMPETIT IVENESS RANKING 2019148
Alpha AlphaLabelBeta BetaLabel Gamma GammaLabel1 2 2 2 2 2 24 4 4 2 2
6.5 4 4 2 28.5 4 4 2 2
10.5 4 4 2 2
2015 2016 2017 2018 2019
30 30 30 31 28
35 36 33 31 28
35 32 33 33 29
29 30 29 30 27
OVERALL
Future readiness
COMPETITIVENESS & DIGITAL RANKINGS
PEER GROUPS RANKINGS
EUROPE - MIDDLE EAST - AFRICA (40 countries) POPULATIONS > 20 MILLION (29 countries)
Knowledge
Technology
DIGITAL TRENDS - OVERALL
SPAIN
OVERALL PERFORMANCE (63 countries)
OVERALL & FACTORS - 5 years
30 30 30 3128
3734 34 36
36
2015 2016 2017 2018 2019
Digital
Competitiveness
20 20 20 2017
2015 2016 2017 2018 2019
11 11 1112 12
2015 2016 2017 2018 2019
28 29 40 20
29 34 33 2328
27 25 38 25
Knowledge Talent Training & education Scientific concentration
Technology Regulatory framework Capital Technological framework
Future readiness Adaptive attitudes Business agility IT integrationThe direction of the triangle indicates the performance change from the last year: improved or stabledeclined
Overall Factors Sub-Factors
N.B. This graph provides only a comparison of the country’s performance in the two rankings.

149IMD WORLD DIGITAL COMPETIT IVENESS RANKING 2019
u Overall top strengths
w Overall top weaknesses
Subfactors 2015 2016 2017 2018 201933 34 32 32 29
41 43 42 40 40
26 28 29 27 20
Talent Rank Rank Rank
Educational assessment PISA - Math 30 w 47 32 International experience 39 39 26 Foreign highly-skilled personnel 24 31 20 Management of cities 31 17 u 7 Digital/Technological skills 31 28 22 Net flow of international students 32 28 41 u 7
Subfactors 2015 2016 2017 2018 201933 34 35 36 34
48 38 34 37 33
27 27 23 29 23
Regulatory framework Rank Rank Rank
Starting a business 40 15 22 Enforcing contracts 22 44 u 14 Immigration laws 18 32 29 Development and application of technology35 38 26w Scientific research legislation 48 28 15 Intellectual property rights 29 28 w 48
Subfactors 2015 2016 2017 2018 201926 26 24 26 25
31 30 47 44 38
26 26 26 27 25
Adaptive attitudes Rank Rank Rank
u E-Participation 5 44 17 Internet retailing 30 u 9 28 Tablet possession 15 38 38 Smartphone possession 25 w 55 32 Attitudes toward globalization 40 w 44
Scientific concentration
Training & education Scientific concentration
Talent
Robots in Education and R&D
FUTURE READINESS
IT integration
Business agility IT integration
FACTORS BREAKDOWN - STRENGTHS AND WEAKNESSES
SPAIN
TECHNOLOGY
Technological framework
Capital Technological framework
Opportunities and threats E-GovernmentWorld robots distribution Public-private partnerships
Total expenditure on R&D (%)Total public expenditure on education Total R&D personnel per capita
Training & education
Adaptive attitudes
Business agility
Venture capital Internet bandwidth speedInvestment in Telecommunications High-tech exports (%)
Regulatory framework
Capital
IT & media stock market capitalization Communications technologyFunding for technological development Mobile Broadband subscribersBanking and financial services Wireless broadbandCountry credit rating Internet users
Higher education achievement Female researchersPupil-teacher ratio (tertiary education) R&D productivity by publicationGraduates in Sciences Scientific and technical employmentWomen with degrees High-tech patent grants
Employee training
KNOWLEDGE
Agility of companies Cyber securityUse of big data and analytics Sofware piracyKnowledge transfer
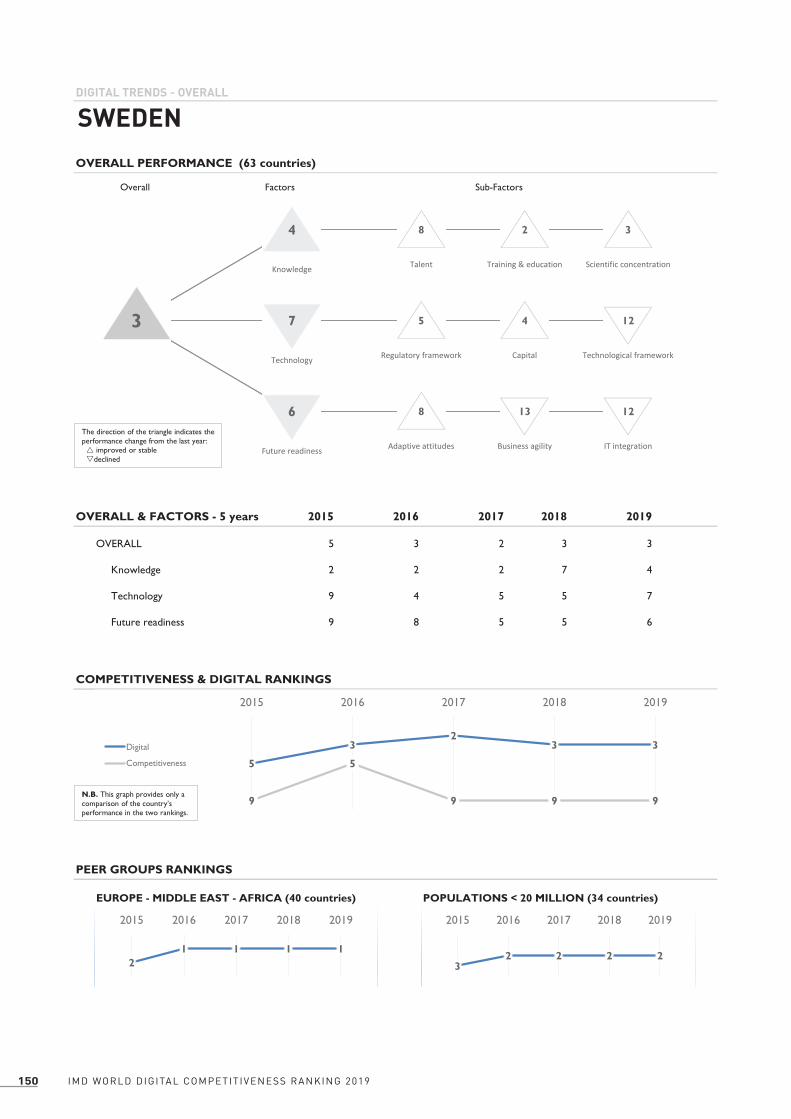
IMD WORLD DIGITAL COMPETIT IVENESS RANKING 2019150
Alpha AlphaLabelBeta BetaLabel Gamma GammaLabel1 2 2 2 2 2 24 4 4 2 2
6.5 4 4 2 28.5 4 4 2 2
10.5 4 4 2 2
2015 2016 2017 2018 2019
5 3 2 3 3
2 2 2 7 4
9 4 5 5 7
9 8 5 5 6
OVERALL
Future readiness
COMPETITIVENESS & DIGITAL RANKINGS
PEER GROUPS RANKINGS
EUROPE - MIDDLE EAST - AFRICA (40 countries) POPULATIONS < 20 MILLION (34 countries)
Knowledge
Technology
DIGITAL TRENDS - OVERALL
SWEDEN
OVERALL PERFORMANCE (63 countries)
OVERALL & FACTORS - 5 years
5
32
3 3
9
5
9 9 9
2015 2016 2017 2018 2019
Digital
Competitiveness
21 1 1 1
2015 2016 2017 2018 2019
32 2 2 2
2015 2016 2017 2018 2019
4 8 2 3
7 5 4 123
6 8 13 12
Knowledge Talent Training & education Scientific concentration
Technology Regulatory framework Capital Technological framework
Future readiness Adaptive attitudes Business agility IT integrationThe direction of the triangle indicates the performance change from the last year: improved or stabledeclined
Overall Factors Sub-Factors
N.B. This graph provides only a comparison of the country’s performance in the two rankings.
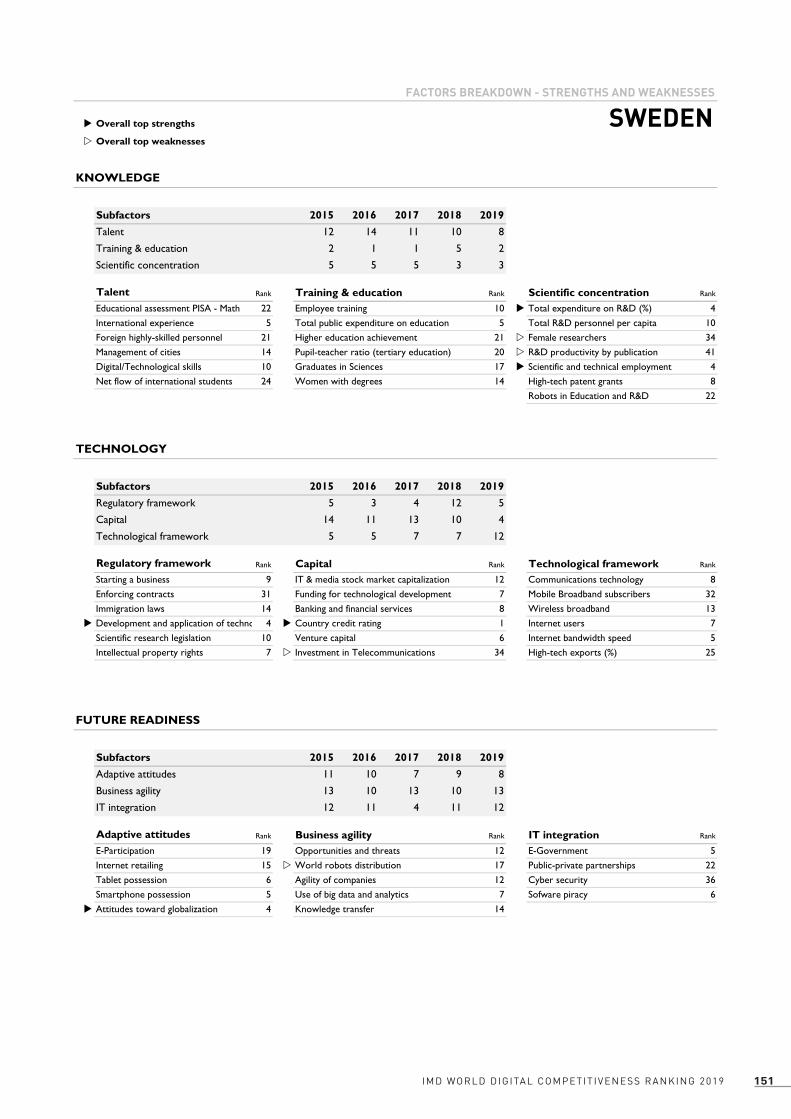
151IMD WORLD DIGITAL COMPETIT IVENESS RANKING 2019
u Overall top strengths
w Overall top weaknesses
Subfactors 2015 2016 2017 2018 201912 14 11 10 8
2 1 1 5 2
5 5 5 3 3
Talent Rank Rank Rank
Educational assessment PISA - Math 22 10 u 4 International experience 5 5 10 Foreign highly-skilled personnel 21 21 w 34 Management of cities 14 20 w 41 Digital/Technological skills 10 17 u 4 Net flow of international students 24 14 8 22
Subfactors 2015 2016 2017 2018 20195 3 4 12 5
14 11 13 10 4
5 5 7 7 12
Regulatory framework Rank Rank Rank
Starting a business 9 12 8 Enforcing contracts 31 7 32 Immigration laws 14 8 13u Development and application of technology4 u 1 7 Scientific research legislation 10 6 5 Intellectual property rights 7 w 34 25
Subfactors 2015 2016 2017 2018 201911 10 7 9 8
13 10 13 10 13
12 11 4 11 12
Adaptive attitudes Rank Rank Rank
E-Participation 19 12 5 Internet retailing 15 w 17 22 Tablet possession 6 12 36 Smartphone possession 5 7 6u Attitudes toward globalization 4 14
TECHNOLOGY
Technological framework
Capital Technological framework
Scientific concentration
Training & education Scientific concentration
Talent
Robots in Education and R&D
FUTURE READINESS
IT integration
Business agility IT integration
FACTORS BREAKDOWN - STRENGTHS AND WEAKNESSES
SWEDEN
Opportunities and threats E-GovernmentWorld robots distribution Public-private partnerships
Total expenditure on R&D (%)Total public expenditure on education Total R&D personnel per capita
Training & education
Adaptive attitudes
Business agility
Venture capital Internet bandwidth speedInvestment in Telecommunications High-tech exports (%)
Regulatory framework
Capital
IT & media stock market capitalization Communications technologyFunding for technological development Mobile Broadband subscribersBanking and financial services Wireless broadbandCountry credit rating Internet users
Higher education achievement Female researchersPupil-teacher ratio (tertiary education) R&D productivity by publicationGraduates in Sciences Scientific and technical employmentWomen with degrees High-tech patent grants
Employee training
KNOWLEDGE
Agility of companies Cyber securityUse of big data and analytics Sofware piracyKnowledge transfer
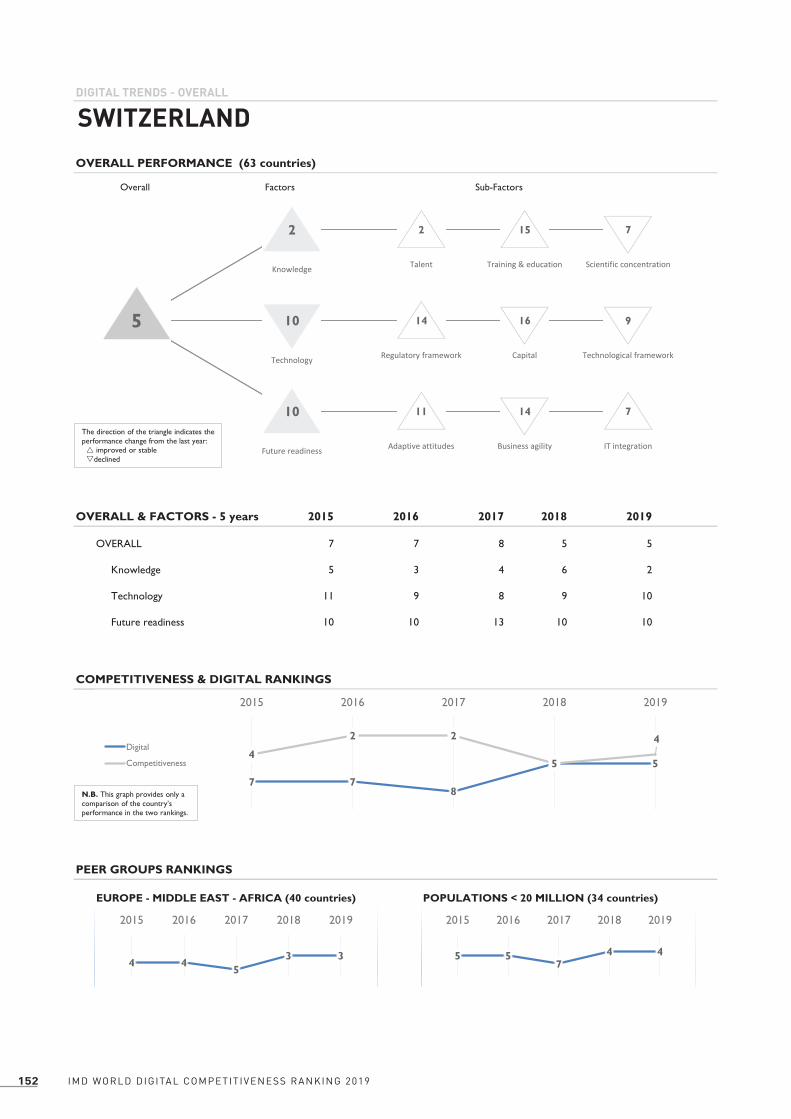
IMD WORLD DIGITAL COMPETIT IVENESS RANKING 2019152
Alpha AlphaLabelBeta BetaLabel Gamma GammaLabel1 2 2 2 2 2 24 4 4 2 2
6.5 4 4 2 28.5 4 4 2 2
10.5 4 4 2 2
2015 2016 2017 2018 2019
7 7 8 5 5
5 3 4 6 2
11 9 8 9 10
10 10 13 10 10
COMPETITIVENESS & DIGITAL RANKINGS
PEER GROUPS RANKINGS
EUROPE - MIDDLE EAST - AFRICA (40 countries) POPULATIONS < 20 MILLION (34 countries)
Knowledge
Technology
Future readiness
OVERALL
DIGITAL TRENDS - OVERALL
SWITZERLAND
OVERALL PERFORMANCE (63 countries)
OVERALL & FACTORS - 5 years
7 78
5 54
2 2
5
4
2015 2016 2017 2018 2019
Digital
Competitiveness
4 45
3 3
2015 2016 2017 2018 2019
5 57
4 4
2015 2016 2017 2018 2019
2 2 15 7
10 14 16 95
10 11 14 7
Knowledge Talent Training & education Scientific concentration
Technology Regulatory framework Capital Technological framework
Future readiness Adaptive attitudes Business agility IT integrationThe direction of the triangle indicates the performance change from the last year: improved or stabledeclined
Overall Factors Sub-Factors
N.B. This graph provides only a comparison of the country’s performance in the two rankings.

153IMD WORLD DIGITAL COMPETIT IVENESS RANKING 2019
u Overall top strengths
w Overall top weaknesses
Subfactors 2015 2016 2017 2018 20192 2 2 2 2
21 18 25 15 15
12 13 13 6 7
Talent Rank Rank Rank
Educational assessment PISA - Math 7 5 3u International experience 2 24 3u Foreign highly-skilled personnel 1 16 w 35 Management of cities 5 5 w 39 Digital/Technological skills 17 26 3 Net flow of international students 8 29 34 15
Subfactors 2015 2016 2017 2018 201914 10 13 15 14
13 12 11 15 16
12 9 10 8 9
Regulatory framework Rank Rank Rank
Starting a business 36 w 42 9w Enforcing contracts 41 10 22 Immigration laws 26 11 26 Development and application of technology7 u 1 22 Scientific research legislation 2 15 7 Intellectual property rights 2 23 5
Subfactors 2015 2016 2017 2018 201924 21 23 12 11
2 3 4 7 14
13 14 13 16 7
Adaptive attitudes Rank Rank Rank
w E-Participation 37 11 15 Internet retailing 10 27 5 Tablet possession 8 9 11u Smartphone possession 2 29 10 Attitudes toward globalization 27 u 1
Talent
Robots in Education and R&D
Training & education Scientific concentration
TECHNOLOGY
Scientific concentration
Capital Technological framework
FUTURE READINESS
IT integration
Business agility IT integration
FACTORS BREAKDOWN - STRENGTHS AND WEAKNESSES
SWITZERLAND
Technological framework
Opportunities and threats E-GovernmentWorld robots distribution Public-private partnerships
Total expenditure on R&D (%)Total public expenditure on education Total R&D personnel per capita
Training & education
Adaptive attitudes
Business agility
Venture capital Internet bandwidth speedInvestment in Telecommunications High-tech exports (%)
Regulatory framework
Capital
IT & media stock market capitalization Communications technologyFunding for technological development Mobile Broadband subscribersBanking and financial services Wireless broadbandCountry credit rating Internet users
Higher education achievement Female researchersPupil-teacher ratio (tertiary education) R&D productivity by publicationGraduates in Sciences Scientific and technical employmentWomen with degrees High-tech patent grants
Employee training
KNOWLEDGE
Agility of companies Cyber securityUse of big data and analytics Sofware piracyKnowledge transfer

IMD WORLD DIGITAL COMPETIT IVENESS RANKING 2019154
Alpha AlphaLabelBeta BetaLabel Gamma GammaLabel1 2 2 2 2 2 24 4 4 2 2
6.5 4 4 2 28.5 4 4 2 2
10.5 4 4 2 2
2015 2016 2017 2018 2019
15 16 12 16 13
19 19 16 19 17
4 8 7 11 9
20 22 16 22 12
OVERALL
Future readiness
COMPETITIVENESS & DIGITAL RANKINGS
PEER GROUPS RANKINGS
ASIA - PACIFIC (14 countries) POPULATIONS > 20 MILLION (29 countries)
Knowledge
Technology
DIGITAL TRENDS - OVERALL
TAIWAN, CHINA
OVERALL PERFORMANCE (63 countries)
OVERALL & FACTORS - 5 years
15 16
12
1613
11 14
1417 16
2015 2016 2017 2018 2019
Digital
Competitiveness
5 53
54
2015 2016 2017 2018 2019
5 64
64
2015 2016 2017 2018 2019
17 21 20 15
9 23 12 413
12 14 3 24
Knowledge Talent Training & education Scientific concentration
Technology Regulatory framework Capital Technological framework
Future readiness Adaptive attitudes Business agility IT integrationThe direction of the triangle indicates the performance change from the last year: improved or stabledeclined
Overall Factors Sub-Factors
N.B. This graph provides only a comparison of the country’s performance in the two rankings.

155IMD WORLD DIGITAL COMPETIT IVENESS RANKING 2019
u Overall top strengths
w Overall top weaknesses
Subfactors 2015 2016 2017 2018 201919 19 18 25 21
22 23 28 25 20
19 19 17 13 15
Talent Rank Rank Rank
Educational assessment PISA - Math 3 14 5 International experience 36 w 45 u 2w Foreign highly-skilled personnel 48 4 w 50 Management of cities 24 w 54 35 Digital/Technological skills 27 u 3 37 Net flow of international students 12 35 17 21
Subfactors 2015 2016 2017 2018 201922 25 24 21 23
6 6 8 13 12
4 6 4 10 4
Regulatory framework Rank Rank Rank
Starting a business 11 u 2 24 Enforcing contracts 10 23 u 1 Immigration laws 39 18 16 Development and application of technology36 22 21 Scientific research legislation 23 27 18 Intellectual property rights 24 w 45 u 3
Subfactors 2015 2016 2017 2018 201919 19 19 28 14
19 24 6 13 3
23 24 22 23 24
Adaptive attitudes Rank Rank Rank
E-Participation - 4 - Internet retailing 20 7 18 Tablet possession 27 3 12 Smartphone possession 4 14 25 Attitudes toward globalization 11 19
TECHNOLOGY
Technological framework
Capital Technological framework
Scientific concentration
Training & education Scientific concentration
Talent
Robots in Education and R&D
FUTURE READINESS
IT integration
Business agility IT integration
FACTORS BREAKDOWN - STRENGTHS AND WEAKNESSES
TAIWAN, CHINA
Opportunities and threats E-GovernmentWorld robots distribution Public-private partnerships
Total expenditure on R&D (%)Total public expenditure on education Total R&D personnel per capita
Training & education
Adaptive attitudes
Business agility
Venture capital Internet bandwidth speedInvestment in Telecommunications High-tech exports (%)
Regulatory framework
Capital
IT & media stock market capitalization Communications technologyFunding for technological development Mobile Broadband subscribersBanking and financial services Wireless broadbandCountry credit rating Internet users
Higher education achievement Female researchersPupil-teacher ratio (tertiary education) R&D productivity by publicationGraduates in Sciences Scientific and technical employmentWomen with degrees High-tech patent grants
Employee training
KNOWLEDGE
Agility of companies Cyber securityUse of big data and analytics Sofware piracyKnowledge transfer

IMD WORLD DIGITAL COMPETIT IVENESS RANKING 2019156
Alpha AlphaLabelBeta BetaLabel Gamma GammaLabel1 2 2 2 2 2 24 4 4 2 2
6.5 4 4 2 28.5 4 4 2 2
10.5 4 4 2 2
2015 2016 2017 2018 2019
42 39 41 39 40
48 42 44 44 43
33 30 30 28 27
50 48 45 49 50
OVERALL
Future readiness
COMPETITIVENESS & DIGITAL RANKINGS
PEER GROUPS RANKINGS
ASIA - PACIFIC (14 countries) POPULATIONS > 20 MILLION (29 countries)
Knowledge
Technology
DIGITAL TRENDS - OVERALL
THAILAND
OVERALL PERFORMANCE (63 countries)
OVERALL & FACTORS - 5 years
42 39 41 39 40
30 28 27 3025
2015 2016 2017 2018 2019
Digital
Competitiveness
10 10 10 10 10
2015 2016 2017 2018 2019
1615
1614
16
2015 2016 2017 2018 2019
43 40 50 35
27 33 21 2940
50 58 30 51
Knowledge Talent Training & education Scientific concentration
Technology Regulatory framework Capital Technological framework
Future readiness Adaptive attitudes Business agility IT integrationThe direction of the triangle indicates the performance change from the last year: improved or stabledeclined
Overall Factors Sub-Factors
N.B. This graph provides only a comparison of the country’s performance in the two rankings.

157IMD WORLD DIGITAL COMPETIT IVENESS RANKING 2019
u Overall top strengths
w Overall top weaknesses
Subfactors 2015 2016 2017 2018 201942 42 42 42 40
54 44 47 44 50
44 41 43 45 35
Talent Rank Rank Rank
Educational assessment PISA - Math 48 25 37 International experience 20 51 39 Foreign highly-skilled personnel 29 41 u 3 Management of cities 35 w 57 28 Digital/Technological skills 49 15 47 Net flow of international students 34 45 49 26
Subfactors 2015 2016 2017 2018 201942 43 38 34 33
17 21 21 28 21
38 32 30 23 29
Regulatory framework Rank Rank Rank
Starting a business 23 23 23 Enforcing contracts 29 29 u 4 Immigration laws 27 u 7 22 Development and application of technology34 41 w 54 Scientific research legislation 37 22 32 Intellectual property rights 47 19 u 9
Subfactors 2015 2016 2017 2018 201947 47 51 55 58
40 34 32 34 30
57 55 53 55 51
Adaptive attitudes Rank Rank Rank
w E-Participation 56 33 53 Internet retailing 54 u 10 20w Tablet possession 59 41 30 Smartphone possession 49 37 w 56 Attitudes toward globalization 18 32
TECHNOLOGY
Technological framework
Capital Technological framework
Scientific concentration
Training & education Scientific concentration
Talent
Robots in Education and R&D
FUTURE READINESS
IT integration
Business agility IT integration
FACTORS BREAKDOWN - STRENGTHS AND WEAKNESSES
THAILAND
Opportunities and threats E-GovernmentWorld robots distribution Public-private partnerships
Total expenditure on R&D (%)Total public expenditure on education Total R&D personnel per capita
Training & education
Adaptive attitudes
Business agility
Venture capital Internet bandwidth speedInvestment in Telecommunications High-tech exports (%)
Regulatory framework
Capital
IT & media stock market capitalization Communications technologyFunding for technological development Mobile Broadband subscribersBanking and financial services Wireless broadbandCountry credit rating Internet users
Higher education achievement Female researchersPupil-teacher ratio (tertiary education) R&D productivity by publicationGraduates in Sciences Scientific and technical employmentWomen with degrees High-tech patent grants
Employee training
KNOWLEDGE
Agility of companies Cyber securityUse of big data and analytics Sofware piracyKnowledge transfer

IMD WORLD DIGITAL COMPETIT IVENESS RANKING 2019158
Alpha AlphaLabelBeta BetaLabel Gamma GammaLabel1 2 2 2 2 2 24 4 4 2 2
6.5 4 4 2 28.5 4 4 2 2
10.5 4 4 2 2
2015 2016 2017 2018 2019
52 50 52 52 52
59 58 60 59 60
48 48 49 45 48
42 42 40 42 41
OVERALL
Future readiness
COMPETITIVENESS & DIGITAL RANKINGS
PEER GROUPS RANKINGS
EUROPE - MIDDLE EAST - AFRICA (40 countries) POPULATIONS > 20 MILLION (29 countries)
Knowledge
Technology
DIGITAL TRENDS - OVERALL
TURKEY
OVERALL PERFORMANCE (63 countries)
OVERALL & FACTORS - 5 years
52 50 52 52 52
40 38 47 4651
2015 2016 2017 2018 2019
Digital
Competitiveness
36 36 3637 37
2015 2016 2017 2018 2019
21 18 22 21 21
2015 2016 2017 2018 2019
60 52 63 43
48 38 56 5052
41 38 44 48
Knowledge Talent Training & education Scientific concentration
Technology Regulatory framework Capital Technological framework
Future readiness Adaptive attitudes Business agility IT integrationThe direction of the triangle indicates the performance change from the last year: improved or stabledeclined
Overall Factors Sub-Factors
N.B. This graph provides only a comparison of the country’s performance in the two rankings.

159IMD WORLD DIGITAL COMPETIT IVENESS RANKING 2019
u Overall top strengths
w Overall top weaknesses
Subfactors 2015 2016 2017 2018 201941 36 49 49 52
61 61 63 62 63
52 52 48 48 43
Talent Rank Rank Rank
Educational assessment PISA - Math 47 w 59 39 International experience 38 37 41 Foreign highly-skilled personnel 57 45 27 Management of cities 48 w 60 u 10 Digital/Technological skills 38 51 38 Net flow of international students 29 50 55 28
Subfactors 2015 2016 2017 2018 201944 40 40 37 38
36 46 47 41 56
50 51 51 51 50
Regulatory framework Rank Rank Rank
Starting a business 37 u 20 u 20u Enforcing contracts 18 46 u 9 Immigration laws 24 47 55 Development and application of technology45 57 49 Scientific research legislation 42 54 55w Intellectual property rights 58 53 w 60
Subfactors 2015 2016 2017 2018 201937 35 36 42 38
44 41 39 42 44
50 52 51 50 48
Adaptive attitudes Rank Rank Rank
E-Participation 35 31 44 Internet retailing 43 20 39 Tablet possession 40 40 50 Smartphone possession 45 w 58 48 Attitudes toward globalization 30 43
TECHNOLOGY
Technological framework
Capital Technological framework
Scientific concentration
Training & education Scientific concentration
Talent
Robots in Education and R&D
FUTURE READINESS
IT integration
Business agility IT integration
FACTORS BREAKDOWN - STRENGTHS AND WEAKNESSES
TURKEY
Opportunities and threats E-GovernmentWorld robots distribution Public-private partnerships
Total expenditure on R&D (%)Total public expenditure on education Total R&D personnel per capita
Training & education
Adaptive attitudes
Business agility
Venture capital Internet bandwidth speedInvestment in Telecommunications High-tech exports (%)
Regulatory framework
Capital
IT & media stock market capitalization Communications technologyFunding for technological development Mobile Broadband subscribersBanking and financial services Wireless broadbandCountry credit rating Internet users
Higher education achievement Female researchersPupil-teacher ratio (tertiary education) R&D productivity by publicationGraduates in Sciences Scientific and technical employmentWomen with degrees High-tech patent grants
Employee training
KNOWLEDGE
Agility of companies Cyber securityUse of big data and analytics Sofware piracyKnowledge transfer

IMD WORLD DIGITAL COMPETIT IVENESS RANKING 2019160
Alpha AlphaLabelBeta BetaLabel Gamma GammaLabel1 2 2 2 2 2 24 4 4 2 2
6.5 4 4 2 28.5 4 4 2 2
10.5 4 4 2 2
2015 2016 2017 2018 2019
22 25 18 17 12
38 35 38 36 35
10 20 14 7 2
18 17 7 12 9
OVERALL
Knowledge
Technology
DIGITAL TRENDS - OVERALL
UAE
OVERALL PERFORMANCE (63 countries)
OVERALL & FACTORS - 5 years
Future readiness
COMPETITIVENESS & DIGITAL RANKINGS
PEER GROUPS RANKINGS
EUROPE - MIDDLE EAST - AFRICA (40 countries) POPULATIONS < 20 MILLION (34 countries)
2225
18 171212
1510
7 5
2015 2016 2017 2018 2019
Digital
Competitiveness
13 1511 10 7
2015 2016 2017 2018 2019
13 15 12 11 9
2015 2016 2017 2018 2019
35 5 41 56
2 1 2 512
9 20 4 8
Knowledge Talent Training & education Scientific concentration
Technology Regulatory framework Capital Technological framework
Future readiness Adaptive attitudes Business agility IT integrationThe direction of the triangle indicates the performance change from the last year: improved or stabledeclined
Overall Factors Sub-Factors
N.B. This graph provides only a comparison of the country’s performance in the two rankings.

161IMD WORLD DIGITAL COMPETIT IVENESS RANKING 2019
u Overall top strengths
w Overall top weaknesses
Subfactors 2015 2016 2017 2018 20196 5 5 4 5
53 53 56 53 41
54 51 52 56 56
Talent Rank Rank Rank
w Educational assessment PISA - Math 45 4 38u International experience 1 w 61 40 Foreign highly-skilled personnel 5 35 - Management of cities 2 41 w 57 Digital/Technological skills 7 37 - Net flow of international students 3 23 22 40
Subfactors 2015 2016 2017 2018 201919 16 5 3 1
4 14 12 11 2
19 31 29 16 5
Regulatory framework Rank Rank Rank
Starting a business 15 - 21 Enforcing contracts 8 4 15u Immigration laws 1 3 u 1 Development and application of technology3 16 35 Scientific research legislation 7 3 41 Intellectual property rights 17 18 w 43
Subfactors 2015 2016 2017 2018 201915 14 17 21 20
24 18 1 1 4
21 18 8 14 8
Adaptive attitudes Rank Rank Rank
E-Participation 17 u 1 21 Internet retailing 32 w 53 1 Tablet possession 21 1 2 Smartphone possession 21 u 1 20 Attitudes toward globalization 3 3
Adaptive attitudes
Business agility
Opportunities and threats E-GovernmentWorld robots distribution Public-private partnerships
Venture capital Internet bandwidth speedInvestment in Telecommunications High-tech exports (%)
Talent
Training & education
Employee training Total expenditure on R&D (%)Total public expenditure on education Total R&D personnel per capita
TECHNOLOGY
Technological framework
Capital Technological framework
Regulatory framework
Capital
IT & media stock market capitalization Communications technologyFunding for technological development Mobile Broadband subscribersBanking and financial services Wireless broadbandCountry credit rating Internet users
Scientific concentration
Training & education Scientific concentration
Higher education achievement Female researchersPupil-teacher ratio (tertiary education) R&D productivity by publicationGraduates in Sciences Scientific and technical employmentWomen with degrees High-tech patent grants Robots in Education and R&D
UAE
KNOWLEDGE
IT integration
Business agility IT integration
Agility of companies Cyber securityUse of big data and analytics Sofware piracyKnowledge transfer
FACTORS BREAKDOWN - STRENGTHS AND WEAKNESSES
FUTURE READINESS

IMD WORLD DIGITAL COMPETIT IVENESS RANKING 2019162
Alpha AlphaLabelBeta BetaLabel Gamma GammaLabel1 2 2 2 2 2 24 4 4 2 2
6.5 4 4 2 28.5 4 4 2 2
10.5 4 4 2 2
2015 2016 2017 2018 2019
59 59 60 58 60
40 44 45 39 40
60 60 62 61 61
61 61 61 61 62
OVERALL
Future readiness
COMPETITIVENESS & DIGITAL RANKINGS
PEER GROUPS RANKINGS
EUROPE - MIDDLE EAST - AFRICA (40 countries) POPULATIONS > 20 MILLION (29 countries)
Knowledge
Technology
DIGITAL TRENDS - OVERALL
UKRAINE
OVERALL PERFORMANCE (63 countries)
OVERALL & FACTORS - 5 years
59 5960
5860
60
5960
59
54
2015 2016 2017 2018 2019
Digital
Competitiveness
38 3840 40 40
2015 2016 2017 2018 2019
26 2627
25
27
2015 2016 2017 2018 2019
40 57 21 49
61 54 62 6060
62 59 45 61
Knowledge Talent Training & education Scientific concentration
Technology Regulatory framework Capital Technological framework
Future readiness Adaptive attitudes Business agility IT integrationThe direction of the triangle indicates the performance change from the last year: improved or stabledeclined
Overall Factors Sub-Factors
N.B. This graph provides only a comparison of the country’s performance in the two rankings.

163IMD WORLD DIGITAL COMPETIT IVENESS RANKING 2019
u Overall top strengths
w Overall top weaknesses
Subfactors 2015 2016 2017 2018 201955 58 57 55 57
15 20 26 22 21
39 45 45 40 49
Talent Rank Rank Rank
Educational assessment PISA - Math - 51 54 International experience 57 u 10 43 Foreign highly-skilled personnel 59 - u 16 Management of cities 57 u 11 u 23 Digital/Technological skills 40 27 40 Net flow of international students 49 - 37 48
Subfactors 2015 2016 2017 2018 201955 55 56 54 54
60 60 62 61 62
60 58 60 57 60
Regulatory framework Rank Rank Rank
Starting a business 30 - 50 Enforcing contracts 42 52 60 Immigration laws 41 59 60 Development and application of technology57 w 62 50w Scientific research legislation 61 w 61 42w Intellectual property rights 61 u 11 55
Subfactors 2015 2016 2017 2018 201960 60 58 53 59
58 59 56 53 45
61 60 60 61 61
Adaptive attitudes Rank Rank Rank
E-Participation 53 30 56 Internet retailing 51 51 59 Tablet possession 56 47 60 Smartphone possession 50 23 w 60 Attitudes toward globalization 50 56
TECHNOLOGY
Technological framework
Capital Technological framework
Scientific concentration
Training & education Scientific concentration
Talent
Robots in Education and R&D
FUTURE READINESS
IT integration
Business agility IT integration
FACTORS BREAKDOWN - STRENGTHS AND WEAKNESSES
UKRAINE
Opportunities and threats E-GovernmentWorld robots distribution Public-private partnerships
Total expenditure on R&D (%)Total public expenditure on education Total R&D personnel per capita
Training & education
Adaptive attitudes
Business agility
Venture capital Internet bandwidth speedInvestment in Telecommunications High-tech exports (%)
Regulatory framework
Capital
IT & media stock market capitalization Communications technologyFunding for technological development Mobile Broadband subscribersBanking and financial services Wireless broadbandCountry credit rating Internet users
Higher education achievement Female researchersPupil-teacher ratio (tertiary education) R&D productivity by publicationGraduates in Sciences Scientific and technical employmentWomen with degrees High-tech patent grants
Employee training
KNOWLEDGE
Agility of companies Cyber securityUse of big data and analytics Sofware piracyKnowledge transfer

IMD WORLD DIGITAL COMPETIT IVENESS RANKING 2019164
Alpha AlphaLabelBeta BetaLabel Gamma GammaLabel1 2 2 2 2 2 24 4 4 2 2
6.5 4 4 2 28.5 4 4 2 2
10.5 4 4 2 2
2015 2016 2017 2018 2019
12 12 11 10 15
12 11 10 10 14
18 18 16 13 18
11 11 9 3 13
OVERALL
Future readiness
COMPETITIVENESS & DIGITAL RANKINGS
PEER GROUPS RANKINGS
EUROPE - MIDDLE EAST - AFRICA (40 countries) POPULATIONS > 20 MILLION (29 countries)
Knowledge
Technology
DIGITAL TRENDS - OVERALL
UNITED KINGDOM
OVERALL PERFORMANCE (63 countries)
OVERALL & FACTORS - 5 years
12 12 11 10
1519 18 19 20
23
2015 2016 2017 2018 2019
Digital
Competitiveness
87 7 7
8
2015 2016 2017 2018 2019
4 3 3 36
2015 2016 2017 2018 2019
14 17 23 8
18 18 22 1815
13 10 26 14
Knowledge Talent Training & education Scientific concentration
Technology Regulatory framework Capital Technological framework
Future readiness Adaptive attitudes Business agility IT integrationThe direction of the triangle indicates the performance change from the last year: improved or stabledeclined
Overall Factors Sub-Factors
N.B. This graph provides only a comparison of the country’s performance in the two rankings.

165IMD WORLD DIGITAL COMPETIT IVENESS RANKING 2019
u Overall top strengths
w Overall top weaknesses
Subfactors 2015 2016 2017 2018 20197 7 7 9 17
23 19 19 20 23
11 10 11 8 8
Talent Rank Rank Rank
Educational assessment PISA - Math 25 37 22 International experience 28 32 19 Foreign highly-skilled personnel 22 14 22 Management of cities 19 37 u 4 Digital/Technological skills 30 19 8u Net flow of international students 5 17 21 6
Subfactors 2015 2016 2017 2018 201910 11 12 7 18
22 25 24 17 22
15 16 16 17 18
Regulatory framework Rank Rank Rank
Starting a business 10 30 34 Enforcing contracts 27 19 23w Immigration laws 40 14 w 38 Development and application of technology21 18 15 Scientific research legislation 14 7 31 Intellectual property rights 12 w 58 11
Subfactors 2015 2016 2017 2018 20195 4 6 4 10
22 25 22 16 26
16 13 6 2 14
Adaptive attitudes Rank Rank Rank
u E-Participation 5 36 u 4u Internet retailing 3 12 34 Tablet possession 12 w 42 29 Smartphone possession 22 25 10w Attitudes toward globalization 42 17
Scientific concentration
Training & education Scientific concentration
Talent
Robots in Education and R&D
FUTURE READINESS
IT integration
Business agility IT integration
FACTORS BREAKDOWN - STRENGTHS AND WEAKNESSES
UNITED KINGDOM
TECHNOLOGY
Technological framework
Capital Technological framework
Opportunities and threats E-GovernmentWorld robots distribution Public-private partnerships
Total expenditure on R&D (%)Total public expenditure on education Total R&D personnel per capita
Training & education
Adaptive attitudes
Business agility
Venture capital Internet bandwidth speedInvestment in Telecommunications High-tech exports (%)
Regulatory framework
Capital
IT & media stock market capitalization Communications technologyFunding for technological development Mobile Broadband subscribersBanking and financial services Wireless broadbandCountry credit rating Internet users
Higher education achievement Female researchersPupil-teacher ratio (tertiary education) R&D productivity by publicationGraduates in Sciences Scientific and technical employmentWomen with degrees High-tech patent grants
Employee training
KNOWLEDGE
Agility of companies Cyber securityUse of big data and analytics Sofware piracyKnowledge transfer

IMD WORLD DIGITAL COMPETIT IVENESS RANKING 2019166
Alpha AlphaLabelBeta BetaLabel Gamma GammaLabel1 2 2 2 2 2 24 4 4 2 2
6.5 4 4 2 28.5 4 4 2 2
10.5 4 4 2 2
2015 2016 2017 2018 2019
2 2 3 1 1
6 4 5 4 1
6 5 6 3 5
3 1 2 2 1
OVERALL
Future readiness
COMPETITIVENESS & DIGITAL RANKINGS
PEER GROUPS RANKINGS
THE AMERICAS (9 countries) POPULATIONS > 20 MILLION (29 countries)
Knowledge
Technology
DIGITAL TRENDS - OVERALL
USA
OVERALL PERFORMANCE (63 countries)
OVERALL & FACTORS - 5 years
2 2
3
1 11
3
4
1
3
2015 2016 2017 2018 2019
Digital
Competitiveness
1 1 1 1 1
2015 2016 2017 2018 2019
1 1 1 1 1
2015 2016 2017 2018 2019
1 14 25 1
5 19 1 111
1 2 2 5
Knowledge Talent Training & education Scientific concentration
Technology Regulatory framework Capital Technological framework
Future readiness Adaptive attitudes Business agility IT integrationThe direction of the triangle indicates the performance change from the last year: improved or stabledeclined
Overall Factors Sub-Factors
N.B. This graph provides only a comparison of the country’s performance in the two rankings.

167IMD WORLD DIGITAL COMPETIT IVENESS RANKING 2019
u Overall top strengths
w Overall top weaknesses
Subfactors 2015 2016 2017 2018 201914 11 13 11 14
32 30 33 21 25
1 1 1 1 1
Talent Rank Rank Rank
w Educational assessment PISA - Math 37 w 38 10 International experience 29 9 - Foreign highly-skilled personnel 7 19 - Management of cities 18 19 3 Digital/Technological skills 9 w 54 7 Net flow of international students 13 11 5 3
Subfactors 2015 2016 2017 2018 201916 12 17 16 19
2 1 2 1 1
11 12 12 9 11
Regulatory framework Rank Rank Rank
Starting a business 29 6 17 Enforcing contracts 15 2 26w Immigration laws 60 u 1 8 Development and application of technology8 11 3 Scientific research legislation 5 u 1 13 Intellectual property rights 13 22 20
Subfactors 2015 2016 2017 2018 20191 1 2 1 2
9 4 3 9 2
11 4 12 8 5
Adaptive attitudes Rank Rank Rank
E-Participation 5 16 11u Internet retailing 2 4 12u Tablet possession 2 18 34 Smartphone possession 12 6 u 1w Attitudes toward globalization 46 4
TECHNOLOGY
Technological framework
Capital Technological framework
Scientific concentration
Training & education Scientific concentration
Talent
Robots in Education and R&D
FUTURE READINESS
IT integration
Business agility IT integration
FACTORS BREAKDOWN - STRENGTHS AND WEAKNESSES
USA
Opportunities and threats E-GovernmentWorld robots distribution Public-private partnerships
Total expenditure on R&D (%)Total public expenditure on education Total R&D personnel per capita
Training & education
Adaptive attitudes
Business agility
Venture capital Internet bandwidth speedInvestment in Telecommunications High-tech exports (%)
Regulatory framework
Capital
IT & media stock market capitalization Communications technologyFunding for technological development Mobile Broadband subscribersBanking and financial services Wireless broadbandCountry credit rating Internet users
Higher education achievement Female researchersPupil-teacher ratio (tertiary education) R&D productivity by publicationGraduates in Sciences Scientific and technical employmentWomen with degrees High-tech patent grants
Employee training
KNOWLEDGE
Agility of companies Cyber securityUse of big data and analytics Sofware piracyKnowledge transfer

IMD WORLD DIGITAL COMPETIT IVENESS RANKING 2019168
Alpha AlphaLabelBeta BetaLabel Gamma GammaLabel1 2 2 2 2 2 24 4 4 2 2
6.5 4 4 2 28.5 4 4 2 2
10.5 4 4 2 2
2015 2016 2017 2018 2019
61 61 63 63 63
54 57 63 63 63
61 61 63 63 63
60 59 63 63 63
OVERALL
Future readiness
COMPETITIVENESS & DIGITAL RANKINGS
PEER GROUPS RANKINGS
THE AMERICAS (9 countries) POPULATIONS > 20 MILLION (29 countries)
Knowledge
Technology
DIGITAL TRENDS - OVERALL
VENEZUELA
OVERALL PERFORMANCE (63 countries)
OVERALL & FACTORS - 5 years
61 61
63 63 63
61 61
63 63 63
2015 2016 2017 2018 2019
Digital
Competitiveness
9 9 9 9 9
2015 2016 2017 2018 2019
28 2829 29 29
2015 2016 2017 2018 2019
63 63 56 51
63 63 63 6363
63 63 49 63
Knowledge Talent Training & education Scientific concentration
Technology Regulatory framework Capital Technological framework
Future readiness Adaptive attitudes Business agility IT integrationThe direction of the triangle indicates the performance change from the last year: improved or stabledeclined
Overall Factors Sub-Factors
N.B. This graph provides only a comparison of the country’s performance in the two rankings.

169IMD WORLD DIGITAL COMPETIT IVENESS RANKING 2019
u Overall top strengths
w Overall top weaknesses
Subfactors 2015 2016 2017 2018 201961 61 63 63 63
44 39 62 60 56
33 47 50 22 51
Talent Rank Rank Rank
Educational assessment PISA - Math - 52 63 International experience 60 - - Foreign highly-skilled personnel 63 - u 1 Management of cities 63 - 37w Digital/Technological skills 63 - - Net flow of international students - - 56 54
Subfactors 2015 2016 2017 2018 201961 61 63 63 63
61 61 63 63 63
57 59 62 63 63
Regulatory framework Rank Rank Rank
w Starting a business 63 50 w 63 Enforcing contracts 60 63 63 Immigration laws 52 63 61 Development and application of technology63 w 63 48 Scientific research legislation 63 63 63 Intellectual property rights 63 63 w 63
Subfactors 2015 2016 2017 2018 201957 56 62 63 63
52 52 49 51 49
60 61 63 63 63
Adaptive attitudes Rank Rank Rank
E-Participation 61 u 15 60 Internet retailing 52 57 63 Tablet possession 52 u 23 62 Smartphone possession 61 44 62 Attitudes toward globalization 53 62
TECHNOLOGY
Technological framework
Capital Technological framework
Scientific concentration
Training & education Scientific concentration
Talent
Robots in Education and R&D
FUTURE READINESS
IT integration
Business agility IT integration
FACTORS BREAKDOWN - STRENGTHS AND WEAKNESSES
VENEZUELA
Opportunities and threats E-GovernmentWorld robots distribution Public-private partnerships
Total expenditure on R&D (%)Total public expenditure on education Total R&D personnel per capita
Training & education
Adaptive attitudes
Business agility
Venture capital Internet bandwidth speedInvestment in Telecommunications High-tech exports (%)
Regulatory framework
Capital
IT & media stock market capitalization Communications technologyFunding for technological development Mobile Broadband subscribersBanking and financial services Wireless broadbandCountry credit rating Internet users
Higher education achievement Female researchersPupil-teacher ratio (tertiary education) R&D productivity by publicationGraduates in Sciences Scientific and technical employmentWomen with degrees High-tech patent grants
Employee training
KNOWLEDGE
Agility of companies Cyber securityUse of big data and analytics Sofware piracyKnowledge transfer

IMD WORLD DIGITAL COMPETIT IVENESS RANKING 2019170
Append ices and SourcesThe statistical tables are available for subscribers of the IMD World Competitiveness Online.
Visit our eShop
B ackground Stat ist ics 0.0.1 [B] Population - market size Estimates in millions 0.0.2 [B] GDP per capita US$ per capita
Fa ctor I : Knowledge
1.1 Talent
1.1.1 Educational assessment PISA - Math PISA survey of 15-year olds 1.1.2 [S] International experience International experience of senior managers is generally significant 1.1.3 [S] Foreign highly-skilled personnel Foreign highly-skilled personnel are attracted to your country’s business environment 1.1.4 [S] Management of cities Management of cities supports business development 1.1.5 [S] Digital/Technological skills Digital/Technological skills are readily available 1.1.6 Net flow of international students Tertiary-level international students inbound minus students outbound (per 1000 people)
1.2 Tra in ing & educat ion
1.2.1 [S] Employee training Employee training is a high priority in companies 1.2.2 Total public expenditure on education Percentage of GDP 1.2.3 Higher education achievement Percentage of population that has attained at least tertiary education for persons 25-34 1.2.4 Pupil-teacher ratio (tertiary education) Number of pupils per teacher 1.2.5 Graduates in Sciences % of graduates in ICT, Engineering, Math & Natural Sciences 1.2.6 Women with degrees Share of women who have a degree in the population 25-65
1.3 Sc ient i f ic concentrat ion
1.3.1 Total expenditure on R&D (%) Percentage of GDP 1.3.2 Total R&D personnel per capita Full-time work equivalent (FTE) per 1000 people 1.3.3 Female researchers % of total (headcount FT&PT) 1.3.4 R&D productivity by publication No. of scientific articles over R&D expenditure (as % GDP) 1.3.5 Scientific and technical employment % of total employment 1.3.6 High-tech patent grants % of all patents granted by applicant’s origin (average 2015-2017) 1.3.7 Robots in Education and R&D number of robots
Fa ctor I I : Technology
2.1 Regulatory framework
2.1.1 Starting a business Distance to Frontier 2.1.2 Enforcing contracts Distance to Frontier 2.1.3 [S] Immigration laws Immigration laws do not prevent your company from employing foreign labor 2.1.4 [S] Development & application of technology Development and application of technology are supported by the legal environment 2.1.5 [S] Scientific research legislation Laws relating to scientific research do encourage innovation 2.1.6 [S] Intellectual property rights Intellectual property rights are adequately enforced
2.2 Capi tal
2.2.1 IT & media stock market capitalization % of total stock market capitalization 2.2.2 [S] Funding for technological development Funding for technological development is readily available 2.2.3 [S] Banking and financial services Banking and financial services do support business activities efficiently 2.2.4 Country credit rating Index (0-60) of three country credit ratings: Fitch, Moody’s and S&P 2.2.5 [S] Venture capital Venture capital is easily available for business 2.2.6 Investment in Telecommunications Percentage of GDP

171IMD WORLD DIGITAL COMPETIT IVENESS RANKING 2019
2.3 Technological framework
2.3.1 [S] Communications technology Communications technology (voice and data) meets business requirements 2.3.2 Mobile Broadband subscribers 3G & 4G market, % of mobile market 2.3.3 Wireless broadband Penetration rate (per 100 people) 2.3.4 Internet users Number of internet users per 1000 people/ Source: Computer Industry Almanac 2.3.5 Internet bandwidth speed Average speed 2.3.6 High-tech exports (%) Percentage of manufactured exports
Factor I I I : Future R eadiness
3.1 Adapt ive at t i tudes
3.1.1 E-Participation Use of online services that facilitate public’s interaction with government 3.1.2 Internet retailing US$ Per ‘000 People 3.1.3 Tablet possession % households 3.1.4 Smartphone possession % households 3.1.5 [S] Attitudes toward globalization Attitudes toward globalization are generally positive in your society
3.2 Business agi l i ty
3.2.1 [S] Opportunities and threats Companies are very good at responding quickly to opportunities and threats 3.2.2 World robots distribution Percentage share of world robots 3.2.3 [S] Agility of companies Companies are agile 3.2.4 [S] Use of big data and analytics Companies are very good at using big data and analytics to support decision-making 3.2.5 [S] Knowledge transfer Knowledge transfer is highly developed between companies and universities
3.3 IT integrat ion
3.3.1 E-Government Provision of online government services to promote access and inclusion of citizens 3.3.2 [S] Public-private partnerships Public and private sector ventures are supporting technological development 3.3.3 [S] Cyber security Cyber security is being adequately addressed by corporations 3.3.4 Sofware piracy % of unlicensed software installation

IMD WORLD DIGITAL COMPETIT IVENESS RANKING 2019172
Standard notes used in the data tables
When statistical data is not available or is too out-dated to be relevant for a particular economy, the name appears at the bottom of the statistical table and a dash is shown. When the data is older than the reference year, the year of the data is shown next to the criterion value.
Exchange Rate As most data are expressed in U.S. dollars, you will find the exchange rates used at the beginning of the Statistical Tables.the sources for the Exchange Rates are International Financial Statistics Online March 2019 (IMF) and national sources. Per capita For all information presented “per capita” the sources for the population are Passport GMID (Euromonitor) and national sources.
% of GDP For all information presented as a “percentage of GDP” the sources for GDP are the OECD Main Economic Indicators April 2019 and national sources.
[B] GDP per capita (US$ per capita)
OECD (2019), Main Economic Indicators - complete databaseNational sourcesProvisional data or estimates for most recent year.
[B] Population - market size (Estimates in millions)
UNDP Human Development Report 2018
Mid-year estimates. Croatia: new census in 2011 with a new methodology.India: break in series in 2011. Jordan: series have been revised according to the the new Population and Housing Census published in 2016. Portugal: methodological change in 2011. Rus-sia: including Crimea as of 2015. UAE: re-estimation of the national population was made by the National Bureau of Statistics in 2010 (consequent increase as of 2008). Lithuania: break in series 2011 - census revised population figure downwards by 10% (emigration to EU over past decade). Philippines: Latest available census data is for 2010. 2011-2015 figures are projections based on PSA’s annual Philippines in Figures publication.
Factor 1: Knowledge
1.1 Talent
1.1.1 Educational assessment PISA - Math (PISA survey of 15-year olds)PISA 2015 (OECD)http://www.oecd.org/pisa/
The OECD’s Programme for International Student Assessment (PISA) is a regular survey of 15-year olds which assesses aspects of their preparedness for adult life. Mathematical literacy: an individual’s capacity to identify and understand the role that mathematics plays in the world, to make well-founded judgments and to use and engage with mathematics in ways that meet the needs of that individual’s life as a constructive, concerned and reflective citizen. Scientific literacy: an individual’s scientific knowledge and use of that knowledge to identify questions, to acquire new knowledge, to explain scientific phenomena, and to draw evidence based conclusions about science-related issues, understanding of the characteristic features of science as a form of human knowledge and enquiry, awareness of how science and technology shape our material, intellectual, and cultural environments, and willingness to engage in science-related issues, and with the ideas of science, as a reflective citizen.
Notes and S ources by Cr i ter ia

173IMD WORLD DIGITAL COMPETIT IVENESS RANKING 2019
1.1.6 Net flow of international students (Tertiary-level international students inbound minus students outbound (per 1000 people))UNESCO http://stats.uis.unesco.org
Net flow of internationally mobile students (inbound from abroad studying in a given country minus outbound from a given country), both sexes, in tertiary education. Data can refer to the school or financial year prior or after the reference year.
1.2 Training & education
1.2.2 Total public expenditure on education (Percentage of GDP)UNESCO http://stats.uis.unesco.org Eurostat April 2019 National sources Chile and Jordan: Budgetary central government. Philippines: Includes expenditure for items other than basic and higher education such as vocational education, culture and sports.
1.2.3 Higher education achievement (Percentage of population that has attained at least tertiary education for persons 25-34)OECD Education at a Glance 2018 National sources Percentage of the population aged 25-34 that has attained tertiary-type B and tertiary-type A and advance research programs. Tertiary-type A education covers more theoretical programs that give access to advanced research programs and to professions with high general skills requirements. Tertiary-type B education covers more practical or occupationally specific programs that provide participants with a qualification of immediate relevance to the labor market. Hong Kong: Figures starting from 2012 exclude post-secondary diploma or certificate and exclude foreign domestic helpers. New-Zealand and Slovenia: break in series. Peru: Tertiary education type A refers to University tertiary level and terciary education type B refers to Non-university tertiary level; for 25 years and more. Singapore: proportion of resident non-students aged 25-34 years with polytechnic, professional qualification or other diploma, or university qualification. Japan: Data for tertiary education include upper secondary or post-secondary non-tertiary programmes (less than 5% of adults are in this group).
1.2.4 Pupil-teacher ratio (tertiary education) (Number of pupils per teacher)UNESCO http://stats.uis.unesco.org OECD Education at a Glance 2018 National sources Average number of pupils per teacher at a given level of education, based on headcounts of both pupils and teachers. Tertiary educa-tion (ISCED levels 5 to 8). Tertiary education builds on secondary education, providing learning activities in specialised fields of edu-cation. It aims at learning at a high level of complexity and specialisation. Tertiary education includes what is commonly understood as academic education but also includes advanced vocational or professional education. Australia, Czech Republic, Estonia, Greece and Ireland: based on full-time equivalents. Philippines: Academic Year 2016-2017 data. Data includes students and faculty from both public and private tertiary educational institutions.
1.2.5 Graduates in Sciences (% of graduates in ICT, Engineering, Math & Natural Sciences)OECD Education at a Glance 2018 UNESCO National sources
Share of graduates in Natural Sciences; Mathematics and Statistics; Computing, Information and Communication technologies. In tertiary education (ISCED2011 levels 5 to 8), both sexes (%). Philippines: Academic Year 2016-2017 data. Does not include engi-neering.
1.2.6 Women with degrees (Share of women who have a degree in the population 25-65)OECD Education at a Glance
Educational attainment in tertiary education of 25-64 year-old females expressed as a percentage of the female population 25-64. Note: In most countries data refer to ISCED 2011 (codes 5/6/7/8). For Indonesia and Saudi Arabia data refer to ISCED-97 (codes 5A/5B/6)
Scientific concentration
1.3.1 Total expenditure on R&D (%) (Percentage of GDP)OECD Main Science and Technology Indicators 2/2018 UNESCO http://stats.uis.unesco.org National sources
National estimates, projections or provisional data for the most recent year. Chile, Denmark, France, Japan, Korea, Netherlands, Portugal, Slovenia, Spain and Sweden: break in series. Hungary (up to 2003), Israel: defense excluded(all or mostly). Indonesia: Estimate based on target GERD by the Ministry of Science and Technology. Sweden: underestimated or based on underestimated data. USA: excludes most or all capital expenditure.

IMD WORLD DIGITAL COMPETIT IVENESS RANKING 2019174
1.3.2 Total R&D personnel per capita (Full-time work equivalent (FTE) per 1000 people)OECD Main Science and Technology Indicators 2/2018 UNESCO http://stats.uis.unesco.org National sources
National estimates, projections or provisional data for most recent year. Czech Republic, Colombia, Denmark, Finland, Korea, Mex-ico, Netherlands, Hungary, Japan, Portugal, Slovenia, Sweden and Taiwan: break in series. United Kingdom: underestimated or based on underestimated data. Jordan, Philippines: based on headcount, not FTE.
1.3.3 Female researchers (% of total (headcount FT&PT))UNESCO
Female researchers (headcount) who are mainly or partially employed in R&D. This includes staff employed both full-time and part-time. Expressed as a percentage of the total workforce (male + female)
1.3.4 R&D productivity by publication (No. of scientific articles over R&D expenditure (as % GDP))NSF Science & Engineering Indicators 2018 Courtesy: National Science Foundation National sources
The indicator is calculated as a ratio between the number of scientific articles by author’s origin and the total expenditure in R&D as % GDP, which clearly include the input costs to produce research (e.g. researchers’ salaries, equipement etc.). The result gives therefore the number of scientific articles published every year for a one percent (of GDP) expenditure in R&D activities. This meas-ure can be consider as a proxy to assess the efficiency (or productivity) in producing high-level scientific research at country level.
1.3.5 Scientific and technical employment (% of total employment)Business Monitor International Eurostat
Scientific and technical employment as a % of total employment. Defined as formal employment within the ‘scientific and technical’ sector. For more information, refer to NACE2 category M (or equivalent).
1.3.6 High-tech patent grants (% of all patents granted by applicant’s origin (average 2014-2016))WIPO Statistics Database http://www.wipo.int/ipstats/en/statistics/patents/ TIPO for Taiwan
High-Tech patent grants as a percentage of total patent grants (Direct and PCT national phase entries) by applicant’s origin. Three year average to reduce volatility. Counts are based on the grant date. Country of origin refers to the country of residency of the first-named applicant in the application. Taiwan: data compiled by TIPO using data supplied by international patent offices (USPTO, JPO, EPO, KIPO, SIPO).
1.3.7 Robots in Education and R&D (number of robots)World Robotics 2018 International Federation of Robotics (IFR)
Industrial robot as defined by ISO 8373:2012: an automatically controlled, reprogrammable, multipurpose manipulator programmable in three or more axes, which can be either fixed in place or mobile for use in industrial automation applications.
The primary source is data on robot installations by country, industry and application that nearly all industrial robot suppliers world-wide report to the IFR Statistical Department directly. Several national robot associations collect data on their national robot markets and provide their results as secondary data to the IFR. This data is used to validate and complete the IFR primary data.
IFR Statistical Departments estimates the operational stock assuming an average service life of 12 years with an immediate with-drawal from service afterwards.
Factor 2: Technology
2.1 Regulatory framework
2.1.1 Starting a business (Distance to Frontier)Doing Business 2019 - World Bank
The distance to frontier score aids in assessing the absolute level of regulatory performance and how it improves over time. This measure shows the distance of each economy to the “frontier,” which represents the best performance observed on each of the indicators across all economies in the Doing Business sample since 2005. This allows users both to see the gap between a par-ticular economy’s performance and the best performance at any point in time and to assess the absolute change in the economy’s regulatory environment over time as measured by Doing Business. An economy’s distance to frontier is reflected on a scale from 0 to 100, where 0 represents the lowest performance and 100 represents the frontier. For example, a score of 75 in DB 2016 means an economy was 25 percentage points away from the frontier constructed from the best performances across all economies and across time. A score of 80 in DB 2017 would indicate the economy is improving. In this way the distance to frontier measure complements the annual ease of doing business ranking, which compares economies with one another at a point in time.

175IMD WORLD DIGITAL COMPETIT IVENESS RANKING 2019
2.1.2 Enforcing contracts (Distance to Frontier)Doing Business 2019 - World Bank
The distance to frontier score aids in assessing the absolute level of regulatory performance and how it improves over time. This measure shows the distance of each economy to the “frontier,” which represents the best performance observed on each of the indicators across all economies in the Doing Business sample since 2005. This allows users both to see the gap between a par-ticular economy’s performance and the best performance at any point in time and to assess the absolute change in the economy’s regulatory environment over time as measured by Doing Business. An economy’s distance to frontier is reflected on a scale from 0 to 100, where 0 represents the lowest performance and 100 represents the frontier. For example, a score of 75 in DB 2016 means an economy was 25 percentage points away from the frontier constructed from the best performances across all economies and across time. A score of 80 in DB 2017 would indicate the economy is improving. In this way the distance to frontier measure complements the annual ease of doing business ranking, which compares economies with one another at a point in time.
2.2 Capital
2.2.1 IT & media stock market capitalization (% of total stock market capitalization)Thomson One Banker Thomson Data Stream
Datastream Telecom, Media and IT (TMT) Market Value in national currency. Calculated as a percentage of Datastream Total Market Value in national currency. Figures for close-of-business on the 29th March each year.
2.2.4 Country credit rating (Index (0-60) of three country credit ratings: Fitch, Moody’s and S&P)Fitch, Moody’s and S&P
IMD WCC created index of the three country credit ratings Fitch, Moody’s and S&P. Each rating, including the outlook, is converted to a numerical score from 20-0 and totalled for each country.
2.2.6 Investment in Telecommunications (Percentage of GDP)Passport GMID Source: © Euromonitor International 2019 National sources
Investment refers to as the annual capital expenditure; this is the gross annual investment in telecom (including fixed, mobile and other services) for acquiring property and network. The term investment means the expenditure associated with acquiring the owner-ship of property (including intellectual and non-tangible property such as computer software) and plant. This includes expenditure on initial installations and on additions to existing installations where the usage is expected to be over an extended period of time. Note that this applies to telecom services that are available to the public, and exclude investment in telecom software or equipment for private use.
2.3 Technological framework
2.3.2 Mobile Broadband subscribers (3G & 4G market, % of mobile market)Business Monitor International
Total active mobile 3G and 4G subscriptions, excluding broadband connections on dedicated data SIM cards or USB dongles. Data given as a percentage of the total mobile market.
2.3.3 Wireless broadband (Penetration rate (per 100 people))Passport GMID Source: © Euromonitor International 2019
The penetration rates of wireless broadband is calculated by dividing the number of Wireless Broadband subscribers by the total population and multiplying by 100. Wireless-broadband subscriptions refer to the sum of satellite broadband, terrestrial fixed wireless broadband and active mobile-broadband subscriptions to the public Internet. The indicator refers to total active wireless-broadband Internet subscriptions using satellite, terrestrial fixed wireless or terrestrial mobile connections. Broadband subscriptions are those with an advertised download speed of at least 256 kbit/s. In the case of mobile-broadband, only active subscriptions are included (those with at least one access to the Internet in the last three months or with a dedicated data plan). The service can be standalone with a data card, or an add-on service to a voice plan. The indicator does not cover fixed (wired)-broadband or Wi-Fi subscriptions. Both residential and business subscriptions should be included.
2.3.4 Internet users (Number of internet users per 1000 people/ Source: Computer Industry Almanac )Computer Industry Almanac Inc. April 2018 National sources

IMD WORLD DIGITAL COMPETIT IVENESS RANKING 2019176
2.3.5 Internet bandwidth speed (Average speed)M-Labs / cable.co.uk Ookla Akamai OpenSignal
Average connection speed in Mbps: data transfer rates for Internet access by end-users.
Values presented are an average compiled from four different sources: M-Labs / cablie.co.uk; Ookla; Akamai; and OpenSignal.
2.3.6 High-tech exports (%) (Percentage of manufactured exports)The World Bank (Development Data Group) http://databank.worldbank.org National sources
High-technology exports are products with high R&D intensity, such as in aerospace, computers, pharmaceuticals, scientific instru-ments, and electrical machinery.
Factor 3: Future readiness
Adaptive attitudes
3.1.1 E-Participation (Use of online services that facilitate public’s interaction with government)UN E-Government Knowledge Database
The e-participation index (EPI) measures the use of online services to facilitate provision of information by governments to citizens (“e-information sharing”), interaction with stakeholders (“e-consultation”), and engagement in decision-making processes (“e-deci-sion making”).“3.1.2 Internet retailing (US$ Per ‘000 People)Passport GMID Source: © Euromonitor International 2019
Retail Value excluding sales tax
3.1.3 Tablet possession (% households)Passport GMID Source: © Euromonitor International 2019
Percentage of households having at least one item. Portable, usually battery-powered, and very thin personal computer contained with a touchscreen panel.
3.1.4 Smartphone possession (% households)Passport GMID Source: © Euromonitor International 2019
Percentage of households having at least one item. A smartphone is a cellular telephone with an integrated computer and other fea-tures not originally associated with telephones, such as an operating system, Web browsing, music and movie player, camera and camcorder, GPS navigation, voice dictation for messaging, the ability to run software applications, etc.
Business agility
3.2.2 World robots distribution (Percentage share of world robots)World Robotics 2018International Federation of Robotics (IFR)
Industrial robot as defined by ISO 8373:2012: an automatically controlled, reprogrammable, multipurpose manipulator programmable in three or more axes, which can be either fixed in place or mobile for use in industrial automation applications.
The primary source is data on robot installations by country, industry and application that nearly all industrial robot suppliers world-wide report to the IFR Statistical Department directly. Several national robot associations collect data on their national robot markets and provide their results as secondary data to the IFR. This data is used to validate and complete the IFR primary data.
IFR Statistical Departments estimates the operational stock assuming an average service life of 12 years with an immediate with-drawal from service afterwards.

177IMD WORLD DIGITAL COMPETIT IVENESS RANKING 2019
IT integration
3.3.1 E-Government (Provision of online government services to promote access and inclusion of citizens)UN E-Government Knowledge Database
The E-Government Development Index presents the state of E-Government Development of the United Nations Member States. Along with an assessment of the website development patterns in a country, the E-Government Development index incorporates the access characteristics, such as the infrastructure and educational levels, to reflect how a country is using information technologies to promote access and inclusion of its people. The EGDI is a composite measure of three important dimensions of e-government, namely: provision of online services, telecommunication connectivity and human capacity.
3.3.4 Sofware piracy (% of unlicensed software installation)BSA Global Software Survey
The BSA Global Software Survey calculates unlicensed installations of software that runs on PCs — including desktops, laptops, and ultra-portables, such as netbooks. A key component of the BSA Global Software Survey is a global survey of more than 20,000 home and enterprise PC users, conducted by IDC. In addition, a parallel survey was carried out among 2,200 IT managers in 22 countries. Please consult the original report for a more detailed explanation of the methodology.
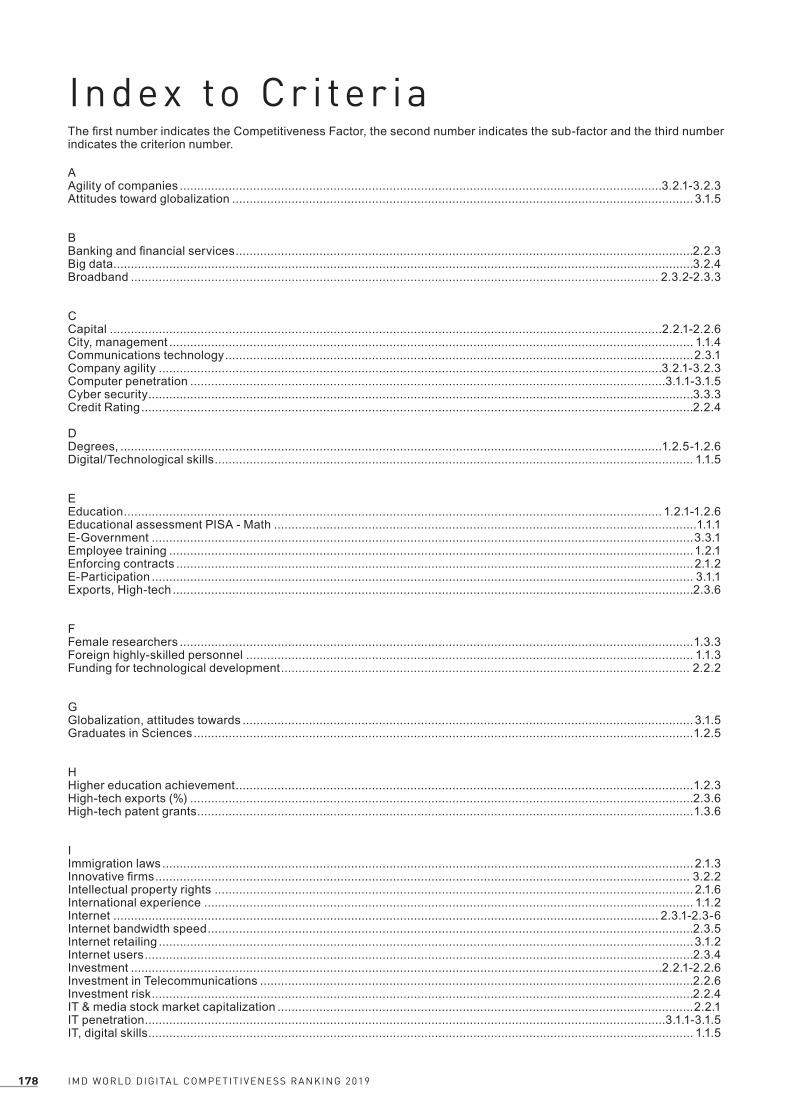
IMD WORLD DIGITAL COMPETIT IVENESS RANKING 2019178
AAgility of companies ..........................................................................................................................................3.2.1-3.2.3Attitudes toward globalization .................................................................................................................................... 3.1.5
BBanking and financial services ...................................................................................................................................2.2.3Big data ......................................................................................................................................................................3.2.4Broadband ....................................................................................................................................................... 2.3.2-2.3.3
CCapital ..............................................................................................................................................................2.2.1-2.2.6City, management ...................................................................................................................................................... 1.1.4Communications technology ......................................................................................................................................2.3.1Company agility ................................................................................................................................................3.2.1-3.2.3Computer penetration ........................................................................................................................................3.1.1-3.1.5Cyber security ............................................................................................................................................................3.3.3Credit Rating ..............................................................................................................................................................2.2.4
DDegrees, ...........................................................................................................................................................1.2.5-1.2.6Digital/Technological skills ......................................................................................................................................... 1.1.5
EEducation .......................................................................................................................................................... 1.2.1-1.2.6Educational assessment PISA - Math .........................................................................................................................1.1.1E-Government ...........................................................................................................................................................3.3.1Employee training ......................................................................................................................................................1.2.1Enforcing contracts ....................................................................................................................................................2.1.2E-Participation ........................................................................................................................................................... 3.1.1Exports, High-tech .....................................................................................................................................................2.3.6
FFemale researchers ...................................................................................................................................................1.3.3Foreign highly-skilled personnel ................................................................................................................................ 1.1.3Funding for technological development ..................................................................................................................... 2.2.2
GGlobalization, attitudes towards ................................................................................................................................. 3.1.5Graduates in Sciences ...............................................................................................................................................1.2.5
HHigher education achievement ...................................................................................................................................1.2.3High-tech exports (%) ................................................................................................................................................2.3.6High-tech patent grants ..............................................................................................................................................1.3.6
IImmigration laws ........................................................................................................................................................ 2.1.3Innovative firms ......................................................................................................................................................... 3.2.2Intellectual property rights ......................................................................................................................................... 2.1.6International experience ............................................................................................................................................ 1.1.2Internet ............................................................................................................................................................ 2.3.1-2.3-6Internet bandwidth speed ...........................................................................................................................................2.3.5Internet retailing .........................................................................................................................................................3.1.2Internet users .............................................................................................................................................................2.3.4Investment ........................................................................................................................................................2.2.1-2.2.6Investment in Telecommunications ............................................................................................................................2.2.6Investment risk ...........................................................................................................................................................2.2.4IT & media stock market capitalization .......................................................................................................................2.2.1IT penetration .....................................................................................................................................................3.1.1-3.1.5IT, digital skills ............................................................................................................................................................ 1.1.5
Index to Cr i ter iaThe first number indicates the Competitiveness Factor, the second number indicates the sub-factor and the third number indicates the criterion number.

179IMD WORLD DIGITAL COMPETIT IVENESS RANKING 2019
K-LKnowledge transfer ....................................................................................................................................................3.2.5Legislation .........................................................................................................................................................2.1.1-2.1.6
MManagement of cities ................................................................................................................................................. 1.1.4Mobile Broadband subscribers...................................................................................................................................2.3.2
N-ONet flow of international students ............................................................................................................................... 1.1.6Opportunities and threats ..........................................................................................................................................3.2.1
PPiracy .........................................................................................................................................................................3.3.4Public-private partnerships ........................................................................................................................................3.3.2Pupil-teacher ratio (tertiary education) .......................................................................................................................1.2.4
RR&D ................................................................................................................................................................. 1.3.1-1.3.6R&D productivity ........................................................................................................................................................1.3.4Regulations ........................................................................................................................................................2.1.1-2.1.6Robotics ........................................................................................................................................................... 1.3.7, 3.2.2
SScientific and technical employment ..........................................................................................................................1.3.5Scientific research legislation .................................................................................................................................... 2.1.5Skills ........................................................................................................................................................1.1.2, 1.1.3, 1.1.5Smartphone possession ............................................................................................................................................ 3.1.4Sofware piracy ...........................................................................................................................................................3.3.4Starting a business .................................................................................................................................................... 2.1.1
TTablet possession ...................................................................................................................................................... 3.1.3Talent .......................................................................................................................................................1.1.2, 1.1.3, 1.1.5Technological regulation ............................................................................................................................................ 2.1.4Technology ...................................................................................................................................................... 2.3.1-2.3-6Total expenditure on R&D (%) .................................................................................................................................... 1.3.1Total public expenditure on education ........................................................................................................................1.2.2Total R&D personnel per capita..................................................................................................................................1.3.2Training ......................................................................................................................................................................1.2.1
U-VUse of big data and analytics .....................................................................................................................................3.2.4Venture capital ...........................................................................................................................................................2.2.5
WWireless broadband ...................................................................................................................................................2.3.3Women with degrees .................................................................................................................................................1.2.6


![œ‹際瞭望台.pdfWORLDWIDE (International Institute for Management Development, IMD tž (World Competitiveness Yearbook) (UBS Prices and , (IMD) [2] [3] [4] [5] [6] [12] [131 [25]](https://static.documents.pub/doc/80x56/60dc61b7e3f85f0dd33cb958/oeecoepdf-worldwide-international-institute-for-management-development.jpg)


