6 October 2020 Version 06 IMERG Release Notes 1 V06 IMERG Release Notes George J. Huffman, David T. Bolvin, Eric J. Nelkin, Erich F. Stocker, Jackson Tan 6 October 2020 The algorithm for the Integrated Multi-satellitE Retrievals for GPM (IMERG) has now been upgraded to Version 06 and all datasets have been reprocessed to V06B. The transition to V06 for the IMERG Final Run began 13 March 2019 at PPS and the new data started flowing down to the GES DISC as well. However, on 15 March 2019 an error was discovered in processing the initial batches of V06 IMERG Final Run months. A design choice in the code ended up retaining microwave precipitation estimates in the latitude band 60°N-S when there is snow/ice on the surface, rather than masking out the estimates due to low performance in such cases. [Masking for microwave retrievals over surface snow and ice outside that band is correct.] All then-existent V06A Monthly and Half-hourly IMERG Final Run products (June 2014-December 2015) were retracted, and corrected datasets released. Then in late May a damaged land/ocean map was detected in the Kalman filter module. While easy to correct, it required yet another retraction and reprocessing for the Final, this time as V06B. In addition, the Early and Late Run Initial Processing was promoted to V06B on 22 May. This change directly affected the output when the new Kalman statistics were implemented at 1337 UTC 5 June 2019. All prior V06A Early and Late files computed as IP were replaced at the end of retrospective processing. However, by accident the Initial Processing for Early and Late Runs continued to have V06A in the metadata until 22 September 2020. The GPM-era Final Run begins on 1 June 2014 to allow a spin-up of calibration files and extends to the (delayed) present. Retrospective processing for the TRMM era Final Run began on 15 April 2019. Due to IR data issues at present, the actual start of the record is June 2000 to allow spin-up of the calibration files. Starting with September 2019 the ERA-I reanalysis that was used to compute the Final Run Probability of Liquid Precipitation Phase (PLPP) datafield was superseded by ERA-5. Some notably differences exist in the vicinity of the 0°C wet bulb isotherm, but overall the change is considered not to warrant a change in version designator. Initial Processing of the Early and Late Runs began with 1 May, with Retrospective Processing commencing when the Final Run was fully retrospectively processed. Version 06B supersedes all prior IMERG versions, and users are urged to shift to the new datasets as soon as practical. This set of release notes covers all the IMERG Runs – Early, Late, and Final – because prior incarnations of the separate release notes for the near-real-time Early and Late and for the Final turned out to be near duplicates of each other. Changes from Version 05 to 06 • The dimensions of the (native) HDF5 data fields have changed from (lon, lat) to (time, lon, lat), with the corresponding lengths of (1, 3600, 1800). This is done to conform to GES DISC archiving conventions. In most cases this should be transparent to application programs, but some users have reported needing to re-work code that makes individual calls to the HDF API. Note well that some applications presume that the ordering of the dimensions is (time, lat, lon) without checking the metadata, so it is incumbent on the user to verify a few test cases, for example, using the Giovanni interactive system (https://giovanni.gsfc.nasa.gov/giovanni/). • Up through V05, the “displacement vectors” used in the quasi-Lagrangian time interpolation scheme were computed from the IR data. In V06, these vectors are now computed from
Transcript
6 October 2020 Version 06 IMERG Release Notes 1
V06 IMERG Release Notes George J. Huffman, David T. Bolvin, Eric J. Nelkin, Erich F. Stocker, Jackson Tan
6 October 2020 The algorithm for the Integrated Multi-satellitE Retrievals for GPM (IMERG) has now been upgraded to Version 06 and all datasets have been reprocessed to V06B. The transition to V06 for the IMERG Final Run began 13 March 2019 at PPS and the new data started flowing down to the GES DISC as well. However, on 15 March 2019 an error was discovered in processing the initial batches of V06 IMERG Final Run months. A design choice in the code ended up retaining microwave precipitation estimates in the latitude band 60°N-S when there is snow/ice on the surface, rather than masking out the estimates due to low performance in such cases. [Masking for microwave retrievals over surface snow and ice outside that band is correct.] All then-existent V06A Monthly and Half-hourly IMERG Final Run products (June 2014-December 2015) were retracted, and corrected datasets released. Then in late May a damaged land/ocean map was detected in the Kalman filter module. While easy to correct, it required yet another retraction and reprocessing for the Final, this time as V06B. In addition, the Early and Late Run Initial Processing was promoted to V06B on 22 May. This change directly affected the output when the new Kalman statistics were implemented at 1337 UTC 5 June 2019. All prior V06A Early and Late files computed as IP were replaced at the end of retrospective processing. However, by accident the Initial Processing for Early and Late Runs continued to have V06A in the metadata until 22 September 2020. The GPM-era Final Run begins on 1 June 2014 to allow a spin-up of calibration files and extends to the (delayed) present. Retrospective processing for the TRMM era Final Run began on 15 April 2019. Due to IR data issues at present, the actual start of the record is June 2000 to allow spin-up of the calibration files. Starting with September 2019 the ERA-I reanalysis that was used to compute the Final Run Probability of Liquid Precipitation Phase (PLPP) datafield was superseded by ERA-5. Some notably differences exist in the vicinity of the 0°C wet bulb isotherm, but overall the change is considered not to warrant a change in version designator. Initial Processing of the Early and Late Runs began with 1 May, with Retrospective Processing commencing when the Final Run was fully retrospectively processed. Version 06B supersedes all prior IMERG versions, and users are urged to shift to the new datasets as soon as practical. This set of release notes covers all the IMERG Runs – Early, Late, and Final – because prior incarnations of the separate release notes for the near-real-time Early and Late and for the Final turned out to be near duplicates of each other. Changes from Version 05 to 06 • The dimensions of the (native) HDF5 data fields have changed from (lon, lat) to (time, lon, lat),
with the corresponding lengths of (1, 3600, 1800). This is done to conform to GES DISC archiving conventions. In most cases this should be transparent to application programs, but some users have reported needing to re-work code that makes individual calls to the HDF API. Note well that some applications presume that the ordering of the dimensions is (time, lat, lon) without checking the metadata, so it is incumbent on the user to verify a few test cases, for example, using the Giovanni interactive system (https://giovanni.gsfc.nasa.gov/giovanni/).
• Up through V05, the “displacement vectors” used in the quasi-Lagrangian time interpolation scheme were computed from the IR data. In V06, these vectors are now computed from
6 October 2020 Version 06 IMERG Release Notes 2
Modern-Era Retrospective Analysis for Research and Applications, Version 2 (MERRA-2) and Goddard Earth Observing System model (GEOS) Forward Processing (FP) data, as ingested by PPS. See https://pmm.nasa.gov/sites/default/files/document_files/MorphingInV06IMERG.pdf for details, as well as Tan et al. (2019).
• In V05, only the SSMIS sensor was given a calibration to the (CORRA-calibrated) GMI. The other constellation sensors were judged to be similar enough to the GMI that calibrations were not applied. In V06, all constellation sensors are calibrated to (CORRA-calibrated) GMI.
• Goddard Profiling Algorithm (GPROF) V05 continues to be used to compute precipitation estimates for all microwave sensors as input, except for SAPHIR, for which the Precipitation Retrieval and Profiling Scheme (PRPS) is used.
• GPROF applied to TRMM Microwave Imager (TMI; GPROF-TMI) V05 estimates are computed for the GPM era and incorporated in the V06 IMERG datasets (unlike V05).
• We continue to provide estimates from all constellation members in the microwave-only precipitation field (HQprecipitation) and the complete precipitation fields (precipitationCal, precipitationUncal) over the fully global domain (90ºN-S). Note: microwave estimates over snowy/icy surface types are not masked out in HQprecipitation, but are for precipitationCal and precipitationUncal (as was done in V05). So, in the latter two, IR fill-in occurs over 60°N-S and there are holes at higher latitudes. This was true in V05, but now V06 morphs the microwave estimates at the high latitudes, so the holes are much smaller than the overpass-only scheme used at high latitudes in V05.
• SAPHIR estimates are incorporated into IMERG for the first time in V06, and are computed with PRPS. However, communication issues with Megha Tropiques that began on 15 December 2018 have reduced the number of available orbits to about 25% of the day. Furthermore, an unexpected shift in nadir Earth Incidence Angle prevented the data from being used until 27 June 2019.
• The Version 05 GPROF estimates for AMSU, ATMS, and MHS do not provide estimates for the 5, 8, and 5 footprints (respectively) at each swath edge due to algorithm issues revealed in early testing. The same is true for 5 footprints at each swath edge for the PRPS estimates computed for SAPHIR.
• At the start of the GPM era (March 2014), we continue to use TRMM-based calibrations through May 2014, unlike V05, in which GPM-based calibrations started immediately. This is done to allow the GPM-based calibrations to spin up before they are applied, since calibrations based on fully populated rotating match-up arrays are available from TRMM. Due to code development considerations, GPROF applied to GPM Microwave Imager (GMI; GPROF-GMI) V05 estimates are not incorporated in the V06 IMERG datasets while TRMM-based calibrations continue in this first 2.5 months of the GPM era. We expect to use GMI in this first 2.5 months of the GPM era in V07 IMERG.
• We continue the practice of thresholding input precipitation rates to adjust fractional coverage; GPROF estimates are currently thresholded at 0.03 mm/h, and PRPS-SAPHIR has a threshold of zero.
• Prior internal storage limitations were removed, eliminating discretization of the output precipitation rates and increasing the maximum permitted rate from 50 to 200 mm/h.
• We continue the practice started with V04 of calibrating the Combined Radar-Radiometer Algorithm (CORRA) to the Global Precipitation Climatology Project (GPCP) V2.3 monthly satellite-gauge (SG) product over ocean (at middle and high latitudes) and land (at low and middle) to compensate for low (high) CORRA bias over non-tropical oceans (land).
6 October 2020 Version 06 IMERG Release Notes 3
• We now estimate the t=0 (i.e., actual microwave overpass data, contained in the HQprecipitation field) correlations in the half-hourly Quality Index; in V05 they were identically 1. See the “IMERG Quality Index” document (https://gpm.nasa.gov/sites/default/files/2020-02/IMERGV06_QI_0.pdf) for a summary.
• “Rippling” in the animation of IMERG data in the GPM era has been reduced somewhat from V05 to V06, but continues to be visible. This indicates that the different sensors continue to have different depictions of the same precipitation features due to each sensor type’s unique combination of resolution and channel selection. We see similar fluctuations in early animations of the TRMM era as well (see below).
Specific Comments About the TRMM Era Significant effort has gone into ensuring that there is reasonable homogeneity in the IMERG record given the constantly evolving satellite constellation. This includes ensuring that the Level 1 (brightness temperature) and Level 2 (precipitation) data are as consistent as possible with the GMI across the constellation of passive microwave radiometers during the GPM era, and correspondingly TMI in the TRMM era. Then IMERG enforces calibration to the perceived “best” core satellite estimate, which is CORRA, as well as selective climatological calibration to a recognized standard (the GPCP SG product) where CORRA is known to be low (high-latitude oceans) or high (tropical and mid-latitude land). Despite this intercalibration, users should note that variations remain across sensors and between the TRMM and GPM eras. Specifically: • Version 06 is the first time that CORRA and IMERG have been computed for both the TRMM
and GPM era. As such, we expect to learn a great deal about how the detailed behavior of the IMERG estimates differs between the two eras.
• The TRMM CORRA is based on fewer channels of microwave and radar data than for the GPM CORRA, so one would expect the underlying calibrations to shift across the transition boundary (May/June 2014). Preliminary analyses show an affect on the histogram of precipitation rates (see below).
• The TRMM CORRA only covers the latitude band 35°N-S, while it is 65°N-S for GPM. Thus, calibrations to TRMM CORRA outside 35°N-S are necessarily approximate, based on the (monthly climatological) “shape” of the GPM CORRA calibration field, scaled to match the precipitation volume for each month of TRMM-era calibration for northern and southern hemisphere ocean and land separately in the region 33°N-S. See the IMERG Technical Document (listed below in “Key IMERG Documents”) for more details.
• The early TRMM era contains estimates from SSMI and AMSU-B sensors, which are less capable than the subsequent SSMIS and MHS sensors that were phased in starting in 2005. This implies that a shift in estimation skill is likely.
• As in the GPM era, “rippling” is visible in the animation of IMERG data in the TRMM era as well. In addition, the early TRMM era lacked microwave observations for several hours around the 0/12 and 04/16 UTC orbital times. As a result, there is more use of IR-based estimates in the first few years. IR estimates are generally of lower quality and potentially introduce a systematic regional offset in the timing of precipitation systems. [IR Tb’s tend to lag precipitation occurrence, but IMERG uses the PERSIANN-CCS algorithm, which considers other factors, such as spatial texture in the IR Tb’s.] Furthermore, the Japanese GMS observations only provide hourly data for certain periods of the day, and in the missing half-hours the adjacent METEOSAT and GOES-W IR values are used to the extent possible, but in some cases the necessary zenith-angle parallax corrections apparently yield very different IR
6 October 2020 Version 06 IMERG Release Notes 4
values, leading to dithering between two precipitation estimate scenes in successive half hours. Before 2005 there are large gaps in the available microwave data, which makes the behavior of the IR estimates more important. In addition, there is apparently a somewhat complicated interaction between the morphed microwave and available IR data.
• There is an extended data dropout in the presently available IR dataset for Japanese sector from late on 17 November 2005 to the middle of 22 March 2006 due to issues in NOAA coping with the format of the then-newly introduced MTSat-1. Consequently, during that period a small sector over Japan lacks all data, and the adjacent IR are entirely based on high-zenith-angle data from the METEOSAT to the west and GOES-W to the east.
Additional Access Information The data archive sites are now populating the various repositories of original and value-added data with the new V06. See https://gpm.nasa.gov/data/directory to find all of the various formats and their locations. Recall that access to the various systems (PPS, PPS near-real time, and GES DISC) requires separate simple, free, and automatic registrations to satisfy NASA data system requirements. IMERG Early, Late, and Final Run datasets are computed about 4 hours, 14 hours, and 3.5 months after observation time, respectively. Early and Late are computed an hour at a time, while Final is computed a month at a time. The native HDF5 half-hourly products for Early, Late, and Final runs have the prefixes “3B-HHR-E”. “3B-HHR-L”, and “3B-HHR”, respectively. The monthly products have the prefix “3B-MO”, and are only computed as a native product for the Final Run. The complete file naming convention can be found at
The current version number for the revised release is Version 06B. The field named precipitationCal contains the “complete” IMERG precipitation estimate. Additional Notes Recall that the Final Run uses calibrations based on accumulations of match-ups that include the entire current month and data from previous months, while Early and Late Runs necessarily use calibrations based on trailing accumulations of match-ups, since these cannot be computed into the future. In addition, the Early Run only has forward propagation of the microwave data (unlike both the Late and Final Runs), and neither has calibration to the monthly gauge data as in the Final Run. Initially, both the Early and Late Runs used the latest “seed” calibration files for the Kalman coefficients and the CORRA-GMI and HQ-IR calibrations from the Final Run of V06A on 30 April 2019 to begin Initial Processing on 1 May 2019. Subsequently, Early and Late datasets computed as Initial Processing before 1 June 2019 were replaced by Retrospective Processing V06B datasets. In contrast, the Final Run does not require a seed file, since the calibrators are spun up to start on 1 June 2019. Validation results will be posted as they are developed. Complete records of all Runs are posted (honoring the necessary latency), labeled as V06B. The current retrospective computation starts in June 2000 because the necessary IR data are not presently available until February 2000, and then the calibrators must be spun up. It is planned
6 October 2020 Version 06 IMERG Release Notes 5
that all three Runs will be retrospectively processed back to the start of TRMM (January 1998) when the requisite data become available. The Quality Index (QI) document (see below) describes the QI variables for both half-hourly and monthly data. This includes advice about what might be considered “good” ranges of QI. We encourage users to report their experience with QI (and any other variable) to aid in developing the next versions of IMERG. The metadata providing the date/time in seconds since the base date/time requires comment because it does not reflect leap seconds. Although this does not affect the strictly increasing number of seconds with time within IMERG, it creates an offset from the actual number of seconds since the base time. The difference grows with time and in 2019 is less than 30 seconds, but some applications may be sensitive to this. A correction will be made in V07. As of 14 June 2019, it was discovered that Autosnow sometimes provides incorrect values other than “sea ice” above 89°N. These values cause IMERG to provide precipitation values in these boxes, when in fact all gridbox values above 89°N should be “missing” for the precipitationUncal and PrecipitationCal variables. This error will be corrected in a future reprocessing for Autosnow and IMERG. Key IMERG Documents Algorithm Theoretical Basis Document https://gpm.nasa.gov/sites/default/files/2020-05/IMERG_ATBD_V06.3.pdf Morphing Vector Document https://gpm.nasa.gov/sites/default/files/2020-06/MorphingInV06IMERG.pdf Quality Index https://gpm.nasa.gov/sites/default/files/2020-02/IMERGV06_QI_0.pdf Technical Documentation https://gpm.nasa.gov/sites/default/files/2019-05/IMERG_doc_201006.docx Tan, J., G.J. Huffman, D.T. Belvin, E.J. Nelkin, 2019: IMERG V06: Changes to the Morphing Algorithm. J. Atmos. Ocean. Technol., 36(12), 2471-2482. doi:10.1175/JTECH-D-19-0114.1
6 October 2020 Version 06 IMERG Release Notes 6
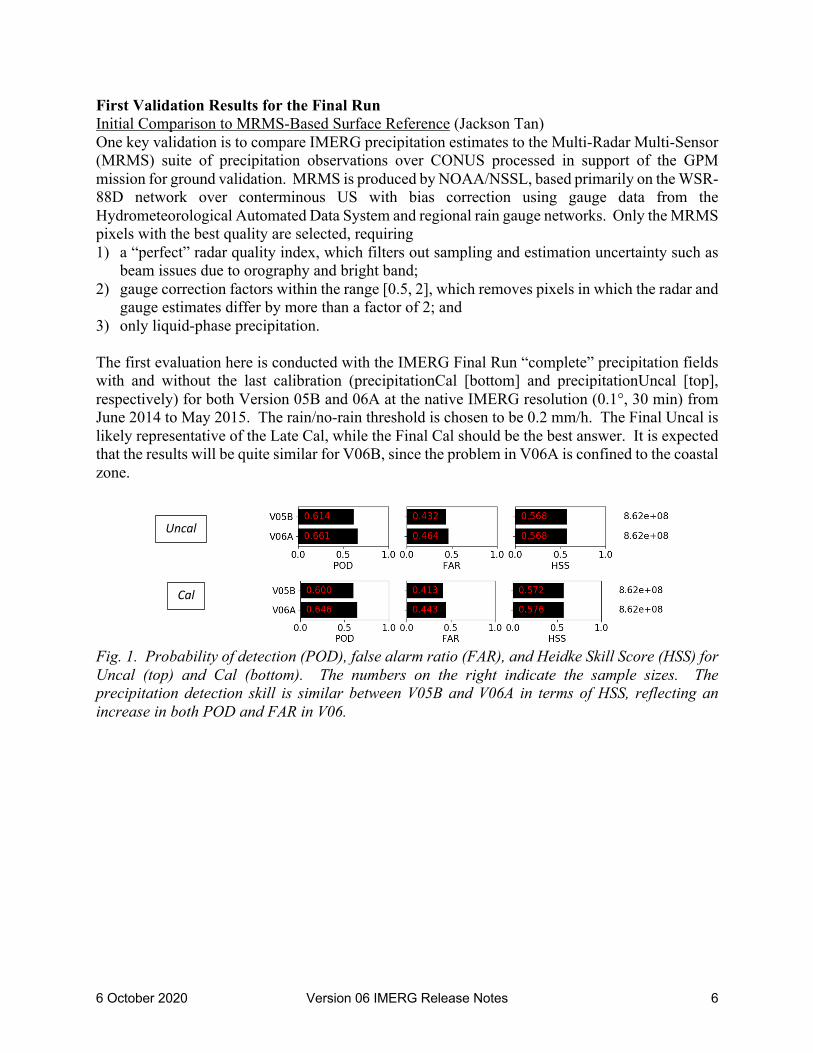
First Validation Results for the Final Run Initial Comparison to MRMS-Based Surface Reference (Jackson Tan) One key validation is to compare IMERG precipitation estimates to the Multi-Radar Multi-Sensor (MRMS) suite of precipitation observations over CONUS processed in support of the GPM mission for ground validation. MRMS is produced by NOAA/NSSL, based primarily on the WSR-88D network over conterminous US with bias correction using gauge data from the Hydrometeorological Automated Data System and regional rain gauge networks. Only the MRMS pixels with the best quality are selected, requiring 1) a “perfect” radar quality index, which filters out sampling and estimation uncertainty such as
beam issues due to orography and bright band; 2) gauge correction factors within the range [0.5, 2], which removes pixels in which the radar and
gauge estimates differ by more than a factor of 2; and 3) only liquid-phase precipitation. The first evaluation here is conducted with the IMERG Final Run “complete” precipitation fields with and without the last calibration (precipitationCal [bottom] and precipitationUncal [top], respectively) for both Version 05B and 06A at the native IMERG resolution (0.1°, 30 min) from June 2014 to May 2015. The rain/no-rain threshold is chosen to be 0.2 mm/h. The Final Uncal is likely representative of the Late Cal, while the Final Cal should be the best answer. It is expected that the results will be quite similar for V06B, since the problem in V06A is confined to the coastal zone.
Fig. 1. Probability of detection (POD), false alarm ratio (FAR), and Heidke Skill Score (HSS) for Uncal (top) and Cal (bottom). The numbers on the right indicate the sample sizes. The precipitation detection skill is similar between V05B and V06A in terms of HSS, reflecting an increase in both POD and FAR in V06.
Uncal
Cal
6 October 2020 Version 06 IMERG Release Notes 7
Fig. 2. Joint distributions of the rain rates between IMERG and the MRMS-based ground reference, limited to cases where both meet the 0.2 mm/h threshold) for Uncal (top) and Cal (bottom). The number in the lower-right corner of each plot shows the normalization factor for the color scale. There is a distinct improvement from V05B to V06A, with (i) the elimination of horizontal bands in the uncalibrated estimates due to the elimination of discretized values (see above), and (ii) a better representation of higher precipitation rates that can primarily be traced to estimates from the improved morphing scheme.
Fig. 3. Bias, normalized root mean square error (NRMSE), and Pearson correlation coefficient for cases where both IMERG and the MRMS-based ground reference meet the 0.2 mm/h threshold) for Uncal (top) and Cal (bottom). The numbers on the right indicate the sample sizes (number of hits). Between V05B and V06A, there is a slight increase in the bias of the uncalibrated estimates, a marginal increase in NRMSE, and a modest increase in the correlation.
Uncal
Cal
Uncal
Cal
6 October 2020 Version 06 IMERG Release Notes 8
Calibration comparisons over ocean (David Bolvin) The calibration sequence in IMERG is • CORRA (unadjusted in red) climatologically calibrated to GPCP V2.3 SG (blue) over ocean
outside 30ºN-S (adjusted in green), • GMI calibrated to monthly CORRA, • GPM constellation satellites climatologically calibrated to GMI, and • all of the microwave constellation used to construct IMERG V06B (black). The adjustments are working roughly as intended, which is to say that unadjusted CORRA is low at higher latitudes, and the calibration to GPCP largely corrects this. Adjustments in the Southern Ocean are large and need analysis to verify their reasonableness. Note that IMERG subsetted to coincidence with CORRA swaths (not shown) is much closer to (adjusted) CORRA than the full IMERG.
Fig. 4. Bias, normalized root mean square error (NRMSE), and Pearson correlation coefficient for cases where both IMERG and the MRMS-based ground reference meet the 0.2 mm/h threshold) for Uncal (top) and Cal (bottom). The numbers on the right indicate the sample sizes (number of hits). Between V05B and V06A, there is a slight increase in the bias of the uncalibrated estimates, a marginal increase in NRMSE, and a modest increase in the correlation.
Latitude
CORRA CORRA
6 October 2020 Version 06 IMERG Release Notes 9
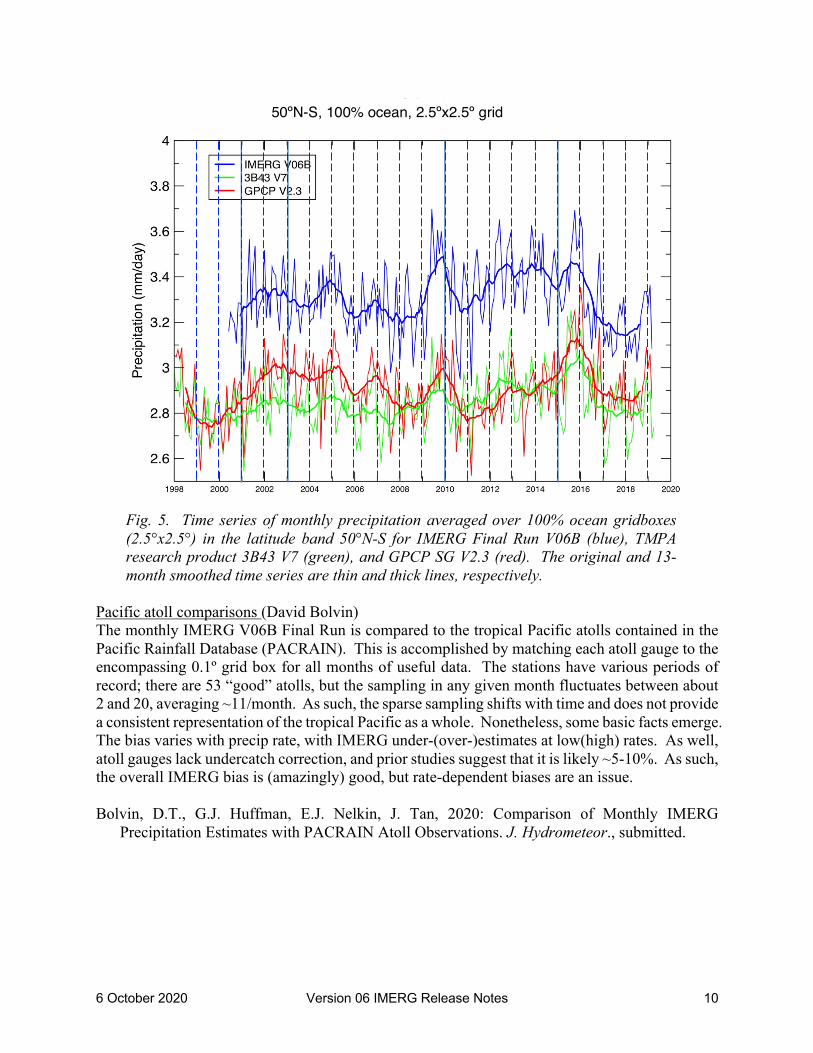
Long-term comparisons over ocean (Eric Nelkin) One important analysis is the interannual variation over the vast expanses of the oceans, where satellite data are the only means of creating estimates. Here, we compare the current IMERG V06B Final Run monthly product (blue); the previous TRMM-based TRMM Multi-satellite Precipitation Analysis (TMPA), using the post-real time monthly product 3B43 (green); and the GPCP SG monthly product across the entire TRMM and GPM eras (red). The latitudinal extent is limited to the range for 3B43. The original and 13-month smoothed time series are shown as thin and thick lines, respectively. Things to note include: • IMERG is higher than 3B43 and GPCP over ocean. • TRMM-era IMERG has a strong semi-annual signal, but
• GPM-era IMERG and 3B43 throughout are dominated by the annual cycle. • Interannual variations
• have similar peaks/troughs for all datasets; • GPCP (passive microwave calibration) lags the phase of 3B43 (through 2013) and IMERG
(both PMW/radar calibration); and • after September 2014, 3B43 (which has now converted to PMW calibration) matches
GPCP’s phasing. • There are additional multi-year variations whose origins must be explored. • Users are reminded that IMERG and 3B43 are High Resolution Precipitation Products, which
is to say that they give the best snapshot answers. Climate analysis should be undertaken with Climate Data Records (CDRs), of which GPCP is an example. CDRs are more focused on homogeneity in the dataset, frequently resulting in less-precise snapshot answers.
6 October 2020 Version 06 IMERG Release Notes 10
Fig. 5. Time series of monthly precipitation averaged over 100% ocean gridboxes (2.5°x2.5°) in the latitude band 50°N-S for IMERG Final Run V06B (blue), TMPA research product 3B43 V7 (green), and GPCP SG V2.3 (red). The original and 13-month smoothed time series are thin and thick lines, respectively.
Pacific atoll comparisons (David Bolvin) The monthly IMERG V06B Final Run is compared to the tropical Pacific atolls contained in the Pacific Rainfall Database (PACRAIN). This is accomplished by matching each atoll gauge to the encompassing 0.1º grid box for all months of useful data. The stations have various periods of record; there are 53 “good” atolls, but the sampling in any given month fluctuates between about 2 and 20, averaging ~11/month. As such, the sparse sampling shifts with time and does not provide a consistent representation of the tropical Pacific as a whole. Nonetheless, some basic facts emerge. The bias varies with precip rate, with IMERG under-(over-)estimates at low(high) rates. As well, atoll gauges lack undercatch correction, and prior studies suggest that it is likely ~5-10%. As such, the overall IMERG bias is (amazingly) good, but rate-dependent biases are an issue. Bolvin, D.T., G.J. Huffman, E.J. Nelkin, J. Tan, 2020: Comparison of Monthly IMERG
Precipitation Estimates with PACRAIN Atoll Observations. J. Hydrometeor., submitted.
50ºN-S, 100% ocean, 2.5ºx2.5º grid
6 October 2020 Version 06 IMERG Release Notes 11
Fig. 6. Scatter plot of monthly precipitation data for monthly IMERG V06B Final estimates in 0.1° grid boxes encompassing “good” months of atoll stations in PACRAIN. The quantile-quantile match-up is plotted in green.
Histogram time series (Gerald Potter) Histograms of the IMERG V06B Final Run monthly data are accumulated over the tropical oceans on 0.1º grid in the latitude band 20º N-S and plotted as colorized boxes for each month (top). The color scale is log(counts) to help draw out small values at higher rates. While interesting, this display is best interpreted by computing anomalies from the long-term average at each precipitation rate (bottom). Again, log scaling is needed to draw out the smaller values, this time in both the positive and negative difference directions starting at zero. The anomaly field is filtered using Savitzky-Golay filter with window size 5 and polynomial order 3 to emphasize the main features. The initial analysis is that: • mid-to-high rates sometimes (2009-10) vary together, but not always (2006-07); • lower rates tend to vary in the opposite direction from the mid-to-high rates; • the start of GPM calibration (June 2014) seems to shift the PDF to lower rates; and • persistent mid-range positive anomalies in 2009-14 remain to be explained. This discussion will help determine reliability for climate-related trend analysis, but the shift in going from the TRMM to GPM eras tends to indicate that such use must be approached cautiously.
6 October 2020 Version 06 IMERG Release Notes 12
Potter, G., G.J. Huffman, D.T. Bolvin, M.G. Bosilovich, J. Hertz, Laura E. Carriere, 2020: Histogram Anomaly Time Series: A Compact Graphical Representation of Spatial Time Series Data Sets. Bull. Amer. Meteor. Soc., accepted.
Fig. 7. Time series of monthly precipitation histograms (top) and histogram anomalies (bottom) compiled over 100% ocean gridboxes (0.1°x0.1°) over 20°N-S for IMERG Final Run.
IMERG Final, monthly tropical ocean 20ºN-S
IMERG Final anomalies, monthly tropical ocean 20ºN-S
Mon
thly
pre
cip
rate
(mm
/d)
Mon
thly
pre
cip
rate
(mm
/d)
6 October 2020 Version 06 IMERG Release Notes 13
Quality Index performance (Jackson Tan) The Quality Index for half-hourly IMERG fields is presently defined as a composite correlation pulled out of the Kalman filter processing (see the QI document referenced above). Fig. 8 shows a half-hourly example and the number of various QI values, which is typical. The low values over the Northern Hemisphere land arise because the microwave estimates are discarded over snowy/icy surfaces and replaced with (low-quality) IR estimates.
Fig. 8. QI for the IMERG-Final half-hourly field starting 15 March 2019 0000 UTC (left) and the distribution of QI values (right).
QI validation is somewhat messy because it is not a directly observable quantity. Instead, we compute IMERG statistics against MRMS data over CONUS as a function of QI. Fig. 9 displays density plots, and as expected, the clouds of points are more oriented along the 1:1 line for larger QI and they become more circular (i.e., less correlated) for smaller values. The visual impression is that the decay of correlation is not necessarily linearly related to the QI. Figs. 10 and 11 demonstrate this, as well as showing a number of other MRMS-based statistics. Given the modest variation for QI > 0.6, and the decay of skill (for POD in particular) for QI < 0.4, our preliminary advice is that the “stoplight” statement is: 0-0.4 = "red" significant IR contribution with high uncertainty, 0.4-0.6 = "yellow" morphed microwave, 0.6-1 = "green" current half-hour microwave swath data and short morphs.
6 October 2020 Version 06 IMERG Release Notes 14
Fig. 9. Density plots of IMERG-Final half-hourly
fields covering 15 March 2019 as a function of MRMS over CONUS for various ranges of QI.
Fig. 10. MRMS-based validation statistics for the IMERG-Final half-hourly fields
covering 15 March 2019 for various ranges of QI.
6 October 2020 Version 06 IMERG Release Notes 15
Fig. 11. MRMS-based HSS (blue; left-hand axis) and correlation (red; right-hand axis) for the IMERG-Final half-hourly fields covering 15 March 2019 for various ranges of QI. These data are displayed as part of Fig. 10 as well.