Under Article IV of the IMF’s Articles of Agreement, the IMF holds bilateral discussions with members, usually every year. In the context of the 2012 Article IV consultation with Luxembourg, the following documents have been released and are included in this package: Staff Report for the 2012 Article IV consultation, prepared by a staff team of the IMF, following discussions that ended on May 14, 2012, with the officials of Luxembourg on economic developments and policies. Based on information available at the time of these discussions, the staff report was completed on June 12, 2012. The views expressed in the staff report are those of the staff team and do not necessarily reflect the views of the Executive Board of the IMF.
Informational Annex prepared by the IMF.
Public Information Notice (PIN) summarizing the views of the Executive Board as expressed during its June 27, 2012 discussion of the staff report that concluded the Article IV consultation.
Statement by the Executive Director for Luxembourg.
The policy of publication of staff reports and other documents allows for the deletion of market-sensitive information.
Copies of this report are available to the public from
International Monetary Fund Publication Services 700 19th Street, N.W. Washington, D.C. 20431
generous pension system is not sustainable and will require more comprehensive
reform than the proposed long-run incentives to increase the effective retirement age.
Structural policies: Boosting long-run growth will largely depend on reforming labor
markets to address skill mismatches and negative work incentives. Further efforts are
also needed to limit harmful competitiveness effects of automatic backward-looking
wage indexation with a view of eliminating it in the medium term. Product market
reforms can support these efforts by fostering competition, spurring productivity
growth and possibly increasing economic diversification.
June 12, 2012
2012 ARTICLE IV REPORT LUXEMBOURG
2 INTERNATIONAL MONETARY FUND
Approved By Mahmood Pradhan and Jan Kees Martijn
Discussions took place in Luxembourg on May 3–14, 2012. The staff team comprised Mr. Hoffmaister (head), Ms. Kongsamut (all EUR), Ms. Che (STA), and Mr. Yanase (MCM), and was supported by Mmes. Becker and Noren, and Mr. Morán Arce (all EUR). The mission team met with Mr. Luc Frieden, Minister of Finance; Mr. Yves Mersch, Central Bank Governor; Mr. Mars di Bartolomeo, Minister of Social Security; Mr. Nicolas Schmit, Minister of Labor; Mr. Jean Guill, General Director, Financial Sector Supervisory Commission, and other senior officials, private sector and civil society representatives. Ms. Hubic (OED) accompanied the mission, and Mr. Kiekens (OED) attended the concluding meeting. Luxembourg is an Article VIII country (Informational Annex, Appendix I). Data provision is adequate for surveillance (Informational Annex, Appendix II).
OUTLOOK AND RISKS ........................................................................................................................................................... 8
I. Current account and IIP developments, and macroeconomic volatility ................................................ 34
II. Luxembourg: Risk Assessment Matrix ............................................................................................................... 38
III. Pension Reform in Europe .................................................................................................................................... 39
IV. Unemployment and Labor Market Programs ............................................................................................... 40
V. Productivity and Product Markets ...................................................................................................................... 46
2012 ARTICLE IV REPORT LUXEMBOURG
4 INTERNATIONAL MONETARY FUND
CONTEXT1. Luxembourg’s long record of
stability has served the economy and its
financial center well. Prudent macroeconomic
policies and stable political and regulatory
environments have been integral elements of
Luxembourg’s continuing success, including its
financial center. The latter comprises an
outward-oriented banking sector—providing
upstream liquidity to foreign parent banks with
domestic intermediation limited to a handful
of banks—and an investment fund industry.
Source: Central Bank of Luxembourg.
The financial system’s diversification in
businesses, customer bases and investment
destinations has helped it to weather the
global financial crisis and euro area turbulence.
Besides its contribution to value added and
employment, the financial center generates a
large share of fiscal revenues and supports
legal, accounting, and related service
industries.
2. The financial sector has endured the
euro crisis and remained stable. Having
declined sharply from their pre-crisis peak,
Luxembourg-based banks’ assets have
increased modestly in the second half of 2011
and since stabilized. Banks have remained
profitable despite losses in their securities
portfolios, including from Greek sovereign
exposures. While overall Luxembourg-based
banks are highly capitalized and liquid, liquidity
pressures arising from the euro area crisis
ultimately led to the breakup (along national
lines) of Dexia group in October 2011. But
beyond the impact on Dexia’s Luxembourg
subsidiary (DBIL)—one of largest banks with
retail business in Luxembourg—spillovers were
limited.1 For its part, assets managed by the
Luxembourg investment fund industry continue
to grow. Assets under management declined
during the second half of 2011 reflecting
unfavorable market developments, but have
recently recovered beyond their pre-crisis
levels. The number of funds has continued to
increase (Box 1).
3. Amid the euro area debt crisis,
Luxembourg’s growth slowed in 2011.
Private consumption held up in the first half of
the year, but slowed thereafter. Large lumpy 1 A share purchase agreement has been reached on April 5, 2012. Precision Capital S.A. (a Qatari owned holding company), will purchase 90 percent of DBIL shares; the Grand Duchy of Luxembourg will keep the rest. This agreement is subject to the EC’s approval. Also, as part of the Dexia group resolution agreement, Belgium, France, and Luxembourg will jointly guarantee the debt issued by the group up to €90 billion. The EC has approved €55 billion on a temporary basis. Luxembourg’s share of the guarantee amounts to 3 percent or roughly up to 8 percent of 2011 GDP. In 2008, the restructuring of Dexia and Fortis accounted for about 8 percent of GDP.
0
10
20
30
40
50
60
70
80
90
2001 2003 2005 2007 2009 2011
Banking Sector and Investment Funds Assets
(multiples of GDP)Investment funds
Banks
LUXEMBOURG 2012 ARTICLE IV REPORT
INTERNATIONAL MONETARY FUND 5
Box 1. Recent Developments in the Financial Sector
The investment fund industry’s brisk recovery following the global financial crisis has slowed. Assets under management started to recover shortly after the crisis and in mid-2010 surpassed their pre-crisis peak. This trend was partially reversed in the second half of 2011, due to market valuation losses and, to a lesser extent, redemptions. The industry, however, has recovered the losses as worldwide markets trended up in early 2012. Assets under management have remained above €2 trillion and the number of funds has increased by about 5 percent compared to their pre-crisis level.
In contrast, Luxembourg-based banks have been slower to recover. Banks’ assets hit bottom in February 2011. Most of the decline was associated with exposures to other credit institutions (mostly cross-border intra-bank group) that declined about 20 percent. Credit to customers nonetheless fell by less than 10 percent. While bank assets have begun recovering, they have remained far below their pre-crisis peak.
Still, Luxembourg-based banks have generally remained well capitalized, profitable and liquid. Their overall capital adequacy ratio has improved reflecting shrinking risk-weighted assets. Banks have continued to post profits although these are substantially lower than before the global financial crisis (Figure 4). In 2011, the decline largely reflected securities portfolio-related valuation losses, particularly in European sovereign bonds. The overall liquidity ratio has improved but Luxembourg-based banks have remained substantially exposed to risks arising from foreign parent banks.
Bank exposures to distressed sovereigns in the European periphery are generally contained, but cross-border exposures remain high. Exposures to distressed sovereigns have declined and account for less than 2 percent of total assets. These are concentrated in a small number of banks with limited retail deposits. More generally though, cross-border (mainly intragroup) exposures still account for about ¾ of Luxembourg-based banks’ loans.
Cross-Border Exposures of Luxembourg Banks(Percent of Total, End of Year)
Assets Liabilities
2012 ARTICLE IV REPORT LUXEMBOURG
6 INTERNATIONAL MONETARY FUND
investments—mostly satellite-related
projects—skewed the investment and trade
data in the second half of 2011. Confidence
indicators fell during this period, particularly in
the last quarter, and have remained in negative
territory (Figure 1). Private domestic demand
has weakened, with households and firms
postponing consumption and investment
decisions as the crisis festered and the
confidence effects from continuing
uncertainties persisted.
4. Inflation has fallen reflecting
developments in global prices and wages.
Mirroring international food and fuel prices,
headline inflation rose to about 4 percent in
the second half of 2011 before subsiding
(Figure 2). Inflation has nonetheless
consistently remained above the euro area
average, in part due to wage increases. For a
number of years, the latter had exceeded
those in the euro area. But in 2011 wage
increases have been broadly comparable to
neighboring countries, as automatic backward-
looking wage indexation was postponed.
Wage increases also moderated due to labor
market developments. In recent months, while
employment growth has remained stable the
unemployment rate has increased amid
growing signs of skill mismatches and rising
structural unemployment. Long-term
unemployment now accounts for about
45 percent of overall unemployment
compared to about 30 percent before the
global financial crisis.
5. The fiscal deficit fell in 2011. The
general government deficit was about ½ of
1 percent of GDP lower than in the budget
(Figure 3), despite a small overrun in public
investment.2 The over-performance reflected
continued current expenditure control as well
as strong revenue growth. Tax revenues were
boosted by crisis-related, temporary tax rate
hikes in personal income taxes and
corporation solidarity taxes. In addition,
economic activity, particularly in the first half
of 2011, also contributed to higher-than-
expected direct tax collection. Accordingly,
staff estimates suggest that the structural
deficit was about ½ of 1 percent of GDP,
roughly unchanged from 2010. Public debt has
almost tripled to about 20 percent of GDP
since the outset of the global financial crisis.
2 This reflected the reclassification of a school project from public-private partnership to public investment and the unexpected purchase of real estate.
-12
-9
-6
-3
0
3
6
9
12
2009
Q1
2009
Q2
2009
Q3
2009
Q4
2010
Q1
2010
Q2
2010
Q3
2010
Q4
2011
Q1
2011
Q2
2011
Q3
2011
Q4
Private consumption
Foreign Contribution
Investment
Public Consumption
GDP
Sources: WEO, STATEC, and IMF staff calculations.
GDP and Contribution of Demand Components (YoY)
LUXEMBOURG 2012 ARTICLE IV REPORT
INTERNATIONAL MONETARY FUND 7
6. The current account surplus has
narrowed. Balance of payments flows are
dominated by the financial sector. Reflecting
developments in the euro area, service sector
exports—primarily financial and related
business services—lost momentum during the
course of 2011. Likewise, the trade balance
worsened in the second half of 2011, with
imports boosted by lumpy investment goods
and exports declining compared to earlier in
the year. Mirroring developments in the
investment fund industry, portfolio investment
flows were stagnant through the third quarter
of 2011 compared to 2010. On the
competitiveness front, some gains have been
seen in export unit value-based and
manufacturing unit labor cost-based real
exchange rates as well as in the average CGER
assessment (Box 2).
Box 2. Evolution of Competitiveness and External Stability
Following a decade of deterioration, Luxembourg’s competitiveness gap has narrowed since 2010 (Figure 5). Wage increases associated with automatic backward wage indexation outstripped productivity gains for a number of years. In the aftermath of the global financial crisis, labor hoarding resulted in a sharp decline in labor productivity, far exceeding declines in neighboring countries. More recently, labor cost increases have been slowed by a sluggish labor market as well as by the postponement of automatic wage indexation adjustments. In 2011, some competitiveness gains have continued in unit labor cost-based real effective exchange rates and average CGER-based competitiveness gap. Besides some unwinding of labor hoarding, these improvements reflect Luxembourg’s medium-term current account balance that is now projected to be closer to its NFA stabilizing level. These medium-term projections are, however, subject to large uncertainty due to the intrinsic volatility in financial services export statistics. Balance of payments flows are dominated by the financial sector. Specifically, financial sector flows reflect the liquidity management role of
Luxembourg-based banks, most of which are part of international financial groups with limited impact on domestic intermediation (Annex I). From Luxembourg’s perspective, the financial center can be viewed as akin to a non-financial exporting industry. In this context, global financial shocks can have an asymmetrical impact on the center’s assets and liabilities, contributing to volatility in Luxembourg’s international investment position. The impact of these shocks however has been primarily on employment and tax revenues.
EstimateAverage competitiveness gap 0.34 Macroeconomic balance approach -0.49 Equilibrium real exchange rate approach 1.61 External stability approach -0.10
Memorandum: Current account Norm (percent of GDP) 6.52 Projected current account (percent of GDP) 7.30
Sources: WEO and staff estimates
CGER Assessment for Luxembourg(in percent)
2012 ARTICLE IV REPORT LUXEMBOURG
8 INTERNATIONAL MONETARY FUND
OUTLOOK AND RISKS7. In the context of an unfavorable
global outlook, Luxembourg’s economy is
poised to continue slowing in 2012.
Economic activity is envisaged to roughly
come to a standstill in the first half of 2012,
before experiencing a mild recovery later in
the second half. Weak external demand—
reflecting also euro area fiscal consolidation—
will hold back exports, and lingering
uncertainty will continue to weigh on domestic
demand. These factors will also likely reduce
price pressures and reinforce inflation’s
declining trend.
8. Given continuing uncertainties in
the euro area, the balance of risks is tilted
to the downside (Annex II). As elsewhere in
Europe, a slowdown in the euro area would
likely increase unemployment, hurt
households’ ability to service their loans,
possibly weaken the quality of domestically-
oriented banks’ assets and burden fiscal
accounts. In contrast to most economies, the
impact on domestic credit would likely be
limited given that most bank lending is cross-
border in nature, which historically has
accounted for most of the adjustment. In part
this also reflects the fact that domestic
deposits exceed non-interbank loans, thus
relieving pressure to reduce domestic credit. In
the case of a strong intensification of the euro
area crisis, Luxembourg-based banks would
face risks stemming from their parent banks.
Banks could also be affected through their
large cross-border intra-group transactions
that are associated with their role of upstream
liquidity providers. In such a case, contingent
fiscal liabilities—limited to supporting
domestically-active banks—could be large.
Euro area turbulence and a loss in risk appetite
could also result in outflows from
Luxembourg’s massive investment fund
industry. The impact of these outflows on
Luxembourg’s economy would be limited.
Likewise, outward spillovers are likely to be
limited as Luxembourg would likely be a
conduit rather than an originator of outward
spillovers. This is not only because
Luxembourg-based financial institutions are
generally well-capitalized, but also because
they intermediate large financial flows from
abroad (mainly intra-group operations), and a
global or regional financial shock tends to
reduce both inflows and outflows. In any case,
a better-than-expected outlook could
materialize if efforts to address the crisis quell
Box 3. Progress in Implementing Key Recommendations of the FSAP Update
A. Institutional Aspects Legislation was amended to improve the
operational independence of the CSSF granting it authorization power regarding some changes in financial institutions. Further measures are under consideration.
In light of the European Systemic Risk Board’s (ESRB’s) recommendation on establishing a national macroprudential authority, the authorities are exploring ways to clarify more broadly the supervisory responsibilities of the BCL and CSSF.
B. Conduct of Financial Sector Supervision Staff and resources available for the CSSF’s
supervisory and enforcement functions have been increased substantially. This has translated into more frequent on-site inspections and enhanced risk-based supervision of banks and investment funds, with stress testing more integrated into supervisory planning.
A number of organizational and procedural changes have taken place to expedite enforcement actions. These include the issuance of internal rules, the creation of the enforcement committee as well as a division devoted to investment fund enforcement.
The CSSF continues active participation in supervisory college meetings contributing to improve their monitoring of cross-border exposures to parent banks. Following the EBA recommendations, relevant European supervisors have started to conduct joint risk assessments of banking groups following a common approach.
Disclosure requirements for investment funds were strengthened to clarify shareholder and ownership rights. An EU-level legislative proposal standardizing and strengthening the role of depositaries is expected to be published in 2012.
C. Financial Safety Net A law requiring speedier payments by the
deposit insurance scheme was enacted. While waiting for progress of EU-level initiatives, the authorities have been studying options to strengthen the bank resolution framework and upgrade the deposit insurance scheme.
The authorities have been in discussions with Clearstream Banking Luxembourg to prepare contingency plans and have been studying the need for legislative actions.
12. But continued improvements are
required, particularly to further enhance
cross-border supervision. For the banking
industry, its structure and outward orientation
underscore the need for close cooperation
with home supervisors. In this regard, it is
important for the authorities to keep taking
advantage of supervisory colleges for EU
banking groups. These colleges provide an
ideal venue to exchange data, analyze financial
groups using a common methodology, and
develop coherent group-level strategies, as
required by the European Banking Authority
(EBA). As these structures are less developed
for non-EU banking groups, continued efforts
are necessary to procure the needed data and
coordinate group-level recommendations at
supervisory colleges. Likewise, given the
increasingly global nature of UCITS funds and
the different jurisdictions involved in managing
these funds, Luxembourg should consider
spearheading efforts to establish multilateral
supervisory frameworks for investment funds
LUXEMBOURG 2012 ARTICLE IV REPORT
INTERNATIONAL MONETARY FUND 11
to complement the existing bilateral
arrangements.
13. There are however a number of
areas where progress in EU-level financial
initiatives is crucial and continued delays
pose a dilemma for Luxembourg.
Specifically, these include the EU’s efforts to
harmonize bank resolution mechanisms as well
as deposit guarantee schemes. These are
essential for Luxembourg given the banking
sector’s cross-border exposure. On the
investment fund side, the UCITS V Directive
can provide an opportunity to strengthen
depository regimes including asset
segregation. The slow progress in these
initiatives, however, creates a tradeoff.
Implementing reforms ahead of EU guidance
runs the risk of having to revisit reforms
should these contravene EU-level Directives.
But continuing to place on hold needed
reforms can leave Luxembourg’s financial
system less able to deal with potential risks.
14. As Luxembourg awaits the
finalization of EU-level initiatives, there are
nonetheless pragmatic steps, not needing
legislative action, which should be taken to
improve Luxembourg’s regulatory
frameworks. For instance, bank resolution can
be strengthened by Recovery and Resolution
Plans (RRPs) that will be required for all major
EU banks. These will need to be coordinated
with home supervisors, possibly in the context
of Crisis Management Groups or supervisory
colleges. Regarding the existing ex-post
deposit guarantee scheme, consideration
should be given to require mandatory
provisioning for the needed payments under
the scheme. This would ensure the availability
of needed resources to cope with bank
resolution.
15. Looking ahead, global and EU-level
regulatory reform initiatives will require
stepped up efforts by Luxembourg’s
financial sector and its supervisors. These
include:
‧ Basel III and Capital Requirement
Directive IV (CRD IV). Given Luxembourg-
based banks’ strong capital position, the
higher capital adequacy requirements would
not likely pose difficulties. But tougher liquidity
standards could be challenging, because many
Luxembourg-based banks are subsidiaries of
international banking groups and new
standards may require changes in group-wide
liquidity management. The authorities’ recent
study on the Liquidity Coverage Ratio shows
that a number of banks would not meet those
standards that, if applied on a stand-alone
basis, would result in a shortfall of 65 billion
euro (roughly 1½ times GDP). While EU
discussions are ongoing, the authorities should
continue to urge banks to prepare for the
implementation of liquidity standards
associated with Basel III and the forthcoming
EU directive.
‧ Central securities depositories regimes.
The European Commission’s (EC’s) recent
legislative proposal to harmonize these
regimes could result in stricter rules for those
2012 ARTICLE IV REPORT LUXEMBOURG
12 INTERNATIONAL MONETARY FUND
depositories—such as Clearstream Banking
Luxembourg—to provide banking services. In
due course, this may require revising the
supervisory framework for Clearstream, which
is currently supervised as a bank. Meanwhile,
the authorities are encouraged to continue
discussing ways to strengthen contingency
planning for this institution and limit potential
outward spillovers.
16. Further refinements are also needed
in Luxembourg’s institutional frameworks
for financial supervision and regulation. In
line with the FSAP update’s recommendations
as well as forthcoming EU requirements, this
will entail:
• Clarifying the respective roles and
duties of the CSSF and BCL on liquidity risk
supervision. While this has worked smoothly in
practice, forthcoming Basel III requirements on
liquidity will likely call for a clear demarcation
on these matters, particularly as EU rules could
provide local authorities the power to grant
waivers to banks in their jurisdiction.
• Establishing a national macro-
prudential authority following the ESRB’s
recommendations, with the central bank taking
an important role. Regardless of the specific
institutional set-up of the national authority, its
proper functioning will require the ability to
identify, monitor, and assess systemic risks,
and to take actions to mitigate risk and limit
potential fallout.
• Strengthening the CSSF’s operational
independence. While there is no evidence of
political interference, its operational
independence should be strengthened in line
with international standards. Steps have
already been taken in this regard, but the CSSF
remains under the “direct authority” of the
Minister of Finance, its senior management can
be dismissed by the government over a
disagreement about policy or execution of its
remit, and the ultimate licensing authority lies
with the Minister.
17. On the Anti-Money Laundering and
Combating the Financing of Terrorism
(AML/CFT) framework, the authorities have
made progress in remedying the
shortcomings identified in the Financial
Action Task Force (FATF)’s 2010 mutual
evaluation report. Luxembourg was removed
from the enhanced review process of the
FATF’s International Cooperation Review
Group in early 2011 and is now subject to a
yearly follow up by the FATF. The FATF noted
that additional improvements are needed, in
particular in relation to legal entities
transparency (i.e. beneficial ownership and
control). Looking forward, the authorities will
need to take into account the revised FATF
standard of tax crimes.
18. The authorities broadly agreed and
expressed their intention to address
matters under their control. In particular:
• Regarding the bank resolution regime
and deposit insurance scheme, they stressed
the importance of moving in lockstep with
EU-level regulations. This would be consistent
LUXEMBOURG 2012 ARTICLE IV REPORT
INTERNATIONAL MONETARY FUND 13
with their tradition of regulatory stability and
consistency with other EU partners. The
authorities noted nonetheless that they have
increased capital requirements for all
Luxembourg-based banks (not just those
required by EBA) to a minimum 9 percent of
risk-weighted assets in Core Tier I capital. They
agreed that it was important to continue
exploring pragmatic ways to move ahead
should delays persist in finalizing EU initiatives.
On Clearstream, they noted ongoing
discussions on contingency planning, which
have focused on ensuring the continuity of
critical functions, and awaited the final EU-level
agreement to assess whether revisions were
needed on the supervisory front.
• The authorities stressed that the
principles embedded in their supervisory and
regulatory institutional settings do not differ
from those underlying international standards
and, in practice, these arrangements have
operated smoothly. They agreed nonetheless
to revisit these to reflect the FSAP update’s
recommendations as well as in light of the
newly required national macro-prudential
authority. The authorities intend to take
legislative action to address these institutional
issues in a holistic manner and stressed that
operational independence of institutions
should go hand in hand with accountability
and responsibility.
• On AML/CFT, the authorities stressed
their commitment to take needed measures to
be in compliance with revised FATF standards.
B. Ensuring Fiscal Sustainability
19. The 2012 budget may provide
support to the economy, albeit its stimulus
is based on current expenditure increases.
Staff estimates that the general government
deficit will widen from about ¾ percent of
GDP to almost 2 percent of GDP in 2012.
Overall expenditures will increase by about
2 percent of GDP, the bulk of which reflect
increases in wages and social benefits. On the
revenue side, the budget sees the early
cancellation of the 2011 crisis tax, which
consisted of a surcharge on personal income
tax of 0.8 percentage points. In effect, staff
estimates suggest that the structural deficit will
widen by roughly 1 percent of GDP. Given the
openness of the economy and the
correspondingly small fiscal multipliers, this
impulse will likely have only a modest
stimulative effect (Figure 6). Staff thus advised
to strictly adhere to the budget’s expenditure
allocations, also in light of the medium-term
fiscal pressures. Nevertheless, should the
aforementioned downside risks materialize,
automatic stabilizers should be allowed to
2009 2010 2011 2012
Proj
Overall balance -0.8 -0.9 -0.6 -1.9
Revenues 42.2 41.6 41.4 42.1
Expenditure 43.0 42.4 42.0 44.0
Current expenditure 39.3 38.4 37.9 40.0
o/w Compensation to employees 8.1 8.0 7.9 8.2
Social benefits 21.0 20.3 19.8 20.7
Capital expenditure 3.7 4.0 4.1 3.9
Sources : Minis try of Finance; IMF staff estimates .
Luxembourg: Fiscal Developments, 2008 - 2012 (Percent of GDP)
2012 ARTICLE IV REPORT LUXEMBOURG
14 INTERNATIONAL MONETARY FUND
operate and safeguard the social safety net
while maintaining fiscal credibility.
20. In an effort to contain expenditures,
the budget also extends the public
investment cap for an additional year. This
will result in capital expenditure declining
slightly as a percentage of GDP. In the short
run, the cap can help arrest rapid increases in
recent years, but it is a blunt tool to prioritize
public investment. Moreover, continued
reliance on an investment cap could hurt
growth prospects in the long run.
21. In the medium term, Luxembourg’s
fiscal position is poised to deteriorate. On
current policies, the general government
deficit is projected to increase, particularly
starting in 2015 when the permanent revenue
loss from e-commerce takes effect.3 Public
debt would almost double to over 30 percent
3 E-commerce value added tax revenues will be reimbursed to governments according to the residency of the online purchaser. In effect, this translates into a permanent revenue loss of about 1¼ percent of GDP.
of GDP by 2017, with its trajectory especially
sensitive to growth shocks and contingent
liabilities shocks (Figure 7).4 In this context, the
authorities have reiterated their goal of
reaching a balanced budget by 2014 and staff
estimates that this would require measures of
about 1 percent of GDP—beyond the
measures announced in the April 2012 Stability
and Convergence Program Update—with the
sharing of e-commerce VAT revenues
requiring additional measures in 2015. While
staff noted that the pace of fiscal consolidation
should be mindful of economic developments,
in particular the aforementioned downside
risks, they encouraged the authorities to spell
out the needed consolidation actions. The
latter should focus on rationalizing and
prioritizing current expenditure. A
comprehensive review of the generous social
transfers and subsidies will be needed to
secure a more effective and targeted use of
scarce resources as well as to limit adverse
work incentives.
22. Establishing a multi-year budgetary
framework can support the needed high-
quality fiscal consolidation. The framework
should apply to all levels of government and
include binding, multi-year expenditure
ceilings. Such a framework would be
consistent with EU requirements associated
4 The 10 percent contingent liability shock in the DSA is broadly in line with actual costs of rescuing Dexia and Fortis during the crisis (about 8 percent of GDP).
LUXEMBOURG 2012 ARTICLE IV REPORT
INTERNATIONAL MONETARY FUND 15
with the legislative “six pack” and the Fiscal
Compact, including fiscal sustainability.
23. Looking forward, the authorities
have begun reforming the old-age pension
and health care systems. Aging-related
expenditure pressures are widespread in the
EU. But the generosity of Luxembourg’s
pension system—and its associated low
effective retirement age—translates into the
largest increases in aging expenditures in the
EU (Figure 8). The authorities have recently
introduced so-called “pension à la carte.” It
fully grandfathers the rights accrued under the
existing regime and will take 40 years to be
fully in force. At that time, workers could draw
a reduced pension (about 8½ percent lower)
at the current effective retirement age (about
58 years of age5) or elect to work three more
years and obtained an unreduced pension.
With respect to health care, the 2011 reforms
included an increase in contributions and
higher financial burden-sharing of the patients,
tighter budgetary constraints for hospitals and
practitioners, and promotion of generic drugs.
As a result, the health care system is estimated
to have generated a surplus of about
0.15 percent of GDP in 2011.
5 This average includes disability pensions.
24. Still, fiscal sustainability will require
comprehensive old-age pension reform.
Even if the effective retirement age were to
increase by three years in the long run, it would
remain below today’s EU average. Moreover,
the reform would not suffice to place social
security on a strong financial footing and
places a disproportionate burden on younger
generations to support the unsustainably
generous benefits of those being
grandfathered. Luxembourg must consider
further reforms to better align benefits to
contributions. In this regard, it should increase
the statutory retirement age—following the
lead of other European countries facing far less
aging-related pressures (Annex III)—and limit
pension benefit adjustments to cost-of-living
indexation. The latter would eliminate what
amounts to double indexation of benefits to
wages and prices. In addition, there remains an
urgent need to vastly curtail, if not eliminate,
complementary periods, during which benefits
accrue without corresponding contributions.
On the health care front, beyond the full
implementation of the 2011 reforms, further
efforts will be needed to ensure the long-term
viability of the system.
0.0
2.0
4.0
6.0
8.0
10.0
12.0
14.0
16.0
18.0
20.0
2010 2020 2030 2040 2050
Projected pension expenditure (in percent of GDP)
Finland France Germany Italy
Luxembourg Spain Sweden UK
(Source: IMF staff estimation)
2012 ARTICLE IV REPORT LUXEMBOURG
16 INTERNATIONAL MONETARY FUND
25. The authorities stressed that fiscal
consolidation was needed to preserve fiscal
credibility and rebuild fiscal buffers. They
underscored that the 2012 budget would have
little, if any stimulative impact given the small
multipliers. With respect to the investment
cap, the authorities noted that prioritization
has been carried out, with several lower-
priority projects being delayed. Looking to the
medium-term challenges, they concurred that
further measures beyond those announced in
the April 2012 Stability and Convergence
Program could be needed to reach their
balanced budget target in 2014. These would
focus on limiting growth in current
expenditure with the view of reducing adverse
work incentives. They also highlighted the
need to rebuild fiscal buffers—effectively used
during recent crises but now exhausted—to
keep public debt from increasing further and
cope with future shocks. The authorities noted
ongoing plans to implement a medium-term
fiscal framework––to be transposed in line with
EU commitments by end-2013.
26. The authorities concurred with the
urgent need to place Luxembourg’s old-age
pension system on a sustainable path.
They noted that the existing pension system
suffers from a number of rigidities that are
proving to be costly, including the cumulative
existing indexation of benefits to real wages.
The proposed reforms would also allow for
more flexible adjustment mechanisms,
including on benefit indexation. In addition,
the authorities stressed that the sustainability
of the system will be reassessed every five
years and needed corrective measures would
be taken in case of expected shortfalls. As
regards to additional reforms, they have
discussed reducing complementary periods
and adjusting the indexation factors but
underscored the importance of
intergenerational fairness in further reforms.
On health care, further reforms are being
developed, including to restructure the
hospital sector starting in 2013.
C. Boosting Long Run Growth and Competitiveness
27. Enhancing sustainable growth will
require addressing long-term joblessness
and fostering productivity growth. Besides a
stable macroeconomic environment,
Luxembourg’s success has also reflected its
ability to react quickly to changes in the global
environment, often giving it a first-mover
advantage. In addition, the authorities have
fostered competitiveness and growth by
investing in key infrastructures and education
and establishing public research facilities. As
the economy boomed, spearheaded by the
financial sector, tax revenues have been
increasingly devoted to providing generous
social transfers. But robust growth, particularly
in the financial sector, masked growing
structural problems in labor and product
markets associated with the welfare system
LUXEMBOURG 2012 ARTICLE IV REPORT
INTERNATIONAL MONETARY FUND 17
and product regulations. Moreover, in
response to the global financial crisis,
protecting employment became a priority. The
downturn has, however, brought to the fore
the burden of these policies on the fiscal purse
as well as their unintended disincentives to
work and impediments to competition.
28. Labor market policies will thus need
to be redesigned to strengthen work
incentives and facilitate mobility across
sectors. Besides the disincentives to work, the
existing generous social transfer schemes,
including unemployment insurance, have
diverted resources from active labor market
policies (Annex IV). Skill mismatches,
particularly for local residents, have recently
become more acute in the wake of the global
financial crisis. In this connection, labor market
programs will thus need to be rebalanced to
support the continued development of
marketable skills. Human capital accumulation
can be further supported by life-long learning
and continued attention to improving formal
education. In addition, labor market flexibility
has been hindered by the long-standing
automatic backward-looking wage indexation.
Luxembourg’s efforts to limit its negative side-
effects—delaying wage adjustments and
limiting these to no more than once a year—
have helped contain rising unit labor costs. But
reforms are still needed to further reduce its
undesirable effects on competitiveness. This
can be achieved by modifying the reference
index to exclude volatile prices (notably food
and fuel prices), with a view of eliminating
indexation altogether in the medium term.
29. Product market reforms are also
vital to spur competition and productivity
growth. Luxembourg has stringent product
market regulations (PMR) compared to other
European countries, notably entry barriers.
Moreover, while other countries have made
progress in reducing regulations, these have
increased in Luxembourg (Annex V). In 2011,
Luxembourg has sought to lower entry barriers
for some professions by substituting work
experience for formal education requirements.
While a step in the right direction, further
reforms will be needed to foster a climate of
active competition. Specifically, this will also
require further reforms to simplify
administrative approval procedures,
particularly those regulations surrounding land
use. Together, these can underpin productivity
growth, enable resources to move freely across
sectors, and possibly foster economic
diversification.
30. The authorities shared concerns
about labor markets and recognized that
product market regulations had a negative
impact on competitiveness. The authorities
explained that they are currently pursuing
measures to strengthen human capital through
continuing education programs. Specifically,
they have implemented a program to help
unemployed financial sector workers find new
jobs after re-training, and reported some
success. The authorities acknowledged that the
2012 ARTICLE IV REPORT LUXEMBOURG
18 INTERNATIONAL MONETARY FUND
generous unemployment benefits have
contributed to an increase in long-term
unemployment. In this regard, a reform to the
unemployment categorization scheme is
currently under discussion to provide more
incentives to work and reduce the fiscal
burden. They also recognized wage indexation
had propped up unit labor costs and will
continue to explore ways to limit the adverse
impact on competitiveness. The authorities
also stressed the role of high profit margins—
made possible due to weak competition—on
competitiveness. In this connection, they noted
the need to focus reforms to address the
various aspects of competitiveness.
STAFF APPRAISAL31. Luxembourg is confronted with the
challenge of safeguarding its hallmark
economic stability. The financial sector has
endured the global financial as well as the euro
area crises and remained stable. Luxembourg’s
long-standing economic stability has provided
comfort in the face of heightened financial
market volatility. The economy will
nonetheless slow in 2012, reflecting external
conditions, and the fiscal deficit will widen but
remain low. Headline inflation will slow, as the
impact of global fuel prices wanes and wage
indexation is delayed. For its part, the
unemployment rate is expected to remain
broadly unchanged, but long-term joblessness
will still account for a large share of
unemployment.
32. In this regard, continued efforts are
needed to enhance the stability of its
financial system. Luxembourg has made
strides to strengthen its financial center,
including by increasing resources to the CSSF.
Still, the authorities should continue to take
advantage of supervisory colleges for EU
banking groups to exchange data and develop
coherent group-level strategies. As these
multilateral structures are less developed for
non-EU financial groups as well as for UCITS
funds, further efforts are needed to ensure
coordination among relevant supervisors.
Regarding EU-level regulatory initiatives, their
slow progress pose a dilemma. On balance,
however, as Luxembourg awaits their
finalization, it should push ahead with actions
not requiring legislation. The authorities
should also continue to encourage banks to
prepare for the tougher liquidity standards
associated with Basel III and CRD IV.
33. More broadly, there is a growing
need to revisit Luxembourg’s institutional
arrangements for its financial sector
supervision and regulation. Coordination
among supervisors has been smooth and there
is no evidence of political interference in
supervisory matters. Revisions are needed
nonetheless to better align Luxembourg’s
frameworks with international standards. In
this regard, it is important that the revised
frameworks provide clear roles and
responsibilities of the relevant authorities and
LUXEMBOURG 2012 ARTICLE IV REPORT
INTERNATIONAL MONETARY FUND 19
ensure the operational independence and
accountability of the CSSF and of the needed
macro-prudential authority.
34. The challenge for fiscal policy
includes implementing a high-quality fiscal
consolidation to ensure that Luxembourg’s
fiscal sustainability remains beyond doubt.
In 2012, this will require strictly adhering to the
The banking sector is well capitalized ... ... and remains profitable.
Non-performing loans are relatively subdued ... ... with a continued high level of liquidity.
Source: Central Bank of Luxembourg.
0
5
10
15
20
25
30
Mar-08 Mar-09 Mar-10 Mar-11
(In multiples of GDP) Total assets
Interbank
Intragroup
Assets are bottoming out ...
0
2
4
6
8
10
12
14
16
18
Mar-08 Mar-09 Mar-10 Mar-11
(In multiples of GDP)
Total assets, excl intra group claims
Total claims on non-financial sector
... but intra-group exposures remain large.
2012 ARTICLE IV REPORT LUXEMBOURG
24 INTERNATIONAL MONETARY FUND
Figure 5. Luxembourg: Competitiveness Indicators
Source: OECD.
0.7
0.8
0.9
1.0
1.1
1.2
2002
Q1
2002
Q3
2003
Q1
2003
Q3
2004
Q1
2004
Q3
2005
Q1
2005
Q3
2006
Q1
2006
Q3
2007
Q1
2007
Q3
2008
Q1
2008
Q3
2009
Q1
2009
Q3
2010
Q1
2010
Q3
2011
Q1
2011
Q3
Belgium France
Germany Luxembourg
Thus the larger increase in ULC is driven mainly by lower labor productivity growth
Labor productivity of the total economy(2005=1)
0.9
1.0
1.1
1.2
1.3
2002
Q1
2002
Q3
2003
Q1
2003
Q3
2004
Q1
2004
Q3
2005
Q1
2005
Q3
2006
Q1
2006
Q3
2007
Q1
2007
Q3
2008
Q1
2008
Q3
2009
Q1
2009
Q3
2010
Q1
2010
Q3
2011
Q1
2011
Q3
Belgium
France
Germany
Luxembourg
The recent increase in ULC is higher than regional peers.
Unit labor costs in total economy(2005=1)
80
90
100
110
120
130
2001
Q4
2002
Q3
2003
Q2
2004
Q1
2004
Q4
2005
Q3
2006
Q2
2007
Q1
2007
Q4
2008
Q3
2009
Q2
2010
Q1
2010
Q4
2011
Q3
Belgium
Germany
France
Luxembourg
But the increases in wages are relatively moderate.
Labor compensation (2005=100)
80
90
100
110
120
130
140
150
160
170
2000
Q1
2000
Q3
2001
Q1
2001
Q3
2002
Q1
2002
Q3
2003
Q1
2003
Q3
2004
Q1
2004
Q3
2005
Q1
2005
Q3
2006
Q1
2006
Q3
2007
Q1
2007
Q3
2008
Q1
2008
Q3
2009
Q1
2009
Q3
2010
Q1
2010
Q3
2011
Q1
2011
Q3
2012
Q1
CPI REERWPI REERULC REER (Total Economy)ULC REER (Manufacturing)XUV REER
The trend real exchange rate appreciation starting since the early 2000's has shown signs of stabilization.
Real Effective Exchange Rate (2000=100)
LUXEMBOURG 2012 ARTICLE IV REPORT
INTERNATIONAL MONETARY FUND 25
Figure 6. Fiscal Multipliers
Sources: OECD (2012), Fiscal monitor (2012).
-1.4
-1.2
-1
-0.8
-0.6
-0.4
-0.2
0
0.0 0.1 0.2 0.3 0.4 0.5 0.6 0.7 0.8 0.9
Spen
ding
Mul
tiplie
r
Imports of goods and services/2005 GDP
Fiscal multipliers vs import penetration
GRC
BEL
IRL
NLD
JPN
USA
-2.5
-2
-1.5
-1
-0.5
0
0.5
1
1.5
0.0 0.1 0.2 0.3 0.4 0.5 0.6 0.7 0.8 0.9
Mul
tiplie
r
Imports of goods and services/2005 GDP
Fiscal multipliers in the context of negative output gaps, G-7 excl Italy
USA
DEU
JPN
Traditional analysis of fiscal multipliers have found that more open economies (measured here using imports) tend to have smaller multipliers. Luxembourg's openness measure exceeds 1.
New evidence suggests that fiscal consolidation in the context of negative output gaps could mean larger multipliers, particularly in larger economies.
CAN
2012 ARTICLE IV REPORT LUXEMBOURG
26 INTERNATIONAL MONETARY FUND
Figure 7. Luxembourg: Public Debt Sustainability: Bound Tests 1/ (in percent of GDP, unless otherwise indicated)
Sources: International Monetary Fund, and staff estimates. 1/ Shaded areas represent actual data. Individual shocks are permanent one-half standard deviation shocks. Figures in the boxes represent average projections for the respective variables in the baseline and scenario being presented. Ten-year historical average for the variable is also shown. 2/ Permanent 1/4 standard deviation shocks applied to real interest rate, growth rate, and primary balance. 3/ One-time real depreciation of 30 percent and 10 percent of GDP shock to contingent liabilities occur in 2010, with real depreciation defined as nominal depreciation (measured by percentage fall in dollar value or local currency) minus domestic inflation (based on GDP deflator).
PB shock 36
Baseline32
33
05
10152025303540455055
2007 2009 2011 2013 2015 2017
Primary balance shock (in percent of GDP) and no policy change scenario (contant primary) balance
i-rate shock
33
Baseline32
05
10152025303540455055
2007 2009 2011 2013 2015 2017
Interest rate shock (in percent)
Historical 21
Baseline 32
-4
-3
-2
-1
0
1
2
3
4
5
05
10152025303540455055
2007 2009 2011 2013 2015 2017
Baseline and historical scenarios
Combined shock 36
Baseline
32
05
10152025303540455055
2007 2009 2011 2013 2015 2017
Combined shock 2/
30 % depreciation
32Baseline
32
contingent liabilities shock
41
05
10152025303540455055
2007 2009 2011 2013 2015 2017
Real depreciation and contingent liabilities shocks 3/
Gross financing need under
baseline
No policy change
Baseline: -1.1Scenario: -2.0Historical: 1.0
Baseline: 2.8
Scenario: 1.1
Historical: 2.7
Baseline: 0.1Scenario: 1.1Historical: -0.5
Growth shock
45
Baseline
32
05
10152025303540455055
2007 2009 2011 2013 2015 2017
Growth Shock (in percent per year)
LUXEMBOURG 2012 ARTICLE IV REPORT
INTERNATIONAL MONETARY FUND 27
Figure 8. Luxembourg: Pension System Sustainability
Sources: IMF staff estimates from "The Challenge of Public Pension Reform in Advanced and Emerging Market Countries", (2011), and OECD "Pensions at a Glance 2011", (2011).
-2
-1
0
1
2
3
4
5
6
LUX BEL NLD DEU PRT GBR GRC FRA SWE ITA
Increase in pension spending, 2010-2030(In percent of GDP)
AUS
AUT
BEL
CAN
CZEDNK
FIN
FRA
DEU
GRC
ISLIRL
ITA
JPN
KOR
LUXNLD
NZL
NOR
PRT
SVK
SVNESPSWE
CHE
UK USA
-2
1
4
7
10
13
16
-2 0 2 4 6 8 10P
ensi
on
Sp
endi
ng, 2
010
Age-Related Spending Increases, 2010-2030
Pension spending and age-related spending increases to 2030 (In percent of GDP)
5055606570
Men
Effective
Official
50 55 60 65 70
Women
Effective
Official
PortugalSweden
United Kingdom
Netherlands
EU average
Greece
Germany
Italy
Belgium
France
Luxembourg
Effective and official retirement ages, selected EU countries
Luxembourg's projected increase in pension and age-related spending is among the highest, partly due to generous rules which encourage beneficiaries to retire years earlier than the official retirement age.
Interest rates 3/ Government bond yield, end period 4.2 3.3 2.3 2.0 … … … … …
Memorandum items: Land area = 2,586 square kilometers; population in 2010= 502 thousand; GDP per capita = €82,852.
Sources: Luxembourg authorities; IMF staff estimates and projections. 1/ Contribution to GDP growth. 2/ Overall economy. 3/ For 2012, data refer to April.
Projections
LUXEMBOURG 2012 ARTICLE IV REPORT
INTERNATIONAL MONETARY FUND 29
Table 2. Luxembourg: General Government Operations, 2009–17 1/
1/ Projections reflect measures announced in the 13th Stability and Convergence Programme, April 2012.Sources: Luxembourg authorities, and staff projections.
Proj
(In percent of GDP)
2012 ARTICLE IV REPORT LUXEMBOURG
30 INTERNATIONAL MONETARY FUND
Table 3. Luxembourg: Estimated Effect of Fiscal Consolidation 1/
Table 6. Luxembourg: Financial Soundness Indicators, 2008–11 1/ (In percent)
2008 2009 2010 Jun-11 Dec-11
Capital AdequacyRegulatory capital to risk-weighted assets 15.4 18.9 17.0 17.0 21.0Regulatory Tier 1 capital to risk-weighted assets 13.0 17.0 15.0 15.0 18.0Capital to assets 4.0 5.5 5.0 5.0 5.0
Profitability And EfficiencyReturn on assets 0.2 0.6 0.7 0.7 0.3Return on equity 5.5 11.6 13.0 14.0 6.0Interest margin to gross income 37.7 36.5 31.0 30.0 34.0Trading income to total income -8.9 6.0 -1.0 -3.0 -9.0Noninterest expenses to gross income 56.2 56.3 64.0 63.0 74.0Personnel expenses to noninterest expenses 35.7 38.7 36.0 34.0 35.0
Asset Quality And StructureResidential real estate loans to total loans 2.2 2.8 3.0 3.0 3.0Household debt to GDP 45.0 50.0 54.0 51.0 54.0Nonperforming large exposures to total large exposures 2/ 0.6 0.7 0.2 0.3 0.4Sectoral distribution of loans (in % of total loans) Residents 26.6 23.4 22.0 21.0 25.0 Deposit Takers 10.7 9.8 7.0 7.0 5.0 Central Bank 6.4 2.3 2.0 2.0 8.0 Other Financial Corporations 4.2 4.8 6.0 6.0 5.0 General Government 0.4 0.4 0.5 0.5 0.4 Nonfinancial Corporations 2.4 2.6 2.0 3.0 2.0 Other Domestic Sectors 2.6 3.4 4.0 4.0 4.0 Non Residents 73.4 77.0 78.0 79.0 75.0
LiquidityLiquid assets to total assets 59.0 55.9 56.0 57.0 59.0Liquid assets to short-term liabilities 67.8 64.7 66.0 66.0 69.0Customer deposits to total (non interbank) loans 134.7 137.5 131.0 128.0 119.0
Foreign ExchangeForeign currrency denominated loans to total loans 30.2 28.0 30.0 31.0 29.0Foreign currency denominated liabilities to total liabilities 29.1 28.8 33.0 32.0 32.0Net open foreign exchange to capital 1.6 -0.6 0.3 0.9 2.6
Source: Central Bank of Luxembourg.1/ There is a break in the series in 2009 due to the adoption of IAS and IFRS in 2008.2/ Change in the underlying reporting instructions as of 31/12/2010.
2012 ARTICLE IV REPORT LUXEMBOURG
34 INTERNATIONAL MONETARY FUND
ANNEX I. CURRENT ACCOUNT AND IIP DEVELOPMENTS, AND MACROECONOMIC VOLATILITY
1. Luxembourg’s current account
balance has been in persistent surplus,
mainly driven by financial services. Pre-
crisis (1995–2007), the current account surplus
averaged over 10 percent of GDP (Figure A1).
The goods balance has usually registered a
deficit of around the same magnitude over
the past 15 years. The activity in the financial
sector is reflected in the growing services
surplus, which reached over 50 percent of
GDP in 2011, as well as in the salary
remittances of cross-border workers, many of
whom are employed in the financial sector.
2. During the global financial crisis,
the current account surplus narrowed by
almost half and has since partially
recovered. With trade activity largely stable,
financial services activity has underpinned the
recovery in the current account.
3. Roughly mirroring the current
account developments, the financial
account balance has been in deficit,
reflecting the net accumulation of assets
abroad. Despite net portfolio inflows from
investment fund activity, the overall financial
account balance has registered a deficit due
to “other investment” activities. These also to
a large extent reflect financial center
activities.1 Net international investment
position (IIP) for this period confirms a large
increase in net other investments, reflecting
financial transactions.
4. Financial sector activity dominated
developments in Luxembourg’s net
international investment position (IIP),
which has experienced high volatility since
2003. Luxembourg held a net asset position
exceeding 100 percent of GDP in the third
quarter of 2011. The overall IIP position
showed a large spike in 2008–09, peaking at
152 percent of GDP in the second quarter of
2008 and dropping to about 67 percent of
GDP before recovering more recently. This
spike reflected financial flows with the sharp
decline driven primarily by a large decline in
stock market indexes, which hurt net portfolio
investment values. The valuation effect
swamped the impact of net redemptions. Of
note, given the dominance of financial sector
activity in these data, only a small fraction of
1 These include banking and investment fund activities, as well as activities of Special Purpose Entities (SPEs). SPEs include for example in-house banks for corporate groups, or proceeds from international issuance of securities in Luxembourg by multinational corporations.
LUXEMBOURG 2012 ARTICLE IV REPORT
INTERNATIONAL MONETARY FUND 35
flows are associated with developments in
Luxembourg’s domestic economic activity. In
this regard, IIP movements provide limited
insights into Luxembourg’s economic
developments.
5. More broadly, Luxembourg’s
experience illustrates how countries with
large financial sectors are typically subject
to higher macroeconomic volatility.
Specifically, output volatility appears to
increase with the size of the financial sector
(Figure A2). The volatility of employment,
current account balance, and IIP also appear
to be associated with the importance of the
financial sector, albeit less so.
2012 ARTICLE IV REPORT LUXEMBOURG
36 INTERNATIONAL MONETARY FUND
Figure A1. Luxembourg Current Account and IIP Developments (in percent of GDP)
Net International Investment Position(in percent of GDP)
-1500
-1000
-500
0
500
1000
International Investment Position components(net, in percent of GDP)
Other investmentPortfolio investmentDirect investmentFinancial derivativesOverall net IIP position
LUXEMBOURG 2012 ARTICLE IV REPORT
INTERNATIONAL MONETARY FUND 37
Figure A2: Financial Sector Size and Macroeconomic Volatility
Sources: WEO, IIP database.
0.00
0.10
0.20
0.30
0.40
0.50
0.60
0 1 2 3 4
Co
eff
icie
nt o
f va
riat
ion
of o
utp
ut
ln(Financial sector size/GDP)
Output volatility and financial sector size, 1980-2010
0.00
0.10
0.20
0.30
0.40
0.50
0.60
0.70
0 1 2 3 4C
oe
ffic
ient
of
vari
atio
n o
f em
plo
yme
nt
ln(Financial sector size/GDP)
Employment volatility and financial sector size, 1980-2010
LUX
-5.00
-4.00
-3.00
-2.00
-1.00
0.00
1.00
2.00
3.00
4.00
0 1 2 3 4
Co
eff
icie
nt o
f va
riat
ion
of c
urr
en
t acc
oun
t b
alan
ce/G
DP
ln(Financial sector size/GDP)
Current account volatility and financial sector size, 2002-2010
LUX
-2.00
-1.00
0.00
1.00
2.00
3.00
4.00
0 1 2 3 4
Co
eff
icie
nt o
f va
riat
ion
IIP
ln(Financial sector size/GDP)
IIP volatility and financial sector size, 2002-2010
LUX
LUX
2012 ARTICLE IV REPORT LUXEMBOURG
38 INTERNATIONAL MONETARY FUND
ANNEX II: LUXEMBOURG: RISK ASSESSMENT MATRIX1 (Scale―high, medium, or low)
Source of Risk Relative Likelihood Impact if Realized Strong intensification of the euro area crisis
Medium
A strong intensification of the crisis could affect both the real economy (a recession affecting employment and output) and the financial system through both direct (losses on sovereign debt holdings) and indirect effects (contagion, intra-group exposures).
High
Output losses and further increases in unemployment. Luxembourg-based outward-oriented banks could be resilient if there is no major failure of relevant parent banks. But liquidity pressures could resurface. Domestically-oriented banks could be affected through higher unemployment and household’s inability to repay debt, also possibly impacting real estate values.
Though bank exposure to distressed sovereign bonds has declined, these remain sizeable in some banks. Losses from these holdings could threaten a few small banks.
Failure of a parent bank
Medium
A sizeable sovereign or funding shock could cause major global or European financial institutions to fail.
High Most banks are exposed to parent banks through large intra-group positions and reputation effects. Thus, parent failures are likely to be disruptive. Also, for domestically-active subsidiaries, the failure of a parent bank could result in large contingent fiscal liabilities for Luxembourg.
Inability to carry out fiscal consolidation in accordance with announced intentions
Low/Medium
Luxembourg’s fiscal position appears favorable, but crisis measures have taken their toll on public debt, with forthcoming sharing of e-commerce revenues further challenging fiscal stability.
High
Public debt would almost double in five years with no policy change (Figure 7), and would more than double under a low growth scenario. Luxembourg would not be well-placed to withstand further shocks, nor to manage its looming pension obligations, even if proposed pension reforms are implemented.
Global financial regulation and tax reforms.
Low
Luxembourg’s position as a financial center could be threatened by changes in prudential regulations and international taxation.
High
The financial center’s cross-border activities could shrink, with adverse impact on employment and value added in the medium-term.
Loss of confidence in investment fund industry
Low
Damage to Luxembourg’s funds’ brand name owing to negative reputational effects from large global investment fund failures.
Renewed turbulence in financial markets could lead to large-scale fund redemptions.
High (over the medium-term)
Investment funds redemption could temporarily depress asset market prices and create a need for liquidity.
In the medium-term, the loss of business would hurt employment and value added.
1/ The RAM shows events that could materially alter the baseline path - the scenario most likely to materialize in the view of the staff.
LUXEMBOURG 2012 ARTICLE IV REPORT
INTERNATIONAL MONETARY FUND 39
ANNEX III: PENSION REFORM IN EUROPEWhile Luxembourg’s projected increases in
old-age pensions are the largest, a number
of EU countries have been reforming their
old-age pension to address demographic
pressures. Notably, reforms in Europe have
included increasing the statutory retirement
age, modifying benefit indexation, boosting
contribution rates and periods, and generally
discouraging early retirement.
Cross-Country Pension Reform Experiences
Country Years Measure Finland 2005 Increase statutory retirement age five years to 68 with actuarially fair reductions for those retiring before
the age of 63; Eliminate ceiling on pension benefits.
France 1985–91
1993
2003 2010
Increase contribution rates by 1.85 percentage points to 6.55 percent. Increase the minimum contribution period for a full pension by 2½ years to 40 years; Change the base wage for calculating pensions from the top 10 years to the top 25 years; Change the pension benefit indexation from wages to prices; Link the number contribution years for full pension to life expectancy; Increase the minimum retirement age two years to 62 years of age.
Germany 2004
2007
Introduce a “sustainability factor” linking pension replacement to the old-age dependency ratio to partially offset the effect of increases in the dependency to partially offset the effect of increases in the dependency ratio; Increase statutory retirement age by two years to 67 years after 2030.
Italy 1992
1995
2011
Increase the retirement age for full benefits for men by five years to 65; Increasing reference earnings five years to last 10 years; Raise contributing years for full pension five years to 20 years; Link pensions to lifetime contributions and GDP growth; Freeze pension indexation to 2012–13 levels except for the lowest pensions. Increase the minimum retirement age of woman to 62 and the full benefit retirement age to 67; Set the minimum retirement age to 66 in 2018 for men and women; Adjust the retirement age in the future according to life expectancy.
Spain 2002–05
2011
Extend the effective minimum contribution period (from 12.8 to 15 years); Discourage early retirement by reducing contribution rates. (Early retirement is available from the age of 61 for those who entered the system after 1967 with 30 years of contribution (age of 60 for those entered before). Pension benefits are reduced by 6 to 7.5 percent per year depending on the numbers of years of contributions with a reduction of 8 percent for those before 1967; Increase the statutory retirement age by two years to 67 years of age; Increasing the minimum retirement age from 61 to 63 years with at least 33 years of contribution; Raising the numbers of years to calculate the earnings base (reference period) from 15 to 25 years Raising the required contribution to qualify for the full pension from 35 to 38.5 years.
Sweden 1999 Index contributions to life expectancy and GDP growth; Increase pension benefits by about 60 percent if retirement is postponed to age 67.
UK 2007 Raise statutory retirement age three years to 68 years of age; Decrease eligibility for full pension: 44 to 30 years.
Notes: fixed effect panel regressions. The sample includes 31 OECD countries for the period 2000–08. T-statistics in parentheses. * p < 0.1, ** p < 0.05, *** p < 0.01.
48 IN
TERNATIO
NAL M
ON
ETARY FUN
D
2012 ARTICLE IV REPORT
LUXEM
BOU
RG
LUXEMBOURG 2012 ARTICLE IV REPORT
INTERNATIONAL MONETARY FUND 49
Figure A6. Labor Productivity Growth and Sectoral Composition
Luxembourg experiences low productivity growth in both manufacturing sector…
…and service sector
Output share for the manufacturing sector is low relative to its employment share,
…while the opposite is true for the service sector
2012 ARTICLE IV REPORT LUXEMBOURG
50 INTERNATIONAL MONETARY FUND
Figure A7. Size of Service Industries
Financial industry, which has limited employment capacity, dominates Luxembourg’s service sector..
Other service industries are less developed compared to peer countries, including trade,
…social and personal services, …education industry
…health care industry, …and business services.
LUXEMBOURG 2012 ARTICLE IV REPORT
INTERNATIONAL MONETARY FUND 51
Figure A8. Cross-Country Comparison in Product and Labor Market Regulations
Luxembourg is among the most restrictive in various regulations, including regulation in professional services, …in product market regulations,
…in retail trade regulations, …and in labor market regulations.
Source: OECD.
2012 ARTICLE IV REPORT LUXEMBOURG
52 INTERNATIONAL MONETARY FUND
Figure A9. Productivity Growth and Regulations
Manufacturing productivity growth is inversely related to the strictness of EPL…
It is also inversely related to product market regulations.….
Service sector productivity growth is inversely related to PMR…
It is also inversely related to regulation in professional services.….
Source: Staff estimates.
LUXEMBOURG 2012 ARTICLE IV REPORT
INTERNATIONAL MONETARY FUND 53
Figure A10. New Firm Survival Rates by Industry
New firm survival rate is high in the service sector compared to other countries…
…including in education industry,
…trade industry, …real estate and business services,
v
…and transportation and communication. But the finance industry has lower survival rate than in many other countries.
Source: OECD.
2012 ARTICLE IV REPORT LUXEMBOURG
54 INTERNATIONAL MONETARY FUND
Figure A11. Employment Composition of Major Financial Centers
Luxembourg relies heavily on finance and related industries. In comparison, other financial centers are more diversified in their service sector.
Hong Kong has a large trade sector.
New York City is strong in education and health services. Singapore has a very balanced service sector.
Source: staff estimates.
0.10
0.13
0.07
0.05
0.01
0.12
0.01
0.16
0.12
0.13
0.00 0.05 0.10 0.15 0.20
Manufacturing
Wholesale & Retail Trade
Transportation & storage
Accommodation and Food Services
Information & communications
Finance and Insurance
Real Estate
Professional and Business Services
Educational and Health Services
Others
Luxembourg: Employment by Industry
0.05
0.32
0.06
0.10
0.03
0.08
0.04
0.12
0.17
0.03
Manufacturing
Whole sale/retail trade
Transportation, storage, postal …
Accommodation and food services
Information and communications
Finance and insurance
Real estate
Professional and business services
Social and personal services
Others
0.00 0.05 0.10 0.15 0.20 0.25 0.30 0.35
Hong Kong: Employment by Industry
0.02
0.14
0.04
0.08
0.05
0.10
0.04
0.18
0.24
0.11
0.00 0.05 0.10 0.15 0.20 0.25
Manufacturing
Wholesale & Retail Trade
Transportation & storage
Accommodation and Food Services
Information & communications
Finance and Insurance
Real Estate
Professional and Business Services
Educational and Health Services
Others
NYC: Employment by industry
0.15
0.14
0.10
0.07
0.05
0.06
0.02
0.11
0.23
0.07
0.00 0.05 0.10 0.15 0.20 0.25
Manufacturing
Wholesale & Retail Trade
Transportation & Storage
Accommodation & Food Services
Information & Communications
Financial & Insurance Services
Real Estate
Professional and business services
Social and personal services
Others
Singapore: Employment by Industry
LUXEMBOURG STAFF REPORT FOR THE 2012 ARTICLE IV CONSULTATION—INFORMATIONAL ANNEX Prepared By
European Department
I. FUND RELATIONS .......................................................................................................................... 2
II. STATISTICAL ISSUES .................................................................................................................... 3
CONTENTS
June 12, 2012
2012 ARTICLE IV REPORT—INFORMATIONAL ANNEX LUXEMBOURG
2 INTERNATIONAL MONETARY FUND
FUND RELATIONS(As of May 31, 2012)
Mission: May 3-14, 2012. The concluding statement of the mission is available at: http://www.imf.org/external/np/ms/2012/051412.htm
Fund relations: The previous Article IV consultation took place on March 24–April 4, 2011 (IMF Country Report No. 11/108). The staff report and associated Executive Board’s assessment are available at: http://www.imf.org/external/pubs/cat/longres.aspx?sk=24858.0
Membership Status: Joined: December 27, 1945; Article VIII General Resources Account SDR Million Percent QuotaQuota 418.70 100.00 Fund Holdings of Currency 264.48 63.17 Reserve Position in Fund 154.23 36.84 Lending to the Fund 99.00
SDR Department:
SDR Million Percent
Allocation Net Cumulative Allocation 246.62 100.00 Holdings 243.91 98.90
Outstanding Purchases and Loans None Financial Arrangements None.
Projected Payments to the Fund (SDR million based on existing use of resources and
present holdings of SDRs):
Forthcoming
Type 2012 2013 2014 2015
Principal 0.00 0.00 0.00 0.00
Changes/
Interest 0.00 0.01 0.01 0.01
Exchange Rate Arrangement Luxembourg’s currency is the euro, which floats freely and independently against other currencies. Luxembourg has accepted the obligations of Article VIII, Sections 2, 3, and 4, and maintains an exchange system free of restrictions on payments and transfers for current international transactions, other than restrictions notified to the Fund under Decision No. 144 (52/51).
Anti-Money Laundering/Combating the
Financing of Terrorism (AML/CFT) In early 2011, the Financial Action Task Force (FATF) concluded that Luxembourg had made progress to remedy several deficiencies in its AML/CFT, and ended the enhanced review process of the FATF’s International Cooperation Review Group. Luxembourg is now subject to a yearly follow-up by the FATF. However, some
LUXEMBOURG 2012 ARTICLE IV REPORT—INFORMATIONAL ANNEX
INTERNATIONAL MONETARY FUND 3
shortcomings remain, in particular in relation to legal entities transparency (i.e. beneficial ownerships and control), and the FATF has
been encouraging Luxembourg to continue its efforts to remedy all deficiencies identified in its mutual evaluation report.
STATISTICAL ISSUES(As of May 31, 2012)
I. Assessment of Data Adequacy for Surveillance
General: Data provision is adequate for surveillance. The Central Service for Statistics and Economic Studies (Statec) regularly publishes a full range of economic and financial data and provides an advance release calendar for main statistical releases at: http://www.statistiques.public.lu/fr/agenda/calendrier-diffusion/index.html.
On-line access to Statec’s databases and those of other jurisdictions is available to all users simultaneously at the time of release through the Statistics Portal of Luxembourg.
Key publicly accessible websites for macroeconomic data and analysis are: Statistics Portal of Luxembourg .......................................... http://www.statistiques.public.lu/fr/ Statec ............................................................................................. http://www.statec.public.lu/fr/index.html Central Bank of Luxembourg ............................................... http://www.bcl.lu/en/index.php Ministry of Finance ................................................................... http://www.mf.public.lu/
National Accounts: Luxembourg avails itself of the SDDS special flexibility for the timeliness of the national accounts, and generally disseminates national accounts data not later than four months after the reference period (the SDDS timeliness requirement for the national accounts is three months). Reduction of the reporting lag would aid surveillance.
II. Data Standards and Quality
Subscriber to the Fund’s Special Data Dissemination Standard (SDDS) since May 12, 2006. Uses SDDS flexibility options on the timeliness of national accounts and analytical accounts of the central bank.
No data ROSC is available.
2012 ARTICLE IV REPORT—INFORMATIONAL ANNEX LUXEMBOURG
4 INTERNATIONAL MONETARY FUND
Luxembourg: Table of Common Indicators Required for Surveillance (As of May 31, 2012)
Date of Latest
Observation
Date Received
Frequency of
Data7
Frequency of
Reporting7
Frequency of
Publication7
Exchange Rates 05/31/12 5/31/12 D D D
International Reserve Assets and Reserve Liabilities of the Monetary Authorities1
04/30/12 05/23/12 M M M
Reserve/Base Money 04/30/12 05/23/12 M M M
Broad Money 04/30/12 05/23/12 M M M
Central Bank Balance Sheet 04/30/12 05/23/12 M M M
Consolidated Balance Sheet of the Banking System 04/30/12 05/23/12 M M M
Interest Rates2 05/31/12 05/31/12 D D D
Consumer Price Index 04/30/12 05/09/12 M M M
Revenue, Expenditure, Balance and Composition of Financing3 – General Government4
2011 Q4 04/04/12 Q Q Q
Revenue, Expenditure, Balance and Composition of Financing3– Central Government
2012 Q1 04/27/12 Q Q Q
Stocks of Central Government and Central Government-Guaranteed Debt5
2011 Q4 04/04/12 Q Q Q
External Current Account Balance 2011 Q4 04/08/12 Q Q Q
Exports and Imports of Goods 03/31/12 05/25/12 M M M
GDP/GNP 2011 Q4 04/04/12 Q Q Q
Gross External Debt 03/12/12 04/08/12 Q Q Q
International Investment Position6 2011 Q4 03/30/12 Q Q Q
1 Including reserve assets that are pledged or otherwise encumbered. 2 Both market-based and officially-determined, including discount rates, money market rates, rates on treasury bills,
notes and bonds. 3 Foreign, domestic bank, and domestic nonbank financing. 4 The general government consists of the central government (budgetary funds, extra budgetary funds, and social
security funds) and state and local governments. 5 Including currency and maturity composition. 6 Includes external gross financial asset and liability positions vis-à-vis nonresidents. 7 Daily (D); weekly (W); monthly (M); quarterly (Q); annually (A); irregular (I); and not available (NA).
Public Information Notice (PIN) No. 12/67 FOR IMMEDIATE RELEASE July 2, 2012
IMF Executive Board Concludes 2012 Article IV Consultation with Luxembourg
On June 27, 2012, the Executive Board of the International Monetary Fund (IMF) concluded the Article IV consultation with Luxembourg.1
Background
Economic growth has slowed in 2011 amid the euro area sovereign debt crisis. Private consumption held up in the first half of the year. But as the crisis and uncertainty lingered, consumer and manufacturing business confidence fell and slowed domestic demand. Reflecting the waning impact of global fuel price increases and postponements in automatic wage indexation, inflation has eased. In recent months, employment growth has remained stable but the unemployment rate has risen, particularly long-run joblessness that accounts for about 45 percent of overall unemployment.
The fiscal deficit fell in 2011, reflecting an over performance in revenues and continued expenditure restraint. Staff estimates that the structural deficit, at ½ percent of GDP, was roughly unchanged from 2010. Public debt has nonetheless almost tripled to about 20 percent of GDP since the outset of the global financial crisis and is poised to continue increasing in the face of medium-term fiscal pressures.
1 Under Article IV of the IMF's Articles of Agreement, the IMF holds bilateral discussions with members, usually every year. A staff team visits the country, collects economic and financial information, and discusses with officials the country's economic developments and policies. On return to headquarters, the staff prepares a report, which forms the basis for discussion by the Executive Board. At the conclusion of the discussion, the Managing Director, as Chairman of the Board, summarizes the views of Executive Directors, and this summary is transmitted to the country's authorities. An explanation of any qualifiers used in summings up can be found here: http://www.imf.org/external/np/sec/misc/qualifiers.htm.
International Monetary Fund 700 19th Street, NW Washington, D. C. 20431 USA
2 The financial sector has endured the crisis and remained stable. The investment fund industry experienced some valuation losses in 2011 mainly due to euro area related market turbulence, but has largely recovered, with assets under management surpassing €2 trillion in early 2012. Though bank assets have been slower to recover, Luxembourg-based banks have generally remained well capitalized, profitable, and liquid. Their exposures to distressed sovereigns in the European periphery are generally contained, but cross-border exposures remain high. Cross-border, mainly intragroup, exposures still account for about ¾ of bank loans.
Reflecting sluggish external demand, economic activity is expected to further weaken, with growth projected to decline to ½ percent in 2012. Volatile financial markets and unclear economic prospects will likely continue to weigh on domestic demand. These factors will also likely reduce price pressures and reinforce inflation’s declining trend. Risks are tilted to the downside given ongoing uncertainties in the euro area.
Executive Board Assessment
Executive Directors welcomed the continued stability of Luxembourg’s economy despite the turbulence in the euro area, but noted that slowing activity and an uncertain economic outlook call for further steps to limit financial sector risks, safeguard fiscal sustainability, and boost medium-term growth.
Directors commended the authorities on measures taken to strengthen the financial sector and implement recommendations from the Financial Stability Assessment Program update. They supported further participation in EU supervisory colleges and the development of similar arrangements to promote cross-border cooperation among supervisors of non-EU banking groups and investment funds. Directors also advised the authorities to continue pursuing ahead of EU-level initiatives, if appropriate, regulatory enhancements not requiring legislation, and to continue encouraging banks to prepare for tighter liquidity standards under Basel III. More broadly, Directors saw scope for revisiting institutional arrangements for regulation and supervision, to better align these with evolving international standards. Regarding the AML/CFT framework, Directors noted the authorities’ commitment to undertake the needed measures to comply with revised FATF standards.
Directors welcomed the support to the economy provided by the 2012 budget. They urged the authorities to adhere to the budget’s expenditure allocations but cautioned that reliance on public investment caps could hurt growth in the long run. Directors generally agreed that automatic stabilizers should be allowed to operate if downside risks materialized. A few Directors, however, were not convinced that this would be effective, given low fiscal multipliers and the need to preserve hard-won credibility.
3 In light of the expected deterioration in public finances in coming years, Directors encouraged high-quality consolidation measures supported by a medium-term fiscal framework. In particular, while welcoming the proposed pension reforms, they urged the authorities to undertake a more comprehensive reform of the pension and healthcare systems to ensure fiscal sustainability.
Directors commended the authorities’ efforts to lay the foundation for higher medium-term growth through a comprehensive reform agenda. They encouraged nonetheless further steps to improve active labor market policies and the social safety net with a view to minimizing work disincentives and addressing market rigidities. Directors also welcomed measures to limit the adverse competitiveness effects of the wage indexation system, and suggested revising or eliminating this system in the medium term. Product market regulations should also be reviewed to foster competition, productivity growth, and economic diversification.
Public Information Notices (PINs) form part of the IMF's efforts to promote transparency of the IMF's views and analysis of economic developments and policies. With the consent of the country (or countries) concerned, PINs are issued after Executive Board discussions of Article IV consultations with member countries, of its surveillance of developments at the regional level, of post-program monitoring, and of ex post assessments of member countries with longer-term program engagements. PINs are also issued after Executive Board discussions of general policy matters, unless otherwise decided by the Executive Board in a particular case. The staff report (use the free Adobe Acrobat Reader to view this pdf file) for the 2012 Article IV Consultation with Luxembourg is also available.
Total employment (thousands) 352.2 357.8 368.4 375.3
CPI (harmonized), p.a. 0.0 2.8 3.7 2.3 Public finances (Percent of GDP) General government revenues 42.2 41.6 41.4 42.1
General government expenditures 43.0 42.4 42.0 44.0
General government balance -0.8 -0.9 -0.6 -1.9
General government gross debt 14.8 19.1 18.2 21.4 Balance of payments Current account balance 6.5 7.7 7.1 7.2
Balance of trade in goods and services 39.3 46.1 41.3 39.5
Factor income balance -30.1 -36.8 -31.5 -30.6
Transfer balance -2.8 -1.7 -2.8 -1.7 Exchange rates Member of the euro area U.S. dollar per euro 1.4 1.3 1.4 …
Nominal effective rate (2005=100) 104.9 102.1 102.6 … Sources: Data provided by the authorities; IMF, WEO database; and IMF staff calculations.
1/ IMF Staff projections.
Statement by Willy Kiekens, Executive Director for Luxembourg and Amela Hubic, Advisor to the Executive Director
June 27, 2012 The Luxembourg authorities would like to thank staff for their comprehensive and useful analysis that provides an objective view of the macro-economic situation in Luxembourg and the challenges the economy is facing. However, the authorities note that the structure of the staff report is not rightly balanced as financial sector issues cover a significant part of the report. The FSAP update, that took place in September 2011, has already tackled in detail the current state of the financial sector and the remaining challenges. More analysis and advice on macro-policy and on public finances would have been appreciated. The authorities broadly share the views of the staff. The country’s stable political, social and regulatory environments have helped its economy and financial sector to endure the recent global financial and the ongoing European sovereign debt crisis. The authorities have followed prudent macroeconomic policies and have paid careful attention to developing a business friendly climate and will continue to do so. They are committed to take all the necessary measures to further ensure the stability of the financial sector; long-run fiscal sustainability; and continued growth and employment. Diversification of the forward-looking financial sector across business types, investment destinations and customer bases has helped the economy to weather the crisis. Looking forward, the authorities are committed to pursue efforts to diversify the structure of the economy by developing new lines of business outside of financial sector realm (e.g. ICT, logistics or clean technologies). Finally, Luxembourg is among the very few European countries to maintain an AAA credit rating assessment with stable outlook, clearly demonstrating the market’s trust in the country. Recent economic developments and outlook
After a severe downturn in 2009, the Luxembourg economy recovered in 2010 and registered a real GDP growth of 2.7 percent. In 2011, growth decelerated to 1.6 percent in the context of the slowdown of European economies. During the last quarter of 2011, the Luxembourg economy grew by only 0.8 percent. This deteriorating situation primarily reflects weaker export demand resulting inter alia from a restricted fiscal stance at the European level, a substantial deterioration in both business and consumer confidence stemming from the sovereign debt crisis and the negative effect that all these developments had on financial markets. In 2012, the Statistical Office (Statec) and the Central Bank of Luxembourg (BCL) project real growth to be 1 percent of GDP, 0.5 percent higher than staff’s projections, before recovering to just above 2 percent in 2013.
In this difficult economic environment, employment growth has been decelerating, although remaining positive at 1.9 percent in April 2012. Close to one third of new jobs were created in the public sector (broad definition) while employment growth in the private sector was more subdued. Nonetheless, the seasonally adjusted unemployment rate is on the rise, reaching a historical peak of 6.1 percent in April 2012. Unemployment tends to become more structural as rightly emphasized in the staff report. Almost half of
2
the unemployed are low-skilled and a quarter of them are older than 50. The authorities are aware of this tendency and are planning to adopt measures to address it. The Ministry of Labor has already put in place some policies designed to preserve labor market participation among individuals over 50 who have recently lost their job. Public finances
The economic and financial crisis has weakened the state of public finances in Luxembourg. Despite this negative evolution, Luxembourg has maintained its relatively low level of public debt as well as a budgetary safety margin in relation to the Maastricht reference value of 3 percent of GDP. Nevertheless, the country is facing a series of challenges of a structural nature that will have an impact on public finances. Potential growth is declining, and so will be the growth of public revenues. The high degree of openness of the economy and its specialization in financial services make public revenues subject to high volatility. At the same time, public expenditures are sticky downwards with a significant part being growing autonomously, independent of the business cycle. Finally, public finances in Luxembourg are highly exposed to population ageing. The general government deficit declined from 0.9 percent of GDP in 2010 to 0.6 percent in 2011. Spending growth was kept below nominal GDP growth. New tax measures are estimated to have yielded 0.5 percent of GDP additional revenues. The debt-to-GDP ratio declined from 19.1 percent to 18.2 percent. With weak GDP-growth this year, the fiscal deficit is allowed to increase to 1.5 percent of GDP in 2012. For next year, in line with the country’s latest update of its Stability and Growth Program (April 2012) fiscal consolidation measures have been announced for the period 2013 – 2015. These measures should reduce the deficit to 1.2 percent of GDP in 2013 and by an additional 1 percent of GDP annually thereafter, compared to unchanged policies. Adjustment measures include expenditure reductions for 2/3 and revenue increases for 1/3. The authorities would have appreciated a clearer presentation of this consolidation package in the staff report for the period 2013 – 2014, as it is not clear whether staff’s projections include the government’s consolidation package or not. The authorities are skeptical about staff’s suggestion to let automatic stabilizers operate since in Luxembourg fiscal multipliers are rather low or close to zero, as recognized by the staff. Given the political difficulties in reducing the fiscal deficit, the authorities are reluctant to allow deviations from the nominal consolidation path. The general government balance is projected to continue to improve in 2014. However, in 2015, despite a favorable macroeconomic context, a structural change in the VAT regime will cause a revenue loss of about 1 percent of GDP due to a shift from the domicile of the e-commerce service provider to the residence of the consumer. This revenue drop will gradually increase as the change in the VAT regime is introduced gradually. In line with the European directive, 70 percent of the VAT receipts will be transferred to the ‘consumer’ countries during the first two-year period, 85 percent in 2017 and 2018, and 100 percent only in 2019. The staff estimate of these revenue losses seems to neglect this gradual phasing in.
3
If Luxembourg has not achieved its medium-term objective of a structural surplus of 0.5 percent of GDP in 2015, the authorities are committed to adopt additional measures in order to bring public finances back towards the medium-term fiscal objective. The staff report rightly points out that the debt-to-GDP ratio has almost tripled in the period 2007-2011, from 6.7 to about 18.2 percent. Let us nonetheless observe that Luxembourg’s debt level remains well below the 60 percent level of the Maastricht criteria, that the net public debt is significantly lower (Luxembourg’s participation in PNB Paribas alone amounts to 6 percent of GDP) and that the public debt is entirely denominated in euros. The authorities are committed to keep the public debt at low levels as the only sustainable trajectory for Luxembourg. Short-term public finances indicators in Luxembourg are favorable when compared with peer countries. Nonetheless, there are long-term challenges. The authorities are aware of the importance of putting the public finances on a sound footing in the long term. Since Luxembourg is a small open economy, from the authorities’ point of view, public debt levels should remain well below the Maastricht criteria, even in case of a renewed downturn. This will preserve long-term economic stability and business attractiveness of the country. Therefore, several initiatives have been taken. An important healthcare reform has become effective from January 1, 2011. Further reforms are being developed, including the restructuring of the hospital sector starting in 2013. A draft pension reform will be discussed in Parliament in the second half of 2012. The government concurs with the staff’s view about the urgent need to place Luxembourg’s old-age pension system (public and private) on a sustainable path. The existing pension system suffers from a number of costly rigidities, including the indexation of benefits to both price and real wage developments. The authorities are aware that this reform might not be sufficient to solve the problems of the pension system. Under the new pension regime, the government’s reassessment every five years should prompt corrective measures in case of expected shortfalls. Finally, the authorities are working on establishing a multi-year budgetary framework to deliver the needed fiscal consolidation. The framework would apply to all levels of the government, and include multi-year expenditure ceilings, consistent with the new EU requirements under the legislative “six pack” (to be transposed by the end of 2013) and the Fiscal Compact. Financial sector and developments in supervision
The banking sector has recently suffered from the ongoing sovereign debt crisis in the euro area. The aggregate bank balance sheet, after having recovered to more than euro 800 billion in January 2012, receded again in the following months to stabilize in April 2012 at a level slightly higher than the yearly average observed in 2011 (780 billion euros). This contraction follows declining asset values and reduced exposure on sovereigns and other banks. Bank profits before taxes, depreciation and provisions, declined by more than 11 percent in the first quarter of 2012 to around 1.4 billion euros. Still, Luxembourg-based banks remain well capitalized, profitable and liquid.
4
While some banks are retreating from Luxembourg, mainly because of restructuring measures or because their business model does not fit the Luxembourg financial sector, large banking groups expand their presence in Luxembourg because of its role and expertise as a hub for back-office and custodian services. Private banking is also undergoing a transformation, becoming more service oriented and catering increasingly to a more sophisticated clientele. The investment fund industry is an important component of the Luxembourg’s financial system. Although affected by the recent global financial crisis, the fund industry has recovered well. With over 2.2 trillion euro in April 2012, assets in Luxembourg-domiciled regulated funds reached a historical ceiling1. This is a result of both revaluation of assets held and new inflows. The number of investment funds has increased by 178 units between end 2010 and 2011 (from 3667 to 3845). Anecdotal evidence also suggests that investment funds that used to be offshore before the crisis are now seeking the safety of a regulated product like the UCITS brand and of a domicile in Luxembourg. Overall, it seems that the Luxembourg fund industry is weathering well the ongoing sovereign euro area debt crisis – both from a financial stability point of view and with regard to its reputation as a well regulated product. Moreover, the authorities do not share staff’s point of view that euro area turbulence could result in outflows of funds. If the investors want to change their investment portfolio and invest in other regions rather than in the euro area, they will probably opt for another Luxembourg-domiciled fund offering exposure to that specific region which in the end would not cause any outflows from the fund industry. The experience in recent crisis (e.g. Irish case) provides some evidence. Both the authorities and the fund industry’s management are confident about the outlook. The data of the first four months of 2012 indicate that the net asset value as well as the number of units has continued to increase. The industry management indicated that it does not expect any significant new inflows of assets for the rest of the year but is confident that the industry is able to maintain the current level. Luxembourg financial sector exposure to European periphery countries has declined significantly since the last consultation, as rightly noted in staff report, and represents a small share of overall assets. Moreover, the authorities are confident that, in an extreme tail event, the banking sector’s strong capital position provides comfort in this regard. Regarding Luxembourg Fund industry, the exposure to distressed sovereigns is limited. Solvency, Tier 1 capital and liquidity indicators are traditionally high in Luxembourg and remain so. Although Luxembourg-based banks have registered losses in their securities portfolios in 2011, they remain highly capitalized. Moreover, following the EBA recommendation of 8 December 2011 on the recapitalization of European banking groups, the banking supervision authority (CSSF) has increased the capital requirements for all Luxembourg based banks (not just those required by EBA) to a minimum 9 percent of risk-weighted assets in Core Tier I capital. The authorities acknowledge that the liquidity standards under Basel III (CRDIV/CRR in Europe) could be challenging if
1 The country is the second largest investment fund domicile in the world after US.
5
applied at the solo/sub-consolidated level. The CSSF and the BCL are closely following developments on that front. Regulatory issues. The authorities have made substantial progress in strengthening financial sector supervision and the regulatory framework. To improve the financial stability policy framework, the authorities followed the FSAP recommendation by further enhancing on-site supervisions and by hiring highly qualified staff. Indeed, the staff and resources of CSSF have been significantly increased and resulted in more frequent on-site inspections (from 38 in 2009 to 85 inspections in 2011 of banks) and augmented enforcement actions (from 4 in 2009 to 72 inspections of investment funds). Similarly, the BCL has vastly expanded its supervisory activities by also recruiting additional staff and expending the financial stability and prudential supervision department resources. The latter integrates one unit in charge of liquidity surveillance, one in charge of oversight of payment and settlement infrastructures and the financial stability unit tackling the macro-prudential aspects and assessing systemic liquidity risk. The BCL liquidity monitoring and surveillance framework at the institutional level comprises qualitative and forward-looking quantitative analysis, which includes both off-site analysis and on-site inspections. In this context, the BCL has conducted in 2011 nine on-site inspections in close cooperation with the CSSF. In addition, the central bank requires from a large proportion of banks to provide their liquidity gap projections on a daily basis. As regards the bank resolution regime and deposit insurance scheme, the authorities would like to emphasize the importance of moving in lockstep with EU-level regulations which is consistent with Luxembourg tradition of regulatory stability but also with other EU countries. The financial industry had recognized the value of stronger supervision for financial stability, which provides an additional safety net for investors, and has welcomed the constructive dialogues with supervisors (CSSF and BCL) as well as with Luxembourg authorities. The authorities take note of staff recommendations for refinements in Luxembourg’s institutional frameworks for financial supervision and regulation – in line with the FSAP update as well as forthcoming EU requirements – namely: clarifying the respective roles and duties of the CSSF and BCL on liquidity risk supervision; establishing a national macro-prudential authority with a central bank taking a leading role; and strengthening the CSSF’s operational independence. They take all these three issues very seriously and intend to take legislative actions to address them in a holistic manner. They stress that operational independence of institutions should go hand in hand with accountability and responsibility. The legislative actions will probably take place in the second part of 2012. At the international level both the BCL and the CSSF are engaged in exchange, discussion and analytical work on the new European supervisory infrastructure EBA and ESRB. Moreover, exchange of supervisory information and home-host coordination takes place at the level of supervisory Colleges and Cross Boarder Stability Groups for all important banking groups with cross border activities. In addition, the BCL and the CSSF
6
are engaging intensively with banks to prepare them for potential future changes in regulation. Other issues
Diversification of the economy. The authorities are committed to pursue efforts to diversify the structure of the economy which is currently largely based on the financial sector activities (close to 30 percent of GDP) that contribute significantly to fiscal revenues (around 25 percent of total revenues) as well as to employment (around 10 percent of employment). At the beginning of 2012, the authorities founded a Luxembourg Future Fund to support the diversification and sustainable development of the economy. The Fund should invest directly or via other funds in innovative small and medium enterprises in a start-up or development phase in technology sectors (e.g. ICT or clean technologies). The government will invest 120 million euro in the Fund via the ‘Société Nationale de Crédit et d’Investissement (SNCI)’ and the European Investment Fund will contribute another 30 million euros. In addition, the government will invest in health sciences and technology via an existing private fund. Competitiveness and unit labor cost. The authorities have noted the deterioration in price competitiveness over the last decade (unit labor costs rising much faster than in neighboring countries) due to high wage increases coupled with low productivity growth. Wages and benefits are linked to inflation through an automatic indexation mechanism. The authorities took steps to improve competitiveness by adjusting the system of wage indexation. In December 2011, Parliament adopted a law to temporarily modify the automatic indexation of wages. The automatic indexation of wages, which would have occurred in March 2012, has been postponed to October 2012. Moreover, until 2014, at least 12 months should elapse between each indexation step of 2.5 percent. With the introduction of this minimum interval, wages and benefits will no longer be fully indexed to the cost of living in the event that inflation exceeds 2.5 percent. This so-called ‘modulation of the wage indexation system’ prevents an upward spiral of cost and price increases and will have a temporary effect on cost competitiveness, especially in times of high inflation. From 2015 on, the automatic indexation will return to its previous mode, but the counter for the next automatic wage indexation will be set to zero. As a consequence, some of the gains in cost competitiveness will be permanent. The authorities are aware that this modulation is only temporary and that the room of manoeuvre in terms of productivity gains is getting smaller. Therefore, it is essential to ensure the competitiveness by limiting the growth of unit labor costs. During this temporary modulation period, the authorities will be working with unions and employers’ representatives on a more permanent solution which should not undermine social cohesion in Luxembourg.


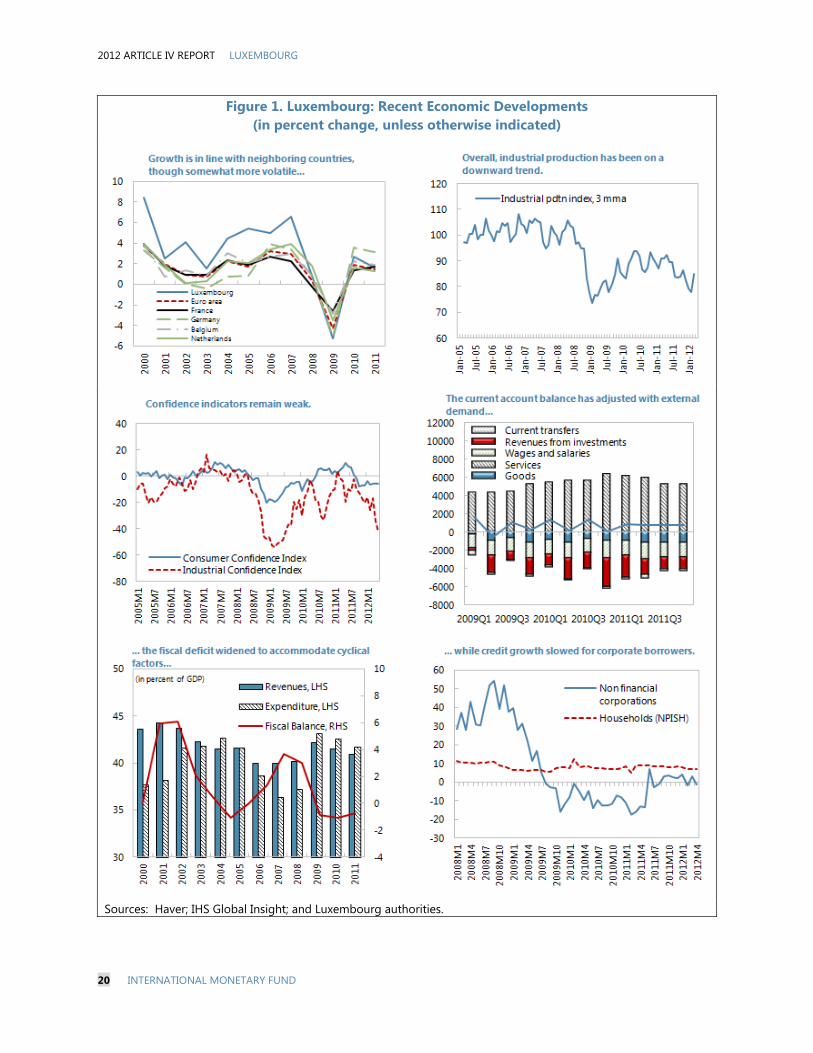
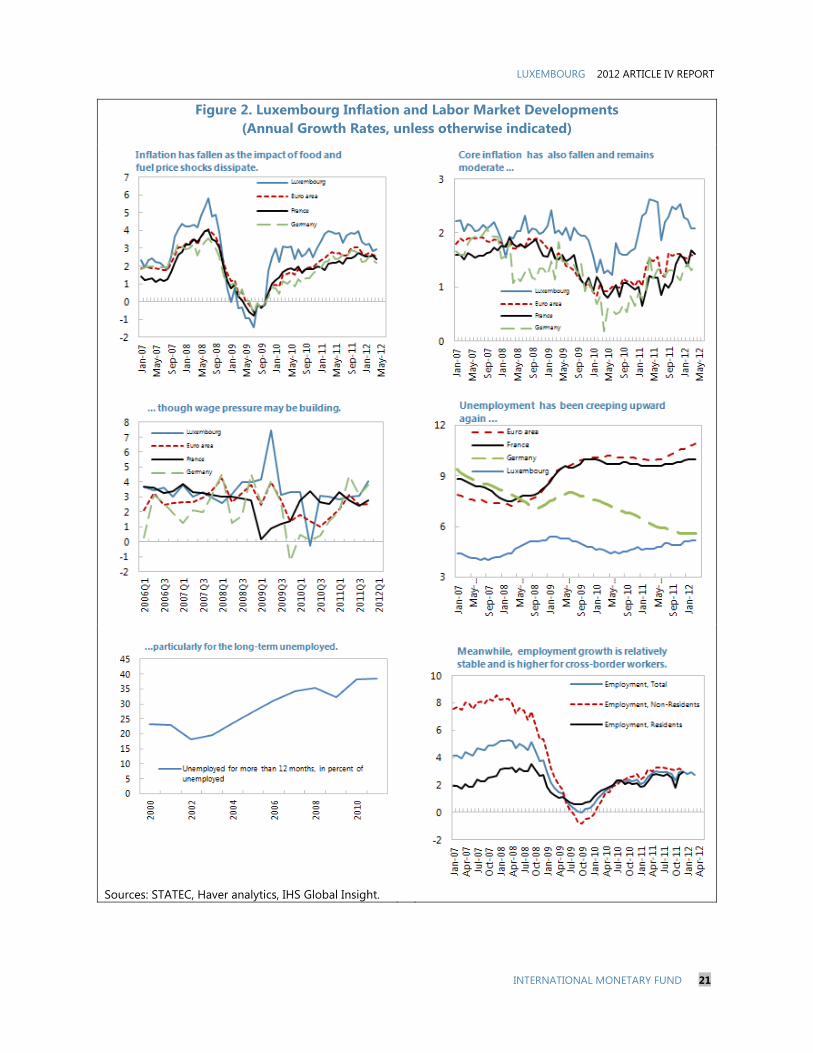
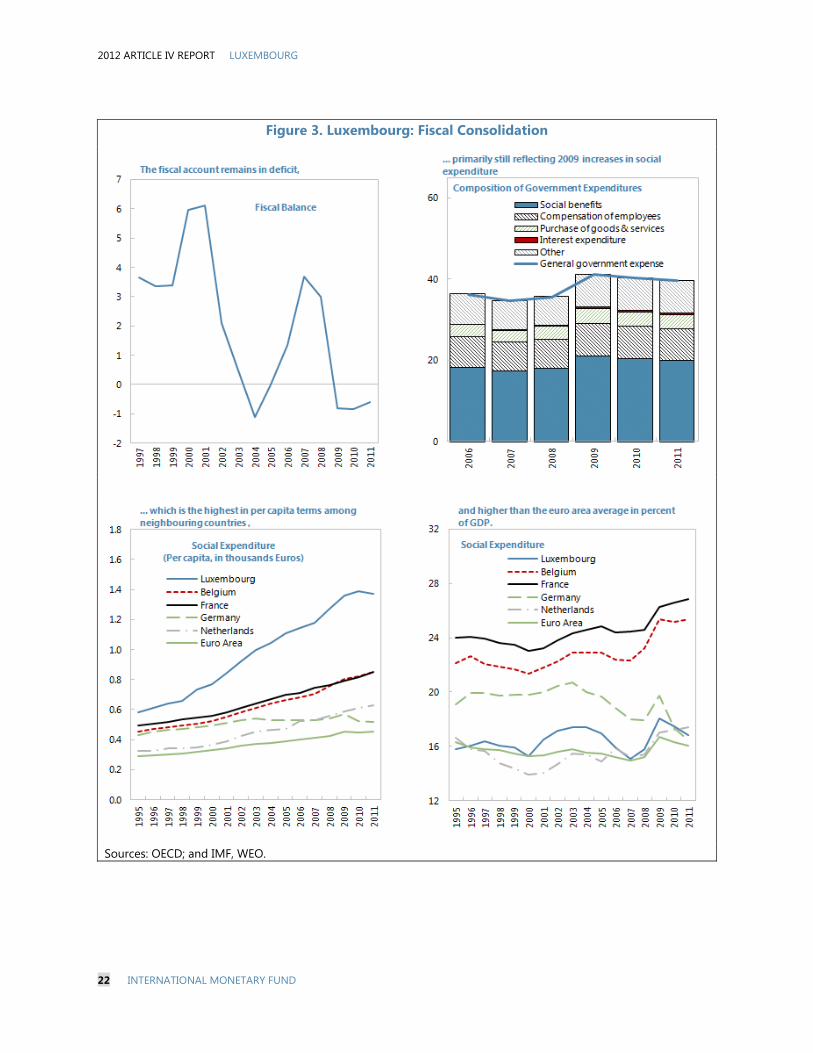


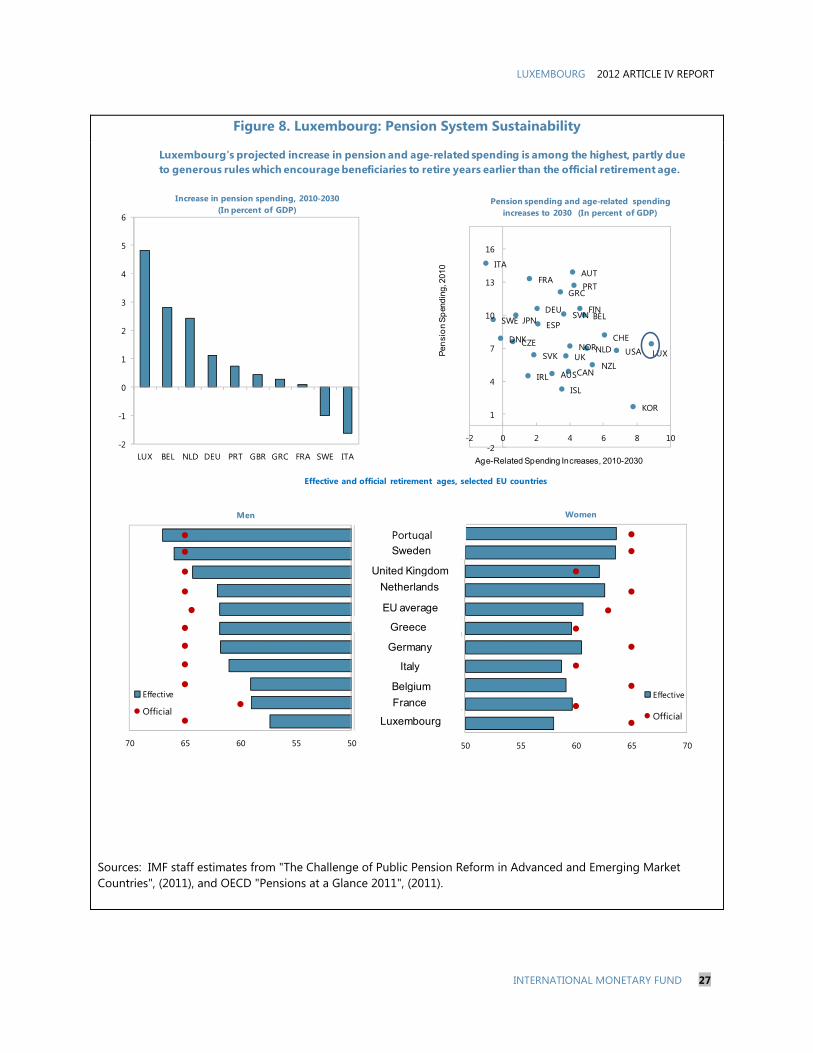


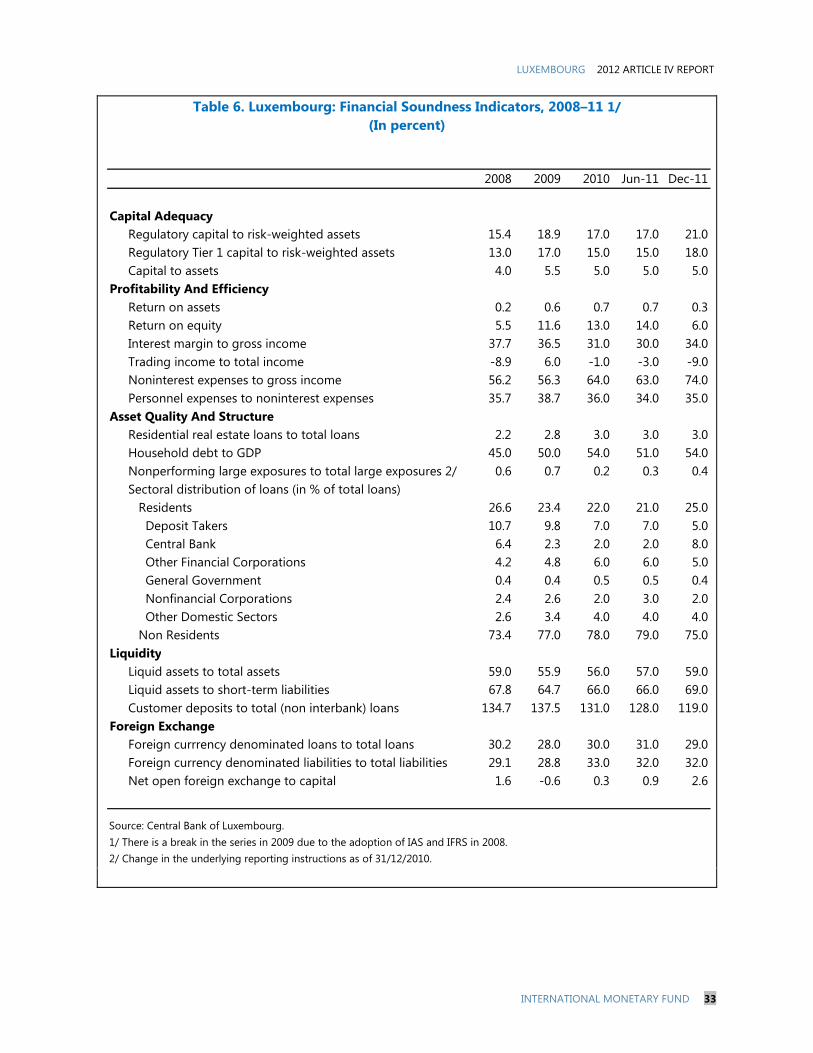

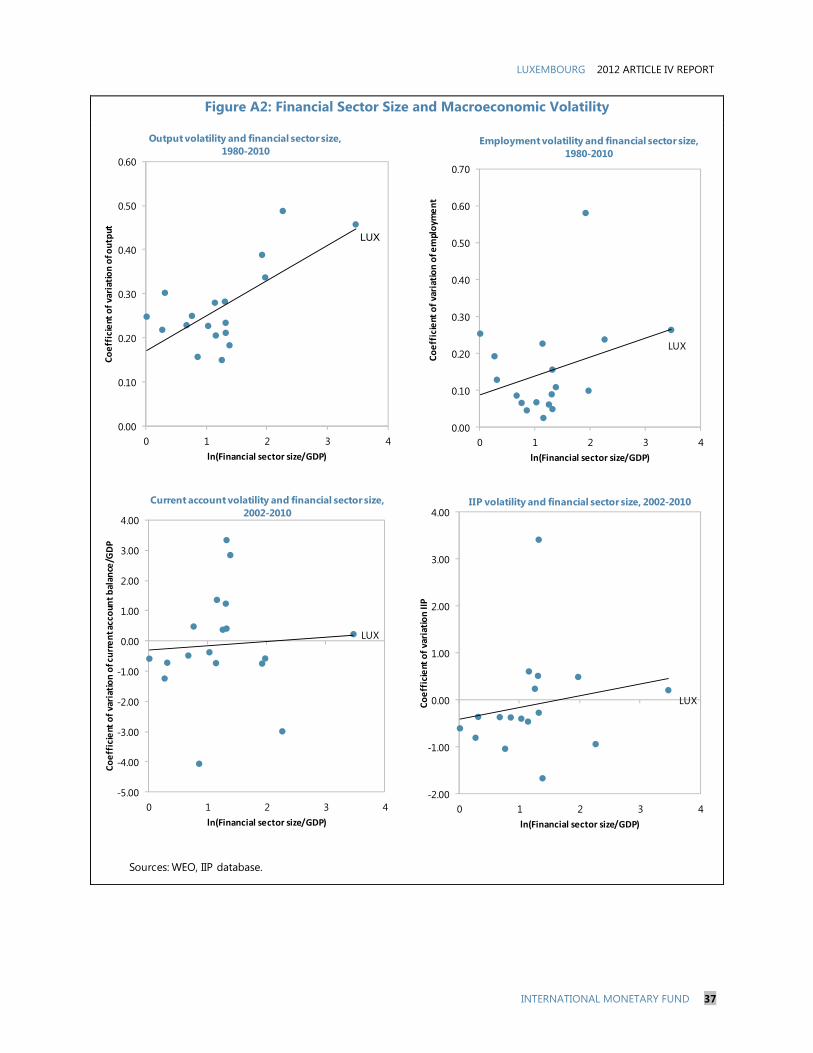


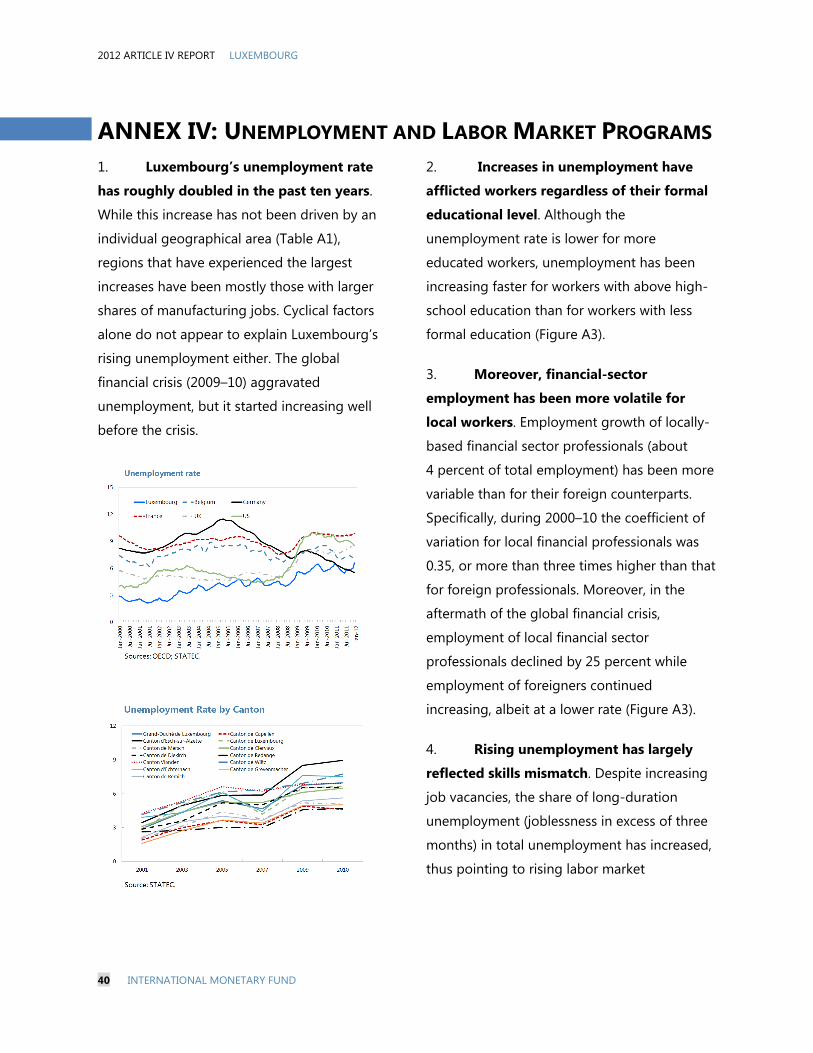


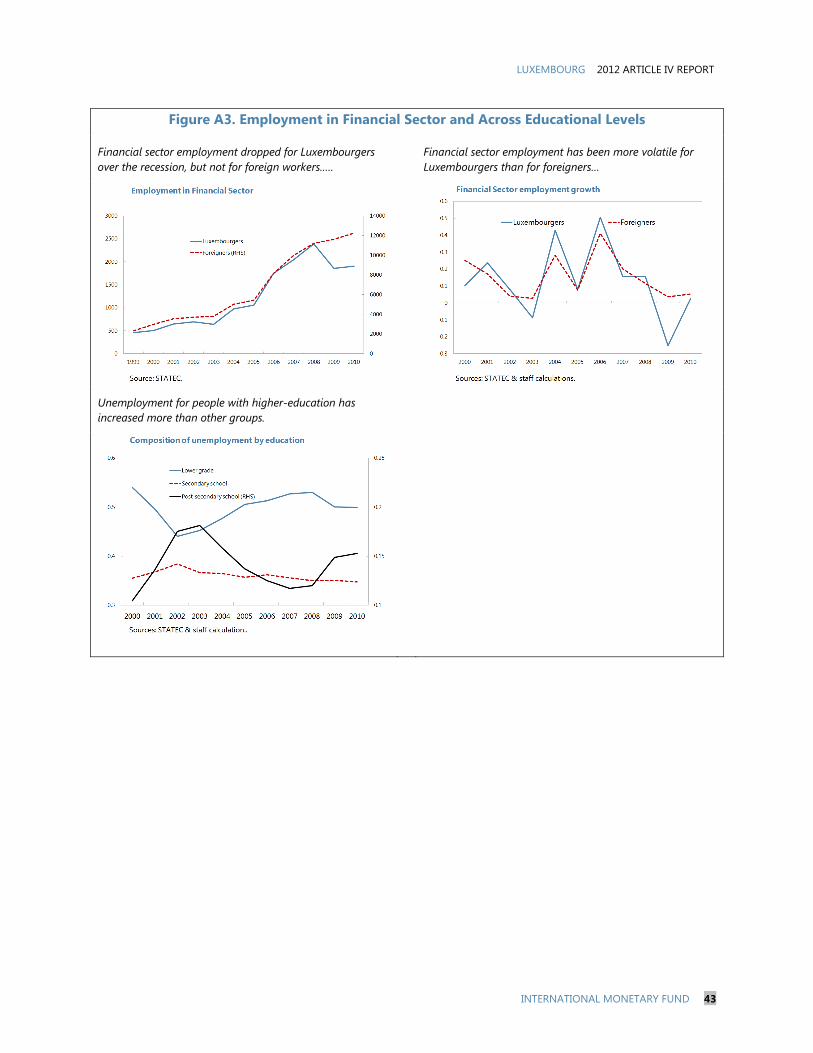
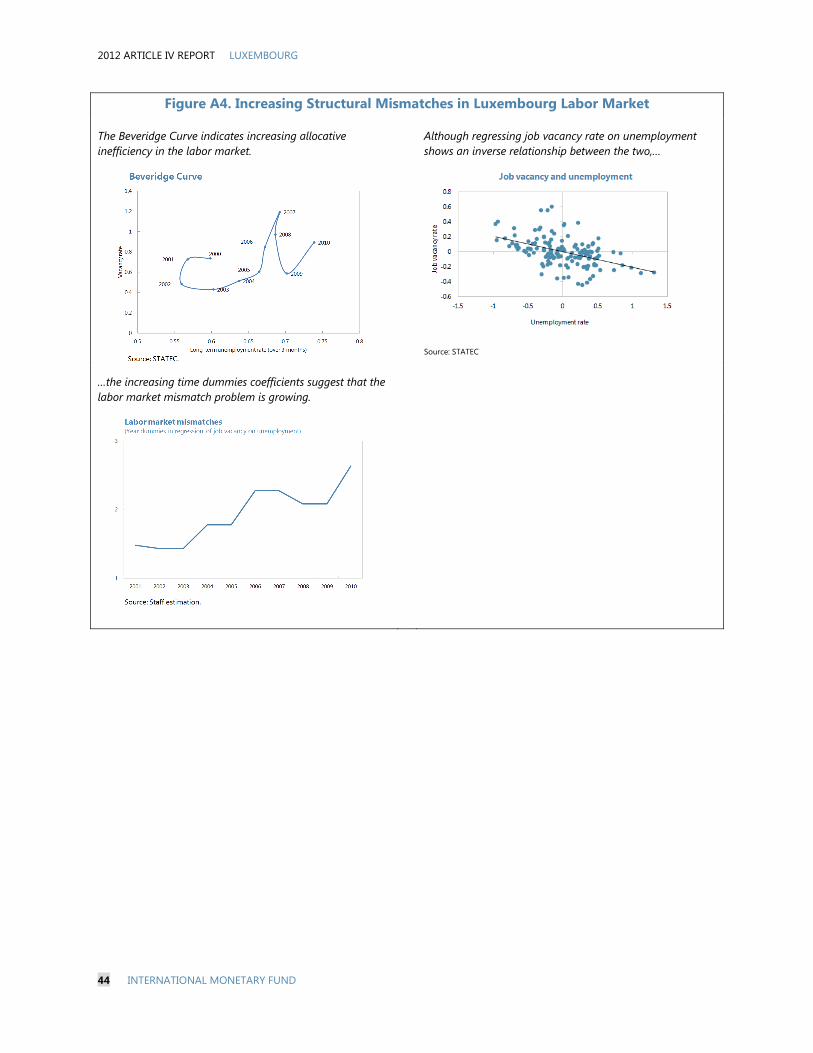

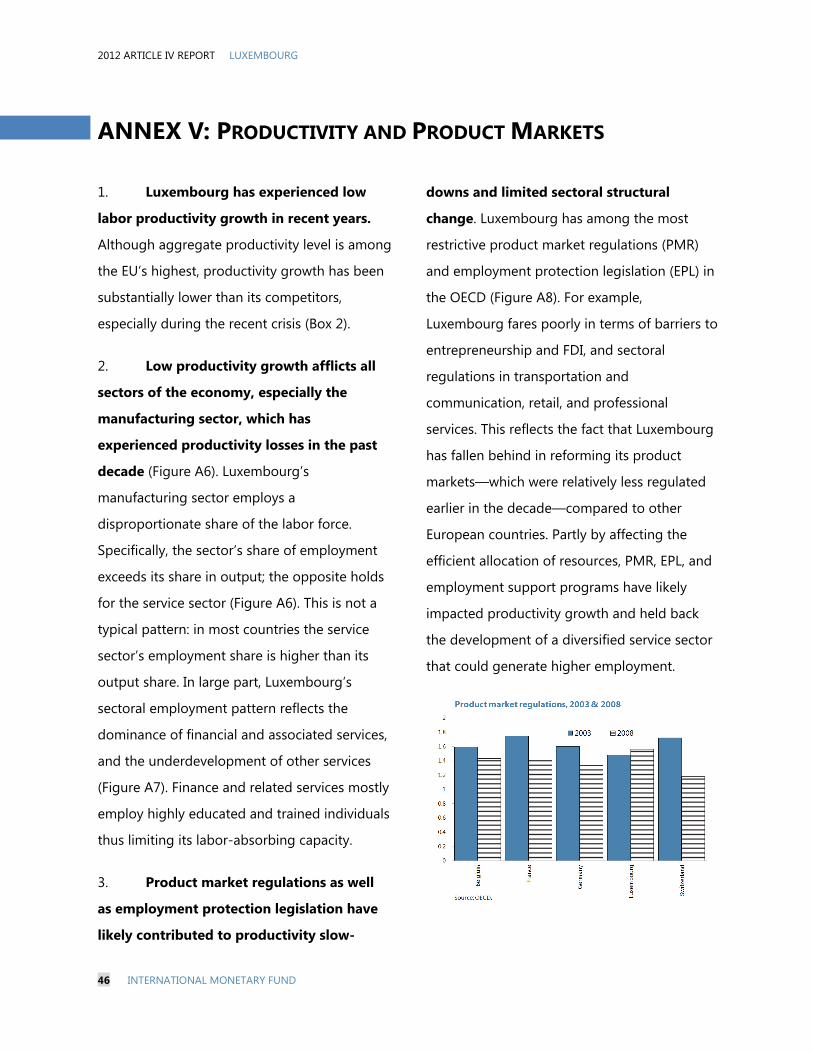
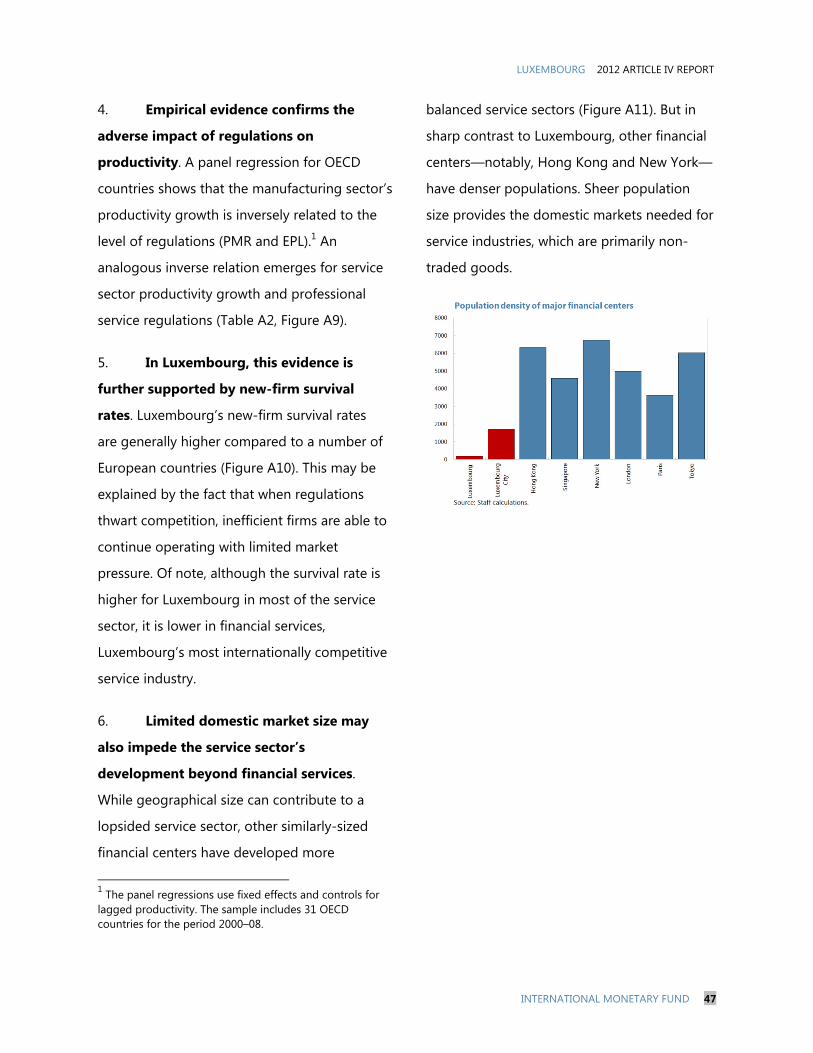


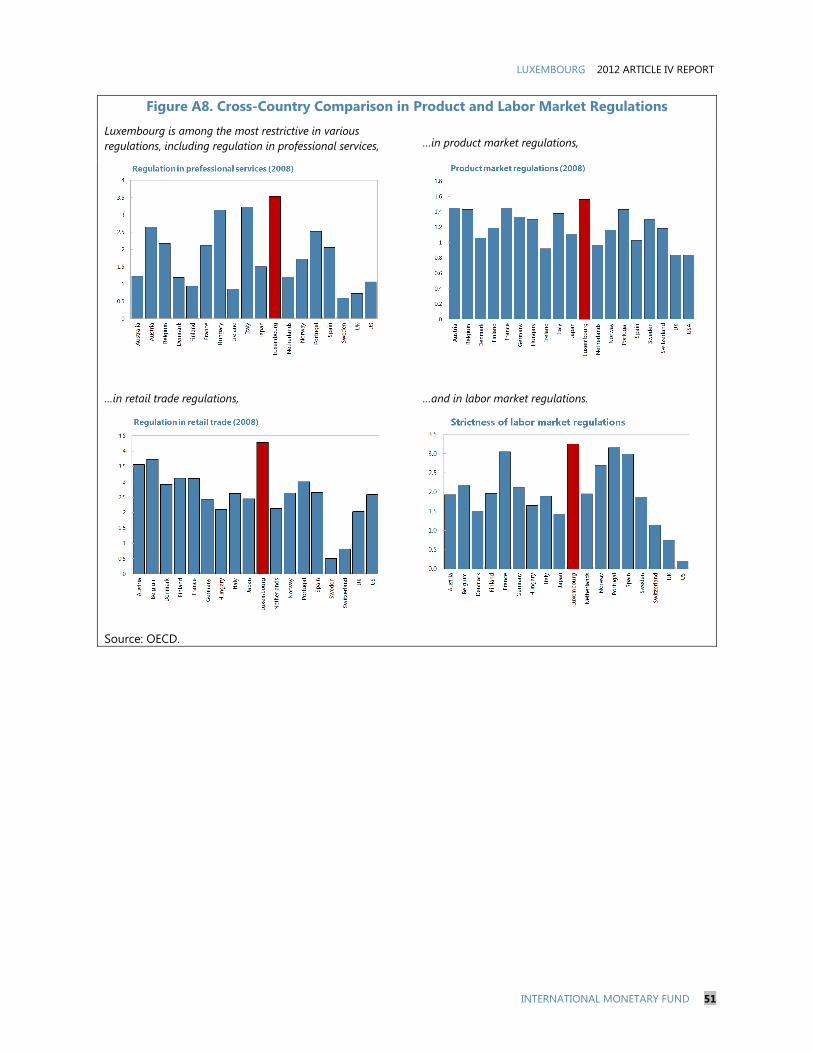

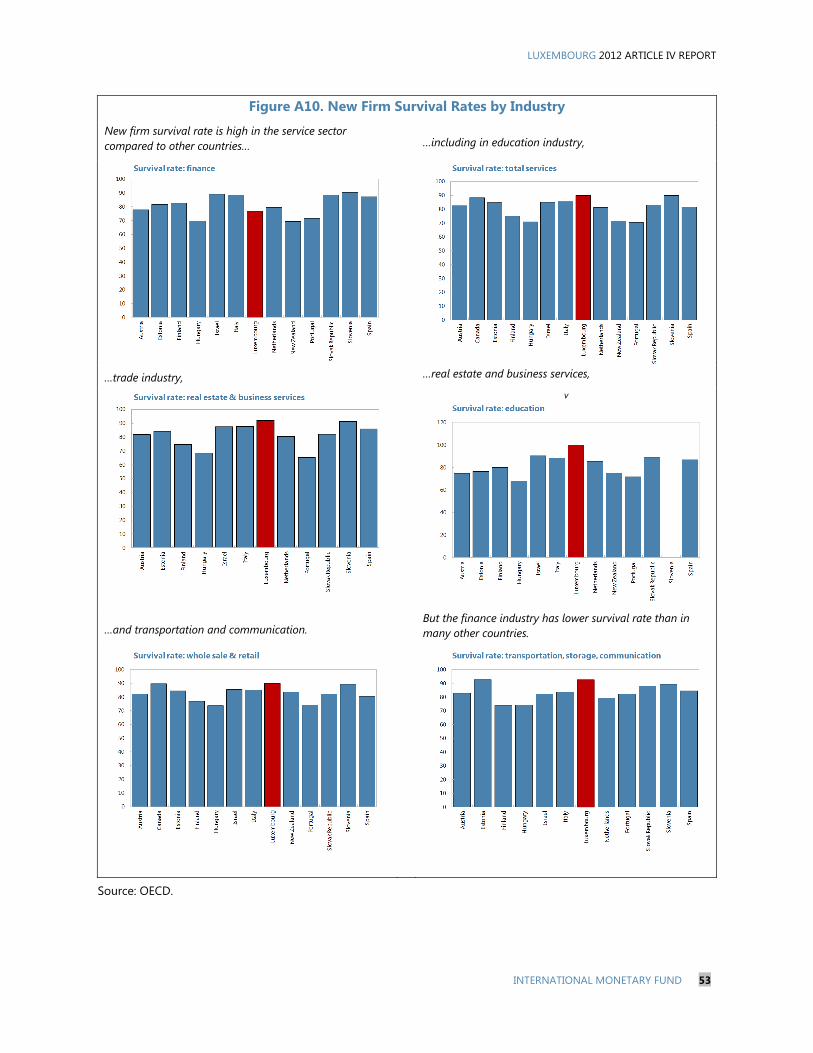
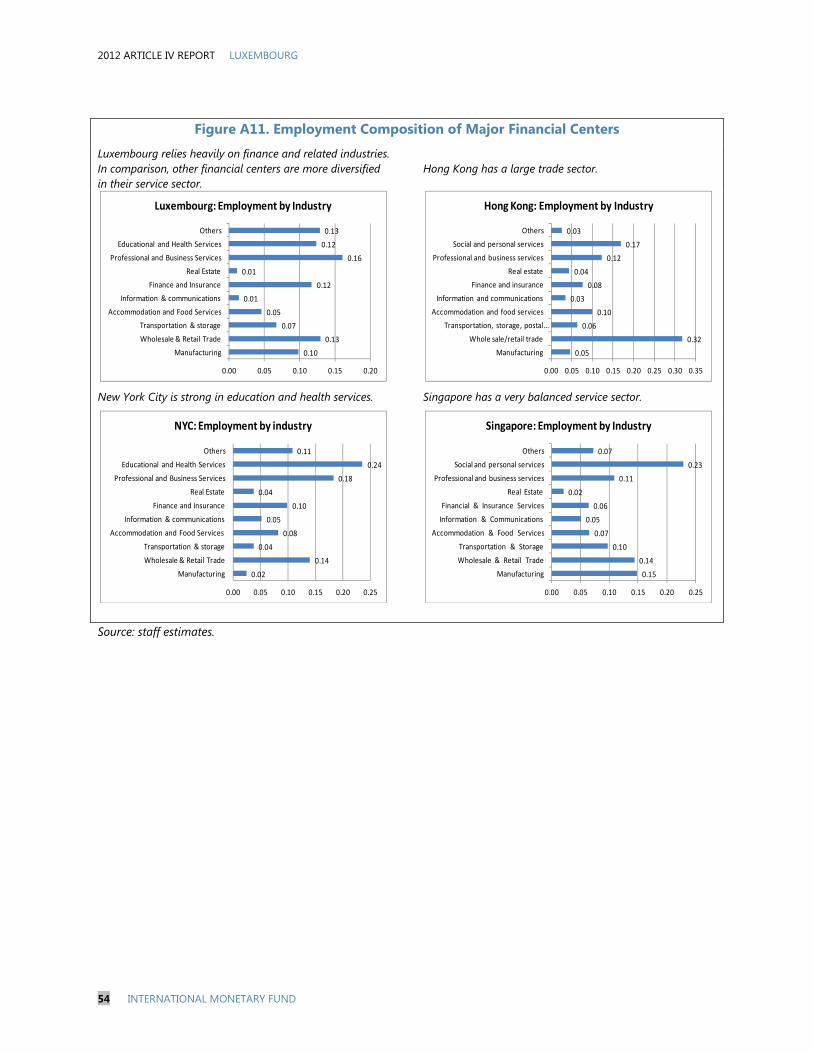


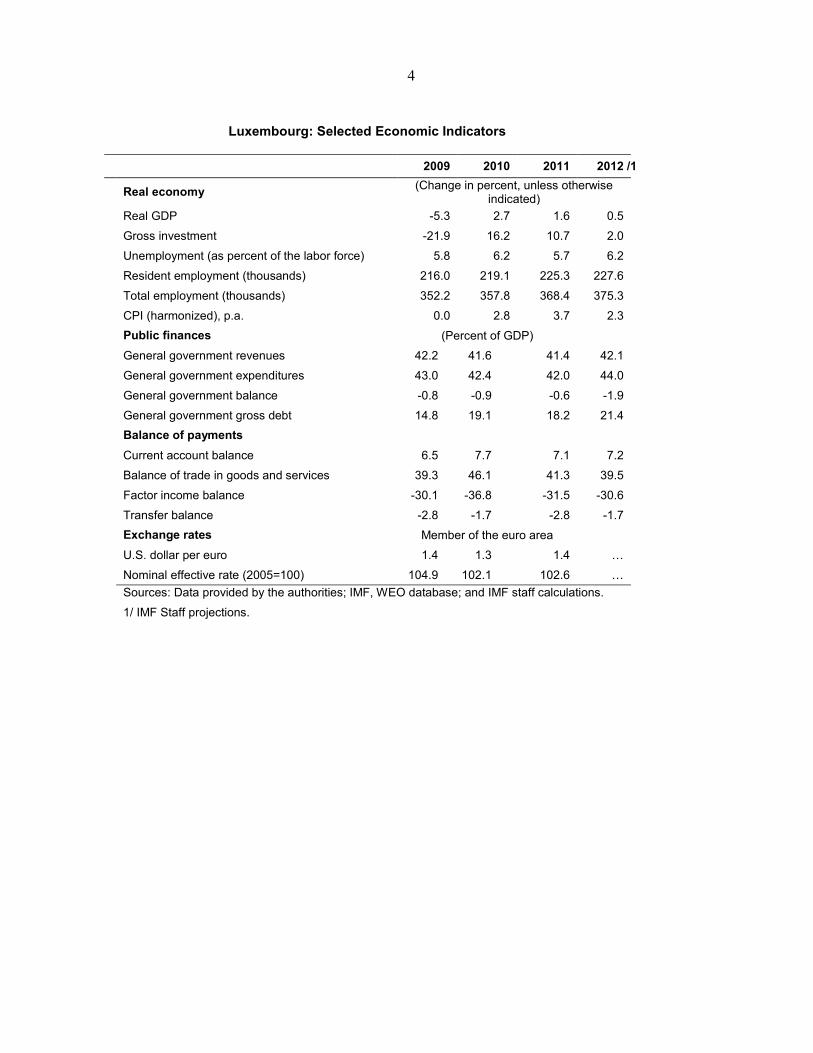


![IMF Country Report No. [15/145] LUXEMBOURG · eliminate price differentials with neighboring countries (OECD, 2015). 1 Prepared by Michael Gorbanyov, with inputs from Piyabha Kongsamut](https://static.documents.pub/doc/80x56/5f81b1c1f8c26e7dca186fc7/imf-country-report-no-15145-luxembourg-eliminate-price-differentials-with-neighboring.jpg)


