Under Article IV of the IMF’s Articles of Agreement, the IMF holds bilateral discussions with members, usually every year. In the context of the 2013 Article IV Consultation with Zambia, the following documents have been released and are included in this package:
The Staff Report for the 2013 Article IV Consultation, prepared by a staff team of the IMF for the Executive Board’s consideration on December 11, 2013, following discussions that ended on October 12 , 2013 with the officials of Zambia on economic developments and policies. Based on information available at the time of these discussions, the staff report was completed on November 26, 2013.
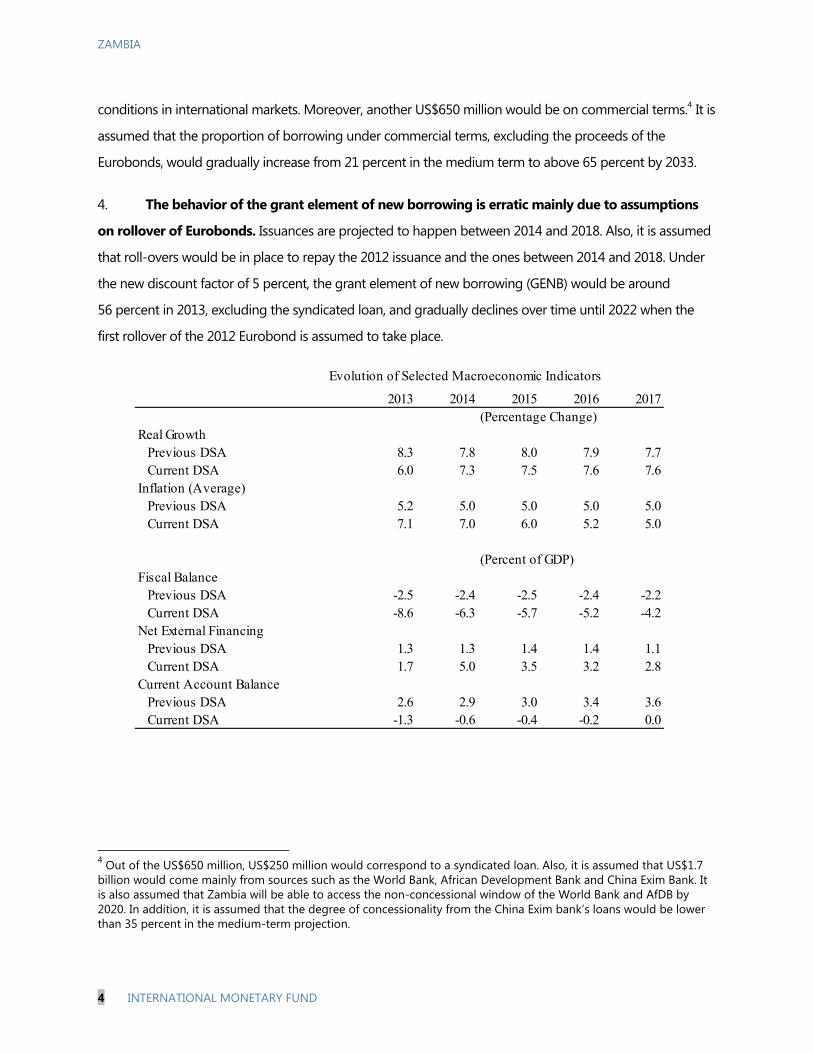
An Informational Annex prepared by the IMF in consultation with the World Bank.
Debt Sustainability Analysis prepared by the staffs of the IMF and the World Bank.
A Press Release summarizing the views of the Executive Board as expressed during its December 11, 2013 consideration of the staff report that concluded the Article IV Consultation with Zambia.
A Statement by the Executive Director for Zambia.
The policy of publication of staff reports and other documents allows for the deletion of market-sensitive information.
Copies of this report are available to the public from
International Monetary Fund Publication Services 700 19th Street, N.W. Washington, D.C. 20431
ZAMBIA STAFF REPORT FOR THE 2013 ARTICLE IV CONSULTATION
KEY ISSUES Context. The Zambian economy has performed well in recent years, with strong growth and modest inflation, and has high growth potential. The government has resolved to step up development by scaling up investment in infrastructure. However, this year has seen a significant loosening of fiscal policy, leading to a large fiscal deficit.
Outlook and risks. Assuming front-loaded fiscal adjustment toward a sustainable deficit, growth is projected to remain strong at 7–8 percent and inflation to decline gradually to 5 percent over the medium term. Key risks to the outlook are the uncertainties about fiscal policy and the broader business environment, and a possible slowdown in emerging markets and its impact on copper prices.
Fiscal stance. The current fiscal stance is unsustainable. To improve Zambia’s fiscal position, fundamental reforms are required to contain the wage bill and recurrent expenditures, boost domestic revenue, and create fiscal space for infrastructure investment. Staff recommended reducing deficits to 5 percent of GDP in 2014 and gradually to 3 percent over the medium term, and bringing down net domestic financing to 1½-2 percent of GDP to avoid crowding out the private sector.
Public financial management (PFM). To support fiscal consolidation, PFM reform needs to be stepped up. Investment planning and implementation also need to be strengthened to support planned scaling up of capital expenditures, and debt management strengthened in light of the increasing reliance on non-concessional financing.
Monetary policy. Given the low level of international reserves, the Bank of Zambia (BOZ) should allow more exchange rate flexibility and continue to build up reserves in line with their medium-term target. BOZ also needs to continue to tighten monetary policy to contain inflation.
Competitiveness. Over the last decade, Zambia’s competitiveness has been boosted by strengthened macroeconomic fundamentals and a favorable business environment. However, a series of recent regulations have raised questions about the policy direction, and high minimum wages could hamper the country’s competitiveness, job creation, and economic diversification.
November 26, 2013
ZAMBIA
2 INTERNATIONAL MONETARY FUND
Approved By David Owen and Chris Lane
Discussions took place in Lusaka during July 3-16 and September 17-24, and in Washington October 10-12. The staff team comprised J. Wakeman-Linn (head), K. Ismail, B. Jang (all AFR), M. Arena (SPR), and T. Rasmussen (resident representative). Ms. Kapwepwe (OED) participated in the discussions. The mission met with the Minister of Finance; the Governor of the Bank of Zambia; other senior government officials; and representatives of the private sector, trade unions, civil society, and the donor community.
CONTENTS
DECADE OF PROGRESS BUT THE ECONOMY AT A CROSSROADS ____________________________ 4
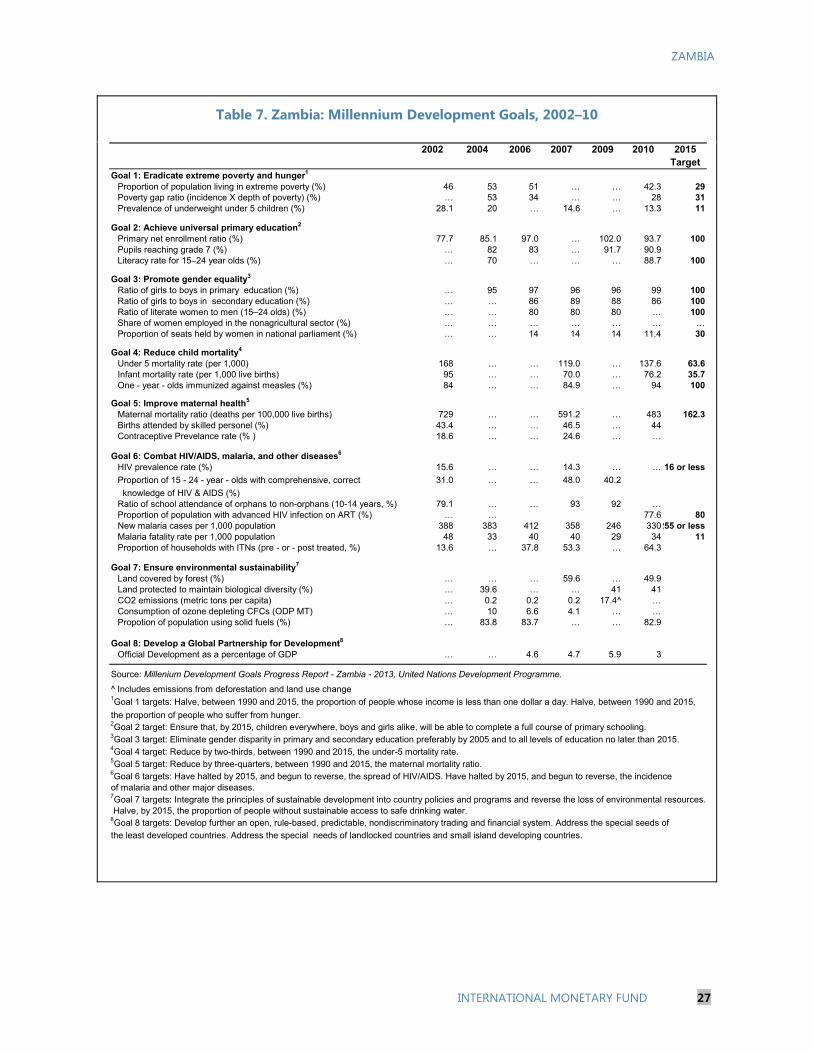
7. Millennium Development Goals, 2002–10 _____________________________________________________ 27
APPENDICES
I. Competitiveness ________________________________________________________________________________ 32
II. Risk Assessment Matrix ________________________________________________________________________ 40
III. A Regional Comparison of Government Wage Spending _____________________________________ 41
IV. External Stability Assessment _________________________________________________________________ 46
V. Lending Rate Ceilings and Their Impact on the Nonbanking Sector __________________________ 48
ZAMBIA
4 INTERNATIONAL MONETARY FUND
DECADE OF PROGRESS BUT THE ECONOMY AT A CROSSROADS1. Decade of progress. Zambia has achieved high, sustained growth—thanks to strong growth in copper production and prudent macroeconomic policies—and macroeconomic stability over the past decade, supported by two Extended Credit Facility (ECF) arrangements. During this period, Zambia received debt relief of $5.5 billion. Public debt was just over 30 percent of GDP at end-2012, of which about half was external debt. GDP per capita in PPP terms has almost doubled since 2000. However, poverty remains high (in 2010, an estimated 60.5 percent of the population was living in poverty and 42.3 percent in extreme poverty) and infrastructure needs to be improved substantially (Ex-Post Assessment update, 2011).
2. Growth and inflation. Output grew 7.2 percent in 2012, supported by strong performance in agriculture, construction, and communication services. Growth is expected to decline to 6 percent in 2013, mainly owing to lower agricultural production. Inflation was slightly above the BOZ target of 7 percent at end-2012, and was 6.9 percent in October 2013, mainly driven by non-food inflation.
3. Fiscal developments. The government conducted fiscal policy prudently in recent years, and the 2013 budget targeted a deficit of 4.1 percent of GDP (broadly consistent with the 2012 Article IV recommendations), with significant increases in capital spending. However, the actual fiscal deficit for 2013 is projected to be roughly double the budgeted level, mainly as a result of significant overspending on recurrent items, primarily subsidies and wages.
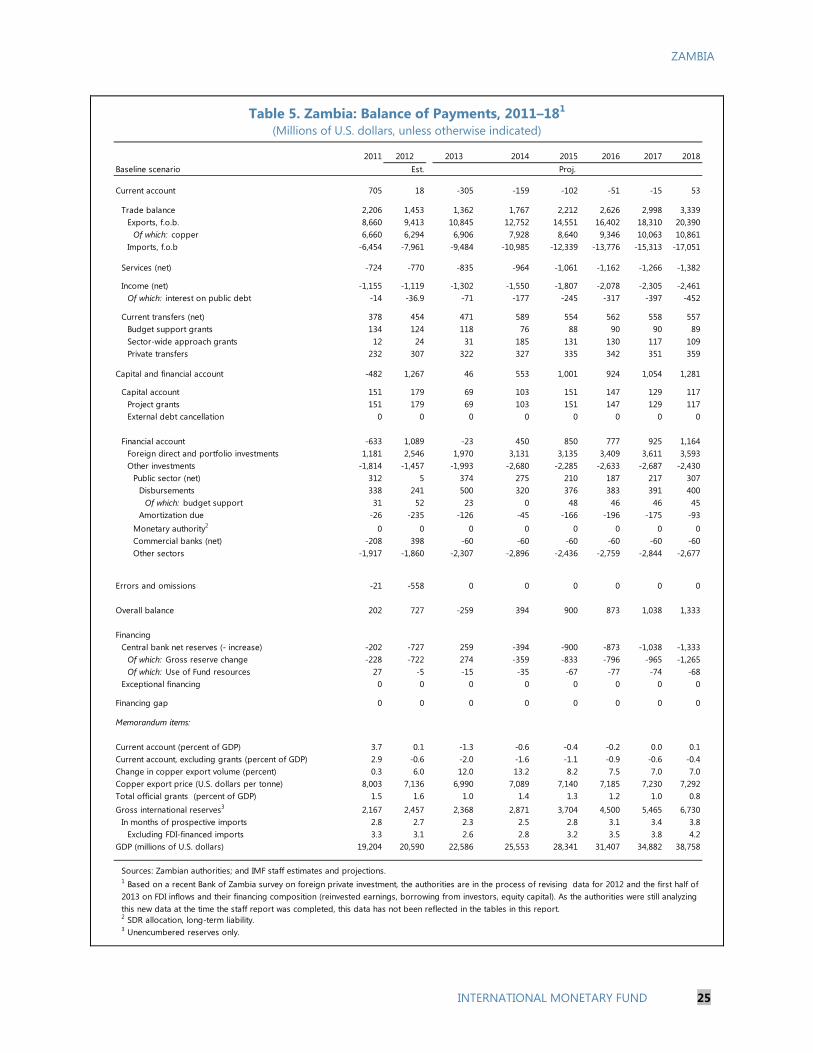
4. External position. The current account was roughly balanced in 2012, but is expected to move into a deficit of 1.3 percent of GDP in 2013, despite rapidly growing non-traditional exports, reflecting lower copper prices and rising imports. FDI has been increasing in recent years, largely in mining. International reserves are increasing slowly, but remain low after sharp declines earlier in 2013. In January-
Spread to Benchmark for Selected Eurobonds (Basis points)
Senegal (B+ 1/)
Namibia (BBB- 2/)
South Africa (BBB 1/ 2/)
Nigeria (BB- 1/ 2/)
Zambia (B; B+ until 10/28/13 2/)
Sources: Bloomberg, Fitch and S&P.1/ S&P2/ Fitch
ZAMBIA
INTERNATIONAL MONETARY FUND 5
April 2013, BOZ sold foreign exchange to offset depreciation pressures. The possible tapering of unconventional monetary policy in the U.S. has had little impact on Zambia’s Eurobond yields, but reflecting concerns about the Zambian economy, Zambia’s Eurobond spreads have during 2013 increased more than those of other African countries.
5. Financial sector. The banking sector has grown steadily and remains profitable and well-capitalized. Private sector credit growth has started slowing down in 2013 from a rapid increase in the second half of 2012. Nonperforming loans declined to 8.2 percent of total loans in mid-2013 from 15 percent in 2010.
6. Past advice and recent reform measures. In line with earlier advice, the government recently made progress in structural reforms by curtailing fuel and agricultural subsidies (Box 1) and announcing a pension reform plan that will include an increase the pension age to 65 from 55 years. The authorities have also made progress in improving access to financial services, and the government increased BOZ’s capital substantially. BOZ has proceeded flexibly and gradually with the implementation of the increased capital requirement for banks. However, traction on PFM reforms, including on fiscal reporting and quality control, has been weak and the fiscal situation has deteriorated sharply in 2013.
Box 1. Subsidy Reform
Subsidies for fuel, maize, and agricultural inputs have in recent years been a source of significant budget overruns in Zambia. During 2010-13, these subsidies averaged close to 3 percent of GDP in total, of which only about one quarter was provided for in the original budgets. Aside from being difficult to manage, the programs have been widely criticized as being excessively costly and not obtaining good value for money. To rein in expenditures and better target those in need, the Zambian government has embarked on a major subsidy reform. Retail fuel prices were raised in May 2013 by an average of almost 22 percent, eliminating a mounting subsidy and generating savings for the government of about 1.2 percent of GDP. Around the same time, Government announced that it would reduce the scale of the Food Reserve Agency’s operations and eliminate the difference between its buying and selling price for maize. Moreover, the price of fertilizer under the Farmer Input Support Program was doubled. While the reforms are still underway and the full savings are yet to be realized, the combined cost of the latter two programs is expected to be reduced to 1.0 percent of GDP in 2014 from 2.2 percent of GDP on average during 2010-13. In addition, starting from the 2014 budget, the authorities have decided to accurately reflect all maize-related activity on budget. Along with the reduction of subsidies, government is scaling up social cash transfers to better assist the poor. The budgeted allocation to such transfers is being increased almost tenfold to K150 million in 2014 (about 0.1 percent of GDP) to provide some 143,000 of the poorest households with about $12 a month. This program will cover approximately 13 percent of those in extreme poverty, and for the average recipient household the transfer should boost consumption by 20 percent and eliminate almost half of the gap to the food poverty line. Government plans to extend the program nationwide over the coming years as delivery capacity is built up.
ZAMBIA
6 INTERNATIONAL MONETARY FUND
7. Political and business environment. Zambia’s score in the World Bank’s Doing Business Indicators has improved over the past decade, largely due to improvements in the ease of getting credit and enforcing contracts (Appendix I). Policymakers, however, have at times taken measures adding to costs of doing business and raising uncertainty about the policy direction. The government banned, in mid-2012, the use of foreign exchange in domestic contracts (creating problems for some externally-funded businesses, although these were reduced by a later exclusion of electricity projects from the ban); BOZ introduced caps on lending rates early this year; and the authorities recently adopted a new regulation to strengthen monitoring of foreign exchange transactions (adding to business costs, albeit limited by subsequent revisions of the regulation).
8. Medium-term outlook. The Zambian economy has high growth potential, with its substantial mineral wealth and largely untapped resources in agriculture, hydropower, and tourism. In light of the significant policy uncertainties, however, the medium-term outlook for growth and inflation is uncertain. Assuming front-loaded fiscal reforms leading to a medium-term deficit of 3 percent of GDP, and a business friendly policy environment, staff projects growth to remain at 7–8 percent and inflation to decline gradually to 5 percent. The proposed fiscal adjustment together with increased copper production and non-copper exports would improve the current account to roughly balance by 2018.
9. Risks. The balance of risks to growth is on the downside due to the uncertainties regarding the pace of fiscal adjustment and the investment climate. If the needed fiscal adjustment is delayed, the economy would be highly vulnerable to negative shocks, with low international reserves and rapidly rising public debt. In addition, the authorities might have difficulty mobilizing the needed deficit financing (Risk Assessment Matrix). Other risk factors include weather conditions, financial fallout from a reemergence of financial stress in the euro area, and trade and commodity price implications of a slowdown in emerging markets such as China. Greater exchange rate flexibility could help cushion against negative shocks, including disruptions to external financing and worsening of the terms of trade.
10. Authorities’ views. The authorities broadly shared staff’s assessment of the economy and outlook. They noted that steps had already been taken to contain the fiscal deficit, including by removing the fuel subsidy, and that further strong action would be taken in 2014 and over the medium term. They also emphasized their commitment to maintaining a business friendly environment, noting that the recent steps to tighten regulation were needed to strengthen monitoring of the economy and had already revealed some suspicious business activities.
POLICIES GOING FORWARD11. Government objectives. The government’s Sixth National Development Plan aims to make Zambia a prosperous middle income country with an economic program leading to inclusive growth. Large public investment, particularly on roads and electricity, will lessen key constraints to economic development. Moreover, a rural focus will support pro-poor growth and an ambitious target for job creation has been established.
ZAMBIA
INTERNATIONAL MONETARY FUND 7
12. Policy priorities. Preserving the economy’s hard won macroeconomic stability calls for a reduction of the fiscal deficit and increased international reserves. This will require mobilizing additional domestic revenue, realigning spending priorities, and creating fiscal space for infrastructure investment, while also maintaining a business environment that encourages job creation. At the same time, the targeted transformation of the Zambian economy requires fundamental administrative and institutional reforms to promote credible policy implementation, higher efficiency of public infrastructure investment, and deeper financial intermediation.
A. Fiscal Policy: Close the Financing Gaps and Realign Priorities
13. Developments in 2013. The fiscal deficit for 2013 is projected to reach 8.6 percent of GDP, assuming that the government implements planned fourth quarter spending cuts through reducing spending on goods and services (0.3 percent of GDP savings relative to the budget for the fourth quarter) and maintaining capital spending at least 0.5 percent of GDP below the annual budget. Virtually all categories of spending have deviated substantially from approved levels. The sharp increase in wages (45 percent, compared to the budgeted 9.1 percent),1 and the large overruns on subsidies—4.0 percent of GDP, compared to a budget of less than 0.7 percent—forced the government to make sharp cuts in goods and services, intergovernmental transfers, and capital spending. To finance the above-budget deficit, the authorities have increased issuance of Treasury bills, used part of the 2012 Eurobond proceeds that had earlier been transferred to SOEs for investments but had not yet been spent, and intend to borrow abroad via a syndicated loan.
14. There are risks that the fiscal deficit for 2013 will be higher than currently planned, if the authorities fail to implement the spending cuts discussed with the mission. This could lead to a substantial accumulation of arrears and/or reliance on central bank financing. In this regard, staff expressed concern about the recourse to central bank bridge loans, which are intended to assist with cash management but could—if not quickly repaid—constitute central bank financing of the budget.
15. The current fiscal stance is clearly unsustainable. Rating agencies have recently downgraded Zambia’s credit rating, citing sharply deteriorated government finances. Without a change in policies, government debt would rise in net present value from about 30 percent of GDP in 2013 to over 50 percent by 2018, with the debt financing predominantly recurrent expenditures.
1 The wage increases took effect September 1, so the full year effect will only be felt in 2014.
Source: IMF staff estimates
0
10
20
30
40
50
60
2013 2014 2015 2016 2017 2018
Baseline Fixed-Primary Balance
PV of Debt-to-GDP Ratio
ZAMBIA
8 INTERNATIONAL MONETARY FUND
16. Proposed fiscal adjustment over the medim term. Discussions on the 2014 budget took place before the authorities had finalized their plans. Staff advised addressing the fiscal gaps and creating space for spending on infrastructure, health, and education by taking measures to boost domestic revenue and contain the wage bill and other recurrent expenditures. Given the small size of the domestic financial market, in line with earlier staff advice, net domestic financing should not exceed 1½–2 percent of GDP in the medium term, so as not to crowd out private sector credit. In addition, given limited debt management and project assessment and implementation capacities, as well as the limited availability of concessional financing, staff believes reliance on external financing should also be contained and gradually reduced. Thus, staff recommended reducing the fiscal deficit to 5 percent of GDP in 2014, in line with the MTEF approved by Cabinet in September, and gradually to 3 percent of GDP over the medium term. Given the recent fiscal slippages and to anchor the needed fiscal adjustment, staff stressed the importance of adopting, and then following, prudent budgets.
Long-term fiscal anchor. Staff proposed—and the authorities agreed—that fiscal policy should target a roughly unchanged debt to GDP ratio over the medium term. The proposed debt level is moderate but, considering the limited absorptive and debt management capacities, debt-financed additional spending is not recommended to maintain macroeconomic stability. To finance the needed investment in infrastructure, revenue measures are needed in addition to external borrowing. Moreover, maintaining fiscal space will be important given the economy’s dependence on copper and its volatile prices. In light of the expected increases in mining revenue over the medium term, the authorities will need to consider the implications of possible revenue volatility in conducting macroeconomic policy as well as the benefits of introducing a fiscal rule over the medium term.
Revenue measures. Staff encouraged the authorities to accelerate revenue mobilization and cautioned against any narrowing of the tax base. Staff proposed revenue measures of about 2.3 percent of GDP over the medium term through broadening the tax base (text box), based on the recommendations of the recent FAD tax policy mission. The authorities need to continue strengthening mining tax administration. Staff advised against raising the PIT tax free threshold, which the authorities were considering, noting that the threshold is already high at 3 times GNI per capita. The proposed tax measures together with rising mining revenue and improved non-tax revenue collection are expected to raise revenues by 5 percent of GDP over the medium term.
Rationalize the wage bill, which is projected to be 54 percent of domestic revenue in 2014. To mitigate this year’s large wage increase, staff supported the government’s plan to freeze wages in 2014 and 2015 and net recruitment in 2014, and further proposed reducing the wage bill to not more than 35 percent of domestic revenue over the medium term and eventually to not more than 8 percent of GDP. To achieve the medium term target will require very tight wage policy through at least 2016. To enhance budget predictability and contain the wage bill, multi-year wage agreements (for the period after 2015)2 and civil service reforms will be needed, including a review of staffing levels (Appendix III). In this context, the government has embarked on a multi-year civil service reform program that aims to strengthen the efficiency of the public sector by, among other things, introducing a performance management system, rationalizing the pay scale, and streamlining allowances.
Fuel subsidies. Staff welcomed the removal of fuel subsidies and stressed the importance of adopting an automatic pricing mechanism to avoid the recurrence of subsidies and to attract much needed investments in the area.
Maize marketing and fertilizer subsidies. Staff supported the authorities’ decision to reduce fertilizer subsidies and fully reflect the Food Reserve Agency’s (FRA) operations in the budget, and urged them to stick to the announced policy of limiting FRA activities to maintaining a modest strategic reserve. Additional reforms to support a larger role for the private sector, including the elimination of export bans, could help boost agricultural output and rural development more generally.
Pension system. The Public Service Pension Fund (PSPF) has accumulated pension arrears of an estimated 1.1 percent of GDP, and its annual funding is insufficient to prevent the accumulation of new arrears. Staff supported the government’s intention to reform the system (Box 2), including through increasing the retirement age to 65 from 55 years.
2 In addition, staff strongly supports the proposal to move wage negotiations with civil servants to before, rather than after, budget approval.
ZAMBIA
10 INTERNATIONAL MONETARY FUND
Capital spending and financing. Staff recommended a more gradual path of increase in capital spending, in light of capacity constraints, and limiting external borrowing for capital projects to what is needed each year rather than issuing a Eurobond adequate to cover the full cost of multi-year investment projects. In the case of the latter, the government must bear additional interest costs, and there will be a risk that the funds will be diverted to lower priority spending.
17. Proposed 2014 budget. Staff stressed that the proposed 2014 budget does not take sufficient steps to start addressing the large fiscal deficit. The budget submitted to Parliament in October calls for a deficit of 6.2 percent of GDP in 2014, above staff’s recommendation of 5 percent. The budget aims to increase domestic revenue by about 1.3 percent of GDP, mainly through nontax measures (including bringing revenue from FRA and other government agencies on budget, raising road tolls, and introducing a surcharge on money transfers). Contrary to staff’s advice, the budget proposes raising the PIT tax-free threshold to K3,000 from the current 2,200, which will generate a revenue loss of about 1 percent of GDP.3 The budget also proposes a wage freeze for 2014
3 Under the new PIT tax-free threshold, only about 33 percent of employees in the formal sector are expected to pay income taxes.
Box 2. Pension Reform
The public pension system in Zambia is complicated by the presence of three different schemes: i) the National Pension Scheme Authority (NAPSA), to which all new entrants to the formal sector since 2000 are mandated to contribute, ii) The PSPF for central government workers, and iii) The Local Authorities Superannuation Fund (LASF) for subnational government and public utility workers. The PSPF and LASF have been closed to new entrants since 2000. Moreover, pensions for all three funds are based on ultimately unsustainable benefit rules. And the PSPF and LASF have been running large deficits. The central government has been partially financing the deficit of the PSPF to slow down the pace of arrears accumulation, but the stock of PSPF arrears to pensioners are nevertheless expected to reach 1.1 percent of GDP by end-2013. Supported by the finding of an FAD TA mission, staff recommended near- and medium-term measures to strengthen the sustainability of the pension systems including: i) transferring members of PSPF and LASF to NAPSA, which is currently in surplus, under a dual-benefit system, ii) raising the statutory retirement age from 55 to 65 gradually, (iii) reducing the current bias towards lump sum payments by lowering the commutation rate, introducing penalties for early retirement, and indexing benefits to inflation, (iv) raising the contribution rates of PSPF and LASF workers to the NAPSA rate of 10 percent, (v) strengthening collection capacity within NAPSA. The authorities have announced their intention to put the public pension system on a sustainable footing, including by raising the retirement age to 65. However, the full details and timing of the reform are not yet available.
ZAMBIA
INTERNATIONAL MONETARY FUND 11
and 2015, as well as a net recruitment freeze for 2014 and limits FRA activities to maintaining a strategic reserve.
18. In addition to the higher than desirable planned deficit, there are substantial downside risks to the proposed 2014 budget. Based on available information, staff estimates that revenue and spending policies in the budget would produce a deficit of 7.4 percent of GDP, about 1 percent of GDP higher than budgeted.4 Moreover, the proposed wage and hiring freezes will be difficult to achieve given opposition from unions. Even modest increases in wages and new recruitments could incur additional spending of 1–1½ percent of GDP. To reduce the proposed deficit to 5 percent of GDP, staff recommended further measures (text box).5
19. Authorities’ views. The authorities reiterated their commitment to ensure that the fiscal deficit for 2013 does not go beyond 8.5 percent of GDP. They will cut low-priority spending as needed to meet the deficit projection. Regarding the risks to the 2014 budget, the authorities reaffirmed that the government will stick to the proposed wage and net recruitment freeze and that additional measures will be taken as needed to meet the 2014 deficit target. Starting next year, revenues and expenditures of FRA and other government agencies will be monitored by the Treasury. Across the public sector, steps are being taken to strengthen governance and accountability, including new measures to improve procurement of petroleum and fertilizer.
20. While the authorities have not finalized their medium-term fiscal plans, they broadly agreed with staff’s recommendations to gradually reduce the deficit to 3 percent of GDP, net domestic financing to 1½–2 percent of GDP, and the wage bill to not more than 35 percent of revenues.6 They did not fully agree with the long-term target of a wage bill less than 8 percent of GDP, noting that the need to hire teachers, health care workers, and agricultural extension workers may make this impossible. In addition, while the authorities agree it will be important to eventually develop a fiscal strategy to insulate the budget from volatile copper revenues, they do not see this
4 The deficit could be significantly higher if the increase in nontax revenue falls short of the authorities’ ambitious projections. 5 The baseline in Tables 2 and 3 assumes a fiscal outcome in 2014 based on the authorities’ planned financing. Over the medium term the baseline assumes that the authorities arrive at their medium-term target of raising tax revenue by around 3 percent of GDP over 2014-18 through the measures recommended by staff, and that recurrent expenditures are contained to levels agreed upon during discussions with a gradual increase in capital spending. For this baseline to hold, the authorities would need to identify additional measures to arrive at their targeted deficit. 6 The attached fiscal tables reflect these medium-term fiscal goals. As the authorities have not yet spelled out all policies required to meet these goals, the tables include a line for fiscal measures yet to be taken.
Staff Recommendations: Fiscal Measures Additional to the 2014 Proposed Budget
Gain in Deficit Reduction
Refrain from raising the tax-free theshold 1 percent of GDP
Starting to raise CIT rates on low-taxed sectors 0.4 percent of GDP
Postponing some infrastructure projections 0.4 percent of GDP
Reducing intergovernmental transfers 0.3 percent of GDP
ZAMBIA
12 INTERNATIONAL MONETARY FUND
as an urgent need, in light of the fact that significant copper tax revenue remains some years in the future.
B. PFM: Step up Reforms to Support Fiscal Consolidation
21. Developments. The recent PEFA assessment found a deterioration in PFM, including reporting and quality control. Procurement practices have also deteriorated, with single-source contracts for some large projects. While the rollout of the Integrated Financial Management Information System (IFMIS) has continued, its implementation, as well as that of the Treasury Single Account (TSA), has been weak, and only release-based fiscal data are available. In addition, consolidation of financing data with the BOZ needs to be improved.
22. Staff stressed the importance of stepping up PFM reform to support fiscal consolidation and improve budget planning and implementation. Staff underlined the importance of (i) enhancing budget credibility and consistency between the National Development Plan, Medium-Term Expenditure Framework, and annual budget; (ii) improving fiscal data as well as forecasts by enhancing the macro fiscal framework; (iii) expanding the coverage of the TSA by closing line ministries’ accounts at commercial banks; (iv) improving collaboration between units at the Ministry of Finance, and with the BOZ, to produce fiscal data based on expenditures rather than releases; (v) strengthening IFMIS implementation and controls; and (vi) providing additional resources to the Accountant General’s Department to support these reforms.
23. Authorities’ views. The authorities agreed with the need to improve cash management and improve collaboration across ministry units and with the BOZ. They noted that, with TA from donors, they will be refocusing efforts in this area and have recently adopted a new PFM reform strategy. Progress has been slow in implementing the multi-donor funded Public Expenditure Management and Accountability (PEMFA) program prepared in 2010. They indicated that the recommendations of the November 2013 FAD mission will be used to further develop the reform program, including prioritization and sequencing, and will inform further strategic discussions with donors on support for PFM reform.
C. Improve Investment Planning and Maintain Debt Sustainability
24. Developments. Given infrastructure needs, the government is ramping up capital spending on roads, railways, and power over the medium term. With limited donor support, Zambia has begun tapping the Eurobond market to
Angola
EthiopiaMozambique
Nigeria
Rwanda
Tanzania
GhanaZambia
0
1
2
3
4
5
0
1
2
3
4
5
0 5 10 15 20
Infr
astr
uctu
reIn
dex
1/
(20
09
-20
11
Ave
rage
)
Government capital expenditure in percent of GDP (2006-2011 Average)
Infrastructure and government spending
Sources: World Economic Forum; WEO; and IMF staff calculations.
Uganda
South Africa
ZAMBIA
INTERNATIONAL MONETARY FUND 13
finance needed infrastructure.7 Selected municipalities and SOEs have proposed issuing sub-national Eurobonds totaling $4.5 billion (over 20 percent of 2012 GDP). Such issuances would likely require government guarantees.
25. Staff supported the Minister’s opposition to the proposed sub-national Eurobonds, and advised that, to the extent these projects are of national importance, it would be preferable to issue sovereign bonds, which should be budgeted and on lent to sub-national entities with proper monitoring. Any such borrowing should also be in line with (i) macroeconomic stability and fiscal/debt sustainability; (ii) project appraisal, management and monitoring capacity; and (iii) debt management capacity and strategy. In this regard, staff encouraged the authorities to request a voluntary update of the Debt Management Performance Assessment (DEMPA) conducted in 2011, as well as to request TA from the World Bank to assist in finalizing their medium-term debt strategy.
26. Debt sustainability analysis (DSA). Zambia’s external and public debt remains relatively low, and an updated DSA based on the authorities’ planned fiscal adjustment scenario continues to indicate a low risk of debt stress, despite higher borrowing envisaged than in the previous DSA (Attachment). Absent adjustment, however, the debt ratio would rise sharply, with the fixed primary fiscal balance scenario demonstrating clearly the need for fiscal adjustment.
27. Authorities’ views. The authorities broadly agreed with staff’s recommendations on the proposed sub-national Eurobonds as well as with the DSA results. They indicated that, to strengthen debt management, the International Debt Management Department will be restructured in tandem with a restructuring of the Ministry of Finance and stressed that Zambia will not fall into another debt trap, after receiving large debt relief in the 2000s.
D. Monetary Policy: Ensure Flexibility to Maintain Macroeconomic Stability
28. Developments. Inflation has in recent months remained at around 7 percent, above the BOZ’s end-2013 target of 6 percent, reflecting the removal of fuel subsidies, and inflationary pressure is expected to rise due to the large civil servant wage increases and reduction of maize subsidies.8 Following the elimination of fuel and maize subsidies, the BOZ increased the policy rate twice (25 bps each time) to 9.75 percent to contain inflationary pressure.9 Bank liquidity has been highly volatile. The BOZ has been under political pressure to lower lending rates and strengthen the kwacha.
7 Zambia’s maiden sovereign bond issue in September 2012 was a 10-year dollar-denominated bond, in the amount of $750m (initially $500 million). Orders for the offer amounted to some $12 billion, allowing the country to price the bond at a yield of just 5.625 percent. 8 Food comprises 53 percent of Zambia’s consumer price index basket so the BOZ uses headline inflation as its inflation target while monitoring food and non-food inflation developments. 9 The policy rate was introduced in April 2012 to replace reserve money targeting as BOZ’s main monetary policy tool.
ZAMBIA
14 INTERNATIONAL MONETARY FUND
29. Monetary policy framework. Staff welcomed the progress that the BOZ has made in transitioning from conducting monetary policy through targeting reserve money to conducting policy through the policy rate. However, more needs to be done, including strengthening understanding of the interest rate transmission mechanism, improving liquidity forecasting and management, and developing high frequency indicators of economic activity. Pending further progress in these areas, staff supported the BOZ’s intention to increasingly conduct monetary policy through the policy rate, while nonetheless seeking to keep reserve money and bank liquidity in check. Staff encouraged the BOZ to narrow the 400 basis point corridor in which the BOZ targets the interbank rate to strengthen the policy rate’s role as a benchmark for the pricing of longer-term and customer transactions.
30. Monetary policy stance. The significant fiscal policy changes this year greatly complicate the BOZ’s task of controlling inflation. Staff supported the authorities’ intention to implicitly increase their inflation target for end-2013 to 7.5 percent to accommodate the first round effects of the removal of fuel and maize subsidies (estimated at 1–1½ percentage points). Staff emphasized the importance of continuing to tighten monetary policy, in order to resist the second round effects of the removal of subsidies and the inflationary pressure from the large civil servant wage increases.
31. International reserves and exchange rates. The BOZ has started building up reserves slowly as the kwacha had appreciated in recent months, after losing reserves rapidly early this year during a brief (now ended) period of providing foreign exchange to finance oil imports. Given the economy’s vulnerability to negative shocks and the current low level of reserves (an estimate of 2.3
5.0
6.0
7.0
8.0
9.0
10.0
11.0
12.0
13.0
Apr-12 Jul-12 Oct-12 Jan-13 Apr-13 Jul-13
Simple Average Overnight Rate Corridor - low
Corridor-high Policy rate
Policy Rate and Overnight Interbank Rate(In percent)
Source: Bank of Zambia.
4.0
4.5
5.0
5.5
6.0
1,500
2,000
2,500
3,000
Jan-
11
Mar
-11
May
-11
Jul-1
1
Sep-
11
Nov
-11
Jan-
12
Mar
-12
May
-12
Jul-1
2
Sep-
12
Nov
-12
Jan-
13
Mar
-13
May
-13
Jul-1
3
Sep-
13
Nov
-13
International reserves 1/
Kwacha per US$, rhs
Source: Bank of Zambia.1/ Unencumbered reserves only.
International Reserves(US$ Millions)
-5
0
5
10
15
20
Jan-11 Jul-11 Jan-12 Jul-12 Jan-13 Jul-13
Petroleum Products Other Non-FoodFood Overall
Consumer Prices (year-on-year percent change)
Source: Zambian authorities.
ZAMBIA
INTERNATIONAL MONETARY FUND 15
months of imports for 2013), staff advised the BOZ to allow more exchange rate flexibility and to continue to build up reserves in line with their medium-term target of 4 months of imports, using reserves to offset temporary exchange rate movements, but not to resist sustained depreciation pressures when they exist. Staff analysis suggested that the kwacha remains broadly in line with fundamentals (Appendix IV).
32. Exchange restrictions. The authorities amended the BOZ Act and introduced new foreign exchange market regulations to strengthen monitoring of external transactions. LEG had judged that the initial version of the regulation on foreign exchange transactions violated Article VIII of the IMF’s Articles of Agreement:
On June 25, 2013, the Zambian authorities issued Statutory Instrument 55 of 2013, which regulates the monitoring of foreign exchange transactions and includes two measures that give rise to exchange restrictions subject to Fund approval under Article VIII, Section 2(a). The first exchange restriction arises from the requirement that a person making payments of dividends in foreign exchange provide a tax clearance certificate and evidence of payment of corporate or income tax. The second exchange restriction arises from the requirement that payments for royalties, management fees, technical fees, commissions or consultancy fees in foreign exchange be accompanied by evidence of corporate tax payments. Both measures give rise to exchange restrictions subject to IMF approval under Article VIII, Section 2(a) because they impose limitations on the availability of foreign exchange for the making of payments of current international transactions based on noncompliance with obligations that are unrelated to the proposed transaction.
33. The authorities have been working closely with the Fund staff to eliminate the exchange restrictions in the regulation, while maintaining their goal of strengthened monitoring. It is expected that the authorities will amend the regulation to be compliant with Article VIII before the Board meeting.
34. Authorities’ views. The BOZ acknowledged that moving to a policy rate-based regime is a transitional process. They noted that, utilizing the ongoing Norway/MCM TA, the BOZ will continue to develop all the structures necessary for the effective functioning of the policy rate as the main monetary policy tool. To improve liquidity forecasting, the BOZ plans to work together with the government to enhance the flow of information on government transactions. The BOZ stressed that to avoid a wage-price spiral, they are prepared to act to offset inflationary pressures from the large civil service wage increase, and noted the recent increase in BOZ’s budget for open market operations. The authorities agreed with the exchange rate assessment and acknowledged the need to further build up international reserves, but noted that they are reluctant to do so when the kwacha is depreciating.
ZAMBIA
16 INTERNATIONAL MONETARY FUND
E. Financial Sector: Address Structural Constraints
35. Background. The authorities are concerned about high lending rates and limited access to credit by SMEs, which prompted the introduction of caps on lending rates (Appendix V).10 The banking system is highly concentrated, with the top four banks’ assets amounting to about 60 percent of total banking sector assets. The banking system’s loan-to-deposit ratio is low at around 65 percent, indicating that the lack of bankable projects and borrowers is the main reason for limited credit delivery. The overall framework and practices for banking supervision are broadly compliant with the Basel Core Principles (Financial Sector Assessment Program Update, 2009).
36. Lending rate ceilings. Staff noted that international experience shows that lending rate ceilings—if they are binding—will distort credit allocation and restrict (rather than enhance) access to credit, particularly for SMEs. Since the lending rate ceilings were introduced early this year, market interest rates (as reflected in average Treasury bill rates) have increased more than two percentage points, while the ceilings have been increased only one half percentage point, making them increasingly binding. Staff advised that to reduce interest rates, efforts should focus on reforms to enhance competition in the banking sector, and help SMEs develop credible business plans. If the authorities are determined to maintain the lending rate ceilings, at the very least it will be important to adjust them in line with market rate increases. One way to achieve this would be to tie the ceiling to the average Treasury bill rate, rather than to the policy rate.
37. Financial inclusion. Staff welcomed the authorities’ continued efforts to enhance financial services delivery by strengthening the Credit Reference Bureau, expanding bank branches in rural areas, and improving credit culture. The planned introduction of a unified collateral registry system, agency banking guidelines, and steps to improve land titling will facilitate credit provision and improve access to financial services particularly in rural areas. Staff noted that, combined, these measures are more likely to
10 The interest rate caps were initially set at 18.25 percent for banks, 30 percent for non-banks, and 42 percent for microfinance institutions, with the levels tied to the BoZ policy rate.
Treasury Bill Rates and Lending Rate Ceilings(percent)
ZAMBIA
INTERNATIONAL MONETARY FUND 17
contribute to a reduced cost of loans for SMEs than the lending rate cap.
38. Banks’ new capital requirement. To strengthen the balance sheets of banks, the authorities increased the minimum capital requirement.11 All but a few small banks are expected to meet the new requirements by the end of 2013. Given the rapid increase in private sector credit in the second half of 2012 and the new higher bank capital, staff supported the BOZ’s intensive banking supervision to assess a potential build-up in vulnerability and risks to financial stability.
39. Authorities’ views. The authorities noted that private sector credit has continued to increase since the introduction of the lending rate ceilings and that the nonbank sector is being restructured, including by marginal and inefficient nonbanks’ exit from the market. They indicated that BOZ is carefully monitoring developments in bank and nonbank lending, and has also asked a foreign consultant to conduct an in-depth study of the impact of the lending rate ceilings. The authorities noted financial inclusion as a policy priority. Given limited financial system infrastructure in Zambia, agent banking is being pursued as a low cost solution, particularly in rural areas.
F. Boosting Competitiveness and Inclusive Growth
40. Background. Over the last decade, Zambia’s competitiveness has been boosted by strengthened macroeconomic fundamentals and a supportive business environment. Zambia’s business environment remains favorable compared to other countries in the region, but weaknesses in infrastructure and human capital as well as the recently more interventionist regulatory approach and related uncertainty about the policy direction are impediments to continued progress. Moreover, while non-copper exports have increased rapidly in recent years, the country remains reliant on copper exports. To secure continued growth and diversification, Zambia will need to boost infrastructure and education, while maintaining a business friendly environment that inspires investor confidence
41. Minimum wages. A sharp increase in 2012 brought the minimum wage in Zambia to about 1½ times per capita GDP. The private sector and NGOs noted that the high minimum wage is hampering the country’s competitiveness and formal employment.12 Moreover,
11 The capital requirement was increased in 2012 from $2.4 million to $20 million for locally owned banks and to $100 million for foreign-owned banks, but banks have been given to end-2013 to meet the new requirement. 12 The minimum wage law applies to the formal private sector, and sets different minimums for different job categories, including domestics, shopkeepers, and general workers. In the public sector, the lowest wage paid is much higher than specified in the minimum wage law.
0
50
100
150
200
250
300
350
400
450
500
0 2000 4000 6000 8000
Min
imum
Wag
e ov
er G
DP
per C
apita
Minimum Wage in US$
Minimum Wages (2012/13 and private sector unless otherwise noted)
Sources: U.S. Department of Labor and WageIndicators.org.
Cambodia
Malawi
Bangladesh
Senegal
Kenya
Tanzania
Mozambique
China
Indonesia &Vietnam
Zambia (2011)
Zambia
Zambia (public sector from September, 2013)
ZAMBIA
18 INTERNATIONAL MONETARY FUND
some in government are considering pressuring private companies to match the new government minimum wage, which is roughly 4½ times per capita GDP and 2½ times the current minimum wage in the private sector. Minimum wages of this magnitude would inhibit job creation by driving many employers out of business and resulting in a sharp decline in both domestic and foreign investments. It could also lead to further reliance on informal sector jobs, where workers have less protection.
42. Authorities’ views. The authorities stressed that the government is ramping up capital spending on infrastructure to address key impediments to inclusive growth and competitiveness. They noted that the 2012 increase in the statutory minimum wage had been overdue as it had not been adjusted between 2006 and 2011, but also that views by some officials on extending the new government minimum to the private sector or introducing sector-based differentiation were their personal views, not the government’s.
G. Strengthening Statistics
43. While data provision needs improvement, especially on balance of payments and fiscal reporting, data are broadly adequate for surveillance. Efforts are ongoing to improve national accounts data with plans to rebase to 2010 by next year. However, gaps in balance of payments data remain in several areas including reinvested exporter earnings, trade in services, and the financial account (Informational Annex). Fiscal data is not robust due to weak data consolidation and limited classification harmonization across government institutions and the BOZ. Staff welcomed the authorities’ continued efforts to improve data quality and availability and recommended a data ROSC to fully assess Zambia’s data situation.
STAFF APPRAISAL44. The Zambian economy has performed well in recent years, with strong growth and modest inflation, and has high growth potential. The government has resolved to step up development by scaling up investment in infrastructure. However, this year has seen a substantial loosening of fiscal policy, leading to a large fiscal deficit.
45. The current fiscal stance is unsustainable. To address risks of large arrears accumulations and additional central bank financing in 2013, it will be important for the authorities to adhere to their plans to reduce low-priority investment spending, and contain goods and services spending. Staff recommends firmly addressing the fiscal slippages in 2014 and continuing to reduce fiscal deficits over the medium term. Medium-term reforms are required to contain the wage bill and recurrent expenditure, boost domestic revenue, and create fiscal space for infrastructure investment. Staff recommends reducing the fiscal deficit to 5 percent of GDP in 2014 and gradually to 3 percent of GDP over the medium term, and bringing down net domestic financing to 1½–2 percent of GDP a year to avoid crowding out the private sector.
ZAMBIA
INTERNATIONAL MONETARY FUND 19
46. The proposed 2014 budget does not take sufficient steps to begin addressing the large fiscal deficit. Staff estimates that the spending and revenue policies in the budget will produce a deficit of at least 7.4 percent of GDP, much higher than the recommended 5 percent. Staff cautions against the proposed increase in the tax-free threshold on personal income tax, which would further reduce the already narrow tax base. The government should take stronger revenue measures than budgeted and stick to the proposed wage and recruitment freezes, to contain the already excessive wage bill. Staff welcomes the government’s decision to remove fuel and maize subsidies, to limit FRA activities to maintaining a strategic reserve, and to fully reflect FRA revenue and expenditure in the budget.
47. Public financial management reform needs to be stepped up to support fiscal consolidation. Staff welcomes the authorities’ stated commitment to working with its partners to strengthen PFM, and urges the authorities to attach high priority to these efforts, especially on fiscal reporting and budgetary controls.
48. The progress made in transitioning to conducting monetary policy through the policy rate is welcome. However, more needs to be done, including strengthening understanding of the interest rate transmission mechanism, improving liquidity forecasting and management, and developing high frequency indicators of economic activity. Pending further progress in these areas, staff supports the BOZ’s intention to increasingly conduct monetary policy through the policy rate, while nonetheless seeking to keep reserve money and bank liquidity in check.
49. The BOZ needs to continue tightening monetary policy. The significant fiscal policy changes this year complicate the BOZ’s task of controlling inflation. Staff supports the authorities’ intention to increase their inflation target to accommodate the first round effects of the removal of fuel and maize subsidies. However, tighter monetary policy is needed to resist second round effects of the removal of subsidies and inflationary pressure from the large civil servant wage increases. Given the current low level of reserves, staff advises the BOZ to allow more exchange rate flexibility and continue to build up reserves in line with their medium-term target in order to limit the economy’s vulnerability to negative shocks.
50. Staff supports the authorities’ efforts to strengthen the financial sector and improve access to financial services. Staff recommends the elimination of the lending rate ceilings introduced early this year, which restrict access to credit, particularly for SMEs, and are becoming increasingly binding, or, at a minimum, tying the lending rate ceiling to the Treasury bill rate. To reduce lending rates, efforts should instead focus on reforms to enhance competition in the banking sector and address high business costs. The planned introduction of a unified collateral registry system, agency banking guidelines, and steps to improve land titling will facilitate credit provision and improve access to financial services particularly in rural areas.
51. Maintaining a good business environment is important for strong growth and economic diversification. Over the last decade, Zambia’s competitiveness has been boosted by strengthened macroeconomic fundamentals and a favorable business environment. However, regulatory changes in a number of areas have raised costs of doing business and created
ZAMBIA
20 INTERNATIONAL MONETARY FUND
uncertainty about the policy direction. Moreover, wage increases that outstrip productivity would hamper the country’s competitiveness and job creation. Staff strongly advises against pressuring private sector employers to match the government’s new minimum wage, as this would significantly undermine competitiveness.
52. Staff recommends that the next Article IV consultation be held on the standard 12-month cycle.
Public debtTotal central government debt, net (end-period) 20.1 24.2 30.3 33.0 34.9 36.2 36.5 35.6
External 10.2 16.3 16.5 19.7 21.0 21.8 22.3 22.0
Stock of domestic debt, net 9.8 7.9 13.8 13.3 13.9 14.3 14.2 13.6
Memorandum item: Gross national income per capita (US$) 1,408 1,463 … … … … … …
Sources: Zambian authorities; and IMF staff estimates and projections.1 Excludes Zimbabwe. 2 Including discrepancy between the above-the-line balance and below-the-line financing.
2012 2013
(Percentage Change)
(Percent of GDP; unless otherwise indicated)
Proj.
ZAMBIA
22 INTERNATIONAL MONETARY FUND
Table 2. Zambia: Fiscal Operations of the Central Government, 2011–18 (Millions of kwacha)
Sources: Zambian authorities; and IMF staff estimates and projections.1 Includes royalties paid by mining companies.2 Includes arrears payments for goods and services and other liability payments. 3 Includes financial restructuring. 4 The discrepancy largely reflects changes in the carryover of budgetary releases. 5 Includes eurobond proceeds collected in 2012 to be spent in 2013.
2012 2013 20152014
ZAMBIA
INTERNATIONAL MONETARY FUND 23
Table 3. Zambia: Fiscal Operations of the Central Government, 2011–18 (Percent of GDP)
Sources: Zambian authorities; and IMF staff estimates and projections.1 Includes royalties paid by mining companies.2 Includes arrears payments for goods and services and other liability payments.3 Includes financial restructuring. 4 The discrepancy largely reflects changes in the carryover of budgetary releases. 5 Includes eurobond proceeds collected in 2012 to be spent in 2013.
Bank of Zambia (millions of U.S. dollars) 2/ 2,167 2,457 2,368 2,871 3,704 4,500 5,465 6,730Exchange rate (kwacha per U.S. dollar, end period) 5.117 5.147 … … … … … …
Sources: Zambian authorities; and IMF staff estimates and projections.1 End of period.2 Unencumbered reserves only
20132012
Proj.
ZAMBIA
INTERNATIONAL MONETARY FUND 25
Table 5. Zambia: Balance of Payments, 2011–181 (Millions of U.S. dollars, unless otherwise indicated)
2011 2014 2015 2016 2017 2018Baseline scenario Est.
1 Based on a recent Bank of Zambia survey on foreign private investment, the authorities are in the process of revising data for 2012 and the first half of 2013 on FDI inflows and their financing composition (reinvested earnings, borrowing from investors, equity capital). As the authorities were still analyzing this new data at the time the staff report was completed, this data has not been reflected in the tables in this report.
Regulatory capital to risk-weighted assets 18.6 18.6 22.3 22.1 19.2 21.3 23.3
Tier 1 regulatory capital to risk-weighted assets 15.9 15.7 18.9 19.1 16.8 19.4 21.7
Capital to total assets 9.2 9.9 11.2 10.4 10.2 12.0 13.0
Asset quality
Past due advances (NPL) to total advances 8.8 7.2 12.6 14.8 10.4 8.1 8.2
Loan loss provisions to nonperforming loans 73.2 104.6 86.6 80.3 76.7 73.5 73.2
Bad debt provisions to advances 6.4 6.1 10.9 11.9 8.0 6.0 4.7
Loan concentration
Households 15.5 30.1 30.9 32.2 30.8 34.3 32.9
Government and parastatals 9.1 1.9 3.1 4.6 4.7 3.9 9.3
Agriculture 18.4 16.0 19.0 17.6 17.7 22.6 21.1
Mining 4.1 5.0 4.0 3.2 4.2 5.7 5.9
Manufacturing 11.0 11.0 12.0 12.7 12.2 11.3 11.4
Construction 3.7 4.0 3.0 5.8 4.2 3.7 3.6
Services 13.3 9.0 8.0 7.0 7.1 3.9 4.3
Others 25.0 23.0 20.0 16.9 19.1 14.6 11.5
Earnings and profitability
Return on average assets 4.7 3.6 2.1 2.9 3.7 3.9 3.3
Return on equity 35.1 20.8 9.4 12.1 25.5 20.8 18.1
Gross interest income to total gross income 63.1 66.6 65.1 58.6 59.3 61.3 64.4
Gross noninterest income to total gross income 36.9 33.4 34.9 41.4 40.7 38.7 35.6
Net interest margin 11.5 10.4 10.7 9.0 8.1 8.4 8.5
Liquidity
Liquid assets to total assets 37.6 35.5 38.0 43.8 40.3 36.0 34.9
Liquid assets to total deposits 46.0 49.9 52.6 58.5 53.3 49.0 48.1
Advances to deposits ratio 57.4 66.3 60.1 53.1 57.1 66.0 65.7
Exposure to foreign currency
Foreign currency loans to total gross loans 1/ 32.5 42.1 36.4 32.8 39.1 28.7 27.3
Foreign currency liabilities to total liabilities 1/ 27.1 35.8 38.0 39.6 39.0 22.9 24.7Net open position in foreign exchange to capital 7.1 6.9 2.5 4.1 5.5 2.8 2.2
Source: Bank of Zambia. 1/ Data for 2013 are as of April.
ZAMBIA
INTERNATIONAL MONETARY FUND 27
Table 7. Zambia: Millennium Development Goals, 2002–10
2002 2004 2006 2007 2009 2010 2015Target
Goal 1: Eradicate extreme poverty and hunger1
Proportion of population living in extreme poverty (%) 46 53 51 … … 42.3 29Poverty gap ratio (incidence X depth of poverty) (%) … 53 34 … … 28 31Prevalence of underweight under 5 children (%) 28.1 20 … 14.6 … 13.3 11
Goal 2: Achieve universal primary education2
Primary net enrollment ratio (%) 77.7 85.1 97.0 … 102.0 93.7 100Pupils reaching grade 7 (%) … 82 83 … 91.7 90.9Literacy rate for 15–24 year olds (%) … 70 … … … 88.7 100
Goal 3: Promote gender equality3
Ratio of girls to boys in primary education (%) … 95 97 96 96 99 100Ratio of girls to boys in secondary education (%) … … 86 89 88 86 100Ratio of literate women to men (15–24 olds) (%) … … 80 80 80 … 100Share of women employed in the nonagricultural sector (%) … … … … … … …Proportion of seats held by women in national parliament (%) … … 14 14 14 11.4 30
Maternal mortality ratio (deaths per 100,000 live births) 729 … … 591.2 … 483 162.3Births attended by skilled personel (%) 43.4 … … 46.5 … 44Contraceptive Prevelance rate (% ) 18.6 … … 24.6 … …
Goal 6: Combat HIV/AIDS, malaria, and other diseases6
HIV prevalence rate (%) 15.6 … … 14.3 … … 16 or less
Proportion of 15 - 24 - year - olds with comprehensive, correct 31.0 … … 48.0 40.2
knowledge of HIV & AIDS (%)Ratio of school attendance of orphans to non-orphans (10-14 years, %) 79.1 … … 93 92 …Proportion of population with advanced HIV infection on ART (%) … … 77.6 80New malaria cases per 1,000 population 388 383 412 358 246 330255 or lessMalaria fatality rate per 1,000 population 48 33 40 40 29 34 11Proportion of households with ITNs (pre - or - post treated, %) 13.6 … 37.8 53.3 … 64.3
Goal 7: Ensure environmental sustainability7
Land covered by forest (%) … … … 59.6 … 49.9Land protected to maintain biological diversity (%) … 39.6 … … 41 41CO2 emissions (metric tons per capita) … 0.2 0.2 0.2 17.4^ …Consumption of ozone depleting CFCs (ODP MT) … 10 6.6 4.1 … …Propotion of population using solid fuels (%) … 83.8 83.7 … … 82.9
Goal 8: Develop a Global Partnership for Development8
Official Development as a percentage of GDP … … 4.6 4.7 5.9 3
Source: Millenium Development Goals Progress Report - Zambia - 2013, United Nations Development Programme.
^ Includes emissions from deforestation and land use change1Goal 1 targets: Halve, between 1990 and 2015, the proportion of people whose income is less than one dollar a day. Halve, between 1990 and 2015,
the proportion of people who suffer from hunger.2Goal 2 target: Ensure that, by 2015, children everywhere, boys and girls alike, will be able to complete a full course of primary schooling.3Goal 3 target: Eliminate gender disparity in primary and secondary education preferably by 2005 and to all levels of education no later than 2015.4Goal 4 target: Reduce by two-thirds, between 1990 and 2015, the under-5 mortality rate.5Goal 5 target: Reduce by three-quarters, between 1990 and 2015, the maternal mortality ratio.6Goal 6 targets: Have halted by 2015, and begun to reverse, the spread of HIV/AIDS. Have halted by 2015, and begun to reverse, the incidence of malaria and other major diseases.7Goal 7 targets: Integrate the principles of sustainable development into country policies and programs and reverse the loss of environmental resources. Halve, by 2015, the proportion of people without sustainable access to safe drinking water.8Goal 8 targets: Develop further an open, rule-based, predictable, nondiscriminatory trading and financial system. Address the special seeds of
the least developed countries. Address the special needs of landlocked countries and small island developing countries.
ZAMBIA
28 INTERNATIONAL MONETARY FUND
Figure 1. Zambia: Real Sector Developments
Sources: Zambia, Central Statistics Office; IMF, World Economic Outlook database. ¹ Median of Ghana, Kenya, Mauritius , Mozambique, Nigeria, Senegal, Tanzania, and Uganda.
Growth has picked up strongly over the past decade, supported by higher copper production...
Generally prudent macro policies... ... have helped bring down inflation.
As a result, income levels have been rising rapidly... ... and poverty has declined, although it is still high.
0
10
20
30
2000 2002 2004 2006 2008 2010 2012
ZambiaSub-Saharan AfricaComparators¹
CPI Inflation (percent change)
500
1,000
1,500
2,000
2,500
2000 2002 2004 2006 2008 2010 2012
ZambiaSub-Saharan AfricaComparators¹
GDP Per Capita (current PPP dollars)
55
60
65
70
75
1991 1995 1999 2003 2007
Proportion of Population in Poverty(percent)
0
1
2
3
4
5
6
7
8
9
2009 2010 2011 2012
Tertiary sector Secondary sector Primary sector
Contribution to Real GDP Growth (percentage points
... but with activity increasingly driven by construction and services.
Broad Money Growth (percent change)
-4
-2
0
2
4
6
0
10
20
30
40
50
2003 2005 2007 2009 2011
Broad money growth
Government net domestic financing (% of GDP, rhs)
ZAMBIA
INTERNATIONAL MONETARY FUND 29
Figure 2. Zambia: Fiscal Developments (Percent of GDP)
Sources: Zambian authorities and IMF staff estimates.
-14
-12
-10
-8
-6
-4
-2
0
-10
-5
0
5
10
15
20
25
30
35
2010 2011 2012 2013 proj.
Revenues
Expenditures
Overall Balance (rhs)
Non-mining balance (rhs)
The overall cash deficit in 2013 is expected to widen due toincreased expenditure and revenue underperformance.
One-off mining arrears payments
0
1
2
3
4
5
6
7
8
9
2010 2011 2012 2013 proj.
Personal Income TaxesVATIndirect Taxes (Non-VAT)Corporate Income Tax (Non-Mining)Other Non-TaxMining Revenues (exc. one-off payments)
Revnue performance has been weak in 2013 mainly due to lower than expected mining corporate income tax.
0
1
2
3
4
5
6
7
8
9
10
2010 2011 2012 2013 proj.
OtherWages and SalariesCapital SpendingPurchase of Goods and ServicesTransfers for MaizeFuel Subsidies
Expenditure increased due to higher wage s, capital spending, and subsidies (maize and fuel).
0
5
10
15
20
25
30
35
40
-2
0
2
4
6
8
10
2010 2011 2012 2013 proj.
External FinancingDomestic FinancingPublic Domestic Gross Debt (rhs)Total Public Debt (rhs)
In 2013, the bulk of financing was domestic including eurobondproceeds saved from 2012.
ZAMBIA
30 INTERNATIONAL MONETARY FUND
Figure 3. Zambia: External Developments
Copper exports will increase in 2013 mainly due to higher export volumes. Also, non-traditional Non-oil imports continue to increase in 2013 (20 percent). A slighly higher pace than the
exports will register an increase. Overall, exports of goods would increase by 16 percent in 2013. one observed in the previous year, mainly following developments in FDI inflows.
As a result, the current account balance would deteriorate in 2013 mainly driven by the decline FDI net inflows would show an increase compated to in 2012 and disbursements to the
in the balance of goods and services. government, without the 2012 Eurobond proceeds, would continue a positive trend.
Gross reserve accumulation would show a decline in 2013 due to the transfer of Eurobond Reserve import coverage, based of unencumbered reserves, would be 2.3 months of
proceeds to implementing agencies. Also, central bank's readily available reserves prospective imports in 2013, showing a decline compared to 2012 (2.7 months).
(unencumbered) would show a slight decline (89 million).
Appendix I. Competitiveness1 Over the last decade, Zambia’s competitiveness has been boosted by strengthened macroeconomic
fundamentals and a favorable business environment. However, exports remain dominated by copper,
and weaknesses in infrastructure, scarcity of skilled labor and rising labor costs, and recent uncertainty
about the policy direction pose challenges to sustaining rapid economic development. To secure
continued growth and diversification, Zambia will need to boost investment in infrastructure and
enhance provision of education, while maintaining a business friendly environment.
Background
Zambia’s economy has over the past decade expanded rapidly. Overall output growth has been
strong at an average of 6.2 percent a year since 2003, about half a percentage point more than for
Sub-Saharan Africa (SSA) as a whole. This positive outcome has been supported by prudent
macroeconomic policies that kept fiscal balances and inflation in check as well as by rising copper
prices that improved the country’s terms of trade.
While exports remain dominated by copper, non-
copper exports are now growing rapidly. Increased
copper production notwithstanding, the largest
contributors to real GDP growth over the past
decade have been construction and services.
From 2002 and until 2008-10, non-copper exports
were declining as a share of both GDP and of total
exports. Since 2010, however, growth has started
to diversify, with the mainly agricultural non-
traditional exports growing in nominal US dollar
terms by an average of about 45 percent a year.
Sustaining Zambia’s strong overall growth performance in the face of uncertain prospects for
copper prices will require that the ongoing diversification of the economy is maintained. That, in
turn, will require a supportive business environment and availability of credit and needed human
and infrastructure resources. This appendix examines the progress and challenges towards
improving the business environment, access to finance, and labor quality and cost. Additionally, the
1 Prepared by Kareem Ismail and Tobias Rasmussen.
0
5
10
15
20
25
30
35
40
45
50
2000 2002 2004 2006 2008 2010 2012
Total exports
Copper and cobalt
Other (non-traditional)
Merchandise Exports (in percent of GDP)
Source: Bank of Zambia.
ZAMBIA
INTERNATIONAL MONETARY FUND 33
annex considers key issues relating to the agricultural sector, where the majority of the workforce
remains employed.
The Business Environment
According to the World Bank’s Doing Business indicators, Zambia’s business environment—although
middling from a global perspective—is among the best in Africa.2 At 83rd in the world, Zambia’s
doing business ranking is the 7th highest in SSA and in Southern Africa is only surpassed by South
Africa and Botswana.3 Moreover, Zambia is 47th worldwide in terms of overall progress since 2005.
Zambia performs especially well in areas such as the ease of starting a business, getting credit, and
dealing with construction permits. The country also benefits greatly from political stability and a
conflict-free setting.
2 As pointed out in an independent evaluation of the Doing Business survey (see www.worldbank.org/ieg/doingbusiness), care should be exercised when interpreting these indicators given subjective interpretation, limited coverage of business constraints, and a small number of informants which tend to overstate the indicators' coverage and explanatory power. 3 In Doing Business 2014, Zambia’s ranking of 83, compares to 41 for South Africa, 56 for Botswana, 98 for Namibia, 123 for Swaziland, 136 for Lesotho, 170 for Zimbabwe, and an average of 141 for SSA.
Ease of Doing Business(distance to frontier, percentage points)
Source: World Bank, Doing Business 2014.Note: Scores show how far Zambia is from the best performing economy on each indicator, with higher values indicating a smaller gap. Southern Africa is average of Botswana, Lesotho, Namibia, South Africa, Swaziland, Zambia, and Zimbabwe.
0
10
20
30
40
50
60
70
80
90
10020132005
Zambia by Area
40
45
50
55
60
65
70
2005 2006 2007 2008 2009 2010 2011 2012 2013
ZambiaSouthern AfricaSSA
Zambia and Regional Averages Overall
ZAMBIA
34 INTERNATIONAL MONETARY FUND
Constraints on competitiveness include lacking
infrastructure and in some areas high costs of
doing business. International trade is expensive
(comparable to Rwanda and Uganda), a result of
the country being landlocked with weak
transport infrastructure. Moreover, a shortage of
electricity despite sizable hydropower potential
is a major impediment to growth. In addition, a
series of recent regulatory changes, including
bans on using foreign currency in domestic
transactions and new requirements for making
international transactions, have added to firms’
costs. Imposed with little prior consultation among stakeholders and in some cases revised multiple
times, these new regulations have also raised uncertainty about the policy direction.
Efforts towards modernizing transport and energy infrastructure would help ease the structural
bottlenecks. Zambia has a fast-growing market for exports to neighboring countries, including for
agricultural products, cement, and electricity. If well implemented, the country’s plans to upgrade
road, rail, and power infrastructure could provide important support to continued economic
development by facilitating trade internationally as well as within Zambia. Calderon (2009) measures
the potential growth dividend from infrastructure improvement in Zambia and estimates that
bringing the country’s infrastructure to a level comparable to the regional leader (Mauritius) would
boost real GDP per capita growth by
between 2 and 3½ percentage points.4
Access to Finance
One of the main drivers of Zambia’s
improved Doing Business score relates
to access to credit. Indeed, according to
the World Bank, Zambia is now among
the best performing SSA countries in
terms of institutions and regulations
4 The study does not specify how long such a growth dividend would last, but by using a linear estimate based on data spanning 1960-2005, the methodology suggests that the effect would persist over possibly several decades.
0
1000
2000
3000
4000
5000
Rwanda Uganda Zambia Tanzania SSA Average
OECD Average
Cost to Export Cost to Import
Costs of Trade(US dollars per container)
Source: Doing Business Indicators, World Bank
0
5
10
15
20
25
30
35
Ghana Zambia
Manufacturing
Agriculture
sector share in total credit
Sources: National Authorities
05
1015202530354045
Ghana Zambia
Manufacturing
Agriculture
credit ratio to sector value added
Access to Credit, 2012(in percent)
ZAMBIA
INTERNATIONAL MONETARY FUND 35
that facilitate access to credit, reflecting the depth of its credit information infrastructure and good
enforcement of contracts. Progress in this area has helped boost overall credit growth to an average
of over 30 percent during 2011-12. Notably, the share of credit to sectors such as agriculture and
manufacturing—where access to finance is traditionally limited in SSA—is significantly higher than in
peer countries. Overall, however, Zambia’s financial depth remains shallow compared to its peers,
with credit to the private sector at 15 percent of GDP in 2012, well below the median for lower-
middle income countries in the region of 28 percent of GDP.
Foreign financing is another important source of investment funding in Zambia, but inflows have
largely been limited to the mining sector. As of 2011, almost 70 percent of Zambia’s $11 billion
stock of inward foreign direct
investment (FDI) was in the mining
sector. These investments have
enabled a surge in copper production
from an estimated 260 thousand tons
in 2000 to current levels of about
800 thousand tons a year. More FDI
inflows into other sectors besides
mining would support overall growth,
as foreign investment not only boosts
available resources but also tends to
bring know-how and technological
improvement.
Human Capital and Cost of Labor
Aside from high transport costs and other infrastructure weaknesses, the availability and cost of
human capital is an important constraint on Zambia’s competitiveness, even as health and education
indictors show considerable progress in recent years. Life expectancy at birth has increased by over
15 percent since 2002; HIV prevalence among adults is on a declining trend; and school enrollment
rates have increased markedly. At 6.7 years, average schooling compares favorably within the region:
on par with Ghana and exceeding all low-income neighbors in the region and even Namibia, and
slightly above the average for countries assessed to have medium human development by the
UNDP.
0 1 2 3 4 5 6 7 8 9
MiningAgriculture
ManufacturingWholesale and Retail Trade
Transport and CommunicationsConstruction
Real EstateFinancial Institutions
Deposit Taking CorporationsFinance and Insurance
TourismAccomodation and Food
Information and CommunicationElectricity, gas and steam
Other
2010
2011
Zambia: Foreign Direct Investment Stocks by Sector(billions of US dollars)
Source: Bank of Zambia.
ZAMBIA
36 INTERNATIONAL MONETARY FUND
However, there remains significant scope for improvement. Life expectancy is among the lowest in
Sub-Saharan Africa, even when compared to lower-income Malawi where HIV prevalence is similar.
Access to education and health services remains very limited in rural areas. Water and sanitation
conditions remain poor, with only 50 percent of rural population having access to improved water
sources. Moreover, even those with access to schooling often receive a substandard education, with
Zambian students underperforming in both reading and mathematics compared with their peers in
other countries (Hungi and others 2010). This is in part due to an elevated pupil-to-teacher ratio in
primary education, which at 61 in 2011 was the highest in the region after the Central African
Republic and Chad, as sampled by the World Bank. Teachers are especially scarce in rural areas due
to the difficulty of attracting qualified candidates.
High labor costs are another challenge. Labor costs in Zambia have contributed to high levels of
informality or self-employment, with wage employment estimated at only 16.8 percent of total
employment in 2010 (World Bank, 2013). Based on firm-level data, labor costs in manufacturing at
about $2,100 in 2007 were among the highest in SSA, although on par with other regions when
viewed in relation to productivity. Since 2007, however, minimum wages in the private sector have
increased by about 80 percent in real terms and currently stand at close to $2,600 a year (about
160 percent of GDP per capita) when allowances are included. Moreover, following the recent wage
increase for civil servants, the lowest wage in the public sector is now about $6,500 a year—about
4½ times GDP per capita and 2½ times the minimum wage for the private sector—and is bound to
put further upward pressure on wages in the private sector.
0
10
20
30
40
50
60
70
0
1
2
3
4
5
6
7
Botswana Ghana Malawi Rwanda South Africa Zambia
Public Spending on Health(percent of GDP)
Life expectancy at birth' total (years), rhs
2011
2002
Sources: World Bank and IMF staff estimates
0
1
2
3
4
5
6
7
8
9
0
1
2
3
4
5
6
7
Ghana Malawi Rwanda South Africa Zambia
Public Spending on Education(percent of GDP)
Average years of schooling, rhs
2010
2001
Sources: UNDP, World Bank, and IMF staff estimates
ZAMBIA
INTERNATIONAL MONETARY FUND 37
Agriculture
A key sector for continued economic development in Zambia is agriculture. While agriculture
accounts for 55 to 65 percent of total
employment, the sector’s contribution to
GDP stands at less than 10 percent. The
country is very well endowed for farming,
but less than 20 percent of arable land is
cultivated and most farmers operate on a
subsistence basis with low productivity.
Average farm yields, although higher than
in many other countries in the region, trail
behind South Africa and agricultural
exporters in Asia. Key obstacles to
development include lack of transportation
and market infrastructure, difficulties in
0.0
0.1
0.2
0.3
0.4
0.5
0.6
0.7
0
1,000
2,000
3,000
4,000
5,000
6,000
7,000
Ango
la (2
006)
Ethi
opia
(200
6)
Gha
na (2
007)
Keny
a (2
007)
Mal
i (20
07)
Moz
ambi
que
(200
7)
Nig
eria
(200
7)
Sene
gal (
2007
)
Tanz
ania
(200
6)
Uga
nda
(200
6)
Zam
bia
(200
7)
Sub-
Saha
ran
Afric
a
East
Asi
a an
d Pa
cific
Euro
pe a
nd C
entr
al A
sia
Latin
Am
eric
a
Sout
h As
ia
Regional Means
Labor Cost Unit Labor Cost, rhs
Source: Gelb and others (2013), based on World Bank Enterprise Surveys data.Notes: Original data converted from 2005 to 2012 prices using US CPI. Unit labor cost is labor cost divided by value added per worker. Regional mean for Sub-Saharan Africa based on countries shown. East Asia and Pacific: Indonesia, Philippines, and Vietnam; Europe and Central Asia: Russia, Turkey, and Ukraine; Latin America: Argentina, Brazil, Chile, Columbia, Mexico, and Uruguay; and South Asia: Bangladesh and India.
Labor Costs in Manufacturing (survey medians, annual, per worker, in 2012 US dollars)
0
1000
2000
3000
4000
5000
6000
Source: World Bank, World Development Indicators.
Cereal Yields(average 2009-11, kg/hectare)
ZAMBIA
38 INTERNATIONAL MONETARY FUND
obtaining land titles and finance, and policies that have been overly focused on maize to the
detriment of crops with higher income potential. With effective efforts to address these constraints,
the sector could be a significant source of export earnings and a major driver of poverty reduction.
Conclusion
Zambia’s favorable business environment and strong macroeconomic fundamentals have supported
high economic growth over the past decade. More recently, there has been rapid progress towards
diversifying exports and lessening the country’s dependence on copper. This all speaks to the
healthy competitiveness of the Zambian economy. Nevertheless, the country faces significant
constraints that will hold back continued growth and diversification unless addressed. These include
an inadequate infrastructure, especially in transportation and electricity; poor health and education
standards; high labor costs in the formal sector; and low yields in agriculture. These are all areas that
are being targeted in the National Development Plan. The challenge will be to ensure that fiscal
space is made available for the resulting spending needs and also to ensure that what is spent is
effectively used. Careful planning and prioritization is needed, supported by evaluation of
implementation capacity, estimates of return on investment, and clear communication.
ZAMBIA
INTERNATIONAL MONETARY FUND 39
REFERENCES
Calderon, Cesar, 2009. “Infrastructure and Growth in Africa.” World Bank, Policy Research Working Paper Series 4914.
Gelb, Alan, Christian Meyer, and Vijaya Ramachandran, 2013. “Does Poor Mean Cheap? A Comparative Look at Africa’s Industrial Labor Costs.” Center for Global Development, Working Paper No. 325.
Hungi, Njora, Demus Makuwa, Kenneth Ross, Mioko Saito, Stephanie Dolata, Frank van Cappelle, Laura Paviot, and Jocelyne Vellien, 2010. “SACMEQ III Project Results: Pupil Achievement Levels in Reading and Mathematics.” Southern and Eastern Africa Consortium for Monitoring Educational Quality.
The World Bank, 2013. Doing Business 2013. World Bank.
The World Bank, 2013. “Zambia’s Jobs Challenge: Realities on the Ground.” World Bank, Zambia Economic Brief.
ZAMBIA
40 INTERNATIONAL MONETARY FUND
Appendix II. Risk Assessment Matrix
Main Sources of Risks
Likelihood (high, medium or low)
Expected Impact on Economy (high, medium or low)
Delayed fiscal adjustment in Zambia
Medium The needed fiscal adjustment to address the emerging financing gaps would be delayed until after the next elections in 2016.
High Given the government’s high funding needs, the failure to contain the wage bill and other recurrent expenditure could reduce needed capital and social spending (which will hurt growth potential and poverty reduction), or crowd out private sector credit, raise interest rates, and prompt currency depreciation (which will hurt growth and generate inflationary pressure). Public debt would rise rapidly, reducing fiscal buffers.
Loss of investor confidence in the Zambian business environment
Low to Medium The measures taken recently to tighten regulation of interest rates, together with the increases in minimum and government wages and concern about fiscal sustainability could undermine investor confidence.
Medium to High Loss of investor confidence could result in a sharp drop in FDI, which will hurt exports, job creation, and growth potential. Zambia’s funding costs in the global capital markets could rise substantially, resulting in additional debt service costs for the government given its need for substantial external financing.
Re-emergence of financial stress in the Euro area
Medium Re-emergence of financial stress in the Euro area as a result of stalled or incomplete delivery of national or Euro area policy commitments could lead to strains in cost of market access for peripheral sovereigns.
Medium Given the emerging fiscal financing gaps, Zambia needs a substantial amount of external financing. A sustained shutdown of global funding markets would put pressure on the domestic government securities market, leading to a rise in interest rates and crowding out private sector credit.
Lower than anticipated growth potential in emerging markets
Medium Lower demand from emerging markets, especially China, could result in a substantial drop in commodity prices.
Medium A substantial fall in commodity prices, particularly copper prices, could result in a sharp drop in exports and FDI in the mining sector. Part of the impact would be offset by lower profit and dividend payments to foreign owners. A deterioration in the current account could weaken the currently low reserve buffer.
ZAMBIA
INTERNATIONAL MONETARY FUND 41
Appendix III. A Regional Comparison of Government Wage Spending1,2
This appendix illustrates how Zambia compares to peer countries in the region on government wage
spending.3 The rapid increase in average wages that took place in September 2013 is raising pressures
on government finances, potentially crowding out public investment and priority spending in health
and education. This appendix also illustrates a few recent examples from countries where public wage
spending increased rapidly describing macroeconomic outcomes following such spending and policies
that may have helped mitigate the impact of ratcheted wage increases. Finally, the appendix draws
implications for Zambia.
Background. The government has
increased wages of civil servants by
an average of 45 percent following
the annual wage negotiations round
with the unions. The increase in wages
targeted a tripling of the minimum
salaries. Even though the wage
increase did not take effect until
September 2013, wage spending has
gone over budget and is expected to
reach almost 10 percent of GDP by
end year. The result is that Zambia’s
wage bill will close in on some of the
highest in Sub-Saharan Africa,
comparable to Mozambique, Angola,
and Cape Verde and about
2.5 percent of GDP higher than the
average in Sub-Saharan Africa (SSA).
Despite a planned wage freeze
in 2014 (both on salaries and net
recruitment), the wage bill is expected
1 Prepared by Kareem Ismail. 2 Projections and data in this note are IMF staff estimates based on the October 2013 WEO. 3 Comparator countries (see charts) include Angola, Cameron, Cape Verde, Ghana, Kenya, Mozambique, Nigeria, Rwanda, Uganda.
0
10
20
30
40
50
60
Wages in percent of Revenues Excluding Grants(2013 except where noted)
Nigeria Uganda RwandaCameroon Sub-Saharan Africa KenyaGhana Angola ZambiaCape Verde Mozambique Tanzania
Wage increase above 2013 MTEF
Sources: WEO and IMF staff projections
ZAMBIA
42 INTERNATIONAL MONETARY FUND
to reach 11 percent of GDP, reflecting the full year impact of the 2013 wage increase.
Fiscal risks and stress are even higher than ratios-to-GDP suggest due to the comparatively
weak revenue mobilization in
Zambia. The wage bill relative to
revenues is expected at 49 percent
in 2013 rising to 54 percent
in 2014, among the highest in Sub-
Saharan Africa and nearly
18 percent higher than the median.
Moreover, Zambia’s wage bill will
be among the largest in the
comparator group relative to its
current expenditure, which restricts
the scope for financing the wage
bill through cuts to other non-
investment expenditure.
Government wage spending can be a significant contributor to fiscal, and in some cases
external, imbalances due to the ratcheting impact of such spending on expenditure. Rising
wage spending not only affects fiscal balances, but through rising demand for imports may have
repercussion on the external position. Wage commitments are politically difficult to reverse through
cutting wages or firing public workers. The following section examines cases from three countries in
Sub-Saharan Africa: Angola, Botswana, and Ghana.
Experience of Peers
The experience of countries in the
region that have abruptly raised
wage spending over the last five
years shows how challenging it is
to unwind the impact from such
expenditure. This section covers
experiences from Angola, Botswana,
and Ghana where real wage spending
increased significantly (37 percent
in 2008 followed by 8 percent in 2009
0
10
20
30
40
50
60
Wages in percent of Government Current Expenditure(2013 except where noted)
Rwanda Kenya Cameroon
Uganda Angola Sub-Saharan Africa
Ghana Zambia (2013) Zambia (2014)
Nigeria Mozambique Cape Verde
Wage increase above budget
Wage increase above 2013 MTEF
Sources: WEO and IMF staff projections
0
10
20
30
40
7
8
9
10
11
12
2007 2008 2009 2010 2011
Wage in percent of revenue excl. grants
Wage in percent of expense
Wage in percent of GDP, lhs
Angola(percentage)
Source: IMF, World Economic Outlook.
ZAMBIA
INTERNATIONAL MONETARY FUND 43
in Angola; 22 percent in 2010 in Botswana; 45 percent in 2011 followed by 66 percent in 2012 in
Ghana). 4 These countries raised their wage bill in excess of 1.5 percent of GDP in one year through
increased salaries in Botswana and Ghana, and increased recruitment in the case of Angola. Only
Angola has managed to reduce the wage burden from peak through containing wages and
adjusting the exchange rate, which was further helped by rising oil revenue. All three countries
experienced rising fiscal deficits and loss in international reserve coverage following the wage
increase with two of the countries, Angola and Ghana, experiencing significant exchange rate
depreciation.5
In Angola and Ghana exchange rate
depreciation helped to partially
mitigate the wage spending
increases. In the case of Angola the
wage bill increased by 2.5 percent of
GDP in 2008, while in Ghana the wage
bill increased by 2.7 percent of GDP
over 2011-12. The wage bill as
a percent of revenue peaked at
32 percent in Angola in 2008 and
66 percent in Ghana in 2012. A ramp
up in oil revenue in Angola together
with a decline in real wage spending
helped reduce this ratio to around 20 percent of revenues in 2010. The exchange rate depreciated in
both countries significantly with devaluation in the case of Angola by 22 percent over 2008-10, and
by 26 percent in Ghana over 2010-12. While exchange rate depreciation contributed to rising
inflation in Angola, it had limited impact on inflation in Ghana where monetary policy tightened
significantly. Tightened monetary policy in Ghana raised rates on government bonds, which
attracted portfolio inflows and stemmed the decline in gross international reserve coverage from 3.2
to 2.8 months of imports over 2010-12. In Angola, recovering oil prices helped rebuild gross
international reserves in 2010 following a sharp decline in 2009 that led to a Stand-By Arrangement
with the Fund.
4 For Ghana, the wage bill includes deferred payments associated with transition to the single spine salary structure. 5 In the case of Angola, the decline in international reserves was due to a combination of oil revenue collapse and expansionary policies. Gross international reserves recovered in 2010, but even then net international reserves remained lower than they were in 2008.
0
10
20
30
40
50
60
70
80
6
7
8
9
10
11
12
2009 2010 2011 2012
Wage in percent of revenue excl. grants
Wage in percent of expense
Wage in percent of GDP, lhs
Ghana(percentage)
Source: IMF, World Economic Outlook.
ZAMBIA
44 INTERNATIONAL MONETARY FUND
A multi-year structural wage
freeze in Botswana has helped
contain the wage bill though its
impact was limited by temporary
increases in allowances. Botswana
established a three-year structural
wage freeze in 2009 following a
125 percent cumulative increase in
public wages over 2001-09. In the
third year, union strikes demanded
that the government increase wages
by 16 percent. The government
settled worker demands by raising
wages by 3 percent. However, wage spending as a share of GDP remained persistently high and
increased by 2012 due to temporary allowances aimed at the lower end of the wage ladder. The
wage bill as a share of revenue declined by a small margin from a peak of 39 percent in 2010 to
35 percent in 2012. Throughout the wage freeze period, international reserve coverage declined
significantly from 16 months of imports in 2009 to 11 months of imports by 2012.
Lessons Learned
Zambia’s adjustment to the wage increase will require significant fiscal and monetary policy
tightening. On the fiscal side, revenue mobilization is critical to help alleviate the risks from the
elevated wage bill and a multi-year wage freeze is necessary to contain spending. On the monetary
side, maintaining tight policies will be necessary to support low inflation and reduce pressures on
the currency. Given the currently low international reserve coverage, the authorities would need to
abstain from central bank intervention in the foreign exchange market, except to smooth volatility
while gradually building up reserves.
A multi-year wage freeze will require clear communication and support from stakeholders
and strengthened expenditure controls. Much of the public discontent surrounding the recently
announced wage freeze policy is related to disparities in the salary structure and not to public
salaries themselves, which are significantly higher than private sector wages. The government needs
to highlight the risks stemming from the current wage levels and the need for a wage freeze while
reaching an agreement with stakeholders on how to manage current disparities in the civil service
salary structure. Following the currently planned wage freeze for 2014-15, multi-year wage
negotiations, rather than agreements on a year-by-year basis, would facilitate the efforts at
0
10
20
30
40
50
11
12
13
14
2008 2009 2010 2011 2012
Wage in percent of revenue excl. grants
Wage in percent of expense
Wage in percent of GDP, lhs
Botswana(percentage)
Source: IMF, World Economic Outlook.
ZAMBIA
INTERNATIONAL MONETARY FUND 45
containing the wage bill and would help mitigate political pressures to raise wages in election years.
Additionally, wage freeze decisions need to imply controlling not only of base structural salaries, but
also of merit increases, allowances, and recruitment. In order to do so, strengthening expenditure
controls on salaries and enhancing communication with government agencies on wage and staffing
policies will be critical.
ZAMBIA
46 INTERNATIONAL MONETARY FUND
Appendix IV. External Stability Assessment1 Zambia’s real effective exchange rate (REER) has appreciated since the early 2000s, mostly
because of the improvement in
terms of trade (Figure 1). High
copper prices were a major driver of
the terms of trade, and copper
contributed about three-fourths of
export earnings. The depreciation
in 2008–09 was mainly driven by a
plunge in copper prices associated
with the global financial crisis.
In 2012, the REER appreciated by
3 percent mainly due to the inflation
differential.
The standard tools developed by the IMF’s Consultative Group on Exchange Rate (CGER) have
been used to assess the Zambian exchange rate. For that purpose, the current account balance
presented in the Balance of Payments (Table 5) has been adjusted. The balance of payments for
Zambia shows the (mostly foreign-owned) mining companies as keeping a large share of the mining
export proceeds abroad. This large financial account outflow is simply the estimated difference
between the declared mining related inflows and outflows, conventionally recorded in the financial
account instead of in the current account. To better reflect the true impact of the mining related
flows on the foreign currency market, and the exchange rate and international reserves, for the
purpose of this exercise, these outflows have been reclassified to the current account as additional
dividend outflows.2
1 Prepared by Marco Arena. 2 Based on discussions with the authorities, the estimation is done assuming that 80 percent of the financial outflows are reclassified to the current account. An additional scenario is presented with an adjustment of 60 percent. In this context, the underlying current account would be equal to the baseline current account plus 80 (60) percent of the financial outflows.
0
50
100
150
200
250
300
2000 2002 2004 2006 2008 2010 2012
NEER REER Terms of Trade
Sources: IMF Information Notice System and World Economic Outlook.
Figure 1. Zambia: Real and Nominal Effective Exchange Rate
ZAMBIA
INTERNATIONAL MONETARY FUND 47
Under current policies (without fiscal adjustment), there is conflicting evidence of whether
the real effective exchange rate is over- or undervalued (Text Table 1). The estimates based on
the external sustainability approach suggest an overvaluation of almost 6 percent, consistent with a
medium-term projection of 75 percent in the net foreign liabilities ratio. In addition, the
macroeconomic balance approach suggests an overvaluation of 8 percent. On the other hand, the
real equilibrium exchange rate approach
suggests an undervaluation, but that is not
statistically significant because the actual
REER is within the confidence intervals
around the equilibrium real exchange rate
(Figure 2). Under an alternative scenario
(Text Table 2), where the baseline current
account is adjusted with 60 percent of the
financial outflows, both the external
sustainability and macro-balance
approach do not suggest a real exchange
rate misalignment.
Approach REER
Norm Underlying2/
Gap Overvaluation
External sustainability3/
-8.3 -10.1 -1.8 5.7Macroeconomic balance -7.5 -10.1 -2.6 8.4Equilibirum real exchange rate -13.91/ Based on IMF CGER methodology and extension by Francis Vitek (IMF 2009, unpublished).
2/Adjusted current account rat io to GDP (current account under the baseline plus 80% of financial outflows).
3/ Current account norm consistent with a net foreign liability ratio (NFL) of 75 percent. Using a NFL
ratio of 80 percent would imply an overvaluation of 3.9 percent.
Text Table 1. Exchange rate assessment: baseline results 1/Current account/GDP
Approach REER
Norm Underlying2/
Gap Overvaluation
External sustainability3/
-8.3 -7.9 0.4 -1.4Macroeconomic balance -7.5 -7.9 -0.4 1.3Equilibirum real exchange rate -13.91/ Based on IMF CGER methodology and extension by Francis Vitek (IMF 2009, unpublished).
2/ Adjusted current account ratio to GDP (current account under the baseline plus 60% of financial outflows).
3/ Current account norm consistent with a net foreign liability ratio (NFL) of 75 percent. Using a NFL
ratio of 80 percent would imply an undervaluation of 3.2 percent.
Text Table 2. Exchange rate assessment: alternative scenario results 1/Current account/GDP
60
80
100
120
140
160
180
2004 2005 2006 2007 2008 2009 2010 2011 2012 2013
90% confidenceinterval
Equilibrium rateActual rate
Sources: IMF World Economic Outlook and staff estimates.
Figure 2. Equilibrium Real Effective Exchange Rate
ZAMBIA
48 INTERNATIONAL MONETARY FUND
Appendix V. Lending Rate Ceilings and Their Impact on the Nonbanking Sector1
1. The authorities are concerned about high lending rates and limited access to credit by
SMEs. The financial sector, dominated by
the banking sector, has grown steadily and
remains profitable. However, despite
various measures taken, the authorities
believe that lending interest rates in
Zambia remain very high, which has
limited access to credit by SMEs in
particular, given high borrowing costs.
2. In early 2013 the BOZ
introduced ceilings on effective annual
interest rates for banks, nonbanks and
microfinance institutions.2 The ceilings
were initially set at 18.25 percent for
banks, 30 percent for non-banks, and
42 percent for microfinance institutions,
with the levels tied to the BOZ policy rate,
which was 9.25 percent at that time.
3. Banks initially indicated that the
ceilings were not binding for their
customers, except for a few SMEs.
However, indications are that the ceiling
for micro-finance institutions (MFIs) is
particularly binding, as shown by their very
high lending rates amounting to over 90
to 120 percent. In addition, the ceiling for
1 Prepared by Byung Kyoon Jang. 2 The effective annual interest rate is defined as the total costs of borrowing expressed as an annual percentage rate. The total costs of borrowing are all the costs known to the financial service provider, including interest, commissions and any other kind of fees which the borrower is required to pay in connection with a credit agreement, and any other costs in respect of ancillary services relating to the credit agreement, if the conclusion of a service contract is compulsory in order to obtain the credit or to obtain it on the terms and conditions marketed.
Nonbanks’ Lending Rates and Interest Rate Caps (In percent)
NBFI Subsector Average
Interest Rates
in Q4 2012
Interest rate
caps
Enterprise-lending MFIs 91.4 42
All other MFIs 120.6 30
Leasing companies 42.9 30
Building societies 25.3 30
Development Bank of
Zambia
20.6 30
National Savings and
Credit Bank
27.0 30
Source: Bank of Zambia
0
5
10
15
20
25
30
35
Jan-
08
Apr
-08
Jul-0
8
Oct
-08
Jan-
09
Apr
-09
Jul-0
9
Oct
-09
Jan-
10
Apr
-10
Jul-1
0
Oct
-10
Jan-
11
Apr
-11
Jul-1
1
Oct
-11
Jan-
12
Apr
-12
Jul-1
2
Oct
-12
CPI (yoy change) Lending rate (percent)
Bank Lending Rate(In percent)
Sources: Bank of Zambia and Central Statistics Office.
ZAMBIA
INTERNATIONAL MONETARY FUND 49
banks has likely become more binding, as the spread between Treasury bill rates and the ceiling has
declined since the ceiling’s introduction.
4. Since the introduction of the lending rate caps, most nonbanks have continued to
expand their loan portfolios. Total nonbank loans have thus risen, albeit from a small base, by
almost 30 percent from December 2012 to August 2013. The nonbank sector, excluding enterprise-
lending MFIs, also continued to remain profitable.
5. Some restructuring of the nonbanking sector is underway since the introduction of the
ceilings. In response to the declining interest margins, nonbanks, particularly the MFIs, have
implemented cost reduction programs, including closing marginal branches, and adjusted their
business models to remain viable. Four
consumer-lending MFIs decided to exit the
financial sector, which could indicate that
some inefficient nonbanks are weeded out
since the introduction of the lending rate
caps. The BOZ, however, has continued to
receive MFI license applications this year.
The BOZ has asked a foreign NGO (Financial
Sector Deepening Africa) to conduct an in-
depth study of the impact of the lending
rate ceilings.
-5,000
0
5,000
10,000
15,000
20,000
Jan 13 Feb 13 Mar 13 Apr 13 May 13 Jun 13 Jul 13 Aug 13 Sep 13
NBFI Sector Profitability
Enterprise Lending MFIs Profitability
2 per. Mov. Avg. (NBFI Sector Profitability)
Nonbanks’ Profitability(Thousands of Kwacha)
Source: Bank of Zambia
ZAMBIA STAFF REPORT FOR THE 2013 ARTICLE IV CONSULTATION—INFORMATIONAL ANNEX Prepared By
African Department (in consultation with other departments)
RELATIONS WITH THE FUND ___________________________________________________________ 2
JOINT WORLD BANK-FUND WORK PROGRAM, 2013–14 _____________________________ 9
RELATIONS WITH THE FUND As of October 31, 2013 Membership Status: Joined: September 23, 1965; Article VIII General Resources Account:
SDR Million Percent Quota
Quota 489.10 100.0
Fund holdings of currency 489.10 100.0
Reserve position in Fund 0.02 0.0
SDR Department
SDR Million Percent Allocation
Net cumulative allocation 469.14 100.0
Holdings 386.30 82.34
Outstanding Purchases and Loans
SDR Million Percent Quota
ECF arrangements 255.31 52.20
Latest Financial Arrangements
Type Approval Date Expiration Date Amount Approved
(SDR Million)
Amount Drawn
(SDR Million)
ECF 1 06/04/2008 06/29/2011 220.10 220.10
ECF 1 06/16/2004 09/30/2007 220.10 220.10
ECF 1 03/25/1999 03/28/2003 278.90 237.52
Projected Payments to the Fund (SDR million; based on existing use of resources and present holdings of SDRs)
Forthcoming
2013 2014 2015 2016 2017
Principal 3.45 23.09 43.44 49.88 47.32
Charges/interest 0.02 0.08 0.61 0.50 0.37
Total 3.47 23.17 44.05 50.38 47.69
1 Formerly PRGF.
ZAMBIA
INTERNATIONAL MONETARY FUND 3
Implementation of HIPC Initiative
Enhanced
Framework
Commitment of HIPC assistance
Decision point date Dec. 2000
Assistance committed (1999 NPV terms)2
By all creditors (US$ million) 2,499.20
Of which: Fund assistance (US$ million) 602.00
(SDR equivalent in millions) 468.80
Completion point date April 2005
Disbursement of IMF assistance (SDR million)
Assistance disbursed to Zambia 468.80
Interim assistance 351.60
Completion point balance 117.20
Additional disbursements of interest income3 39.47
Total Disbursement 508.27
Implementation of MDRI Assistance
I. Total debt relief (SDR million)4 402.59
Of which: MDRI 398.47
HIPC 4.12
II. Debt relief by facility (SDR million)
Delivery date GRA PRGT Total
January 2006 n/a 402.59 402.59
2 Net present value (NPV) terms at the decision point under the enhanced framework. 3 Under the enhanced framework, an additional disbursement is made at the completion point corresponding to interest income earned on the amount committed at the decision point but not disbursed during the interim period. 4 The Multilateral Debt Relief Initiative (MDRI) provides 100 percent debt relief to eligible member countries that are qualified for assistance. The debt relief covers all debt owed to the Fund as of end-2004 that is outstanding at the time the member qualifies for the relief.
ZAMBIA
4 INTERNATIONAL MONETARY FUND
Safeguard Assessments
Safeguards assessments of the Bank of Zambia (BoZ) were completed in June 2004, January 2009, and October 2010. The 2009 assessment concluded that the bank had adequate safeguards in several areas, but confirmed the existence of certain vulnerabilities in the BoZ’s legal framework and financial reporting. The 2010 update report concluded that the BoZ had made progress in implementing safeguards recommendations. Staff noted improvements in the internal audit and internal control mechanisms. Weak statutory independence remains a substantive safeguards concern.
Exchange Rate Arrangement
The currency of Zambia is the kwacha. The exchange rate arrangement is a “float,” with the kwacha exchange rate determined in the interbank market. The buying rate of the BoZ is a simple average of the primary dealers’ low bid rates, and the BoZ’s selling rate is the simple average of the primary dealers’ high offer rates. On April 19, 2002, Zambia accepted the obligations of Article VIII, Sections 2, 3, and 4 of the Articles of Agreement.
On June 25, 2013, the Zambian authorities issued Statutory Instrument 55 of 2013, which regulates the monitoring of foreign exchange transactions. Among the measures included are two that give rise to exchange restrictions subject to Fund approval under Article VIII, Section 2(a). The first exchange restriction arises from the requirement that a person making payments of dividends in foreign exchange to a foreign bank account or nonresident person provide a tax clearance certificate and evidence of payment of corporate or income tax. The measure gives rise to an exchange restriction subject to IMF approval under Article VIII, Section 2(a) because it imposes limitations on the availability of foreign exchange for the making of payments of current international transactions based on noncompliance with obligations that are unrelated to the proposed transaction. The second exchange restriction arises from the requirement that a person making payments for royalties, management fees, technical fees, commissions or consultancy fees in foreign exchange to a foreign bank account or nonresident person be accompanied by evidence of corporate tax payments. This measure similarly gives rise to an exchange restriction subject to IMF approval under Article VIII, Section 2(a) because it imposes limitations on the availability of foreign exchange for the making of payments of current international transactions based on noncompliance with obligations that are unrelated to the proposed transaction. The authorities have assured staff that SI55 will be amended to remove these restrictions before the Board Meeting for the 2013 Article IV consultation. Further, Zambia continues to maintain an exchange restriction, which is subject to Fund approval under Article VIII, arising from limitations imposed by the government on access to foreign exchange for the making of payments and transfers for current international transactions, which is evidenced by the existence of external payments arrears accumulated prior to October 4, 1985. Staff noted progress towards resolving these arrears.
ZAMBIA
INTERNATIONAL MONETARY FUND 5
Article IV Consultations
Zambia is on the standard 12-month Article IV consultation cycle, subject to Decision No. 14747– (10/96), as amended. The Executive Board concluded the last Article IV consultation on June 13, 2012.
FSAP Participation and ROSC
Zambia has participated in the financial sector assessment program (FSAP); an FSAP mission from the Fund and the World Bank conducted a comprehensive external assessment of the financial system April 30–May 15, 2002, and July 15–26, 2002. A mission from the Fund and the World Bank conducted a follow up FSAP in November 2008.
The fiscal transparency module of a Report on Observance of Standards and Codes (ROSC) assessing compliance with the IMF’s Code of Good Practices on Fiscal Transparency—Declaration of Principles was issued to the Executive Board on October 31, 2001. A ROSC data module was issued to the Executive Board on January 18, 2005.
ZAMBIA
6 INTERNATIONAL MONETARY FUND
Technical Assistance (since 2003)
Resident advisors
Department Dates Position
FAD
MCM
2002–03
2012–13
2011–15
Advisor on public expenditure management
Peripatetic advisor on mining tax administration
Advisor on capacity building at the Bank of
Zambia
Technical assistance missions
Department Dates Purpose
MFD January and May 2003 Development of foreign exchange interbank
market, monetary operations, and reform of the
financial system
September 2003 Monetary operations, reform of the financial
system, government securities market, and
payments system
April–October 2004 Resolution of nonbank financial institutions (three
missions)
April–May 2005 Liquidity management operations
March 2006 Liquidity management, monetary and exchange
rate policies
MCM March 2009 Contingency planning and lender of last resort
September 2007 Institutional arrangements and operation of the
foreign exchange market.
September 2007 Foreign exchange market
November 2007 Risk-based supervision
July 2008 Bank restructuring
July 2009 Debt management strategy
November 2011 Monetary policy framework
January 2012 Inflation targeting framework
January 2012 Payments system reforms
January 2012 Central Bank organizational restructuring
February 2012 Currency management
March 2012 Macro modeling of transmission mechanism
May 2012 Stress testing and risk profile of banks
ZAMBIA
INTERNATIONAL MONETARY FUND 7
Department Dates Purpose
May 2012 Currency management
July 2012 Payments system
September 2012 Currency management
October 2012 Inflation targeting
November 2012 Organization review
November 2012 Financial stability
December 2012 Bank supervision and regulations
February 2013 Information handling
March 2013 Organization of economic analysis
March 2013 Macro modeling of transmission mechanism
May 2013 Payments system
June 2013 Markets for government securities
August 2013 Financial stability analysis
September 2013 Liquidity forecasting and interbank market
STA June 2004 Data ROSC
April–May 2005 Monetary statistics (GDDS)
May 2005 Government finance statistics (GDDS)
February 2006 Real sector (GDDS)
July 2006 Real sector (GDDS)
April 2008 Monetary and financial statistics
January 2009 Consumer price index
April 2010 Government finance statistics
February 2013 SRF data development
FAD July–August 2005 Regulations for the Public Finance Act
November 2005 Fiscal regime for copper mining
July 2006 Revenue administration
August 2006 Follow up on fiscal arrangements for the mining
sector
October 2006 Review of tax policy
June 2008 Tax administration
November 2008 Tax administration
January 2009 Tax administration
April 2009 Public financial management
ZAMBIA
8 INTERNATIONAL MONETARY FUND
Department Dates Purpose
November 2009 Tax administration
February 2010 Tax administration
June 2010 Public financial management
August 2010 Tax policy
September 2010 Public financial management
February 2012 Mining tax administration
April 2012 Public financial management
October 2012 Tax administration
April 2013 Pension reform
July 2012 Tax policy
November 2013 Tax administration
November 2013 Public financial management
LEG August 2004– February
2005
Assistance on amending legislation on nonbank
financial institutions
May 2005 Strengthening the regulatory framework for
nonbank financial institutions
Resident Representative
A Fund Resident Representative first took up the position in Lusaka in June 1990. Mr. Tobias Rasmussen has been the Resident Representative since January 2013.
ZAMBIA
INTERNATIONAL MONETARY FUND 9
JOINT WORLD BANK-FUND WORK PROGRAM, 2013–14 Title Products Expected Delivery
Date World Bank work program in next 12 months
1. Two Economic Briefs with the first focused on Trade and the second on Financial Inclusion
2. Paper on non-concessional borrowing limits
3. Poverty maps
4. Diagnostic trade integration study
5. TA on Pay Policy Reform
6. TA to Zambia Mining Sector Governance Reform including EITI
7. Risk-based supervision TA
8. Financial stability TA with BoZ
9. South-South knowledge exchange with Chile
10. Analytical work on decentralization
11. PFM reform program (TA project worth about $30 million)
March 2014 and September 2014 November 2014 June 2014 January 2014 January 2014 Continuous June 2014 June 2014 February 2014 August/September 2014 Ongoing
IMF work program in next 12 months
1. Technical assistance: tax administration peripatetic advisor to the Zambia Revenue Authority
Ongoing
2. Technical assistance: Central bank capacity building resident advisor to the Bank of Zambia
Ongoing
3. Staff visit February 2014
4. 2014 Article IV mission September 2014
Fund request to Bank
Bank request to Fund
1. Medium-term macroeconomic framework
Joint products in next 12 months
1. DSA
2. Monthly meetings with the Bank of Zambia
September 2014 Continuous
ZAMBIA
10 INTERNATIONAL MONETARY FUND
STATISTICAL ISSUES
As of November 20, 2013
I. Assessment of Data Adequacy for Surveillance
General: Data provision has some shortcomings, but is broadly adequate for surveillance. Issues with source data and compilation affect most datasets, but are particularly problematic in the national accounts, balance of payments, and fiscal reporting.
National accounts: There is a high degree of uncertainty attached to estimates of the level and growth rate of real GDP, because 1994 is the latest benchmark year for value-added ratios to estimate GDP under the production approach. For many important industry areas, such as wholesale and retail trade, construction, business services, and many other service industries, (consisting mainly of small-scale private service providers) no appropriate indicators exist. Data on total production and intermediate consumption of establishments are not available. On the expenditure side, no reliable indicators of household consumption exist and private final consumption expenditure is derived as a residual. Source data for estimating gross fixed capital formation and changes in stocks are incomplete. There is also lack of high frequency real sector data to support a more flexible monetary management. The situation largely reflects resource constraints and organizational weakness within the Central Statistical Office that have affected its ability to produce economic statistics on a timely basis.
Price statistics: The CPI broadly adheres to international methodological standards. The classification system used for compilation closely follows the Classification of Individual Consumption by Purpose. With STA technical assistance, a new CPI series with updated weights based on the latest household budget survey was released in February 2012.
Government finance statistics: Data provision is broadly adequate for surveillance purposes. The transactional coverage of these data is however limited to government operations and transactions in nonfinancial assets. Data on transactions in financial assets and liabilities are still unavailable. The authorities report monthly budget releases data to AFR for operational use in a timely manner, but the data are often subject to substantial revisions, and data on extra-budgetary institutions and local governments are not available. The consolidation of fiscal outturn between fiscal reports and government accounts in monetary data requires significant improvement.
Monetary statistics: Data provision is broadly adequate for surveillance purposes. Since the 2005 monetary and financial statistics mission, there has been a noticeable improvement in the quality of monetary accounts compiled and reported in accordance with the standardized report forms (SRFs) for the BoZ and other depository corporations (ODCs).
ZAMBIA
INTERNATIONAL MONETARY FUND 11
Balance of payments statistics: Data sources and compilation methods still need to be improved (some items are estimated without reference to current source data). Resources available for balance of payments compilation have been increased, but are still inadequate, while coordination between the BoZ and CSO had improved. As a result, gaps in data remain in many areas including reinvested earnings, trade in services, and the financial account (including export proceeds held abroad by mining and nontraditional exporters). While the source data are generally adequate in terms of timeliness, they fall short in terms of coverage. As a result, indirect estimation methods are used, some of which have remained unchanged for many years and are out of date. Source data on private sector foreign assets and liabilities are insufficient to compile an International Investment Position statement.
External and domestic debt statistics: Data provision is broadly adequate for surveillance purposes. Recent efforts, facilitated by technical assistance, have led to an improvement in the consolidation of the debt databases, both in terms of external and domestic debt. Further work is underway in these areas.
II. Data Standards and Quality
Zambia has participated in the General Data Dissemination System (GDDS) since November 2002.
A Data ROSC Assessment was published in February 2005.
ZAMBIA
12 INTERNATIONAL MONETARY FUND
Zambia: Table of Common Indicators Required for Surveillance As of November 12, 2013
1Includes reserve assets pledged or otherwise encumbered as well as net derivative positions. 2 Both market-based and officially determined, including discounts rates, money market rates, rates on treasury bills, notes and bonds. 3 Foreign, domestic bank, and domestic nonbank financing. 4 The general government consists of the central government (budgetary funds, extra budgetary funds, and social security funds) and state and local governments. 5 Including currency and maturity composition. 6 Includes external gross financial asset and liability positions vis-à-vis nonresidents. 7 Daily (D), weekly (W), monthly (M), quarterly (Q), annually (A); irregular (I); or not available (NA). 8 Reflects the assessment provided in the data ROSC, published February 1, 2005, and based on the findings of the mission that took place during May 18–June 3, 2004 for the dataset corresponding to the variable in each row. The assessment indicates whether international standards concerning (respectively) concepts and definitions, scope, classification/sectorization, and basis for recording are fully observed (O), largely observed (LO), largely not observed (LNO), or not observed (NO).
Date of Latest Observation
Date Received
Frequency of
Data7
Frequency of
Reporting7
Frequency of Publication7
Memo Items: Data Quality –
Methodological soundness8
Data Quality – Accuracy
and Reliability9
Exchange rates Nov. 12, 2013
Nov. 12, 2013
D D D
International reserve assets and reserve liabilities of the monetary authorities1
Oct. 10, 2013
Oct. 11, 2013
D W M
Reserve/base money Oct. 10, 2013
Oct. 11, 2013
D W I
LO, LO, LO, LO LO, O, O, O, O
Broad money Sept. 2013 Nov. 8, 2013 M M M
Central bank balance sheet
Sept. 2013 Nov. 8, 2013 M M M
Consolidated balance sheet of the banking system
Sept. 2013 Nov. 8, 2013 M M M
Interest rates2 Sept. 2013 Nov. 8, 2013 W W I Consumer Price Index Oct 2013 Oct. 31,
2013 M M M
O, LO, O, LO LNO, LO, LO, LNO, LO
Revenue, expenditure, balance and composition of financing3—general government4
NA
LO, LNO, LNO, LO
LNO, LO, O, O, LNO
Revenue, expenditure, balance and composition of financing3— central government
Sept. 2013 Oct. 22, 2013
M M M
Stocks of central government and central
government–guaranteed debt5
Aug. 31, 2013
Sept. 23, 2013
M M A
External current account balance
Q3 2013 Nov. 11, 2013
Q Q A LO, LNO, LNO, O
LNO, O, LNO, LO, LNO
Exports and imports of goods and services
Sept. 2013 Oct. 31, 2013
M M M
GDP/GNP 2012 July 10, 2013 A A A LO, LO, LO, LO
LNO, LO, LNO, LNO, LNO
Gross external debt Aug. 2013 Sept. 22, 2013
I I I
International investment position 6
NA NA
ZAMBIA STAFF REPORT FOR THE 2013 ARTICLE IV CONSULTATION—DEBT SUSTAINABILITY ANALYSIS
Based on the Joint Fund-Bank Debt Sustainability Framework for Low-income Countries
(LIC DSA), Zambia’s risk of external debt distress remains low as all debt indicators stay
below the indicative policy thresholds throughout the projection period (2013–2033).
Under the baseline and alternative scenarios, all external debt sustainability indicators
remain below their applicable thresholds. The public DSA suggests that, under the
baseline, Zambia’s overall public sector debt dynamics would be sustainable. However,
besides sound macroeconomic policies, strong debt management, a higher diversification
of the export base, and project appraisal capacity are needed to maintain debt
sustainability in the face of a projected rise in non-concessional borrowing and potential
external shocks.
Approved By David Owen and Chris Lane (IMF) and Jeffrey D. Lewis and Marcelo Giugale (IDA)
Prepared by: International Monetary Fund and International Development Association
November 26, 2013
ZAMBIA
2 INTERNATIONAL MONETARY FUND
BACKGROUND
1. Zambia’s stock of external and public debt remains relatively low. External public and
publicly guaranteed (PPG) debt was about 18 percent of GPD in 2012 (US$3.7 billion).1, 2 The debt’s
share related to multilaterals declined from 62 percent to 38 percent given the issuance of a
Eurobond (US$750 million) in 2012. In this context, as of December 2012, the debt’s share owed to
private banks/investors was 27 percent. Zambia’s total PPG debt also remains relatively low at
32.5 percent of GDP at end-2012.3
UNDERLYING DSA ASSUMPTIONS 2. In 2013, Zambia’s economic growth will be slightly lower than in 2012. GDP is projected
to expand by 6.0 percent compared to 7.2 percent in 2012. This lower growth rate is related to a
decline in the agriculture sector due to adverse weather conditions. GDP growth is being supported
by a scale up of government investments. Inflation is projected at 7.5 percent. The external current
account is projected to register a deficit of around 1.3 percent of GDP compared to a small surplus
observed in 2012, mainly reflecting higher imports related to foreign direct investment activities and
public sector investments. The higher imports more than offset a higher value of both copper and
non-traditional exports compared to 2012. Reserve coverage, in terms of next year’s imports, are
projected to decline from 2.7 to 2.3 months. Over the medium term, the baseline scenario assumes
prudent economic policies to provide fiscal space for growth-enhancing investment while
safeguarding macroeconomic stability. Inflation is expected to remain in single-digits; real economic
growth will continue to be strong, supported by commodity exports, infrastructure investment, and
expanded electricity generation capacity (Box 1).
1 Zambia’s stock of external debt declined substantially from about 86 percent of GDP in 2005 to around 9 percent in 2006 as a result of debt cancellation under the HIPC Initiative and MDRI. 2 Authorities have revised the 2012 central government’s debt stock from US$2.605 billion to US$2.954 billion. This change is mainly due to a reconciliation exercise with some creditors (mainly the EXIM bank of China by an amount of US$331 million). According to the authorities, disbursements of some loans went directly to the implementing agencies without informing the Ministry of Finance’s debt unit. 3PPG debt stock includes Central Government debt stock, IMF debt stock and 60 percent of ZESCO’s debt stock. According to ZESCO’s authorities, 60 percent of the debt is guaranteed by the government.
ZAMBIA
INTERNATIONAL MONETARY FUND 3
Box 1. Baseline Macroeconomic Assumptions
Economic growth: Real GDP growth is assumed to pick up to about 7.7 percent in the medium term, supported by mining activity (copper exports are projected to increase by 70 percent between 2012 and 2018, from 0.9 million tons to 1.5 million tons, giving current production and investment plans), large infrastructure investment (capital expenditures are projected to increase from an estimate of 6.1 percent of GDP in 2013 to 8.8 percent of GDP in 2018), and increased electricity generation capacity. In the long run, the mining sector will remain important, but economic diversification in areas such as electricity generation, agriculture, and tourism is expected to support economic growth, which would be at around 5.0 percent annually.
Inflation: The current objective of monetary policy is to reduce inflation to 6 percent or less. Prudent monetary and fiscal policies are expected to reduce annual inflation to around 5 percent in the medium term.
External sector: Mining output is expected to show an average increase of 10 percent in the medium term (between 2013 and 2018), and the copper price is assumed to stabilize at around US$3.3 per pound in the long run. Copper, whose exports have been particularly strong in 2010 and 2011, will remain Zambia’s most important export (between 65 and 70 percent of total exports in the medium term). However, growth of nontraditional exports are projected to be 17–23 percent over the medium term, and then stabilize at around 10-11 percent in the long run, consistent with higher non-mining output growth and infrastructure expenditure. Foreign direct investment (FDI) is expected to rise in the medium term to around 7.7 percent of GDP, concentrated in the mining, manufacturing, and transport sectors, but then stabilize in the long run at around 4.5 percent of GDP. The current account balance is projected to be roughly balanced by 2018 and to register a deficit of around 1 percent of GDP in the long term.
Government revenue and expenditure: In line with staff recommendations, fiscal policy is assumed to be geared toward creating space for spending needs to enhance the economic diversification of Zambia. To this end, higher revenue will be mobilized through improvements in tax administration, especially with respect to the VAT and mining taxes, and new tax policy measures that would broaden the tax base (reduction of tax incentives and exemptions and some change in tax rates). As a result, revenues would rise gradually from 20.9 percent of GDP in 2013 to 24.8 percent by 2018. Primary expenditures would increase in the near term (reaching 27 percent of GDP), mainly due to the growth-critical infrastructure investment and spending on education and health, but are then expected to stabilize at about 26 percent of GDP, with current spending contained.
Government financing: Net external financing is expected to decline from 5.0 percent of GDP in 2014 to 2.0 percent of GDP by 2018. External finance will be used to finance social and capital spending. This amount includes the issuance of sovereign debt (Eurobonds). However, net external financing is expected to decline to around 1.0 percent of GDP over the long-term. It is also assumed that the repayment of Eurobonds would be done through roll-overs.
3. The baseline scenario assumes new public external borrowing on the order of US$6.2 billion
between 2013 and 2018. Of this amount, around US$3.9 billion is expected to come through Eurobond
issuances. These Eurobonds are expected to incur interest at a constant spread from WEO global
assumptions on the 10 year US Treasury bond of about 5 percentage points. The significant reliance on
Eurobond financing in this scenario raises rollover risks and exposure to potential tightening of liquidity
ZAMBIA
4 INTERNATIONAL MONETARY FUND
conditions in international markets. Moreover, another US$650 million would be on commercial terms.4 It is
assumed that the proportion of borrowing under commercial terms, excluding the proceeds of the
Eurobonds, would gradually increase from 21 percent in the medium term to above 65 percent by 2033.
4. The behavior of the grant element of new borrowing is erratic mainly due to assumptions
on rollover of Eurobonds. Issuances are projected to happen between 2014 and 2018. Also, it is assumed
that roll-overs would be in place to repay the 2012 issuance and the ones between 2014 and 2018. Under
the new discount factor of 5 percent, the grant element of new borrowing (GENB) would be around
56 percent in 2013, excluding the syndicated loan, and gradually declines over time until 2022 when the
first rollover of the 2012 Eurobond is assumed to take place.
4 Out of the US$650 million, US$250 million would correspond to a syndicated loan. Also, it is assumed that US$1.7 billion would come mainly from sources such as the World Bank, African Development Bank and China Exim Bank. It is also assumed that Zambia will be able to access the non-concessional window of the World Bank and AfDB by 2020. In addition, it is assumed that the degree of concessionality from the China Exim bank’s loans would be lower than 35 percent in the medium-term projection.
PUBLIC INVESTMENT AND GROWTH 5. The impact of new borrowing to finance public infrastructure investment on debt
sustainability depends critically on its impact on growth. A number of empirical studies generally find a
positive impact of public investment on growth both through a direct impact on economic activity and
through spillover effects on private investment.5 Among these studies, Burnside and Dollar (1997) found
that a sustained increase in grant-financed investment by one percent of GDP raised real GDP growth in
low-income countries with good policy implementation on a sustained basis by about 0.4 percentage
points. 6 Gupta et al. (2011) find that the unadjusted output elasticity of public capital would be 0.25
(however, the marginal product of (unadjusted) capital would be around 0.5).7 Also, the growth impact of
public investment on growth is affected by how it is financed. Aschauer (2000) found that external debt
financing of public investment could reduce the impact on growth, depending on the quality and effective
use of the investment, as well as the financing costs.8
6. The baseline scenario projects an increase in capital expenditure in the medium term. The
capital expenditure to GDP ratio would increase from 6.6 percent in 2013 to 8.6 percent in 2018. Between
14 and 18 percent of such increase is assumed to be financed with external borrowing, with a mix of
concessional and non-concessional resources. Based on the empirical studies mentioned above, the
projected increase in capital expenditure would raise real GDP growth by 0.5 percentage points over the
medium term.
5 Romp, W. and J. de Haan (2007), “Public Capital and Economic Growth: A Critical Survey,” Perspektiven der Wirtschaftspolitik 8, 1–140 presents a survey on this topic. 6 Burnside, Craig, and David Dollar (1997), “Aid Spurs Growth in a Sound Policy Environment.” Finance and Development, December 1997. 7 The authors present an alternative measure of efficiency-adjusted capital for which the output elasticity would be around 0.15. 8 Aschauer, D.A. (2000), “Do states optimise? Public capital and economic growth.” The Annals of Regional Science, (34), pp. 343-363.
ZAMBIA
6 INTERNATIONAL MONETARY FUND
EXTERNAL DEBT SUSTAINABILITYBaseline scenario
7. External debt burden indicators rise in the medium term, but are expected to remain below
the indicative policy thresholds (Figure 1 and Table 1).9 The stock of external public and publicly
guaranteed (PPG) debt is expected to rise to almost 23 percent of GDP by 2017 but gradually decline
thereafter. The present value (PV) of PPG debt to GDP increases to about 20 percent by 2017 before
declining to 10 percent by 2033, well below the 40 percent threshold.10 The PV of debt to exports increases
to almost 37 percent by 2017, and falls gradually thereafter, remaining well below the threshold of
150 percent. The PV of PPG debt to revenue increases from 63 percent in 2012 to about 89 percent in 2016
and then starts to fall, remaining below the threshold of 250 percent.11
Stress test
8. External debt sustainability is maintained under all stress tests. However, the PV of PPG debt
to GDP ratio almost reaches the threshold in 2015 and 2016 under the export shock (Table 3 and
Figure 3).12 The PV of the PPG debt to GDP ratio reaches a higher level by 2023 compared to the results of
the other stress tests. This scenario illustrates Zambia’s vulnerability to copper price and copper output
volatility and the need to diversify its export base.
9. External debt indicators would deteriorate, but remain below their respective thresholds,
under an alternative high investment-low growth scenario. This scenario assumes that there are
constraints in the appraisal, selection and project implementation capacity of public investment projects in
the medium term, which are not mitigated through the implementation of PFM reforms. In this context and
9 The World Bank’s Country Policy and Institutions Assessment (CPIA) ranks Zambia as a medium performer (the average 2010–12 CPIA score is 3.45). Thus, the external debt burden thresholds for Zambia are (i) a PV of debt-to-GDP at 40 percent; (ii) a PV of debt-to-exports at 150 percent; (iii) a PV of debt-to-revenue at 250 percent; (iv) a debt service-to-exports at 20 percent; and (v) a debt service-to-revenue at 20 percent. 10 Present Values (PV) are calculated based on a 5 percent annual discount. 11 The large residuals in Table 1 are caused by the fact that the official balance of payments statistics for Zambia show the (mostly foreign owned) mining companies as keeping a large share of their mining export proceeds as rapidly increasing deposits abroad. 12 Care is needed with the interpretation of the export shock in the case of Zambia. Given that not all the copper export proceeds return to the country because most mine companies are foreign-owned, the assumption under the export shock that losses in export proceeds are compensated with external debt is overestimating the impact of the shock. Staff estimates that at least 40 percent of copper exports do not return to the country. The shock is defined as the export value growth at historical average minus one standard deviation in 2014–2015.
ZAMBIA
INTERNATIONAL MONETARY FUND 7
based on the discussion provided in paragraphs 4 and 5, real GDP growth would remain about
0.5 percentage points below the baseline in the medium and long term. In addition, we assume that the
decline in GDP growth will have a negative impact on export growth, in particular for non-traditional
exports, due to lower infrastructure capacity (for the purpose of this exercise it is assumed that the
calculated decline in GDP growth would reduce the exports-to-GDP ratio by two percentage points in the
medium term and one percentage point in the long term). The lower growth would result in lower
domestic revenues and a higher financing requirement that are assumed to be met by additional external
borrowing on commercial terms. The additional financing would rise to about 1 percent of GDP in the
medium term. Under this scenario, the ratio of the PV of PPG debt-to-GDP increases by 11 percentage
points by 2018 compared to the baseline but remains below the threshold.
PUBLIC DEBT SUSTAINABILITYBaseline scenario
10. Zambia’s public debt rises slightly in the medium term, but declines gradually over time,
assuming that the government will implement front-loaded fiscal adjustment. Under the baseline
assumptions, the PV of public debt to GDP ratio would reach levels of about 37 percent in the medium-
term and then comes down to about 32 percent by 2033.
Stress test
11. Risks to public debt dynamics come mainly from the possibility of a failure to implement
front-loaded fiscal adjustment and negative shocks to GDP growth. The results under the fixed
primary balance scenario (holding the primary balance unchanged at the 2013 value) underscores the
negative effects on public debt sustainability of not maintaining fiscal discipline over the medium term
(Figure 2 and Table 2). This scenario reinforces staff recommendations for undertaking a front-loaded fiscal
consolidation path. Under this scenario, PV of debt-to- GDP ratio and PV of debt-to-revenue ratio keep
rising over time. Regarding the bound tests, risk would mainly come from lower GDP growth. This risk
underscores both the need for Zambia to diversify its production structure to mitigate vulnerabilities
related to potential declines in mining production in the long term and to improve public investment
management in order to ensure productivity-enhancing investments.
ZAMBIA
8 INTERNATIONAL MONETARY FUND
CONCLUSIONS 12. Zambia is considered at low risk of debt distress. The external debt indicators remain below
their thresholds in the baseline scenario and bound tests. The public debt DSA also suggests that Zambia’s
overall public sector debt dynamics would be sustainable under the baseline scenario. On the other hand,
the fixed primary balance scenario demonstrates the need for an improved fiscal position. Finally, in
addition to sound macroeconomic policies and debt management strengthening, developing project
appraisal capacity and diversification of the export base are needed in order to maintain productivity-
enhancing investments and debt sustainability in the face of access to international markets and a gradual
increase in non-concessional borrowing.
ZAMBIA
INTERNATIONAL MONETARY FUND 9
Sources: Country authorities; and staff estimates and projections.
Figure 1. Zambia: Indicators of Public and Publicly Guaranteed External Debt under Alternatives Scenarios, 2013-2033 1/
1/ The most extreme stress test is the test that yields the highest ratio in 2023. In figure b. it corresponds to an Exports shock; in c. to a Exports shock; in d. to a Exports shock; in e. to a Exports shock and in figure f. to a Exports shock
Sources: Country authorities; and staff estimates and projections.1/ The most extreme stress test is the test that yields the highest ratio in 2023. 2/ Revenues are defined inclusive of grants.
Figure 2.Zambia: Indicators of Public Debt Under Alternative Scenarios, 2013-2033 1/
Grant-equivalent financing (in percent of GDP) 8/ ... ... ... 1.6 1.2 1.4 1.2 1.0 1.0 0.5 0.2 0.3Grant-equivalent financing (in percent of external financing) 8/ ... ... ... 50.0 18.4 25.4 23.9 23.4 31.4 46.7 7.7 23.1
Memorandum items:Nominal GDP (Billions of US dollars) 16.2 19.2 20.6 22.6 25.6 28.3 31.4 34.9 38.8 63.0 142.8Nominal dollar GDP growth 26.4 18.6 7.2 9.7 13.1 10.9 10.8 11.1 11.1 11.1 9.6 8.3 9.1PV of PPG external debt (in Billions of US dollars) 2.7 3.0 4.2 5.2 6.1 7.0 7.5 8.0 14.3(PVt-PVt-1)/GDPt-1 (in percent) 1.4 5.4 3.6 3.2 2.8 1.7 3.0 0.2 1.3 0.5Gross workers' remittances (Billions of US dollars) 0.0 0.0 0.1 0.1 0.1 0.1 0.1 0.1 0.1 0.2 0.3PV of PPG external debt (in percent of GDP + remittances) ... ... 13.3 13.4 16.8 18.4 19.5 20.1 19.6 12.7 10.1PV of PPG external debt (in percent of exports + remittances) ... ... 27.5 26.6 32.1 34.2 35.7 36.5 35.6 23.4 20.8Debt service of PPG external debt (in percent of exports + remittances) ... ... 2.7 1.8 2.3 2.7 3.1 3.1 2.8 1.8 2.2
Sources: Country authorities; and staff estimates and projections.
1/ Includes both public and private sector external debt.2/ Derived as [r - g - ρ(1+g)]/(1+g+ρ+gρ) times previous period debt ratio, with r = nominal interest rate; g = real GDP growth rate, and ρ = growth rate of GDP deflator in U.S. dollar terms. 3/ Includes exceptional financing (i.e., changes in arrears and debt relief); changes in gross foreign assets; and valuation adjustments. For projections also includes contribution from price and exchange rate changes.4/ Assumes that PV of private sector debt is equivalent to its face value.5/ Current-year interest payments divided by previous period debt stock. 6/ Historical averages and standard deviations are generally derived over the past 10 years, subject to data availability. 7/ Defined as grants, concessional loans, and debt relief.8/ Grant-equivalent financing includes grants provided directly to the government and through new borrowing (difference between the face value and the PV of new debt).
PV of contingent liabilities (not included in public sector debt) ... ... ... ... ... ... ... ... ... ... ...Gross financing need 2/ 9.3 7.9 11.0 15.4 15.6 14.4 14.0 13.2 11.8 12.9 15.1PV of public sector debt-to-revenue and grants ratio (in percent) … … 122.4 148.7 154.4 158.0 159.1 155.0 143.8 129.6 131.3PV of public sector debt-to-revenue ratio (in percent) … … 132.3 156.0 165.1 167.8 167.6 161.5 148.7 130.9 131.5
of which: external 3/ … … 63.2 67.5 82.1 87.0 89.3 88.1 81.9 53.2 42.1Debt service-to-revenue and grants ratio (in percent) 4/ 15.2 10.9 17.6 16.5 20.3 21.1 21.2 20.3 18.4 17.8 21.4Debt service-to-revenue ratio (in percent) 4/ 16.7 11.3 19.0 17.3 21.7 22.4 22.4 21.2 19.0 18.0 21.5Primary deficit that stabilizes the debt-to-GDP ratio 2.6 -1.0 -4.4 3.5 2.9 2.3 2.2 2.3 2.5 2.4 1.9
Key macroeconomic and fiscal assumptionsReal GDP growth (in percent) 7.6 6.8 7.2 6.2 0.8 6.0 7.3 7.5 7.6 7.6 7.7 7.3 6.2 5.0 5.7Average nominal interest rate on forex debt (in percent) 0.6 0.9 1.8 1.1 0.6 2.4 3.4 4.0 4.4 4.7 4.8 3.9 4.5 4.5 4.4Average real interest rate on domestic debt (in percent) 1.7 -3.1 5.4 0.2 2.9 3.4 5.0 7.1 7.1 6.8 6.6 6.0 6.6 6.6 6.6Real exchange rate depreciation (in percent, + indicates depreciation -6.2 -3.1 -3.3 -7.7 11.2 -1.7 ... ... ... ... ... ... ... ... ...Inflation rate (GDP deflator, in percent) 11.7 12.5 5.9 13.7 4.6 7.6 7.2 5.9 5.1 5.0 5.0 6.0 5.0 5.0 5.0Growth of real primary spending (deflated by GDP deflator, in percen 0.1 0.2 0.1 0.1 0.1 0.2 0.0 0.0 0.1 0.1 0.1 0.1 0.1 0.1 0.1Grant element of new external borrowing (in percent) ... ... ... … … 27.9 -4.1 1.3 0.6 1.3 7.5 5.7 30.9 5.8 ...
Sources: Country authorities; and staff estimates and projections.1/ [Indicate coverage of public sector, e.g., general government or nonfinancial public sector. Also whether net or gross debt is used.]2/ Gross financing need is defined as the primary deficit plus debt service plus the stock of short-term debt at the end of the last period. 3/ Revenues excluding grants.4/ Debt service is defined as the sum of interest and amortization of medium and long-term debt.5/ Historical averages and standard deviations are generally derived over the past 10 years, subject to data availability.
Table 2.Zambia: Public Sector Debt Sustainability Framework, Baseline Scenario, 2010-2033(In percent of GDP, unless otherwise indicated)
Actual Projections
ZAMBIA
12 IN
TERNATIO
NAL M
ON
ETARY FUN
D
ZAMBIA
INTERNATIONAL MONETARY FUND 13
2013 2014 2015 2016 2017 2018 2023 2033
Baseline 13 17 18 20 20 20 13 10
A. Alternative Scenarios
A1. Key variables at their historical averages in 2013-2033 1/ 13 19 23 27 30 31 29 10A2. New public sector loans on less favorable terms in 2013-2033 2 13 17 19 21 23 23 17 15A3. Alternative Scenario :[Higher investment-Lower growth] 13 19 22 25 27 29 24 22
B. Bound Tests
B1. Real GDP growth at historical average minus one standard deviation in 2014-2015 13 17 19 20 21 20 13 10B2. Export value growth at historical average minus one standard deviation in 2014-2015 3/ 13 25 40 40 39 38 24 12B3. US dollar GDP deflator at historical average minus one standard deviation in 2014-2015 13 18 21 23 23 23 15 12B4. Net non-debt creating flows at historical average minus one standard deviation in 2014-2015 4/ 13 21 27 28 28 27 17 11B5. Combination of B1-B4 using one-half standard deviation shocks 13 22 28 29 29 28 18 11B6. One-time 30 percent nominal depreciation relative to the baseline in 2014 5/ 13 23 26 27 28 27 18 14
Baseline 27 32 34 36 37 36 23 21
A. Alternative Scenarios
A1. Key variables at their historical averages in 2013-2033 1/ 27 37 44 49 54 57 53 21A2. New public sector loans on less favorable terms in 2013-2033 2 27 32 36 39 41 41 30 32A3. Alternative Scenario :[Higher investment-Lower growth] 27 37 43 48 52 54 45 47
B. Bound Tests
B1. Real GDP growth at historical average minus one standard deviation in 2014-2015 27 32 34 36 36 35 23 21B2. Export value growth at historical average minus one standard deviation in 2014-2015 3/ 27 56 102 100 98 94 61 34B3. US dollar GDP deflator at historical average minus one standard deviation in 2014-2015 27 32 34 36 36 35 23 21B4. Net non-debt creating flows at historical average minus one standard deviation in 2014-2015 4/ 27 41 51 51 51 49 32 22B5. Combination of B1-B4 using one-half standard deviation shocks 27 42 53 54 54 52 34 23B6. One-time 30 percent nominal depreciation relative to the baseline in 2014 5/ 27 32 34 36 36 35 23 21
Baseline 67 82 87 89 88 82 53 42
A. Alternative Scenarios
A1. Key variables at their historical averages in 2013-2033 1/ 67 94 110 122 130 130 121 43A2. New public sector loans on less favorable terms in 2013-2033 2 67 81 92 98 99 95 69 64A3. Alternative Scenario :[Higher investment-Lower growth] 67 91 105 115 120 119 100 92
B. Bound Tests
B1. Real GDP growth at historical average minus one standard deviation in 2014-2015 67 82 89 92 91 84 55 43B2. Export value growth at historical average minus one standard deviation in 2014-2015 3/ 67 120 188 182 172 157 102 51B3. US dollar GDP deflator at historical average minus one standard deviation in 2014-2015 67 89 101 104 102 95 62 49B4. Net non-debt creating flows at historical average minus one standard deviation in 2014-2015 4/ 67 104 128 127 122 112 73 45B5. Combination of B1-B4 using one-half standard deviation shocks 67 107 133 132 127 117 75 47B6. One-time 30 percent nominal depreciation relative to the baseline in 2014 5/ 67 113 120 124 122 113 73 58
PV of debt-to-exports ratio
PV of debt-to-revenue ratio
Table 3.Zambia: Sensitivity Analysis for Key Indicators of Public and Publicly Guaranteed External Debt, 2013-2033(In percent)
PV of debt-to GDP ratio
Projections
ZAMBIA
14 INTERNATIONAL MONETARY FUND
Baseline 2 2 3 3 3 3 2 2
A. Alternative Scenarios
A1. Key variables at their historical averages in 2013-2033 1/ 2 2 3 3 3 3 3 3A2. New public sector loans on less favorable terms in 2013-2033 2 2 2 2 2 3 3 3 4A3. Alternative Scenario :[Higher investment-Lower growth] 2 2 3 4 4 4 3 5
B. Bound Tests
B1. Real GDP growth at historical average minus one standard deviation in 2014-2015 2 2 3 3 3 3 2 2B2. Export value growth at historical average minus one standard deviation in 2014-2015 3/ 2 3 5 7 6 6 7 4B3. US dollar GDP deflator at historical average minus one standard deviation in 2014-2015 2 2 3 3 3 3 2 2B4. Net non-debt creating flows at historical average minus one standard deviation in 2014-2015 4/ 2 2 3 4 4 3 3 3B5. Combination of B1-B4 using one-half standard deviation shocks 2 2 3 4 4 4 3 3B6. One-time 30 percent nominal depreciation relative to the baseline in 2014 5/ 2 2 3 3 3 3 2 2
Baseline 5 6 7 8 7 6 4 5
A. Alternative Scenarios
A1. Key variables at their historical averages in 2013-2033 1/ 5 6 7 8 8 7 7 5A2. New public sector loans on less favorable terms in 2013-2033 2 5 6 5 6 6 6 6 7A3. Alternative Scenario :[Higher investment-Lower growth] 5 6 7 9 9 8 8 10
B. Bound Tests
B1. Real GDP growth at historical average minus one standard deviation in 2014-2015 5 6 7 8 8 7 4 5B2. Export value growth at historical average minus one standard deviation in 2014-2015 3/ 5 6 9 12 11 10 11 6B3. US dollar GDP deflator at historical average minus one standard deviation in 2014-2015 5 6 8 9 9 7 5 5B4. Net non-debt creating flows at historical average minus one standard deviation in 2014-2015 4/ 5 6 8 10 9 8 7 5B5. Combination of B1-B4 using one-half standard deviation shocks 5 6 8 10 9 8 7 5B6. One-time 30 percent nominal depreciation relative to the baseline in 2014 5/ 5 8 10 11 10 9 6 6
Sources: Country authorities; and staff estimates and projections.
1/ Variables include real GDP growth, growth of GDP deflator (in U.S. dollar terms), non-interest current account in percent of GDP, and non-debt creating flows. 2/ Assumes that the interest rate on new borrowing is by 2 percentage points higher than in the baseline., while grace and maturity periods are the same as in the baseline.3/ Exports values are assumed to remain permanently at the lower level, but the current account as a share of GDP is assumed to return to its baseline level after the shock (implicitly assumingan offsetting adjustment in import levels). 4/ Includes official and private transfers and FDI.5/ Depreciation is defined as percentage decline in dollar/local currency rate, such that it never exceeds 100 percent.6/ Applies to all stress scenarios except for A2 (less favorable financing) in which the terms on all new financing are as specified in footnote 2.
Debt service-to-exports ratio
Table 3.Zambia: Sensitivity Analysis for Key Indicators of Public and Publicly Guaranteed External Debt, 2013-2033 (continued)(In percent)
Debt service-to-revenue ratio
ZAMBIA
INTERNATIONAL MONETARY FUND 15
Table 4.Zambia: Sensitivity Analysis for Key Indicators of Public Debt 2013-2033
2013 2014 2015 2016 2017 2018 2023 2033
Baseline 31 34 36 37 37 36 31 32
A. Alternative scenarios
A1. Real GDP growth and primary balance are at historical averages 31 27 24 21 18 15 -3 -27A2. Primary balance is unchanged from 2013 31 36 40 45 49 53 67 98A3. Permanently lower GDP growth 1/ 31 34 36 37 37 37 34 40
B. Bound tests
B1. Real GDP growth is at historical average minus one standard deviations in 2014-20 31 35 38 40 41 40 39 46B2. Primary balance is at historical average minus one standard deviations in 2014-201 31 34 37 38 38 37 32 32B3. Combination of B1-B2 using one half standard deviation shocks 31 31 31 33 34 34 33 39B4. One-time 30 percent real depreciation in 2014 31 40 41 42 42 41 37 38B5. 10 percent of GDP increase in other debt-creating flows in 2014 31 44 45 46 45 44 38 36
Baseline 149 154 158 159 155 144 130 131
A. Alternative scenarios
A1. Real GDP growth and primary balance are at historical averages 149 124 107 91 75 59 -13 -113A2. Primary balance is unchanged from 2013 149 163 179 195 206 212 276 408A3. Permanently lower GDP growth 1/ 149 155 159 161 157 147 140 166
B. Bound tests
B1. Real GDP growth is at historical average minus one standard deviations in 2014-20 149 159 169 173 172 163 163 190B2. Primary balance is at historical average minus one standard deviations in 2014-201 149 154 163 164 159 148 133 134B3. Combination of B1-B2 using one half standard deviation shocks 149 140 137 143 143 136 138 164B4. One-time 30 percent real depreciation in 2014 149 181 183 183 178 166 152 160B5. 10 percent of GDP increase in other debt-creating flows in 2014 149 199 199 197 190 176 155 150
Baseline 17 20 21 21 20 18 18 21
A. Alternative scenarios
A1. Real GDP growth and primary balance are at historical averages 17 20 20 16 15 13 8 -2A2. Primary balance is unchanged from 2013 17 20 22 23 23 23 28 47A3. Permanently lower GDP growth 1/ 17 20 21 21 21 19 19 25
B. Bound tests
B1. Real GDP growth is at historical average minus one standard deviations in 2014-20 17 21 22 22 22 20 20 27B2. Primary balance is at historical average minus one standard deviations in 2014-201 17 20 21 21 21 19 18 22B3. Combination of B1-B2 using one half standard deviation shocks 17 21 21 19 19 18 18 25B4. One-time 30 percent real depreciation in 2014 17 22 24 25 24 22 21 27B5. 10 percent of GDP increase in other debt-creating flows in 2014 17 20 23 28 22 21 21 23
Sources: Country authorities; and staff estimates and projections.1/ Assumes that real GDP growth is at baseline minus one standard deviation divided by the square root of the length of the projection period.2/ Revenues are defined inclusive of grants.
PV of Debt-to-GDP Ratio
Projections
PV of Debt-to-Revenue Ratio 2/
Debt Service-to-Revenue Ratio 2/
Press Release No. 13/535 FOR IMMEDIATE RELEASE December 19, 2013
IMF Executive Board Concludes 2013 Article IV Consultation with Zambia
On December 11, 2013, the Executive Board of the International Monetary Fund (IMF) concluded the Article IV consultation with Zambia. 1
Zambia has achieved strong and sustained economic growth over the past decade due to improved macroeconomic management and increased copper production; however, risks have over the past year increased with rising fiscal imbalances and lower reserve coverage. Robust output growth continued in 2012 at slightly above 7 percent, driven by agriculture and services, but is slowing in 2013 due to a weaker harvest. Expansionary fiscal policies, mainly from spending on subsidies and wages, have raised the projected 2013 deficit to about 8½ percent of GDP. Rising imports together with weakened copper prices are expected to move the current account into deficit, and international reserve coverage has fallen to 2.3 months of next year’s imports. Inflation has remained contained as monetary policy has been gradually tightened. With the Central Bank having raised its policy rate in two steps of 25 basis points each, consumer price inflation is projected to stay broadly unchanged at 7½ percent in 2013 despite the withdrawal of fuel and agricultural subsidies earlier this year, as well as the more recent increase in civil service wages. The nominal exchange rate has depreciated recently, but has remained broadly in line with inflation differentials to trading partners. The banking sector has grown steadily and remains profitable and well-capitalized. Private sector credit growth has started slowing down in 2013 from a rapid increase in the second half of 2012. Nonperforming loans declined to 8.2 percent of total loans in mid-2013 from 15 percent in 2010. Over the medium term, economic growth is expected to stay strong, averaging about 7½ percent a year. However, this is premised on significant policy adjustment to restore
1 Under Article IV of the IMF's Articles of Agreement, the IMF holds bilateral discussions with members, usually every year. A staff team visits the country, collects economic and financial information, and discusses with officials the country's economic developments and policies. On return to headquarters, the staff prepares a report, which forms the basis for discussion by the Executive Board.
International Monetary Fund Washington, D.C. 20431 USA
2
fiscal sustainability and preservation of the investment climate. The authorities are targeting a 3 percent of GDP deficit over the medium term with no more than 1½ percent of GDP net domestic financing. In order to help achieve this, the government is planning a wage and net recruitment freeze for 2014 and is aiming to limit the cost of agricultural subsidies. The central bank aims to build up reserves gradually with the aim to reach 4 months of imports over the medium term. Executive Board Assessment2 Executive Directors welcomed Zambia’s strong economic performance over the past decade, which was underpinned by prudent macroeconomic management over much of this period. Nevertheless, they noted that the outlook is subject to significant risks from the recent widening of fiscal imbalances, reduced external buffers, and volatile copper prices. Directors therefore recommended containing the fiscal deficit, accelerating public financial management reforms, strengthening external buffers, and improving the business environment to help diversify the economy away from mining and accelerate poverty reduction. Directors called for comprehensive policy actions to address the unsustainable fiscal position following the spike in wage and subsidy spending last year. Noting the rapidly rising public debt and substantial downside risks to the budget, they recommended fiscal consolidation through increased revenue mobilization and a reorientation away from recurrent spending, to create fiscal space for infrastructure investment and control of the public debt. Directors welcomed the authorities’ plans to freeze wage spending in 2014 and limit the cost of agricultural subsidies. They advised that raising the tax-free threshold on personal income taxes runs counter to fiscal consolidation efforts and recommended accelerating revenue mobilization through changes in tax policy, enhanced mining tax administration, and broadening the tax base. Directors called for strengthening public financial management through improvements in budget planning, fiscal reporting, expenditure controls and debt management combined with stricter oversight and accountability. Strengthening debt management and project assessment capacity is critical, given the planned rise in infrastructure spending and recourse to non-concessional borrowing. Noting the inherent risks, Directors advised against issuance of the proposed sub-national Eurobonds in favor of sovereign bonds, and stressed that all external borrowing should be subject to project appraisal and screened for consistency with macroeconomic stability, debt sustainability and the overall debt management strategy.
2 At the conclusion of the discussion, the Managing Director, as Chairman of the Board, summarizes the views of Executive Directors, and this summary is transmitted to the country's authorities. An explanation of any qualifiers used in summings up can be found here: http://www.imf.org/external/np/sec/misc/qualifiers.htm.
3
Directors agreed that rising inflationary pressures warrant a tighter monetary stance. They welcomed progress in transitioning the monetary framework toward utilizing the policy rate and recommended improving liquidity forecasting and management. Directors advised rebuilding external buffers through enhanced exchange rate flexibility and further reserve accumulation. Directors welcomed recent improvements in Zambia’s ranking in the World Bank’s Doing Business Index, but called for improved policy consistency. They cautioned that the imposition of lending rate ceilings, restrictions on the use of foreign exchange, and rapid increases in minimum wages could undermine external competitiveness and erode investor confidence. Directors advised that financial intermediation could be better strengthened through enhanced competition and improved efficiency. Directors also recommended that the remaining exchange restrictions on current account transactions be removed expeditiously.
4
Zambia: Selected Economic Indicators, 2011–14
2011 2012 2013 2014
Baseline Scenario Actual Proj.
(Percentage Change)
National account and prices
GDP growth at constant prices 6.8 7.2 6.0 7.3
Mining -5.2 -2.7 12.0 13.2
Non mining 8.2 8.2 5.5 6.7
GDP deflator 12.5 5.9 7.6 7.2
GDP at market prices (millions of kwacha) 93,344 105,983 120,952 139,113
Consumer prices
Consumer prices (average) 8.7 6.6 7.1 7.0
Consumer prices (end of period) 7.2 7.3 7.5 6.5
External sector
Terms of trade (deterioration -) 4.4 -12.5 -3.9 1.4
Average exchange rate (kwacha per U.S. dollar) 4.861 5.147 … …
(percentage change; depreciation -) -1.3 -5.9 … …
Real effective exchange rate (depreciation -)1 -2.6 3.3 … …
Money and credit (end of period, unless otherwise specified)
Domestic credit to the private sector 28.2 37.0 10.0 18.0
Reserve money (end of period) 6.8 51.4 -9.6 18.0
Broad Money (M3) 21.7 17.9 18.2 19.6
(Percent of GDP; unless otherwise indicated)
National accounts
Gross investment 23.5 24.8 24.8 25.2
Government 4.2 6.5 6.6 7.2
Private 19.3 18.3 18.1 18.0
National savings 27.1 24.9 23.4 24.5
Net lending(+)/net borrowing(-) 3.7 0.1 -1.3 -0.6
Central government budget
Revenue 21.7 22.7 20.9 22.0
Taxes 19.3 18.2 17.2 16.9
Grants 0.8 1.7 1.0 1.4
Other revenue 1.6 2.9 2.7 3.7
Expenditure 23.9 26.0 29.5 29.4
Expense 19.7 19.6 22.9 22.2
Net acquisition of nonfinancial assets 4.2 6.5 6.6 7.2
Fiscal Measures … … 0.0 1.1
Net lending/borrowing2 -1.2 -2.7 -8.6 -6.3
Excluding grants -2.0 -4.4 -9.6 -7.8
5
Net acquisition of financial assets 2.4 2.0 -1.5 0.7 Domestic 2.4 2.0 -1.5 0.7 Foreign 0.0 0.0 0.0 0.0
Net incurrance of liabilities 3.6 4.7 6.4 7.0
Domestic 2.4 1.1 4.8 2.0
Foreign 1.2 3.7 1.7 5.0
External sector
Current account balance 3.7 0.1 -1.3 -0.6
(excluding grants) 2.9 -0.6 -2.0 -1.6
Gross International Reserves (months of prospective imports) 2.8 2.7 2.3 2.5
Excluding FDI-financed imports 3.3 3.1 2.6 2.8
Public debt
Total central government debt, net (end-period) 20.1 24.2 30.3 33.0
External 10.2 16.3 16.5 19.7
Stock of domestic debt, net 9.8 7.9 13.8 13.3
Memorandum item: Gross national income per capita (US$) 1,408 1,463 … …
Sources: Zambian authorities; and IMF staff estimates and projections. 1 Excludes Zimbabwe. 2 Including discrepancy between the above-the-line balance and below-the-line financing.
Statement by Mr. Saho, Executive Director for Zambia
December 11, 2013 1. The Zambian authorities welcome the completion of the 2013 Article IV consultations and the Board’s consideration. The authorities have had thorough and wide-ranging discussions with staff, particularly around the priorities of the new Government as it tackles the challenges of an unacceptably high level of poverty and inequality, whilst maintaining robust economic growth and macroeconomic stability. This concern has necessitated the adoption of a higher fiscal deficit profile over the medium term than was originally envisaged. 2. Whilst there are many areas in which the authorities agree with Fund staff, they do have areas of significant differences in terms of policy priorities and the emerging risks to strong growth and poverty reduction over the medium to long term. In particular, the authorities’ views differ from the assessment of Fund staff in several key areas: (1) outlook, risks and the fiscal stance; (2) public financial management (PFM); (3) monetary policy; and (4) competitiveness.
A. Authorities’ views on selected key areas Outlook, risks, and the fiscal stance 3. The authorities’ projections for growth of an average of 7.5 percent over the medium term are consistent with those of the Fund staff. They are also looking to achieve fiscal consolidation over the medium term towards a deficit of no more than 3 percent of GDP. They do not, however, agree that such fiscal consolidation should be front-loaded. On the contrary, they believe that such front-loaded fiscal consolidation would substantially impair critical investment in the energy and transport sectors – investment that is critical for strong growth and improved competitiveness. In addition, the Government is committed to substantially improving education and health outcomes in terms of both the availability and quality of health and education services. Both of these actions are critical to reduce poverty and inequality and to preserve peace and stability that Zambia has enjoyed since independence. 4. The authorities acknowledge and agree with Fund staff that improving Zambia’s fiscal position will require fundamental reforms that enable them to contain the wage bill and recurrent expenditures, and boost their revenue base. They would, however, welcome greater engagement and more innovative thinking around how the Government can better balance the need to manage its wage bill against its commitment to improve health and education outcomes through improved services and infrastructure. They note that the health and education sectors account for approximately 70 percent of the civil service workforce. Be that as it may, achieving the MDG targets, such as improving maternal
health and the education outcomes and opportunities for their children, will require more and better qualified teachers that will help to reduce pupil teacher ratios, as well as more health personnel to reduce the number of mothers giving birth without qualified attendants. The current health and education sectors are estimated to require additional 20,000 personnel each, if they are to achieve their MDG targets. While one way to address these challenges is improvements in labor productivity, such improvements will require greater use of technology (e-governance), which is expensive to implement and will need a medium- to long-term horizon to fully implement – with implications for the budget deficit. 5. In the authorities’ view, failure to undertake these tasks poses a bigger threat to Zambia’s long term growth prospects and the probability of reducing poverty and inequality than failure to implement front-loaded fiscal consolidation. Therefore, the fiscal stance that has been adopted by the authorities reflects the new Government’s strategy to address the constraints placed on economic growth by the low investments in infrastructure over the past years. However, the authorities remain committed to a tighter fiscal stance in the medium term, as the bottlenecks to growth are loosened. Public financial management (PFM) 6. The authorities broadly concur with the views of Fund staff on the need to revitalize reforms that will help to improve the quality and effectiveness of their expenditures. This will require them to significantly improve their institutional framework and arrangements in the areas of cash and financial management, planning and budgeting, as well as investment planning and debt management. The authorities are committed to these tasks and have already engaged their international cooperating partners for support. In 2014, for example, the Ministry of Finance will develop a planning and budgeting policy, and present a planning and budgeting bill to Parliament. Monetary policy 7. Zambia’s monetary policy has successfully reduced inflation, whilst maintaining a flexible exchange rate regime, as evidenced by the achievement and maintenance of single-digit inflation. In addition, recent work by Fund staff, suggests that the exchange rate is not misaligned. Therefore, the authorities are concerned that Fund staff continues to advocate for greater flexibility in the exchange rate, when the Bank of Zambia (BOZ) has allowed the exchange rate to fluctuate – sometimes significantly, such as during the global financial crisis. The BOZ currently intervenes to contain excessive volatility, which undermines the primary monetary policy goal of achieving low inflation and more broadly economic growth. It should also be noted that regulations such as the Statutory Instrument (SI) 33 of 2012, which prohibits the pricing and quoting of domestic transactions in foreign currency, were intended to address the issue of dollarization and thereby strengthen the transmission mechanism of monetary policy.
Competitiveness 8. The authorities acknowledge the concerns raised by staff on the potential adverse impact of recent regulations on the competitiveness of the Zambian economy. However, they believe that many of these concerns are misplaced. One of the key impediments to improving competitiveness in Zambia has been poor infrastructure and shortage of skilled labor. Staff in fact acknowledges empirical work that suggests that Zambia’s infrastructure deficit relative to its regional neighbors, such as Mauritius, potentially cost the country 2 – 3 percent of GDP per annum. The Government’s public investment strategy is squarely aimed at addressing these impediments. The authorities do not believe that the recent policy actions such as the increase in the minimum wage and strengthened monitoring of the external sector make the business environment worse. On the contrary, they believe that these actions will allow for productivity gains and improved macroeconomic management for the greater benefit of businesses and households.
B. Recent economic developments, outlook and risks 9. Despite several challenges, Zambia’s economy continues to grow strongly, anchored on sound macroeconomic policies and a favorable business climate. Output grew by 7.2 percent in 2012, and averaged 6.3 percent between 2004 and 2012, according to the October 2013 Regional Economic Outlook for Sub-Saharan Africa. Growth in 2012 was driven mainly by agricultural, construction, and communication sectors. At the same time, inflation has remained broadly consistent with expectations and was 7 percent in November 2013. In response, the Bank of Zambia’s Monetary Policy Committee decided in November 2013 to maintain its policy rate at 9.75 percent. 10. As a result of prudent fiscal policy management, budget performance has improved consistently over time, with the deficit excluding grants declining from 8.4 percent of GDP in 2004 to about 4 percent in 2012. Despite pressures from the recent wage increase, the authorities remain committed to a sustainable fiscal policy stance. 11. Meanwhile, the external sector position was characteristic of solid economic performance, with staff analysis not showing a real exchange rate misalignment. The current account was broadly balanced in 2012; and foreign direct investment strong. According to the REO (October 2013), FDI flows increased sharply and reached 5 percent of GDP in 2012, in response to rising copper prices and Zambia’s relatively favorable business environment. 12. The financial sector is characterized by profitable and well-capitalized banks. Private sector credit remains strong and non-performing loans are declining.
C. Request for waiver of non-observance of performance criterion 13. The Zambian authorities deeply regret the unintentional misreporting, and request a waiver for non-observance of a performance criterion (PC) under the ECF arrangement
that expired in June 2011. As explained in EBS/13/147, the misreporting relates to two loans that were contracted during Zambia’s ECF arrangement, each with a grant element less than 35 percent. 14. In line with the Managing Director’s report, the authorities have explained the circumstances under which the Lusaka Stadium Project and the Mobile Hospital Project were not reported to the Fund at the time of the fifth and sixth reviews in December 2010 and June 2011, respectively. At the time, the two loans did not appear on the Ministry of Finance’s database, due to coordination gaps between different units of the debt management department. In addition, officers responsible for debt management had determined, prior to the contracting of these loans, that they would meet the 35 percent grant element threshold. However, based on revised calculations, they fell slightly short of the threshold. 15. The authorities are taking necessary action to strengthen debt management. To deal with the gaps in coordination, the Ministry of Finance have developed a Public Debt Procedures Manual, aimed at providing guidance and direction to all stakeholders involved in debt management. Also, the authorities have instructed government creditors to inform the relevant unit whenever a disbursement takes place. At the same time, relevant units now undertake regular bi-monthly internal reconciliation. Furthermore, the authorities are working on a broader Debt Management Reform Plan that was finalized earlier this year, in collaboration with the World Bank. The plan addresses key debt management issues, including strengthening of the legal framework, developing a debt management strategy, and improving operational risk management. The authorities have also committed to sharing with the Fund team the terms of all future external loan agreements prior to their signing, for a proper assessment of their concessionality.
D. Conclusion 16. My Zambian authorities have resolved to step up infrastructure development, to build on the economy’s strong track record of macroeconomic performance. Despite resource and capacity constraints, they will continue to work closely with the Fund and other international development partners in an effort to improve the welfare of the Zambians.