Page 1
© 2016 International Monetary Fund
IMF Country Report No. 16/82
INDONESIA SELECTED ISSUES
This Selected Issues paper on Indonesia was prepared by a staff team of the International
Monetary Fund as background documentation for the periodic consultation with the
member country. It is based on the information available at the time it was completed on
February 8, 2016.
Copies of this report are available to the public from
International Monetary Fund Publication Services
PO Box 92780 Washington, D.C. 20090
Telephone: (202) 623-7430 Fax: (202) 623-7201
E-mail: [email protected] Web: http://www.imf.org
Price: $18.00 per printed copy
International Monetary Fund
Washington, D.C.
March 2016
Page 2
INDONESIA SELECTED ISSUES
Approved By Asia and Pacific
Department
Prepared By Elena Loukoianova, Masahiro Nozaki,
Jongsoon Shin (all APD), Teresa Curristine (FAD),
Ken Miyajima (MCM), and Giovanni Ugazio (STA)
BANKING SECTOR SOUNDNESS IN INDONESIA _______________________________________ 4
A. Introduction _________________________________________________________________________ 4
B. The Landscape _______________________________________________________________________ 4
C. Scenario Analysis ____________________________________________________________________ 7
D. Concluding Remarks ________________________________________________________________ 10
References ______________________________________________________________________________ 13
FIGURES
1. Selected Financial Soundness Indicators, 2014 _______________________________________ 5
2. Bank Asset Quality and Liquidity _____________________________________________________ 6
3. Simulated Increase in NPL Ratio _____________________________________________________ 8
4. Liquid Assets to Overall Short-Term Funding After Simulation ______________________ 10
TABLES
1. Bank Asset Quality and Liquidity ____________________________________________________ 11
2. Bank Financial Soundness Indicators, August 2015 _________________________________ 11
3. Regression Results __________________________________________________________________ 12
4. Parameter Value for Bank Liquidity Scenario Analysis _______________________________ 12
CORPORATE VULNERABILITIES ________________________________________________________ 14
A. Introduction ________________________________________________________________________ 14
B. Corporate Performance and External Debt Risk _____________________________________ 14
C. Bottom-Up Scenario Analysis of Corporate Default Probability in Indonesia ________ 19
D. Concluding Remarks ________________________________________________________________ 21
References ______________________________________________________________________________ 26
CONTENTS
February 8, 2016
Page 3
INDONESIA
2 INTERNATIONAL MONETARY FUND
BOX
1. Bank Indonesia’s Foreign Exchange Regulations on Corporates ____________________ 22
FIGURES
1. Peer Comparison: Leverage—Total Liabilities to Total Asset, 2014 __________________ 15
2. Peer Comparison: Profitability—Return on Assets, 2014 ____________________________ 15
3. Profitability—Return on Assets of Listed Companies ________________________________ 15
4. Peer Comparison: Liquidity—Liquid Assets to Current Liabilities, 2014 _____________ 15
5. Corporate Debt Outstanding _______________________________________________________ 16
6. FX Debt by Industry _________________________________________________________________ 16
7. Annual Gross Issuances of Syndicated Loans and Bonds ____________________________ 16
8. Share of FX Debt Securities _________________________________________________________ 16
9. Maturing Syndicated Loans or Bonds of Corporates ________________________________ 17
10. Maturity of Private Sector’s External Debt __________________________________________ 17
11. Corporate Debt-at-Risk _____________________________________________________________ 18
12. Share of Corporate Debt-at-Risk by Industry _______________________________________ 18
13. Default Probability of Corporates by Country _______________________________________ 18
14. Default Probability of Corporates by Group ________________________________________ 18
15. Schematic of Bottom Up Scenario Analysis _________________________________________ 20
16. Projected Macroeconomic Variables ________________________________________________ 23
17. GDP Growth and Corporate Default Probability ____________________________________ 24
TABLE
1. Data for Simulating Corporate Probability of Default _______________________________ 20
APPENDIX
1. Technical Background ______________________________________________________________ 25
ANALYSIS OF MACRO-FINANCIAL LINKAGES IN INDONESIA _______________________ 27
A. Introduction ________________________________________________________________________ 27
B. Balance Sheet Analysis ______________________________________________________________ 27
C. Panel Vector Autoregression Analysis_______________________________________________ 32
D. Concluding Remarks ________________________________________________________________ 36
References ______________________________________________________________________________ 39
FIGURES
1. BSA Matrix in Network Map Form __________________________________________________ 29
2. Response to Negative Shock to Capital Inflows _____________________________________ 32
3. Macro-Financial Linkages ___________________________________________________________ 35
TABLES
1. BSA Matrix—Intersectoral Net Position, 2014:Q4 ___________________________________ 38
Page 4
INDONESIA
INTERNATIONAL MONETARY FUND 3
2. Sensitivity Analysis Using the BSA—Difference of Intersectoral Net Positions ______ 30
3. BSA VAR Analysis ___________________________________________________________________ 31
4. Estimated Panel VAR Coefficients and t-Statistics ___________________________________ 33
APPENDIX
1. Macro-Financial Impulse Responses ________________________________________________ 37
INFRASTRUCTURE DEVELOPMENT IN INDONESIA ___________________________________ 41
A. Introduction ________________________________________________________________________ 41
B. Macro-Fiscal Implications of Infrastructure Development ___________________________ 43
C. Institutions for Public Investment Management In Indonesia _______________________ 45
D. The Role of SOEs and PPPs in Infrastructure Development _________________________ 46
E. Conclusion __________________________________________________________________________ 51
References ______________________________________________________________________________ 54
BOXES
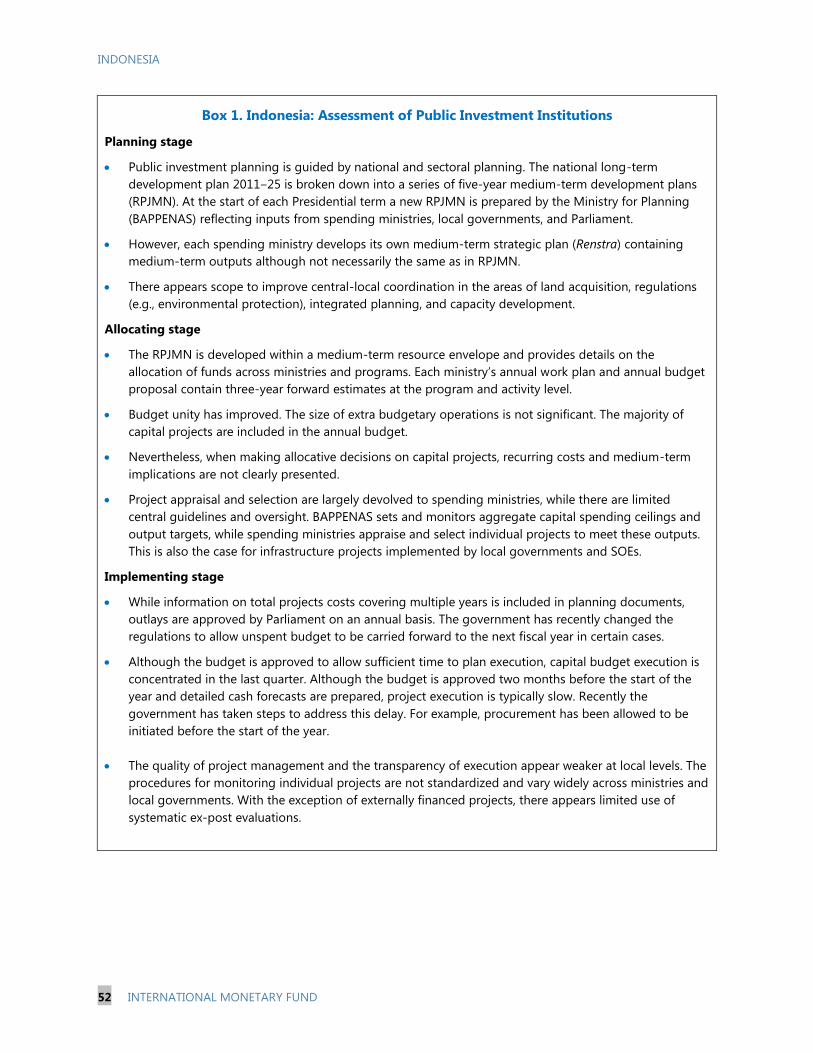
1. Assessment of Public Investment Institutions _______________________________________ 52
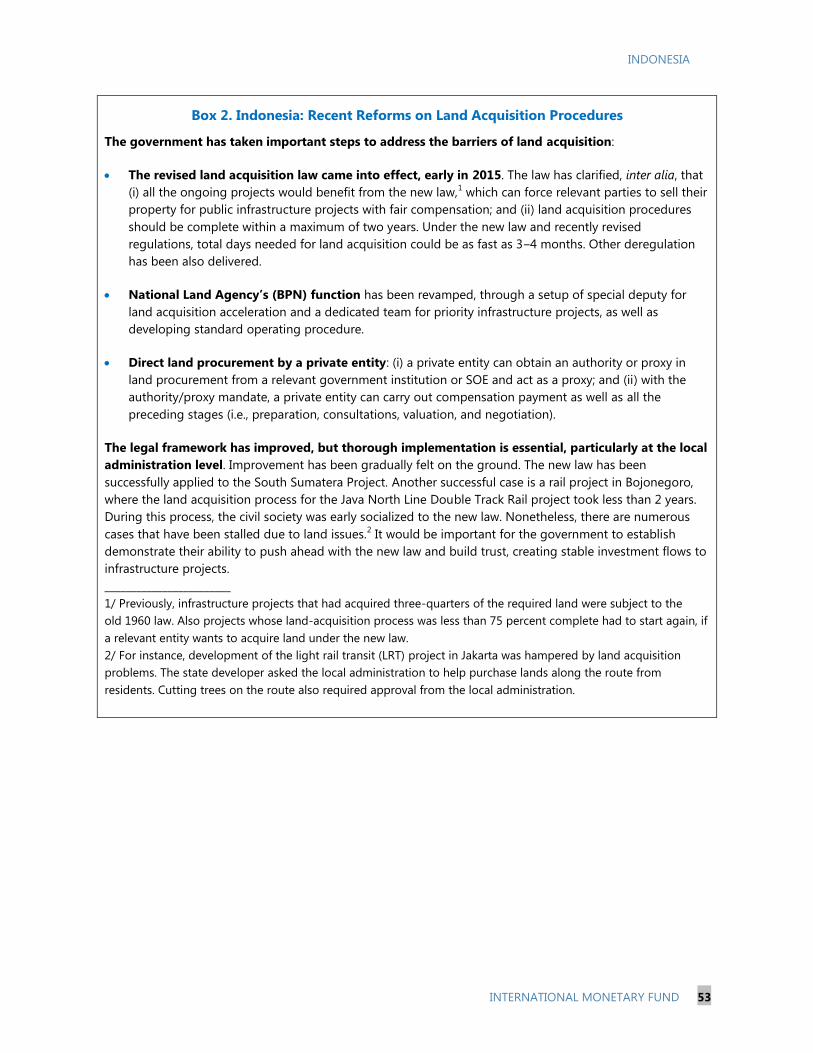
2. Recent Reforms on Land Acquisition Procedures ___________________________________ 53
FIGURES
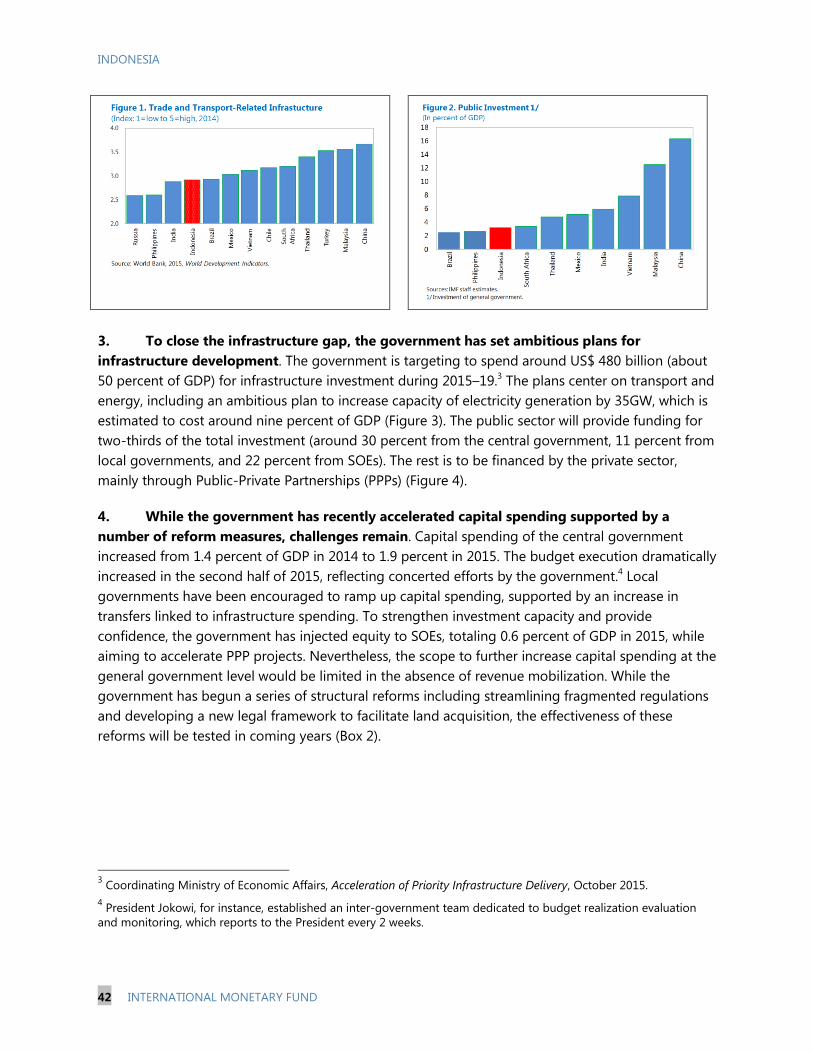
1. Trade and Transport-Related Infrastructure _________________________________________ 42
2. Public Investment ___________________________________________________________________ 42
3. Need for Infrastructure Investment, 2015–19 _______________________________________ 43
4. Source of Infrastructure Financing, 2015–19 ________________________________________ 43
5. Framework for Public Investment Management Assessment _______________________ 46
6. Capital Injection to Selected Infrastructure SOEs, 2015 _____________________________ 47
7. Dividend Payment of SOEs to Government _________________________________________ 47
8. Capital Spending of Government and SOEs _________________________________________ 48
9. Capital Expenditure of SOEs, 2015:H1_______________________________________________ 48
10. Pipeline Guarantee from Infrastructure Projects ____________________________________ 48
11. SOE Performance ___________________________________________________________________ 48
TABLES
1. GIMF Model—Simulation Results ___________________________________________________ 45
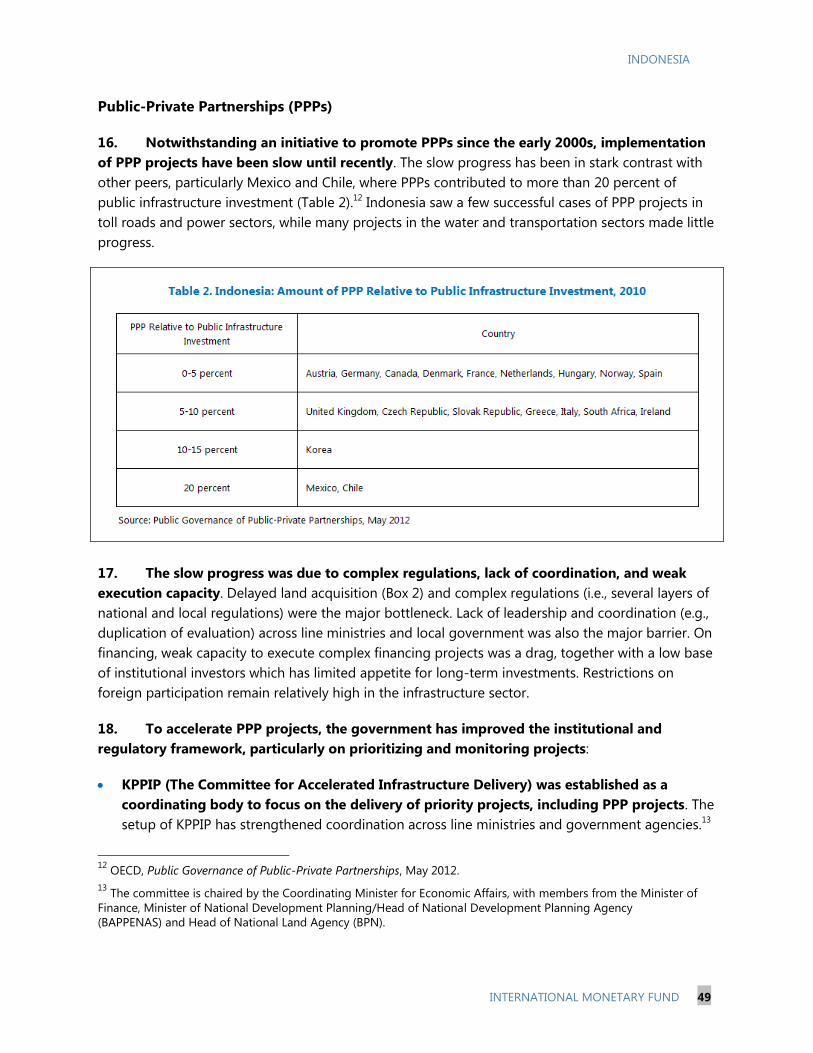
2. Amount of PPP Relative to Public Infrastructure Investment, 2010 __________________ 49
Page 5
INDONESIA
4 INTERNATIONAL MONETARY FUND
BANKING SECTOR SOUNDNESS IN INDONESIA1
Overall, the banking sector appears well capitalized and profitable. However, rising vulnerabilities from
corporate foreign currency leverage and challenging financial market conditions have raised concerns.
In a less favorable external environment, nonperforming loans (NPLs) could rise as economic growth
slows and the rupiah depreciates. Availability of short-term funding including deposits could tighten.
The high level of capitalization and profitability, and the large deposit base generally provided buffers.
Nonetheless, analyses of both aggregate and bank-by-bank data suggests that a group of smaller
banks are vulnerable to deterioration in bank asset quality and liquidity conditions. These pockets of
vulnerabilities warrant closer monitoring as econometric analysis suggests that NPLs would continue
to rise if economic growth remains subdued and currency depreciation continues.1
A. Introduction
1. This paper assesses the soundness of Indonesia’s banking system. It first conducts an
analysis of aggregate and bank-level data. It then conducts forward-looking scenario analyses of
bank asset quality and liquidity.
B. The Landscape
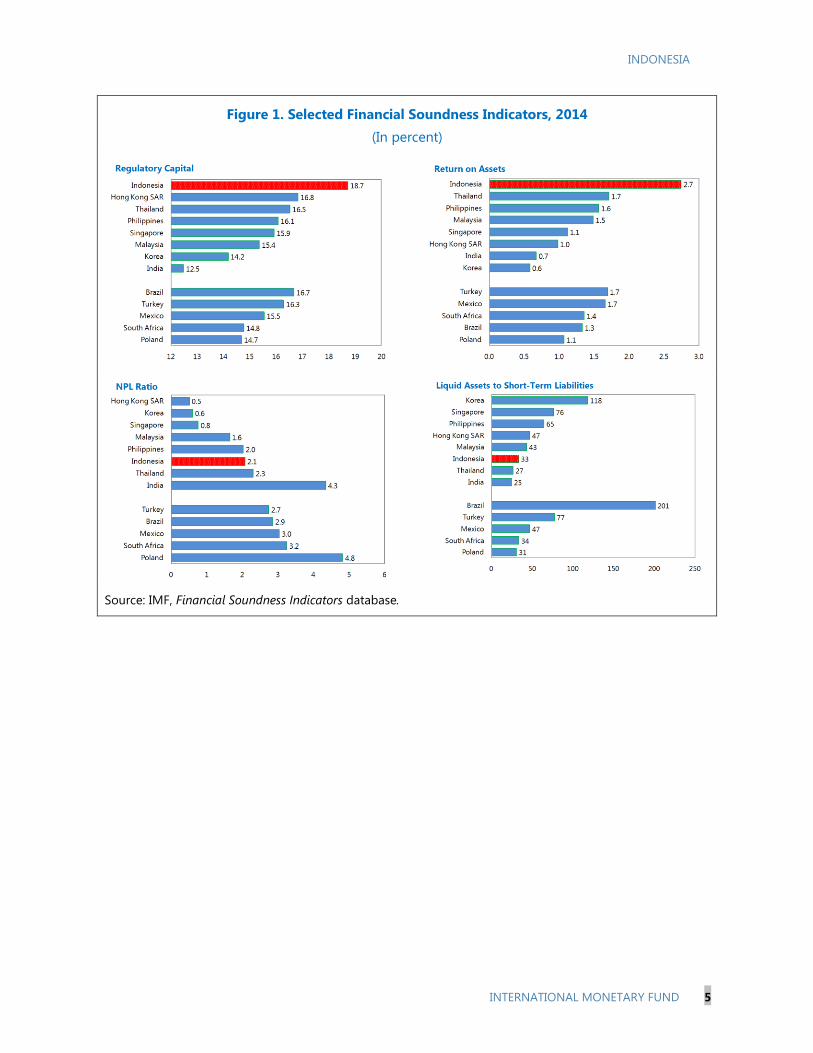
2. Cross-country comparison suggests Indonesia’s banking system is well capitalized and
profitable. Figures 1.1 and 1.2 show that the capital ratio of 18.7 percent and return on assets (ROA)
of 2.7 percent in 2014 were substantially above those for all other major emerging market
economies (EMEs) sampled. Through August, the capital ratio remained relatively stable. ROA
declined to 2.3 percent on slower growth but remained relatively high.
3. Nonetheless, bank asset quality and liquidity conditions need to be watched closely.
Figures 1.3 and 1.4 show that the nonperforming loan (NPL) ratio of 2.1 percent and liquid assets to
short-term liabilities of 33 percent in 2014 were much closer to the lower end of the country
spectrum. Liquid assets to short-term liabilities rose somewhat in 2015:Q1. However, the NPL ratio
rose steadily through August to 2.8 percent, exceeding the 2010 level.
4. Bank level data suggest pockets of vulnerabilities among smaller banks.
High NPLs: Figure 2.1 shows that some smaller banks have relatively low capital ratios and high
NPLs. Profitability tends to be lower for smaller banks due partly to the higher cost of deposit
funding. August data show that the largest four banks (Buku 4, mainly state owned banks)
enjoyed ROA of 3.3 percent, more than twice the 1.5 percent for small and medium sized banks
(Buku1‒3).
1 Prepared by Ken Miyajima.
Page 6
INDONESIA
INTERNATIONAL MONETARY FUND 5
Figure 1. Selected Financial Soundness Indicators, 2014
(In percent)
Source: IMF, Financial Soundness Indicators database.
Page 7
INDONESIA
6 INTERNATIONAL MONETARY FUND
Figure 2. Indonesia: Bank Asset Quality and Liquidity
(In percent)
Some smaller banks have relatively low capital ratios and
high NPLs.
Special mention loans jumped this year.
Some banks with relatively low NPLs have high level of
special mention loans.
Case study: One half of special mention loans are assumed
to migrate to NPLs.
Liquid assets have declined relative to deposits and other
short term funding.
Some banks with low liquid asset ratios rely more on non-
deposit funding.
Sources: Bank Indonesia; Bankscope; IMF, Financial Soundness Indicators database; and IMF staff estimates.
1/ Bubble size represents total assets.
2/ One half of special mention loans are assumed to migrate into NPLs.
Page 8
INDONESIA
INTERNATIONAL MONETARY FUND 7
Special mention and restructured loans: Figure 2.2 shows that special mention loans (SMLs)
jumped this year to 5.7 percent of total loans. Figure 2.3 shows that some banks with relatively
low NPLs have high level of SMLs, thus vulnerable to potential deterioration of asset quality if,
for instance, economic growth remained subdued for a protracted period. And smaller banks are
particularly vulnerable to the risk of migration of SMLs to NPLs. Figure 2.4 highlights this when,
for illustrative purposes one half of special mention loans is assumed to migrate to NPLs.
Restructured loans represent another source of risk. For a sample of banks for which data are
available, restructured loans in 2014 represented 2 percent of total loans, compared to NPLs of
3.5 percent of total loans for the same sample of banks.
Liquidity risk: Figure 2.5 shows that liquid assets have declined relative to deposits and other
short term funding, from 36 percent in 2006 to 23 percent in 2014. In 2014, the indicator was
even below 15 percent for several banks (Figure 2.6). Smaller banks are exposed to larger
liquidity risk given their greater reliance than larger banks on term deposits. In Indonesia, term
deposits, which look similar to money market instruments, tend to be more volatile than current
and savings account (CASA) deposits.
5. Bank soundness varies markedly across different type of banks (Table 2). August 2015
data show that NPLs of regional development banks (4.3 percent) were significantly above those of
other types of banks (2.1–2.8 percent). Risks from asset quality for non-foreign exchange banks and
foreign/joint venture banks are mitigated by their high capital ratios (23 percent and 34 percent,
respectively). State-owned banks outperformed in terms of profitability, with their ROA (3 percent)
notably above the industry average (2.3 percent). Funding risk could become an issue for
foreign/joint-venture banks as their Loan-to-Deposit (LTD) ratios (131 percent) are significantly
above the industry average (89 percent). Moreover, these banks rely more on non-deposit funding
(30 percent of total funding) compared to their peers (4-11 percent of total funding).
C. Scenario Analysis
6. Illustrative scenario analyses of bank asset quality and liquidity are conducted. First,
key determinants of NPLs are identified by estimating a small-scale satellite model, the result of
which is used to project NPLs for a given set of macroeconomic assumptions. Second, a simple
simulation is conducted to assess banks’ ability to accommodate reduced short-term funding using
liquid assets.
Bank Asset Quality2
7. The linkages between NPLs and key macroeconomic and bank balance sheet variables
in real terms are estimated. With respect to macroeconomic variables, lower GDP growth reduces
2 Bank Indonesia’s empirical analysis shows that NPLs are affected by GDP growth, corporates’ financial conditions
and lending rates in the short run, while GDP growth and lending rates in the long run (Box 1.1, Financial Stability
Report, March 2015).
Page 9
INDONESIA
8 INTERNATIONAL MONETARY FUND
corporate profitability. Depreciation of the rupiah against the US dollar increases repayment needs
for corporates with foreign currency debts, reducing capacity to service rupiah loans. A rise in the
policy interest rate tightens domestic monetary conditions while a lower oil price growth dampens
export revenues. Turning to bank level variables, a larger value of the lagged NPL ratio captures
greater persistence of NPLs. Lower credit growth leads to slower economic activity. We also control
for bank size. Dummy variables are included to control for the potential impact of the Global
Financial Crisis on NPLs. The model was estimated applying pooled, fixed-effects, and system
General Method of Moments (GMM) approaches (Arellano and Bover (1995), Blundell and Bond
(1998)) to annual data spanning 2000–14. All variables are lagged by one period to help reduce
reverse causality.
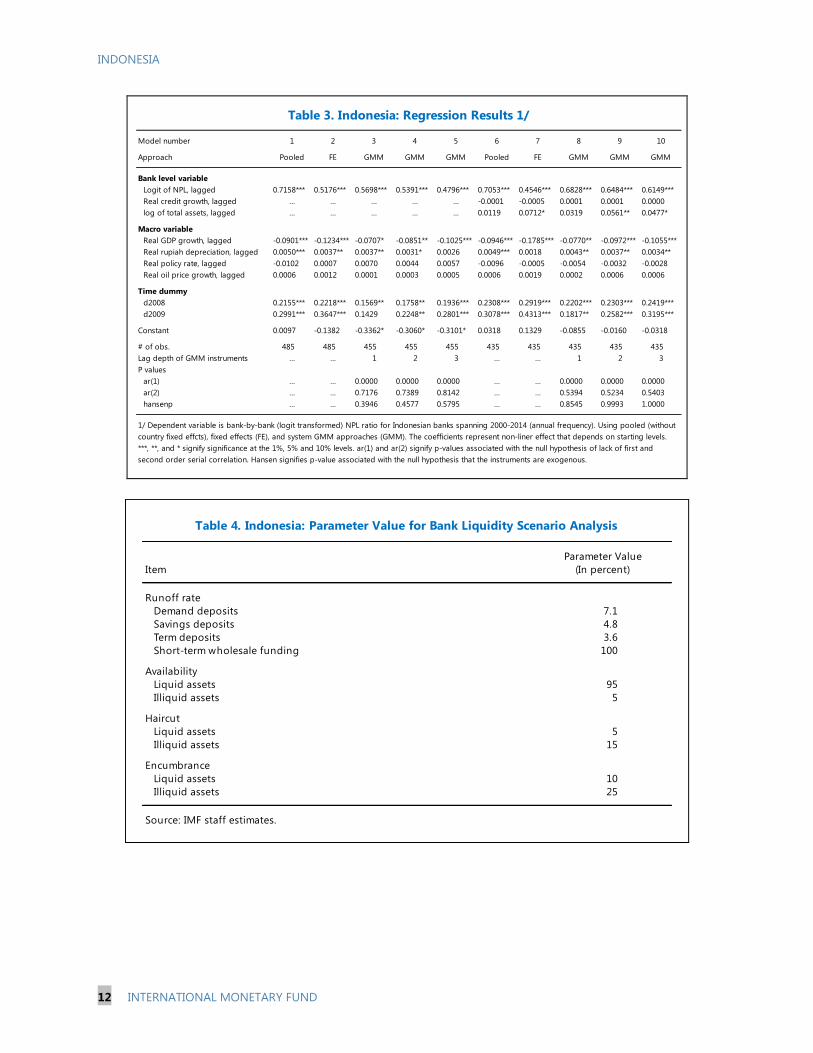
8. NPLs in Indonesia appear to be driven by GDP growth and the rupiah’s performance.
Table 1 summarizes key findings from two different specifications–with and without bank level
variables except that lagged NPLs were included in both (Table 3 reports the underlying regression
results). The lagged NPL ratio is statistically significant, indicating the variable’s persistence. The
coefficient on GDP growth is negative and statistically significant at the 5 percent level, while that on
rupiah depreciation is positive and statistically significant at the 5–10 percent level. Thus, lower GDP
growth and greater rupiah depreciation lead to a rise in NPLs. The coefficients on dummy variables
for 2008 and 2009 are positive and statistically significant at the 1–5 percent level.
9. In addition, several bank characteristics affect NPLs. First, larger banks tend to have
somewhat higher NPL ratios. Larger banks may benefit from economies of scale or take on higher
risk for higher returns than smaller banks do, potentially underpinning the observation that larger
banks tend to be more profitable than smaller banks (Table 2). Second, a tentative result suggests
that NPLs of state-owned banks may be less impacted by both economic activity and rupiah
depreciation.3 These banks’ loan portfolios could
be more diversified.
10. The banking system appears to be able
to withstand relatively large shocks to NPLs.
For illustrative purposes, the NPL ratios in
the 20th, 60th, and 90th percentile in 2014 are
taken as a starting point and the coefficients
obtained from the regression results underlying
Table 3 are applied. To simulate, real GDP growth
is assumed to moderate from 4.7 percent in
t = ‒1 to 2 percent in t = 0, 1, 2, 3. The rupiah
3 A regression model with macro variables was re-estimated with additional terms capturing the interaction between
a dummy variable for state owned banks and GDP growth or rupiah depreciation. The results were less strong than
those summarized in Table 1. Log of total assets was dropped as size and bank characteristics can overlap,
particularly for state-owned banks, most of which are the largest banks. Similar interaction terms did not indicate
systematic effects for other bank groups.
Page 10
INDONESIA
INTERNATIONAL MONETARY FUND 9
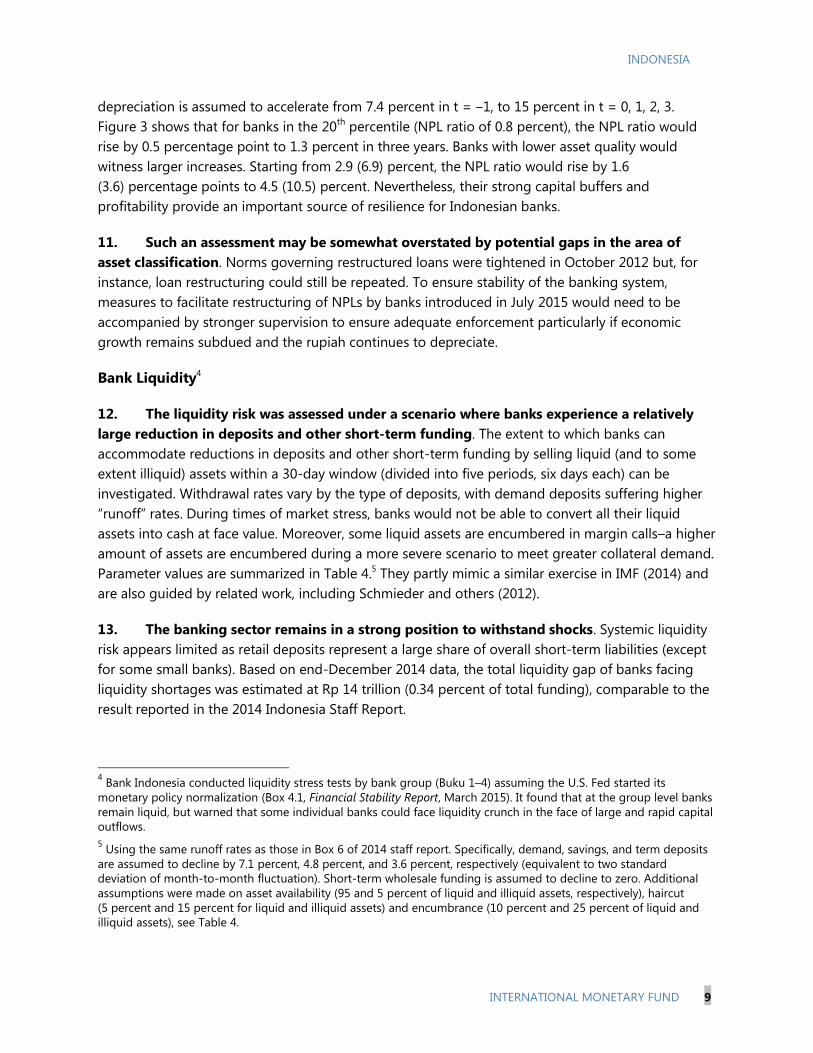
depreciation is assumed to accelerate from 7.4 percent in t = ‒1, to 15 percent in t = 0, 1, 2, 3.
Figure 3 shows that for banks in the 20th
percentile (NPL ratio of 0.8 percent), the NPL ratio would
rise by 0.5 percentage point to 1.3 percent in three years. Banks with lower asset quality would
witness larger increases. Starting from 2.9 (6.9) percent, the NPL ratio would rise by 1.6
(3.6) percentage points to 4.5 (10.5) percent. Nevertheless, their strong capital buffers and
profitability provide an important source of resilience for Indonesian banks.
11. Such an assessment may be somewhat overstated by potential gaps in the area of
asset classification. Norms governing restructured loans were tightened in October 2012 but, for
instance, loan restructuring could still be repeated. To ensure stability of the banking system,
measures to facilitate restructuring of NPLs by banks introduced in July 2015 would need to be
accompanied by stronger supervision to ensure adequate enforcement particularly if economic
growth remains subdued and the rupiah continues to depreciate.
Bank Liquidity4
12. The liquidity risk was assessed under a scenario where banks experience a relatively
large reduction in deposits and other short-term funding. The extent to which banks can
accommodate reductions in deposits and other short-term funding by selling liquid (and to some
extent illiquid) assets within a 30-day window (divided into five periods, six days each) can be
investigated. Withdrawal rates vary by the type of deposits, with demand deposits suffering higher
“runoff” rates. During times of market stress, banks would not be able to convert all their liquid
assets into cash at face value. Moreover, some liquid assets are encumbered in margin calls–a higher
amount of assets are encumbered during a more severe scenario to meet greater collateral demand.
Parameter values are summarized in Table 4.5 They partly mimic a similar exercise in IMF (2014) and
are also guided by related work, including Schmieder and others (2012).
13. The banking sector remains in a strong position to withstand shocks. Systemic liquidity
risk appears limited as retail deposits represent a large share of overall short-term liabilities (except
for some small banks). Based on end-December 2014 data, the total liquidity gap of banks facing
liquidity shortages was estimated at Rp 14 trillion (0.34 percent of total funding), comparable to the
result reported in the 2014 Indonesia Staff Report.
4 Bank Indonesia conducted liquidity stress tests by bank group (Buku 1–4) assuming the U.S. Fed started its
monetary policy normalization (Box 4.1, Financial Stability Report, March 2015). It found that at the group level banks
remain liquid, but warned that some individual banks could face liquidity crunch in the face of large and rapid capital
outflows.
5 Using the same runoff rates as those in Box 6 of 2014 staff report. Specifically, demand, savings, and term deposits
are assumed to decline by 7.1 percent, 4.8 percent, and 3.6 percent, respectively (equivalent to two standard
deviation of month-to-month fluctuation). Short-term wholesale funding is assumed to decline to zero. Additional
assumptions were made on asset availability (95 and 5 percent of liquid and illiquid assets, respectively), haircut
(5 percent and 15 percent for liquid and illiquid assets) and encumbrance (10 percent and 25 percent of liquid and
illiquid assets), see Table 4.
Page 11
INDONESIA
10 INTERNATIONAL MONETARY FUND
14. Pockets of vulnerabilities are highlighted
by Figure 4, which shows that a handful of banks
can be left with small amounts of liquid assets
relative to deposits and other short term funding
at the end of the period analyzed. The bottom
eight banks consist of foreign-owned/ joint
venture banks and smaller private sector banks as
well as two medium-sized banks (a domestic
private bank and a state owned bank).
D. Concluding Remarks
15. Results from this paper suggest that Indonesia’s banking system appears strong on
average but pockets of vulnerabilities warrant close monitoring. The high level of capitalization
and profitability, and the large deposit base generally provide buffers to Indonesia’s banks.
However, analyses using both aggregate data and bank-by-bank data suggest that a group of
smaller banks are vulnerable to deterioration in bank asset quality and liquidity conditions. These
pockets of vulnerabilities warrant closer monitoring particular as our econometric analysis suggests
that NPLs would continue to rise if economic growth remaines subdued and currency depreciation
continues.
Page 12
INDONESIA
INTERNATIONAL MONETARY FUND 11
Bank Level Variables? No Yes
Bank level variable
Logit of NPL, lagged +*** +***
Real credit growth, lagged … .
log of total assets, lagged … +*
Macro variable
Real GDP growth, lagged -** -**
Real rupiah depreciation, lagged +* +**
Real policy rate, lagged . .
Real oil price growth, lagged . .
Time dummy
Year 2008 +** +***
Year 2009 +** +**
Source: IMF staff estimates.
Table 1. Indonesia: Bank Asset Quality and Liquidity 1/
1/ Dependent variable is bank-by-bank (logit transformed) NPL ratio for Indonesian banks spanning 2000-
2014 (annual frequency). The table shows the sign of estimated coefficients based on a range of
regressions including pooled (without country fixed effcts), fixed effects (FE), and system GMM
approaches (GMM). ***, **, and * signify significance at the 1%, 5% and 10% levels. " . " signifies the
coefficient is not statistically different from zero. " ... " means the variable in the first column was not
included.
Overall Buku4 Buku1
State own. Reg. dev. Forex Non forex JV/for-own. Largest Smallest
Number of banks 118 4 26 39 28 21 4 40
Solvency
NPL to total loans 2.8 2.8 4.3 2.7 2.6 2.1
SML to total loans 5.7
CAR 20.7 18.8 17.8 17.8 23.1 33.6 19.1 20.4
Core CAR 18.2 15.6 15.7 15.3 21.6 32.1 16.3 18.7
Profitability
ROA 2.3 3.0 2.2 1.8 1.9 1.8 3.3 1.5
Funding
LTD 88.8 86.3 71.9 85.9 91.4 130.5 82.9 77.7
Nondeposits to total funding (excluding equity) 11.0 11.0 4.2 7.9 7.8 30.0
Liquidity
Liquid asssets/total assets 16.9 15.8 24.3 15.2 12.8 19.7 16.6 21.3
Size
Assets 100 37 9 37 2 15 44 3
Loans 100 36 8 40 3 12 42 3
Source: Bank Indonesia; and IMF staff estimates.
Public Private
Table 2. Indonesia: Bank Financial Soundness Indicators, August 2015
Page 13
INDONESIA
12 INTERNATIONAL MONETARY FUND
Model number 1 2 3 4 5 6 7 8 9 10
Approach Pooled FE GMM GMM GMM Pooled FE GMM GMM GMM
Bank level variable
Logit of NPL, lagged 0.7158*** 0.5176*** 0.5698*** 0.5391*** 0.4796*** 0.7053*** 0.4546*** 0.6828*** 0.6484*** 0.6149***
Real credit growth, lagged … … … … … -0.0001 -0.0005 0.0001 0.0001 0.0000
log of total assets, lagged … … … … … 0.0119 0.0712* 0.0319 0.0561** 0.0477*
Macro variable
Real GDP growth, lagged -0.0901*** -0.1234*** -0.0707* -0.0851** -0.1025*** -0.0946*** -0.1785*** -0.0770** -0.0972*** -0.1055***
Real rupiah depreciation, lagged 0.0050*** 0.0037** 0.0037** 0.0031* 0.0026 0.0049*** 0.0018 0.0043** 0.0037** 0.0034**
Real policy rate, lagged -0.0102 0.0007 0.0070 0.0044 0.0057 -0.0096 -0.0005 -0.0054 -0.0032 -0.0028
Real oil price growth, lagged 0.0006 0.0012 0.0001 0.0003 0.0005 0.0006 0.0019 0.0002 0.0006 0.0006
Time dummy
d2008 0.2155*** 0.2218*** 0.1569** 0.1758** 0.1936*** 0.2308*** 0.2919*** 0.2202*** 0.2303*** 0.2419***
d2009 0.2991*** 0.3647*** 0.1429 0.2248** 0.2801*** 0.3078*** 0.4313*** 0.1817** 0.2582*** 0.3195***
Constant 0.0097 -0.1382 -0.3362* -0.3060* -0.3101* 0.0318 0.1329 -0.0855 -0.0160 -0.0318
# of obs. 485 485 455 455 455 435 435 435 435 435
Lag depth of GMM instruments … … 1 2 3 … … 1 2 3
P values
ar(1) … … 0.0000 0.0000 0.0000 … … 0.0000 0.0000 0.0000
ar(2) … … 0.7176 0.7389 0.8142 … … 0.5394 0.5234 0.5403
hansenp … … 0.3946 0.4577 0.5795 … … 0.8545 0.9993 1.0000
1/ Dependent variable is bank-by-bank (logit transformed) NPL ratio for Indonesian banks spanning 2000-2014 (annual frequency). Using pooled (without
country fixed effcts), fixed effects (FE), and system GMM approaches (GMM). The coefficients represent non-liner effect that depends on starting levels.
***, **, and * signify significance at the 1%, 5% and 10% levels. ar(1) and ar(2) signify p-values associated with the null hypothesis of lack of first and
second order serial correlation. Hansen signifies p-value associated with the null hypothesis that the instruments are exogenous.
Table 3. Indonesia: Regression Results 1/
Parameter Value
Item (In percent)
Runoff rate
Demand deposits 7.1
Savings deposits 4.8
Term deposits 3.6
Short-term wholesale funding 100
Availability
Liquid assets 95
Illiquid assets 5
Haircut
Liquid assets 5
Illiquid assets 15
Encumbrance
Liquid assets 10
Illiquid assets 25
Source: IMF staff estimates.
Table 4. Indonesia: Parameter Value for Bank Liquidity Scenario Analysis
Page 14
INDONESIA
INTERNATIONAL MONETARY FUND 13
References
Arellano, M., and O. Bover, 1995, “Another Look at the Instrumental Variable Estimation of Error-
Components Models,” Journal of Econometrics, Vol. 68, Issue 1, pp 29–51.
Bank Indonesia, 2015, Financial Stability Report, March.
Blundell, R., and S. Bond, 1998, “Initial Conditions and Moment Restrictions in Dynamic Panel Data
Models,” Journal of Econometrics, Vol. 87, pp 115–43.
International Monetary Fund, 2014, Indonesia—Staff Report for the 2014 Article IV Consultation, IMF
Country Report No. 15/74 (Washington).
Schmieder, C., H. Hesse, B. Neudorfer, C. Puhr, S. W. Schmitz, 2012, “Next Generation System-Wide
Liquidity Stress Testing,” IMF Working Paper No. 12/3 (Washington: International Monetary
Fund).
Page 15
INDONESIA
14 INTERNATIONAL MONETARY FUND
CORPORATE VULNERABILITIES1
While overall corporate sector risks in Indonesia appear manageable, some corporates are facing
higher risks including exchange rate, refinancing, or default, with possible spillovers to the banking
system. With a slowing economy and a weakened rupiah, corporate balance sheets are expected to
provide smaller buffers against negative macroeconomic shocks going forward. This paper assesses
corporate sector vulnerabilities. It first describes the current situation in the corporate sector, and then
projects corporate default probabilities under different macroeconomic scenarios. Results from the
scenario analyses suggest that if economic growth slows sharply and recovers only slowly, the default
probabilities of domestic firms could rise to levels comparable to those during the Global Financial
Crisis. While this is a low-probability scenario, policy makers should continue to closely monitor
vulnerabilities and step up effort to strengthen contingency plans.1
A. Introduction
1. This note assesses corporate sector vulnerabilities in Indonesia. It first discusses key facts
about the sector exploiting a range of macroeconomic and financial market data. Then, as a way of
further assessing corporate vulnerabilities, it projects corporate default probabilities under different
macroeconomic scenarios.
B. Corporate Performance and External Debt Risk
2. Indonesia’s corporate sector remains relatively strong and sound compared to its EM
peers. Aggregate corporate leverage is comparatively low, with the corporate debt relative to GDP
standing relatively small at around 32 percent (compared to around 70 percent on average for Asian
EM peers.2 The liability-to-asset ratio is low at less than 50 percent (Figure 1), and profitability is
highest among peers (Figure 2). Many corporates in Indonesia also tend to rely on internal cash
flows for funding rather than external financing.
1 Prepared by Ken Miyajima and Jongsoon Shin.
2 Includes India, Malaysia, Thailand, and the Philippines.
Page 16
INDONESIA
INTERNATIONAL MONETARY FUND 15
3. Nonetheless, corporates have been impacted by continuing commodity price falls and
a weakened rupiah, exacerbated by rapidly increased external debt. The commodity down-cycle
and slowing economy have impacted commodity-related corporates (i.e., coal mining), and
corporates in non-tradable sectors, reducing their income stream and ability to pass the costs to
consumers due to consumers’ reduced purchasing power. Profitability continues to decline and
liquidity remains tight, reflecting a weakening operating environment and tighter financial
conditions (Figures 3 and 4). Some corporates have been facing debt repayment problems in recent
months, notably on foreign currency denominated (FX) bonds. In the coming periods, as external
financing conditions tighten, the corporate sector could face difficulties in servicing their high level
of FX debt.
Page 17
INDONESIA
16 INTERNATIONAL MONETARY FUND
4. Foreign currency (FX) denominated debt
of corporates grew rapidly over the past years.
FX corporate debt (including FX debt to domestic
banks) reached around 20 percent of GDP as of
June 2015, doubling the level seen in 2010, albeit
from a low base. FX debt of corporates accounts
for around 60 percent of the total corporate debt.
However, FX debt growth moderated in 2015, with
issuance affected by general risk aversion towards
emerging markets and weak private investment.
5. FX corporate debt is concentrated in the
commodity and some non-tradable sectors,
driven by FX debt securities.
The share of the commodity sector steadily
rose to around 30 percent in 2014
from 20 percent in 2007. A group of non-
tradable sectors, notably the transport and
telecommunication industries, accounts for
around 40 percent of FX corporate debt, while
these sectors are running a growing risk of
currency mismatches between rupiah incomes
and FX debt service.
FX debt securities (i.e., syndicated loans) were the major driver. Around 90 percent of debt
securities issued in 2014 were FX denominated. The heavy reliance on FX syndicated loans is in
contrast with EM peers where local currency bond markets have increasingly substituted bank
loans to corporates (Figure 8).
The rise in FX debt has been led by SOEs (e.g., energy-related SOEs), while FDI-related
corporates’ borrowing accounts for half of external borrowing (i.e., foreign private corporates
Page 18
INDONESIA
INTERNATIONAL MONETARY FUND 17
and joint-venture private corporates). The expected rise in infrastructure spending in the coming
years suggests that external debt borrowing may continue to rise at a brisk pace.
6. The rapid increase in corporate FX borrowing has been driven by both pull and push
factors. Corporates tapped low-cost external borrowing under the U.S. Fed monetary easing, which
helped create ample liquidity in EM debt markets. With favorable interest rate spreads and
commodity booms in 2010-13, corporates borrowed actively from global bond and syndicated loan
markets. More structurally, shallow domestic financial markets, particularly thin corporate bond
markets, have led corporates to tap offshore debt markets.
7. Some corporates has been facing rising FX exposure, refinancing risk, or default risk.
A portion of the FX debt is estimated to be unhedged, making it vulnerable to currency
depreciation. Rupiah depreciation has exposed corporates to losses from the revaluation of
their FX debt. Bank Indonesia (BI)’s hedging regulations have helped corporates to manage
currency risk (Box 1). However, some corporates do only partial hedging to reduce hedging
costs. Since plain vanilla hedging instruments have a high cost, some corporates use hedging
instruments with built-in ceiling options. If the rupiah depreciates substantially, FX exposure is
likely to jump, causing losses.
Refinancing risk is likely to rise, as maturing FX debt securities are set to rise in 2016
(Figure 9). Maturing FX syndicated loans and bonds have a large proportion of debt categorized
as leveraged or high-yield, whose ease of rollover could be affected by BI’s new requirement for
corporate that wants to issue FX debt to be of investment grade credit rating starting from 2016.
Still, there are some mitigating factors. Two-thirds of non-bank private corporates’ external debt
maturing within a year was borrowed from affiliates, which could help mitigate the refinancing
risk. Also, the overall amount of maturing debt (including financials) within a year appears
manageable (Figure 10).
Page 19
INDONESIA
18 INTERNATIONAL MONETARY FUND
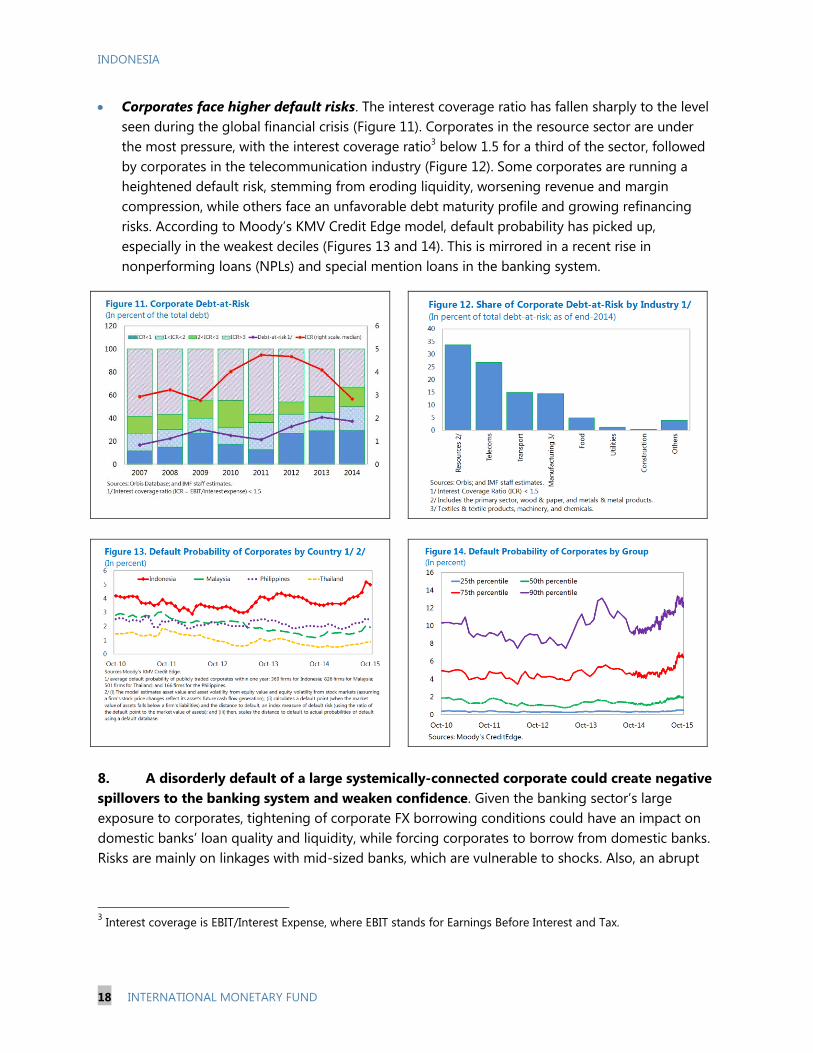
Corporates face higher default risks. The interest coverage ratio has fallen sharply to the level
seen during the global financial crisis (Figure 11). Corporates in the resource sector are under
the most pressure, with the interest coverage ratio3 below 1.5 for a third of the sector, followed
by corporates in the telecommunication industry (Figure 12). Some corporates are running a
heightened default risk, stemming from eroding liquidity, worsening revenue and margin
compression, while others face an unfavorable debt maturity profile and growing refinancing
risks. According to Moody’s KMV Credit Edge model, default probability has picked up,
especially in the weakest deciles (Figures 13 and 14). This is mirrored in a recent rise in
nonperforming loans (NPLs) and special mention loans in the banking system.
8. A disorderly default of a large systemically-connected corporate could create negative
spillovers to the banking system and weaken confidence. Given the banking sector’s large
exposure to corporates, tightening of corporate FX borrowing conditions could have an impact on
domestic banks’ loan quality and liquidity, while forcing corporates to borrow from domestic banks.
Risks are mainly on linkages with mid-sized banks, which are vulnerable to shocks. Also, an abrupt
3 Interest coverage is EBIT/Interest Expense, where EBIT stands for Earnings Before Interest and Tax.
Page 20
INDONESIA
INTERNATIONAL MONETARY FUND 19
downgrade of corporate credit rating could quickly weaken investor confidence in the corporate
sector.
C. Bottom-Up Scenario Analysis of Corporate Default Probability in Indonesia
9. This section provides a forward-looking assessment of corporate sector vulnerabilities.
In particular, it projects corporate default probabilities under different macroeconomic assumptions
in several steps as explained below.
10. The model maps macroeconomic scenarios to probabilities of default (PDs) of
individual firms (Figure 15).4 A forward intensity model is a reduced form model in which the PD is
computed as a function of different input variables. The model accounts for exits of firms due both
to defaults and reasons other than defaults.5 Two sets of independent factors—common risk
factors and firm specific factors—are used as input variables. Common and firm specific factors
are assumed to be influenced by a set of macroeconomic factors.
11. The variables used for the scenario analysis are summarized in Table 1. Macroeconomic
conditions are characterized by variables commonly used in the literature of stress testing. GDP
growth proxies for the growth in incomes and earnings of firms. Unemployment rate affects the
consumption and spending of households and, in turn, corporate sales. Inflation can signal
macroeconomic uncertainty. High inflation raises costs and impairs credit quality but also reduces
real debt burden. Exchange rate performance affects firms through net exports and balance sheet
channels. Short-term interest rates are an indicator of the cost of funding for corporates. Common
risk factors are the domestic equity price index and short-term interest rates, which define the
market conditions and in turn affect the state of individual firms. Firm specific factors for more than
400 corporates (both financial and nonfinancial) capture characteristics including liquidity,
profitability, and size.6
4 The model was developed by staff of National University of Singapore (NUS) in collaboration with IMF staff with the
active support by NUS Risk Management Institute’s Credit Research Initiative team. For further information see Duan
et al (2012), Duan and Fulop (2013) and Duan et al (2014).
5 In the forward intensity model, a firm’s default is signaled by a jump in a Poisson process. The probability of a jump
in the Poisson process is determined by the intensity of the Poisson process. With forward intensities, PDs for any
forecast horizon can be computed knowing only the values of the input variables at the time of prediction, without
needing to simulate future values of the input variables.
6 Idiosyncratic volatility represents the standard deviation of the residuals obtained from a regression of the daily
returns of the firm’s market capitalization on those of the economy’s stock index, for the previous 250 days. Firms
with more variable cash flows and therefore more variable stock returns relative to a market index are likely to have a
higher probability of bankruptcy.
Page 21
INDONESIA
20 INTERNATIONAL MONETARY FUND
12. The simulation starts by assuming two different paths of quarterly macroeconomic
variables through 2017 (Figure 16).7 The trajectories of macroeconomic variables are in turn used
to project common risk factors and firm specific risk factors. Finally, these risk factors are used as
inputs to a forward intensity model, which is simulated to generate a distribution of PDs.
The baseline scenario assumes GDP growth would moderately increase to around 5.3 percent.
The unemployment rate would decline gradually to 5.7 percent, while inflation would fall to
4.4 percent. The rupiah’s movement would range between –3 percent to 4 percent year-on-year
(y/y) every quarter and the one-month JIBOR interest rate decline moderately to 6.7 percent.
The downside scenario is characterized by a sharp drop in GDP growth to below two percent
y/y and a vigorous V-shape recovery. The unemployment rate would jump to nine percent and
return to somewhat above eight percent. Inflation would surge to above ten percent but return
to 6 percent. The rupiah would depreciate by 14–20 percent y/y for three quarters. The JIBOR
interest rate would jump to exceed 12 percent for three quarters and return to 9 percent.
13. Several key observations emerge from estimated results.8
First, the firm-specific factors may have recently taken less supportive values than in previous
periods, after growth slowdown and rupiah depreciation have weakened corporate balance
sheet conditions amid rising corporate foreign currency leverage. Under the baseline scenario,
the median corporate PD is projected to rise to levels somewhat higher than those during the
taper tantrum in 2013 and moderate somewhat toward the end of 2017 (Figure 17, upper panel,
7 The actual simulation is based on quarter-on-quarter percent or percentage point changes implied by the year-on-
year data presented in Figure 16.
8 The model performs generally well. For the ASEAN‒5 economies, macroeconomic variables explain a large share of
variation in the common risk factors (R^2 is around 0.6) and the firm specific risk factors (R^2 is around 0.3–0.4).
Accuracy of in-sample prediction of PDs is high.
Page 22
INDONESIA
INTERNATIONAL MONETARY FUND 21
red broken line).9 This is the case despite projected macro fundamentals being broadly
comparable to those in 2013—GDP growth is somewhat lower, but the rupiah’s performance is
more favorable and inflation is lower.
Second, weaker macroeconomic performance would naturally lift corporate PD to higher levels.
The median PD under the downside scenario would rise to about one half of the maximum
registered during the Lehman crisis (Figure 17, upper panel, green solid line). This reflects a
sharp GDP growth slowdown and deterioration in other macro variables. However, the PD would
decline as economic activity regains momentum.
Third, corporate distress can worsen materially if weak macroeconomic performance is
accompanied by severe financial market jitters. Under the downside scenario, the 95th percentile
estimate, with remote chance of occurrence, rises to very close to the maximum registered
during the global financial crisis (Figure 17, lower panel, light green broken line). Meanwhile,
cross-border spillovers of a negative shock could be large in an environment of elevated
uncertainty and financial market volatility. Under such circumstances, what is considered as a
low-probability outcome (with a high impact) could become a real threat.
D. Concluding Remarks
14. Overall, the risk from the corporate sector remains manageable, and the authorities
have strengthened the monitoring framework. The aggregate corporate debt-to-GDP ratio
remains small, and on a system wide basis, near-term refinancing risk appears manageable. The
authorities are monitoring corporate vulnerabilities closely, and the implementation of the BI’s
hedging regulations has helped corporates manage currency risks. Authorities’ ongoing work to
upgrade the framework and inter-agency coordination on corporate surveillance is also in the right
direction.
15. Nonetheless, close monitoring and granular analysis on maturing FX debt are
warranted. Even though the overall risk of the corporate sector is manageable, a group of
corporates is facing heightened debt risks, some of which are connected to large business groups.
The results of the empirical analysis in Section B confirm these observations. Close monitoring,
therefore, is required for FX debt of corporates with rupiah income, as well as unhedged, non-
affiliated, or maturing FX debt, together with bank linkages. Strengthening policy coordination
should also continue, coupled with data analysis to assess the dimensions of the debt problems of
specific corporates in vulnerable groups. The authorities should consider reviewing the corporate
resolution framework (including the bankruptcy regime) to ensure that it is capable of dealing with
large and systemically connected conglomerates. In the medium-term, deeper financial markets will
help reduce the costs of hedging and develop domestic corporate bond issuance and trading.
9 Based on 10,000 simulations.
Page 23
INDONESIA
22 INTERNATIONAL MONETARY FUND
Box 1. Bank Indonesia’s Foreign Exchange Regulations on Corporates
FX regulations. To encourage corporates with external debt to enhance risk management, BI introduced a set of
prudential measures in October 2014.
Hedging ratio. The hedging ratio is defined as the
ratio between the total value hedged and the net
short-term foreign liability position. The minimum
hedging ratio is 20 percent for 2015 and 25 percent
for 2016, and is applied to the net foreign currency
liabilities with a maturity period up to three months,
and those that mature between three and six
months. Exemptions are made for export-oriented
corporates—corporates with a ratio of export
revenue to total revenue exceeding 50 percent of
the previous calendar year—with financial
statements issued in U.S. dollars.
Liquidity ratio. The liquidity ratio is defined as the
ratio between short-term foreign currency assets and short-term foreign currency liabilities. The minimum
ratio is 50 percent for 2015 and 70 percent for 2016.
Credit rating requirement. Nonbank corporates should have a credit rating of no less than BB or equivalent
issued by an authorized rating agency, including Moody’s (Ba3), S&P (BB-), and Fitch (BB-). The validity of the
credit rating is up to 2 years. Corporates can use a parent company’s credit rating for the external debt of
parent companies or external debt secured by parent companies. Exemptions are made for external debt
related to infrastructure projects, external debt secured by multilateral institutions, refinancing, and trade
credit.
Reporting requirement. BI has also strengthened monitoring on external borrowing of corporates. Corporates
with external borrowing should submit quarterly reports to BI regarding their hedging and liquidity ratios for
each quarter, starting from 2015. The report covers a corporate’s hedging ratio, liquidity ratio, and credit rating,
and all supporting documentation.
Sanctions. To implement these regulations effectively, BI will impose administrative sanctions from 2015:Q4, in
the form of warning letters to “related parties” in the transactions, including to the lenders which are providing
the non-compliant debt, the Ministry of Finance, the Minister of State Owned Enterprises (in the case of
borrowers that are state-owned enterprises), the Financial Services Authority (OJK) and the Indonesia Stock
Exchange (in the case of listed-company borrowers).
Page 24
INDONESIA
INTERNATIONAL MONETARY FUND 23
Figure 16. Projected Macroeconomic Variables
Page 25
INDONESIA
24 INTERNATIONAL MONETARY FUND
Figure 17. Indonesia: GDP Growth and Corporate Default Probability
(Lehman peak = 100)
Page 26
INDONESIA
INTERNATIONAL MONETARY FUND 25
Appendix 1. Technical Background
This appendix provides a brief description of two steps for the scenario analysis: (i) project common
risk factors and firm-specific risk factors given the assumed paths of macroeconomic variables, and
(ii) map these risk factors to PDs.
Generating the Paths of Common Risk Factors and Firm-Specific Factors
Given the assumed and projected paths of macroeconomic variables ( , both
common risk factors and risk factors specific to firm j, can
be predicted.
(A1)
(A2)
The equations above include first and second order lags to capture auto-correlation. Subscript i
represents country, which in our case is Indonesia.
Mapping Risk Factors to PDs
Given the paths of risk factors and , multivariate regressions are
used to map them to PDs. The PD of firm i at time t for the prediction horizon of ) can
be written as:
(A3)
where is the PD function for horizon , is the common risk factors at time t, and is the
firm specific risk factors for firm i at time t. By simulating the model for many times (10,000 times in
our case) one can create a distribution of each . The results presented in the main text
represent the average of the observations corresponding to the specific percentile (median, 75th
and
95th
) of the individual firms’ probability distributions.
Page 27
INDONESIA
26 INTERNATIONAL MONETARY FUND
References
Arman, H., 2015, “Indonesia Macro View, Short-term External Debt: Gauging the Roll-Over Risk.” Citi
Research.
Duan, J. C., J. Sun, and T. Wang, 2012, “Multiperiod Corporate Default Prediction - A Forward
Intensity Approach,” Journal of Econometrics, Vol. 170, pp. 191‒209.
Duan, J. C., A. Fulop, 2013, “Multiperiod Corporate Default Prediction with Partially-Conditioned
Forward Intensity,” RMI Working Paper No. 12/04 (Singapore: National University of
Singapore, Risk Management Institute).
Duan, J. C., W. Miao, and T. Wang, 2014, "Stress Testing with a Bottom-Up Corporate Default
Prediction Model," RMI Working Paper. Available via the Internet:
http://www.rmi.nus.edu.sg/duanjc/index_files/files/CreditStressTesting_Aug-5-2014.pdf
Laryea, T., 2010, “Approaches to Corporate Debt Restructuring in the Wake of Financial Crises,” IMF
Staff Position Note 10/02 (Washington: International Monetary Fund).
Standard & Poor’s Rating Service, 2015, “15,000 Rupiah to One U.S. Dollar Could be the Level to
Watch For Rated Indonesian Companies,” September.
Page 28
INDONESIA
INTERNATIONAL MONETARY FUND 27
ANALYSIS OF MACRO-FINANCIAL LINKAGES IN
INDONESIA1
Macro-financial linkages in Indonesia are analyzed using two complementary approaches: a sector-
level balance sheet analysis and a panel vector autoregression approach. These analyses confirmed the
importance of external funding in Indonesia, particularly through nonfinancial corporations (NFC). In
this connection, negative external shocks could propagate through NFCs to the domestic banking
system, which replaces some of the reduction in NFC’s foreign financing. In addition, we empirically
identify linkages among global risk sentiment, economic activity, bank credit and deposits, and the
exchange rate that warrant close monitoring.1
A. Introduction
1. This paper presents evidence about macro-financial linkages in Indonesia using two
complementary approaches. The first approach is the Balance Sheet Analysis (BSA) which extracts
information from annual data on sector-level balance sheets. Within this approach, we demonstrate
four different ways of exploiting the same set of data. The second approach is a panel vector
autoregression approach which relies on a combination of macroeconomic data and bank-level
balance sheet data.
B. Balance Sheet Analysis
2. Sectoral balance sheet data are used to construct a balance sheet matrix that supports
a range of different balance sheet analyses (BSA). A BSA matrix provides a snapshot of
outstanding gross and net balance sheet positions (stocks) of each sector in the economy vis-à-vis
other resident sectors.2 As such, it can be used to study the evolution of exposures and
vulnerabilities in individual sectors, as well as cross-sectoral linkages. A matrix can be constructed
from monetary and financial statistics (MFS, drawn from the IMF’s standardized report forms),
international investment position (IIP), and government finance statistics (GFS). To analyze the
Indonesian economy, we use data covering the period 2001–14 for seven sectors:3 (i) Government;
(ii) Central bank; (iii) Banks; (iv) Nonbanking financial institutions; (v) Nonfinancial corporations
(NFCs); (vi) Households (HHs);4 and (vii) Non-resident (or rest of the world, ROW). We use the BSA to
support four types of analysis: matrix, network, sensitivity, and a vector-autoregression (VAR).
1 Prepared by Elena Loukoianova (APD), Ken Miyajima (MCM), and Giovanni Ugazio (STA).
2 For more details on the recent work on BSA see Caprio (2011), and IMF (2014, 2015).
3 See IMF (2016) for a discussion on how to construct the BSA matrix. GFS data are available for selected recent
periods only (2009 until 2013).
4 Data for NFCs and HHs are generally less comprehensive than those for the other sectors.
Page 29
INDONESIA
28 INTERNATIONAL MONETARY FUND
3. Analysis of NFC exposures to ROW calculated from the IIP warrants some caveats.
From the point of view of NFCs external assets, the residency concept used in the construction of
the BSA may lead to underestimating the actual funds available to NFCs, as NFCs operating in the
country sometimes hold their funds abroad (e.g. Singapore) through an affiliate or subsidiary
company. Further, external liabilities of NFCs include indistinguishably both equity and debt
funding, without a currency breakdown (they are assumed to be all denominated in foreign
currency).
Matrix Analysis
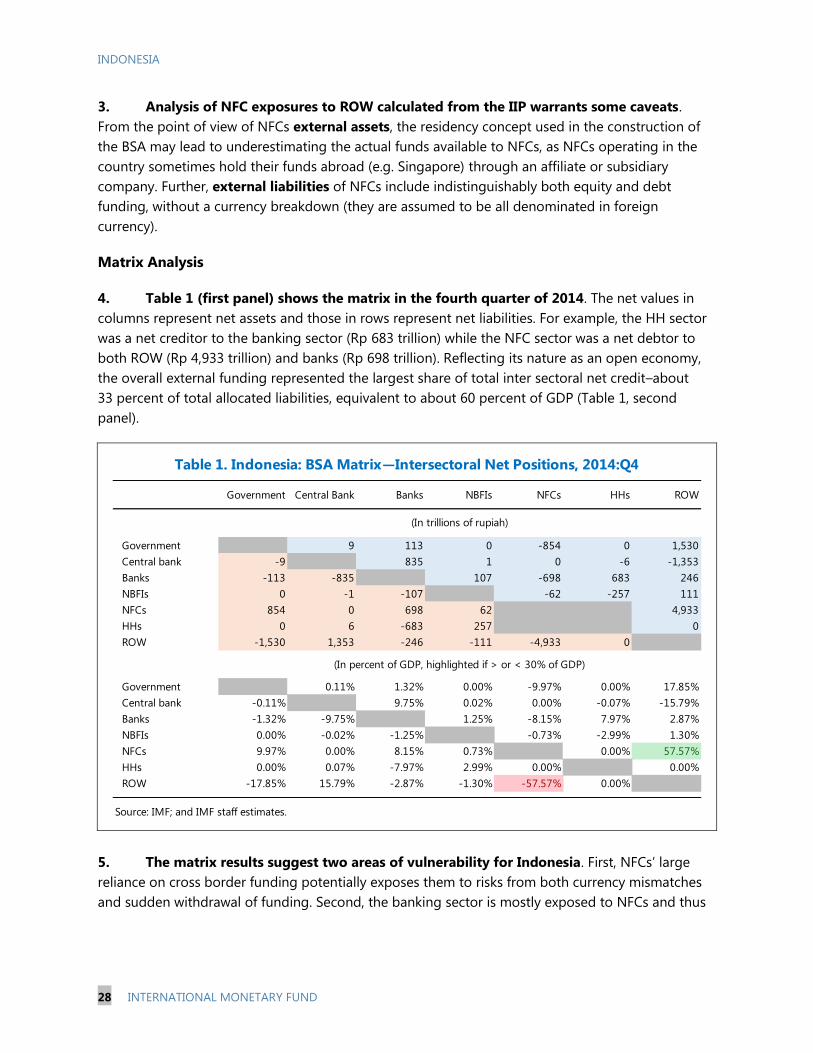
4. Table 1 (first panel) shows the matrix in the fourth quarter of 2014. The net values in
columns represent net assets and those in rows represent net liabilities. For example, the HH sector
was a net creditor to the banking sector (Rp 683 trillion) while the NFC sector was a net debtor to
both ROW (Rp 4,933 trillion) and banks (Rp 698 trillion). Reflecting its nature as an open economy,
the overall external funding represented the largest share of total inter sectoral net credit–about
33 percent of total allocated liabilities, equivalent to about 60 percent of GDP (Table 1, second
panel).
5. The matrix results suggest two areas of vulnerability for Indonesia. First, NFCs’ large
reliance on cross border funding potentially exposes them to risks from both currency mismatches
and sudden withdrawal of funding. Second, the banking sector is mostly exposed to NFCs and thus
Government Central Bank Banks NBFIs NFCs HHs ROW
Government 9 113 0 -854 0 1,530
Central bank -9 835 1 0 -6 -1,353
Banks -113 -835 107 -698 683 246
NBFIs 0 -1 -107 -62 -257 111
NFCs 854 0 698 62 4,933
HHs 0 6 -683 257 0
ROW -1,530 1,353 -246 -111 -4,933 0
Government 0.11% 1.32% 0.00% -9.97% 0.00% 17.85%
Central bank -0.11% 9.75% 0.02% 0.00% -0.07% -15.79%
Banks -1.32% -9.75% 1.25% -8.15% 7.97% 2.87%
NBFIs 0.00% -0.02% -1.25% -0.73% -2.99% 1.30%
NFCs 9.97% 0.00% 8.15% 0.73% 0.00% 57.57%
HHs 0.00% 0.07% -7.97% 2.99% 0.00% 0.00%
ROW -17.85% 15.79% -2.87% -1.30% -57.57% 0.00%
Source: IMF; and IMF staff estimates.
Table 1. Indonesia: BSA Matrix—Intersectoral Net Positions, 2014:Q4
(In trillions of rupiah)
(In percent of GDP, highlighted if > or < 30% of GDP)
Page 30
INDONESIA
INTERNATIONAL MONETARY FUND 29
vulnerable to a shock to NFCs balance sheets (e.g. higher nonperforming loans (NPLs)).5 The net
exposure of banks to the nonfinancial sector (NFCs and HHs combined) is slightly negative, as banks
are net borrowers from HHs. Indeed, loan to deposit ratio in Indonesia is relatively low as banks
fund their assets relying mainly on customer deposits.
Network Analysis
6. Network maps provide a graphical presentation of the BSA matrix. They can be used to
visualize the evolution of financial exposures among sectors over time. Figure 1 shows gross cross-
sectoral exposures along different dimensions in 2007 and 2014.6 The thickness of the arrow
indicates the size of gross exposure, while the color of the nodes distinguishes net creditors
(green) from net debtors (red).
7. Three key messages emerge from the analysis of the network maps. In particular, net
creditors in 2007 remained so in 2014; the size of both gross exposures (thickness of the arrows) and
net exposures (size of the nodes) has generally become larger over the period; and the NFC sector’s
borrowing from ROW represented the largest exposure in both 2007 and 2014.
Sensitivity Analysis
8. The BSA matrix is used to assess the sensitivity of the NFC sector to exogenous shocks.
Importantly, the analysis allows propagation of a shock from other sectors to NFC. The analysis is
5 Higher NPLs would be reflected in the BSA matrix when a write-off reduces the stock of loans.
6 Missing links in the 2007 map reflect the data gaps discussed above, which however do not materially constrain the
BSA.
Page 31
INDONESIA
30 INTERNATIONAL MONETARY FUND
conducted using two scenarios: Scenario 1—an exchange rate depreciation of 25 percent, and
Scenario 2—an exchange rate depreciation of 25 percent and a capital flow reversal, in which NFCs
are forced to replace 10 percent of their foreign funding with domestic funding either by drawing
from their funds in banks, or by obtaining new credit from banks. Either assumption has the same
implication in the BSA, specifically an increase of net assets (or exposure) of banks with respect to
NFCs. The sensitivity analysis, however, does not capture second-round effect. For instance, it does
not show if the deterioration of the NFC balance sheet has implications on bank lending or NPLs.
9. There are several key takeaways from the results summarized in Table 2:
In Scenario 1 (Table 2, first panel), external indebtedness of NFCs increases by about
14 percent of GDP. Following exchange rate depreciation, all assets and liabilities denominated
in foreign currency increase in value proportionally. Therefore, sectors that are net-borrowers in
foreign currency become further indebted, particularly the government and NFC sectors, due to
their reliance on borrowing from nonresidents.
In Scenario 2 (Table 2, second panel), external indebtedness of NFCs increases by about
eight percent of GDP, and the exposure of banks to NFCs increases by about
seven percent of GDP. NFCs indebtedness initially increases by the same 14 percent due to the
exchange rate depreciation shock. However, due the additional capital flow reversal shock, the
external borrowing is now partially replaced with borrowing with the banking sector.
Table 2. Indonesia: Sensitivity Analysis Using the BSA—Difference of Intersectoral Net Positions
Government Central Bank Banks NBFIs NFCs HHs ROW
Government -0.05% 0.11% 0.00% 0.00% 0.00% 4.46%
Central Bank 0.05% 0.44% 0.00% 0.00% 0.00% -3.95%
Banks -0.11% -0.44% -0.03% -0.63% 0.58% 0.62%
NBFIs 0.00% 0.00% 0.03% -0.16% 0.00% 0.23%
NFCs 0.00% 0.00% 0.63% 0.16% 14.39%
HHs 0.00% 0.00% -0.58% 0.00% 0.00%
ROW -4.46% 3.95% -0.62% -0.23% -14.39% 0.00%
Government -0.05% 0.11% 0.00% 0.00% 0.00% 4.46%
Central Bank 0.05% 0.44% 0.00% 0.00% 0.00% -3.95%
Banks -0.11% -0.44% -0.03% -6.90% 0.58% 0.62%
NBFIs 0.00% 0.00% 0.03% -0.16% 0.00% 0.23%
NFCs 0.00% 0.00% 6.90% 0.16% 8.12%
HHs 0.00% 0.00% -0.58% 0.00% 0.00%
ROW -4.46% 3.95% -0.62% -0.23% -8.12% 0.00%
Source: IMF; and IMF staff estimates.
(In percent of GDP, after 25 percent depreciation shock)
(In percent of GDP, after combined shocks)
Page 32
INDONESIA
INTERNATIONAL MONETARY FUND 31
Vector Autoregression (VAR) Analysis
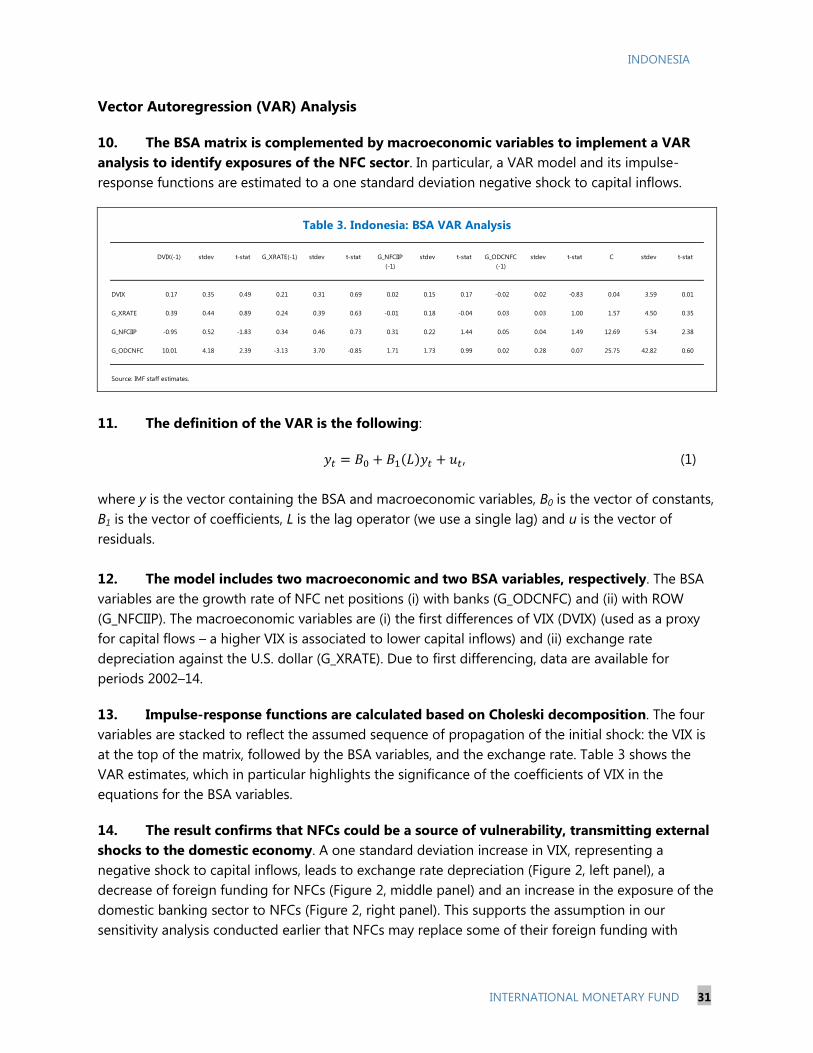
10. The BSA matrix is complemented by macroeconomic variables to implement a VAR
analysis to identify exposures of the NFC sector. In particular, a VAR model and its impulse-
response functions are estimated to a one standard deviation negative shock to capital inflows.
11. The definition of the VAR is the following:
, (1)
where y is the vector containing the BSA and macroeconomic variables, B0 is the vector of constants,
B1 is the vector of coefficients, L is the lag operator (we use a single lag) and u is the vector of
residuals.
12. The model includes two macroeconomic and two BSA variables, respectively. The BSA
variables are the growth rate of NFC net positions (i) with banks (G_ODCNFC) and (ii) with ROW
(G_NFCIIP). The macroeconomic variables are (i) the first differences of VIX (DVIX) (used as a proxy
for capital flows – a higher VIX is associated to lower capital inflows) and (ii) exchange rate
depreciation against the U.S. dollar (G_XRATE). Due to first differencing, data are available for
periods 2002–14.
13. Impulse-response functions are calculated based on Choleski decomposition. The four
variables are stacked to reflect the assumed sequence of propagation of the initial shock: the VIX is
at the top of the matrix, followed by the BSA variables, and the exchange rate. Table 3 shows the
VAR estimates, which in particular highlights the significance of the coefficients of VIX in the
equations for the BSA variables.
14. The result confirms that NFCs could be a source of vulnerability, transmitting external
shocks to the domestic economy. A one standard deviation increase in VIX, representing a
negative shock to capital inflows, leads to exchange rate depreciation (Figure 2, left panel), a
decrease of foreign funding for NFCs (Figure 2, middle panel) and an increase in the exposure of the
domestic banking sector to NFCs (Figure 2, right panel). This supports the assumption in our
sensitivity analysis conducted earlier that NFCs may replace some of their foreign funding with
DVIX(-1) stdev t-stat G_XRATE(-1) stdev t-stat stdev t-stat stdev t-stat C stdev t-stat
DVIX 0.17 0.35 0.49 0.21 0.31 0.69 0.02 0.15 0.17 -0.02 0.02 -0.83 0.04 3.59 0.01
G_XRATE 0.39 0.44 0.89 0.24 0.39 0.63 -0.01 0.18 -0.04 0.03 0.03 1.00 1.57 4.50 0.35
G_NFCIIP -0.95 0.52 -1.83 0.34 0.46 0.73 0.31 0.22 1.44 0.05 0.04 1.49 12.69 5.34 2.38
G_ODCNFC 10.01 4.18 2.39 -3.13 3.70 -0.85 1.71 1.73 0.99 0.02 0.28 0.07 25.75 42.82 0.60
Source: IMF staff estimates.
G_ODCNFC
(-1)
G_NFCIIP
(-1)
Table 3. Indonesia: BSA VAR Analysis
Page 33
INDONESIA
32 INTERNATIONAL MONETARY FUND
domestic bank lending, creating a channel for transmitting balance sheet vulnerabilities.
Nonetheless, the relatively few number of observations and the somewhat restrictive assumptions in
constructing the BSA matrix call for further robustness analysis as new information becomes
available.
Figure 2. Indonesia: Response to Negative Shock to Capital Inflows
Source: IMF staff estimates.
C. Panel Vector Autoregression Analysis7
15. Weaker macroeconomic conditions, including growth slowdown and rupiah
depreciation can negatively affect bank balance sheets. Vulnerabilities from rising corporate
foreign exchange leverage are rising.8 Evidence suggests that weaker real GDP growth and higher
rates of rupiah depreciation tend to increase bank NPLs. If there are spillbacks to the
macroeconomy, a vicious feedback loop can develop. This note attempts to identify existence of
such macro-financial linkages, exploiting information on bank-by-bank heterogeneity.
16. The paper estimates a panel vector autoregression (VAR) model that accounts for
bank-level heterogeneity, to identify a positive feedback loop between the macroeconomic and
bank-level balance sheet variables:
(2)
where is a vector of macroeconomic and bank-level variables, is the deterministic component,
is a lag operator and is the residual. The model was estimated using a panel VAR routine
pvar developed by Love and Zicchino (2006), which exploits a SystemGeneral Method of Moments
(GMM) estimator as in Arellano and Bover (1995).9
7 Similar work published recently by IMF staff includes Espinoza and Prasad (2010), Nkusu (2011), De Bock and
Demyanets (2012), Love and Turk (2013), and Callen et al (2015).
8 See accompanied SIP on corporate vulnerabilities for more details.
9 As the fixed effects are correlated with the regressors due to lags of the dependent variables, the mean-differencing
procedure commonly used to eliminate fixed effects would create biased coefficients. The orthogonality between
transformed variables and lagged regressors is preserved by forward mean-differencing (the Helmert procedure in
(continued)
Page 34
INDONESIA
INTERNATIONAL MONETARY FUND 33
17. Five macroeconomic and bank level variables were included. Among macroeconomic
variables, the VIX index captures global risk sentiment, commonly found in the literature to be a key
determinant of cross-border capital flows. Domestic economic activity is captured by real GDP
growth. Real rupiah depreciation against the US dollar affects profits and balance sheet conditions
of domestic agents, such as corporates, impacting broader economic activity. Real growth rates of
credit and deposits for the individual banks represent the channel through which shocks propagates
back to the real economy.
18. The identification of shocks is based on Choleski decomposition, where the variables are
stacked to explore how macroeconomic shocks affect bank-level variables first, and how the latter
affect the former in the second round. In particular, two macroeconomic variables {VIX, real GDP
growth} are stacked at the top. The bank-level variables {real deposit growth, real credit growth} are
stacked below the macro-level variables. Real rupiah depreciation against the U.S. dollar is stacked
at the bottom as commonly done in the literature. The model is estimated with one lag in view of
the short time series dimension (2000–14).
19. The estimated results are summarized as follows. Table 4 presents the estimated
coefficients from the system GMM approach in the panel VAR model. The estimated coefficients are
mostly statistically significant, except for those of the deposit growth equation.10
Figure 3 visually
Arellano and Bover, 1995), which removes the mean of the future observations. Then, lagged regressors are used as
instruments to estimate the coefficients by system GMM.
10 The counterintuitive response of real deposit growth to several variables may be due to lack of statistical
significance of the estimated coefficients in the deposit growth equation. In particular, real deposit growth rises due
to a rise in the VIX index or a decline in real GDP growth.
Page 35
INDONESIA
34 INTERNATIONAL MONETARY FUND
summarizes the directions and magnitude of responses, which are broadly consistent with findings
in the literature.11
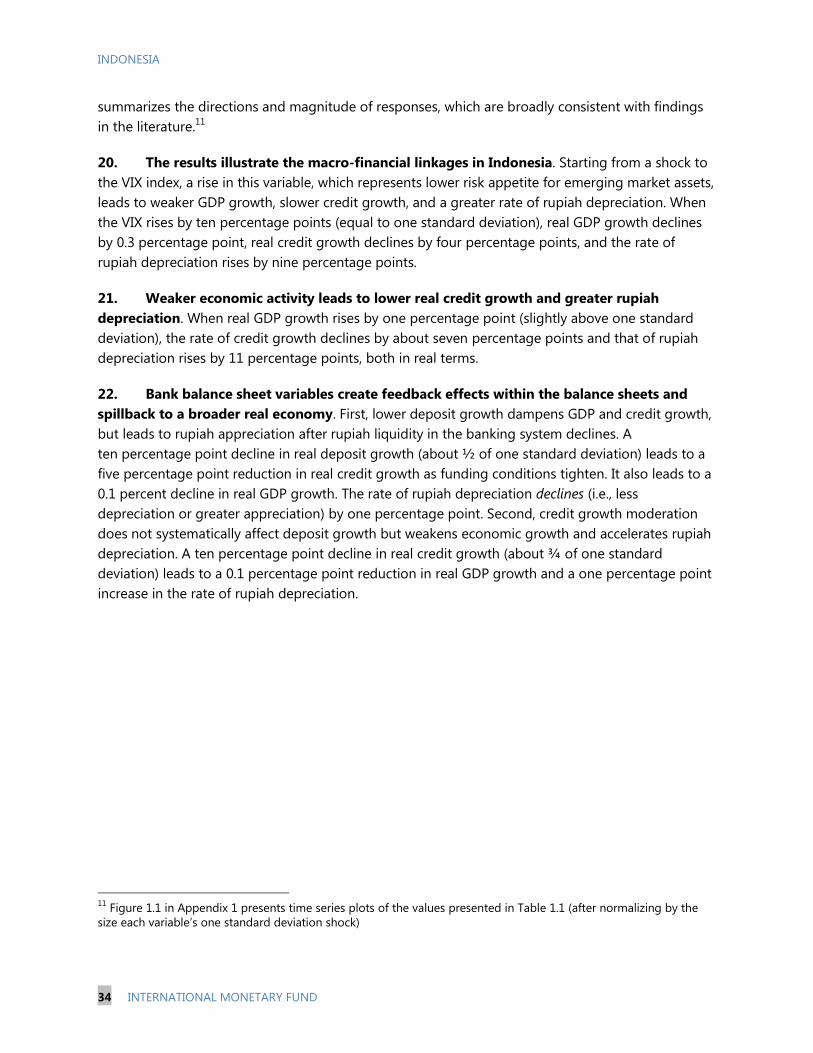
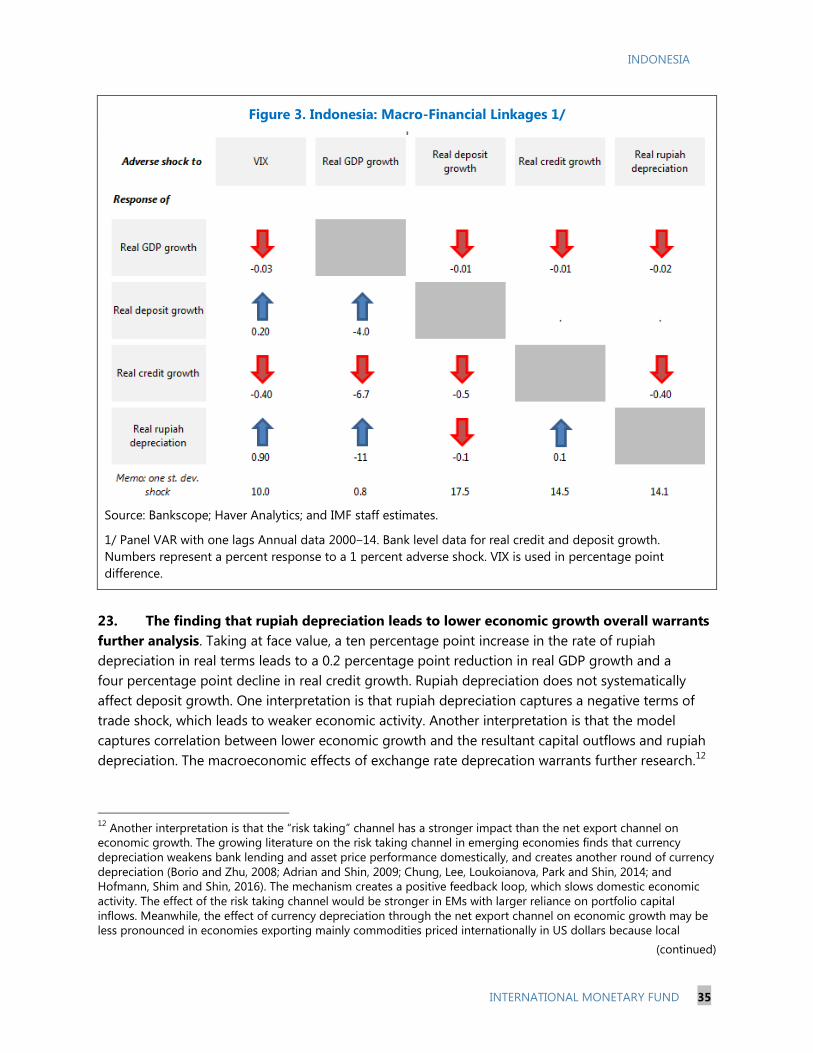
20. The results illustrate the macro-financial linkages in Indonesia. Starting from a shock to
the VIX index, a rise in this variable, which represents lower risk appetite for emerging market assets,
leads to weaker GDP growth, slower credit growth, and a greater rate of rupiah depreciation. When
the VIX rises by ten percentage points (equal to one standard deviation), real GDP growth declines
by 0.3 percentage point, real credit growth declines by four percentage points, and the rate of
rupiah depreciation rises by nine percentage points.
21. Weaker economic activity leads to lower real credit growth and greater rupiah
depreciation. When real GDP growth rises by one percentage point (slightly above one standard
deviation), the rate of credit growth declines by about seven percentage points and that of rupiah
depreciation rises by 11 percentage points, both in real terms.
22. Bank balance sheet variables create feedback effects within the balance sheets and
spillback to a broader real economy. First, lower deposit growth dampens GDP and credit growth,
but leads to rupiah appreciation after rupiah liquidity in the banking system declines. A
ten percentage point decline in real deposit growth (about ½ of one standard deviation) leads to a
five percentage point reduction in real credit growth as funding conditions tighten. It also leads to a
0.1 percent decline in real GDP growth. The rate of rupiah depreciation declines (i.e., less
depreciation or greater appreciation) by one percentage point. Second, credit growth moderation
does not systematically affect deposit growth but weakens economic growth and accelerates rupiah
depreciation. A ten percentage point decline in real credit growth (about ¾ of one standard
deviation) leads to a 0.1 percentage point reduction in real GDP growth and a one percentage point
increase in the rate of rupiah depreciation.
11
Figure 1.1 in Appendix 1 presents time series plots of the values presented in Table 1.1 (after normalizing by the
size each variable’s one standard deviation shock)
Page 36
INDONESIA
INTERNATIONAL MONETARY FUND 35
Figure 3. Indonesia: Macro-Financial Linkages 1/
Source: Bankscope; Haver Analytics; and IMF staff estimates.
1/ Panel VAR with one lags Annual data 2000‒14. Bank level data for real credit and deposit growth.
Numbers represent a percent response to a 1 percent adverse shock. VIX is used in percentage point
difference.
23. The finding that rupiah depreciation leads to lower economic growth overall warrants
further analysis. Taking at face value, a ten percentage point increase in the rate of rupiah
depreciation in real terms leads to a 0.2 percentage point reduction in real GDP growth and a
four percentage point decline in real credit growth. Rupiah depreciation does not systematically
affect deposit growth. One interpretation is that rupiah depreciation captures a negative terms of
trade shock, which leads to weaker economic activity. Another interpretation is that the model
captures correlation between lower economic growth and the resultant capital outflows and rupiah
depreciation. The macroeconomic effects of exchange rate deprecation warrants further research.12
12
Another interpretation is that the “risk taking” channel has a stronger impact than the net export channel on
economic growth. The growing literature on the risk taking channel in emerging economies finds that currency
depreciation weakens bank lending and asset price performance domestically, and creates another round of currency
depreciation (Borio and Zhu, 2008; Adrian and Shin, 2009; Chung, Lee, Loukoianova, Park and Shin, 2014; and
Hofmann, Shim and Shin, 2016). The mechanism creates a positive feedback loop, which slows domestic economic
activity. The effect of the risk taking channel would be stronger in EMs with larger reliance on portfolio capital
inflows. Meanwhile, the effect of currency depreciation through the net export channel on economic growth may be
less pronounced in economies exporting mainly commodities priced internationally in US dollars because local
(continued)
Page 37
INDONESIA
36 INTERNATIONAL MONETARY FUND
D. Concluding Remarks
24. The results of the BSA analysis highlight NFC’s large reliance on foreign funding and,
as a result, a potential source of vulnerability for the Indonesian economy. A depreciation
shock or a negative shock to global risk sentiment may affect NFC’s foreign funding. In the case of a
negative shock to capital inflows, the shock may propagate the vulnerability to the domestic
banking sector, for instance if NFCs are to replace a part of foreign funding with domestic credit.
25. The results from the panel VAR approach using a combination of macroeconomic and
bank level data point to the macro-financial linkages in Indonesia. In particular, worsening
global risk sentiment, which tends to lower appetite for emerging market assets, leads to
moderation in GDP growth, credit growth and a greater rate of rupiah depreciation. Weaker
economic activity leads to lower real credit growth and greater rupiah depreciation. Bank balance
sheet variables create feedback effects within the balance sheets and spillback to a broader real
economy. Finally, rupiah depreciation puts pressure on profits and currency mismatches on balance
sheets, leading to lower economic and credit growth.
26. Looking ahead, the authorities should continue to monitor macro-financial linkages
and maintain strong macroeconomic fundamentals. In particular, the resilience of the NFC sector
is of primary importance, as their funding structure could transmit external shocks to the domestic
economy partly through the banking system. This is particularly the case if global and domestic
conditions remained unfavorable for a protracted period (e.g. global risk sentiment remained weak,
economic growth stuck at low gear, and rupiah deprecation continued). The first line of defense for
Indonesia against adverse shocks is to keep its house in order. In other words, the country should
maintain strong and credible monetary and fiscal policy and sustain the resilience of the domestic
financial and corporate sector partly by continue upgrading the financial stability safety net.
currency depreciation would not improve competitiveness much, particularly when import content of the trade
balance is large. Therefore, greater rupiah depreciation could lead to lower economic growth in Indonesia.
Page 38
INDONESIA
INTERNATIONAL MONETARY FUND 37
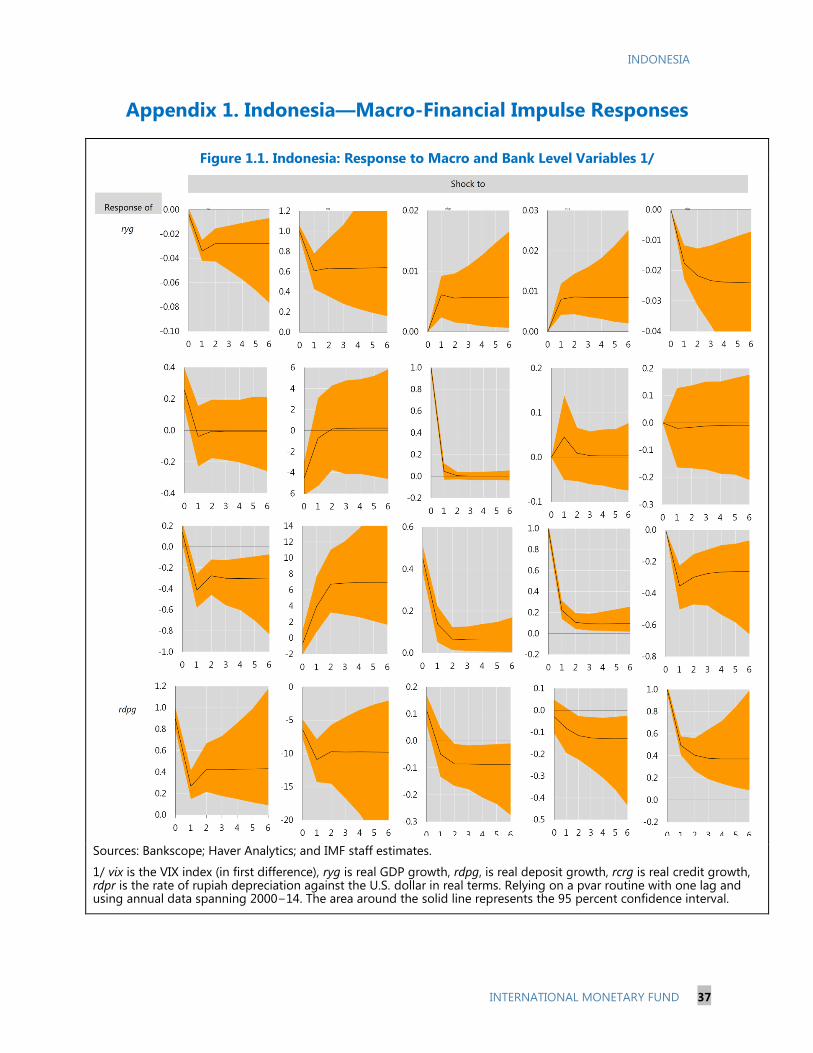
Appendix 1. Indonesia—Macro-Financial Impulse Responses
Figure 1.1. Indonesia: Response to Macro and Bank Level Variables 1/
Sources: Bankscope; Haver Analytics; and IMF staff estimates.
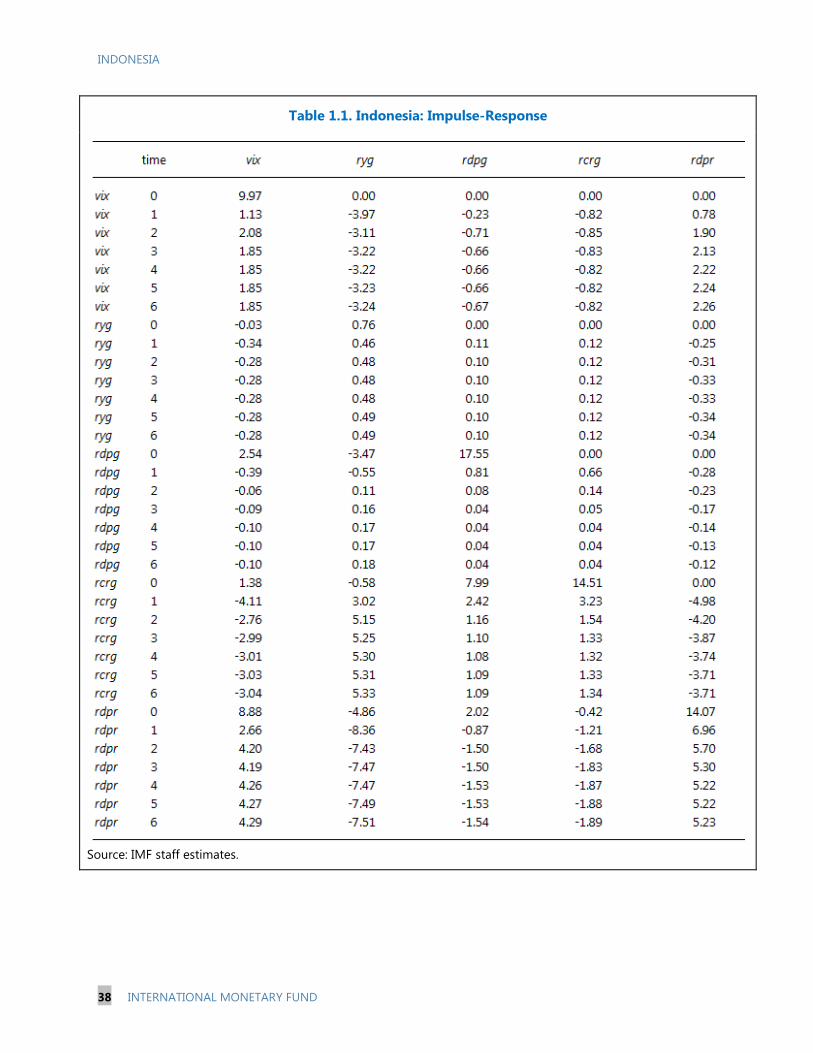
1/ vix is the VIX index (in first difference), ryg is real GDP growth, rdpg, is real deposit growth, rcrg is real credit growth, rdpr is the rate of rupiah depreciation against the U.S. dollar in real terms. Relying on a pvar routine with one lag and using annual data spanning 2000−14. The area around the solid line represents the 95 percent confidence interval.
Page 39
INDONESIA
38 INTERNATIONAL MONETARY FUND
Table 1.1. Indonesia: Impulse-Response
Source: IMF staff estimates.
Page 40
INDONESIA
INTERNATIONAL MONETARY FUND 39
References
Adrian, T., and H. Shin, 2009, “Financial Intermediaries and Monetary Economics,” Federal Reserve
Bank of New York Staff Reports No. 398.
Arellano, M., and O. Bover, 1995. “Another Look at the Instrumental Variable Estimation of Error-
Components Models,” Journal of Econometrics, Vol. 68, Issue 1, pp. 29–51.
Borio, C., and H. Zhu, 2008, “Capital Regulation, Risk-Taking and Monetary Policy: A Missing Link in
the Transmission Mechanism?,” BIS Working Papers No. 268 (Basel: Bank for International
Settlements).
Callen, T, P. Khandelwal, K. Miyajima, and A. Santos, 2015, “Oil Prices, Financial Stability, and the Use
of Countercyclical Macroprudential Policies in the GCC,” Paper prepared for the Annual
Meeting of Ministers of Finance and Central Bank Governors (Washington: International
Monetary Fund).
Caprio, G Jr., 2011, Macro-Financial Linkages in IMF Research, IEO Background Paper No. 11/07
(Washington: International Monetary Fund, Independent Evaluation Office).
Chung K., J. Lee, E. Loukoianova, H. Park, and H. S. Shin, 2014, "Global Liquidity Through the Lens of
Monetary Aggregates," IMF Working Paper No. 14/9 (Washington: International Monetary
Fund).
De Bock, R., and A. Demyanets, 2012, “Bank Asset Quality in Emerging Markets: Determinants and
Spillovers,” IMF Working Paper No. 12/71 (Washington: International Monetary Fund).
Espinoza, R., and A. Prasad, 2010, “Nonperforming Loans in the GCC Banking Systems and their
Macroeconomic Effects,” IMF Working Paper No. 10/224 (Washington: International Monetary
Fund).
Hofmann B., I. Shim, and H. S. Shin, 2016, “Sovereign Yields and the Risk-Taking Channel of Currency
Appreciation,” BIS Working Papers No.538 (Basel: Bank for International Settlements).
International Monetary Fund, 2016, The Balance Sheet Approach: Lessons from the Fund-wide Pilot
Project, forthcoming (Washington).
———, 2014, 2014 Triennial Surveillance Review, IMF Policy Paper. Available via the Internet:
http://www.imf.org/external/np/spr/triennial/2014/.
———, 2015, Balance Sheet Analysis in Fund Surveillance, IMF Policy Paper. Available via the
Internet: http://www.imf.org/external/np/pp/eng/2015/061215.pdf.
Page 41
INDONESIA
40 INTERNATIONAL MONETARY FUND
Love, I, and R. Turk, 2013, “Macro-Financial Linkages in Egypt: A Panel Analysis of Economic Shocks
and Loan Portfolio Quality,” IMF Working Paper No. 13/271 (Washington: International
Monetary Fund).
Love, I., and L. Zicchino, 2006, “Financial Development and Dynamic Investment Behavior: Evidence
from Panel Vector Autoregression,” The Quarterly Review of Economics and Finance, Vol. 46,
pp. 190–210.
Nkusu, M., 2011, “Nonperforming Loans and Macro-financial Vulnerabilities in Advanced
Economies,” IMF Working Paper No. 11/161 (Washington: International Monetary Fund).
Page 42
INDONESIA
INTERNATIONAL MONETARY FUND 41
INFRASTRUCTURE DEVELOPMENT IN INDONESIA1
This paper discusses macro-fiscal issues surrounding infrastructure development in Indonesia and
assesses the institutional framework for public investment, including state-owned enterprises (SOEs)
and public-private partnerships (PPPs). The government has attempted to address Indonesia’s large
infrastructure gap by setting up an ambitious plan and demonstrated early successes in boosting
infrastructure spending. Nevertheless, structural impediments remain to be addressed going forward.
Fiscal space to increase government infrastructure spending should be created by increasing revenue
through an efficient package of tax measures. There is scope to improve public investment institutions
in Indonesia, in particular for better coordination across ministries and local governments, as well as
for enhanced implementation of infrastructure projects. Finally, while SOEs and PPPs can play a bigger
role in reducing the infrastructure gap, there is a need to carefully manage fiscal risks from contingent
liabilities.1This calls for gradual implementation of the infrastructure plan, supported by steady
progress in structural reforms.
A. Introduction
1. Indonesia’s infrastructure gap remains wide compared to its peers, particularly in
transport and power (Figure 1). Logistics costs are among the highest in Asia, estimated at
25 percent of GDP a year (vs. peers’ 13–20 percent), reflecting poor connectivity among islands and
a limited national road network. Electricity production is also insufficient, at 20–60 percent per capita
of its peers. According to the World Economic Forum in 2014, Indonesia ranked 56th out of 144
countries on infrastructure, compared with Malaysia (25th
), China (46th
), and Thailand (48th
) in 2014.2
The large infrastructure gap has increased distribution costs and inhibited industry competitiveness
and weakened macroeconomic conditions. This has limited FDI flows and weakened export
competitiveness.
2. Despite the gap, infrastructure investment was limited over the past years, constrained
by limited budget space and structural bottlenecks. In Indonesia, capital spending by general
government was low, at 3¼ percent of GDP on average in 2011‒14, one of the lowest among EM
peers (Figure 2). During this period, fiscal space for capital spending was constrained by a low
revenue-to-GDP ratio as well as large energy subsidies, which reached one-fifth of the central
government’s budget in 2014. Also structural problems delayed infrastructure projects, including
limited capacity of central and local governments to execute the capital budget; multiple layers of
regulations; and protracted land acquisition procedures. Under-investment has affected growth by
catalyzing less private investment and dampening productivity gains.
1 Prepared by Teresa Curristine, Masahiro Nozaki, and Jongsoon Shin.
2 World Economic Forum, 2014, The Global Competitiveness Report 2014‒2015.”
Page 43
INDONESIA
42 INTERNATIONAL MONETARY FUND
3. To close the infrastructure gap, the government has set ambitious plans for
infrastructure development. The government is targeting to spend around US$ 480 billion (about
50 percent of GDP) for infrastructure investment during 2015–19.3 The plans center on transport and
energy, including an ambitious plan to increase capacity of electricity generation by 35GW, which is
estimated to cost around nine percent of GDP (Figure 3). The public sector will provide funding for
two-thirds of the total investment (around 30 percent from the central government, 11 percent from
local governments, and 22 percent from SOEs). The rest is to be financed by the private sector,
mainly through Public-Private Partnerships (PPPs) (Figure 4).
4. While the government has recently accelerated capital spending supported by a
number of reform measures, challenges remain. Capital spending of the central government
increased from 1.4 percent of GDP in 2014 to 1.9 percent in 2015. The budget execution dramatically
increased in the second half of 2015, reflecting concerted efforts by the government.4 Local
governments have been encouraged to ramp up capital spending, supported by an increase in
transfers linked to infrastructure spending. To strengthen investment capacity and provide
confidence, the government has injected equity to SOEs, totaling 0.6 percent of GDP in 2015, while
aiming to accelerate PPP projects. Nevertheless, the scope to further increase capital spending at the
general government level would be limited in the absence of revenue mobilization. While the
government has begun a series of structural reforms including streamlining fragmented regulations
and developing a new legal framework to facilitate land acquisition, the effectiveness of these
reforms will be tested in coming years (Box 2).
3 Coordinating Ministry of Economic Affairs, Acceleration of Priority Infrastructure Delivery, October 2015.
4 President Jokowi, for instance, established an intergovernment team dedicated to budget realization evaluation
and monitoring, which reports to the President every 2 weeks.
Page 44
INDONESIA
INTERNATIONAL MONETARY FUND 43
5. Against this background, this paper discusses macro-fiscal issues surrounding
infrastructure development in Indonesia and evaluates the institutions for public investment.
The paper proceeds as follows. Section B analyzes macro-fiscal impact of implementing the plan to
ramp up infrastructure spending using the Global Integrated Monetary and Fiscal (GIMF) model.
Section C assesses institutions for public investment management, while Section D evaluates the
government’s plan to increase the role of SOEs and PPPs in infrastructure development. Section E
concludes by summarizing key findings and policy implications.
B. Macro-Fiscal Implications of Infrastructure Development
6. Ramping up infrastructure spending has significant macro-fiscal implications. First, it
raises output growth by boosting aggregate demand as well as production capacity of the economy.
Second, it will affect the fiscal account, as the higher government spending would need to be
financed by revenue-raising measures, expenditure cuts, and/or higher deficit. Third, these shocks
would affect corporate and household sectors through changes in macroeconomic variables such as
inflation, wages, the interest rate, and the exchange rate. Finally, in an open economy, these shocks
will also affect external balance, possibly resulting in higher external current account deficit.
7. A macro-fiscal simulation model for Indonesia is constructed to analyze quantitatively
macro-fiscal implications of infrastructure spending ramp-up. The model is the Global
Integrated Monetary and Fiscal (GIMF), a multicountry Dynamic Stochastic General Equilibrium
(DSGE) model with optimizing households and firms (Anderson and Others, 2013). The
nonRicardian features of the model such as sticky prices and liquidity-constrained households
provide for non-neutral impact of fiscal policy shocks. To analyze macro-fiscal impact of
infrastructure ramp-up, a steady state is constructed to mimic the current macroeconomic
conditions in Indonesia, and then is shocked by an increase in public investment by
three percentage points of GDP over 2016–20 (an increase of 0.6 percent of GDP in each year).
8. Macro-fiscal implications would differ depending on how the spending increase is
financed. In this regard, four scenarios are considered: the increase in public investment is financed
by (i) a consumption tax rate increase; (ii) increases in corporate and labor income tax rates; (iii) an
increase in lump sum taxes; and (iv) government borrowing (i.e., higher deficit). The third scenario is
Page 45
INDONESIA
44 INTERNATIONAL MONETARY FUND
presented to examine an option with the least distortionary tax measure. The fourth scenario is
presented for illustrative purpose, even though it would not be consistent with the reality in
Indonesia, where the fiscal rule caps general government deficit at 3 percent of GDP. Similarly, in
each of the tax-financed scenarios, the idea of raising the needed revenue with a single tax measure
may be unrealistic, but they are intended to highlight differences in macroeconomic impact of
various tax measures.
9. The main simulation results presented in Table 1 suggests the importance of financing
infrastructure ramp-up not by borrowing, but by a well-designed, efficient tax package.
In all scenarios, the increase in public investment boosts annual output growth by
0.2‒0.6 percentage points over 2016–20. In the tax-financed scenarios (Scenarios 1–3), the
positive growth impact from higher public investment, through both demand and supply
channels as discussed above, is dampened by the negative impact of tax increases on private
consumption or investment, or both. The dampening effect on consumption and investment is
pronounced in the scenarios with income- and consumption-tax increases (Scenarios 1 and 2),
limiting the increase in growth to 0.2–0.3 percentage points. The lump sum tax scenario
(Scenario 3) achieves the largest growth impact (0.6 percentage point), as this is the least
distortionary tax option. The deficit-financing scenario (Scenario 4) achieves relatively high
growth impact (0.5 percentage point). Here, the boost in aggregate demand is muted by a
decline in net exports.
Fiscal balances would be preserved in the tax-financed scenarios. By construction, general
government deficit is not affected under these scenarios, while the ratio of public debt to GDP
decreases slightly reflecting higher output growth. In the deficit-financed scenario, fiscal deficit
and public debt rise by 3.4 percentage points of GDP and 8.4 percentage points of GDP by 2020,
respectively.
The changes in external current account balance largely reflect the savings and investment
balance. In the deficit-financed scenario, the reduction in net savings in the fiscal sector is only
partially offset by an increase in net savings in household and corporate sectors. As a result, the
current account balance would have to deteriorate by as much as 3.1 percent of GDP by 2020.
On contrary, the deterioration in current account balance is much lower in the tax-financed
scenarios, as the domestic saving-investment balance is not disrupted by fiscal imbalance.
Page 46
INDONESIA
INTERNATIONAL MONETARY FUND 45
10. The simulation results should be viewed with caution, because the GIMF model would
not be able to fully mimic the reality of Indonesia. In the tax-financed scenarios with
consumption or income tax, tax rates would need to be raised significantly, exerting a large negative
influence on domestic private demand. Alternatively, if revenue could be raised by less distortionary
measures such as base-broadening reforms of consumption and income taxes, the negative impact
on demand could be less pronounced. In addition, raising additional revenues of three percent of
GDP from lump sum tax would be unrealistic. In the context of Indonesia, an option akin to lump
sum tax would be property taxes and excises, which would not likely have potential to raise
additional revenues of three percent of GDP.
C. Institutions for Public Investment Management in Indonesia
11. Countries with stronger public investment management institutions have more
predictable, credible, efficient, and productive investments. To help countries evaluate the
strength of the public investment management practices, the IMF has developed a new Public
Investment Management Assessment (PIMA).5 The PIMA evaluates 15 institutions that shape public
investment decision-making at three key stages (see Figure 5): first, planning sustainable investment
across the public sector; second, allocating investment to the right sectors and projects; and third,
implementing projects on time and on budget. This enables to cover the full public investment cycle,
including national and sectoral planning, investment budgeting, project appraisal and selection, and
managing and monitoring of project implementation.
5 For more information, visit http://www.imf.org/external/np/fad/publicinvestment/.
Page 47
INDONESIA
46 INTERNATIONAL MONETARY FUND
12. According to preliminary PIMA assessment, there is scope to improve public
investment institutions in Indonesia, in particular for coordination and implementation
(Box 1).
On the planning phase,
Indonesia has well-
developed national and
sector planning processes.
However, there appears
room to improve
coordination among
ministries and with local
governments on planning.
Specifically, each spending
ministry develops its own
medium-term strategic plan,
which is not necessarily in
line with the national plan. Also, central-local coordination for land acquisition and
regulations could be improved.
The institutions for the allocation phase are mixed. The medium-term plans appropriately
include resource envelope with breakdown across ministries and programs. However, project
appraisal and selection are largely devolved to spending ministries, and there are limited
central guidelines and oversight on feasibility studies for infrastructure projects. This is also
the case for projects implemented by local governments and SOEs.
Indonesia scores relatively poorly on the implementation phase. In particular, multiyear
capital budgeting would need to be further developed, and within a year, budget execution
would need smoothing through better planning. Also, the procedure for monitoring
individual projects varies across ministries and local governments. There is limited use of
systematic ex-post evaluations.
D. The Role of SOEs and PPPs in Infrastructure Development
Stated-Owned Enterprises (SOEs)
13. The government envisages a greater role for SOEs in infrastructure development. With
a view to pushing SOEs to ramp up infrastructure investment, the government has taken a
multipronged approach, including capital injection, limiting dividend payments, and upgrading the
financing framework.
Page 48
INDONESIA
INTERNATIONAL MONETARY FUND 47
Capital injection. To expand investment capacity and provide confidence, the government has
injected new capital to SOEs, focused on electricity, construction, and transportation SOEs.6
In 2015, the injected funds amounted to around 0.6 percent of GDP, and for 2016, another
capital injection of around 0.3 percent of GDP has been planned (Figure 6). To ensure the proper
use of the funds, the government has limited the use of the funds to specific priority
infrastructure projects.7
Limiting dividend payments. To encourage capital spending and send a strong signal of its
intention, the government has allowed SOEs to lower dividend payments, as long as the retained
earnings are channeled into infrastructure investment. Also, asset revaluation has been allowed
to expand SOE’s balance sheets (Figure 7).
Financing framework.8 The role of SOEs has strengthened, with the improved financing
framework. PT SMI is envisaged to become an infrastructure bank, supported by the large
capital injection (0.2 percent of GDP). Direct borrowing by SOEs from international financial
institutions (IFIs) has been allowed, under a sovereign guarantee. The scope of Indonesia
Infrastructure Guarantee Fund (IIGF) has been also expanded to guarantee SOE’s borrowing.
14. On the back of the strengthened balance sheets, SOEs are set to accelerate
infrastructure investment. The government projects capital expenditure of SOEs to rise to
2.7 percent of GDP in 2015 and 3.1 percent of GDP in 2016, from 2.4 percent of GDP in 2014
(Figure 8). This is in contrast with a modest rise in the government’s capital spending envisaged in
the staff baseline, to 3.2 percent in 2016 from 3.1 percent in 2014. By sector, spending on electricity
generation accounts for the largest part of the spending as of 2015:H1, followed by the mining and
construction industries (Figure 9).
6 Including PT PLN (electricity), PT Hutama Karya (construction), PT Waskita Karya (construction), PT Angkasa Pura (air
transportation), and PT Kereta Api (railway transportation)
7 The government has incentivized the management of SOEs to take a proactive role in infrastructure investment, by
holding regular discussions on the implementation of their expenditure plans and evaluating execution results in key
performance indicators.
8 Asian Development Bank, 2015, Highlights of Selected Infrastructure Reforms.
Page 49
INDONESIA
48 INTERNATIONAL MONETARY FUND
15. A close motoring of contingent liabilities and financial performance of SOEs is
warranted, together with the gradual implementation of infrastructure plans. Fiscal risk
appears moderate, as guaranteed debt for SOEs is estimated at around 0.8 percent of GDP per
annum into 2019 (Figure 10).9 The government has also limited the use of the injected equity and
retained earnings to specific priority projects, and has put in place a supervisory scheme.10
Nevertheless, close monitoring of SOE’s infrastructure projects is warranted, in view of the expected
rapid increase in investment and rising external debt, as well as weakening performance of SOEs
(Figure 11).11
Given the need to ensure high quality investment and weak execution capacity, the
gradual implementation of infrastructure projects is recommended. This will help minimize potential
adverse effects of increased public borrowing on interest rates (i.e., crowding out private
investment) and of higher contingent liabilities.
9 Based on the estimates of the Ministry of Finance.
10 SOEs are required to prepare quarterly reports to SOEs where the usage of funds is closely monitored. An audit
committee also supervises the expenditure of SOEs.
11 “Managing Fiscal Risks in Indonesia,” in Indonesia—Selected Issues, IMF Country Report No. 15/75.
Page 50
INDONESIA
INTERNATIONAL MONETARY FUND 49
Public-Private Partnerships (PPPs)
16. Notwithstanding an initiative to promote PPPs since the early 2000s, implementation
of PPP projects have been slow until recently. The slow progress has been in stark contrast with
other peers, particularly Mexico and Chile, where PPPs contributed to more than 20 percent of
public infrastructure investment (Table 2).12
Indonesia saw a few successful cases of PPP projects in
toll roads and power sectors, while many projects in the water and transportation sectors made little
progress.
17. The slow progress was due to complex regulations, lack of coordination, and weak
execution capacity. Delayed land acquisition (Box 2) and complex regulations (i.e., several layers of
national and local regulations) were the major bottleneck. Lack of leadership and coordination (e.g.,
duplication of evaluation) across line ministries and local government was also the major barrier. On
financing, weak capacity to execute complex financing projects was a drag, together with a low base
of institutional investors which has limited appetite for long-term investments. Restrictions on
foreign participation remain relatively high in the infrastructure sector.
18. To accelerate PPP projects, the government has improved the institutional and
regulatory framework, particularly on prioritizing and monitoring projects:
KPPIP (The Committee for Accelerated Infrastructure Delivery) was established as a
coordinating body to focus on the delivery of priority projects, including PPP projects. The
setup of KPPIP has strengthened coordination across line ministries and government agencies.13
12
OECD, Public Governance of Public-Private Partnerships, May 2012.
13 The committee is chaired by the Coordinating Minister for Economic Affairs, with members from the Minister of
Finance, Minister of National Development Planning/Head of National Development Planning Agency
(BAPPENAS) and Head of National Land Agency (BPN).
Page 51
INDONESIA
50 INTERNATIONAL MONETARY FUND
KPPIP has identified 22 priority projects so far, with the amount totaling eight percent of GDP.
KPPIP has also expanded the evaluation expertise, by bringing in financial experts from the
private sector.
The PPP Unit was set up in the Ministry of Finance, as a one-stop-shop for PPP
coordination and facilitation. Currently, eight PPP projects are in the pipeline, totaling around
two percent of GDP. The PPP unit has strengthened the review process to assess contingent
liabilities.
PPP modality has expanded to social infrastructure and availability-based PPP. Adding to
economic infrastructure, a PPP modality can be used for social infrastructure, including facilities
for education, sports, arts, tourism, and health, public housing, as well as for commercial
facilities. In addition to user-pay PPP, availability-based PPP (i.e., the source of payment is the
government) and hybrid PPP (a mix of the user-pay and availability-based PPP) are allowed.
Restrictions on foreign ownership were eased in some of the transport and energy sectors.
In the transport sector, the foreign ownership limit for a seaport facility increased to 50 percent
from 49 percent. The 100 percent of foreign ownership for a power plan (greater than 10
MWV) has been allowed, up from 95 percent previously.
The regulatory framework on PPP has improved,14
together with other deregulations to
stimulate investment, including streamlining licensing process and time.
19. The government needs to monitor contingent liabilities closely, with the prudent
implementation of projects. The enhanced institutional framework contributes to screening
projects, and the amount of pipeline guarantees for PPP appears to be moderate, at around
0.3 percent of GDP per annum into 2019.15
Nevertheless, since a greater number of PPPs will likely
be launched with a potential increase in fiscal risk, the authorities need to closely monitor
contingent liabilities as well as proper risk sharing between the private and public sectors. The pace
of implementation will need to be prudent and gradual, given the long-standing implementation
problems such as institutional and regulatory weakness (i.e., land right issues) and the constrained
execution capacity (i.e., local governments), as well as the need to prioritize high impact projects. In
addition, it would be important to set up uniform guidelines for project selection and feasibility
studies for infrastructure projects by SOEs, as discussed in the previous section.
20. Financial deepening would also promote infrastructure development. Mobilizing
savings to finance infrastructure is key to sustaining infrastructure investment. Deepening of
financial markets, including growing the pension and insurance companies as well as developing
14
(i) In addition to a tender mechanism, a direct appointment of concessionaire is allowed under certain conditions;
and (ii) bundling of projects is allowed to accommodate projects that extend beyond the boundary of one agency or
local government; and; and (iii) private sector and IFIs can support preparation of PPP projects.
15 Based on the estimates of the Ministry of Finance.
Page 52
INDONESIA
INTERNATIONAL MONETARY FUND 51
corporate bond markets, is highly conducive to creating demand and supply of long-term
infrastructure financing. Diverse financing vehicles should be developed, including infrastructure
bonds and securitized instruments, which could benefit from a sound legal framework.16
Efforts
should continue to expand capacity of the fiscal authorities to prepare a complex financing scheme,
particularly at the local government level.
E. Conclusion
21. The main findings and policy implications of this chapter are summarized as follows.
The government’s ambitious plans for infrastructure development would rightly address
infrastructure bottleneck in Indonesia. The government has achieved early successes in
accelerating capital spending, supported by a number of reform measures.
Going forward, structural impediments remain to be addressed, including revenue capacity as
well as the regulatory and institutional framework, with due consideration for fiscal risks. These
would call for gradual implementation of the infrastructure plan, supported by steady progress
in structural reforms.
A macro-fiscal simulation suggests that ramping up public investment will have positive impact
on growth. Maximizing the growth impact in the context of macroeconomic stability would
require a welldesigned and least-distortionary package of tax measures. While hypothetical,
ramping up public investment without revenue mobilization would lead to large fiscal and
current account deficit, giving rise to funding risks.
There is scope to improve public investment institutions in Indonesia. Coordination across
ministries could be enhanced, for example by establishing central guidelines and oversight on
feasibility studies for infrastructure projects. Also, central-local coordination could be improved
in the area of land acquisition and regulations. Indonesia’s institutions for implementing
infrastructure projects are relatively weak, and there is need for further improvements in
multiyear capital budgeting and smooth within-year budget execution.
The increasing role of SOEs and PPPs could help reduce the infrastructure gap, while fiscal risks
appear to be moderate at this juncture. Nevertheless, the authorities should closely monitor
potential fiscal risks, and implement the ambitious infrastructure development plans in a orderly
manner, in light of long-standing fundamental constraints, such as the institutional and
coordination weakness, the limited execution capacity, and the reduced fiscal space. The
prudent implementation will also help ensure high quality of infrastructure development.
16
Infrastructure funds were introduced in 2013 in Thailand. The funds are listed instruments to facilitate
infrastructure development, launched by corporates which plan infrastructure development, including in the telecom
and utilities sectors (Mandiri Institute and Oliver Wyman, Financing deepening in Indonesia, 2015).
Page 53
INDONESIA
52 INTERNATIONAL MONETARY FUND
Box 1. Indonesia: Assessment of Public Investment Institutions
Planning stage
Public investment planning is guided by national and sectoral planning. The national long-term
development plan 2011‒25 is broken down into a series of five-year medium-term development plans
(RPJMN). At the start of each Presidential term a new RPJMN is prepared by the Ministry for Planning
(BAPPENAS) reflecting inputs from spending ministries, local governments, and Parliament.
However, each spending ministry develops its own medium-term strategic plan (Renstra) containing
medium-term outputs although not necessarily the same as in RPJMN.
There appears scope to improve central-local coordination in the areas of land acquisition, regulations
(e.g., environmental protection), integrated planning, and capacity development.
Allocating stage
The RPJMN is developed within a medium-term resource envelope and provides details on the
allocation of funds across ministries and programs. Each ministry’s annual work plan and annual budget
proposal contain three-year forward estimates at the program and activity level.
Budget unity has improved. The size of extra budgetary operations is not significant. The majority of
capital projects are included in the annual budget.
Nevertheless, when making allocative decisions on capital projects, recurring costs and medium-term
implications are not clearly presented.
Project appraisal and selection are largely devolved to spending ministries, while there are limited
central guidelines and oversight. BAPPENAS sets and monitors aggregate capital spending ceilings and
output targets, while spending ministries appraise and select individual projects to meet these outputs.
This is also the case for infrastructure projects implemented by local governments and SOEs.
Implementing stage
While information on total projects costs covering multiple years is included in planning documents,
outlays are approved by Parliament on an annual basis. The government has recently changed the
regulations to allow unspent budget to be carried forward to the next fiscal year in certain cases.
Although the budget is approved to allow sufficient time to plan execution, capital budget execution is
concentrated in the last quarter. Although the budget is approved two months before the start of the
year and detailed cash forecasts are prepared, project execution is typically slow. Recently the
government has taken steps to address this delay. For example, procurement has been allowed to be
initiated before the start of the year.
The quality of project management and the transparency of execution appear weaker at local levels. The
procedures for monitoring individual projects are not standardized and vary widely across ministries and
local governments. With the exception of externally financed projects, there appears limited use of
systematic expost evaluations.
Page 54
INDONESIA
INTERNATIONAL MONETARY FUND 53
Box 2. Indonesia: Recent Reforms on Land Acquisition Procedures
The government has taken important steps to address the barriers of land acquisition:
The revised land acquisition law came into effect, early in 2015. The law has clarified, inter alia, that
(i) all the ongoing projects would benefit from the new law,1 which can force relevant parties to sell their
property for public infrastructure projects with fair compensation; and (ii) land acquisition procedures
should be complete within a maximum of two years. Under the new law and recently revised
regulations, total days needed for land acquisition could be as fast as 3‒4 months. Other deregulation
has been also delivered.
National Land Agency’s (BPN) function has been revamped, through a setup of special deputy for
land acquisition acceleration and a dedicated team for priority infrastructure projects, as well as
developing standard operating procedure.
Direct land procurement by a private entity: (i) a private entity can obtain an authority or proxy in
land procurement from a relevant government institution or SOE and act as a proxy; and (ii) with the
authority/proxy mandate, a private entity can carry out compensation payment as well as all the
preceding stages (i.e., preparation, consultations, valuation, and negotiation).
The legal framework has improved, but thorough implementation is essential, particularly at the local
administration level. Improvement has been gradually felt on the ground. The new law has been
successfully applied to the South Sumatera Project. Another successful case is a rail project in Bojonegoro,
where the land acquisition process for the Java North Line Double Track Rail project took less than 2 years.
During this process, the civil society was early socialized to the new law. Nonetheless, there are numerous
cases that have been stalled due to land issues.2 It would be important for the government to establish
demonstrate their ability to push ahead with the new law and build trust, creating stable investment flows to
infrastructure projects.
________________________
1/ Previously, infrastructure projects that had acquired three-quarters of the required land were subject to the
old 1960 law. Also projects whose land-acquisition process was less than 75 percent complete had to start again, if
a relevant entity wants to acquire land under the new law.
2/ For instance, development of the light rail transit (LRT) project in Jakarta was hampered by land acquisition
problems. The state developer asked the local administration to help purchase lands along the route from
residents. Cutting trees on the route also required approval from the local administration.
Page 55
INDONESIA
54 INTERNATIONAL MONETARY FUND
References
Anderson, Derek, Benjamin Hunt, Mika Kortelainen, Michael Kumhof, Douglas Laxton, Dirk Muir,
Susanna Mursula, and Stephen Snudden, 2013, “Getting to Know GIMF: The Simulation
Properties of the Global Integrated Monetary and Fiscal Model,” IMF Working Paper 13/55.
Coordinating Ministry of Economic Affairs, 2015, Acceleration of Priority Infrastructure Delivery,
October (Jakarta).
International Monetary Fund, 2014, “Addressing the Infrastructure Deficit in Sub-Saharan Africa,”
Chapter 3 in Regional Economic Outlook: Sub-Saharan Africa, World Economic and Financial
Survey (Washington).
Republic of Indonesia, 2015, The Economy with Remarkable Adaptability (December).
OECD, 2012, “Public-Private Partnership Governance: Policy, Process and Structure,” in OECD
Reviews of Regulatory Reform Indonesia (Paris).
————, 2012, Public Governance of Public-Private Partnerships (Paris).
World Bank, 2014, Indonesia Systematic Country Diagnostic: Connecting the Bottom 40 percent to the
Prosperity Generation.
World Economic Forum, 2014, The Global Competitiveness Report 2014‒2015 (Geneva).