1 Immigrant Resentment and Voter Fraud Beliefs in the U.S. Electorate Adriano Udani Assistant Professor Department of Political Science University of Missouri – St. Louis [email protected]David C. Kimball Professor Department of Political Science University of Missouri – St. Louis [email protected]July 2017 Forthcoming, American Politics Research Abstract Public beliefs about the frequency of voter fraud are frequently cited to support restrictive voting laws in the United States. However, some sources of public beliefs about voter fraud have received little attention. We identify two conditions that combine to make anti-immigrant attitudes a strong predictor of voter fraud beliefs. First, the recent growth and dispersion of the immigrant population makes immigration a salient consideration for many Americans. Second, an immigrant threat narrative in political discourse linking immigration to crime and political dysfunction has been extended to the voting domain. Using new data from a survey module in the 2014 Cooperative Congressional Election Study and the 2012 American National Election Study, we show that immigrant resentment is strongly associated with voter fraud beliefs. Widespread hostility toward immigrants helps nourish public beliefs about voter fraud and support for voting restrictions in the United States. The conditions generating this relationship in public opinion likely exist in other nations roiled by immigration politics. The topic of fraudulent electoral practices will likely continue to provoke voters to call to mind groups that are politically constructed as “un-American.” * We acknowledge the support of the University of Missouri Research Board, the College of Arts and Sciences at the University of Missouri-St. Louis and National Science Foundation Award # 1430505. Earlier versions of this manuscript were presented at the 2015 Annual Meeting of the Midwest Political Science Association in Chicago, Illinois and at the 2015 Cooperative Congressional Election Study Conference in Provo, Utah. We are grateful for the helpful feedback from our discussants, panelists, and attendees.
Transcript
1
Immigrant Resentment and Voter Fraud Beliefs in the U.S. Electorate
Adriano Udani Assistant Professor
Department of Political Science University of Missouri – St. Louis
Public beliefs about the frequency of voter fraud are frequently cited to support restrictive voting laws in the United States. However, some sources of public beliefs about voter fraud have received little attention. We identify two conditions that combine to make anti-immigrant attitudes a strong predictor of voter fraud beliefs. First, the recent growth and dispersion of the immigrant population makes immigration a salient consideration for many Americans. Second, an immigrant threat narrative in political discourse linking immigration to crime and political dysfunction has been extended to the voting domain. Using new data from a survey module in the 2014 Cooperative Congressional Election Study and the 2012 American National Election Study, we show that immigrant resentment is strongly associated with voter fraud beliefs. Widespread hostility toward immigrants helps nourish public beliefs about voter fraud and support for voting restrictions in the United States. The conditions generating this relationship in public opinion likely exist in other nations roiled by immigration politics. The topic of fraudulent electoral practices will likely continue to provoke voters to call to mind groups that are politically constructed as “un-American.”
* We acknowledge the support of the University of Missouri Research Board, the College of Arts and Sciences at the University of Missouri-St. Louis and National Science Foundation Award # 1430505. Earlier versions of this manuscript were presented at the 2015 Annual Meeting of the Midwest Political Science Association in Chicago, Illinois and at the 2015 Cooperative Congressional Election Study Conference in Provo, Utah. We are grateful for the helpful feedback from our discussants, panelists, and attendees.
2
INTRODUCTION
Public concerns about voting integrity are more than an academic curiosity, since they are
frequently cited to support particular election reforms. In two recent Supreme Court cases, Purcell v.
Gonzalez (2006) and Crawford v. Marion County (2008), the majority decision accepted state arguments
that voting restrictions, such as photo identification and proof of citizenship requirements, are
needed to maintain public confidence in elections. Similarly, lawmakers frequently invoke public
concerns about voter fraud as the basis for new voting restrictions (Minnite 2010; Hasen 2012).
Indeed, people who believe that voter fraud is common are more likely to favor laws requiring
voters to show a photo ID before being allowed to cast a ballot (Wilson and Brewer 2013). Beliefs
about widespread voter fraud have filtered across the American mass public, despite evidence that
voter fraud occurs very rarely (Ansolabehere, Luks and Schaffner 2015; Minnite 2010; Ahlquist,
Mayer, and Jackman 2014; Christensen and Schultz 2014; Levitt 2014).
Given that beliefs about widespread voter fraud are influential in driving public support for
voter restrictions, it is important to understand the sources of these beliefs. While the literature on
voter fraud beliefs is emerging, we argue that attitudes toward immigrants are an understudied
source of public beliefs about how much voter fraud occurs. Two conditions in the United States
are expected to produce a strong association between anti-immigrant attitudes and public beliefs
about voter fraud: (1) relatively high levels of immigration in recent years that make immigration a
salient national issue; and (2) an immigrant threat narrative in political rhetoric that frames
immigrants as criminals and undeserving of the rights of citizenship. Elite claims about voter fraud
frequently incorporate elements of immigrant threat language. For example, upon taking office in
2017, President Donald Trump called for a major investigation into voter fraud after alleging that
millions of undocumented immigrants cast illegal votes to deliver the nationwide popular vote to
3
Hillary Clinton (House and Dennis 2017). Trump also centered his campaign for president around
anti-immigrant rhetoric and policy proposals, though he is certainly not the first politician to frame
immigrants as criminals or fraudulent voters. While we test this theory on the United States we
believe that anti-immigrant attitudes will be a potent predictor of voter fraud beliefs in other
countries where these conditions also exist.
We argue that a person’s animosity toward immigrants – particularly, immigrant resentment
– is a highly influential predisposition since its components reflect attitudes toward crime, deserving
membership in the polity, perceived threats to American traditions, and fears about losing political
influence. Recent political rhetoric frequently combines these elements by linking immigration with
crime and voter fraud in particular. We posit that similar attitudes are called to mind when people
attempt to enumerate instances of voter fraud in U.S. elections. By bridging the literatures on
immigrant threat and voter fraud, our study is the first to theorize and test a link between public
attitudes toward election integrity and anti-immigrant attitudes.
We report the results of two studies to examine the relationship between attitudes toward
immigrants and voter fraud beliefs. Our first study reports results from a survey module in the 2014
Cooperative Congressional Election Study (CCES). We test an immigrant resentment hypothesis
along with dominant frameworks in political science. Our second study examines public perceptions
of election integrity in the United States using data from the 2012 American National Election Study
(ANES). In each study, we find that anti-immigrant attitudes strongly predict beliefs about voter
fraud, often outperforming conventional political predispositions and contextual measures.
We organize the paper as follows. First, we explain the reasons for which anti-immigrant
attitudes should be associated with voter fraud beliefs. We then provide an overview of scholarship
on public beliefs about voter fraud. Next, we present our data, methods, and evidence from our two
studies. Finally, we provide some concluding remarks about our results.
4
ANTI-IMMIGRANT ATTITUDES AND VOTER FRAUD PERCEPTIONS
Existing scholarship indicates that political predispositions, general orientations toward the
political system, and racial attitudes are the most reliable predictors of public beliefs about voter
fraud. Reflecting the nature of political debate about proposed voting restrictions, Republicans and
conservatives tend to believe that voter fraud occurs more frequently than Democrats and liberals
(Wilson and Brewer 2013; Bowler et al. 2015; Wilson and King-Meadows 2016). Furthermore, there
is clear evidence of a sore loser effect in voter fraud beliefs, as supporters of winning candidates
hold more positive assessments of election integrity than supporters of losing candidates (Sances
and Stewart 2015; Wolak 2014; Beaulieu 2014).
Certain predispositions and acts that signal closer connections to the political system also
shape beliefs about voter fraud. Voters and people with higher levels of political efficacy and trust in
government tend to hold more positive beliefs about election integrity (Wolak 2014). In addition,
people with higher levels of education and political knowledge tend to be more sanguine about voter
fraud in the United States (Bowler et al. 2015; Wolak 2014). Similarly, messages from political elites,
particularly trusted leaders, can influence public beliefs about voter fraud (Vonnhame and Miller
2013; Wilson and Brewer 2013; Beaulieu 2014).
Finally, there is some evidence that the issue of voter fraud has become racialized. Political
debates about restrictive voting laws often feature arguments about how those laws will affect
people of color, who are less likely to possess a government-issued photo ID or the documents
needed to obtain one (Barreto, Nuño and Sanchez 2009; Hershey 2009). In some instances political
rhetoric includes pointed allegations of voter fraud by people of color (Dreier and Martin 2010;
Minnite 2010; Hasen 2012: 44, 65-67; Wilson and Brewer 2013; Ellis 2014; Appleby and Federico
2017). As a result, some have found a positive relationship between racial resentment and public
beliefs about voter fraud (Wilson and Brewer 2013; Appleby and Federico 2017). Current
5
scholarship on voter fraud builds upon a racial spillover effect of President Obama’s historic status
as the nation’s first African American president (Appleby and Federico 2017). In turn, they find that
perceptions of the fairness of the presidential election and integrity of the vote became racialized in
2008 and 2012. Nevertheless, existing research has largely ignored public attitudes toward
immigrants as a source of beliefs about voter fraud.
Why should attitudes toward immigrants influence public beliefs about voter fraud? One
mechanism linking the two sets of attitudes would be empirical evidence of higher rates of voter
fraud among immigrants. Available evidence suggests that voter fraud is extremely rare and that
non-citizen voting is even less common than other forms of election fraud, such as absentee fraud
and ballot tampering by officials (Ansolabehere, Luks, and Schaffner 2015; Kahn and Carson 2012).1
One study found 33 complaints of non-citizen voting during a decade of elections in California and
Oregon, but only four cases that led to convictions (Minnite 2010). A nationwide investigation of all
reported instances of voter fraud from 2000 to 2012 found just 56 cases of alleged non-citizen
voting (Kahn and Carson 2012). Most voter fraud allegations are made leading up to a major
election, particularly in electorally competitive states, suggesting that voter fraud allegations are used
as a voter mobilization strategy (Fogarty et al. 2015; Hasen 2012).
Some elite rhetoric tends to exaggerate the frequency of non-citizen voting in the United
States. For example, in 2011 Colorado Secretary of State Scott Gessler (R) claimed that 12,000
registered voters were not citizens out of more than 3 million registered voters in the state
(Siegelbaum 2011). Gesler further claimed that 5,000 non-citizens voted in the 2010 general election
in Colorado (Siegelbaum 2011). Upon further investigation, most of the people on the list were
1 One study concludes that approximately 2% to 6% of non-citizens vote illegally in American elections (Richman, Chattha, and Earnest 2014). However, this study has major flaws. The estimate is based on a sample survey yet does not report confidence intervals for any estimates of illegal voting. More importantly, large sample surveys are inferior for making inferences about low probability events when there are even small amounts of measurement error in key variables (in this case there is some error in the question identifying non-citizens). Another study of the same data concludes that the non-citizen voting rate in the United States is likely 0 (Ansolabehere, Luks, and Schaffner 2015).
6
American citizens and the state ultimately identified only 35 alleged non-citizens who voted in
Colorado (Hoover 2012). In Florida, the Department of Highway Safety and Motor Vehicles
estimated a potential 180,000 non-citizens registered among the state’s 12 million registered voters in
2011 (Dixon 2012). Florida Governor Rick Scott (R-FL) ordered a statewide effort to remove
immigrants from the state’s voting rolls. However, the initial estimate included extensive errors and
a subsequent investigation found just 38 alleged non-citizens voted in Florida (Powers, Haughney
and Williams 2012) and only one person was convicted of non-citizen voting in Florida.
A more likely mechanism linking attitudes toward immigrants and beliefs about voter fraud
relies on two conditions: (1) the growth of foreign-born groups in historically newer U.S.
destinations, increasing the salience of immigration attitudes in the mass public; and, (2) political
rhetoric that often paints immigrants as lawbreakers, thus priming attitudes toward immigrants when
people think about criminal behavior, including voter fraud. These conditions are similar to Kinder
and Kam’s (2009) theory about the conditions that “activate” ethnocentrism as a powerful force in
public opinion.
On the first condition, the United States has experienced relatively high levels of
immigration over the past twenty years, with most of the recent wave of immigrants coming from
Latin America and Asia (Hajnal and Lee 2011, 10; Garand, Xu, and Davis 2015). Currently, the
foreign-born share of the total population in the United States is higher than it has been in almost
one hundred years. Between 1990 and 2000, the total U.S. foreign-born population grew by 57
percent from 19.8 million to 31.1 million. Between 2000 and 2009, the number of immigrants grew
by 24 percent from 31.1 million to 38.5 million. In addition, the number of unauthorized immigrants
peaked at 12.2 million in 2007 and has remained relatively stable since 2009 after rising for nearly
two decades (Passel and Cohn 2016).
7
Furthermore, the foreign-born population is now more dispersed across the United States,
with recent immigrants settling in racially and ethnically homogenous areas where immigrants have
historically been absent (Marrow 2011; Massey 2008; Singer 2004). Scholars have found an increase
in “new destination” states, cities and rural areas that had not experienced much immigration since
the 1960s (Marrow, 2011; Cisneros 2009; Wilson and Singer, 2011). While traditional destination
states – such as New York, Illinois, California, Texas, Massachusetts, New Jersey, and Florida –
continue to receive large numbers of immigrants, the foreign born population grew by 49 percent or
more, twice the national rate between 2000 and 2009, in mostly southern and Midwestern regions
of the United States (Terrazas 2011; Passel and Cohn 2011).2
Scholarship on racial and ethnic group threat suggests that the growth and dispersion of
immigrant groups across the U.S. is related to the second condition. That is, demographic changes in
one’s community fosters a sense of perceived threat among native-born U.S. citizens (Hopkins 2010;
Newman 2013). Others show that a considerable portion of American voters feel that increased
growth rates of immigrants lead to reductions in employment prospects, safety, and “American”
values (Branton et al. 2011; Schildkraut 2011). Large proportionate changes in state immigrant
populations produce intensive sociocultural changes that represent a challenge to a state’s ethnic and
cultural status quo while generating a higher degree of anti-immigrant sentiment (Newman et al.
2012). In some quarters there is also a longstanding strain of anxiety about demographic change in
the United States, a fear that the country as they know it is slipping away (Albertson and Gadarian
2015).
On the second condition, the extent to which a person’s anti-immigrant attitudes structure
perceptions of how much voter fraud occurs in U.S. election will depend on an “immigrant threat”
narrative commonly found in political and policy discourse (Abrajano and Hajnal 2015; Albertson 2 These states are: South Carolina, Alabama, Tennessee, Delaware, Arkansas, South Dakota, Nevada, Georgia, Kentucky, North Carolina, Wyoming, Idaho, Indiana, and Mississippi.
8
and Gadarian 2015). Sudden increases in ethnic diversity, complimented by mainstream political
discourse that arouses public anxiety about an increasingly diverse country, are associated with
increases in anti-immigrant attitudes (Hopkins 2010). The threat narrative broadly links concerns
over immigration to crime, job loss, and several other social and political maladies (Abrajano and
Hajnal 2015; Albertson and Gadarian 2015).3 Some argue that perceived threat manifests as
resentment toward immigrants generally (Schildkraudt 2011). Resentment takes the form of negative
stereotypes about immigrants as a monolithic group, fears about cultural and political decline, beliefs
that immigrants are not equally deserving of political rights, and that immigrants engage in criminal
activity.
Voter fraud is another type of crime and rhetoric about voter fraud from prominent
politicians often extends this connection between immigration and criminal behavior to the voting
domain. Elite rhetoric about voter fraud is often vague, but when a specific mechanism is provided
it tends to focus on allegations of non-citizens voting in elections (Fogarty et al. 2015). For example,
President Trump has made the unsupported claim that he lost the popular vote in the 2016 election
because millions of undocumented immigrants participated illegally in the election (House and
Dennis 2017). In congressional testimony, Kansas Secretary of State Kris Kobach alleged that “the
problem of aliens registering to vote is a massive one, nationwide” (Kobach 2015). The recent
increase in immigration, combined with elite rhetoric and media coverage that stereotype non-
citizens as criminals, may prime attitudes toward immigrants when Americans think about voter
fraud. This suggests that higher levels of immigrant resentment are associated with the perception
that voter fraud occurs more frequently in U.S. elections (H1).
Others argue that the perceived threat arises specifically from Mexicans, who pundits and
political elites have constructed as the stereotypical immigrant (Brader, Valentino and Suhay 2008). 3 A recent review of criminology research finds that immigration generally has not increased crime rates in the United States (Ousey and Kubrin 2017).
9
When Americans imagine a stereotypical immigrant, studies suggest that they tend to envision a
Latino (Burns and Gimpel 2000; Dunaway, Branton and Abrajano 2010; Gilliam and Iyengar 2000;
Haynes, Merolla and Ramakrishman 2013) while visual cues of “Latino-looking” people elicit
restrictive immigration attitudes among U.S. voters (Brader, Valentino and Suhay 2008). As such,
these findings indicate that more negative attitudes toward Latinos, particularly Mexican immigrants,
are associated with the perception that voter fraud occurs more frequently (H2).
Finally, studies also suggest that threatened sentiments mainly come from an animosity
toward undocumented immigrants. Paul Broun, a Republican running for a U.S. Senate seat in
Georgia in 2014, stated that Democrats can only win elections in the state with the votes of “illegal
aliens” (Galloway 2014). Haynes, Merolla and Ramakrishnan (2016) show that mainstream political
rhetoric continues to construct immigration as a problem of social deviance (i.e. immigrants illegally
crossing the border). Undocumented immigrants are often portrayed as being deceptive in trying to
acquire welfare benefits and legal residence at the cost of law-abiding and deserving Americans
(Garand, Xu, and Davis 2015; Hussey and Pearson-Merkowitz 2013). Xia Wang (2012) finds that
perceptions of undocumented immigrants as a criminal threat is positively associated with the
perceived size of the undocumented immigrant population. These findings suggest that more
negative attitudes toward undocumented immigrants are associated with the perception that voter
fraud occurs more frequently in U.S. elections (H3).
STUDY 1: USING RACIAL AND ETHNIC ATTITUDES IN THE 2014 CCES
In this study, our main objective is to test whether voter fraud beliefs are associated
specifically with anti-immigrant attitudes while controlling for relevant political dispositions. We use
survey data from a module of 1,000 respondents to the 2014 CCES. The survey was conducted
online by YouGov and included a pre-election wave conducted before the November elections and
a post-election wave fielded after the elections. To understand the determinants of voter fraud
10
beliefs, we collect data on respondents’ political attitudes and social characteristics before the
election, and then measure their voter fraud beliefs after the election. A detailed description of our
variables is provided in the online appendix.
Public perceptions about election fraud can be measured on several dimensions: (1) who is
committing fraud – individual voters or election officials; (2) the frequency of fraudulent acts; and
(3) the significance of fraudulent acts. Our main dependent variable measures beliefs about the
frequency of voter fraud, focusing primarily on fraud committed by voters. These frequency
measures were previously used in the Survey of the Performance of American Elections and another
peer-reviewed study (Stewart 2013; Bowler and Donovan 2016). In addition, beliefs about the
frequency of voter fraud are more strongly correlated with election policy preferences than other
common measures of voter confidence and election integrity perceptions (Udani and Kimball 2017).
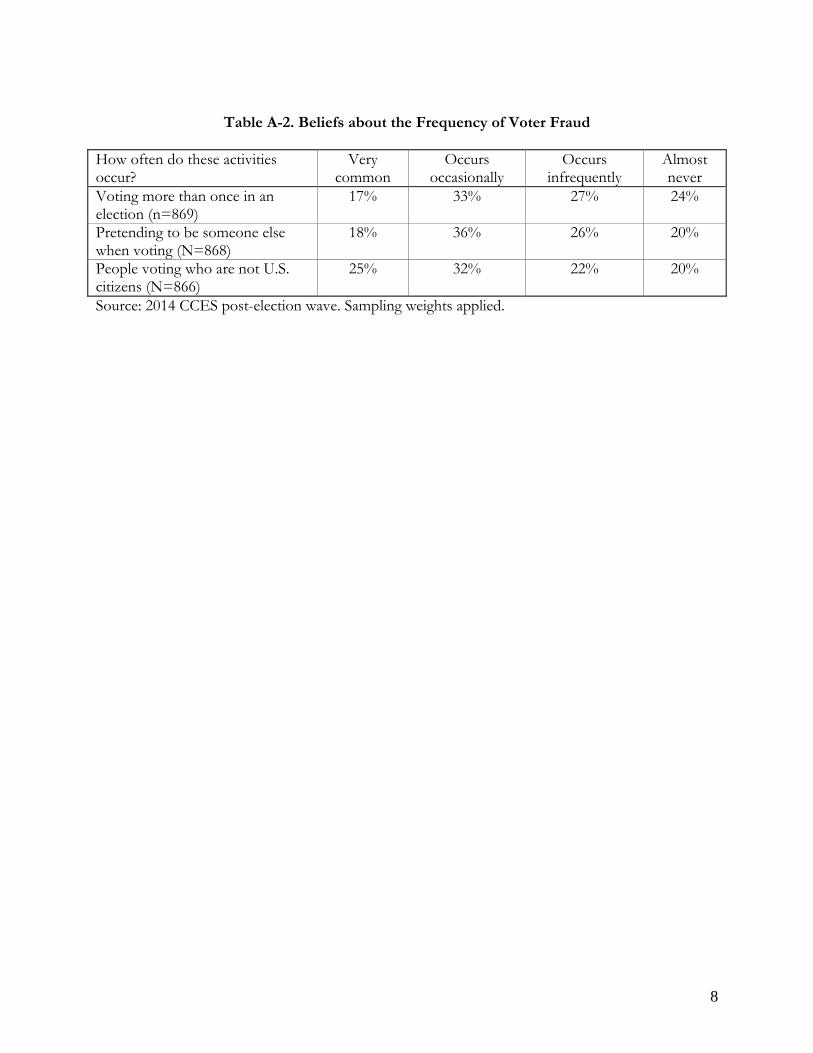
In the CCES post-election module, respondents are asked how frequently four different types of
voter fraud occur in the United States: non-citizen voting, voter impersonation, double voting, and
ballot tampering. We randomize the order of fraudulent activities that participants view. There is
considerable variation across individuals in voter fraud beliefs, and roughly 20 percent of
respondents in the CCES module believe that acts of voter fraud are “very common.” Our sample is
similar to prior surveys in terms of baseline beliefs about voter fraud and support for photo ID laws
(see Table A-1 in online appendix). Responses to the voter fraud items are coded from 1 to 4 with
the most frequent category at the high end of the scale. An exploratory factor analysis of the four
items reveals just one factor, with the item dealing with official vote tampering producing the
weakest factor loading. Excluding vote tampering, the other three items form a reliable scale (α =
0.92). There is also relatively little variation in aggregate beliefs across the different types of voter
fraud, although respondents tend to believe that non-citizen voting occurs more frequently than
other acts of fraudulent voting (see Table A-2 in online appendix). This suggests that people hold
11
general beliefs about voter fraud and do not distinguish between different sources of voter fraud.
Our voter fraud index is created by averaging the responses to each of the three items.4 Higher
scores on the scale indicate beliefs that voter fraud occurs more frequently.
To investigate whether animosity toward immigrants predicts beliefs about voter fraud, we
create several measures of attitudes toward immigrants based on questions in the pre-election wave
of the survey. We create a measure of immigrant resentment based on six randomly ordered
questions that ask how much respondents agree or disagree with statements about the impact of
immigration. These items, which tap into dimensions involving cultural beliefs, group conflict,
political influence, and different forms of resentment, form a reliable scale (α = 0.84), with higher
scores indicating greater resentment of immigrants. A majority of respondents fall on the resentful
side of the scale. Respondents in the bottom third of the immigrant resentment scale tend to believe
that voter fraud occurs infrequently, with a mean score of 1.9 on the voter fraud index (which ranges
from 1 to 4). Mean voter fraud beliefs are higher for respondents in the middle third (2.5) and
highest third (3.0) of the immigrant resentment scale. This provides preliminary support for H1.
To account for animosity toward illegal immigrants, we measure affect towards illegal
immigrants with a feeling thermometer, with larger (smaller) values reflecting more warmth
(coldness). To account for anti-Latino sentiments that often are associated with attitudes toward
U.S. immigration, we use a two batteries of stereotype questions that ask respondents whether
Latinos are lazier and less intelligent than whites, African Americans, and Asian Americans (α =
0.70) . Our immigrant resentment scale generates a solid correlation with the thermometer rating of
illegal immigrants (r = 0.44) and a weaker correlation with the Latino stereotype scale (r = 0.30).
We try to control for as many alternative sources of voter fraud beliefs as possible with
CCES data. For example, one’s identity as an American may influence optimism toward election
4 Bowler and Donovan (2016) use the same three items to construct a voter fraud scale.
12
administration. Studies suggest that those with high levels of national pride tend to offer more
positive assessments of electoral integrity (Schildkraut 2011; Wolak 2014). To this end, we suspect
that voter fraud beliefs will be lower among not only voters who are highly patriotic, but also are
native-born residents whose family members were all born in the United States. The CCES allowed
respondents to choose which of the following categories best describes them: immigrant citizens,
immigrant non-citizens, first generation, second generation, and third generation. We use
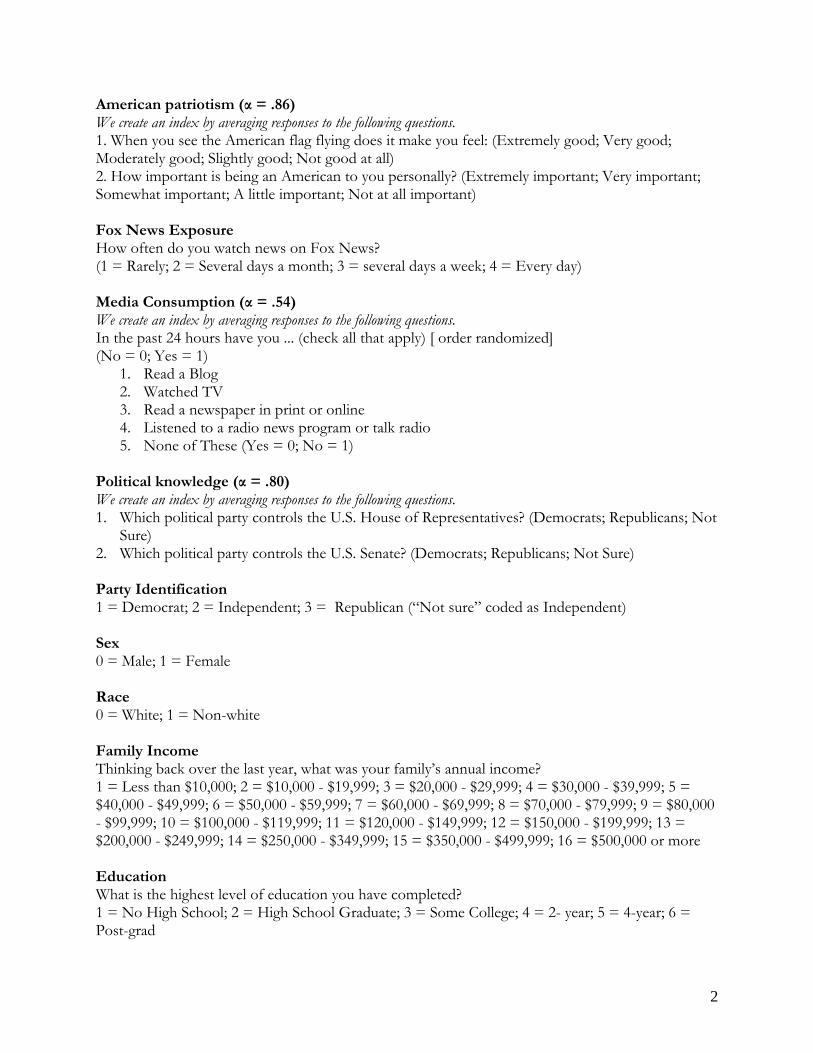
dichotomous indicators for each category, but exclude third generation. Second, we create a
patriotism scale using two questions on the importance of being an American and how good a
person feels seeing the American flag (α = 0.86).
Most of what we know about voter fraud beliefs is informed by broader attitudes about
American government institutions and electoral outcomes. In predicting beliefs about voter fraud,
we measure relevant social and political dispositions from the pre-election module of the 2014
CCES. First, partisanship should also be a strong predictor of public opinion about electoral
integrity. Voter fraud debates are largely understood in partisan and polarized terms (Bowler and
Donovan 2016; Wolak 2012). Studies show that voter fraud concerns are advanced primarily by
conservatives and Republican elites (Dreier and Martin 2010; Hasen 2012; Ellis 2014) while liberal
groups and Democratic Party elites tend to spread fears that voting restrictions may disenfranchise
some voters (Atkeson, Adams and Alvarez 2014; Bowler and Donovan 2016; Hasen 2012). In
addition, most voter restrictions are either enacted or introduced by predominantly Republican-
dominated state legislatures (Hicks et al. 2015). If partisans in the mass public internalize messages
coming from respective party elites (Zaller 1992), we expect that Republicans are more likely than
13
Democrats and Independents to believe that voter fraud occurs frequently in U.S. elections. We use
three dichotomous variables to delineate between Democrats, Independents, and Republicans.5
Prior studies point to other subgroups that may hold unique voter fraud beliefs. There is
variation in information from different news sources on this issue, as conservative sources tend to
emphasize concerns about voter fraud while liberal sources tend to focus more on voter suppression
fears (Hasen 2012; Henderson 2015). Unlike the ANES data in Study 2, the CCES data include
relatively few questions about specific sources of political information. We create a conservative
news exposure index based on three questions (α = 0.75), two of which ask how frequently
respondents watch Fox News and visit its web site. Uncritical reports of voter fraud are more
common on Fox News than other news sources (Dreier and Martin 2010), including allegations of
non-citizen voting (Henderson 2015). For example, in 2017 Fox & Friends co-host Ainsley Earhardt
alleged that 5.7 million non-citizens may have voted in the 2008 election (Sherman 2017). We are
not aware of other major news organizations reporting the same allegation. There is some evidence
that Fox News influences public opinion, particularly support for presidential candidates (Della
Vigna and Kaplan 2007; Smith 2016). More relevant to our study, people who trust Fox News are
much more likely to believe that voter fraud is a big problem than viewers of other news networks
(Jones et al. 2014). Furthermore, exposure to Fox News is associated with negative views of Mexican
immigrants and more support for restrictive immigration policies (Gil de Zúñiga et al. 2012). For
these reasons, we include a measure of conservative media exposure as a control variable. We create
a similar measure of exposure to liberal media based on six questions that ask how often
respondents watch particular TV networks or visit certain web sites (α = 0.82). Few people report
5 Due to much of the voter fraud and election integrity rhetoric expressed in polarized terms (Wolak 2014), we anticipate that partisan cues will have minimal effect on independents and those who are unsure of their party identification. To this end, we group these two groups of respondents (163 and 46, respectively) together in order to avoid dropping more observations when analyzing the dependent variable, which is measured in the post-election wave.
14
consuming partisan news sources at least several days a week (6 percent for conservative sources, 5
percent for liberal sources). We expect that conservative media exposure is positively associated with
beliefs about the frequency of voter fraud while liberal media exposure is negatively associated with
voter fraud beliefs.
Along the same lines, it may be that general exposure to news influences beliefs about voter
fraud, as fraud allegations tend to be regular news items, particularly as a major election approaches
(Fogarty et al. 2015; Dreier and Martin 2010). Thus, we also use five questions on type of media
usage to gauge overall media consumption. Furthermore, others find that higher levels of education
and political knowledge tend to reduce public concerns about election fraud (Wolak 2014; Gronke
2014). We include controls for both factors. Education is measured with 6 categories of educational
attainment ranging from having no high school degree to having a post-graduate degree. Political
knowledge is measured with two questions asking participants whether they know which political
party controls the U.S. House of Representatives and U.S. Senate (α = 0.80).
Lastly, other scholars have noted that the issue of voter fraud has become racialized, with
some political rhetoric describing voter fraud as an urban problem specifically implicating African
Americans (Dreier and Martin 2010; Minnite 2010; Wilson and Brewer 2013; Ellis 2014). This
rhetoric encourages the public to bring to mind racial attitudes when considering the issue of voter
fraud. As a result, some have found a positive relationship between racial resentment and public
beliefs about voter fraud (Wilson and Brewer 2013; Wilson and King-Meadows 2016; Appleby and
Federico 2017). Racial resentment seems to be a strong predictor of public support for voting
restrictions as well (Wilson and Brewer 2013; Gronke et al. 2015). We create a black resentment
scale based on items in the CCES common content survey (α = 0.75), and expect that people with
higher racial resentment tend to believe that voter fraud occurs more frequently.
15
We also control for age, sex, and race. We use a set of dichotomous indicators to designate
respondents who identify as female, black, Hispanic, Asian, Native American, Mixed, and Other.
Because of a history of resisting the Voting Rights Act, we control for whether a respondent lives in
the South as defined by the U.S. Census. The base category in our statistical models of voter fraud
beliefs consist of respondents who identify as white, male, Republican, and third generation
Americans with mean levels of political knowledge, media exposure, education, racial resentment,
immigrant resentment, and who does not live in the south.
Results
Table A-3 in the online appendix displays the OLS coefficients and robust standard errors
from the separate models of voter fraud beliefs.6 For comparison, we standardize all scales (i.e.
immigrant resentment, nationalism, negative Latino stereotypes, ratings of undocumented
immigrants, black resentment, and political knowledge), media consumption measures, education,
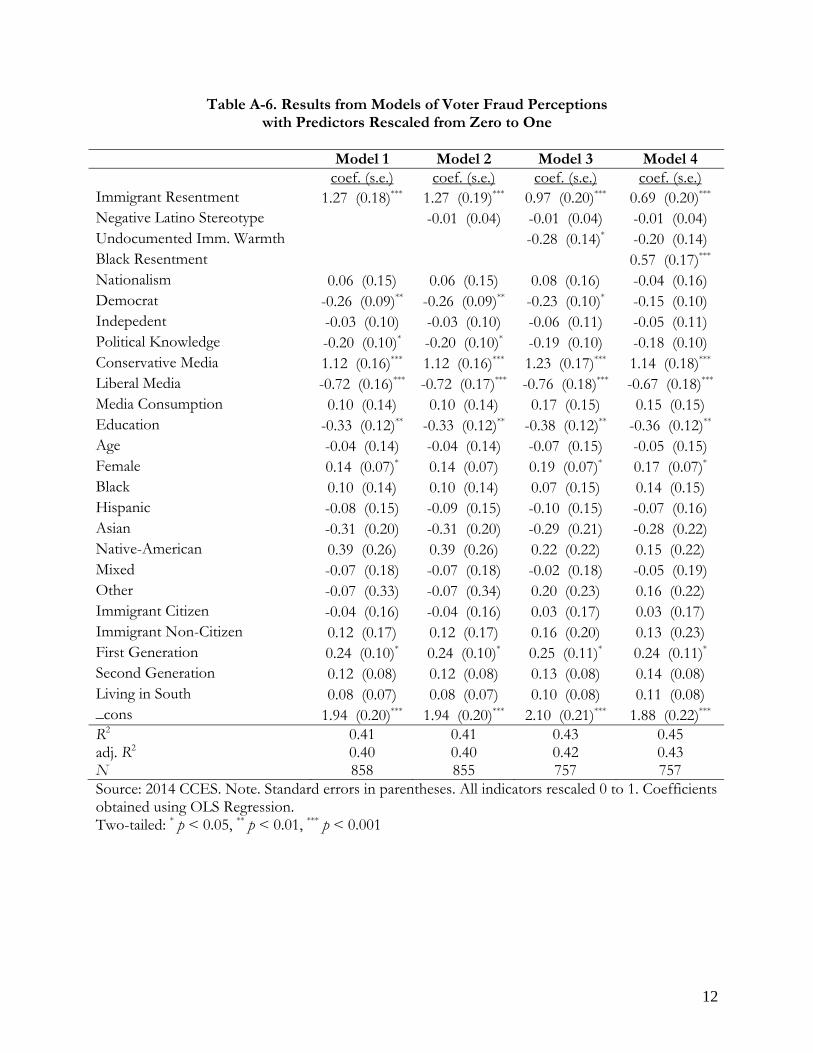
and age. Our results provide strong evidence that a general measure of immigrant resentment is a
robust predictor of voter fraud perceptions. In Models 1 and 2 of Table A-3, a one standard
deviation change in immigrant resentment scale is associated with a 0.29 increase (s.e. = 0.04, p <
0.001) in the voter fraud perception scale. The results also show a significant negative association
between voter fraud perceptions and receptivity toward undocumented immigrants (b=-0.09, s.e. =
0.05, p < 0.05), but not with negative stereotypes toward Latinos. The size and significance of the
6 While 1,000 respondents participated in our pre-election module, 873 respondents participated in our post-election module. Since we measure voter fraud perceptions in the post-election module, the most observations that we could have in a statistical model is 873. Additional missing observations arise from participants who did not answer questions on watching Fox News (16), the political knowledge battery (1), immigrant resentment battery (1), and voter fraud battery (2). The number of observations in Models 3 and 4 of Table A-3 is lower, due to 116 participants preferring not to answer the undocumented immigrant thermometer question. We also tested models that include household income as a predictor. Ultimately, we left income out of the reported results because over 100 respondents did not answer the income question. Income is not a statistically significant predictor of voter fraud beliefs in the CCES study, and the substantive findings do not change when income is included in the model. These results are available from the authors.
16
immigrant resentment indicator does not change after accounting for holding negative stereotypes
of Latinos; however, its size does decrease by 24 percent after controlling for attitudes toward
undocumented immigrants. The findings suggest that voter fraud perceptions tap an underlying
dimension of attitudes involving undocumented immigrants, a group of immigrants that are
dominant constructed as criminals.
The effect of immigrant resentment is nearly cut in half (-45%) after adding the control for
black resentment. The results from the last model in Table A-3 show that the resentment scales
nearly produce the same change in voter fraud perceptions. Comparing the black resentment and
immigrant resentment indicators, a one standard deviation change in each is associated with a 0.18
(s.e. = 0.05, p < 0.001) and 0.16 (s.e. = 0.05, p < 0.001) increase in the voter fraud scale,
respectively.7 Moving from the 10th percentile to the 90th percentile in immigrant resentment is
associated with a .43 increase in the voter fraud scale, holding other factors constant. A similar
change in racial resentment is associated with a .50 increase in voter fraud perceptions. These
relationships are substantial given that the voter fraud scale has a range of 3. We interpret our results
to indicate that the dominant racial attitudinal frameworks that center on black antipathy cannot
easily wash away the effect of other dimensions of racial and ethnic animus directed at immigrants in
particular.
In addition, immigrant resentment serves as a significant predictor of voter fraud
perceptions above and beyond other relevant dispositions toward politics. Our models provide
evidence that political sophistication matters. Even after controlling for racial and ethnic indicators
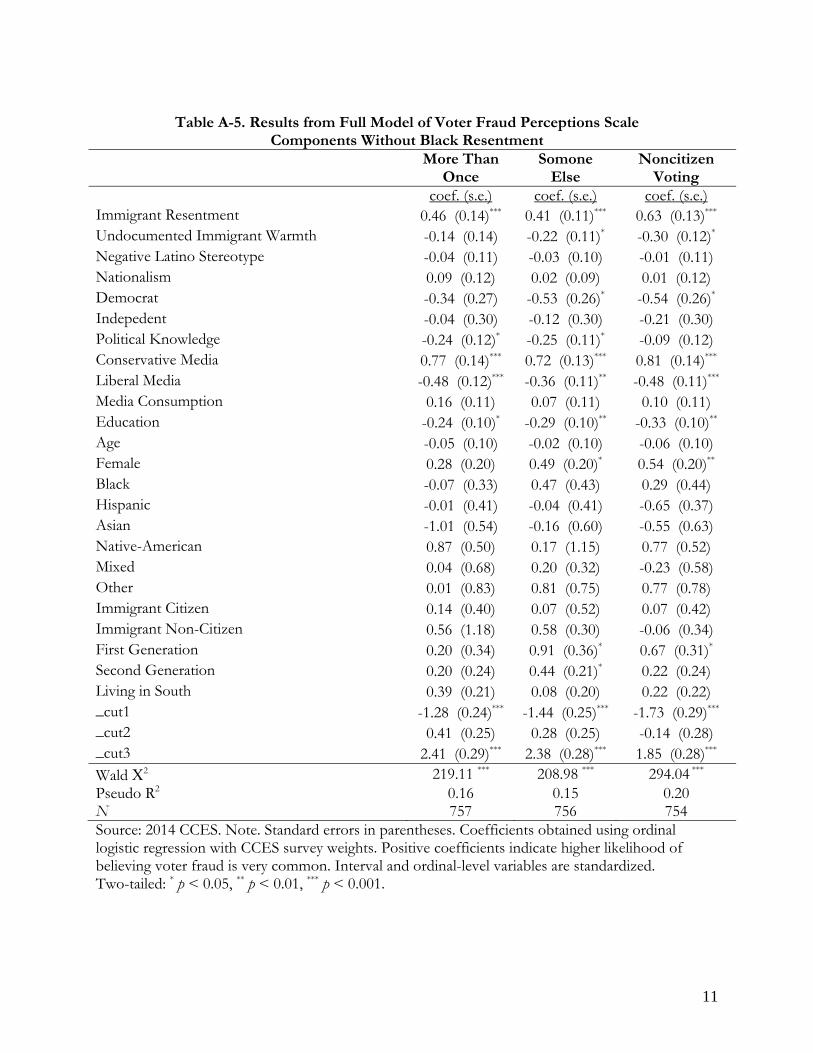
7 Black resentment and immigrant resentment are positively related measures (r = .6) but they are conceptually distinct. Immigrants comprise less than ten percent of Black Americans (Anderson 2015), so immigrant resentment is largely directed at a different group than racial resentment. Given the prior research findings on racial resentment noted above, it is important to control for racial resentment when examining the association between attitudes toward immigrants and voter fraud beliefs. If we remove black resentment from the analysis then the coefficients for immigrant resentment and partisanship increase in size (see Tables A-5 and A-13).
17
in Model 4, a one standard deviation increase in education is associated with a decrease in voter
fraud perceptions (b = -0.10, s.e. = 0.03, p < 0.01). Increasing education levels from the 10th to the
90th percentile is associated with a .29 drop in voter fraud perceptions, holding other variables
constant. Meanwhile, some model results show that political knowledge (b = -0.09, s.e. = 0.04, p <
0.05) is significantly associated with lower voter fraud perceptions (see Models 1 and 2 in Table A-
3).
Our results also provide stronger evidence for partisan effects and the influence of
conservative media outlets. As Models 1 through 3 in Table A-3 indicate, Democrats on average
score 0.25 lower than Republicans in voter fraud perceptions (s.e. = 0.09, p < 0.001). That partisan
coefficient does not change after controlling for attitudes toward undocumented immigrants, but
becomes statistically insignificant when models account for black resentment (b = -.15, s.e.=0.15 in
Model 4).8 In Model 1, a one standard deviation change in watching conservative media outlets is
associated with a 0.32 increase on average (s.e. = 0.05, p < 0.001) in voter fraud perceptions.9 In
contrast, a one standard deviation change in watching liberal media outlets is associated with a 0.17
drop on average in voter fraud perceptions (s.e. = 0.04, p < 0.001). These effect sizes, standard
errors, and significance levels change minimally in different model specifications. Lastly, our results
suggest that elite rhetoric on voter fraud is more impressionable on newer than older generations of
voters. Compared to third generation participants, first-generation respondents believe voter fraud
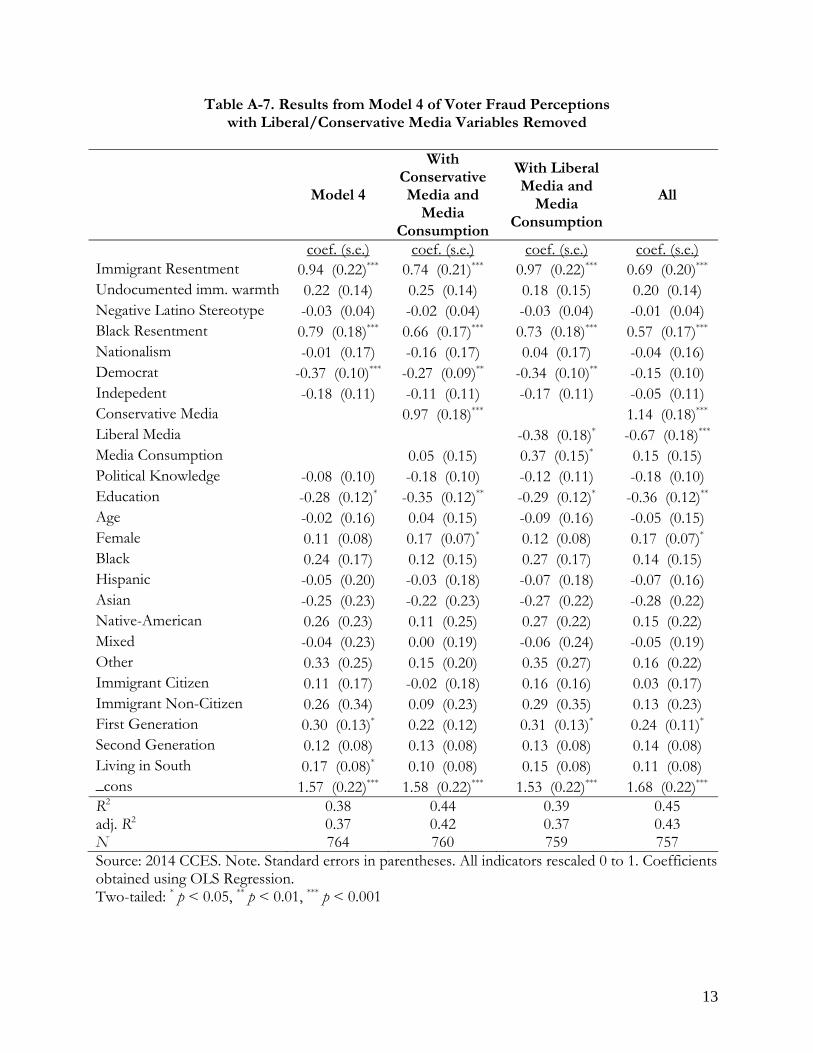
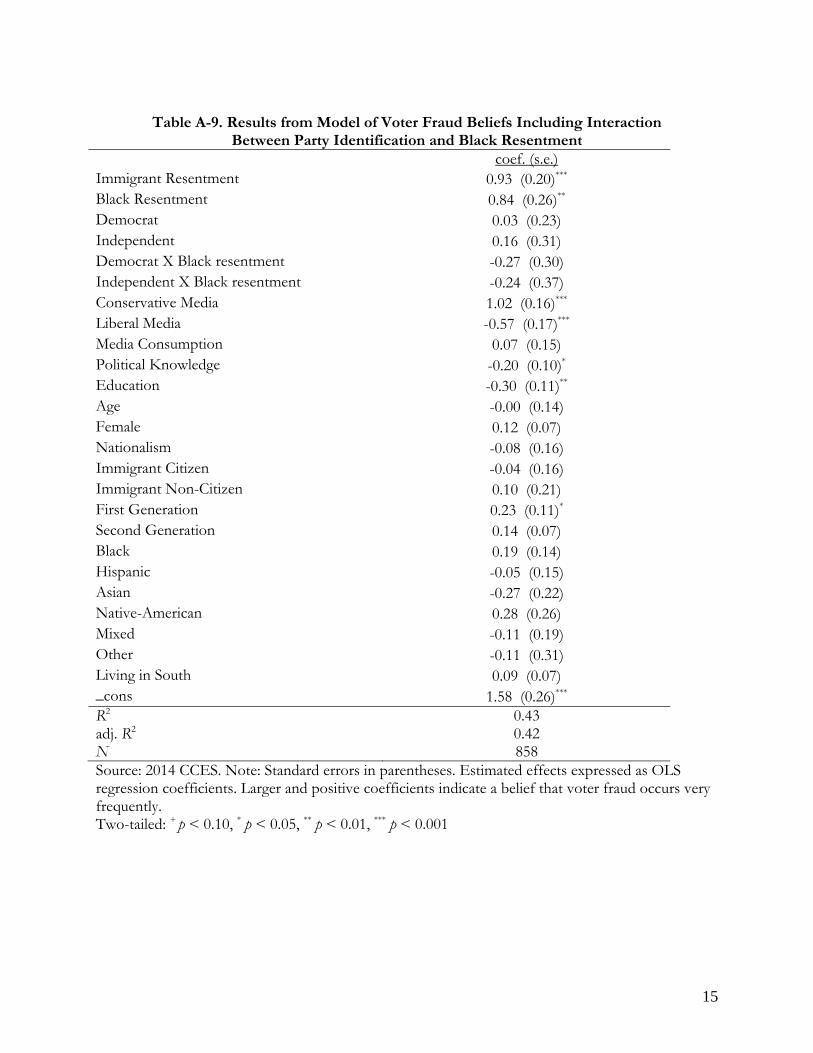
occurs more frequently (b = 0.24, s.e. = 0.10, p < 0.05). The estimated effect of this generational 8 Other statistical models in the online appendix (Tables A-9 and A-10) indicate that black resentment has similar effects for Republicans, Independents, and Democrats. Models interacting black resentment with race also suggest that black resentment has a larger effect on whites than Hispanic (b=-0.87, s.e. = 0.50, p<0.10), Asian (b=-0.87, s.e.= 0.72, p<0.10) or mixed-race (b=-0.84, s.e. = 0.49, p<0.05) identifiers. 9 Conservative media exposure is positively associated with immigrant resentment (r = .33), racial resentment (r = .32) and Republican partisanship (r = .29), and negatively correlated with liberal media exposure (r = .28). If we remove the conservative and liberal media variables from Model 4 then the coefficients for immigrant resentment, racial resentment, partisanship, and general news consumption increase in size (see Table A-7).
18
difference is less certain, though, once our models account for all racial and ethnic indicators. Other
demographic measures, including age, sex, race and ethnicity are largely unrelated to public beliefs
about voter fraud.
Some may wonder whether immigrant resentment is only associated with beliefs about the
frequency of non-citizen voting, rather than other types of voter fraud. When we examine the
individual questions that comprise the voter fraud scale, we find that immigrant resentment is a
strong predictor of beliefs about each type of fraudulent activity (see Table A-4 in online appendix).
We use an ordinal logit estimation to model the responses to individual voter fraud questions. We
find that a one standard deviation increase in immigrant resentment has the strongest association
with believing that noncitizen voting occurs very frequently in U.S. elections (b = 0.49, s.e. = 0.14 p
< 0.001), and is slightly stronger than black resentment (b = 0.44, s.e. = 0.14, p < 0.001). In Figure 1
we compare the relative impact of significant racial and ethnic attitudes on each item of the voter
fraud perception scale.10 As the first two panels of Figure 1 further illustrate, immigrant resentment
has a marginally larger effect than black resentment on the probability of believing that double
voting and voter impersonation are “very common” in American elections. As immigrant
resentment increases from lowest to highest values, the predicted probability of believing that either
form of fraud is very common increases by roughly .14 and .12, respectively.11 The third panel of
Figure 1 indicates that the estimated impact of immigrant resentment on beliefs about non-citizen
voting is even bigger, and substantially larger than the impact of racial resentment. As immigrant
resentment increases from lowest to highest values, the probability of believing that non-citizen
voting is very common increases by approximately 27 percentage points. A comparable rise in black
10 For each figure we recode the independent variables on a 0-1 scale so that different variables have comparable minimum and maximum values. 11 The predicted probabilities reported in the text are “as observed” – calculated while leaving other independent variables at observed values and then averaging over all cases in the sample (see Hanmer and Kalkan 2013).
19
resentment increases the probability of believing the non-citizen voting is very common by almost
17 percentage points. It is not surprising that immigrant resentment is more closely related to beliefs
about the type of voter fraud directly implicating non-citizens. The results are also consistent with
our main hypothesis: even when asked about forms of voter fraud that do not necessarily involve
non-citizens, people with more resentment toward immigrants are still more likely to believe that
those fraudulent acts occur frequently.
[Insert Figure 1 About Here]
We are also interested in whether voter fraud beliefs are associated with negative attitudes
toward immigrants from a particular part of the world. To answer this question, we leverage a
question wording experiment that we conducted in the pre-election module. All respondents were
asked to use a thermometer rating to indicate how cold (0) or warm (100) they feel about Irish
immigrants. Then, respondents were randomly assigned one of three group thermometer rating
questions on African, Chinese, and Mexican immigrants. Measuring attitudes toward Irish
immigrants creates a baseline against which to compare the effects of the other immigrant groups.
We then examine the association between the different immigrant group ratings and voter fraud
beliefs while controlling for other competing explanatory variables proposed in this study.12 We
provide the results of our regression models with immigrant group thermometer ratings as
predictors in our online appendix (see Table A-11).
[Insert Figure 2 About Here]
In Figure 2, we compare the relative impact of each thermometer scale on the voter fraud
perceptions scale. We find that feelings toward Irish immigrants are unrelated to beliefs about voter
fraud. In contrast, when asked about the other immigrant groups, people with colder feelings toward
those groups are more inclined to think that voter fraud occurs very frequently. Our findings show 12 These tests have weaker statistical power since a different subsample evaluated each non-Irish immigrant group.
20
that a one standard deviation change in warmth towards Mexican immigrants is associated with a
decrease in voter fraud perceptions (b = -0.12, s.e. = 0.05, p < 0.05). Moving from extremely low to
extremely positive ratings of Mexican immigrants is associated with a roughly 1 point drop in the
expected voter fraud scale. However, there is no statistically significant relationship between views
towards Irish, African, or Chinese immigrants and beliefs about voter fraud. Additional tests of the
treatment effects indicate that the Mexican immigrant treatment group had significantly higher voter
fraud beliefs than the Chinese immigrant treatment group (b = 0.19, s.e. = 0.09, p < 0.05). No
significant differences were found between Mexican and African immigrant groups or Chinese and
African immigrant groups. This suggests that voter restrictions, which may depress turnout among
voters of color (Hajnal et al. 2015), are being mobilized by tapping into public animosity toward
Mexican immigrants. Overall, the CCES study shows a strong relationship between immigrant
resentment and voter fraud beliefs.
STUDY 2: ELECTION INTEGRITY MEASURES IN THE 2012 ANES
We have two main objectives in our second study. First, we build upon our first study
showing that voter fraud beliefs extend beyond racial animus to immigration concerns, using
different measures of election fraud beliefs and immigration attitudes. Second, we aim to further
show that immigrant animosity biases a person’s perception of election integrity even after
controlling for many covariates, including general orientations toward the political system. When
registration and voting procedures operate smoothly the public is more likely to believe in the
integrity of elections. Prior studies provide some evidence that public confidence in elections is
shaped by the performance of election administrators at the state level (Bowler et al. 2015) and at
the local level (Hall, Monson, and Patterson 2009; Gronke 2014). There is less evidence that state
election laws influence public concerns about election integrity. For example, the adoption of photo
ID requirements in several states does not appear to alleviate public concerns about voter fraud
21
(Ansolabehere and Persily 2008; Bowler et al. 2015). These findings still suggest that public
confidence in election administration should improve perceptions about the frequency of voter
fraud. Lastly, voters with higher levels of political efficacy and trust in government tend to be more
sanguine about election fraud in the United States (Gronke 2014; Wolak 2014; Uscinski and Parent
2014). This suggests that such dispositions should lower voter fraud beliefs.
To this end, we further test our hypotheses using the 2012 American National Election
Study (ANES) data. We provide a more detailed explanation of our measures in the online appendix.
We again use dependent variables that ask respondents about the frequency of election integrity
outcomes. The 2012 ANES Time Series Study includes questions in the post-election wave that ask
how often in our country “votes are counted fairly” and “election officials are fair.” Thus,
respondents knew the outcome of the 2012 election when answering the questions. We focus on
these two items as dependent variables because they come closest to the election fraud allegations
that frequently appear in election reform debates in the United States. We code both variables so
that higher scores indicate a stronger belief that elections are fraudulent. Less than one-third of
respondents believe that votes are counted fairly “very often,” and less than one-quarter believe that
election officials are fair “very often.”
We examine two measures of hostility to immigrants as our primary independent variable of
interest. One is an anti-immigration scale based on responses to six ANES questions on
immigration. Each item was recoded to a 0-1 scale, with higher values indicating greater antipathy
toward immigrants, and the six variables were averaged together to form an anti-immigration scale
(α = 0.75). We also create an ethnocentrism scale based on stereotype questions that ask the degree
to which particular groups (Whites, Blacks, Hispanics, and Asians) are “hard working” and
“intelligent.” Following the method used by Kam and Kinder (2012, 328), the average rating for out-
group members is subtracted from the in-group rating on each trait. Then the two trait comparison
22
measures are averaged together to create an ethnocentrism scale (α = 0.69). Higher scores indicate
greater hostility to racial and ethnic out-groups. We expect ethnocentrism and anti-immigration
attitudes to be positively associated with the election integrity variables.
We also control for similar partisan and ideological predispositions that we use in the 2014
CCES analysis. Both variables are coded so that we expect them to be positively associated with the
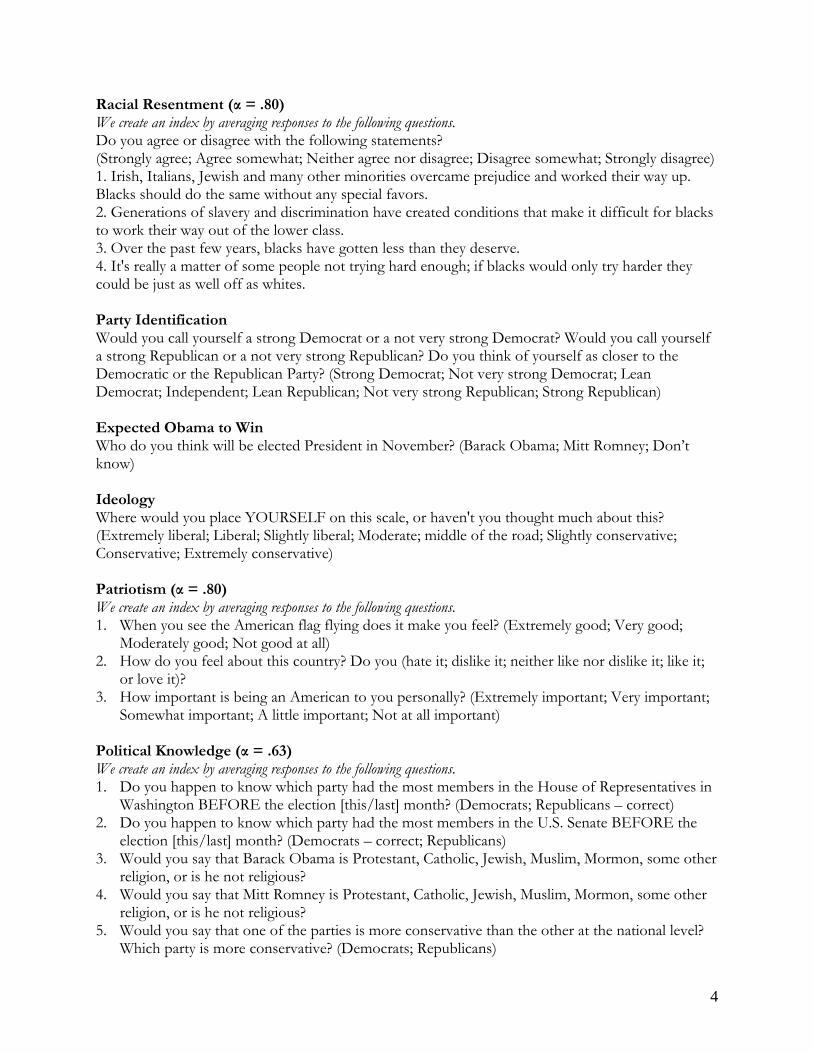
electoral integrity measures. In addition, we control for racial resentment by developing a scale with
four questions that ask about the status of blacks in American society (α = 0.80).13 Higher values
indicate higher levels of racial resentment, so we expect it to be positively associated with beliefs
about election fraud.
We also utilize the richness of ANES surveys to control for other dispositions that we were
unable to include in our CCES module. First, we control for electoral surprise, the inclination of
election losers, particularly unexpected losers, to grasp at poorly sourced claims of voter fraud
(Beaulieu 2014; Wolak 2014). To test this hypothesis, we create a dummy variable for respondents in
the pre-election wave of the survey who correctly predicted that President Obama would win re-
election in 2012. This measure should be negatively associated with beliefs about voter fraud.
Second, those with higher levels of patriotism and confidence in government should also be more
confident in the fairness of elections (Wolak 2014). We combine four questions about government
corruption and waste to measure trust in government (α= 0.63). Higher values indicate more trust in
government. We measure patriotism with three items (α= 0.80). We expect patriotism and trust to
be negatively associated with beliefs about election fraud.
The ANES data include a bevy of media exposure measures as well. Many ask which
newspapers, web sites, and radio and television programs respondents follow regularly. We compute
13 Racial resentment is positively correlated with ethnocentrism (r = .35) and the anti-immigration scale (r = .46). Removing racial resentment from the models does not appreciably change the coefficient estimates for the other independent variables (compare Tables A-13 and A-14).
23
the average of 19 of these questions measuring exposure to conservative media sources to create a
conservative media consumption scale (α= 0.86). Similarly, we combined 19 items for liberal sources
into a liberal media consumption scale (α= 0.77). We control for general media consumption with a
separate set of questions that ask respondents how frequently they read a newspaper, watch TV
news, or get news from radio shows or web sites.
Additionally, we include external efficacy and voter turnout as additional independent
variables, since actual participation and efficacy should predict more positive assessments of election
integrity. Turnout is a dummy variable indicating whether the respondent reported voting in the
2012 election. We measure external efficacy by combining two items that ask respondents whether
government official care about their interests and whether they have a say over what government
does (α= 0.65). Both variables are coded in a way that we expect them to be negatively associated
with beliefs about election fraud. Fourth, we include a dummy variable for battleground states to test
whether exposure to the heaviest competition in the presidential campaign produces more positive
assessments of electoral fairness (Wolak 2014). Lastly, we test the election administration hypothesis
using data from a recent initiative that rates each state’s administration of elections based on several
indicators (Pew Charitable Trusts 2016). We use the summary rating, the Election Performance
Index (EPI), as a measure of state election administration in 2012. Higher scores indicate better
performance, so we expect EPI to be negatively associated with our election integrity measures.
The 2012 ANES is a mixed-mode survey, with some respondents carrying out the survey via
traditional face-to-face interviews and others completing the survey online. There is some indication
that interviewer-administered surveys are more prone to social desirability effects, producing more
positive assessments of government and elections (Atkeson, Adams, and Alvarez 2014). Internet
surveys tend to generate more negative assessments and may also yield more pessimistic evaluations
24
of electoral integrity. We include a dummy variable for the Internet mode to test this hypothesis.
Finally, we include controls for political knowledge, education, income, race, and ethnicity.
Since our dependent variables are ordinal measures we estimate an ordered logit model to
examine the predictors of beliefs about electoral integrity. Each of the independent variables are
scored on a 0-1 interval. For each dependent variable we estimate one model with anti-immigration
attitudes as our main predictor of interest and a second model with ethnocentrism as the chief
independent variable.
Results
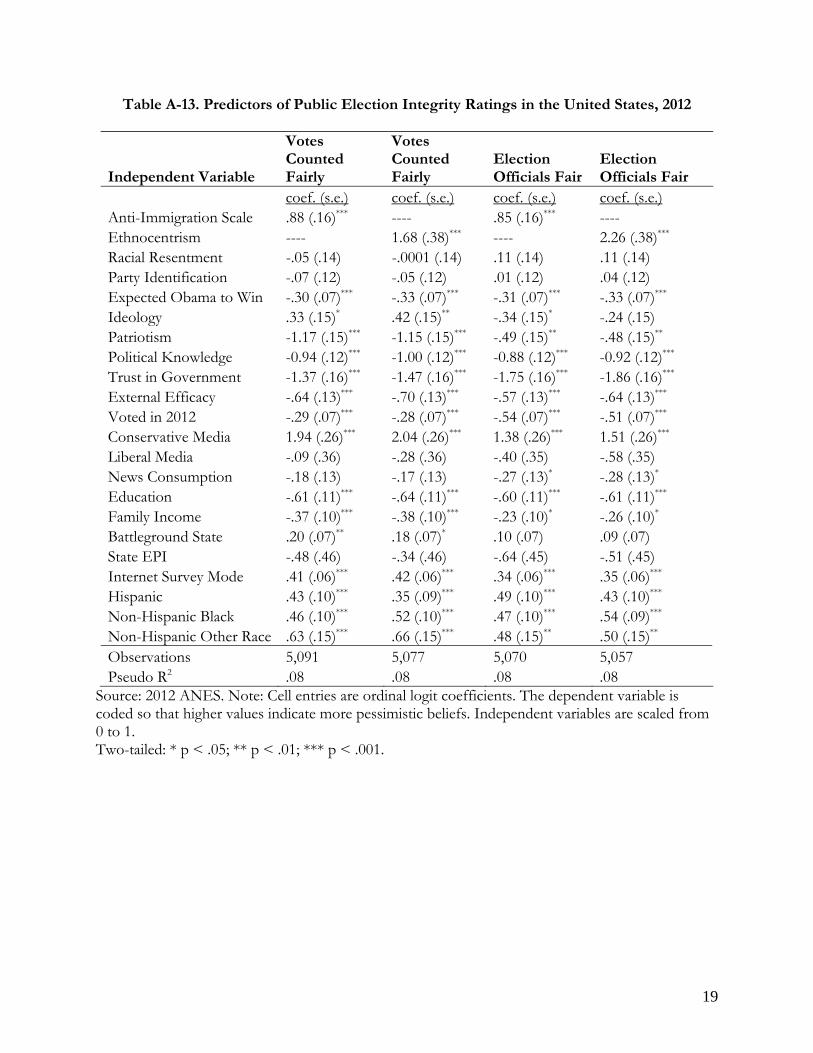
Table A-13 in the appendix provides the results from models of election integrity ratings in
the United States. Our results provide additional evidence of a strong relationship between anti-
immigrant attitudes and measures of electoral fraud beliefs. Anti-immigration attitudes and
ethnocentrism are potent predictors of electoral integrity beliefs, even after controlling for a host of
other factors. A one-standard deviation increase in the anti-immigration scale increases the odds of
negative evaluations by 22 percent on the “votes counted fairly” measure and by 21 percent on the
“election officials are fair” measure. A one-standard increase in the ethnocentrism scale yields a
somewhat weaker but statistically significant relationship with election integrity evaluations (14
percent and 20 percent, respectively). Moving from the 10th to the 90th percentile on the anti-
immigration scale is associated with a .10 decline in the predicted probability of believing that votes
are counted fairly very often and a .08 decline in the predicted probability of believing that election
officials are very often fair. A similar change in ethnocentrism is associated with a 6 percentage point
drop in the “very often” response on both election integrity items. Additionally, we find a stronger
impact of ethnocentrism and anti-immigration attitudes on voter fraud beliefs when the sample is
restricted to non-Hispanic Whites. All of these estimated impacts are statistically significant at
25
p<.001. Among the other independent variables, only political knowledge and trust in government
consistently produce stronger associations with beliefs about electoral integrity.
Consistent with previous studies, we find that perceptions of election integrity are influenced
by broader pessimism toward government, mainstream politics, and election administration.
Individuals with less patriotism and trust in government are less likely to believe that votes are
counted fairly and election officials act fairly. A one-standard deviation increase in trust in
government reduces the odds of negative evaluations on the “votes counted fairly” measure by 23
percent and by 29 percent on the “election officials are fair” measure. Moving from the 10th
percentile to the 90th percentile on trust in government increases the predicted probability of
believing that elections are fair very often by approximately 14 percentage points. A one-standard
deviation increase in patriotism reduces the odds of believing that votes are not counted fairly (20
percent) more than believing that election officials are not fair (9 percent). Increasing patriotism
from the 10th percentile to the 90th percentile increases the predicted probability of believing that
votes are very often counted fairly by approximately 9 percentage points. These estimated effects are
statistically significant at p<.001. Patriotism is a somewhat rare disposition that is positively
associated with evaluations of election fairness but appears unrelated to beliefs about the frequently
of voter fraud in the CCES study.
Other indicators of positive connections to the political system tend to produce favorable
assessments of election integrity. People who did not vote in the 2012 elections and have lower
levels of political efficacy are more likely to hold negative evaluations of election fairness. Voters are
6 percentage points more likely than non-voters to believe that votes are very often counted fairly
and 9 points more likely to believe that election officials are very often fair (p<.001). A one-standard
deviation increase in external efficacy reduces the odds of negative election assessments by roughly
14 percent (p<.001). Similarly, education and political knowledge are associated with more positive
26
evaluations of election integrity. One-standard deviation increases in political knowledge and
education lower the odds of unfavorable election fairness beliefs by roughly 24 percent and 16
percent, respectively (p<.001).
As in the CCES study, we again find that exposure to conservative media outlets is
associated with more negative assessments of election integrity. Increasing conservative media
exposure from the 10th to the 90th percentile reduces the predicted probability of believing that vote
counts and election officials are very often fair by 7 percentage points and 4 percentage points,
respectively (p<.001). Liberal media exposure and overall news consumption are substantively and
statistically unreliable predictors of election fairness evaluations.
The ANES results also provide evidence of a mode effect in public evaluations of election
integrity. Face-to-face respondents are 8 percentage points more likely than Internet respondents to
believe that votes are very often counted fairly and 5 points more likely to believe that election
officials are very often fair (p<.001). These findings are consistent with prior research suggesting
that Internet surveys yield somewhat more negative assessments of political institutions and
processes. The results also indicate that negative assessments of election fairness are slightly more
prominent among people who live in battleground states than those living in non-battleground
states. These findings are telling, since the one objective measure of election performance (EPI) is
not significantly related to beliefs about election fairness.14
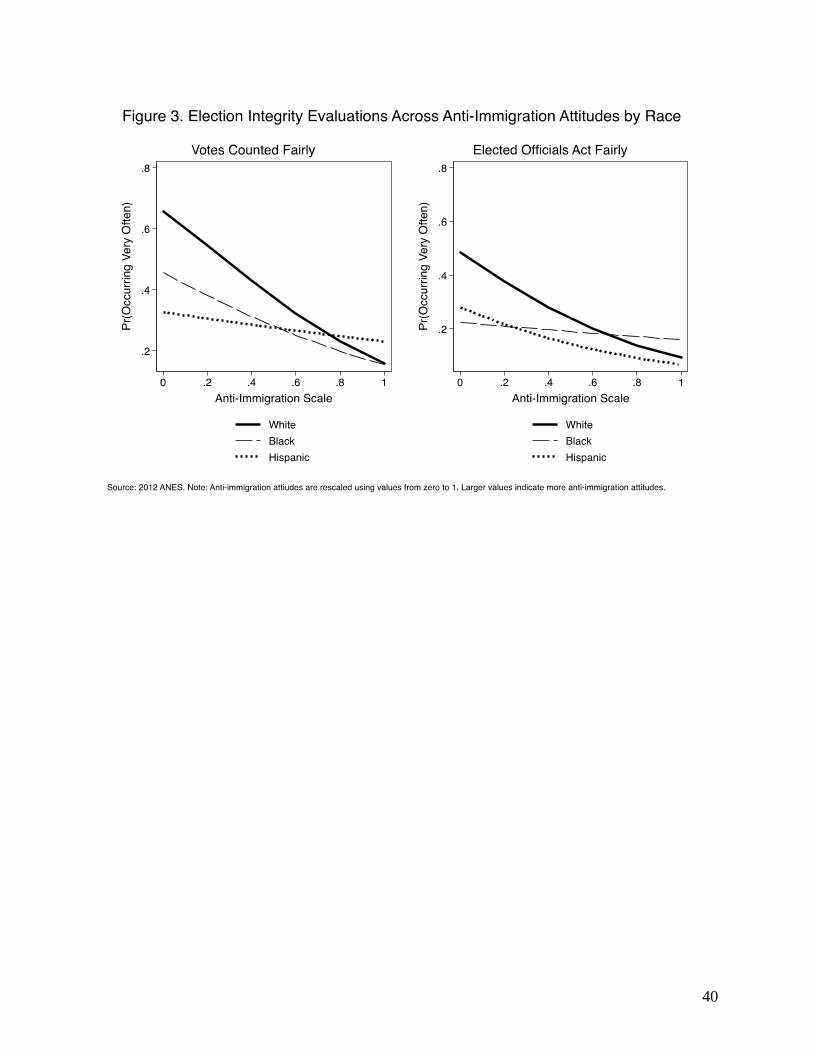
Leveraging the oversampling of racial minorities in the 2012 ANES, we are able to examine
the election integrity ratings of non-Hispanic blacks and Hispanics. We find that African Americans,
Hispanics and Americans of another race tend to report less positive evaluations of election fairness
than white Americans (p<.001). However, when we estimate a simplified model that interacts the
14 When we control for other state performance measures, such as the frequency of registration and absentee voting problems, we also find little to no relationship with public beliefs about election integrity.
27
immigrant resentment measures with race we find that any effect of anti-immigration attitudes on
voter fraud beliefs seems to be located primarily among non-Hispanic white respondents. In Figures
3 and 4, we plot the predicted probability of believing that fair outcomes occur “very often” across
group-based attitudes segmented by race. Generally, an increase in anti-immigrant attitudes
decreases the probability of holding positive evaluations of election fairness. Among individuals with
lower anti-immigration attitudes, white respondents tend to be substantially more optimistic about
election integrity than black and Hispanic respondents. Yet, an increase in anti-immigrant attitudes
has a larger effect in diminishing optimism among whites than racial and ethnic minorities. Thus,
white Americans with strong anti-immigrant attitudes tend hold negative assessments of election
integrity on par with black and Hispanic Americans. Ethnocentrism has an even larger negative
effect on the election fraud beliefs of whites, shown in Figure 4. Figure 4 also illustrates that blacks
and Hispanics who believe that whites are less intelligent and lazier than racial minorities are less
likely to hold positive assessments of election integrity. However, as they subscribe to the stereotype
of white superiority, blacks tend to give generally more positive evaluations of elections while
Hispanics tend to believe that votes are counted fairly very often.
[Insert Figure 3 About Here]
[Insert Figure 4 About Here]
As with our CCES study, controlling for group-based attitudes and other political
orientations seems to leave little room for partisanship and ideology to explain variation in voter
fraud beliefs. Changing the coding of party identification to nominal categories, or removing
ideology from the equation, does not improve partisanship’s explanatory power. Part of the reason
for the weak performance of partisanship is its correlation with the sore loser measure. Those who
correctly expected Obama to be reelected in 2012 were approximately 6 percentage points more
likely than other respondents to believe that ballot counts and election officials are very often fair
28
(p<.001). However, our evidence also suggests that group-based attitudes toward immigrants
account for some of the partisan differences in public beliefs about election integrity.
Meanwhile, after controlling for immigration attitudes we fail to find evidence that racial
resentment is associated with beliefs about election integrity. It appears that broader indicators of
out-group hostility (i.e. ethnocentrism) more reliably predict electoral integrity evaluations than the
more narrowly tailored racial resentment measure. In comparing our two studies, we find that anti-
immigrant attitudes are strongly associated with beliefs about voter fraud and election fairness but
racial resentment only helps explain voter fraud beliefs. This disparity in our findings may be due to
the nature of voter fraud rhetoric in the United States. While there are examples noted above of
rhetoric framing voter fraud as an urban problem, these examples tend to focus on voter registration
and the language tends to stop short of implicating election officials and the fairness of the vote
count. In contrast, voter fraud rhetoric targeting immigrants tends to include claims that non-
citizens change the vote count and swing election outcomes, as in the statements by President
Trump and Rep. Broun noted above, thus “diluting” the votes of American citizens (e.g., von
Spakovsky 2008). Overall, the language of voting integrity may be “immigrationalized” (Garand, Xu
and Davis 2015) more than it is racialized. In any case, this puzzle deserves attention in future
research.
CONCLUSION
Across two studies, we present strong evidence that group-centric attitudes toward
immigrants are associated with public beliefs about voter fraud. Using data from the 2014 CCES, we
show that immigrant resentment is a strong predictor of voter fraud beliefs. Using the 2012 ANES
data, we find that the effects of anti-immigration and ethnocentric attitudes remain robust across
different measures of election fairness. Both studies indicate immigration concerns are associated
29
with election integrity beliefs above and beyond the impact of traditional political dispositions
involving party, ideology, election administration, and racial animus.
We believe these findings are due to two contemporary conditions in American politics.
First, the foreign-born population has increased sharply in recent years, particularly in historically
newer American destinations. This makes immigration a more salient consideration for many
Americans when thinking about politics. Second, political rhetoric often paints immigrants as
lawbreakers, particularly in the voting domain, thus priming attitudes toward immigrants when
people think about criminal behavior. While we test these ideas in the United States, we believe that
immigration attitudes may shape voter fraud beliefs in other countries where politics are roiled by
immigration anxieties.
The results of our studies are consistent with studies that show that racial animus structures
voter fraud beliefs (Appleby and Federico 2017; Wilson and Brewer 2013). Yet, our findings from
the CCES also suggest that such conclusions about racial attitudes are incomplete. In response to
calls to use attitudes toward immigrants as explanatory variables (e.g., Hainmueller and Hopkins
2014), we find that immigrant resentment is a robust predictor of voter fraud beliefs. In addition,
this relationship is mediated in part by attitudes toward undocumented immigrants and Mexican
immigrants. We argue that these findings are largely attributed to the immigrant resentment scale
capturing various attitudes on whether immigrants increase crime, disrupt social and political norms,
are undeserving American members, and decrease the political influence of white Americans. These
attitudes are not measured in other racial attitude scales, but are likely called to mind when
respondents are asked about how often people commit voter fraud.
Our findings suggest that immigrant resentment is a strong and reliable predictor of other
attitudes concerning American political membership. While immigrant anxiety increases trust in
certain political actors, primarily Republican leaders (Albertson and Gadarian 2015), we find that
30
immigrant resentment is associated with lower levels of trust in the integrity of American elections.
We also find significant relationships between measures of conservative media exposure and beliefs
that voter fraud occurs frequently. Overall, these findings suggest that elite rhetoric might provoke
Americans’ pessimistic beliefs about election fraud.
We are aware that two cross-sectional surveys are not ideal for making causal inferences and
do not provide the last word on this topic. Nevertheless, this study establishes a clear relationship
between immigrant resentment and beliefs about voting integrity that merits further examination. In
particular, we suggest survey experiments that test the impact of elite messages linking immigration
and voter fraud. Furthermore, we examine public opinion measures that focus on estimates of the
frequency of fraudulent and fair election activities. Additional research should examine the
relationship between immigrant resentment and other dimensions of voter fraud beliefs (such as
voter confidence, the significance of fraudulent acts, and misbehavior by other actors in the election
process). The gap in political science scholarship on voter fraud beliefs is due in part to a dearth of
survey instruments that include questions about perceptions of voter fraud and attitudes toward
immigrants all in the same survey. As such, prior studies produced indirect analyses by using less
reliable and valid demographic indicators of Latino or foreign-born population growth as
approximations of the threat or animosity that native-born feel toward immigrants.
Hostility toward immigrants is a reliable predictor of concerns about voter fraud and thus a
likely source of public support for restrictive laws such as photo ID and proof of citizenship
requirements for voters. Voter fraud perceptions are associated with public support for restrictive
voter identification laws (Wilson and Brewer 2013). Relatedly, states with a higher share of minority
residents or voters are more likely to introduce legislation with restrictive voting policies, like photo
ID requirements (Bentele and O’Brien 2013; Hicks et al. 2014). The policymaking process may be
shaped by political rhetoric that frequently links immigration, race and voter fraud, sometimes in a
31
hyperbolic manner. Furthermore, debates about proposed voting restrictions often focus on the
anticipated impact of those policies on minority groups. Thus, in a “group-centric” polity we expect
that public support for proposed voting restrictions will be associated with attitudes toward
immigrants.
In sum, the role of animosity toward racial and ethnic minorities is underappreciated in
scholarship on public opinion about election fraud and voting reforms. Much of the existing
literature emphasizes partisan and ideological divisions among the electorate on photo ID laws, for
example, largely reflecting clear partisan divisions among elites on these issues. The partisan and
ideological differences are real, but photo ID and proof of citizenship requirements enjoy majority
support among people of all political stripes in the United States. Widespread support for these
policies, and heightened concerns about voter fraud, appear to be nourished by a reservoir of
hostility toward racial and ethnic minorities. Animosity toward immigrants may solidify public
support for measures to restrict participation of eligible voters in democratic elections. This is
troubling, given that legislators and courts lean heavily on public concerns about voter fraud as
justification for new election laws. These prejudices may extend to election officials themselves. A
recent study (White, Nathan and Faller 2015) finds that Latino voters receive less assistance from
local election officials than white voters. In any case, the topic of fraudulent voting practices will
likely continue to provoke voters to call to mind groups that are politically constructed as “un-
American.”
References Abrajano, Marisa, and Zoltan L. Hajnal. 2015. White backlash: immigration, race, and American politics. Princeton: Princeton University Press. Ahlquist, John S., Kenneth R. Mayer, and Simon Jackman. 2014. “Alien Abduction and Voter Impersonation in the 2012 U.S. General Election: Evidence from a Survey List Experiment." Election Law Journal 36:460-475.
32
Albertson, Bethany, and Shana Kushner Gadarian. 2015. Anxious Politics: Democratic Citizenship in a Threatening World. New York: Cambridge University Press. Ansolabehere, Stephen, and Nathaniel Persily. 2008. “Vote Fraud in the Eye of the Beholder: The Role of Public Opinion in the Challenge to Voter Identification Requirements.” Harvard Law Review 121:1737-1774. Ansolabehere, Stephen, Samantha Luks, and Brian F. Schaffner. 2015. "The perils of cherry picking low frequency events in large sample surveys." Electoral Studies 40: 409-410. Appleby, Jacob, and Christopher M. Federico. 2017. “The racialization of electoral fairness in the 2008 and 2012 United States presidential elections.” Group Processes and Intergroup Relations http://journals.sagepub.com/doi/abs/10.1177/1368430217691364. Atkeson, Lonna Rae, Alex N. Adams, and R. Michael Alvarez. 2014. "Nonresponse and mode effects in self-and interviewer-administered surveys." Political Analysis 22(3): 304-20. Barreto, Matt. 2006. ¡Sí Se Puede! Latino Candidates and the Mobilization of Latino Voters. American Political Science Review 101(3): 425-41. Barreto, Matt A., Stephen A. Nuño, and Gabriel R. Sanchez. 2009. “The Disproportionate Impact of Voter-ID Requirements on the Electorate – New Evidence from Indiana.” PS: Political Science & Politics 42:111-116. Beaulieu, Emily. 2014. “From Voter ID to Party ID: How Political Parties Affect Perceptions of Election Fraud in the US.” Electoral Studies 35:24-32. Bentele, Keith G., and Erin E. O’Brien. 2013. “Jim Crow 2.0? Why States Consider and Adopt Restrictive Voter Access Policies.” Perspectives on Politics 11:1088-1116. Bowler, Shaun, and Todd Donovan. 2016. “A partisan model of electoral reform: Voter identification laws and confidence in state elections.” State Politics & Policy Quarterly 16:340-361. Bowler, Shaun, Thomas Brunell, Todd Donovan, and Paul Gronke. 2015. "Election administration and perceptions of fair elections." Electoral Studies 38: 1-9. Brader, Ted, Nicholas A. Valentino, and Elizabeth Suhay. 2008. “What Triggers Public Opposition to Immigration? Anxiety, Group Cues, and Immigration Threat.” American Journal of Political Science 52:959-978. Branton, Regina, Erin C. Cassese, Bradford S. Jones, and Chad Westerland. 2011. "All along the watchtower: Acculturation fear, anti-Latino affect, and immigration." The Journal of Politics 73(3): 664-679. Burns, Peter, and James G. Gimpel. 2000. "Economic insecurity, prejudicial stereotypes, and public opinion on immigration policy." Political science quarterly 115(2): 201-225.
33
Christensen, Ray, and Thomas J. Schultz. 2014. “Identifying Election Fraud Using Orphan and Low Propensity Voters.” American Politics Research 42:311-337. Cisneros, Henry G. 2009. Twenty-first century gateways: Immigrant incorporation in suburban America. Washington, D.C.: Brookings Institution Press. Soto, Victoria M. DeFrancesco, and Jennifer L. Merolla. 2004. "Vota por tu futuro: Partisan mobilization of Latino voters in the 2000 presidential election." Political Behavior 28(4): 285-304. DellaVigna, Stefano, and Ethan Kaplan. 2007. “The Fox News Effect: Media Bias and Voting.” Quarterly Journal of Economics 122:1187-1234. Dixon, Matt. 2012. “180,000 non-residents could be registered to vote in Florida.” Florida Times-Union, May 11 (http://jacksonville.com/news/florida/2012-05-10/story/180000-non-residents-could-be-registered-vote-florida). Dreier, Peter, and Christopher R. Martin. 2010. “How ACORN was Framed: Political Controversy and Media Agenda Setting.” Perspectives on Politics 8:761-792. Dunaway, Johanna, Regina P. Branton, and Marisa A. Abrajano. 2010."Agenda setting, public opinion, and the issue of immigration reform." Social Science Quarterly 91(2): 359-378. Ellis, Atiba. 2014. “The Meme of Voter Fraud.” Catholic University Law Review 63:879-915. Fogarty, Brian, Jessica Curtis, P. Frances Gouzien, David C. Kimball, and Eric Vorst. 2015. “News Attention to Voter Fraud in the 2008 & 2012 U.S. Elections.” Research & Politics 2(2):1-8. Galloway, Jim. 2014. “Your daily jolt: Paul Broun says Democrats need illegal alien vote to take Georgia.” Atlanta Journal-Constitution, January 7 (http://politics.blog.ajc.com/2014/01/07/your-daily-jolt-paul-broun-says-democrats-need-illegal-alien-vote-to-take-georgia/). Garand, James C., Ping Xu, and Belinda C. Davis. 2015. “Immigration Attitudes and Support for the Welfare State in the American Mass Public.” American Journal of Political Science 1-17. Garcia, J. A. (2003). Latino politics in America: Community, culture, & interests. Maryland: Rowman & Little. Gil de Zúñiga, Homero, Teresa Correa, and Sebastian Valenzuela. 2012. “Selective Exposure to Cable News and Immigration in the U.S.: The Relationship Between FOX News, CNN, and Attitudes Toward Mexican Immigrants.” Journal of Broadcasting and Electronic Media 56:597-615. Gilliam, Frank D., Jr., and Shanto Iyengar. 2000. “Prime Suspects: The Influence of Television News on the Viewing Public.” American Journal of Political Science 44(3): 560– 73. Gronke, Paul. 2014. “Voter Confidence as a Metric of Election Performance.” In The Measure of American Elections, Barry C. Burden and Charles Stewart, III, eds. New York: Cambridge University Press.
34
Hainmueller, Jens, and Daniel J. Hopkins. 2014. "Public attitudes toward immigration." Annual Review of Political Science 17(1): 225-49. Hajnal, Zoltan, Nazita Lajevardi, and Lindsay Nielson. 2017. “Voter identification laws and the suppression of minority votes.” Journal of Politics forthcoming. Hall, Thad E., J. Quin Monson, and Kelly D. Patterson. 2009. "The Human Dimension of Elections How Poll Workers Shape Public Confidence in Elections." Political Research Quarterly 62(3): 507-522. Hanmer, Michael J., and Kerem Ozan Kalkan. 2013. “Behind the Curve: Clarifying the Best Approach to Calculating Predicted Probabilities and Marginal Effects from Limited Dependent Variable Models.” American Journal of Political Science 57:263-277. Hasen, Richard. 2012. The Voting Wars. New Haven, CT: Yale University Press. Haynes, Chris, Jennifer Merolla, and S. Karthick Ramakrishnan. 2016. Framing Immigrants: News Coverage, Public Opinion, and Policy. New York: Russell Sage. Henderson, Ana Kathryn-Anne. 2015. “Shaping Issues: News Media Framing of Proof of Citizenship Requirements to Register to Vote.” Ph.D. diss. University of California, Berkeley. Hershey, Marjorie Randon. 2009. “What We Know about Voter-ID Laws, Registration, and Turnout.” PS: Political Science & Politics 42:87-91. Hicks, William D. Seth C. McKee, Mitchell D. Sellers, and Daniel A. Smith. 2015. “A principle or a strategy? Voter identification laws and partisan competition in the American states.” Political Research Quarterly 68:18-33. Hopkins, D.J., 2010. Politicized places: Explaining where and when immigrants provoke local opposition. American Political Science Review, 104(01), pp.40-60. Hoover, Tim. 2012. “Noncitizen voters ID’d fraction of those first alleged by Gessler.” Denver Post, September 15 (http://www.denverpost.com/2012/09/15/noncitizen-voters-idd-fraction-of-those-first-alleged-by-gessler/). House, Billy, and Steven T. Dennis. 2017. “Trump says undocumented immigrants cost him popular vote.” Bloomberg, January 24 (https://www.bloomberg.com/politics/articles/2017-01-24/trump-again-claims-undocumented-immigrants-cost-him-popular-vote). Hussey, Laura S., and Shanna Pearson-Merkowitz. 2013. "The changing role of race in social welfare attitude formation: Partisan divides over undocumented immigrants and social welfare policy." Political Research Quarterly 66(3): 572-584. Jones, Robert P., Daniel Cox, and Juhem Navarro-Rivera. 2014. “What motivated voters during the Midterm Elections? Public Religion Research Institute, November 12 (https://www.prri.org/research/survey-2014-post-election-american-values-survey-what-motivated-voters-during-the-midterm-elections/).
35
Kahn, Natasha, and Corbin Carson. 2012. News21, August 12 (accessed at http://votingrights.news21.com/article/election-fraud/). Kam, Cindy D., and Donald R. Kinder. 2012. “Ethnocentrism as a short-term force in the 2008 American presidential election.” American Journal of Political Science 56:326-340. Kinder, Donald R., and Cindy D. Kam. 2009. Us Against Them. Chicago: University of Chicago Press. Kobach, Kris W. 2015. Testimony before the United States House of Representatives, Committee on Oversight and Government Reform. February 12 (https://oversight.house.gov/wp-content/uploads/2015/02/Kobach-Testimony-House-OGR-21215.pdf). Kropf, Martha, and David C. Kimball. 2012. Helping America Vote: The Limits of Election Reform. New York: Routledge. Lee, Taeku. 2016. “Asian Americans in the 2015 Election.” Asian American Decisions. Seattle, WA. Retrieved at: http://asianamericandecisions.com/2016/10/26/asian-american-voters-in-the-2016-election/ Levitt, Justin. 2014. “A comprehensive investigation of voter impersonation finds 31 credible incidents out of one billion ballots cast.” Washington Post, August 6 (accessed at http://www.washingtonpost.com/blogs/wonkblog/wp/2014/08/06/a-comprehensive-investigation-of-voter-impersonation-finds-31-credible-incidents-out-of-one-billion-ballots-cast/. Lien, Pei‐te, M. Margaret Conway, and Janelle Wong. 2003. "The contours and sources of ethnic identity choices among Asian Americans." Social Science Quarterly 84(2): 461-481. Lien, Pei-te, M. Margaret Conway, and Janelle Wong. 2004. The politics of Asian Americans: Diversity and community. New York, NY: Routledge. Marrow, Helen. 2011. New destination dreaming: Immigration, race, and legal status in the rural American South. Stanford University Press. Massey, Doug S. ed. 2008. New faces in new places: The changing geography of American immigration. Russell Sage Foundation. Minnite, Lorraine. 2010. The Myth of Voter Fraud. Ithaca, NY: Cornell University Press. Newman, B.J., 2013. Acculturating contexts and Anglo opposition to immigration in the United States. American Journal of Political Science, 57(2), pp.374-390. Newman, B.J., Johnston, C.D., Strickland, A.A. and Citrin, J., 2012. Immigration crackdown in the American workplace: Explaining variation in e-verify policy adoption across the US states. State Politics & Policy Quarterly, 12(2), pp.160-182.
36
Nuño, Stephen A. 2007. "Latino mobilization and vote choice in the 2000 presidential election." American Politics Research 35(2): 273-293. Ousey, Graham C., and Charis E. Kubrin. 2017. “Immigration and Crime: Assessing a Contentious Issue.” Annual Review of Criminology 1:1.1-1.22. Pantoja, A. D., Ramírez, R., & Segura, G. (2001). Citizens by choice, voters by necessity: Patterns in political mobilization by naturalized Latinos. Political Research Quarterly 54(4):729-750. Pew Charitable Trusts. 2016. Elections Performance Index, August 9 (http://www.pewtrusts.org/en/multimedia/data-visualizations/2014/elections-performance-index). Passel and Cohn 2016. “Unauthorized immigrant population stable for half a decade.” Fact Tank News in Numbers. Pew Research Center, Washington, D.C. Retrieved at: Retrieved at: http://www.pewresearch.org/fact-tank/2016/09/21/unauthorized-immigrant-population-stable-for-half-a-decade/ Passel, Jeffrey S. and D'Vera Cohn. 2011. Unauthorized Immigrant Population: National and State Trends, 2010. Washington, DC: Pew Hispanic Center. Retrieved at: http://www.pewhispanic.org/files/reports/133.pdf Powers, Scott, Kathleen Haughney, and Dana Williams. 2012. “State names 198 noncitizens illegally registered to vote.” Orlando Sentinel, September 26 (http://articles.orlandosentinel.com/2012-09-26/news/os-voter-purge-list-released-20120926_1_voter-rolls-voter-registration-chris-cate). Ramírez, Ricardo. 2002. The changing landscape of California politics, 1990-2000. Unpublished doctoral dissertation, Stanford University, Palo Alto, CA. Sances, Michael W., and Charles Stewart. 2014. "Partisanship and confidence in the vote count: Evidence from US National Elections since 2000." Electoral Studies 40: 176-188. Schildkraut, Deborah J. 2011. Americanism in the Twenty-First Century: Public Opinion in the Age of Immigration. New York: Cambridge University Press. Segal, A. 2004. Bikini politics: The 2004 Presidential campaigns’ Hispanic Media Efforts Cover Only the Essential Parts of the Body Politic. Interim Report, Hispanic Voter Project Report. September. Washington: John Hopkins University
Siegelbaum, Debbie. 2011. “GOP says 5,000 non-citizens voting in Colorado a 'wake-up call' for states” The Hill, March 31 (http://thehill.com/homenews/house/153079-gop-says-5000-non-citizens-voting-in-colorado-a-wake-up-call-for-states). Singer, A., 2004. The rise of new immigrant gateways. Brookings Institution, February. Smith, Glen. 2016. “The Timing of Partisan Media Effects during a Presidential Election.” Political Research Quarterly 69:655-666.
37
Stewart, Charles. 2013. "2012 Survey of the Performance of American Elections", http://hdl.handle.net/1902.1/21624 UNF:5:nMKNqnHfGzpAilhPJPvE8g== V2 [Version] Terrazas, Aaron. 2011. “Immigrants in New-Destination States.” February 8, 2011 Spotlight. Migration Policy Institute. Retrieved at: http://www.migrationpolicy.org/article/immigrants-new-destination-states Udani, Adriano, and David C. Kimball. 2017. “Public Beliefs about Voter Fraud.” Paper presented at the annual meeting of the Midwest Political Science Association, Chicago, April 7. Uscinski, Joseph E., and Joseph M. Parent. 2014. American conspiracy theories. Oxford: Oxford University Press. von Spakovsky, Hans. 2008. “The Threat of Non-Citizen Voting.” The Heritage Foundation, July 8 (http://www.heritage.org/report/the-threat-non-citizen-voting). Vonnahme, Greg, and Beth Miller. 2013. “Candidate Cues and Voter Confidence in American Elections.” Journal of Elections, Public Opinion and Parties. 23:223-239. White, Ariel R., Noah L. Nathan, and Julie K. Faller. 2015. “What do I Need to Vote? Bureaucratic Discretion and Discrimination by Local Election Officials.” American Political Science Review. Wilson, David C., and Paul R. Brewer. 2013. “The Foundations of Public Opinion on Voter ID Laws: Political Predispositions, Racial Resentment, and Information Effects.” Public Opinion Quarterly 77:962-984. Wilson, David C., and Tyson King-Meadows. 2016. "Perceived electoral malfeasance and resentment over the election of Barack Obama." Electoral Studies 44: 35-45. Wilson, Jill. and Audrey Singer. 2011. Immigrants in 2010 metropolitan America: A decade of change. Metropolitan Policy Program, Brookings Institution. Retrieved at: https://www.brookings.edu/wp-content/uploads/2016/06/1013_immigration_wilson_singer.pdf Wolak, Jennifer. 2014. “How Campaigns Promote the Legitimacy of Elections.” Electoral Studies 34:205-215. Wang, Xie. 2012. Undocumented immigrants as perceived criminal threat: A test of the minority threat perspective. Criminology, 50(3), pp.743-776. Wong, Janelle. 2008. Democracy's promise: Immigrants and American civic institutions. Ann Arbor, MI: University of Michigan Press. Wong, Janelle S. "Mobilizing Asian American voters: A field experiment." The Annals of the American Academy of Political and Social Science 601, no. 1 (2005): 102-114. Zaller, John R. 1992. The Nature and Origins of Mass Opinion. New York: Cambridge University Press.
38
39
40
41
1
ONLINE APPENDIX for “Immigrant Resentment and Voter Fraud Beliefs in the U.S. Electorate”
Variables and Question Wording for 2014 CCES Study Voter fraud (α = .92) We create an index by averaging responses to the following questions. Responses recoded to indicate higher values reflect beliefs that voter fraud occurs more frequently. How often do the following illegal practices occur in U.S. elections? 1.Voting more than once in an election. 2. Pretending to be someone else when voting. 3. People voting who are not U.S. citizens. Immigrant Resentment (α = .84) We create an index by averaging responses to the following questions. In your view, how much do you agree or disagree with the following statements? (Strongly agree; Agree; Neither agree nor disagree; Disagree; Strongly disagree) 1. The more influence that immigrant have in politics the less influence people like me will have in
politics. 2. English will be threatened if other languages are frequently used in large immigrant communities
in the U.S. 3. New immigrants have increased the level of crime in the United States. 4. The Irish, Italians, Jews, and many other minorities overcame prejudice and worked their way
up. Today's immigrants should do the same without any special favors. 5. Immigrants are getting too demanding in their push for equal rights. 6. Legal immigrants should have same rights as an American. Social dominance orientation (α =.79) We create an index by averaging responses to the following questions. In your view, how much do you agree or disagree with the following statements? (Strongly agree; Agree; Neither agree nor disagree; Disagree; Strongly disagree) 1. Certain groups should stay in their place. 2. Inferior groups should stay in their place. 3. Other groups should stay in their place. 4. Society should equalize conditions for groups. 5. Group equality is ideal. 6. Society should increase social equality. Black resentment (α = .75) We create an index by averaging responses to the following questions. Do you agree or disagree with the following statements? (Strongly agree; Agree; Neither agree nor disagree; Disagree; Strongly disagree) 1. The Irish, Italians, Jews and many other minorities overcame prejudice and worked their way up. Blacks should do the same without any special favors. 2. Generations of slavery and discrimination have created conditions that make it difficult for Blacks to work their way out of the lower class.
2
American patriotism (α = .86) We create an index by averaging responses to the following questions. 1. When you see the American flag flying does it make you feel: (Extremely good; Very good; Moderately good; Slightly good; Not good at all) 2. How important is being an American to you personally? (Extremely important; Very important; Somewhat important; A little important; Not at all important) Fox News Exposure How often do you watch news on Fox News? (1 = Rarely; 2 = Several days a month; 3 = several days a week; 4 = Every day) Media Consumption (α = .54) We create an index by averaging responses to the following questions. In the past 24 hours have you ... (check all that apply) [ order randomized] (No = 0; Yes = 1)
1. Read a Blog 2. Watched TV 3. Read a newspaper in print or online 4. Listened to a radio news program or talk radio 5. None of These (Yes = 0; No = 1)
Political knowledge (α = .80) We create an index by averaging responses to the following questions. 1. Which political party controls the U.S. House of Representatives? (Democrats; Republicans; Not
Sure) 2. Which political party controls the U.S. Senate? (Democrats; Republicans; Not Sure) Party Identification 1 = Democrat; 2 = Independent; 3 = Republican (“Not sure” coded as Independent) Sex 0 = Male; 1 = Female Race 0 = White; 1 = Non-white Family Income Thinking back over the last year, what was your family’s annual income? 1 = Less than $10,000; 2 = $10,000 - $19,999; 3 = $20,000 - $29,999; 4 = $30,000 - $39,999; 5 = $40,000 - $49,999; 6 = $50,000 - $59,999; 7 = $60,000 - $69,999; 8 = $70,000 - $79,999; 9 = $80,000 - $99,999; 10 = $100,000 - $119,999; 11 = $120,000 - $149,999; 12 = $150,000 - $199,999; 13 = $200,000 - $249,999; 14 = $250,000 - $349,999; 15 = $350,000 - $499,999; 16 = $500,000 or more Education What is the highest level of education you have completed? 1 = No High School; 2 = High School Graduate; 3 = Some College; 4 = 2- year; 5 = 4-year; 6 = Post-grad
3
Variables and Question Wording for 2012 ANES Study
Votes Counted Fairly In your view, how often do the following things occur in this country's elections? Votes are counted fairly: (1 = Very often; 2 = Fairly often; 3 = Not often; 4 = Not at all often) Election Officials Fair In your view, how often do the following things occur in this country's elections? Election officials are fair: (1 = Very often; 2 = Fairly often; 3 = Not often; 4 = Not at all often) Anti-Immigration Scale (α = .75) We create an index by averaging responses to the following questions. 1. Which comes closest to your view about what government policy should be toward
unauthorized immigrants now living in the United States? a. Make all unauthorized immigrants felons and send them back to their home country. b. Have a guest worker program that allows unauthorized immigrants to remain c. allow unauthorized immigrants to remain in the united states ...certain requirements d. allow unauthorized immigrants to remain in the united states ...without penalties
2. There is a proposal to allow people who were illegally brought into the U.S. as children to become permanent U.S. residents under some circumstances. Specifically, citizens of other countries who illegally entered the U.S. before age 16, who have lived in the U.S. 5 years or longer, and who graduated high school would be allowed to stay in the U.S. as permanent residents if they attend college or serve in the military. From what you have heard, do you favor, oppose, or neither favor nor oppose this proposal? (Favor; Neither favor nor oppose; Oppose) 3. Some states have passed a law that will require state and local police to determine the immigration status of a person if they find that there is a reasonable suspicion he or she is an undocumented immigrant. Those found to be in the U.S. without permission will have broken state law. From what you have heard, do you favor, oppose, or neither favor nor oppose these immigration laws? (Favor; Neither favor nor oppose; Oppose) 4. Do you think the number of immigrants from foreign countries who are permitted to come to the United States to live should be: (Increased a lot; Increased a little; Left the same as it is now; Decreased a little; Decreased a lot) 5. How likely is it that recent immigration levels will take jobs away from people already here? (Extremely; Very; Somewhat; Not at all) 6. Feeling thermometer rating for illegal immigrants Ethnocentrism (α = .69) We create an index by averaging responses to the following questions. Where would you rate [Whites/Blacks/Hispanic-Americans/Asian-Americans] in general on this scale? (1. Hardworking … 7. Lazy) Where would you rate [Whites/Blacks/Hispanic-Americans/Asian-Americans] in general on this scale? (1. Intelligent … 7. Unintelligent)
4
Racial Resentment (α = .80) We create an index by averaging responses to the following questions. Do you agree or disagree with the following statements? (Strongly agree; Agree somewhat; Neither agree nor disagree; Disagree somewhat; Strongly disagree) 1. Irish, Italians, Jewish and many other minorities overcame prejudice and worked their way up. Blacks should do the same without any special favors. 2. Generations of slavery and discrimination have created conditions that make it difficult for blacks to work their way out of the lower class. 3. Over the past few years, blacks have gotten less than they deserve. 4. It's really a matter of some people not trying hard enough; if blacks would only try harder they could be just as well off as whites. Party Identification Would you call yourself a strong Democrat or a not very strong Democrat? Would you call yourself a strong Republican or a not very strong Republican? Do you think of yourself as closer to the Democratic or the Republican Party? (Strong Democrat; Not very strong Democrat; Lean Democrat; Independent; Lean Republican; Not very strong Republican; Strong Republican) Expected Obama to Win Who do you think will be elected President in November? (Barack Obama; Mitt Romney; Don’t know) Ideology Where would you place YOURSELF on this scale, or haven't you thought much about this? (Extremely liberal; Liberal; Slightly liberal; Moderate; middle of the road; Slightly conservative; Conservative; Extremely conservative) Patriotism (α = .80) We create an index by averaging responses to the following questions. 1. When you see the American flag flying does it make you feel? (Extremely good; Very good;
Moderately good; Not good at all) 2. How do you feel about this country? Do you (hate it; dislike it; neither like nor dislike it; like it;
or love it)? 3. How important is being an American to you personally? (Extremely important; Very important;
Somewhat important; A little important; Not at all important) Political Knowledge (α = .63) We create an index by averaging responses to the following questions. 1. Do you happen to know which party had the most members in the House of Representatives in
Washington BEFORE the election [this/last] month? (Democrats; Republicans – correct) 2. Do you happen to know which party had the most members in the U.S. Senate BEFORE the
election [this/last] month? (Democrats – correct; Republicans) 3. Would you say that Barack Obama is Protestant, Catholic, Jewish, Muslim, Mormon, some other
religion, or is he not religious? 4. Would you say that Mitt Romney is Protestant, Catholic, Jewish, Muslim, Mormon, some other
religion, or is he not religious? 5. Would you say that one of the parties is more conservative than the other at the national level?
Which party is more conservative? (Democrats; Republicans)
5
Trust in Government (α = .63) We create an index by averaging responses to the following questions. 1. How often can you trust the federal government in Washington to do what is right? (Always;
Most of the time; About half the time; Some of the time; Never) OR How much of the time do you think you can trust the government in Washington to do what is right? (Just about always; Most of the time; Only some of the time)
2. Would you say the government is pretty much RUN BY A FEW BIG INTERESTS looking out for themselves or that it is run FOR THE BENEFIT OF ALL THE PEOPLE?
3. Do you think that people in government WASTE A LOT of the money we pay in taxes, WASTE SOME of it, or DON'T WASTE VERY MUCH of it?
4. How many of the people running the government are corrupt? (All; Most; About half; A few; None)
External Efficacy (α = .65) We create an index by averaging responses to the following questions. 1. Public officials don't care much what people like me think. Do you (Agree strongly; Agree
somewhat; Neither agree nor disagree; Disagree somewhat; Disagree strongly)? OR How much do public officials care what people like you think? (A great deal; A lot; A moderate amount; A little; Not at all)
2. People like me don't have any say about what the government does. Do you (Agree strongly; Agree somewhat; Neither agree nor disagree; Disagree somewhat; Disagree strongly)? OR How much can people like you affect what the government does? (A great deal; A lot; A moderate amount; A little; Not at all)
Voted in 2012 Which of the following statements best describes you: One, I did not vote (in the election this November); Two, I thought about voting this time, but didn't; Three, I usually vote, but didn't this time; or Four, I am sure I voted? (recoded into a dummy variable) Conservative Media (α = .86) We create an index by averaging responses to the following questions. 1. Which TV programs do you watch regularly? (Respondents could select any of the following:
America Live; America’s Newsroom; The Five; Fox Report; Hannity; Huckabee; O’Reilly Factor; Greta Van Susteren; Bret Baier)
2. Which radio programs do you listen to regularly? (Respondents could select any of the following: The Dave Ramsey Show; Glenn Beck Program; The Laura Ingraham Show; The Mark Levin Show; The Neal Boortz Show; The Rush Limbaugh Show; The Savage Nation (Michael Savage); The Sean Hannity Show)
3. Which web sites do you visit regularly? (Respondents could select any of the following: Drudge Report; Forbes (forbes.com); Fox News (foxnews.com))
Liberal Media (α = .86) We create an index by averaging responses to the following questions. 1. Which TV programs do you watch regularly? (Respondents could select any of the following:
Christ Matthews Show; Colbert Report; Daily Show with Jon Stewart; Key and Peele)
6
2. Which radio programs do you listen to regularly? (Respondents could select any of the following: All Things Considered (NPR); The Ed Schultz Show; Fresh Air (NPR); Morning Edition (NPR); The Power (Joe Madison); Talk of the Nation (NPR); The Thom Hartmann Program)
3. Which web sites do you visit regularly? (Respondents could select any of the following: Huffington Post; MSNBC; New York Times; Washington Post)
4. Which print newspapers do you read regularly? (Respondents could select any of the following: New York Times; Washington Post)
5. Which online papers do you read regularly? (Respondents could select any of the following: New York Times; Washington Post)
News Consumption (α = .43) We create an index by averaging responses to the following questions. 1. During a typical week, how many days do you watch, read, or listen to news on the Internet,
not including sports? (Respondents could select an integer from 0 to 7) 2. During a typical week, how many days do you watch national news on TV, not including
sports? (Respondents could select an integer from 0 to 7) 3. During a typical week, how many days do you read news in a printed newspaper, not
including sports? (Respondents could select an integer from 0 to 7) 4. During a typical week, how many days do you listen to news on the radio, not including
sports? (Respondents could select an integer from 0 to 7) Battleground State A dummy variable coded: 1 for respondents residing in Colorado, Florida, Iowa, Michigan, Minnesota, Nevada, New Hampshire, North Carolina, Ohio, Pennsylvania, Virginia, or Wisconsin; 0 otherwise State EPI State election performance index for 2012 reported by Pew Charitable Trusts (2014). Internet Survey Mode Coded 1 for Internet respondents and 0 for face-to-face respondents Hispanic Are you Spanish, Hispanic, or Latino? Non-Hispanic Black and Non-Hispanic Other Race Coded from demographic profile variables.
7
Table A-1. Comparing 2014 CCES Voter Fraud Beliefs to other Surveys with the Same Question
Survey Question (Source)
Quantity in Other Survey
Quantity in 2014 CCES
Voter fraud is a major problem (Washington Post 2012)
48% 43%
Votes are counted fairly very often (ANES 2012)
29% 25%
Election officials are fair very often (ANES 2012)
18% 22%
People voting more than once is very common (SPAE 2012)
11% 17%
Voter impersonation is very common (SPAE 2012)
11% 18%
Non-citizen voting is very common (SPAE 2012)
22% 25%
Strongly support photo ID law (SPAE 2012)
53% 56%
8
Table A-2. Beliefs about the Frequency of Voter Fraud
Age -0.01(0.03) -0.01(0.03) -0.01(0.04) -0.01(0.03) Female 0.14(0.07)* 0.14(0.07) 0.19(0.07)* 0.17(0.07)* Black 0.10(0.14) 0.10(0.14) 0.07(0.15) 0.14(0.15) Hispanic -0.08(0.15) -0.09(0.15) -0.10(0.15) -0.07(0.16) Asian -0.31(0.20) -0.31(0.20) -0.29(0.21) -0.28(0.22) Native-American 0.39(0.26) 0.38(0.26) 0.22(0.22) 0.15(0.23) Mixed -0.07(0.18) -0.07(0.18) -0.02(0.18) -0.05(0.19) Other -0.07(0.33) -0.08(0.33) 0.20(0.23) 0.16(0.22) Immigrant Citizen -0.04(0.16) -0.04(0.16) 0.03(0.17) 0.03(0.17) Immigrant Non-Citizen 0.12(0.18) 0.12(0.17) 0.16(0.20) 0.13(0.23) First Generation 0.24(0.10)* 0.24(0.10)* 0.26(0.11)* 0.24(0.11)* Second Generation 0.12(0.08) 0.12(0.08) 0.13(0.08) 0.14(0.08) Living in South 0.08(0.07) 0.08(0.07) 0.10(0.08) 0.11(0.08) _cons 2.48(0.09)*** 2.48(0.09)*** 2.41(0.09)*** 2.38(0.09)***
R2 0.41 0.41 0.43 0.45 adj. R2 0.40 0.40 0.42 0.43 N 858 855 757 757 Source: 2014 CCES. Note. Standard errors in parentheses. Coefficients obtained using OLS Regression with CCES survey weights. Interval and ordinal-level variables are standardized. Two-tailed: * p < 0.05, ** p < 0.01, *** p < 0.001.
10
Table A-4. Results from Full Model of Voter Fraud Perceptions Scale Components
More Than
Once Somone
Else Noncitizen
Voting coef. (s.e.) coef. (s.e.) coef. (s.e.) Immigrant Resentment 0.34(0.14)* 0.29(0.11)* 0.49(0.14)*** Undocumented Immigrant Warmth -0.08(0.14) -0.16(0.11) -0.24(0.12) Negative Latino Stereotype -0.04(0.10) -0.05(0.09) -0.02(0.10) Black Resentment 0.38(0.15)** 0.39(0.13)** 0.44(0.14)** Nationalism 0.01(0.13) -0.05(0.09) -0.06(0.12) Democrat -0.19(0.28) -0.38(0.26) -0.34(0.28) Indepedent -0.04(0.30) -0.11(0.29) -0.18(0.30) Political Knowledge -0.23(0.12)* -0.25(0.11)* -0.08(0.12) Conservative Media 0.72(0.14)*** 0.68(0.13)*** 0.77(0.14)*** Liberal Media -0.44(0.12)*** -0.32(0.12)** -0.44(0.12)*** Media Consumption 0.15(0.11) 0.07(0.11) 0.09(0.11) Education -0.23(0.10)* -0.27(0.10)** -0.31(0.10)** Age -0.03(0.10) -0.00(0.10) -0.04(0.11) Female 0.24(0.20) 0.43(0.19)* 0.48(0.20)* Black 0.11(0.36) 0.66(0.43) 0.49(0.45) Hispanic 0.09(0.45) 0.05(0.44) -0.53(0.39) Asian -1.01(0.56) -0.11(0.62) -0.47(0.72) Native-American 0.70(0.52) -0.03(1.20) 0.59(0.53) Mixed 0.02(0.72) 0.11(0.38) -0.32(0.61) Other -0.10(0.85) 0.72(0.70) 0.68(0.72) Immigrant Citizen 0.16(0.41) 0.05(0.53) 0.06(0.43) Immigrant Non-Citizen 0.49(1.34) 0.51(0.33) -0.13(0.36) First Generation 0.17(0.37) 0.88(0.37)* 0.62(0.34) Second Generation 0.20(0.23) 0.47(0.21)* 0.25(0.24) Living in South 0.41(0.20)* 0.09(0.20) 0.24(0.22) _cut1 -1.24(0.24)*** -1.42(0.25)*** -1.68(0.29)*** _cuts2 0.47(0.25) 0.33(0.24) -0.06(0.27) _cut3 2.48(0.28)*** 2.45(0.27)*** 1.96(0.28)*** Wald 2 209.51 *** 215.18 *** 219.28 *** Pseudo R2 0.16 0.16 0.15 N 757 756 754
Source: 2014 CCES. Note. Standard errors in parentheses. Coefficients obtained using ordinal logistic regression with CCES survey weights. Positive coefficients indicate higher likelihood of believing voter fraud is very common. Interval and ordinal-level variables are standardized. Two-tailed: * p < 0.05, ** p < 0.01, *** p < 0.001.
11
Table A-5. Results from Full Model of Voter Fraud Perceptions Scale
Components Without Black Resentment
More Than
Once Somone
Else Noncitizen
Voting coef. (s.e.) coef. (s.e.) coef. (s.e.) Immigrant Resentment 0.46(0.14)*** 0.41(0.11)*** 0.63(0.13)*** Undocumented Immigrant Warmth -0.14(0.14) -0.22(0.11)* -0.30(0.12)* Negative Latino Stereotype -0.04(0.11) -0.03(0.10) -0.01(0.11) Nationalism 0.09(0.12) 0.02(0.09) 0.01(0.12) Democrat -0.34(0.27) -0.53(0.26)* -0.54(0.26)* Indepedent -0.04(0.30) -0.12(0.30) -0.21(0.30) Political Knowledge -0.24(0.12)* -0.25(0.11)* -0.09(0.12) Conservative Media 0.77(0.14)*** 0.72(0.13)*** 0.81(0.14)*** Liberal Media -0.48(0.12)*** -0.36(0.11)** -0.48(0.11)*** Media Consumption 0.16(0.11) 0.07(0.11) 0.10(0.11) Education -0.24(0.10)* -0.29(0.10)** -0.33(0.10)** Age -0.05(0.10) -0.02(0.10) -0.06(0.10) Female 0.28(0.20) 0.49(0.20)* 0.54(0.20)** Black -0.07(0.33) 0.47(0.43) 0.29(0.44) Hispanic -0.01(0.41) -0.04(0.41) -0.65(0.37) Asian -1.01(0.54) -0.16(0.60) -0.55(0.63) Native-American 0.87(0.50) 0.17(1.15) 0.77(0.52) Mixed 0.04(0.68) 0.20(0.32) -0.23(0.58) Other 0.01(0.83) 0.81(0.75) 0.77(0.78) Immigrant Citizen 0.14(0.40) 0.07(0.52) 0.07(0.42) Immigrant Non-Citizen 0.56(1.18) 0.58(0.30) -0.06(0.34) First Generation 0.20(0.34) 0.91(0.36)* 0.67(0.31)* Second Generation 0.20(0.24) 0.44(0.21)* 0.22(0.24) Living in South 0.39(0.21) 0.08(0.20) 0.22(0.22) _cut1 -1.28(0.24)*** -1.44(0.25)*** -1.73(0.29)*** _cut2 0.41(0.25) 0.28(0.25) -0.14(0.28) _cut3 2.41(0.29)*** 2.38(0.28)*** 1.85(0.28)*** Wald 2 219.11 *** 208.98 *** 294.04 *** Pseudo R2 0.16 0.15 0.20 N 757 756 754 Source: 2014 CCES. Note. Standard errors in parentheses. Coefficients obtained using ordinal logistic regression with CCES survey weights. Positive coefficients indicate higher likelihood of believing voter fraud is very common. Interval and ordinal-level variables are standardized. Two-tailed: * p < 0.05, ** p < 0.01, *** p < 0.001.
12
Table A-6. Results from Models of Voter Fraud Perceptions with Predictors Rescaled from Zero to One
Model 1 Model 2 Model 3 Model 4 coef. (s.e.) coef. (s.e.) coef. (s.e.) coef. (s.e.) Immigrant Resentment 1.27(0.18)*** 1.27(0.19)*** 0.97(0.20)*** 0.69(0.20)*** Negative Latino Stereotype -0.01(0.04) -0.01(0.04) -0.01(0.04) Undocumented Imm. Warmth -0.28(0.14)* -0.20(0.14) Black Resentment 0.57(0.17)*** Nationalism 0.06(0.15) 0.06(0.15) 0.08(0.16) -0.04(0.16) Democrat -0.26(0.09)** -0.26(0.09)** -0.23(0.10)* -0.15(0.10) Indepedent -0.03(0.10) -0.03(0.10) -0.06(0.11) -0.05(0.11) Political Knowledge -0.20(0.10)* -0.20(0.10)* -0.19(0.10) -0.18(0.10) Conservative Media 1.12(0.16)*** 1.12(0.16)*** 1.23(0.17)*** 1.14(0.18)*** Liberal Media -0.72(0.16)*** -0.72(0.17)*** -0.76(0.18)*** -0.67(0.18)*** Media Consumption 0.10(0.14) 0.10(0.14) 0.17(0.15) 0.15(0.15) Education -0.33(0.12)** -0.33(0.12)** -0.38(0.12)** -0.36(0.12)** Age -0.04(0.14) -0.04(0.14) -0.07(0.15) -0.05(0.15) Female 0.14(0.07)* 0.14(0.07) 0.19(0.07)* 0.17(0.07)* Black 0.10(0.14) 0.10(0.14) 0.07(0.15) 0.14(0.15) Hispanic -0.08(0.15) -0.09(0.15) -0.10(0.15) -0.07(0.16) Asian -0.31(0.20) -0.31(0.20) -0.29(0.21) -0.28(0.22) Native-American 0.39(0.26) 0.39(0.26) 0.22(0.22) 0.15(0.22) Mixed -0.07(0.18) -0.07(0.18) -0.02(0.18) -0.05(0.19) Other -0.07(0.33) -0.07(0.34) 0.20(0.23) 0.16(0.22) Immigrant Citizen -0.04(0.16) -0.04(0.16) 0.03(0.17) 0.03(0.17) Immigrant Non-Citizen 0.12(0.17) 0.12(0.17) 0.16(0.20) 0.13(0.23) First Generation 0.24(0.10)* 0.24(0.10)* 0.25(0.11)* 0.24(0.11)* Second Generation 0.12(0.08) 0.12(0.08) 0.13(0.08) 0.14(0.08) Living in South 0.08(0.07) 0.08(0.07) 0.10(0.08) 0.11(0.08) _cons 1.94(0.20)*** 1.94(0.20)*** 2.10(0.21)*** 1.88(0.22)*** R2 0.41 0.41 0.43 0.45 adj. R2 0.40 0.40 0.42 0.43 N 858 855 757 757 Source: 2014 CCES. Note. Standard errors in parentheses. All indicators rescaled 0 to 1. Coefficients obtained using OLS Regression. Two-tailed: * p < 0.05, ** p < 0.01, *** p < 0.001
13
Table A-7. Results from Model 4 of Voter Fraud Perceptions with Liberal/Conservative Media Variables Removed
Source: 2014 CCES. Two-tailed: * p < 0.05, ** p < 0.01, *** p < 0.001
15
Table A-9. Results from Model of Voter Fraud Beliefs Including Interaction
Between Party Identification and Black Resentment coef. (s.e.) Immigrant Resentment 0.93(0.20)*** Black Resentment 0.84(0.26)** Democrat 0.03(0.23) Independent 0.16(0.31) Democrat X Black resentment -0.27(0.30) Independent X Black resentment -0.24(0.37) Conservative Media 1.02(0.16)*** Liberal Media -0.57(0.17)*** Media Consumption 0.07(0.15) Political Knowledge -0.20(0.10)* Education -0.30(0.11)** Age -0.00(0.14) Female 0.12(0.07) Nationalism -0.08(0.16) Immigrant Citizen -0.04(0.16) Immigrant Non-Citizen 0.10(0.21) First Generation 0.23(0.11)* Second Generation 0.14(0.07) Black 0.19(0.14) Hispanic -0.05(0.15) Asian -0.27(0.22) Native-American 0.28(0.26) Mixed -0.11(0.19) Other -0.11(0.31) Living in South 0.09(0.07) _cons 1.58(0.26)*** R2 0.43 adj. R2 0.42 N 858 Source: 2014 CCES. Note: Standard errors in parentheses. Estimated effects expressed as OLS regression coefficients. Larger and positive coefficients indicate a belief that voter fraud occurs very frequently. Two-tailed: + p < 0.10, * p < 0.05, ** p < 0.01, *** p < 0.001
16
Table A-10. Results from Model of Voter Fraud Beliefs Including Interaction Between Race and Black Resentment
coef. (s.e.) Immigrant Resentment 0.88(0.20)*** Black Resentment 0.78(0.16)*** Black 0.24(0.23) Hispanic 0.45(0.33) Asian 0.19(0.34) Native-American -0.49(1.38) Mixed 0.44(0.25) Other -1.20(0.93) Black X Black Resentment -0.08(0.55) Hispanic X Black Resentment -0.87(0.50) Asian X Black Resentment -0.87(0.72) Native American X Black Resentment 0.83(1.46) Mixed X Black Resentment -0.84(0.49) Other X Black Resentment 1.38(0.99) Democrat -0.16(0.09) Independent -0.01(0.10) Conservative Media 1.00(0.16)*** Liberal Media -0.51(0.16)** Media Consumption 0.09(0.14) Political Knowledge -0.19(0.09)* Education -0.30(0.11)** Age -0.02(0.14) Female 0.12(0.07) Nationalism -0.09(0.16) Immigrant Citizen -0.03(0.16) Immigrant Non-Citizen 0.12(0.21) First Generation 0.19(0.10) Second Generation 0.15(0.07)* Living in South 0.09(0.07) _cons 1.64(0.21)*** R2 0.44 adj. R2 0.42 N 858 Source: 2014 CCES. Note: Standard errors in parentheses. Estimated effects expressed as OLS regression coefficients. Larger and positive coefficients indicate a belief that voter fraud occurs very frequently. Two-tailed: * p < .05; ** p < .01; *** p < .001.
17
Table A-11. Results from Models of Voter Fraud Beliefs Using Immigrant Group Thermometer Ratings as Predictors in 2014 CCES
Model 1 Model 2 Model 3 Model 4 coef. (s.e.) coef. (s.e.) coef. (s.e.) coef. (s.e.) Irish immigrant warmth 0.03(0.04) African immigrant warmth -0.08(0.07) Chinese immigrant warmth -0.06(0.06) Mexican immigrant warmth -0.12(0.05)* Black Resentment 0.31(0.05)*** 0.17(0.08)* 0.23(0.07)** 0.32(0.07)***
Liberal Media -0.15(0.05)** -0.04(0.07) -0.28(0.06)*** -0.10(0.08) Media Consumption 0.00(0.04) -0.09(0.07) 0.11(0.05)* 0.01(0.07) Education -0.08(0.03)* -0.11(0.07) -0.07(0.04) -0.09(0.06) Age 0.03(0.04) 0.03(0.07) -0.06(0.05) 0.10(0.05) Female 0.08(0.07) -0.09(0.13) 0.24(0.11)* 0.09(0.11) Black 0.27(0.15) -0.20(0.26) 0.21(0.19) 0.28(0.24) Hispanic -0.03(0.19) -0.06(0.30) -0.30(0.25) -0.14(0.29) Asian -0.32(0.26) -0.08(0.37) -0.54(0.33) -0.28(0.43) Native-American 0.29(0.25) -0.07(0.36) 0.20(0.22) 0.21(0.30) Mixed -0.19(0.19) -0.59(0.39) -0.48(0.39) 0.16(0.25) Other -0.37(0.37) -0.15(0.32) 0.34(0.30) 0.48(0.28) Immigrant Citizen 0.03(0.18) 0.07(0.25) 0.09(0.29) 0.47(0.23)* Immigrant Non-Citizen 0.12(0.22) -0.76(0.27)** 0.26(0.33) 0.57(0.26)* First Generation 0.15(0.12) 0.17(0.18) 0.26(0.16) 0.21(0.17) Second Generation 0.12(0.08) 0.20(0.18) 0.27(0.12)* 0.26(0.12)* Living in South 0.16(0.07)* 0.33(0.13)* 0.02(0.12) 0.14(0.12) _cons 2.46(0.09)*** 2.59(0.15)*** 2.37(0.13)*** 2.31(0.15)***
R2 0.41 0.37 0.50 0.52 adj. R2 0.40 0.31 0.45 0.48 N 789 253 269 271 Source: 2014 CCES. Note. Standard errors in parentheses. Coefficients obtained using OLS Regression with CCES survey weights. Interval and ordinal-level variables are standardized. Larger numbers on thermometer questions are coded to indicate warmer feelings. Two-tailed: * p < 0.05, ** p < 0.01, *** p < 0.001.
18
Table A-12. Results from Models of Voter Fraud Beliefs Using Immigrant Group Thermometer Ratings as Predictors in 2014 CCES, Excluding Black Resentment
Model 1 Model 1 Model 1 Model 1 coef. (s.e.) coef. (s.e.) coef. (s.e.) coef. (s.e.) Irish immigrant warmth 0.03(0.04) African immigrant warmth -0.09(0.08) Chinese immigrant warmth -0.09(0.06) Mexican immigrant warmth -0.18(0.05)** Nationalism 0.07(0.04) -0.06(0.07) 0.03(0.06) 0.21(0.06)*** Democrat -0.41(0.10)*** -0.41(0.17)* -0.37(0.17)* -0.33(0.15)* Indepedent -0.09(0.12) 0.03(0.21) -0.13(0.19) -0.12(0.17) Political Knowledge -0.17(0.05)*** -0.12(0.08) -0.03(0.07) -0.16(0.07)* Conservative Media 0.39(0.05)*** 0.39(0.07)*** 0.42(0.09)*** 0.33(0.07)*** Liberal Media -0.22(0.04)*** -0.08(0.07) -0.35(0.06)*** -0.14(0.08) Media Consumption -0.00(0.04) -0.09(0.07) 0.09(0.06) 0.07(0.07) Education -0.09(0.04)* -0.12(0.07) -0.10(0.05)* -0.11(0.06) Age 0.04(0.04) 0.03(0.07) -0.08(0.05) 0.11(0.06) Female 0.12(0.07) -0.06(0.14) 0.28(0.11)* 0.14(0.12) Black 0.11(0.15) -0.29(0.24) 0.13(0.18) 0.11(0.23) Hispanic -0.10(0.17) -0.19(0.28) -0.31(0.26) -0.02(0.28) Asian -0.29(0.24) -0.09(0.36) -0.65(0.31)* -0.18(0.35) Native-American 0.46(0.26) 0.06(0.31) 0.43(0.22) 0.23(0.26) Mixed -0.19(0.19) -0.76(0.30)* -0.52(0.34) 0.32(0.21) Other -0.30(0.42) -0.04(0.30) 0.42(0.33) 0.46(0.27) Immigrant Citizen 0.00(0.19) 0.08(0.25) 0.13(0.29) 0.44(0.22)* Immigrant Non-Citizen 0.18(0.19) -0.76(0.26)** 0.39(0.39) 0.66(0.24)** First Generation 0.12(0.11) 0.14(0.17) 0.30(0.16) 0.20(0.18) Second Generation 0.10(0.09) 0.16(0.19) 0.29(0.12)* 0.28(0.14)* Living in South 0.13(0.08) 0.32(0.13)* 0.04(0.13) 0.09(0.12) _cons 2.56(0.09)*** 2.65(0.15)*** 2.35(0.14)*** 2.44(0.16)*** R2 0.36 0.36 0.47 0.47 adj. R2 0.34 0.29 0.42 0.42 N 789 253 269 271 Source: 2014 CCES. Note. Standard errors in parentheses. Coefficients obtained using OLS Regression with CCES survey weights. Interval and ordinal-level variables are standardized. Larger numbers on thermometer questions are coded to indicate warmer feelings. Two-tailed: * p < 0.05, ** p < 0.01, *** p < 0.001.
19
Table A-13. Predictors of Public Election Integrity Ratings in the United States, 2012
Source: 2012 ANES. Note: Cell entries are ordinal logit coefficients. The dependent variable is coded so that higher values indicate more pessimistic beliefs. Independent variables are scaled from 0 to 1. Two-tailed: * p < .05; ** p < .01; *** p < .001.
20
Table A-14. Predictors of Public Election Integrity Ratings in the United States, 2012 Racial Resentment Removed
Source: 2012 ANES. Note: Cell entries are ordinal logit coefficients. The dependent variable is coded so that higher values indicate more pessimistic beliefs. Independent variables are scaled from 0 to 1. Two-tailed: * p < .05; ** p < .01; *** p < .001.