Immigrants in Anne Arundel County, MD All analysis in this fact sheet is based on source data from the U.S. Census Bureau American Community Survey, 2011-2015 distributed through IPUMS-USA, University of Minnesota, www.ipums.org. *Please note that the terms “immigrant” and “foreign born” are used interchangeably throughout this fact sheet. Foreign born refers to individuals who are not a U.S. cizen at birth or who were born outside the U.S., Puerto Rico or other U.S .territories and whose parents are not U.S. cizens. The foreign born may include naturalized U.S. cizens, Legal Permanent Residents, temporary residents, refugees and asylees, and others. Addionally, nave born includes those who are U.S. cizens at birth, those born in the United States, Puerto Rico, or other U.S. territories, and those born abroad to a parent who is a U.S. cizen. Country of Birth Figure 2 depicts the top five countries of birth among foreign-born household heads living in Anne Arundel County, MD, and in the state of Maryland. Foreign-born household heads living in Anne Arundel County, MD come from a variety of countries. Compared to all foreign-born household heads in Maryland, there are larger shares of immigrant household heads from Korea, Philippines, and Mexico living in Anne Arundel County MD. Distribuon of Immigrants in the state of Maryland and in Anne Arundel County, MD Figure 1 shows where immigrants live within Anne Arundel County, MD. There are higher proporons of immigrants living in the northwestern region of Anne Arundel County, MD and in and around the city of Annapolis. Immigrants make up smaller shares of the populaon in central and southern Anne Arundel County, MD. 2015 NUMBERS AT A GLANCE 41,757,110: Approximate number of immigrants* living in the U.S. (13% of the populaon) 856,500: Approximate number of immigrants living in Maryland (14% of the state’s populaon) 44,500: Approximate number of immigrants living in Anne Arundel County, MD (8% of the populaon) 9th: Rank of the state of Maryland among the 50 states and Washington, D.C. in terms of immigrants as a percentage of the state’s populaon Figure 1. Immigrants in Maryland Foreign Born as a Percentage of the Populaon Figure 2. Top Five Countries of Birth Among Immigrant Household Heads Anne Arundel County, MD Maryland Country of Origin Percent Country of Origin Percent El Salvador 10% El Salvador 10% Korea 6% India 7% India 5% China 5% Philippines 5% Korea 4% Mexico 5% Nigeria 4% All Other Countries (n=97) 69% All Other Countries (n=149) 70% Esmated Immigrant Household Head Populaon 17,509 Esmated Immigrant Household Head Populaon 335,051
Transcript
Immigrants in Anne Arundel County, MD
All analysis in this fact sheet is based on source data from the U.S. Census Bureau American Community Survey, 2011-2015 distributed through IPUMS-USA, University of Minnesota, www.ipums.org. *Please note that the terms “immigrant” and “foreign born” are used interchangeably throughout this fact sheet. Foreign born refers to individuals who are not a U.S. citizen at birth or who were born outside the U.S., Puerto Rico or other U.S .territories and whose parents are not U.S. citizens. The foreign born may include naturalized U.S. citizens, Legal Permanent Residents, temporary residents, refugees and asylees, and others. Additionally, native born includes those who are U.S. citizens at birth, those born in the United States, Puerto Rico, or other U.S. territories, and those born abroad to a parent who is a U.S. citizen.
Country of Birth
Figure 2 depicts the top five countries of
birth among foreign-born household
heads living in Anne Arundel County,
MD, and in the state of Maryland.
Foreign-born household heads living in
Anne Arundel County, MD come from a
variety of countries. Compared to all
foreign-born household heads in
Maryland, there are larger shares of
immigrant household heads from Korea,
Philippines, and Mexico living in Anne
Arundel County MD.
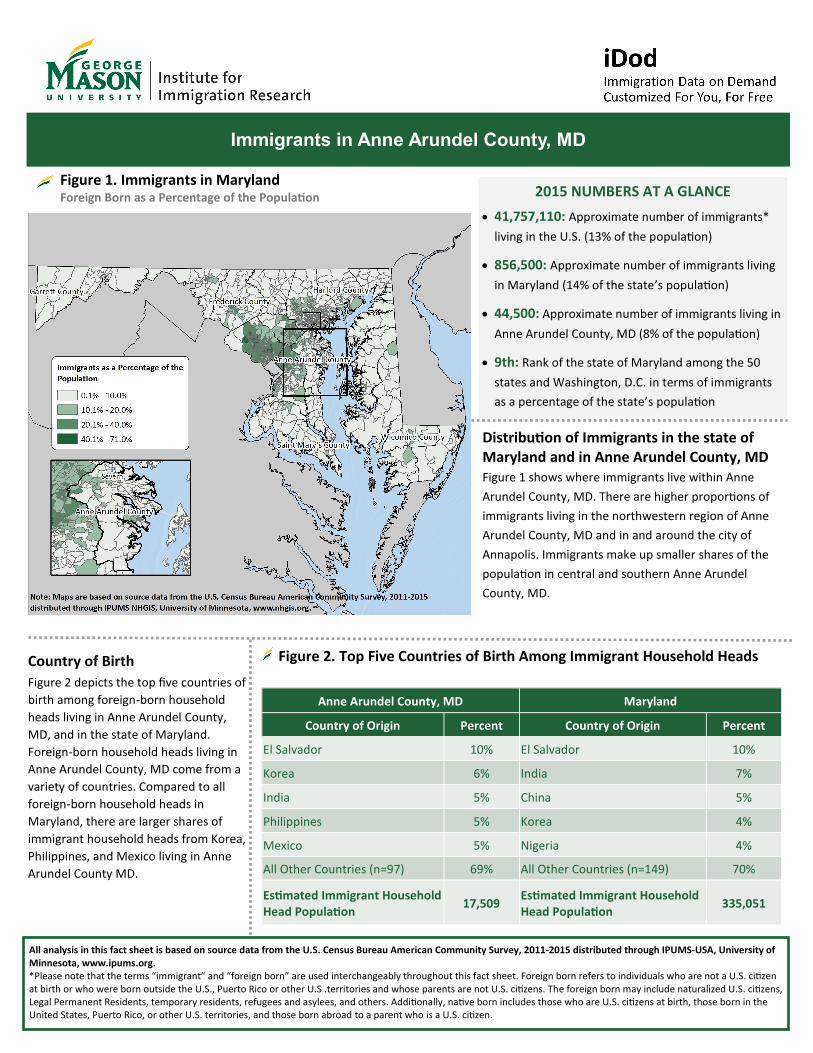
Distribution of Immigrants in the state of Maryland and in Anne Arundel County, MD Figure 1 shows where immigrants live within Anne
Arundel County, MD. There are higher proportions of
immigrants living in the northwestern region of Anne
Arundel County, MD and in and around the city of
Annapolis. Immigrants make up smaller shares of the
population in central and southern Anne Arundel
County, MD.
2015 NUMBERS AT A GLANCE
41,757,110: Approximate number of immigrants*
living in the U.S. (13% of the population)
856,500: Approximate number of immigrants living
in Maryland (14% of the state’s population)
44,500: Approximate number of immigrants living in
Anne Arundel County, MD (8% of the population)
9th: Rank of the state of Maryland among the 50
states and Washington, D.C. in terms of immigrants
as a percentage of the state’s population
Figure 1. Immigrants in Maryland Foreign Born as a Percentage of the Population
Figure 2. Top Five Countries of Birth Among Immigrant Household Heads
Anne Arundel County, MD Maryland
Country of Origin Percent Country of Origin Percent
El Salvador 10% El Salvador 10%
Korea 6% India 7%
India 5% China 5%
Philippines 5% Korea 4%
Mexico 5% Nigeria 4%
All Other Countries (n=97) 69% All Other Countries (n=149) 70%
Estimated Immigrant Household Head Population
17,509 Estimated Immigrant Household Head Population
335,051
Immigrants in Anne Arundel County, MD
Figure 3. Top Five Languages Spoken at Home Among Immigrants Immigrants Household Heads
Languages Spoken at Home
Figure 3 depicts the top five languages spoken at
home among immigrant household heads living in
Anne Arundel County, MD and in the state of
Maryland. Across the two geographic areas, the
most common languages spoken at home includes
Spanish and English. Compared to all foreign-born
household heads in Maryland, there are greater
percentages of immigrants living in Anne Arundel
County, MD who speak Filipino, Tagalog; or Korean
at home.
Educational Attainment
Figure 5 shows the educational attainment among
immigrant household heads living in Anne
Arundel County, MD and in Maryland. Overall,
foreign-born household heads living in
Anne Arundel County, MD are more likely to have
at least some college or an associate’s degree or a
bachelor’s degree compared to immigrant
household heads living in Maryland. However,
immigrant household heads living in Anne
Arundel County are less likely to have a graduate,
professional, or doctoral degree.
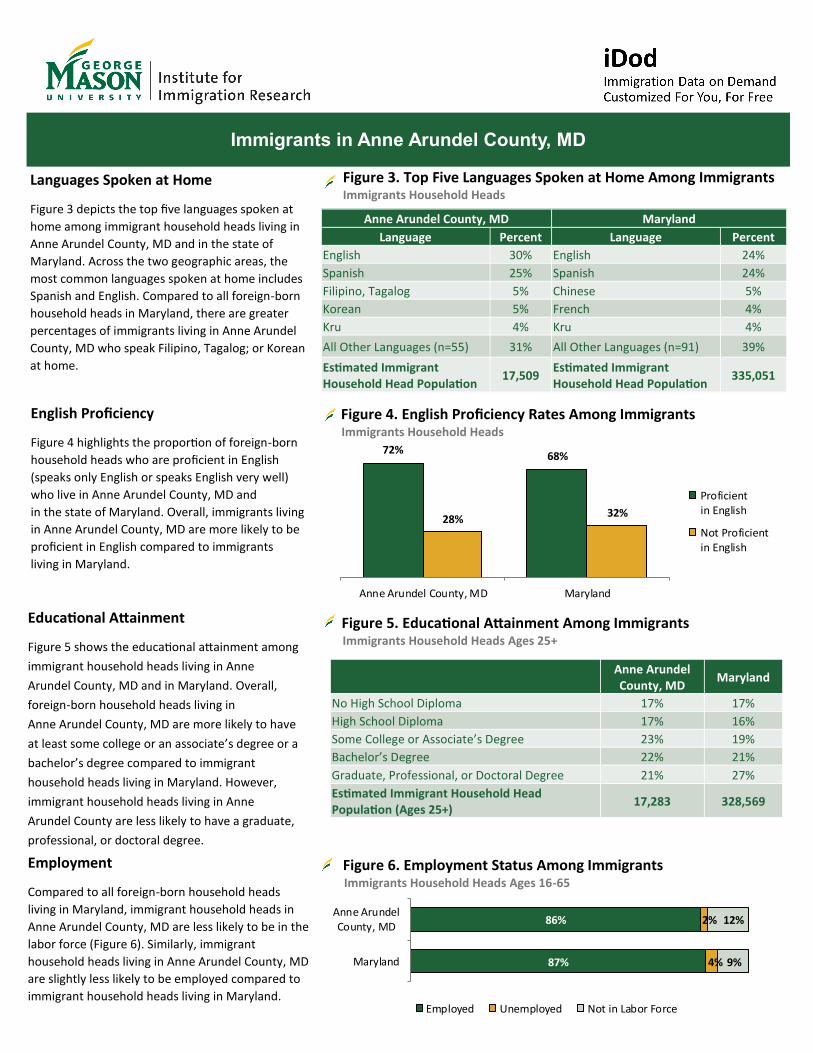
English Proficiency
Figure 4 highlights the proportion of foreign-born
household heads who are proficient in English
(speaks only English or speaks English very well)
who live in Anne Arundel County, MD and
in the state of Maryland. Overall, immigrants living
in Anne Arundel County, MD are more likely to be
proficient in English compared to immigrants
living in Maryland.
Anne Arundel County, MD Maryland
Language Percent Language Percent
English 30% English 24%
Spanish 25% Spanish 24%
Filipino, Tagalog 5% Chinese 5%
Korean 5% French 4%
Kru 4% Kru 4%
All Other Languages (n=55) 31% All Other Languages (n=91) 39%
Estimated Immigrant Household Head Population
17,509 Estimated Immigrant Household Head Population
335,051
Figure 4. English Proficiency Rates Among Immigrants Immigrants Household Heads
72%68%
28%32%
Anne Arundel County, MD Maryland
Proficientin English
Not Proficientin English
Employment
Compared to all foreign-born household heads
living in Maryland, immigrant household heads in
Anne Arundel County, MD are less likely to be in the
labor force (Figure 6). Similarly, immigrant
household heads living in Anne Arundel County, MD
are slightly less likely to be employed compared to
immigrant household heads living in Maryland.
Anne Arundel County, MD
Maryland
No High School Diploma 17% 17%
High School Diploma 17% 16%
Some College or Associate’s Degree 23% 19%
Bachelor’s Degree 22% 21%
Graduate, Professional, or Doctoral Degree 21% 27%
Estimated Immigrant Household Head Population (Ages 25+)
Figure 6. Employment Status Among Immigrants Immigrants Household Heads Ages 16-65
Immigrants in Anne Arundel County, MD
ABOUT THE INSTITUTE FOR IMMIGRATION RESEARCH
The IIR works to refocus the immigration conversation among academics, policy-makers and the public, including the business community and
media, by producing and disseminating unbiased and objective, interdisciplinary academic research related to immigrants and immigration to
the United States. The Institute for Immigration Research is a joint venture between George Mason University and the Immigrant Learning
Center, Inc. (ILC) of Massachusetts. To learn more about the Institute for Immigration Research call (703) 993-5833, email [email protected], or
visit us online at iir.gmu.edu.
IMMIGRATION DATA ON DEMAND (iDod)
The iDod service is offered free of charge to help individuals and institutions examine the immigrant populations of
their particular geography. Recipients of this data will see how immigrants provide vital contributions to the economy
and society of the U.S. Ultimately, the goal of the iDod project is to create collaborations and connect people with
data of interest on immigrant populations from their particular geographic region or economic sector.
iDod Immigration
Data on Demand
Occupation and Industry
Figure 7 highlights the top five occupational and industry groups among immigrant household heads living in Anne Arundel County, MD and in the state of Maryland. While employment patterns among immigrant household heads living in Anne Arundel County, MD are similar to employment patterns of immigrant household heads within Maryland, Anne Arundel County, MD has higher shares of immigrant household heads employed in service oriented occupations and industries, such as sales; food preparation and serving; and retail trade.
Figure 7. Top 5 Occupational and Industry Groups Among Immigrants Immigrant Household Heads Ages 16+