I:\MSC\72\16.doc For reasons of economy, this document is printed in a limited number. Delegates are kindly asked to bring their copies to meetings and not to request additional copies. INTERNATIONAL MARITIME ORGANIZATION IMO E MARITIME SAFETY COMMITTEE 72nd session Agenda item 16 MSC 72/16 14 February 2000 Original: ENGLISH FORMAL SAFETY ASSESSMENT Decision parameters including risk acceptance criteria Submitted by Norway SUMMARY Executive summary: This document is submitted in response to the invitation of MSC 71 to Member Governments and interested organisations to provide information on risk acceptance criteria to MSC 72, for possible incorporation in the FSA Interim Guidelines. In annex 1 of this document, the various decision parameters and their associated acceptance criteria that may be useful when making decisions based on Formal Safety Assessment, are reviewed, and preliminary recommendations are given. Annexes 2 and 3 provide supplementary guidance on related subjects which may also be taken into account when revising the Interim FSA Guidelines. Action to be taken: Paragraph 8 Related documents: MSC/Circ.829; MSC 71/23, paragraph 14.12. 1 During MSC 71 the Working Group on FSA (FSA WG) discussed various topics, including the need for improvements and supplementary text in the Interim FSA Guidelines (MSC/Circ.829). According to paragraph 14.12 of MSC 71/23, the FSA WG, inter alia, agreed the need for developing clear definitions of “risk acceptance criteria”. Furthermore, according to the same paragraph: “The Committee therefore invited Member Governments and interested organisations to provide useful information on the matter for discussion at MSC 72.” The present document is submitted in response to this request. 2 The subject “risk acceptance criteria” in relation to maritime safety and pollution prevention is a topic where little authoritative literature exists. In view of this, the task to develop an initial draft document on “risk acceptance criteria” was given to a small group of specialists on risk analysis and FSA. The initial draft was then given to a team consisting of personnel from NMD, Labour unions, Norwegian Shipowners’ Association, UMOE Scat-Harding and DNV for comments, and the document was later revised in light of the comments received (see annex 1). In this process it was attempted to simplify the subject as much as possible, but without eliminating complex topics (including some formulas) if and when these topics were considered vital to understanding the reasoning behind the proposals.
Transcript
I:\MSC\72\16.docFor reasons of economy, this document is printed in a limited number. Delegates arekindly asked to bring their copies to meetings and not to request additional copies.
Decision parameters including risk acceptance criteria
Submitted by Norway
SUMMARY
Executive summary: This document is submitted in response to the invitation of MSC 71 toMember Governments and interested organisations to provideinformation on risk acceptance criteria to MSC 72, for possibleincorporation in the FSA Interim Guidelines. In annex 1 of thisdocument, the various decision parameters and their associatedacceptance criteria that may be useful when making decisions basedon Formal Safety Assessment, are reviewed, and preliminaryrecommendations are given. Annexes 2 and 3 provide supplementaryguidance on related subjects which may also be taken into accountwhen revising the Interim FSA Guidelines.
Action to be taken: Paragraph 8
Related documents: MSC/Circ.829; MSC 71/23, paragraph 14.12.
1 During MSC 71 the Working Group on FSA (FSA WG) discussed various topics,including the need for improvements and supplementary text in the Interim FSA Guidelines(MSC/Circ.829). According to paragraph 14.12 of MSC 71/23, the FSA WG, inter alia, agreedthe need for developing clear definitions of “risk acceptance criteria”. Furthermore, according tothe same paragraph: “The Committee therefore invited Member Governments and interestedorganisations to provide useful information on the matter for discussion at MSC 72.” Thepresent document is submitted in response to this request.
2 The subject “risk acceptance criteria” in relation to maritime safety and pollutionprevention is a topic where little authoritative literature exists. In view of this, the task to developan initial draft document on “risk acceptance criteria” was given to a small group of specialistson risk analysis and FSA. The initial draft was then given to a team consisting of personnel fromNMD, Labour unions, Norwegian Shipowners’ Association, UMOE Scat-Harding and DNV forcomments, and the document was later revised in light of the comments received (see annex 1).In this process it was attempted to simplify the subject as much as possible, but withouteliminating complex topics (including some formulas) if and when these topics were consideredvital to understanding the reasoning behind the proposals.
MSC 72/16 - -
I:\MSC\72\16.doc
2
3 The group of specialists developing the initial draft document concluded that a vastamount of research literature and other basic information exist on various topics related to, orrelevant for, maritime risk acceptance criteria. Based on a study of this material, it was evidentthat many different alternatives can be chosen as potential “risk acceptance criteria” for themaritime community. However, in our view it would be desirable for IMO to standardisedecision parameters including risk acceptance criteria as far as possible. By reaching agreementon which risk acceptance criteria to use, flag States and NGOs intending to submit an FSA studyto IMO, will know the format of the information needed. Furthermore, this will facilitatecomparison between alternative proposals, and comparison with earlier decisions.Standardisation of risk acceptance criteria would also strengthen the motivation behindintroducing FSA into the work of IMO, i.e. further contribute to a decision making process inIMO which is transparent, consistent, systematic and scientific.
4 In the longer term, the development of agreed risk acceptance criteria might alsocontribute to more consistent and predictable acceptance of equivalency, as safety equivalencymay be proven according to known and accepted safety standards.
5 The decision parameters and risk acceptance criteria included in annex 1, are those whichwere found most useful, based on initial considerations. However, we have not yet reached firmconclusions on this subject, and therefore welcome a debate in MSC (i.e. the FSA WG) prior tomaking a decision on which parameters and acceptance criteria to include in the revised FSAGuidelines. We also consider that even after reaching a decision to include certainparameters/criteria in the FSA Guidelines, this decision should be reconsidered in the futurebased on the experience to be gained.
6 Proposals on decision parameters including acceptance criteria on environmentalprotection are not included in annex 1. In our view; a similar debate on environmental issuesshould be invited at MEPC. The relation between FSA and “the precautionary approach” shouldalso be clarified, as it is considered that the precautionary approach would require a riskinterpretation in order to be useful for the practical work of the organisation.
7 When developing annex 1 on “Decision Parameters including Risk Acceptance Criteria”,other related aspects of the FSA process were also discussed. Since experience has shown thatsupplementary guidance may be desirable on various aspects of the Interim Guidelines on FSA,we decided to also develop text on some of these additional aspects, for possible consideration bythe FSA WG:
.1 Annex 2: “Use of Cost Benefit Analysis (CBA) as Screening and Prioritisation -Loss Matrix”. This annex gives guidance related to paragraph 3.1.3 of the InterimFSA Guidelines.
.2 Annex 3: “Initial Ranking of Accident Scenarios”. This annex gives guidancerelated to paragraph 4.3.1 of the Interim FSA Guidelines.
Taking into account that IMO is expected to develop a redraft of the FSA Guidelines in the yearsto come, we also expect annexes 2 and 3 to be useful as input documents to this process.
- - MSC 72/16
I:\MSC\72\16.doc
3
Action requested of the Committee
8 The Committee is invited to consider this document with annexes as an input to thediscussions at MSC 72 on further improvements of the Interim Guidelines on FSA. We hope thatour document will contribute positively to this process.
***
MSC 72/16
I:\MSC\72\16.doc
ANNEX 1
DECISION PARAMETERS INCLUDING RISK ACCEPTANCECRITERIA FOR SAFETY
BACKGROUND
Formal Safety Assessment (FSA) is a structured and systematic methodology, aimed atenhancing maritime safety, including protection of life, health, the marine environment andproperty, by using risk and cost/benefit assessments (MSC/Circ.829; MEPC/Circ.335).
FSA is consistent with the current IMO decision-making process and provides a basis for makingdecisions in accordance with resolutions A.500(XII) "Objectives of the Organisation in the1980's", and A.777(18) "Work Methods and Organisation of Work in Committees and theirSubsidiary Bodies" (MSC/Circ.829)
FSA comprises the following steps (MSC/Circ.829):
1. identification of hazards;2. risk assessment;3. risk control options;4. cost benefit assessment; and5. recommendations for decision-making.
The decision parameters including risk acceptance criteria are required in steps 4 and 5, when theFSA team present the result of cost benefit assessment and when the recommendations areformulated, (MSC/Circ.829, paragraphs 7.3.1 and 8.2.1). In principle, different decisionparameters may be used, and will be used unless some standardisation effort is undertaken. Theadvantage of standardisation is that the FSA team knows what to document, the committeeknows what to ask for, information are collected from many analyses in the same format,previous decisions may be compared to current and future decisions, etc.
The risk acceptance criteria are normative statements, as opposed to a statement about risk,which ideally should be objective statements of probabilities and consequences. Applications ofFSA will disclose such value judgements. If acceptance criteria are not made explicit, the FSAmay be used to disclose the value judgement. Risk acceptance criteria should be developed priorto extensive use of FSA to avoid that such value judgements are made on an ad hoc basis. In thisannex generic risk results for the common ship types are shown together with the acceptancecriteria to indicate the effect of selecting the suggested criteria at the earliest possible stage.
DECISION PARAMETERS
To make a well-informed decision about the possible implementation of a new regulation, a newrisk control option, or possible deletion of an obsolete regulation, many different decisionparameters may be necessary. Reviewing the FSA Guidelines, (MSC/Circ.829), the followingdecision parameters may be identified, or are suggested:
1. Individual risk for a crew member (Individual risk is risk of death, injury and illhealth).
MSC 72/16ANNEX 1Page 2
I:\MSC\72\16.doc
2. Individual risk for a passenger (if relevant).3. Individual risk to third parties (as appropriate).4. Societal risk in terms of FN1 diagrams for crew members.5. Societal risk in terms of FN diagrams for passenger (if relevant).6. Societal risk in terms of FN diagrams for third parties (as appropriate).7. Costs of each risk control options should be presented together with the effect
on 1-6.8. The Implied Costs of Averting a statistical Fatality (ICAF) should be presented.9. The cost of reducing risk of injuries and ill health, should be presented (see
discussion below).10. In cases where the risk control options can not be justified purely for safety
reasons, the net economic benefit may be subtracted from the costs, and the Costper Unit Risk Reduction (CURR) should be presented.2
The risks and risk control options should fulfil all the criteria associated with the decisionparameters above.
Further criteria for environmental protection should be developed. Alternatively, allenvironmental consequences could be transferred to monetary units, and included in a costbenefit assessment. (This is not discussed further in this document, the focus is on safety.)
For each type of the individual risks (i.e. the risk to an individual person) the risk of death, injuryand ill health should be presented separately, (MSC/Circ.829), appendix 3. An integratedindicator may also be presented as Equivalent Fatalities or the Quality Adjusted Life Year(QALY), see below. As different integrated indicators exist, the presentation of separate resultsshould always be made. In case only fatality rates are presented it must be made clear if thisimplies that risk of injury and ill health are implicit in the numbers or explicitly excluded fromthe analysis. This will affect the risk acceptance criterion used, (see below).
In evaluation of a specific risk control option, results before and after implementing the RiskControl Options (RCO) should be presented (MSC/Circ.829, paragraph 6.5.1.2)
For each of the societal risk acceptance criteria, results should be presented separately and addedtogether. Only fatalities should be presented in this format.
RISK ACCEPTANCE
The term “risk acceptance” is well established in many industries and regulations. It is worthnoting that the term itself may be misleading. The risk is not acceptable, but the activity implyingthe risk may be acceptable, because of the benefits.
In general risk acceptance criteria may be implicit or explicit, and they may be high level or lowlevel. The technical equivalency in Regulation 5 of SOLAS Chapter I is an example of low levelimplicit criterion (technical equivalency without knowing the safety). Acceptance of equivalencymay also be given based on safety equivalency. As the safety is not known in current regulations,
1 FN diagrams are plots of frequency (F) of N or more fatalities. Figures 2-4 are examples. FN diagrams are
displayed in log-log scale
2 If the net benefit is large, it may be recommended not to regulate, as the market will regulate this.
MSC 72/16ANNEX 1
Page 3
I:\MSC\72\16.doc
i.e. is implicit, safety should first be established by analysis, i.e. made explicit. Thereafter safetyequivalency may be demonstrated for a new solution.
It should be noted that without explicit safety objectives, it is not obvious what safetyequivalency should imply. E.g. should the probability of a catastrophic accident vary with theship size, number of passengers etc.?
Examples of high-level explicit safety targets (acceptance criteria) that could be formulated are:
• Ships should be as safe a workplace as land based industries, e.g. manufacturing andprocess industries;
• Passenger ships should be as safe transport as e.g. aeroplanes;• Risks in shipping activities should not be disproportionate to benefits;• Ships should not pose risks that could be reasonably avoided;• Risks should not be unduly concentrated on particular individuals;• Risks from catastrophic accidents should be a small portion of the total risk;• Etc
The community of risk analysts would easily interpret such high-level acceptance criteria. It is,however, unlikely that the interpretation by different analysts would be identical. FSA wouldhence not be consistently applied (MSC/Circ.829, paragraph 1.2.1), and the transparencyobjective of FSA would not be met (MSC/Circ.829, Cover, paragraph 3). Therefore there is aneed for IMO to agree on explicit risk acceptance criteria for use in future FSA.
EXPLICIT RISK ACCEPTANCE CRITERIA
Individual Risk of death, injury and ill health for Passengers, Crew and Third Parties
Purpose
The purpose of individual risk acceptance criteria is to limit the risks to people onboard the shipor to individuals who may be affected by a ship accident. The criteria should define the term“intolerable and negligible level of risk” in terms of the individual risks of death, injury and illhealth.
Background
Modern risk assessment practice is to use an individual risk criterion that defines the intolerableand the negligible (broadly acceptable) risk. These criteria are limits to the area where cost-effectiveness assessment may be applied, as intolerable risks must be reduced irrespectively ofcosts. The area where cost-effectiveness assessment may be applied are commonly referred to asthe As Low As Reasonably Practicable (ALARP) area. In this area risks should be reduced aslong as the risk reduction is not disproportionate to the costs. To reduce risks beyond where riskreduction is disproportionate to the costs is not reasonable. The cost-effectiveness criteriatherefore define what is reasonable (R in ALARP, see section about Cost-Effectiveness below).
There is no single universal level of acceptable individual risk. People are prepared to accept awide variety of risks depending on their own perception of the risks and benefits from theactivity. In general, higher risks are accepted if the risk is voluntary, ordinary, natural, the effectsare delayed and the individual consider that they have control. These factors may explain why
MSC 72/16ANNEX 1Page 4
I:\MSC\72\16.doc
high risks are commonly accepted in some sports, in driving cars and motorbikes, and in certainhazardous occupations where risk control depends on the individual’s own skill (e.g. flying,diving).
When people are exposed to risks over which they have little or no control, they rightly expectthat the appropriate authorities impose control on their behalf. It is these “involuntary” riskswhich risk criteria are developed to control. An appropriate level for the risk acceptance criteriawould then be substantially below the total accident risks experienced in daily life, but might besimilar to risks that are accepted from other involuntary sources.
Individual risk criteria for hazardous activities are often set using the risk levels that have beenaccepted from other industrial activities. This involves a judgement that the acceptability ofindividual risks is similar for all activities over whose safety the person exposed has little or nocontrol. Thus, risk criteria for ship’s crew could be similar to those for land based industries e.g.manufacturing and offshore industries. This implies that risk criteria that have already beendeveloped in other industries can be applied to ships.
In principle there are many different methods that may be used to set the limit of tolerable risk.Criteria may be established by comparing to other industries, (see Appendix, A.1), comparing tonatural hazards, comparing to well informed decisions, etc. A risk acceptance criterion of 10-3 pership-year for crew may be derived from comparison with other hazards. The annual fatality ratefor all reasons in the period of life when this is at its lowest (4-15 of age) is about 10-3 (OECDmember countries). This is used by many regulators as an intolerable limit. For passengers it iscommon to use a stricter criterion, because the passengers are less informed about the risks, theyare not compensated (but pay), and are less in control. A negligible or ‘broadly acceptable’criterion of 10-6 should be understood as a very small number representing an insignificant risk toan individual. (If exposed to only such risks an individual would live in the order of a millionyear.)Crewmembers on a ship should have more influence over the risks and should be better informedthan passengers or members of the public near the port. It is therefore common to treatoccupational risk (crew) differently than transport related risk (passengers).
Proposed Criteria
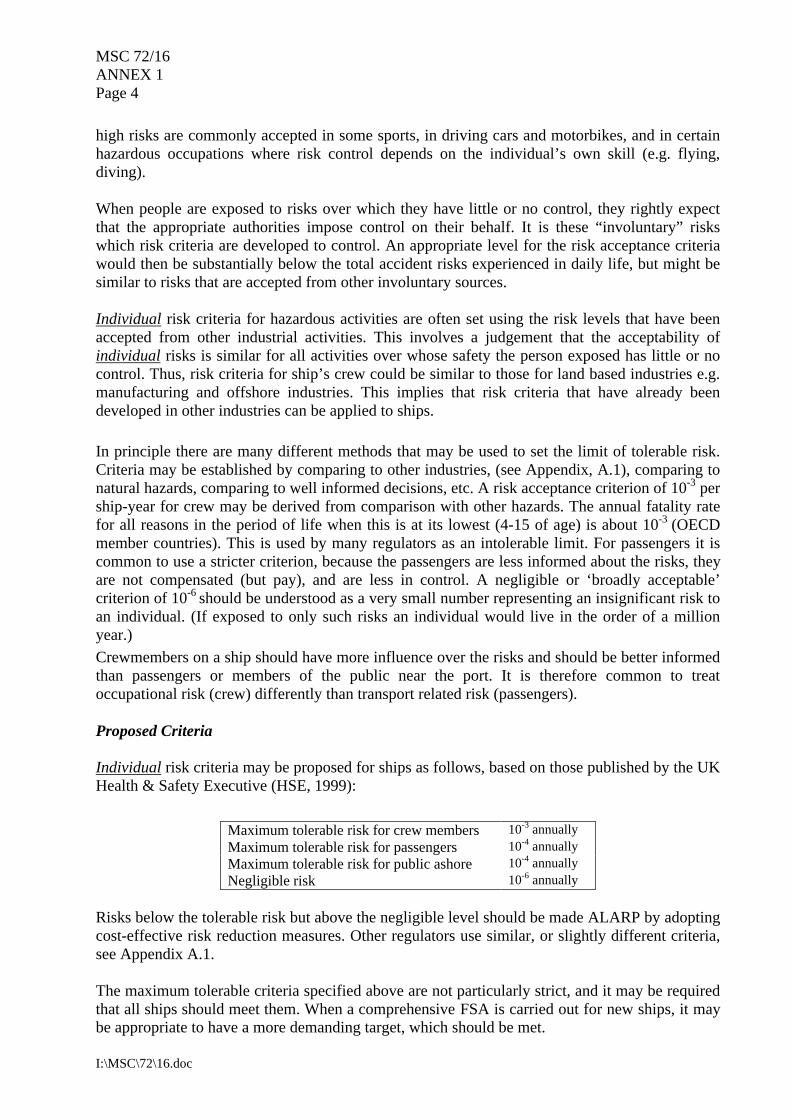
Individual risk criteria may be proposed for ships as follows, based on those published by the UKHealth & Safety Executive (HSE, 1999):
Maximum tolerable risk for crew members 10-3 annuallyMaximum tolerable risk for passengers 10-4 annuallyMaximum tolerable risk for public ashore 10-4 annuallyNegligible risk 10-6 annually
Risks below the tolerable risk but above the negligible level should be made ALARP by adoptingcost-effective risk reduction measures. Other regulators use similar, or slightly different criteria,see Appendix A.1.
The maximum tolerable criteria specified above are not particularly strict, and it may be requiredthat all ships should meet them. When a comprehensive FSA is carried out for new ships, it maybe appropriate to have a more demanding target, which should be met.
MSC 72/16ANNEX 1
Page 5
I:\MSC\72\16.doc
These may be indicated as follows:
Target individual risk for crew members 10-4 annuallyTarget individual risk for passengers 10-5 annuallyTarget individual risk for public ashore 10-5 annually
Although it is not necessarily essential to have risks below these targets, failure to meet themwould suggest that cost-effective risk reduction measures might be available. New regulationsbased on an FSA should demonstrate that the new ships meet these targets, or that risks areALARP.
Regarding the individual risk acceptance criteria for public ashore, indications of risk levels aregiven above. The responsible national authorities should decide on the individual risk acceptancecriteria for public ashore.
Comparison with Historical Data
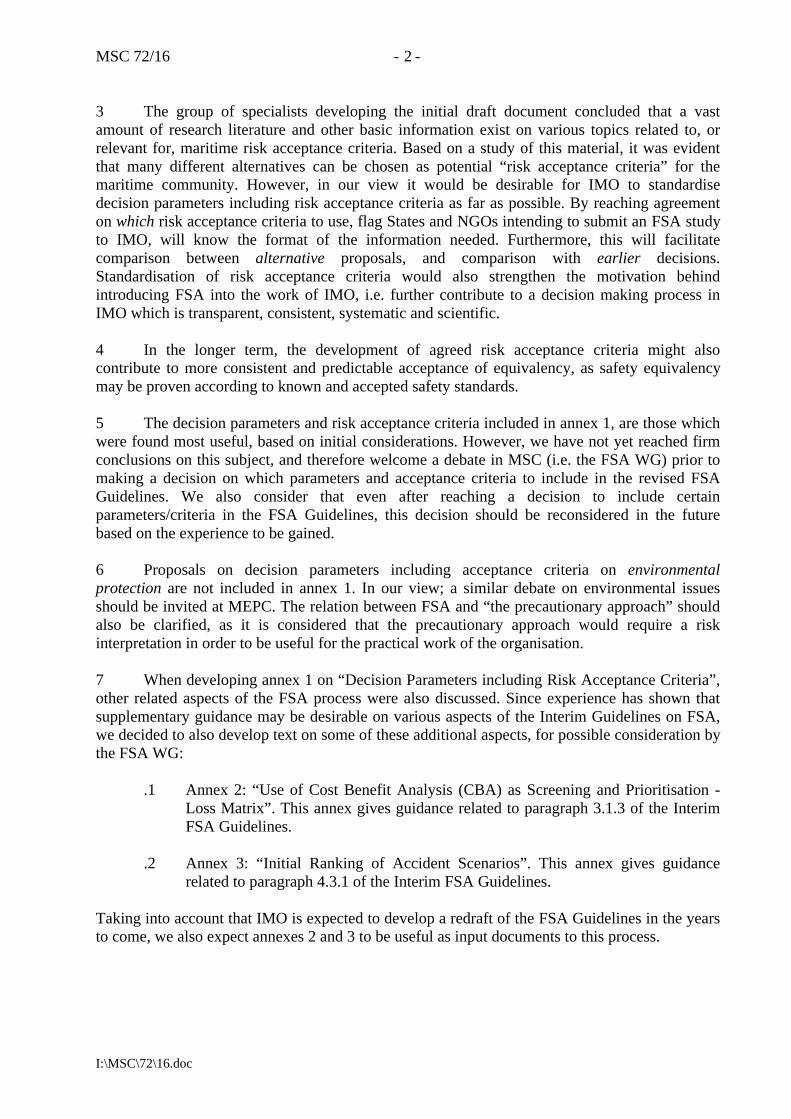
Figure 1 shows the estimated average individual risk for crew of different ship types in the periodfrom 1978 to 1998 (Eknes and Kvien, 1999). The data source is the LMIS casualty database. Thefigures indicate that the individual fatality risk levels in the maritime industry, according to theproposed criteria, fall in the ALARP region, where Risk Control Options should be introduced ifthey are cost effective. There may be exceptions among ship types that have not beeninvestigated, like e.g. tug boats and fishing vessels.
Figure 1: Individual fatality risk (annual) for crew of different ship types, shown together with theproposed Individual Risk acceptance criterion (data from 1978 to 1998, data source: LMIS).
For individual risks of injury and ill health similar acceptance criteria may be developed bycomparing to other industries and transport. For example, if significant proportion of the crew areinjured or develop similar health problems, this should be regarded intolerable. What issignificant may be judged by comparing to statistics representing larger populations.Further, for an explicit treatment of risk of injuries and ill health more explicit criteria should bebased on cost-effectiveness considerations (see Section about Cost-Effectiveness below). Except
1.00E-07
1.00E-06
1.00E-05
1.00E-04
1.00E-03
1.00E-02
Oil Tan
ker
Chemica
l Tan
ker
Oil/Che
mical T
anke
r
Gas Ta
nker
Bulk/O
il Carr
ier
Bulk C
arrier
(incl.
Ore)
Contain
er Ves
sel
Genera
l Carg
o Carr
ier
Ro/Ro C
argo C
arrier
Ind
ivid
ual
ris
k
Intolerable Risk
ALARP
Negligible Risk
MSC 72/16ANNEX 1Page 6
I:\MSC\72\16.doc
for such obviously intolerable cases a criterion based on cost effectiveness is suggested as moreappropriate for explicit studies of risks of injuries and ill health, see below.
Societal Risk to Life for Passengers, Crew and Third Parties
Purpose
The purpose of societal risk acceptance criteria is to limit the risks from ships to society as awhole, and to local communities (such as ports) which may be affected by ship activities. Inparticular, societal risk acceptance criteria are used to limit the risks of catastrophes affectingmany people at the same time, since society is particularly concerned about such events. In effectthe criteria define the term “acceptable level of risk” in terms of the overall societal risks offatalities.
Background
In general, societal risk acceptance criteria, and the societies’ risk aversion against large orcatastrophic accidents may be considered as lacking an explicit rationale. Some risk analystswould count the risk aversion against large accidents as one of the ‘risk conversion factors’representing the bias ‘perceived risk’ divided by ’actual risk’. E.g. Litai (1980) is listing thefollowing factors affecting this bias: Volition, Severity, Origin, Effect Manifestation, ExposurePattern, Controllability, Familiarity, Benefit and Necessity. The factors are found to be similar tofactors addressed by Rowe (1977), Starr (1969), Kinchin (1978), Otway and Cohen (1975) andGreen et al. (1998). Although the rationality may be debated, societal risk criteria are used by alarge and increasing number of regulators. The problems of inconsistency are, however, oftenseen and debated.
FN diagrams may be established in similar ways as individual risk criteria. Comparison withother industries may result in unpredictable and illogical results. The societal risk acceptancecriteria should reflect the importance of the activity to society. For example, the acceptancecriteria used for a fishing vessel should be different from the transport sector in the US. Toformalise such observations an FN acceptance criterion may be established by considering theeconomic activity represented by the different ship types. This may vary by orders of magnitude.The examples given for some ship types show that when the importance to the society isaccounted for, the established FN acceptance curves vary within 1- 2 orders of magnitude. Theoutlined method may (Skjong and Eknes, 1999) be used for any type of activity above a certainsize. An obvious limitation of the principle is represented by activities of high economic valuewith low labour intensity in remote places, e.g. offshore oil production.
The objective of the outlined method is to establish transparent FN risk acceptance criteria with arational foundation, which may be established from factual and available information. This waythe criteria would be transparent, MSC/Circ.829 .
Method
The acceptance criteria may be associated with the economic importance of the activity inquestion, and calibrated against the average fatality rate per unit economic production. Theimportance of an activity may be measured most adequately in economic terms, assuming thatwhat is paid in an open market represents the importance. Similarly, Gross National Product
MSC 72/16ANNEX 1
Page 7
I:\MSC\72\16.doc
(GNP3) is an aggregated indicator of the economic activity. Societal risk associated with anactivity may be accepted according to the importance to society from the activity.For occupational accidents the aggregated indicator, q , may be defined as the average fatalityrate per GNP. For transport related accidents a similar aggregated indicator, r ,may be defined.
GNPfatalities aloccupation ofNumber
=q to establish risk acceptance criteria for crew
ation transportfrom GNP on toContributiation transport todue fatalities ofNumber
=r to establish risk acceptance criteria for passengers
By using the data from US and Norway on occupational fatalities q= 1.5 fatalities/£ billion maybe estimated for the occupational fatalities and an =r 8.6 fatalities/£ billion may be estimatedfrom statistics for scheduled air traffic (ICAO, 1995; Skjong and Eknes, 1999). Air traffic isselected for comparison because of the availability of good statistics, and the generally highsafety standards.
For a specific activity (e.g. a ship), an average acceptable Potential Loss of Life ( APLL ) may bebased on the Economic Value (EV) of the activity.
EVqPLLA ⋅= for crew/workers or EVrPLLA ⋅= for passengers. (1)
This states that largely the total occupational risk should be distributed between the differentactivities accounting for their contribution to GNP, and that large deviations from this should bejudged an indication of good reasons for scrutiny. A similar criterion should be established for atransport activity. For activities and trades, which are of less importance to the society, thesociety may not be willing to accept a high accidental fatality risk. For activities and trades ofminor significance, and with minor contribution to the service production, only minor risksshould be accepted. As the ultimate solution the fatality risk may be eliminated, by eliminatingthe activity itself. This way a safety budget would be established. E.g. a low economicimportance corresponds to a low PLLA.
FN curves are commonly regarded as useful tools. An FN curve with inclination b may be fittedto the resulting APLL by:
(2)
Here Nu is the upper limit of the number of fatalities that may occur in one accident. Fora ship this is well defined as the maximum number of crew + passengers
fN is the frequency of occurrence of an accident involving N fatalitiesand F1 is the frequency of accidents involving one or more fatalities
Following the recommendation by HSC (1991), HCGPD(1983), Statoil (1995), b =1 is chosen,and the above simplifies to:
3 GNP = An estimate of the total money value of all the final goods and services produced in a given one-year period by the
factor of production owned by a particular country's residents
) )1(
)1(1(
1
1111
1∑∑
−
=−−
= +−+
+==uu N
Nbb
bb
bu
N
NNA NN
NNN
FNfPLL
MSC 72/16ANNEX 1Page 8
I:\MSC\72\16.doc
∑∑=
−
=
=+
+=uu N
N
N
NA N
FN
FPLL1
1
1
11
1)
11
1( (3)
Some risk analysis practitioners are of the opinion that b =1 is not risk averse. This is wrong, asexplained in details in HSE (1991). The risk aversion may be understood by observing that smallcontributions to PLL comes from large N. Since this small contributions are as ‘intolerable’ asthe comparable large contributions from small N, the b=1 is risk averse.
If solved with respect to F1, Equation (3) gives
∑=
=uN
N
A
N
PLLF
1
1 1(4)
The ALARP region is introduced by assuming that the risk is intolerable if more than one orderof magnitude above the average acceptable and negligible (broadly acceptable) if more than oneorder of magnitude below the average acceptable. This implies that the region where risks shouldbe reduced to As Low As Reasonably Practicable (ALARP) ranges over two orders ofmagnitude, in agreement with many published FN acceptance criteria, e.g. HSE(1999).HKGPD(1993), Statoil (1995).
Examples of Criteria and Comparison with Data for Some Generic Ship Types
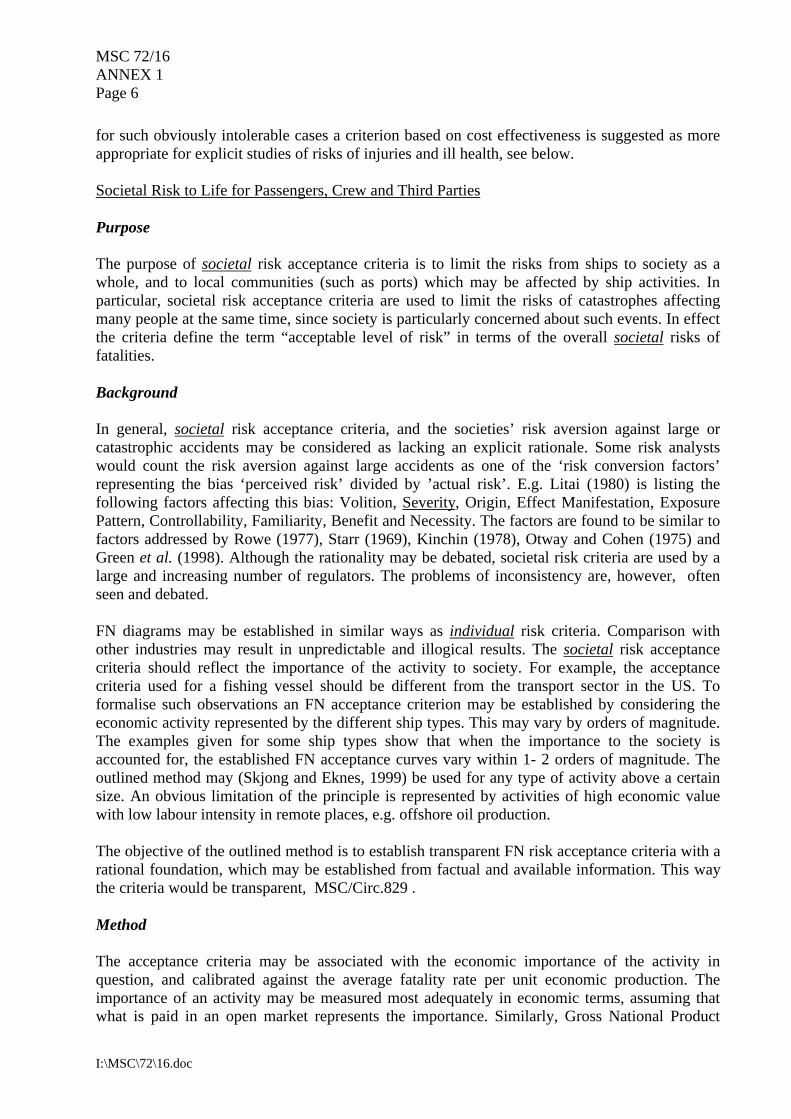
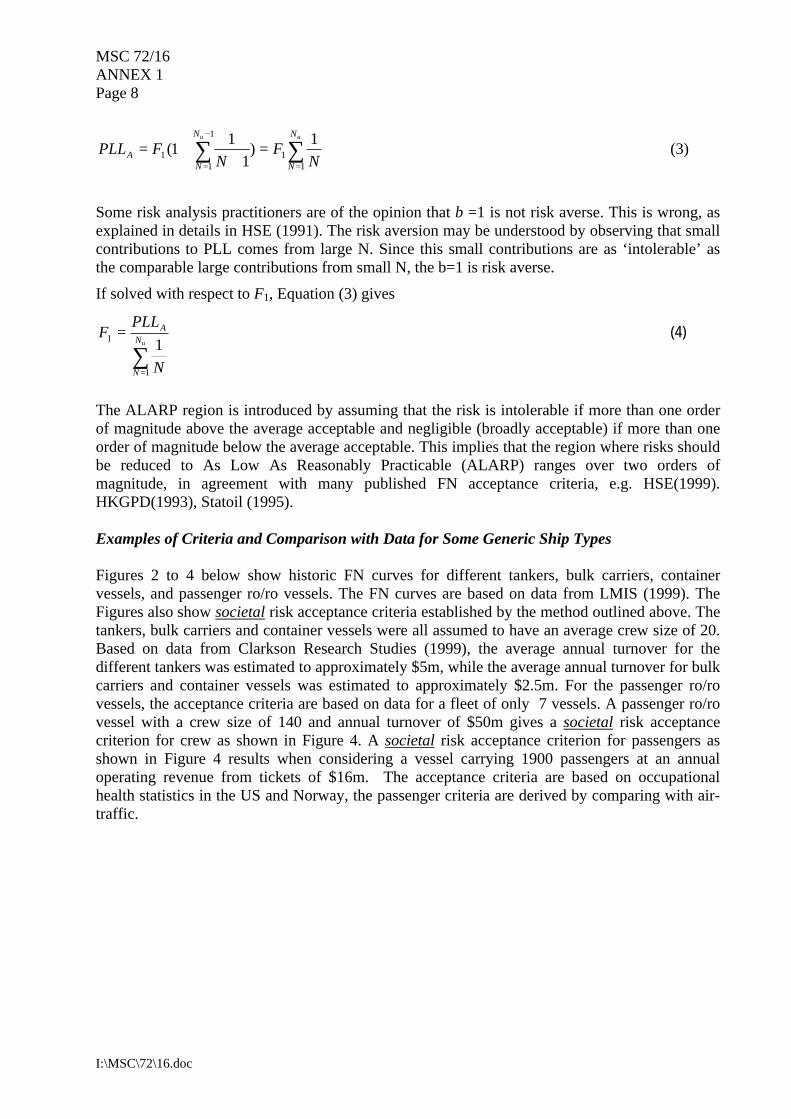
Figures 2 to 4 below show historic FN curves for different tankers, bulk carriers, containervessels, and passenger ro/ro vessels. The FN curves are based on data from LMIS (1999). TheFigures also show societal risk acceptance criteria established by the method outlined above. Thetankers, bulk carriers and container vessels were all assumed to have an average crew size of 20.Based on data from Clarkson Research Studies (1999), the average annual turnover for thedifferent tankers was estimated to approximately $5m, while the average annual turnover for bulkcarriers and container vessels was estimated to approximately $2.5m. For the passenger ro/rovessels, the acceptance criteria are based on data for a fleet of only 7 vessels. A passenger ro/rovessel with a crew size of 140 and annual turnover of $50m gives a societal risk acceptancecriterion for crew as shown in Figure 4. A societal risk acceptance criterion for passengers asshown in Figure 4 results when considering a vessel carrying 1900 passengers at an annualoperating revenue from tickets of $16m. The acceptance criteria are based on occupationalhealth statistics in the US and Norway, the passenger criteria are derived by comparing with air-traffic.
MSC 72/16ANNEX 1
Page 9
I:\MSC\72\16.doc
1.0E-06
1.0E-05
1.0E-04
1.0E-03
1.0E-02
1 10 100
Fatalities (N)
Fre
qu
ency
of
N o
r m
ore
fat
alit
ies
(per
sh
ip
year
)Oil tankers
Chem. tankers
Oil/ChemicaltankersGas tanker
Negligible
Intolerable
ALARP
Figure 2: FN curves for different tankers, shown together with established risk acceptance curves.Data from 1978-1998. (Data source: LMIS)
1.0E-05
1.0E-04
1.0E-03
1.0E-02
1 10 100 1000
Fatalities (N)
Fre
qu
ency
of
N o
r m
ore
fat
alit
ies
(per
sh
ip y
ear)
Bulk and oreContainer
Intolerable
ALARP
Negligible
Figure 3: FN curves for bulk and ore carriers, and container vessels, shown together with risk acceptancecriteria established by the above outlined method. Data from 1978-1998. (Data source: LMIS)
MSC 72/16ANNEX 1Page 10
I:\MSC\72\16.doc
1.0E-05
1.0E-04
1.0E-03
1.0E-02
1 10 100 1000
Fatalities (N)
Freq
uenc
y of
N o
r m
ore
fata
litie
s (p
er s
hip
year
)
Passenger roro
Intolerable
ALARP
Negligible
Figure 4: FN curve for passenger ro/ro ships, shown together with risk acceptance criteria established by theabove outlined method. Data from 1989-1998. (Data source: LMIS)
The historical data appears to give FN curves in the ALARP region for most of the examinedship types. The bulk carriers are different, apparently touching the borderline between theALARP and the intolerable risk region. This may be observed to be in agreement with theattention that has been given to the bulk carriers in recent years, where the impression has beenthat the number of losses of these ships involving many fatalities has been judged as intolerable.For bulk carriers the curve is in agreement with the previous published FN curve by Mathiesen(1997), which was derived by other methods. For Passenger Ro/Ro Vessels the curve presented isin agreement with the FN diagram published by the North West European Project on PassengerRo/Ro Vessels (DNV, 1997).
Third Parties
On safety issues there will always be a conflict between the interests of third parties andindustries, as the third parties will be involuntarily exposed to the risks from the industry. Theshipping industry is not an exception. It should be the national authorities’ responsibility todefine maximum tolerable and negligible third party risk, to protect the citizens.Cost Benefit and Cost Effectiveness Assessment
Purpose
The type of risk criteria proposed above may define a range within which the risks should bereduced to a level “as low as reasonably practicable” (ALARP). Within this range CostEffectiveness Assessment (CEA) is recommended used to select reasonably practicable riskreduction measures.The purpose of the Cost Effectiveness criterion will be to provide a basis for decision-makingabout Risk Control Options (RCOs) resulting from FSA Step 3, MSC/Circ.829 , paragraph 6.5.1.
MSC 72/16ANNEX 1
Page 11
I:\MSC\72\16.doc
Background
In a conventional Cost Benefit Assessment (CBA) the acceptance criteria is simply that thebenefits outweigh the costs. In CBA the analyst converts all risks to monetary units. Thedistinction between Cost Effectiveness Analysis (CEA) and Cost Benefit Assessment is thereforequite large. CEA presents a ratio of costs to benefits, and avoid putting a value to the benefit (e.g.life saved). The value judgement is left to the decision-maker when deciding which RCOs toimplement.In a CBA the analyst makes the value judgement or use prescribed criteria. All losses (life,injuries, ill health, environmental, and economic losses) are converted to monetary units. CBA istherefore not likely to be attractive at IMO, as the analysis may lack transparency. CBA is alsodiscredited by its earlier uses by economists. Some economists found ‘value of life’ byestimating the value of man as a resource in an economic activity. The view, were pursued in e.g.Rice(1966), Lave and Seskin (1970). This approach is conflicting with ethical traditions. Mostethical systems would regard the wellbeing of man as the purpose of economic activity4 Earlyuse of CBA lead to the bizarre result that a child was worth next to nothing (In economic term“low opportunity cost of replacement”), and the same would be the case of elderly persons.
This criticism is accounted for in CEA. Society spends large sums (some 20% of Gross DomesticProduct (GDP5) in some countries) on safety. Such use of resources cannot be justified in orderto optimise economic production. However, resources are limited and society needs to put somelimit to how much resource could be used for safety, and thus an ICAF criterion may beproposed.
The valuation of fatality risks is a critical step in this process, and modern risk assessmentpractice is to highlight this issue by expressing the results in the form of an Implied Cost ofAverting a Fatality (ICAF) if a risk control option were to be adopted, i.e. by CEA:
RiskCost
ICAF∆∆
=
Cost∆ is the marginal (additional) cost of the risk control option, whilst Risk∆ is the reduced riskin terms of fatalities averted.
This approach then requires criteria to define the ICAF values at which measures are consideredjust cost-effective. Again, there are many methods to identify an acceptance criterion.Alternatives are such methods as willingness to pay studies by public surveys, willingness to payin actual decisions, studies of risk control options implemented and not implemented. Ifregulators could avoid implementing risk control options with high ICAFs and implement thosewith low ICAFs, more lives would be saved for the same budget (Condition of Paretooptimality), see e.g. Tengs et al.(1995), Ramberg and Sjøberg (1997).
4 E.g. The “Homo Mensura” sentence was formulated by Protagoras (485 – 415 BC).
5 GDP = An estimate of the total money value of all the final goods and services produced in a given one-year period using thefactor of production located within a particular country's borders. (The differences between GDP and GNP arise from thefacts that there may be foreign-owned companies engaged in production within the country's borders and there may becompanies owned by the country's residents that are engaged in production in some other country but provide income toresidents.)
MSC 72/16ANNEX 1Page 12
I:\MSC\72\16.doc
An alternative cost-effectiveness measure is given by Cost of Unit Risk Reduction (CURR),where the economic benefits of the investigated RCOs are accounted for. Economic benefits (orrisk reduction), may also include the economic value of reduced pollution.
RisknefisEconomicBe
ICAFRisk
nefisEconomicBeCostCURR
∆∆
−=∆
∆−∆=
Table 1 gives values of ICAF used by some authorities.
Table 1: Published ICAFs in use as acceptance criteria
ORGANISATION SUBJECT ICAF SOURCEUS Federal HighwayAdministration
Road Transport $2.5m (£1.6m) FHWA (1994)
UK Department ofTransport
Road transport £1.0 m (1998, upratedwith GDP per capita)
DETR (1998)
UK Health & SafetyExecutive
Industrial safety As above or higher HSE (1999)
Railtrack (UK railinfrastructure controller)
Overground railways As above to £2.65m Railtrack(1998)
London UndergroundLtd
Underground railways £2m Rose (1994)
EU Road Transport ECU 1 million (£0.667m) from Evans(1998)
Norway All hazards NOK 10m (£0.8m) Norway (1996)
Table 2 present the average values from Tengs et al.(1995). These figures represent willingnessto pay in actual decisions. Assuming that a fatality correspond to 35 lost life-years, the medianvalue correspond to $ 1.470.000 (or about £ 900 000)
Table 2: Results from Tengs et al. (1995)“Five Hundred Life-Saving Interventions and their Cost Effectiveness”
Number of measures studied 587Range of cost effectiveness Negative to $10 billion/life year savedMedian Value $ 42.000/life yearMedian for Medical Interventions $ 19.000/life yearMedian for Injury Prevention $ 48.000/life yearMedian for toxic control $2.8 million/life year
It is also possible to derive acceptance criteria expressed as ICAF from compound aggregatedsocial indicators, see UNDP (1990) and Lind (1996). The Life Quality Index Criterion foracceptable risk implies that an option is preferred or accepted as long as the change in the LifeQuality Index owing to the implementation of the option is positive. The Life Quality Indexcontains such indicators as GDP/capita and life expectancy at birth. As a risk control optionchange these two, an optimum acceptable ICAF may be derived, and as GDP and life expectancyvaries between countries there are variations in the acceptance criteria. Within OECD membercountries (representing some 95% of the global GDP), the variation is not very large, seeFigure 5.
MSC 72/16ANNEX 1
Page 13
I:\MSC\72\16.doc
0
500000
1000000
1500000
2000000
2500000
3000000
3500000
Aus
tral
ia
Aus
tria
Bel
gium
Can
ada
Den
mar
k
Fin
land
Fra
nce
Ger
man
y
Gre
ece
Irel
and
Italy
Japa
n
Net
herla
nds
New
Zea
land
Nor
way
Por
tuga
l
Spa
in
Sw
eden
Sw
itzer
land U
K
US
A
Country
ICA
F (
GB
P)
1984
1994
Figure 5: Comparison of values of implied cost of averting a fatality between the years 1984 and 1994 and between various countries (Skjong and Ronold, 1998).
Based on the above, an ICAF criterion of $ 3 million or £ 2 million may be proposed for use byIMO, in cases where fatalities in addition to representing fatality risk also represent an indicatorof risk of injuries and ill health. The ICAF criterion is proposed updated every year according tothe average risk free rate of return (some 5%), or by use of the formula derived by UNDPsocietal indicators. Higher values may be justified for risks that are just tolerable, and a range of£ 1 to 5 million may indicate the range, see MSC 70/WP.12, paragraph 30, referring to $ 1 to 8million.
Risk of injuries and ill health
As indicated above risk of injuries and ill health may be dealt with implicitly or explicitly. In thesocietal indicator approach the indicator is life-year (life expectancy at birth), and may beinterpreted as an indicator of life expectancy as well as life quality. The ICAF criterion maytherefore implicitly be assumed to account for risk of injuries and ill health. In separate studiesof risk of injuries and ill health, the ICAF criterion is therefore initially of no value. It maytherefore be suggested to use the ICAF criterion and split it into contributions covering risk ofdeath, injuries and ill health separately.
According to the UK Department of Transport, DETR(1998), the WTP (Willingness To Pay) forslight injury is 0.9% of the VPF (Value of Prevention of a statistical Fatality). The number ofinjuries to crew on UK registered merchant vessels during 1993-97 was 1886 compared to 15fatalities (MAIB, 1998). The ratio of approximately 130 injuries to 1 fatality can be applied to theestimated personal accident rate above. The severity of these injuries is not defined, but they areassumed to be equivalent to lost-time injuries, as they do not necessarily involve medicalevacuation. It is not clear how comprehensively they are reported. This suggests that the overallcost of injuries could be approximately equal to the value of fatalities (0.9% of 130 = 1.17).Similar results have previously been reported in MSC 68/INF.6. By defining serious injuries as1/10 equivalent fatalities, and minor injuries as 1/100 equivalent fatality the data suggested a 1:1
MSC 72/16ANNEX 1Page 14
I:\MSC\72\16.doc
correspondence (or 14:14.89). These result are highly uncertain, and for comparison, fatalities onNorwegian roads are estimated to contribute with approximately 14% of the total costs offatalities and injuries, whereas the injuries are estimated to contribute the remaining 86% (Elvik,1993). The relatively large difference between these estimates may be explained by minorinjuries in traffic on average being more severe than minor injuries for crewmembers. It is thusinitially, in the lack of better statistics, proposed to split the ICAF criterion equally between thetwo contributors, one applying for fatalities and one for risk of injuries and ill health. As moreknowledge is gained, this should be revised.
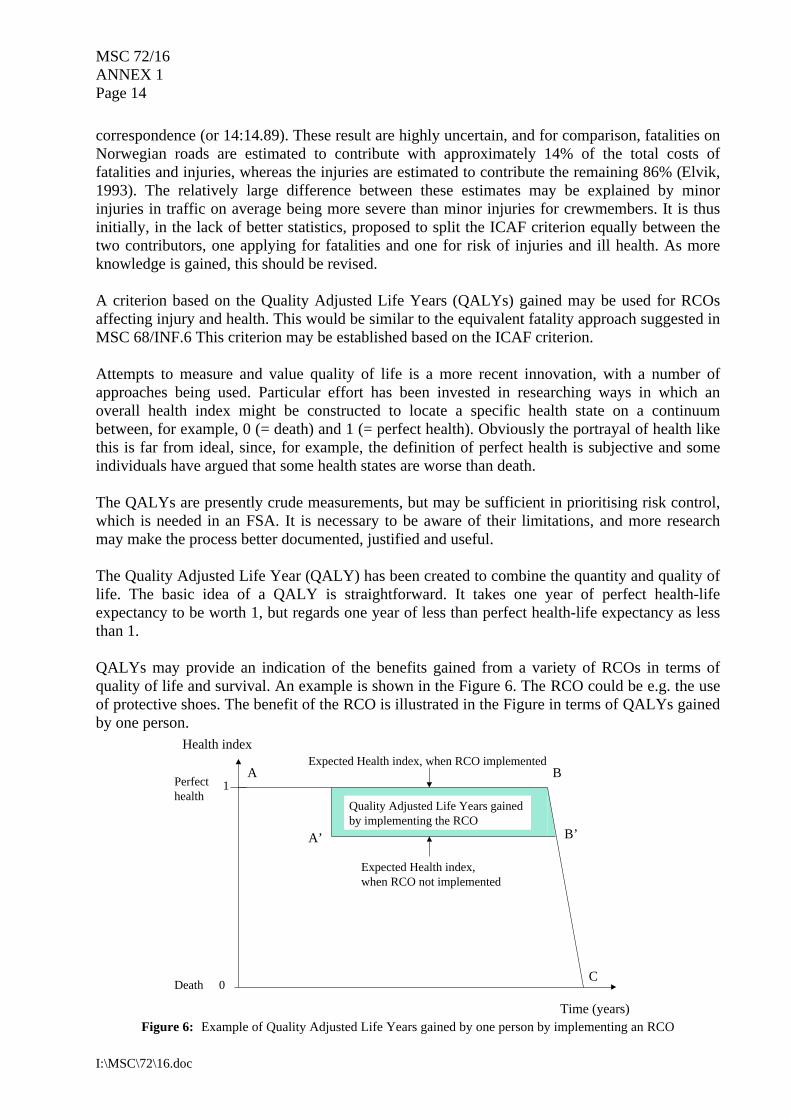
A criterion based on the Quality Adjusted Life Years (QALYs) gained may be used for RCOsaffecting injury and health. This would be similar to the equivalent fatality approach suggested inMSC 68/INF.6 This criterion may be established based on the ICAF criterion.
Attempts to measure and value quality of life is a more recent innovation, with a number ofapproaches being used. Particular effort has been invested in researching ways in which anoverall health index might be constructed to locate a specific health state on a continuumbetween, for example, 0 (= death) and 1 (= perfect health). Obviously the portrayal of health likethis is far from ideal, since, for example, the definition of perfect health is subjective and someindividuals have argued that some health states are worse than death.
The QALYs are presently crude measurements, but may be sufficient in prioritising risk control,which is needed in an FSA. It is necessary to be aware of their limitations, and more researchmay make the process better documented, justified and useful.
The Quality Adjusted Life Year (QALY) has been created to combine the quantity and quality oflife. The basic idea of a QALY is straightforward. It takes one year of perfect health-lifeexpectancy to be worth 1, but regards one year of less than perfect health-life expectancy as lessthan 1.
QALYs may provide an indication of the benefits gained from a variety of RCOs in terms ofquality of life and survival. An example is shown in the Figure 6. The RCO could be e.g. the useof protective shoes. The benefit of the RCO is illustrated in the Figure in terms of QALYs gainedby one person.
Figure 6: Example of Quality Adjusted Life Years gained by one person by implementing an RCOTime (years)
Health index
1Perfecthealth
Death 0
A
C
A’ B’
BExpected Health index, when RCO implemented
Expected Health index,when RCO not implemented
Quality Adjusted Life Years gainedby implementing the RCO
MSC 72/16ANNEX 1
Page 15
I:\MSC\72\16.doc
Some sources of information of on QALY and similar indicators may be referenced.
1. The Quality of Well Being Scale (Kaplan and Anderson, 1988)2. The McMaster Health Classification System (Drummond et al., 1987)3. The Rosser and Kind Index (Kind et al., 1982)4. The EoroQol Instrument (EuroQol Group, 1990; Nord, 1991)
If it is assumed that on average one prevented fatality implies 35 Quality Adjusted Life Yearsgained, a QALY criterion may be based on the ICAF criterion as follows:
gainedYear Life AdjustedQuality per 42000$35
million /2 3$2/==
∆=
eICAF
QALY criterioncriterion
This figure is very close to the figure used for decisions in the health care area, where e.g.Gafni(1999) refer to a QALY of $ 35 000. The average value for life saving interventions in theUS in Tengs et al. (1995) is also $ 42.000 per life-year, see Table 2.
Interest Rates in CBA and CEA
Interest rates in cost benefit assessment and risk assessment may influence results to aconsiderable degree. The reason is that many risk control options are technical installations anddesign modifications that will be part of the costs of constructing the ship, whilst the benefitsmay be reduced risks at the end of the design life (e.g. 20 years). Further, it should be noted thatin an economic decision the interest rate reflects the economic risk of the investment. As risks aremade explicit in CBA/CEA and in an FSA the interest rate should not include any element of riskpremium or opportunities for other investments. The interest rate is not the interest rate in thecorporate investment manual (the corporate rate of return).
It would also seem unethical to be able to delay an investment in safety for an economic benefit.This would be the case if the safety budget could be placed as a risk free investment, and onlypart of the resulting increased budget was allocated to safety. These ethical considerations aremade in Skjong and Ronold(1998) to show that the ICAF criterion should increase with the riskfree rate of return. A similar argument has been used by Paté-Cornell (1983).
The conclusion of the question of interest rates to be used in cost-effectiveness studies istherefore suggested as follows:
For a decision in any given year
• All future monetary costs should be depreciated to present value with an interest ratecorresponding to a ‘risk-free’ rate of return (e.g. future maintenance, inspection, training).
• Investment costs should be in present value• All monetary risks should be handled the same way as monetary costs (e.g. a CURR
criterion).• No uncertainty or risk should be treated as a risk premium (as they are included explicitly).• Lives saved should not be depreciated. For a decision now, all lives saved now or in the
future have the same value.
For comparison with an alternative decision e.g. to delay the implementation of a risk controloption
MSC 72/16ANNEX 1Page 16
I:\MSC\72\16.doc
• The acceptance criteria should be expected to increase corresponding to a ‘risk-free’ rate ofreturn.
• The actual future acceptance criteria are the concern of future decision-makers.
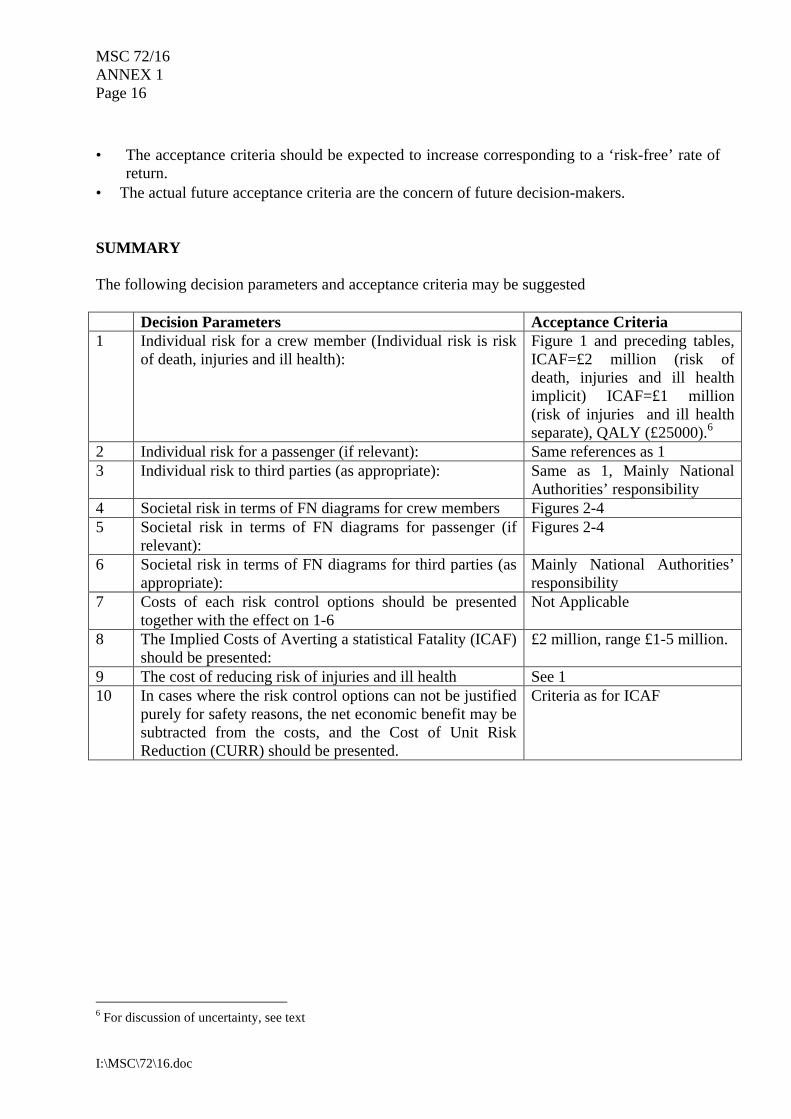
SUMMARY
The following decision parameters and acceptance criteria may be suggested
Decision Parameters Acceptance Criteria1 Individual risk for a crew member (Individual risk is risk
of death, injuries and ill health):Figure 1 and preceding tables,ICAF=£2 million (risk ofdeath, injuries and ill healthimplicit) ICAF=£1 million(risk of injuries and ill healthseparate), QALY (£25000).6
2 Individual risk for a passenger (if relevant): Same references as 13 Individual risk to third parties (as appropriate): Same as 1, Mainly National
Authorities’ responsibility4 Societal risk in terms of FN diagrams for crew members Figures 2-45 Societal risk in terms of FN diagrams for passenger (if
relevant):Figures 2-4
6 Societal risk in terms of FN diagrams for third parties (asappropriate):
Mainly National Authorities’responsibility
7 Costs of each risk control options should be presentedtogether with the effect on 1-6
Not Applicable
8 The Implied Costs of Averting a statistical Fatality (ICAF)should be presented:
£2 million, range £1-5 million.
9 The cost of reducing risk of injuries and ill health See 110 In cases where the risk control options can not be justified
purely for safety reasons, the net economic benefit may besubtracted from the costs, and the Cost of Unit RiskReduction (CURR) should be presented.
Criteria as for ICAF
6 For discussion of uncertainty, see text
MSC 72/16ANNEX 1
Page 17
I:\MSC\72\16.doc
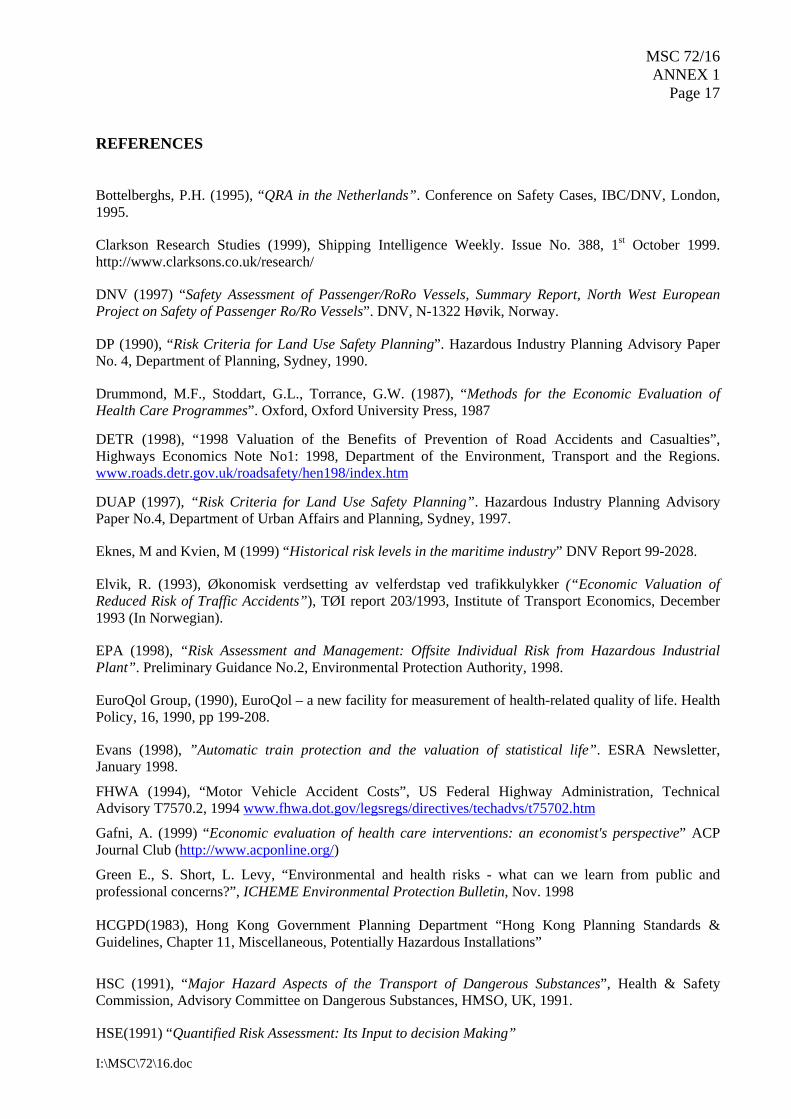
REFERENCES
Bottelberghs, P.H. (1995), “QRA in the Netherlands”. Conference on Safety Cases, IBC/DNV, London,1995.
Clarkson Research Studies (1999), Shipping Intelligence Weekly. Issue No. 388, 1st October 1999.http://www.clarksons.co.uk/research/
DNV (1997) “Safety Assessment of Passenger/RoRo Vessels, Summary Report, North West EuropeanProject on Safety of Passenger Ro/Ro Vessels”. DNV, N-1322 Høvik, Norway.
DP (1990), “Risk Criteria for Land Use Safety Planning”. Hazardous Industry Planning Advisory PaperNo. 4, Department of Planning, Sydney, 1990.
Drummond, M.F., Stoddart, G.L., Torrance, G.W. (1987), “Methods for the Economic Evaluation ofHealth Care Programmes”. Oxford, Oxford University Press, 1987
DETR (1998), “1998 Valuation of the Benefits of Prevention of Road Accidents and Casualties”,Highways Economics Note No1: 1998, Department of the Environment, Transport and the Regions.www.roads.detr.gov.uk/roadsafety/hen198/index.htm
DUAP (1997), “Risk Criteria for Land Use Safety Planning”. Hazardous Industry Planning AdvisoryPaper No.4, Department of Urban Affairs and Planning, Sydney, 1997.
Eknes, M and Kvien, M (1999) “Historical risk levels in the maritime industry” DNV Report 99-2028.
Elvik, R. (1993), Økonomisk verdsetting av velferdstap ved trafikkulykker (“Economic Valuation ofReduced Risk of Traffic Accidents”), TØI report 203/1993, Institute of Transport Economics, December1993 (In Norwegian).
EPA (1998), “Risk Assessment and Management: Offsite Individual Risk from Hazardous IndustrialPlant”. Preliminary Guidance No.2, Environmental Protection Authority, 1998.
EuroQol Group, (1990), EuroQol – a new facility for measurement of health-related quality of life. HealthPolicy, 16, 1990, pp 199-208.
Evans (1998), ”Automatic train protection and the valuation of statistical life”. ESRA Newsletter,January 1998.
FHWA (1994), “Motor Vehicle Accident Costs”, US Federal Highway Administration, TechnicalAdvisory T7570.2, 1994 www.fhwa.dot.gov/legsregs/directives/techadvs/t75702.htm
Gafni, A. (1999) “Economic evaluation of health care interventions: an economist's perspective” ACPJournal Club (http://www.acponline.org/)
Green E., S. Short, L. Levy, “Environmental and health risks - what can we learn from public andprofessional concerns?”, ICHEME Environmental Protection Bulletin, Nov. 1998
HCGPD(1983), Hong Kong Government Planning Department “Hong Kong Planning Standards &Guidelines, Chapter 11, Miscellaneous, Potentially Hazardous Installations”
HSC (1991), “Major Hazard Aspects of the Transport of Dangerous Substances”, Health & SafetyCommission, Advisory Committee on Dangerous Substances, HMSO, UK, 1991.
HSE(1991) “Quantified Risk Assessment: Its Input to decision Making”
MSC 72/16ANNEX 1Page 18
I:\MSC\72\16.doc
HSE (1992) “The Tolerability of Risk from Nuclear Power Stations”, Health and Safety Executive,HMSO.
ICAO (1995): “Civil Aviation Statistics of the World 1994”. The International Civil AviationOrganization, 1995. http://www.icao.org
Kaplan, R.M., Anderson, J.P. (1988), “A General Health Policy Model: Update and Application”. HealthServices Research, 23, 2, 1988, pp 203-235.
Kinchin G.H., “Assessment of Hazards in Engineering Work”, Proc. Instn. Civ.Engrs, Vol 64, pp 431-38,1978.
Kind, P., Rosser, R., Williams, A., (1982) Valuation of Quality of Life: Some Psychometric Evidence. InJones-Lee, M.W. (ed): “The Value of Life and Safety” pp.159-170. Amsterdam, North Holland PublishingCompany, 1982.
Lave, L. and E.P. Seskin (1970) “Air pollution and human health” Science, 109, 723-732, August 1970.
Lind, N.C., “Safety Principles and Safety Culture” Proceedings, 3rd International Summit on Safety atSea, Conference organised by Norwegian Petroleum Society, Oslo, Norway, 1996.
Litai, D. (1980) “A Risk Comparison methodology for the Assessment of Acceptable Risk” PhD Thesis,Massachusetts Institute of Technology, Cambridge, Massachusetts.
LMIS (1999), Lloyds Maritime Information Systems Casualty Database, April 1999.
MAIB (1998), “Annual Report 1997”. Marine Accident Investigation Branch, Department of theEnvironment, Transport and the Regions, London.
Mathiesen, T.C. (1997) “Cost Benefit Analysis of Existing Bulk Carriers” DNV Paper Series No 97-P008
MSC 68/INF.6 “Formal Safety Assessment- Trial Application to high-speed passenger catamaranvessels”, Submitted by UK.
Nord, E (1991), “EuroQol: Health related quality of life measurement. Valuation of health states by thegeneral public in Norway” Health Policy, 18, 1991, pp 25-36.
Norway (1996), Stortingsproposisjon No 1 1996-97 (In Norwegian)
Otway H.J., J.J. Cohen, “Revealed Preferences: Comments on the Starr Benefit-Risk Relationships”,Vienna, International Institute for Applied Systems Analysis, 1975.
Paté-Cornell, M.E., “Discounting in Risk Analysis: Capital vs. Human Safety,” Risk, StructuralEngineering and Human Error, Waterloo, Ontario, Canada, pp. 17-32, 1983.
Skjong, R. and Ronold, K. (1998), “Societal Indicators and Risk Acceptance”. OMAE 98
Skjong, R and Eknes, M (1999) “Risk Acceptance and Economic Activity”, DNV 99-2050
Starr C., “Social Benefits vs. Technological Risks” Science, Vol 165, pp. 1232-38, 1969.
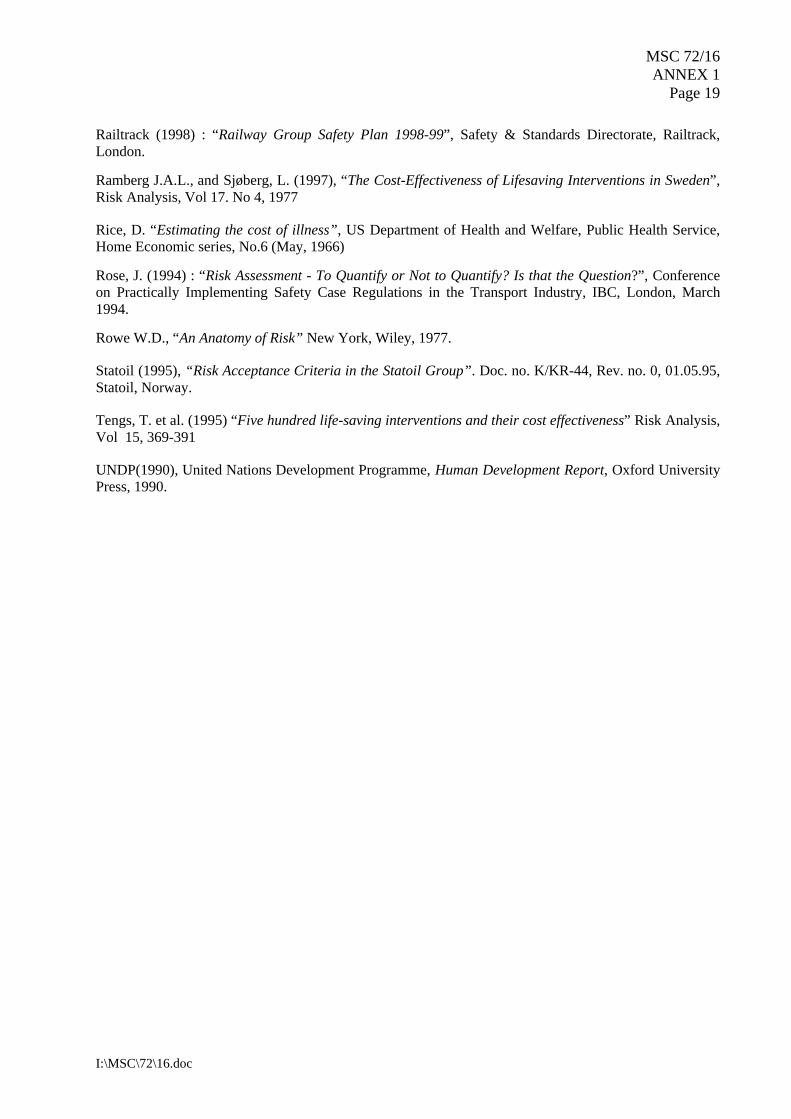
Railtrack (1998) : “Railway Group Safety Plan 1998-99”, Safety & Standards Directorate, Railtrack,London.
Ramberg J.A.L., and Sjøberg, L. (1997), “The Cost-Effectiveness of Lifesaving Interventions in Sweden”,Risk Analysis, Vol 17. No 4, 1977
Rice, D. “Estimating the cost of illness”, US Department of Health and Welfare, Public Health Service,Home Economic series, No.6 (May, 1966)
Rose, J. (1994) : “Risk Assessment - To Quantify or Not to Quantify? Is that the Question?”, Conferenceon Practically Implementing Safety Case Regulations in the Transport Industry, IBC, London, March1994.
Rowe W.D., “An Anatomy of Risk” New York, Wiley, 1977.
Statoil (1995), “Risk Acceptance Criteria in the Statoil Group”. Doc. no. K/KR-44, Rev. no. 0, 01.05.95,Statoil, Norway.
Tengs, T. et al. (1995) “Five hundred life-saving interventions and their cost effectiveness” Risk Analysis,Vol 15, 369-391
UNDP(1990), United Nations Development Programme, Human Development Report, Oxford UniversityPress, 1990.
MSC 72/16ANNEX 1Page 20
I:\MSC\72\16.doc
Appendix A.1. Some Individual risk Criteria
Table A.1: Individual Risk Criteria in UseAuthority Description Criterion (per year)HSE (HSE, 1999) Maximum tolerable risk to workers 10-3
Maximum tolerable risk to the public 10-4
Negligible risk 10-6
Netherlands(Bottelberghs, 1995)
Maximum tolerable for existing situations 10-5
Maximum tolerable risk for new situations 10-6
New South Wales,Australia (DUAP, 1997)
Sensitive developments (hospitals, schoolsetc.)
5⋅10-7
Residential, hotels, motels, tourist resorts etc. 1⋅10-6
Commercial, retail, offices etc 1⋅10-5
Sporting complexes, active open space 1⋅10-5
Industrial 5⋅10-5
Western Australia(EPA, 1998)
Sensitive developments (hospitals, schoolsetc.)
5⋅10-7
Residential zones 1⋅10-6
Non-industrial (commercial, sporting etc.) 1⋅10-5
Industrial 5⋅10-5
Table A.2 Individual Risk in Various Industries and Activities, Mathiesen (1997)
Industry Annual Individual Risk ( x10-5)
Oil and gas production 100.0
Agriculture 7.9
Forestry 15.0
Deep sea fishing 84.0
Energy production 2.5
Metal manufacturing 5.5
Chemical industry 2.1
Mechanical engineering 1.9
Electrical engineering 0.8
Construction 10.0
Railways 9.6
All manufacturing 1.9
All services 0.7
All industries 1.8
Bulk carriers 13.0
***
MSC 72/16
I:\MSC\72\16.doc
ANNEX 2
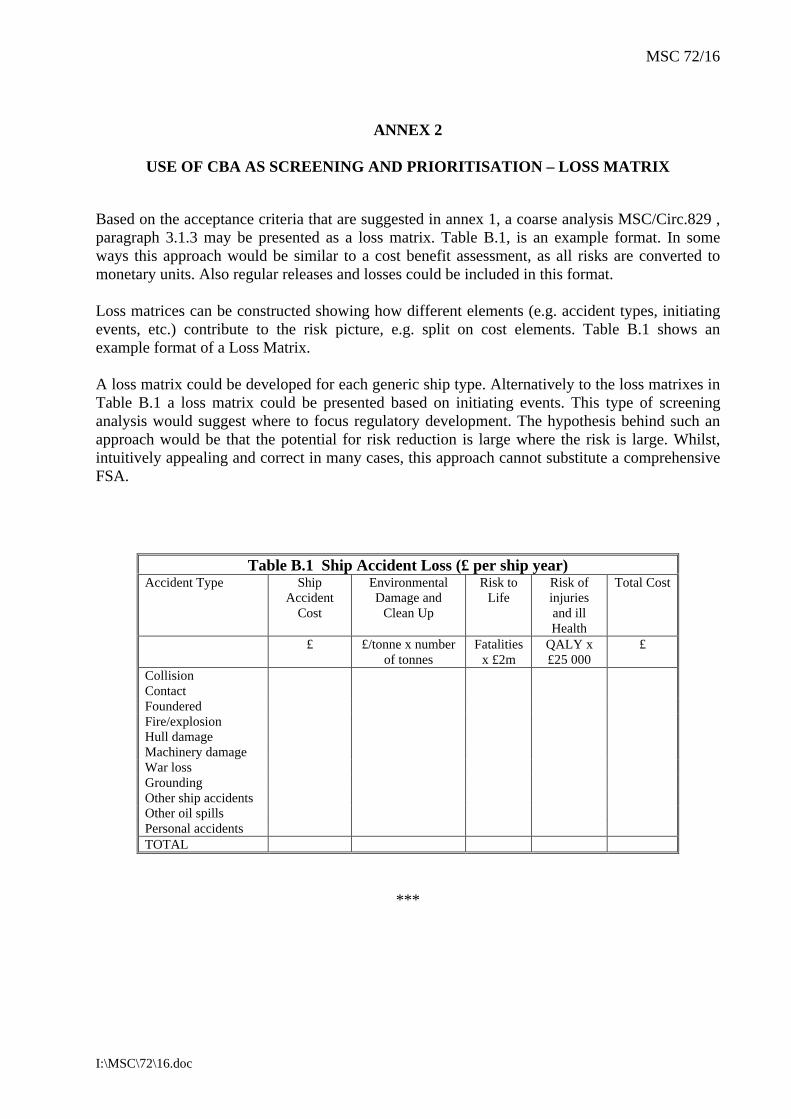
USE OF CBA AS SCREENING AND PRIORITISATION – LOSS MATRIX
Based on the acceptance criteria that are suggested in annex 1, a coarse analysis MSC/Circ.829 ,paragraph 3.1.3 may be presented as a loss matrix. Table B.1, is an example format. In someways this approach would be similar to a cost benefit assessment, as all risks are converted tomonetary units. Also regular releases and losses could be included in this format.
Loss matrices can be constructed showing how different elements (e.g. accident types, initiatingevents, etc.) contribute to the risk picture, e.g. split on cost elements. Table B.1 shows anexample format of a Loss Matrix.
A loss matrix could be developed for each generic ship type. Alternatively to the loss matrixes inTable B.1 a loss matrix could be presented based on initiating events. This type of screeninganalysis would suggest where to focus regulatory development. The hypothesis behind such anapproach would be that the potential for risk reduction is large where the risk is large. Whilst,intuitively appealing and correct in many cases, this approach cannot substitute a comprehensiveFSA.
Table B.1 Ship Accident Loss (£ per ship year)Accident Type Ship
At the end of Step 1, hazards are prioritised and scenarios ranked. Scenarios are typically thesequence of events from the initiating event up to the consequence, through the intermediatestages of the scenario development. (MSC/Circ.829 , paragraph 4.4.1).
If a scenario ranking is carried out, this ranking should, as far as practical, be consistent with therisk acceptance criteria. Note, however, that an FN diagram and a risk matrix commonly used forranking purposes do not use the same format, MSC/Circ.829 , Figure 3. The risk matrix is on theformat of fN diagram (probability of exactly N fatalities as opposed to N or more fatalities). Onlynegligible risk contributions should be excluded from further analysis.
To facilitate the ranking and validation of ranking (e.g. by the hazid team), it is generallyrecommended to define consequence and probability indices on a strictly logarithmic scale. Thereason for the logarithmic scale, is that
Risk = Probability x ConsequenceLog(Risk) = log (Probability) + log (Consequence)
A risk index may therefore be established by adding the probability/frequency and consequenceindices.
The following consequence index is suggested
Consequence IndexSI SEVERITY EFFECTS ON HUMAN SAFETY EFFECTS ON SHIP S
(Equivalentfatalities)
1 Minor Single or minor injuries Local equipment damage 0.012 Significant Multiple or severe injuries Non-severe ship damage 0.13 Severe Single fatality or multiple severe injuries Severe damage 14 Catastrophic Multiple fatalities Total loss 10
The following probability/frequency index is suggested. The wording is identical toMSC/Circ.829 , Figure 3.
Frequency IndexFI FREQUENCY DEFINITION F
(per ship year)7 Frequent Likely to occur once per month on one ship 105 Reasonably probable Likely to occur once per year in a fleet of 10 ships, i.e.
likely to occur a few times during the ship’s life0.1
3 Remote Likely to occur once per year in a fleet of 1000 ships, i.e.likely to occur in the total life of several similar ships
10-3
1 Extremely remote Likely to occur once in 10 years in a fleet of 1000 ships. 10-5
MSC 72/16ANNEX 3Page 2
I:\MSC\72\16.doc
By deciding to use a logarithmic scale, the Risk index for ranking purposes may be calculated as
RI = FI + SI
E.g. An event rated “remote” (FI=3) with severity “Significant” (SI=2) would have RI=5.
The risk matrix (risk indices in bold) suggested would be:
Negligible scenarios may thus be defined by comparison with the relevant FN-diagram.Furthermore, the ranking could be compared with known risks by observing that
Risk = Probability x ConsequenceRisk = 10(FI-6) x 10(SI-3) = 10 FI+RI-9 = 10 RI - 9
Risk = 10(RI-9)
This way the quality of the ranking could be verified against known risks, as a ranking willinvolve both unknown risks and risks that have been quantified in the past.


![SKJ Skipjack BET Bigeye tuna YFT Yellowfin tuna · SKJ. catches were . significantly higher [yearly average around . 9,000 t] A multi-specific fishery • 2006-2012: • SKJ. catches](https://static.documents.pub/doc/80x56/5e330b20da1b036ec55f05c3/skj-skipjack-bet-bigeye-tuna-yft-yellowfin-tuna-skj-catches-were-significantly.jpg)


![IMO - DNVresearch.dnv.com/skj/FSA-SAFEDOR/DangerousGoods/MSC87-INF... · 2009. 9. 12. · IMO. These FSAs systematically investigate the risk for generic ship types LNG carriers [24]](https://static.documents.pub/doc/80x56/60b5a2613d7b0f28596e5f02/imo-2009-9-12-imo-these-fsas-systematically-investigate-the-risk-for-generic.jpg)

