Defense Threat Reduction Agency 8725 John J. Kingman Road, MS-6201 Fort Belvoir, VA 22060-6201 Impact Analysis of Age on Fallout Fatality Estimations for IND Scenarios DISTRIBUTION A. Approved for public release; distribution is unlimited. November 2017 HDTRA1-14-0003; 0005 Prepared by: Applied Research Associates, Inc. 801 N. Quincy Street Suite 700 Arlington, VA 22203 DTRA-TR-18-005 TECHNICAL REPORT
Transcript
Defense Threat Reduction Agency 8725 John J. Kingman Road, MS-6201
Fort Belvoir, VA 22060-6201
Impact Analysis of Age on Fallout Fatality Estimations for IND Scenarios
DISTRIBUTION A. Approved for public release; distribution is unlimited.
November 2017
HDTRA1-14-0003; 0005
Prepared by:
Applied Research Associates, Inc. 801 N. Quincy Street
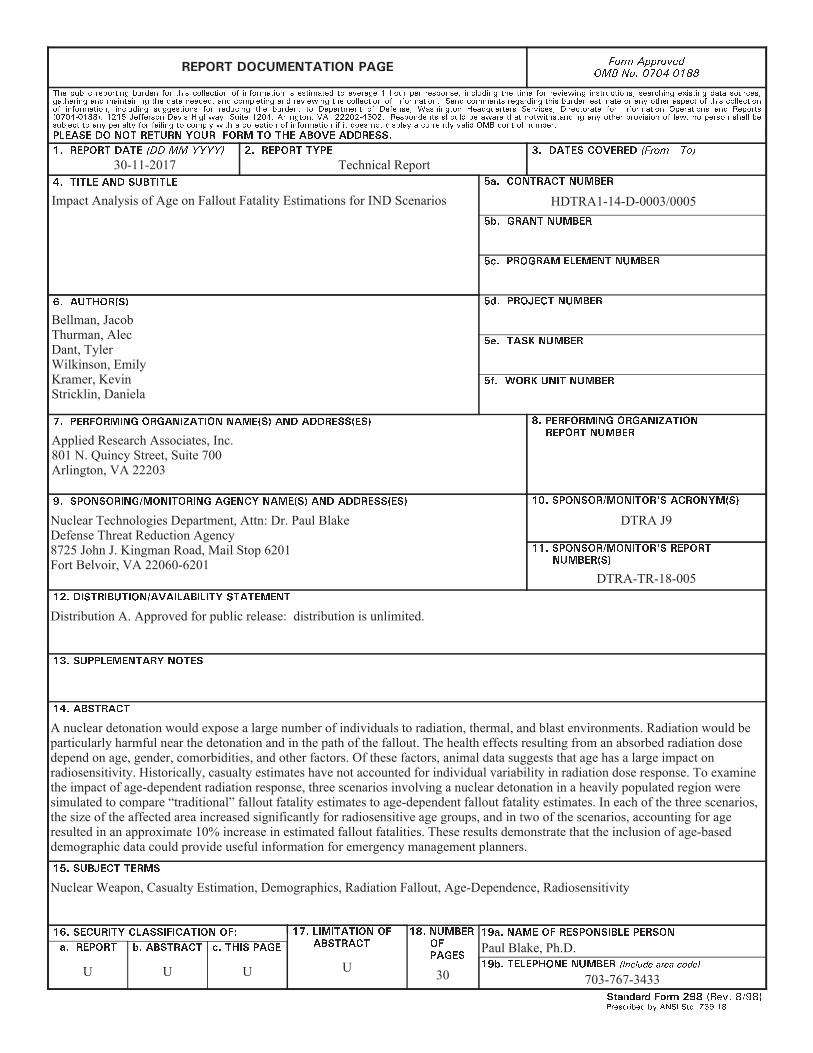
Applied Research Associates, Inc.801 N. Quincy Street, Suite 700Arlington, VA 22203
Nuclear Technologies Department, Attn: Dr. Paul BlakeDefense Threat Reduction Agency8725 John J. Kingman Road, Mail Stop 6201Fort Belvoir, VA 22060-6201
DTRA J9
DTRA-TR-18-005
Distribution A. Approved for public release: distribution is unlimited.
A nuclear detonation would expose a large number of individuals to radiation, thermal, and blast environments. Radiation would beparticularly harmful near the detonation and in the path of the fallout. The health effects resulting from an absorbed radiation dosedepend on age, gender, comorbidities, and other factors. Of these factors, animal data suggests that age has a large impact onradiosensitivity. Historically, casualty estimates have not accounted for individual variability in radiation dose response. To examinethe impact of age-dependent radiation response, three scenarios involving a nuclear detonation in a heavily populated region weresimulated to compare “traditional” fallout fatality estimates to age-dependent fallout fatality estimates. In each of the three scenarios,the size of the affected area increased significantly for radiosensitive age groups, and in two of the scenarios, accounting for ageresulted in an approximate 10% increase in estimated fallout fatalities. These results demonstrate that the inclusion of age-baseddemographic data could provide useful information for emergency management planners.
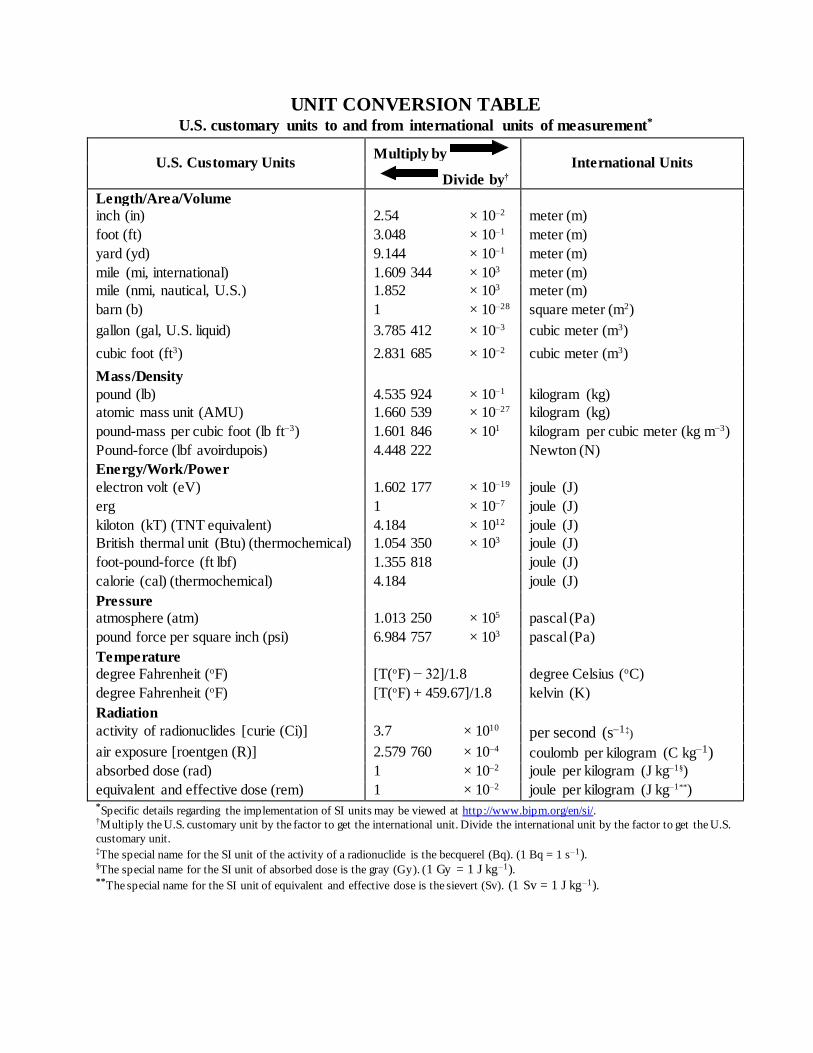
activity of radionuclides [curie (Ci)] 3.7 × 10¹⁰ per second (s–1‡)
air exposure [roentgen (R)] 2.579 760 × 10–4 coulomb per kilogram (C kg–1) absorbed dose (rad) 1 × 10⁻² joule per kilogram (J kg–1§)
equivalent and effective dose (rem) 1 × 10⁻² joule per kilogram (J kg–1**) *Specific details regarding the implementation of SI units may be viewed at http://www.bipm.org/en/si/. †Multiply the U.S. customary unit by the factor to get the international unit. Divide the international unit by the factor to get the U.S.
customary unit. ‡The special name for the SI unit of the activity of a radionuclide is the becquerel (Bq). (1 Bq = 1 s–1). §The special name for the SI unit of absorbed dose is the gray (Gy). (1 Gy = 1 J kg–1). **The special name for the SI unit of equivalent and effective dose is the sievert (Sv). (1 Sv = 1 J kg–1).
Section 7. Abbreviations, Acronyms and Symbols ...................................................................... 21
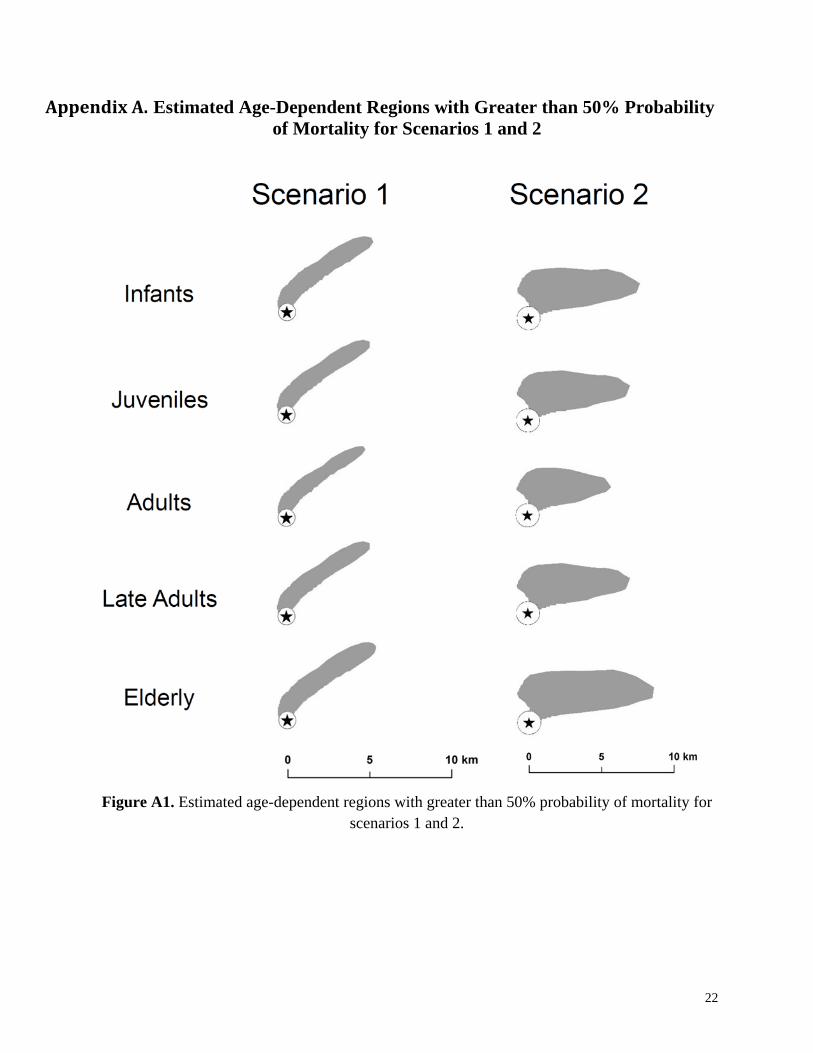
Appendix A. Estimated Age-Dependent Regions with Greater than 50% Probability of Mortality for Scenarios 1 and 2 ........................................................................................ 22
ii
List of Figures
Figure 1. General approach for age-dependent fallout fatality estimates. ...................................... 4
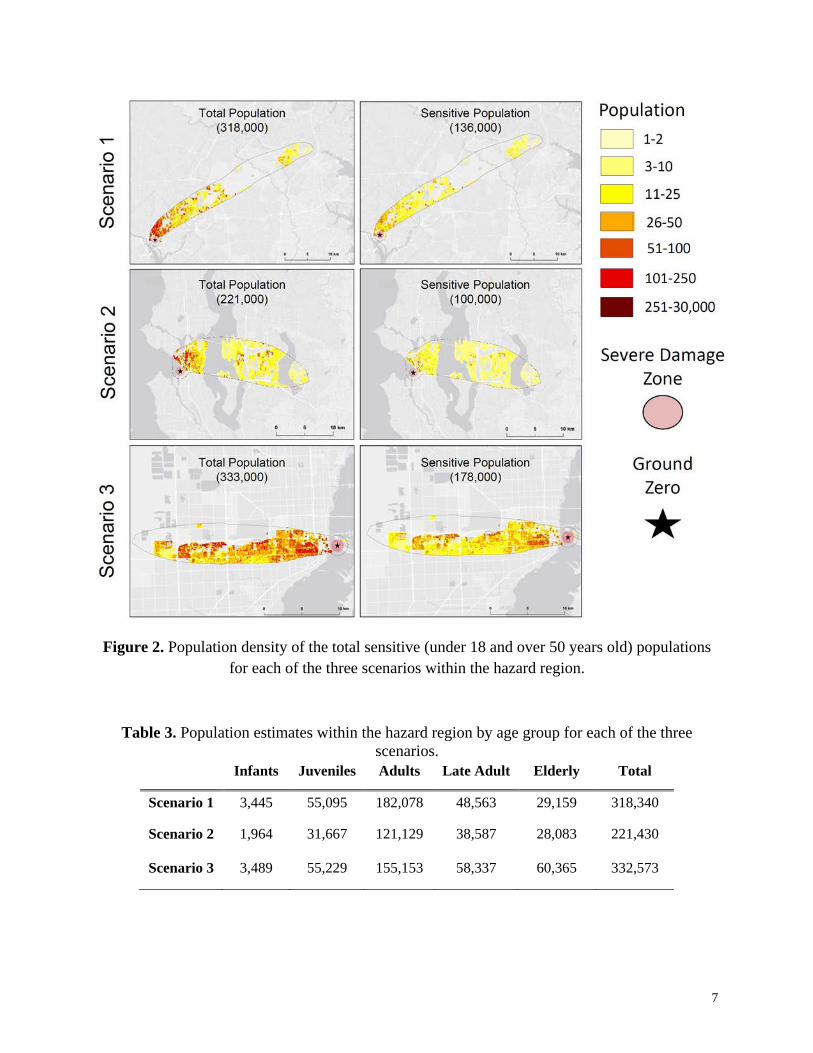
Figure 2. Population density of the total sensitive (under 18 and over 50 years old) populations for each of the three scenarios within the hazard region. ............................................ 7
Figure 3. Estimated effect of age on radiation sensitivity: (a) dose-response curves and (b) absolute difference of probability of mortality between sensitive age groups and adults. ........................................................................................................................... 9
Figure 4. Fallout EPDs for each of the three scenarios. ................................................................ 10
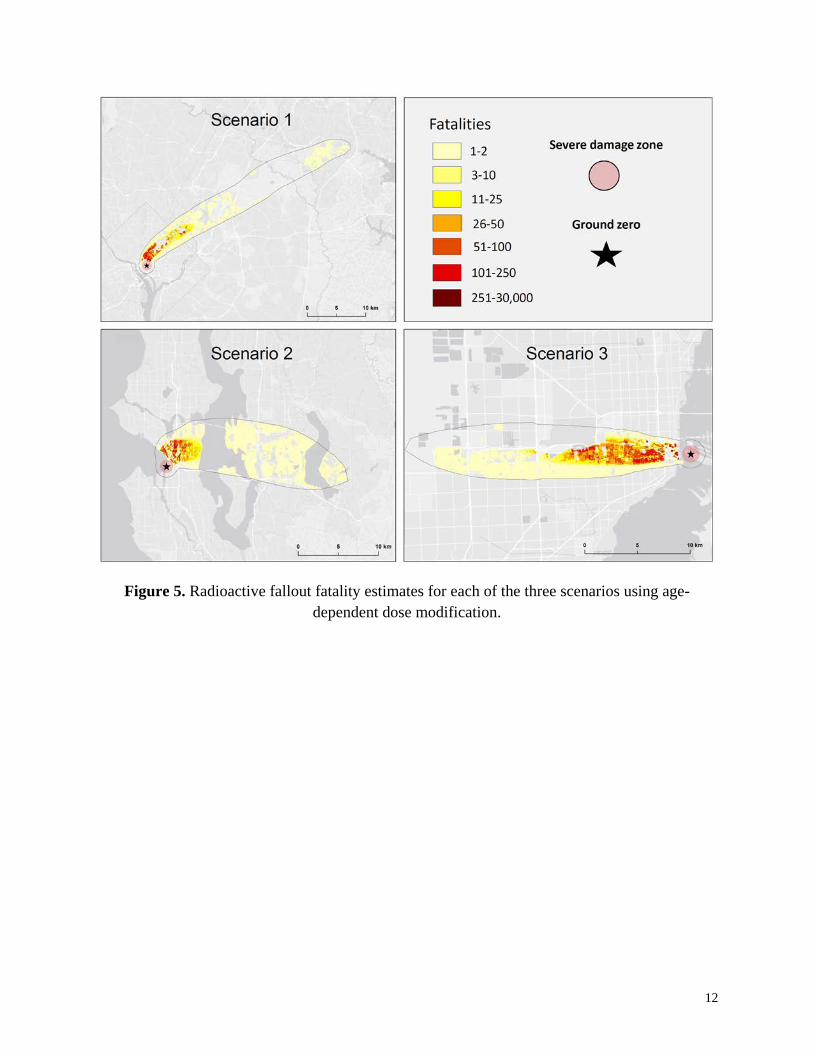
Figure 5. Radioactive fallout fatality estimates for each of the three scenarios using age-dependent dose modification. .................................................................................... 12
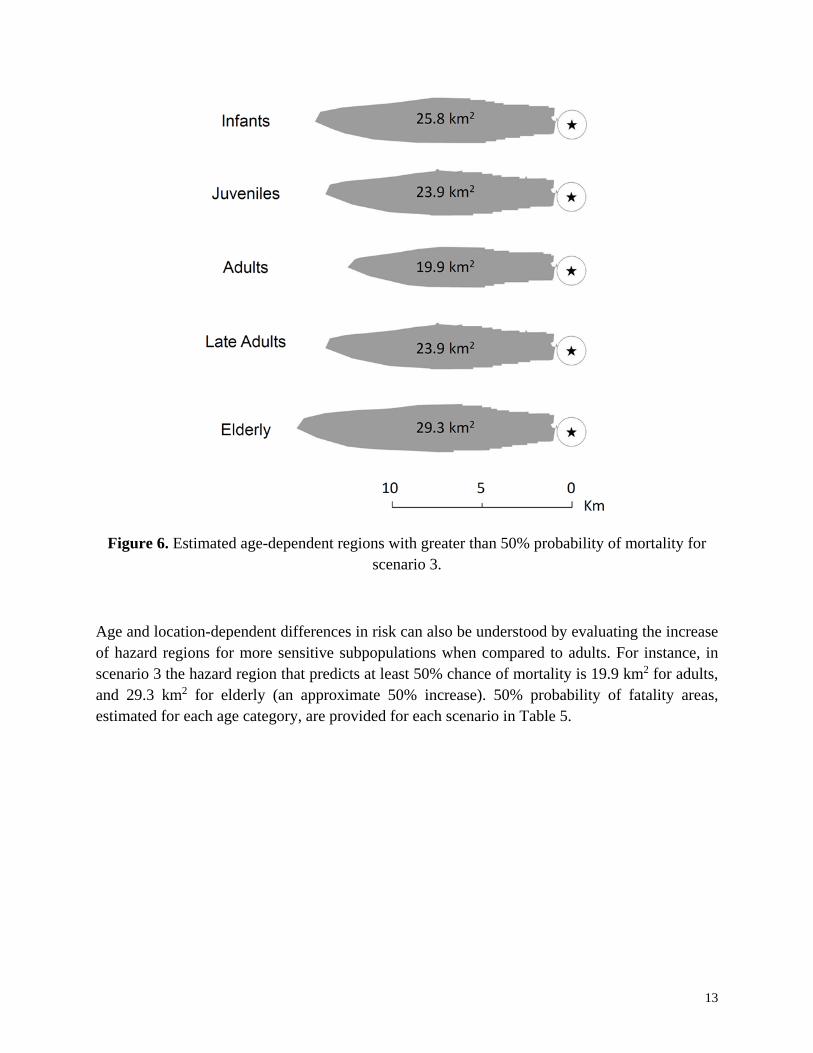
Figure 6. Estimated age-dependent regions with greater than 50% probability of mortality for scenario 3. .................................................................................................................. 13
Figure A1. Estimated age-dependent regions with greater than 50% probability of mortality for scenarios 1 and 2. ....................................................................................................... 22
iii
List of Tables
Table 1. Dose-modification factors for five age groups (Stricklin et al. 2017). ............................. 3
Table 2. Age mapping between the five age groups and the census age ranges. ............................ 6
Table 3. Population estimates within the hazard region by age group for each of the three scenarios. ..................................................................................................................... 7
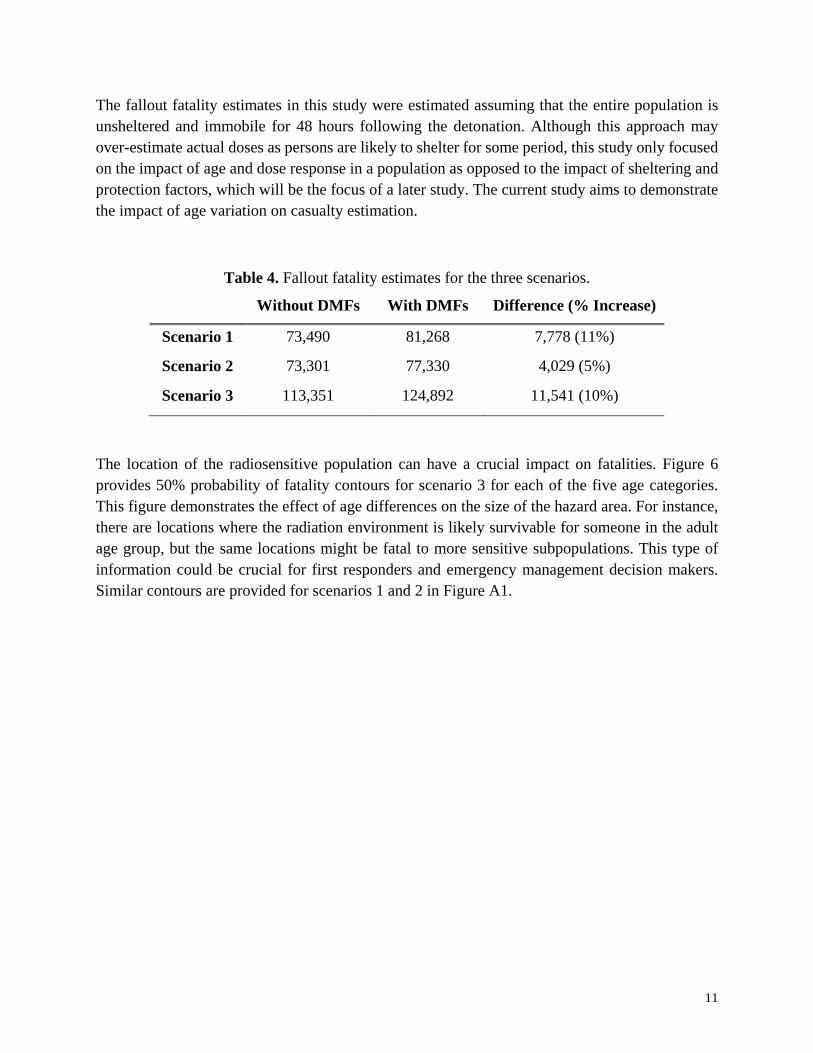
Table 4. Fallout fatality estimates for the three scenarios. ........................................................... 11
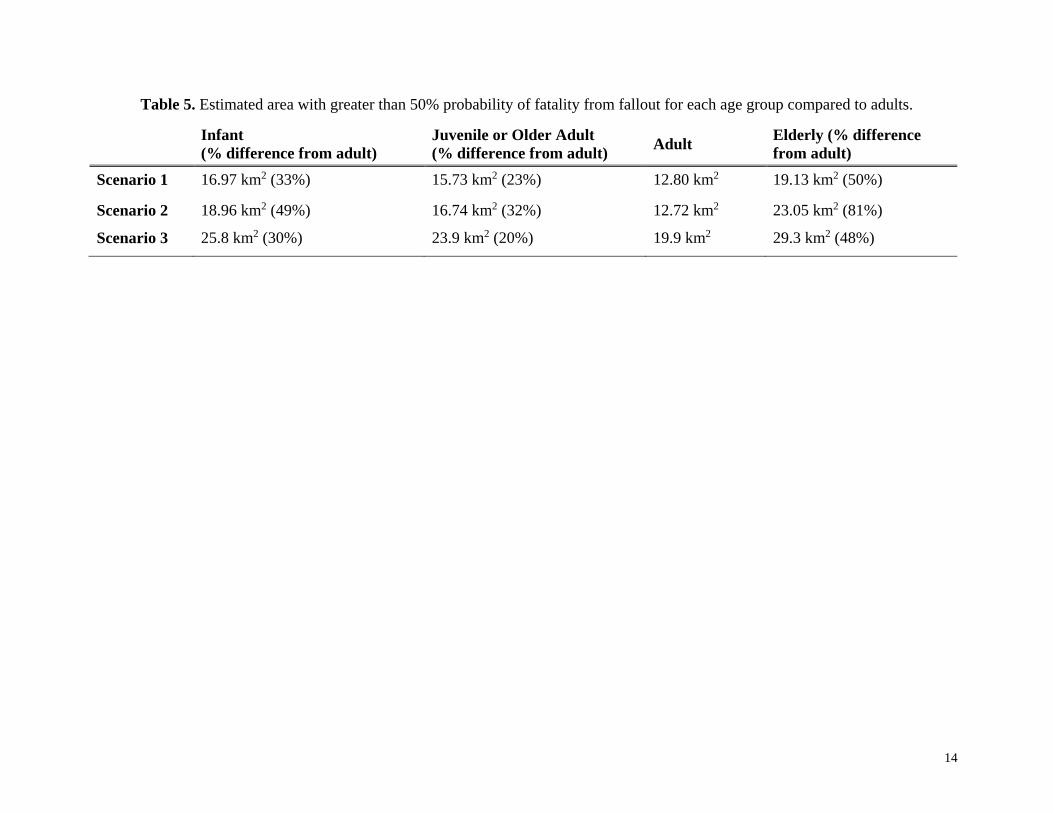
Table 5. Estimated area with greater than 50% probability of fatality from fallout for each age group compared to adults. .......................................................................................... 14
iv
Acknowledgements The authors would like to gratefully acknowledge Dr. Paul Blake of DTRA J9 for programmatic support on this project. This work was performed under DTRA contract HDTRA1-14-D-0003; 0005.
1
Executive Summary
Currently, casualty estimation tools for nuclear detonation scenarios don’t account for differences in demographics such as age, gender, genetic differences and comorbidities. Each of these factors contributes to individual susceptibility to nuclear weapon environments (radiation, thermal, blast). In this study, the impact of age difference was considered for casualty estimations for improvised nuclear device (IND) scenarios. In particular, the impact of age-dependent radiosensitivity on fallout fatalities was evaluated for three notional case studies.
Previously, animal data were analyzed to develop dose-modification factors (DMFs) for five age groups (infant, juvenile, adult, late adult, and elderly). The analysis provided in this report utilizes these values to produce fallout fatality estimates for scenarios located in three heavily populated US cities. In two of these scenarios, fallout fatality estimates increased by about 10% when accounting for age differences. In all three scenarios, a significant change was observed in the size of the hazard contours per age group. This information can be critical in effective planning for response to a nuclear detonation.
2
Section 1. Introduction
1.1 Background
A nuclear weapon detonation could have a catastrophic impact on a heavily populated area. This scenario is of increasing concern in a time when nuclear weapons have become a crucial influence in international relationships (Frühling and O’Neil 2017; MacKenzie 2017; Merom 2017; Mishra 2017) and nuclear terrorism is recognized as a serious global threat (UN 2007; Bunn et al. 2016; WH 2016). To evaluate and supplement preparedness for an event of this nature, US federal agencies have invested in medical and emergency management preparation research (Daugherty et al. 1986; Waller et al. 2009; Archibald and Buddemeier 2010; EOP 2010; Gorman et al. 2010; Broga 2011; Levy 2016). This type of analysis is dependent on detailed modeling and simulation tools that estimate nuclear weapon environments and health effects resulting from these hazards. Accurate casualty estimations are critical for effective planning for nuclear detonation scenarios. As a result, casualty analysis tools impact decisions on medical resource needs, response plans, and research.
1.2 Nuclear weapon environments and exposures
Hazardous environments produced by a nuclear detonation include prompt radiation, thermal radiation, blast and shock waves, secondary fires, and radioactive fallout (Glasstone and Dolan 1977; NATO 1996). The range and magnitude of each of these hazardous environments depends on many factors including the weapon design and height of burst (HOB), weather, building structures, etc. (Glasstone and Dolan 1977). In an urban setting, these environments can cause a diverse range of injuries and result in numerous fatalities.
An improvised nuclear device (IND) is a type of nuclear weapon that is likely to be used in a targeted manner (Buddemeier and Dillon 2009; Gorman et al. 2010; NATO 2010). An IND may come in the form of a relatively small yield weapon (<10 kT) detonated near the ground. In this event, the prompt environments would travel a relatively short distance compared to a higher yield and/or a higher HOB. Nuclear fallout from a ground-burst IND can pose a significant threat to public safety, depending on population distribution with respect to the path of the nuclear fallout. Fallout-related fatalities resulting from an IND scenario are the main focus of this study.
1.3 Age-dependence on radiation dose response
Many factors contribute to an individual’s sensitivity to radiation including age, sex, genetic disposition, health status, etc. (ICRP 1998; DiCarlo et al. 2011; Stricklin and Millage 2012). In a separate study (Stricklin et al. 2017), the age-dependent radiation dose response for acute effects was evaluated in detail. The analysis included data from animal studies, radiation oncology, and other sources of human radiation exposure. A number of animal studies have estimated age-dependence of radiation dose response using the dose that is lethal to 50% of the population (LD50)
3
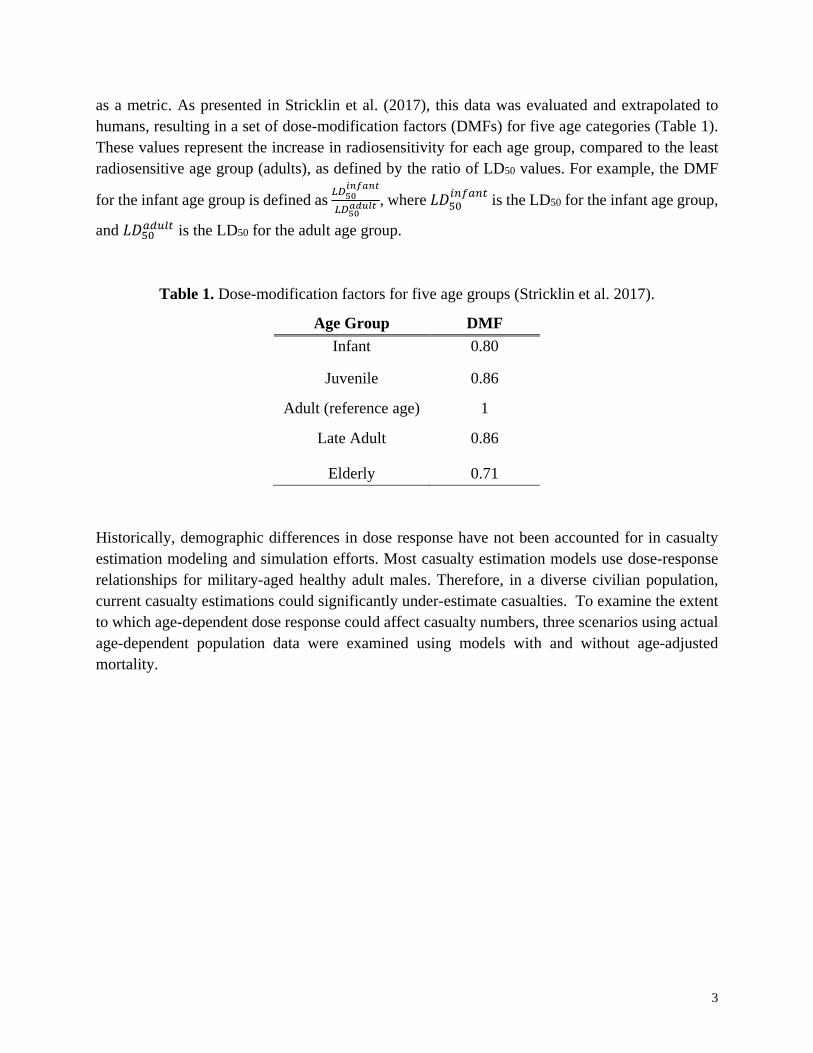
as a metric. As presented in Stricklin et al. (2017), this data was evaluated and extrapolated to humans, resulting in a set of dose-modification factors (DMFs) for five age categories (Table 1). These values represent the increase in radiosensitivity for each age group, compared to the least radiosensitive age group (adults), as defined by the ratio of LD50 values. For example, the DMF
for the infant age group is defined as 𝐿𝐿𝐿𝐿50𝑖𝑖𝑖𝑖𝑖𝑖𝑖𝑖𝑖𝑖𝑖𝑖
𝐿𝐿𝐿𝐿50𝑖𝑖𝑎𝑎𝑎𝑎𝑎𝑎𝑖𝑖 , where 𝐿𝐿𝐿𝐿50
𝑖𝑖𝑖𝑖𝑖𝑖𝑖𝑖𝑖𝑖𝑖𝑖 is the LD50 for the infant age group,
and 𝐿𝐿𝐿𝐿50𝑖𝑖𝑎𝑎𝑎𝑎𝑎𝑎𝑖𝑖 is the LD50 for the adult age group.
Table 1. Dose-modification factors for five age groups (Stricklin et al. 2017).
Age Group DMF Infant 0.80
Juvenile 0.86
Adult (reference age) 1
Late Adult 0.86
Elderly 0.71
Historically, demographic differences in dose response have not been accounted for in casualty estimation modeling and simulation efforts. Most casualty estimation models use dose-response relationships for military-aged healthy adult males. Therefore, in a diverse civilian population, current casualty estimations could significantly under-estimate casualties. To examine the extent to which age-dependent dose response could affect casualty numbers, three scenarios using actual age-dependent population data were examined using models with and without age-adjusted mortality.
4
Section 2. Methods
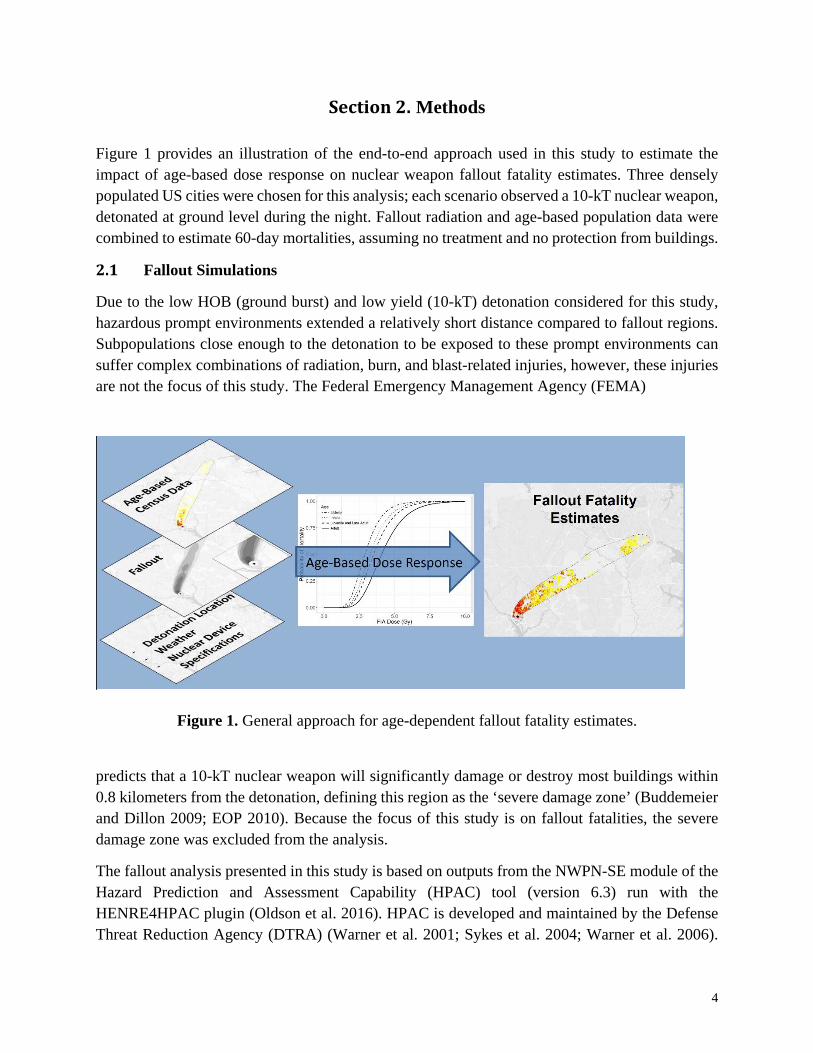
Figure 1 provides an illustration of the end-to-end approach used in this study to estimate the impact of age-based dose response on nuclear weapon fallout fatality estimates. Three densely populated US cities were chosen for this analysis; each scenario observed a 10-kT nuclear weapon, detonated at ground level during the night. Fallout radiation and age-based population data were combined to estimate 60-day mortalities, assuming no treatment and no protection from buildings.
2.1 Fallout Simulations
Due to the low HOB (ground burst) and low yield (10-kT) detonation considered for this study, hazardous prompt environments extended a relatively short distance compared to fallout regions. Subpopulations close enough to the detonation to be exposed to these prompt environments can suffer complex combinations of radiation, burn, and blast-related injuries, however, these injuries are not the focus of this study. The Federal Emergency Management Agency (FEMA)
Figure 1. General approach for age-dependent fallout fatality estimates.
predicts that a 10-kT nuclear weapon will significantly damage or destroy most buildings within 0.8 kilometers from the detonation, defining this region as the ‘severe damage zone’ (Buddemeier and Dillon 2009; EOP 2010). Because the focus of this study is on fallout fatalities, the severe damage zone was excluded from the analysis.
The fallout analysis presented in this study is based on outputs from the NWPN-SE module of the Hazard Prediction and Assessment Capability (HPAC) tool (version 6.3) run with the HENRE4HPAC plugin (Oldson et al. 2016). HPAC is developed and maintained by the Defense Threat Reduction Agency (DTRA) (Warner et al. 2001; Sykes et al. 2004; Warner et al. 2006).
5
The hazardous fallout area was predicted using HPAC’s atmospheric transport models paired with historical weather, chosen from HPAC’s historical weather database, for each of the three scenarios. The outputs from HPAC used in this analysis include 10% probability of casualty contours and time-dependent dose rates from fallout materials. HPAC’s 10% casualty contour, corresponding to approximately 0.85 Gy, was used to place an outer boundary on the analysis region. Outside of this region, full recovery is expected without medical intervention for all ages. Groundshine effective dose rates reported from HPAC were acquired at 15 minute intervals for various locations within the hazard region. Air submersion dose was not considered in this study because it contributes an extremely small dose compared to the groundshine dose (less than 1%).
2.2 Population distribution and dynamics
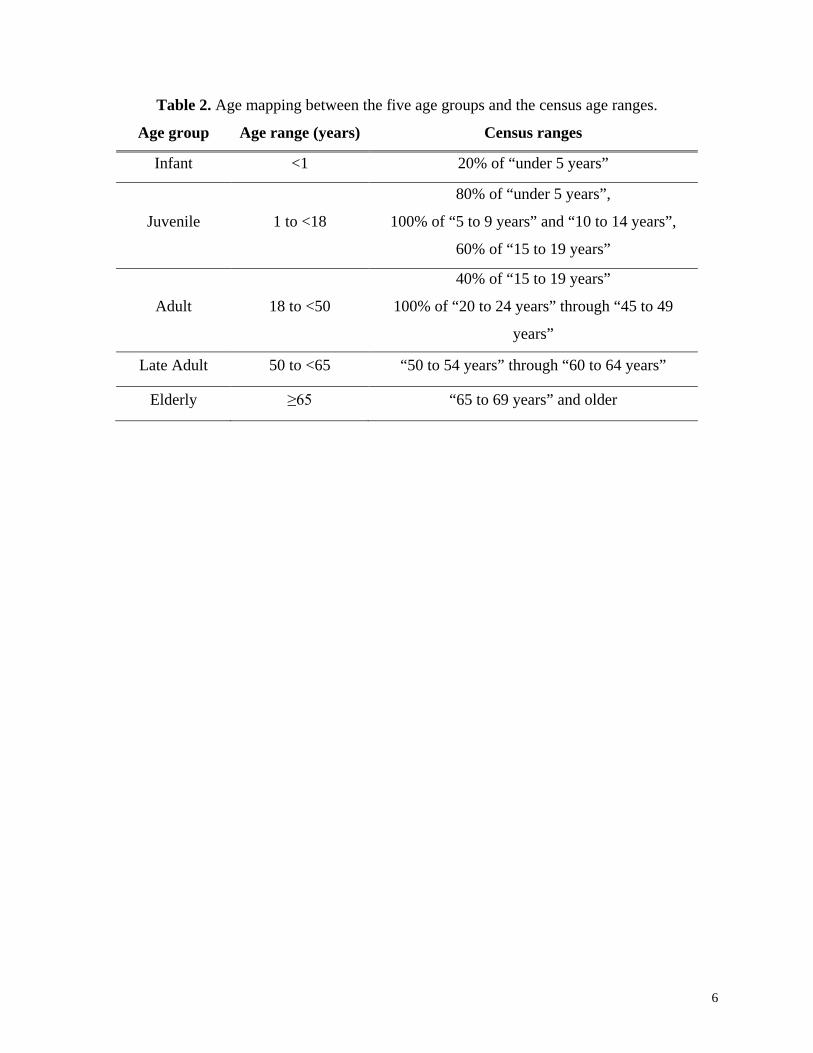
Casualties and fatalities depend on the geospatial density and distribution of the population around the detonation, building structures, and other obstructions. This study only considers a worst case scenario, where the entire population is assumed to be unsheltered for 48 hours following the detonation. Population data for this study were collected from various sources including the 2010 US Census database and LandScan 2012, which is based on 2010 US Census data (Census 2010; LandScan 2012). Demographic data collected by the Census Bureau includes the number of individuals in five year age bins for each census tract, labeled as: “Under 5 years”, “5 to 9 years”, …, “80 to 84 years” and “85 years and over”. To estimate the percentage of the population in each of the five categories established for the current study (Table 1), the percentage of the population in each census age group was mapped to the five age categories as provided in Table 2 (total estimates are provided in Table 3). Figure 2 presents the population density contained in the hazard region for each scenario. The sensitive populations (under 18 and over 50 years old) are also explicitly shown.
6
Table 2. Age mapping between the five age groups and the census age ranges.
Age group Age range (years) Census ranges
Infant <1 20% of “under 5 years”
Juvenile 1 to <18
80% of “under 5 years”,
100% of “5 to 9 years” and “10 to 14 years”,
60% of “15 to 19 years”
Adult 18 to <50
40% of “15 to 19 years”
100% of “20 to 24 years” through “45 to 49
years”
Late Adult 50 to <65 “50 to 54 years” through “60 to 64 years”
Elderly ≥65 “65 to 69 years” and older
7
Figure 2. Population density of the total sensitive (under 18 and over 50 years old) populations for each of the three scenarios within the hazard region.
Table 3. Population estimates within the hazard region by age group for each of the three scenarios.
In this study, open-field fallout radiation fatality estimates were used to measure the impact of a nuclear weapon on a densely populated region. An empirically-developed probit model (Levin et al. 1992; Anno et al. 2003) has been utilized to estimate the probability of 60-day mortality (assuming no treatment) for acute radiation exposure. This model has been adapted to account for protracted fallout radiation exposures and age-based differences in dose response. Each of these model attributes are described in the following paragraphs.
The equivalent prompt dose (EPD) for any dose-rate function is the uniquely defined prompt dose that has the same effect on cellular damage as the dose-rate function (Morris et al. 1994; Jones et al. 1996). In the current study, MarCellTM was used to convert all fallout dose-rate functions reported by HPAC to EPDs. MarCellTM is a mathematical model that simulates the time-dependent kinetics of bone marrow cell damage, repair, and recovery in response to radiation exposure (Jones et al. 1991; Morris et al. 1991; Jones et al. 1993; Morris et al. 1993; Hasan et al. 1997).
A dose-response function for 60-day mortality as established by the DOD Human Response Panel (2000-2002) was used in the current study (Levin et al. 1992; Anno et al. 2003; Stricklin et al. 2016). The basis for the LD50 of this dose response were young adult atomic bomb survivors (mean 22.4, median 20 and 90-percentile of 26 years old). Therefore, this LD50 is used to represent the reference adult group (18 to 50 years old) in the current study. Age-dependence on dose response has been investigated in Stricklin et al. (2017), where age-based dose modification was estimated. The DMF values estimated by Stricklin et al. represent the relative change in LD50 for four age categories compared to the most radioresistant ‘adult’ group (Table 1). In the current study, these values are applied to the dose-response function to modify the probability of mortality as documented in Oldson et al. (2015). Specifically, given an EPD and an age group (A), the probability of lethality is defined as
𝑝𝑝𝐿𝐿𝐴𝐴(𝐸𝐸𝐸𝐸𝐿𝐿) = Ф(𝛽𝛽 log10𝐸𝐸𝐸𝐸𝐿𝐿/𝐿𝐿𝐷𝐷𝐷𝐷𝐴𝐴
𝐿𝐿𝐿𝐿50)
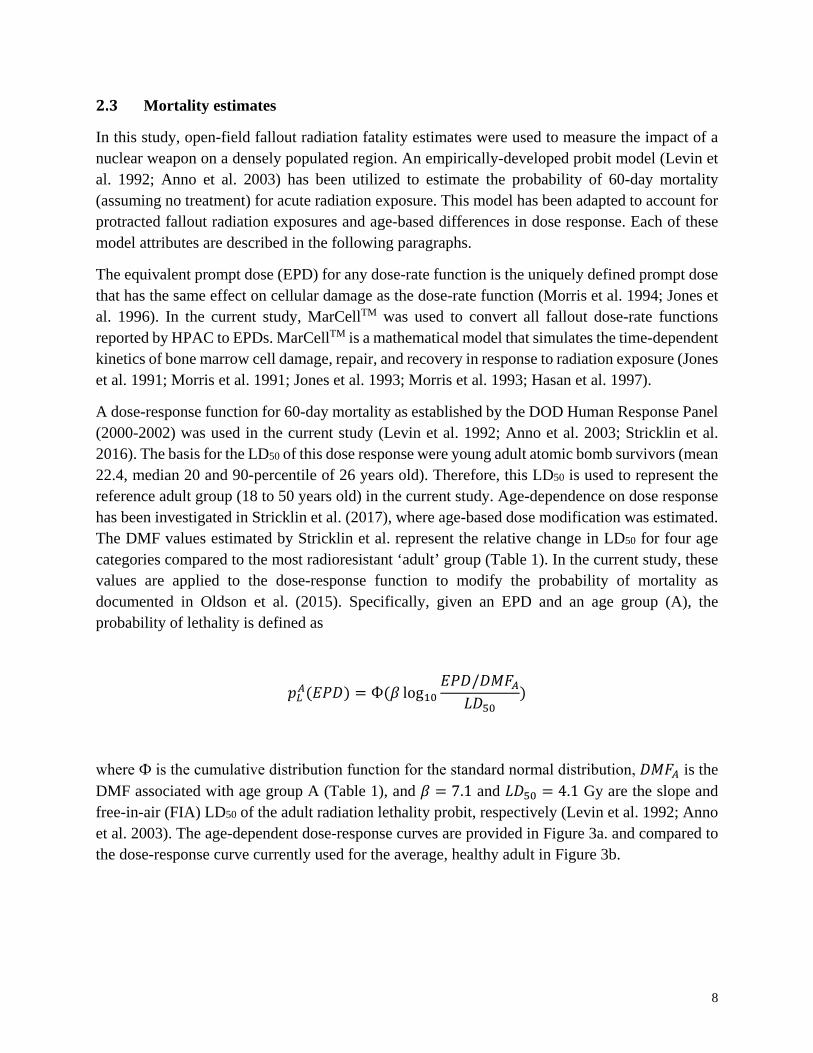
where Ф is the cumulative distribution function for the standard normal distribution, 𝐿𝐿𝐷𝐷𝐷𝐷𝐴𝐴 is the DMF associated with age group A (Table 1), and 𝛽𝛽 = 7.1 and 𝐿𝐿𝐿𝐿50 = 4.1 Gy are the slope and free-in-air (FIA) LD50 of the adult radiation lethality probit, respectively (Levin et al. 1992; Anno et al. 2003). The age-dependent dose-response curves are provided in Figure 3a. and compared to the dose-response curve currently used for the average, healthy adult in Figure 3b.
9
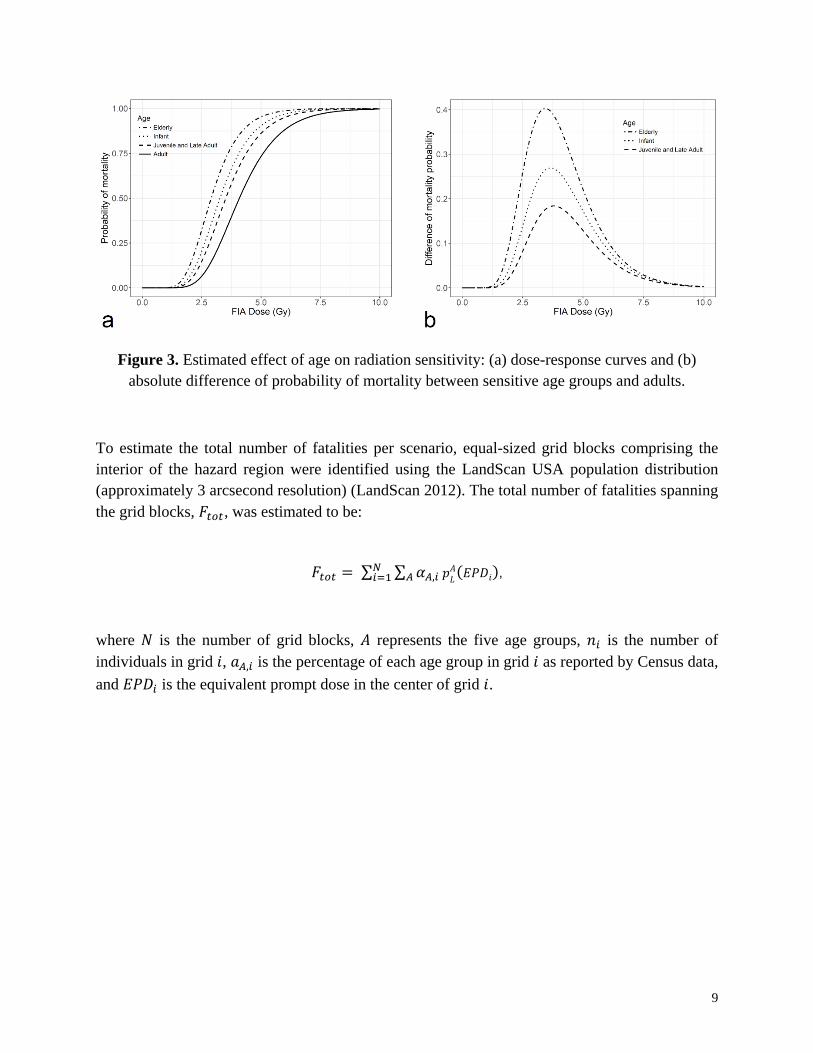
Figure 3. Estimated effect of age on radiation sensitivity: (a) dose-response curves and (b) absolute difference of probability of mortality between sensitive age groups and adults.
To estimate the total number of fatalities per scenario, equal-sized grid blocks comprising the interior of the hazard region were identified using the LandScan USA population distribution (approximately 3 arcsecond resolution) (LandScan 2012). The total number of fatalities spanning the grid blocks, 𝐷𝐷𝑖𝑖𝑡𝑡𝑖𝑖, was estimated to be:
𝐷𝐷𝑖𝑖𝑡𝑡𝑖𝑖 = ∑ ∑ 𝛼𝛼𝐴𝐴,𝑖𝑖𝐴𝐴𝑁𝑁𝑖𝑖=1 𝑝𝑝𝐿𝐿
𝐴𝐴(𝐸𝐸𝐸𝐸𝐿𝐿𝑖𝑖),
where 𝑁𝑁 is the number of grid blocks, 𝐴𝐴 represents the five age groups, 𝑛𝑛𝑖𝑖 is the number of individuals in grid 𝑖𝑖, 𝑎𝑎𝐴𝐴,𝑖𝑖 is the percentage of each age group in grid 𝑖𝑖 as reported by Census data, and 𝐸𝐸𝐸𝐸𝐿𝐿𝑖𝑖 is the equivalent prompt dose in the center of grid 𝑖𝑖.
10
Section 3. Results
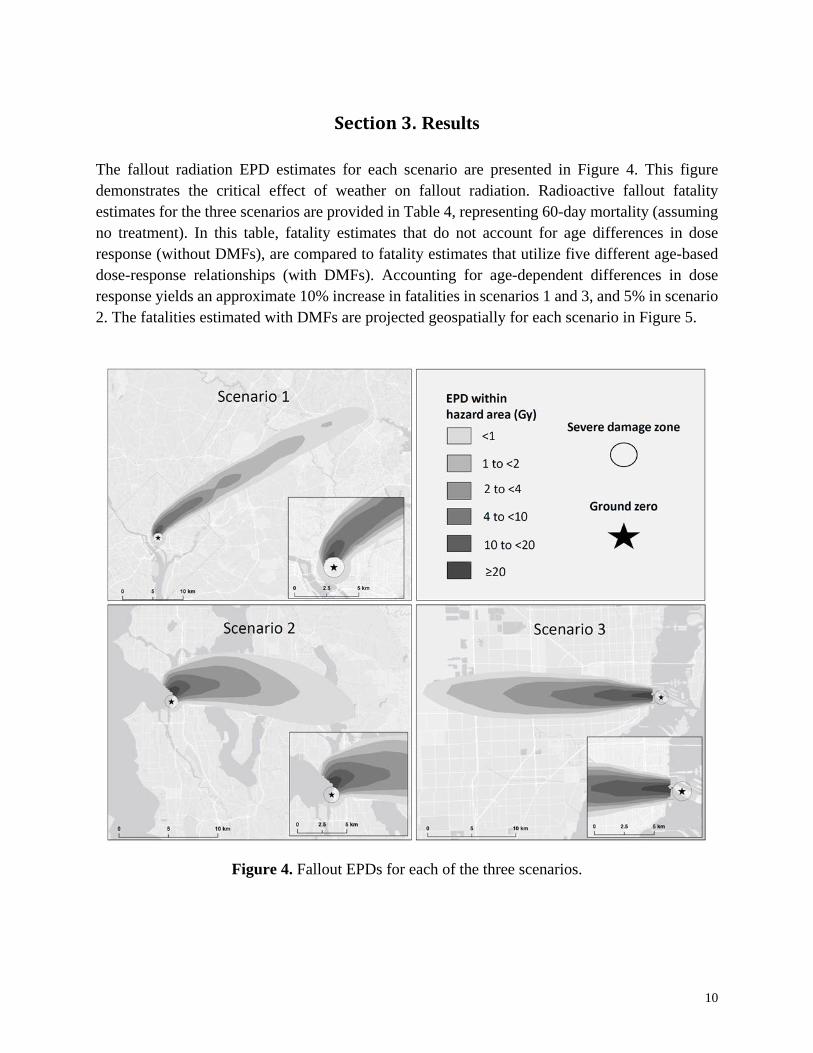
The fallout radiation EPD estimates for each scenario are presented in Figure 4. This figure demonstrates the critical effect of weather on fallout radiation. Radioactive fallout fatality estimates for the three scenarios are provided in Table 4, representing 60-day mortality (assuming no treatment). In this table, fatality estimates that do not account for age differences in dose response (without DMFs), are compared to fatality estimates that utilize five different age-based dose-response relationships (with DMFs). Accounting for age-dependent differences in dose response yields an approximate 10% increase in fatalities in scenarios 1 and 3, and 5% in scenario 2. The fatalities estimated with DMFs are projected geospatially for each scenario in Figure 5.
Figure 4. Fallout EPDs for each of the three scenarios.
11
The fallout fatality estimates in this study were estimated assuming that the entire population is unsheltered and immobile for 48 hours following the detonation. Although this approach may over-estimate actual doses as persons are likely to shelter for some period, this study only focused on the impact of age and dose response in a population as opposed to the impact of sheltering and protection factors, which will be the focus of a later study. The current study aims to demonstrate the impact of age variation on casualty estimation.
Table 4. Fallout fatality estimates for the three scenarios.
Without DMFs With DMFs Difference (% Increase)
Scenario 1 73,490 81,268 7,778 (11%)
Scenario 2 73,301 77,330 4,029 (5%)
Scenario 3 113,351 124,892 11,541 (10%)
The location of the radiosensitive population can have a crucial impact on fatalities. Figure 6 provides 50% probability of fatality contours for scenario 3 for each of the five age categories. This figure demonstrates the effect of age differences on the size of the hazard area. For instance, there are locations where the radiation environment is likely survivable for someone in the adult age group, but the same locations might be fatal to more sensitive subpopulations. This type of information could be crucial for first responders and emergency management decision makers. Similar contours are provided for scenarios 1 and 2 in Figure A1.
12
Figure 5. Radioactive fallout fatality estimates for each of the three scenarios using age-dependent dose modification.
13
Figure 6. Estimated age-dependent regions with greater than 50% probability of mortality for scenario 3.
Age and location-dependent differences in risk can also be understood by evaluating the increase of hazard regions for more sensitive subpopulations when compared to adults. For instance, in scenario 3 the hazard region that predicts at least 50% chance of mortality is 19.9 km2 for adults, and 29.3 km2 for elderly (an approximate 50% increase). 50% probability of fatality areas, estimated for each age category, are provided for each scenario in Table 5.
14
Table 5. Estimated area with greater than 50% probability of fatality from fallout for each age group compared to adults.
Infant (% difference from adult)
Juvenile or Older Adult (% difference from adult) Adult Elderly (% difference
from adult) Scenario 1 16.97 km2 (33%) 15.73 km2 (23%) 12.80 km2 19.13 km2 (50%)
Scenario 2 18.96 km2 (49%) 16.74 km2 (32%) 12.72 km2 23.05 km2 (81%)
Scenario 3 25.8 km2 (30%) 23.9 km2 (20%) 19.9 km2 29.3 km2 (48%)
15
Section 4. Discussion
4.1 Medical and emergency management preparedness
Emergency management procedures and protocols for a nuclear detonation scenario are informed by best estimates of the scenario details (Bell and Dallas 2007). This type of information is gathered from simulations and national exercises conducted by federal agencies (Buddemeier 2010; EOP 2010; Broga 2011), which are limited by the accuracy of the modeling tools used. For this reason, modeling and simulation tools are continuously evaluated and improved to ensure estimates are as realistic as possible.
Historically, nuclear weapon casualty estimation tools have not considered subpopulation variability. The current study has focused on the vulnerability of particular demographic subpopulations by evaluating the impact of dose response of different age groups. Casualty contours provided by the three scenarios demonstrated that the size of hazard regions could change dramatically for different age groups. This additional layer of information can provide medical responders with valuable insight for response and logistics. Understanding which populations are more sensitive and where these subpopulations reside (such as daycare centers, schools, nursing homes, etc.) may factor into emergency response plans.
This study considers age-based differences in dose response and demonstrates that 60-day fallout fatalities may be underestimated when using standard analyses that assume an adult dose response for an entire population. Fatality estimates are primarily comprised of individuals who receive an EPD radiation dose above approximately 2 Gy (FIA) (Figure 3a). At the lower end of this potentially fatal dose range, medical treatment could be life-saving. Therefore, improving dose-response estimates and subsequent casualty estimates has the potential to impact decisions regarding response protocols and the Strategic National Stockpile, which has medical supplies and countermeasures that can be used in nuclear detonation scenarios (Waselenko et al. 2004).
4.2 Limitations
This study provides valuable qualitative insight on the potential impact of age on casualty estimations. However, assumptions and limitations restrict the quantitative precision of the estimates derived here. For instance, in each of the presented scenarios there is uncertainty associated with the dose distributions for the affected population due to uncertainty and imprecisions in fallout estimates. This challenge is inherent to casualty estimations considering the many complicated factors involved with estimating weather patterns, plume dynamics, and radiation transport.
Another challenge of nuclear weapon casualty estimation is predicting how a population will respond. In the best-case scenario, all individuals will shelter in place for at least 24 hours, optimizing their protection, thus minimizing their absorbed radiation dose (Kearny and Mims
16
1987; Archibald and Buddemeier 2010; Buddemeier 2010; Levy 2016). Emergency management planning is prepared to broadcast precautions to a population following a nuclear weapon incident (Buddemeier 2010). Unfortunately, it is unlikely that the entire population will receive the targeted messages. Furthermore, it is possible that many who receive emergency communications will not adhere to suggested protocols. Although the current study focused on a worst case scenario where the entire population is assumed to be unsheltered, a future effort is planned to examine the effects of time-dependent building protection factors on casualty estimations.
An additional limitation of this study is the type of the population data available. Census data provides detailed age distribution data, but is limited to nighttime-based statistics. Commute data can be used to infer daytime estimates (Bell and Dallas 2007; Dallas and Bell 2007), but this type of analysis was beyond the scope of the current study.
For simplicity, the current study focused only on fallout fatalities to demonstrate the potential impact of age on casualty estimates. However, it is likely that age will have an even greater overall impact on casualty estimates when accounting for prompt fatalities as well as injuries derived from prompt and fallout environments. Furthermore, it is expected that accounting for additional demographic groups will have an impact on casualty estimates. This includes, but is not limited to groupings based on gender, comorbidities, and genetic disposition.
17
Section 5. Future Work
Analysis provided by the current study suggests that age-variability in dose response can have an impact on fatality estimates. Although the increase of fallout fatality estimates for the three scenarios was moderate, it is expected that this impact would be significantly greater if they were applied to combined injuries as well. Unfortunately, detailed dose-response data for combined injuries is not currently available, and future work towards this effort is warranted.
The current study focused on the impact of age on casualty estimates, but additional demographic variability is expected to affect casualty estimates. Research on demographic categories other than age (gender, co-morbidities, genetic susceptibility, etc.) is limited, but could have significant value for casualty estimations. Further investigation of these demographic factors is warranted to determine which factors will significantly impact current casualty estimates and whether they should be included in hazard prediction and medical assessment tools.
18
Section 6. References
Anno GH, Young RW, Bloom RM, Mercier JR. Dose response relationships for acute ionizing-radiation lethality. Health Phys 84: 565-75; 2003. DOI:10.1097/00004032-200305000-00001.
Archibald E, Buddemeier B. Nuclear fallout decision aid for first responders. Livermore, CA: Lawrence Livermore National Laboratory; 2010.
Bell WC, Dallas CE. Vulnerability of populations and the urban health care systems to nuclear weapon attack–examples from four American cities. Int J Health Geogr 6: 5; 2007. DOI:10.1186/1476-072X-6-5.
Broga D. Responding to a Radiological or Nuclear Terrorism Incident: A Guide for Decision Makers. Med Phys 38: 5831-5831; 2011. DOI:10.1118/1.3639117.
Buddemeier B. Reducing the consequences of a nuclear detonation: recent research and guidance. Livermore, CA: Lawrence Livermore National Laboratory; 2010.
Buddemeier B, Dillon M. Key response planning factors for the aftermath of nuclear terrorism. Livermore, CA: Lawrence Livermore National Laboratory; 2009.
Dallas CE, Bell WC. Prediction modeling to determine the adequacy of medical response to urban nuclear attack. Disaster Med Public Health Prep 1: 80-89; 2007. DOI:10.1097/DMP.0b013e318159a9e3.
Daugherty W, Levi B, Hippel F. Casualties due to the blast, heat, and radioactive fallout from various hypothetical nuclear attacks on the United States. In: RQ Marstons ed. The Medical Implications of Nuclear War. National Academy Press, Washington, D.C.: The National Academy of Sciences; 1986: 207-232.
DiCarlo AL, Maher C, Hick JL, Hanfling D, Dainiak N, Chao N, Bader JL, Coleman CN, Weinstock DM. Radiation injury after a nuclear detonation: medical consequences and the need for scarce resources allocation. Disaster Med Public Health Prep 5 Suppl 1: S32-44; 2011. DOI:10.1001/dmp.2011.17.
Executive Office of the President Homeland Security Council Interagency Policy. Planning Guidance for Response to a Nuclear Detonation. National Security Staff Interagency Policy Coordination Subcommittee for Preparedness & Response to Radiological and Nuclear Threats; 2010.
Frühling S, O’Neil A. Nuclear weapons, the United States and alliances in Europe and Asia: Toward an institutional perspective. Contemporary Security Policy 38: 4-25; 2017. DOI:10.1080/13523260.2016.1257214.
Glasstone S, Dolan PJ. The effects of nuclear weapons. Department of Defense; TID-28061; TRN: 78-014841; 1977.
Gorman C, Crawford S, McGuire E, Smith D, Johnson M, Ponikvar D, Jordan P, Buddemeier B, Riland C. DHS Strategy for Improving the National Response and Recovery from an IND Attack. Department of Homeland Security; 2010.
Hasan J, Jones T, Morris M. MarCell™ software for modeling bone marrow radiation cell kinetics. Med Phys 24: 1793-1796; 1997. DOI:10.1118/1.597945.
International Commission on Radiological Protection. Genetic susceptibility to cancer: ICRP Publication 79. Ann ICRP 28; 1998. DOI:10.1016/S0146-6435(98)00007-3.
19
Jones D, Morris MD, Hasan JS. Modeling marrow damage from response data: evolution from radiation biology to benzene toxicity. Environ Health Perspect 104: 1293; 1996. DOI:10.2307/3433179.
Jones TD, Morris MD, Young RW. A mathematical model for radiation-induced myelopoiesis. Radiat Res 128: 258-66; 1991. DOI:10.2307/3578048.
Jones TD, Morris MD, Young RW, Kehlet RA. A cell-kinetics model for radiation-induced myelopoiesis. Exp Hematol 21: 816-22; 1993.
Kearny CH, Mims L. Nuclear war survival skills. Oregon Institute of Science and Medicine; 1987.
LandScan 2012 [database online]. Oak Ridge, TN: Oak Ridge National Laboratory; 2012. Updated July, 2013.
Levin SG, Young RW, Stohler RL. Estimation of median human lethal radiation dose computed from data on occupants of reinforced concrete structures in Nagasaki, Japan. Health Phys 63: 522-31; 1992. DOI:10.1097/00004032-199211000-00003.
Levy A. The nuclear threat and US preparedness: radiation monitoring. J Am Phys Surg 21: 88-91; 2016.
MacKenzie D. Can we stop the North Korean nuclear threat? New Scientist 235; 2017. Merom G. Israeli Perceptions of the Iranian Nuclear Threat. Polit Sci Q 132: 87-118; 2017.
DOI:10.1002/polq.12574. Mishra S. Pakistan’s Nuclear Threshold: Not as Low as Perceived. IndraStra Global: 4; 2017. Morris MD, Jones TD, Young RW. Estimation of coefficients in a model of radiation-induced
myelopoiesis from mortality data for mice following X-ray exposure. Radiat Res 128: 267-275; 1991. DOI:10.2307/3578049.
Morris MD, Jones TD, Young RW. A cell kinetics model of radiation-induced myelopoiesis: rate coefficient estimates for mouse, rat, sheep, swine, dog, and burro irradiated by photons. Radiat Res 135: 320-331; 1993. DOI:10.2307/3578871.
Morris MD, Jones TD, Young RW. Bone marrow equivalent prompt dose from two common fallout scenarios. Health Phys 67: 183-6; 1994. DOI:10.1097/00004032-199408000-00011.
North Atlantic Treaty Organization. Handbook on the medical aspects of NBC defensive operations. Brussels: NATO; 1996.
North Atlantic Treaty Organization. Planning Guide to Response to a Nuclear Detonation, Second Edition. 2010.
Oldson D, Wentz J, Stricklin D, Sanchez B, Millage B, McClellan G. HENRE 2.0 Technical Reference Manual HENRE Engine. Fort Belvoir, VA; DTRA-TR-15-071 Rev. 47 (30 Aug 2017); 2015.
Stricklin D, McClellan G, Asadian V. Proceedings of the Joint Weapons Effects Human Response Panel. Fort Belvoir, VA; DTRA-TR-16-069; 2016.
Stricklin D, Millage K. Evaluation of demographic factors that influence acute radiation response. Health Phys 103: 210-216; 2012. DOI:10.1097/HP.0b013e31824.
Stricklin D, Prins R, Zaru-Roque I, Bellman J. Modification of Acute Radiation Response in Different Demographic Age Groups. Fort Belvoir, VA; DTRA-TR-18-001; 2017.
Sykes I, Parker S, Henn D. SCIPUFF Version 2.1 Technical Documentation. Titan Research and Technology Division: Titan Corporation; A.R.A.P. Report No. 728; 2004.
20
U.S. Census Data: Demographic Profiles [database online]. The United States Census Bureau; 2010. Updated May, 2010.
United Nations, Secretary-General Welcomes Swift Entry into Force of Nuclear Terrorism Convention, Calls on all States to Ratify without Delay. Press release SG/SM/11040-L/T/4404, 13 June 2007. Available at: http://www.un.org/press/en/2007/sgsm11040.doc.htm.
Waller E, Millage K, Blakely WF, Ross JA, Mercier JR, Sandgren DJ, Levine IH, Dickerson WE, Nemhauser JB, Nasstrom JS. Overview of hazard assessment and emergency planning software of use to RN first responders. Health Phys 97: 145-156; 2009. DOI:10.1097/01.HP.0000348464.78396.23.
Warner S, Heagy J, Platt N, Dillon M. Transport and dispersion model predictions of elevated source tracer experiments in the Copenhagen area: Comparisons of Hazard Prediction and Assessment Capability (HPAC) and National Atmospheric and Release Advisory Center (NARAC) emergency response model predictions. IDA Paper D-3276; 2006.
Warner S, Heagy J, Platt N, Larson D, Sugiyama G, Nasstrom J, Foster K, Bradley S, Bieberbach G. Evaluation of transport and dispersion models: A controlled comparison of Hazard Prediction and Assessment Capability (HPAC) and National Atmospheric Advisory Center (NARAC) predictions. IDA Paper P-3555; 2001.
Waselenko JK, MacVittie TJ, Blakely WF, Pesik N, Wiley AL, Dickerson WE, Tsu H, Confer DL, Coleman CN, Seed T, Lowry P, Armitage JO, Dainiak N, Strategic National Stockpile Radiation Working Group. Medical management of the acute radiation syndrome: recommendations of the Strategic National Stockpile Radiation Working Group. Ann Intern Med 140: 1037-51; 2004. DOI:10.7326/0003-4819-140-12-200406150-00015.
White House, Nuclear Security Summit 2016 Communiqué. Press release, 01 April 2016. Available at: https://obamawhitehouse.archives.gov/the-press-office/2016/04/01/nuclear-security-summit-2016-communiqu%C3%A9.