70


Page i
Impact Evaluation of KSNDMC
Help-Desk Services
Implemented by
The Karnataka State Natural Disaster Monitoring Centre,
Government of Karnataka, Bangalore
Aditya Chavali
V Ramaswamy
G Shivakumar Nayka
K A Ambarish
S Subramanian
Center for Economic Studies and Policies Institute for Social and Economic Change
Nagarabhavi, Bangalore-560 072
March 2013
Page ii
ACKNOWLEDGEMENTS
We are thankful to ….
Karnataka State Natural Disaster
Monitoring Cell, Bangalore
For sponsoring the study.
Dr. V S Prakash
Director,
Karnataka State Natural Disaster
Monitoring Centre, Bangalore
For giving us opportunity to undertake
this study and for all the
encouragements and help rendered to
us.
Prof. R S Deshpande
Director,
Institute for Social and Economic
Change, Bangalore
For providing constant support from
initial stage of study to the finalization
of report. For spearheading the work
and without his prodding this study
could not have been completed.
Staffs of Institute for Social and
Economic Change and Karnataka State
Natural Disaster Monitoring Cell
Bangalore
For their excellent timely support
Respondent in the selected districts of
Karnataka...............
State level officials
District level officials
Taluk Level Officials
Farmers
Media
For participating in the interviews and
discussions and providing valuable
information and suggestions.
All those who have directly & indirectly involved in the study.
Usual disclaimer applies. -Authors-

Page iii
Table of Contents
Acknowledgement .................................................................................................... ii
List of Maps ............................................................................................................ iv
List of Figure .......................................................................................................... iv
List of Tables .......................................................................................................... iv
List of Appendix Tables .......................................................................................... vi
Foreword ............................................................................................................... vii
CHAPTER I: Introduction .................................................................................. 1
CHAPTER II: Socio-Demographic Profile of Respondents ........................... 10
CHAPTER III: The Farmers Responses .......................................................... 19
CHAPTER IV: The Officials Response ............................................................ 38
CHAPTER V: Summary and Recommendations ............................................ 41
Appendix ................................................................................................................ 45
Page iv
LIST OF MAPS
Map 2.1: Distributions of respondents’ by household income ............................. 12
Map 2.2: Distributions of respondents’ by type of land owned ............................ 14
Map 3.1: Distribution of respondents’ source of information about KSNDMC .. 20
Map 3.2: Distribution of number of respondents’ contacted to KSNDMC .......... 21
Map 3.3: Distribution of time frame of information sought from KSNDMC
by respondents ........................................................................................ 25
Map 3.4: Distribution of respondents’ nature of information sought
from KSNDMC ...................................................................................... 27
Map 3.5: Distribution of usage of information sought from KSNDMC
by respondents ........................................................................................ 29
Map 3.6: Distribution of respondents’ level of satisfaction about KSNDMC ...... 35
LIST OF FIGURE
Figure 2.1: Distribution of sample respondents by size of
the household .......................................................................................... 11
Figure 3.1: Distribution of respondents by number of time calls
made to KSNDMC ................................................................................. 22
Figure 3.2: Distribution of sample respondents by duration of
each call made to the Helpdesk .............................................................. 23
LIST OF TABLES
Table 1.1: Hazards for which KSNDMC provide technical services .................. 3
Table 1.2: List of stakeholders for the study ........................................................ 6
Table 1.3: Officials responded for emails and the telephone calls ...................... 7
Table 1.4: Type of response got for the telephone numbers of farmers
provided by KSNDMC ....................................................................... 8
Table 2.1: Age of respondents ........................................................................... 10
Table 2.2: Distribution of sample respondents by educational level ................. 11
Table 2.3: Distribution of sample respondents by type of lands owned ............ 15

Page v
Table 2.4: Distribution of sample respondents by type of crops grown ........... 17
Table 2.5: Distribution of sample respondents by type of resourceful
officials contacted ............................................................................. 18
Table 3.1: Distribution of sample respondents by nature of problems in getting
Connected to Helpdesk ..................................................................... 24
Table 3.2: Distribution of sample respondents by sharing of information ........ 30
Table 3.3: Distribution of sample respondents by use of information
by others ............................................................................................ 30
Table 3.4: Distribution of respondents by type of usage of information
by others ............................................................................................ 31
Table 3.5: Distribution of farmers Sow seed irrigation and got rain
next day ............................................................................................. 32
Table 3.6: Distribution of farmers by status of crop sown ................................. 32
Table 3.7: Distribution of farmers by type of problem ...................................... 33
Table 3.8: Distribution of farmers by extent of loss under gone ....................... 33
Table 3.9: Distribution of respondents by number of times affected prior to the
Helpdesk services .............................................................................. 34
Table 3.10: Respondents not affected/undergone loss after receiving the
technical advice from KSNDMC ...................................................... 34
Table 3.11: Correlations between the key variables and the level of
satisfaction ....................................................................................... 36
Table 3.12: Distribution of sample respondents by nature of suggestions ......... 37
Table 4.1: Distribution of sample respondents by receipt of SMS and other
services from KSNDMC ................................................................... 39
Table 4.2: Distribution of sample respondents by usefulness and continuation
of the services from KSNDMC ....................................................... 39

Page vi
LIST OF APPENDIX TABLES
App.1: Officials response ................................................................................... 45
App.2: Additional farmers data .......................................................................... 45
App.3: Distribution of respondents’ by household income ................................ 46
App.4: Distribution of respondents’ by type of land owned .............................. 47
App.5: Distribution of respondents’ source of information about KSNDMC ... 48
App.6: Distribution of number of respondents’ contacted To KSNDMC.......... 49
App.7: Distribution of time frame of information sought from KSNDMC
by respondents ........................................................................................ 50
App.8: Distribution of respondents’ nature of information sought
from KSNDMC ...................................................................................... 51
App.9: Distribution of usage of information sought from KSNDMC
by respondents ....................................................................................... 52
App.10: Distribution of respondents’ level of satisfaction about
the KSNDMC ....................................................................................... 53
App.11: Questionnaire for various officials ......................................................... 54
App.12: Questionnaire for farmers ....................................................................... 55
App.13: List of farmers contacted ...................................................................... 56

Page vii
FOREWORD
One of the major historical drawbacks in meeting the challenge of drought was the
availability of rainfall data without delay. Experience in the policy circles revealed that
the response to drought was delayed because of the non-availability of the rainfall data and
also lack of knowledge about the deficiency in rainfall. Dr. Prakash, Director, Karnataka
State Natural Disasters Monitoring Centre (KSNDMC), worked tirelessly in order to bring
real time rainfall data-sharing with the help of telemetric rain gauge stations. This work
began a few years back and the success is unimaginable with a good speed. Now,
KSNDMC has established rain gauge stations in every hobli of Karnataka and the data are
available for every point in the day for 24 hours on all the 365 days. The data are directly
transmitted to the central server located in KSNDMC. These data are also used in
generating weekly, fortnightly and monthly reports to monitor without any delay and
respond to the call of drought or flood. The natural calamities thus, could be well
responded within 24 hours using the network of officers, farmers and other implementing
agencies. As an additional step in the direction of helping the farmers, the KSNDMC
opened ‘Help Desk’ facilities for providing weather related information to farmers,
fishermen and common man and to advice the farmers on probability of rainfall as well as
other questions which they ask. This facility has been now in operation for a few years
and the response is very encouraging.
The present study was undertaken to locate the effectiveness of the ‘Help Desk’ in
meeting the requirements of the callers to the ‘Help Desk’. This 24-hour telephone facility
has been used by a large number of farmers across the state; however, the study is
confined to a sample of 91 respondents who approached the KSNDMC ‘Help-Desk’ for
different services. The study is based on the telephonic conversation and discussion with
the officers, stakeholders and the farmers who tried to contact the help-desk and sought to
know their satisfaction level through these interviews. The study team also visited a few
locations in the state to understand the ground situation.
We were happy to note that the farmers and the stakeholders had expressed true
satisfaction with the information received from the ‘Help-Desk’. which was also
collaborated by the officers and implementers. The early warning system through ‘Help-
Page viii
Desk’ is quite useful and could be used effectively in future. We are sure that this
experiment will be extended to cover most of the districts of the state and the other natural
calamities that confront the agricultural sector of the state. This report provides the
required base for the ‘Help-Desk’ services of KSNDMC which have been used by the
stakeholders and must be expanded to cover other areas. It also points out a few policy
pointers.
I congratulate the authors of the report for their untiring work as well as the
KSNDMC for providing such important services to the farmers of Karnataka.
Date: March 27, 2013 R.S.Deshpande
Director
Institute for Social and Economic Change
Nagarabhavi, Bangalore-560 072

Page 1
Chapter 1: INTRODUCTION
1.1: Background
Heredity and environment are the two
contributing factors for the development of
human personality. Heredity is a
biological factor inherited through genes
from one's parents or ancestors. And
environment refers to socio-physical
surroundings of man, which nurture his
abilities or equip him with a host of talents.
The social surroundings include caste,
class, status, neighborhood relations, peer
group connections, occupation,
participation in the community activities,
and membership in different organizations
etc. And the physical surroundings consist
of land, water, hillocks, forests, etc. Thus,
environment is a very complex entity that
not only offers a range of natural resources
for socio-economic and cultural growth of
the human beings but also contributes
immensely to the personality development.
As a matter of fact, environmental
development cannot be obtained with sheer
economic growth while environmental
degradation does contribute to economic
backwardness.
Floods, droughts and scarcity conditions
resulting from the uneven and irregular
monsoons have been hampering the
agricultural development and also causing
loss of lives and vegetation. It was reported
that between 1960 and 1981, 96 such
disastrous events killed as many as 60,000
people in India, among whom 25,000 were
killed in cyclones and 15,000 in floods.
The last 30 years statistics for India further
reveal that on an average 1,400 people and
over 1,00,000 cattle perish in floods every
year.
Scientists and technocrats offer several
reasons for such disasters. They also help
the administration to take proper
rehabilitation measures to alleviate the
distress. Of late, scientists and
technologists have offered several methods
to forecast the occurrence of such disasters
in advance which should enable the
concerned administration to take proper
measures and mitigate the adverse
implications of the natural disasters on
human population. Further, with the
advancement of science and technology,
now (today) it is possible for a person
(including the farmer) to use new
technologies to enhance the productivity
and accommodate climatic aberrations. In
this direction, the Karnataka State Natural

Page 2
Disaster Monitoring Centre (KSNDMC) is
providing several services to the people of
Karnataka and the Government not only to
take timely and proactive steps to be prepared
for the onslaught of disaster caused by
various natural calamities but also enable the
farmer to improve the farm output and reduce
the cost of cultivation by their services.
1.2: The Karnataka State Natural
Disaster Monitoring Centre
Karnataka has the distinction of being the
first state in the country to establish Drought
Monitoring Cell (DMC) in 1988 as an
institutional mechanism with the main
objective of assisting various stakeholders to
take timely and proactive steps to prevent and
get away from the sloth of disaster caused by
various natural disasters. Later it was
renamed as the Karnataka State Natural
Disaster Monitoring Centre (KSNDMC) in
2007. KSNDMC is an autonomous Body,
affiliated to Department of Science &
Technology, Government of Karnataka. It
covers and provides a formal common
platform to achieve synergy in the field of
disaster management in all the 30 districts of
Karnataka. The main objectives are:
Hazard mapping and vulnerability
studies;
Strengthening of information
technology for natural disaster
management;
Monitoring and impact assessment of
natural hazards;
Human resource development mainly by
imparting training;
Natural disaster early warning system.
KSNDMC has an Executive Committee
Chaired by Principal Secretary, Department
of IT, BT and S&T with Principal Secretary,
Revenue as Vice Chairperson. The members
are from line departments and scientific
organizations. The Governing Body is an
apex body headed by the Chief Secretary
with the Development Commissioner as the
Vice President.
It has been serving as a common platform to
the various response players in the field of
natural disaster management by providing
timely proactive science and technology
inputs. The Master Control Facility will
further strengthen the activities of the centre
in further providing information, reports, and
advisories to the community, research
organizations and the Government. The
Centre provides inputs to the farming
community, agriculture and horticulture
based sector, fisherman, transport sector,
power and electricity sector, state and district
level Disaster Management Authorities in
Karnataka.
1.3: Components and Implementation
of the Programme
The Disaster Management Act 2005,
Government of India reiterates a paradigm
shift in disaster management from rescue,
relief centric approach to preparedness and

Page 3
early warning approach. It is said that a rupee
spent on early warning and preparedness
helps in reducing the cost on rescue, relief
and rehabilitation. Disaster Management is
multidisciplinary and has the complexity
of information sharing and reporting. It
comprises installation of field monitoring
sensors - weather, geological,
hydrological, collection of data on real
time, transmission of the same to a
central computational/analysis centre,
data processing, analysis, alert
recognition, simulation through
appropriate mathematical models,
customized report generation,
dissemination of the
alerts/reports/advisories to the users.
Table 1.1: Hazards for which the KSNDMC provide technical services
Climate Related Hazards Drought, Flood, Cloudburst, Hailstorm, Lightning, Coastal Erosion,
Storm Surge, Cyclone
Geological Hazards Earthquake, Landslide, Tsunami
Hydrological Hazards Groundwater depletion and Aquifer Salinity
Biological Hazards Plant : Pest and Insect attack Human: Plague, SARS, Bird Flu
Currently the Center operates GPRS
enabled and solar powered telemetric rain
gauges, established and operational at all
the 747 hobli centers, 650 Gram
Panchayats. In addition, 64 satellites
based weather Monitoring Stations have
been installed and are operational in
association with ISRO. GPRS enabled
weather monitoring stations are being
established at 137 taluk headquarters.
VSAT enabled and solar powered
Permanent Seismic Monitoring stations
have been installed and operational in the
State. About 20 lakh data is received on
real/near time basis. All these activities
are managed via a web enabled data base
management, application development
and customization. With all this data,
KSNDMC disseminates the information
to various stake holders like District
Collectors, Chief Executive officers,
Assistant Commissioners, Tahsildars,
Joint Directors (Agri), Agricultural
Officers, Raitha Samparka Kendras, Print
and Electronic Media, etc. The
information dissemination takes place in
four formats namely through Reports,
Forecast, Alerts and most importantly
dissemination of information through the
Helpdesk on demand.
Page 4
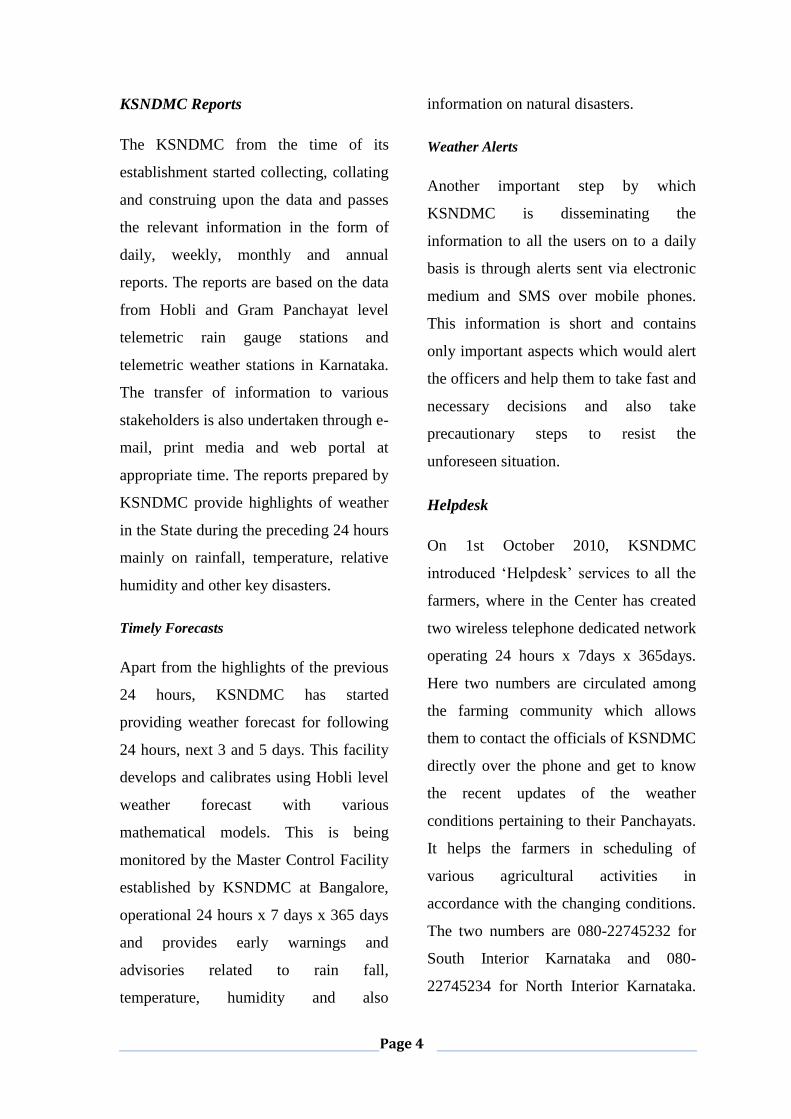
KSNDMC Reports
The KSNDMC from the time of its
establishment started collecting, collating
and construing upon the data and passes
the relevant information in the form of
daily, weekly, monthly and annual
reports. The reports are based on the data
from Hobli and Gram Panchayat level
telemetric rain gauge stations and
telemetric weather stations in Karnataka.
The transfer of information to various
stakeholders is also undertaken through e-
mail, print media and web portal at
appropriate time. The reports prepared by
KSNDMC provide highlights of weather
in the State during the preceding 24 hours
mainly on rainfall, temperature, relative
humidity and other key disasters.
Timely Forecasts
Apart from the highlights of the previous
24 hours, KSNDMC has started
providing weather forecast for following
24 hours, next 3 and 5 days. This facility
develops and calibrates using Hobli level
weather forecast with various
mathematical models. This is being
monitored by the Master Control Facility
established by KSNDMC at Bangalore,
operational 24 hours x 7 days x 365 days
and provides early warnings and
advisories related to rain fall,
temperature, humidity and also
information on natural disasters.
Weather Alerts
Another important step by which
KSNDMC is disseminating the
information to all the users on to a daily
basis is through alerts sent via electronic
medium and SMS over mobile phones.
This information is short and contains
only important aspects which would alert
the officers and help them to take fast and
necessary decisions and also take
precautionary steps to resist the
unforeseen situation.
Helpdesk
On 1st October 2010, KSNDMC
introduced ‘Helpdesk’ services to all the
farmers, where in the Center has created
two wireless telephone dedicated network
operating 24 hours x 7days x 365days.
Here two numbers are circulated among
the farming community which allows
them to contact the officials of KSNDMC
directly over the phone and get to know
the recent updates of the weather
conditions pertaining to their Panchayats.
It helps the farmers in scheduling of
various agricultural activities in
accordance with the changing conditions.
The two numbers are 080-22745232 for
South Interior Karnataka and 080-
22745234 for North Interior Karnataka.

Page 5
Due to the increased demand for the
information from the public, the Center
has recently increased the number of
telephones to 10.
1.4: The Context
The KSNDMC is functioning since 2007
by providing various services to public
and the bureaucrats. The Executive
Committee of KSNDMC took a decision
to evaluate the impact of these services
on the community and government in
their day to day administration.
It is in this context that ISEC was
approached to conduct an evaluation
study on the impact and advantages of the
various services with a particular focus
on the ‘Helpdesk’ which caters to the
bottom most stakeholders. At the behest
of KSNDMC, ISEC has conducted the
third party appraisal of the various
initiatives of KSNDMC and has brought
out the status and current position of the
programme. This would enable
KSNDMC to take necessary steps to
further improvise and penetrate the
programme in a more holistic way to all
parts of the state and cover maximum
farmers and furbish the economic and
social status of the state. The main
objectives of the study and methodology
are enunciated below.
1.5: Objectives
To analyze the perception and
utility of various services of
KSNDMC from the beneficiaries
and stakeholders.
To suggest appropriate and
suitable measures to improve the
existing system.
1.6: Methodology
An attempt was made to study the impact
of the services of the KSNDMC on
various beneficiaries and stakeholders
starting from the top government officials
to the farmers in the field. The study was
mainly based on telephonic interviews
and e-mails with the stakeholders by
using a structured questionnaire to collect
the quantitative data. Telephonic survey
was carried out using questionnaire
canvassed to the identified farmers. The
conversation with the farmers was also
recorded. In addition, the research team
made a brief visits to a few villages in
Haveri, Bijapur and Yadgir districts and
interacted with the farmers individually
and in groups apart from the community
leaders. During such meetings the team
was able to collect qualitative information
regarding the usefulness of the services of
KSNDMC and the problems encountered
along with their suggestions to make the
services better.

Page 6
Due to lack of time and resources, the
research team could not spend sufficient
time with the stakeholders, especially
with the farmers to conduct case studies.
However, the information gathered from
the farmers, officials and others over
telephone enabled the researcher to arrive
at reasonable conclusions. KSNDMC has
extended the fullest possible assistance to
ISEC staff in providing all relevant
information and contact details. The
evaluation study is based on the contact
details of various stakeholders provided
by KSNDMC. The impact of the
programme has been assessed from the
point of view of the stakeholders
presented in the section “Universe”.
1.7: Universe
The sample selection was finalized during
the meeting of officials of KSNDMC and
the ISEC faculty. It was decided that the
study has to cover all districts of
Karnataka based on the calls made to the
helpdesk and the alerts and mails sent to
various persons referred in the list of
Stakeholders (Table 1.2).
Table 1.2: List of stakeholders for the study
Stake holders NOs./Size
I State Level Officials
1 CM Office
2 Ministry/Political (Optional)
3 Government Department: Department Secretaries of Revenue; Agriculture, etc.
4 Media: Print and Electronic
5 Other Agencies: Insurance Companies (Corp)
II District Level
1 DC 30
2 DEO 30
3 CEO 30
4 Joint Directors of Agriculture 30
5 Deputy Directors of Agriculture 30
6 Joint Directors of Horticulture
7 Deputy Directors of Horticulture
8 Horticultural Clinics 30
III Taluk Level
1 Tahsildars 176
2 Assistant Director Agriculture 176
3 Agricultural Officer 176
4 Agricultural Assistant (Tech. Asst.)
5 Assistant Agriculture Office (AAO) 176 X 2
6 Assistant Agricultural Officer Range (1210)
7 Agricultural Assistant at Gram Panchayat Level (5640)
8 Assistant Director Horticulture 176
IV Farmers 400-500
Page 7
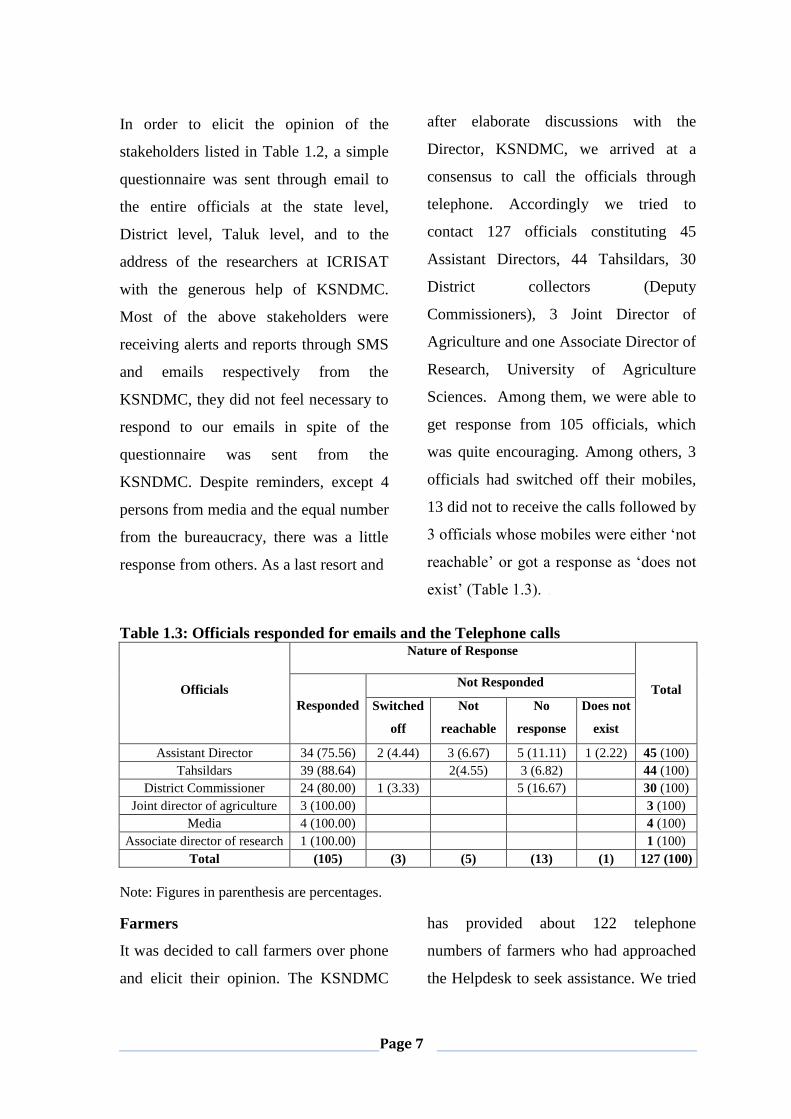
In order to elicit the opinion of the
stakeholders listed in Table 1.2, a simple
questionnaire was sent through email to
the entire officials at the state level,
District level, Taluk level, and to the
address of the researchers at ICRISAT
with the generous help of KSNDMC.
Most of the above stakeholders were
receiving alerts and reports through SMS
and emails respectively from the
KSNDMC, they did not feel necessary to
respond to our emails in spite of the
questionnaire was sent from the
KSNDMC. Despite reminders, except 4
persons from media and the equal number
from the bureaucracy, there was a little
response from others. As a last resort and
after elaborate discussions with the
Director, KSNDMC, we arrived at a
consensus to call the officials through
telephone. Accordingly we tried to
contact 127 officials constituting 45
Assistant Directors, 44 Tahsildars, 30
District collectors (Deputy
Commissioners), 3 Joint Director of
Agriculture and one Associate Director of
Research, University of Agriculture
Sciences. Among them, we were able to
get response from 105 officials, which
was quite encouraging. Among others, 3
officials had switched off their mobiles,
13 did not to receive the calls followed by
3 officials whose mobiles were either ‘not
reachable’ or got a response as ‘does not
exist’ (Table 1.3). [
Table 1.3: Officials responded for emails and the Telephone calls
Officials
Nature of Response
Total
Responded
Not Responded
Switched
off
Not
reachable
No
response
Does not
exist
Assistant Director 34 (75.56) 2 (4.44) 3 (6.67) 5 (11.11) 1 (2.22) 45 (100)
Tahsildars 39 (88.64) 2(4.55) 3 (6.82) 44 (100)
District Commissioner 24 (80.00) 1 (3.33) 5 (16.67) 30 (100)
Joint director of agriculture 3 (100.00) 3 (100)
Media 4 (100.00) 4 (100)
Associate director of research 1 (100.00) 1 (100)
Total (105) (3) (5) (13) (1) 127 (100)
Note: Figures in parenthesis are percentages.
Farmers
It was decided to call farmers over phone
and elicit their opinion. The KSNDMC
has provided about 122 telephone
numbers of farmers who had approached
the Helpdesk to seek assistance. We tried

Page 8
to contact all of them and tried calling the
numbers provided by KSNDMC. Out of
122 numbers called, we were able to get
responses from 91 farmers. Of the
remaining, 11 numbers did not respond, 7
numbers were reported as ‘doesn’t exist’,
and 5 numbers were switched off. (see
Table 1.4).
Table 1.4: Type of response got for the Telephone numbers of farmers provided by
KSNDMC
Nature of Response Number of calls Percentage
Responded 91 74.59
No response 11 9.02
Doesn’t exist 7 5.74
Switched off 5 4.10
Wrong Number 2 1.64
Temporally out service 2 1.64
Total 122 100
The information gathered from the
farmers, officials and others over
telephone enabled the researcher to arrive
at reasonable conclusions. The impact of
the programme has been assessed from
the point of view of the telephone
interviews of the stakeholders. Apart
from collecting the information based on
the interview schedule, later on the
research team decided to add a few more
questions to the farmers so as to assess
the impact of KSNDMC helpdesk.
The research team also undertook a brief
field visit during April 2012 to the
districts of Haveri, Yadgir and Bijapur to
have a personal discussions and visit the
farms to assess the impact after getting
the scientific information from the
helpdesk. The research team visited the
villages of Rattahalli, Yethanahalli and
Ganavi Siddhagiri in Haveri district,
Basavanabagewadi and Kalgurki villages
of Bijapr district and Kembhavi village in
Yadagir district from where a large
number of calls for information were
received. During such visits, the research
team met Deputy Commissioner, three
Additional Deputy Commissioners, one
Zilla Panchayat CEO, two Tahsildars,
four agricultural officers and several
other officials and collected information
from them.
1.8: ANALYSIS
The analysis of data has provided a holistic

Page 9
understanding of the background of the
people living in different geographic
locations in Karnataka. While analyzing
the data and the field level notes, utmost
care was taken to describe the real situation
at the ground level. For the purpose of
comparing field level notes or data and to
arrive at a comparable picture, the ‘district’
was taken as the basic variable. The data or
information pertaining to each district was
tabulated separately and presented in the
form of tables. Such an analysis helps the
reader to understand the variations as well
as similarities of perceptions of people
belonging to different locations and also in
different economic zones.

Page 10
CHAPTER 2: SOCIO-DEMOGRAPHIC PROFILE OF RESPONDENTS
2.1: Introduction
An attempt is made here to understand the
socio economic profile of the farmers who
had called the Helpdesk of KSNDMC to
seek information. Since the
commencement of the Helpdesk facility
many calls were made to the Helpdesk by
the farmers but only 122 numbers were
recorded. The total numbers of responses
were 91 as explained earlier chapter. The
analysis of data on the demographic
characteristics of the sample respondents
has been presented in the following
paragraphs based on these respondents.
2.2: Age
The age-wise classification of data has
shown that 81.32 per cent of respondents
belonged to the age group of 21 to 50 years
of age. Another 13.19 per cent respondents
were in the age group of 51 to 65 years.
Only 3.30 per cent respondents were less
than 20 years of age followed by 2.20 per
cent of respondents who were of the age of
66 years and above (Table 2.1). It is
evident that majority (81 per cent) of
respondents who take agricultural
decisions are in the age group of 21 to 50
years.
Table 2.1: Age Distribution of Respondents
Age of the Respondents No of Respondents Per cent
Up to 20 Years 3 3.30
21 to 35 Years 36 39.56
36 to 50 Years 38 41.76
51 to 65 Years 12 13.19
66 Years & above 2 2.20
Total 91 100
2.3: Educational Level
Table 2.2 has revealed that except 1.10
per cent, all the respondents were literate.
Among them, majorities were either
graduates (40.66 per cent) or had high
school education (39.56 per cent). Only
7.69 per cent of the respondent had
studied up to primary level. The level of
education is an important factor for the
people to approach the Helpdesk of
KSNDMC.

Page 11
Table 2.2: Distribution of sample respondents by Educational level
Educational level of the Respondents No of Respondents Per cent
Illiterate 1 1.10
Primary 7 7.69
High School 36 39.56
Graduate 37 40.66
Others 10 10.98
Total 91 100
2.4: Family Size
Table 2.3 has revealed that a majority
(48.35 per cent) of respondents’
households had 4 to 5 persons per
household or family followed by 29.67
per cent of households with 6 to 10
persons Another 15.38 per cent of
respondent’s households had a family
size of less than 3 persons per household.
Only 6.59 per cent of respondent’s
households had more than 11 persons per
household. As a large majority of
respondent’s households (63.73 per cent)
has less than 5 persons per household one
can infer that the share of nuclear families
seems to be considerable among the
sample respondents’ households.
Figure 2.1: Distribution of sample
respondents by size of the household
2.5: Annual Income
Income is an important indicator of the
economic status of a family. The family
income comprises income from main
occupation, subsidiary occupations
pursued by family members and also the
non-occupational income like rent,
pension, etc.

Page 12

Page 13
Map no 2.1 has shown that of the total
respondents, 30.77 per cent of
respondents have not reported their
household annual income. Of the
remaining, about 22 per cent have
reported that their household income was
about Rs. 50,000 per annum. Another
17.58 per cent reported that their annual
income varied between Rs. 2 lakh to Rs.
5 lakh followed by 14.29 per cent whose
annual income was between Rs 1 lakh to
Rs. 2 lakh. While 8.79 per cent of
respondents were in the income group of
more than Rs. 5 lakh, the rest (6.59 per
cent) had an annual income of between
Rs.50, 000 to Rs.1,00,000. Thus from the
above analysis one could infer that the
sample had spread across different
income groups in the study area.
2.6: Total Land Owned
Land is an important asset in rural areas
not only in terms of livelihood but also in
terms of status. Map no 2.2 has revealed
that 36.26 per cent of respondents were
large farmers having more than 10
hectares of land followed by 24.18 per
cent of medium farmers owning between
4.01 to 10 hectares of land. Another
18.68 per cent were semi-medium
farmers owning land between 2.01 to 4
hectares followed by 13.19 per cent of
small farmers with 1.01 to 2 hectares and
6.59 per cent were marginal farmers
owning less than one hectare. It is
important to note that 1.10 per cent of
respondents were landless. It is quite
appreciable that nearly 20 per cent of the
small and marginal farmers are seeking
the services of the KSNDMC to enhance
their agricultural productivity along with
another 1 per cent landless farmers who
engage themselves in leasing in land for
cultivation. It is evident from the above
analysis that small and marginal farmers
also seek and get the assistance of the
Helpdesk to enhance the productivity of
crops and minimize the losses in crop
production.

Page 14

Page 15
2.7: Type of Land Owned
Except one respondent, all others had
land. Table 2.3 has revealed that 35.16
per cent of the sample households owned
only dry land and 4.40 per cent owned
irrigated land followed by 2.20 per cent
of the sample households who owned
plantation land. Those who own both dry
and wet land constituted 26.37 per cent.
The remaining 30.78 per cent of
respondents owned plantation along with
dry and wet land (24.18 per cent) or dry
land (3.30 per cent) or wet land (3.30 per
cent). The above analysis clearly
indicates the importance of scientific
information from KSNDMC not only
important to grow commercial crops in
wet lands or for the plantations but also
equally important to grow food crops in
dry lands.
Table 2.3: Distribution of sample respondents by type of lands owned
Type of land owned No of Respondents Per cent
Landless 1 1.10
Dry land only 32 35.16
Wet land only 4 4.40
Plantation only 2 2.20
Dry & Wet land 24 26.37
Dry & Plantation 3 3.30
Wet & Plantation 3 3.30
Dry, Wet & Plantation 22 24.18
Total 91 100
2.8: Cropping Pattern
Cropping pattern varies from district to
district. For the present analysis the crops
are clubbed under four categories namely
food crops, commercial crops, seed crops
and plantation crops. The food crops
include jowar, paddy, ragi, wheat, maize
and other pulses. The commercial crops
include grapes, banana, sapota,
pomegranate, lemon, cotton along with
food crops like maize, vegetables, etc.
The oil seed crops include sunflower,
groundnut, kusbi (safflower), etc. The
seed crops grown in the area include
tomato, brinjal, pumpkin, chilies,
sunflower, cotton, etc, grown on contract
with the private seed companies. The

Page 16
plantation crops include coffee, tea,
coconut, arecanut, rubber, teak, etc.
Among those who own dry land, a
majority of respondents (28.57 per cent)
grow food crops only. Another 20.88 per
cent grow food crops along with
commercial crops followed by 8.79 per
cent each who grow oil seeds and
commercial crops with oil seeds along
food crops respectively in the dry land
depending upon the rains. Another 12.09
per cent of respondents grow commercial
crops as against 1.10 per cent who grows
oil seeds. However, 7.69 per cent of
respondents grow both commercial and
oil seed crops. Another interesting fact is
that the remaining 2.2 per cent of
respondents produce seeds in their dry
land for the private companies during
rainy season (Table 2.4).
Though 41.76 per cent of respondents had
no irrigation facility, others depend on
canal or tank or the tube wells to raise the
crops. Among the farmers who had
irrigation facility, a majority of them
grow commercial crops either exclusively
or with other crops. Table 2.4 shows that
24.18 per cent of respondents have grown
only commercial crops. 7.69 per cent
grow both commercial and food crops
followed by 4.40 per cent who grow
commercial crops with oil seeds and 2.20
per cent grow commercial crops along
with both food and oil seeds. Another
9.89 per cent grow only food crops and
1.10 per cent grows only oil seeds.
However, 2.20 per cent grow both food
and oil seed crops. About 6.59 per cent of
respondents produce seeds for the private
seed companies. The queries of farmers
to KSNDMC for information directly
relate to the cropping pattern as they
venture to grow commercial crops apart
from involving in seed production not
only in irrigated land but also in the rain-
fed areas.
Only one-third (32.97 per cent) of the
total respondents had land under
plantation. Coffee, tea, coconut, arecanut,
rubber, teak, etc were some of the
plantation crops grown (Table 2.4). These
farmers called the Helpdesk to assess the
time for spraying pesticides and use of
the irrigation water for their fields so that
they can take required precautions to
avoid unseen calamities.

Page 17
Table 2.4: Distribution of sample respondents by type of crops grown
Type of Crops Grown
Dry Land Irrigated Land Plantation
Respondents Percent Respondents Percent Respondents Percent
Not Applicable 9 9.89 38 41.76 61 67.03
Food Crops 26 28.57 9 9.89 - -
Oil Seeds 1 1.10 1 1.10 - -
Commercial Crops 11 12.09 22 24.18 30 32.97
Seed Crops 2 2.20 0 0 - -
Food and Commercial crops 19 20.88 7 7.69 - -
Commercial and Oilseeds 7 7.69 4 4.40 - -
Food, Oilseed & Commercial
crops 8 8.79 - - - -
Food and oilseeds crops 8 8.79 2 2.20 - -
Vegetable Crops - - 6 6.59 - -
Food crop, Vegetable and
oilseeds - -
2 2.20 - -
Total 91 100 91 100 91 100
Note: Multiple Responses
2.9: Administrators and Other
Stakeholders
The present day agriculture needs inputs
from various sources. Though the
agricultural department officials provide
the necessary information for all
agricultural needs, farmers still depend on
others for help. While selecting seeds for
sowing the farmers contact the
agricultural scientists, neighboring
farmers and pesticide and fertilizer
dealers. Similarly, for information about
the probability of rains, a few farmers
depend on the KSNDMC before
providing irrigation or applying
pesticides or fertilizers for their crops,
especially to the commercial crops and
seed crops. For the marketing
information, seeds, fertilizer application,
etc, the farmers consult the concerned
agriculture officials. This channel of
information is becoming quite popular
but needs further extension to new areas.
In the present context, 37.36 per cent of
respondents had never approached
anybody for information or advice for
their agricultural activities. Of those who
seek information for their agricultural
needs majority (39.56 per cent) consulted
with the officials of the KSNDMC.
Similarly, 7.69 per cent depend on
agricultural department officials followed
by 6.59 per cent sought help from the

Page 18
Gramsevaks. The other sources of
information were the Joint Director,
Horticulture, Krishi Vijnana Kendra,
Raitha Samparka Kendra, etc for a few
farmers (Table 2.5).
The practice of farmers depending on
others especially the neighborhoods,
astrology, almanac, other ritiuals, etc for
rains was in practice since generations
and it is still continuing. In addition,
farmers slowly moved towards scientific
information with weather reports and
general information from agriculture
department etc. but not particular to their
own region. Now with the improvement
in science and technology, farmers
depend on KSNDMC which provides
information on rain and weather more
accurately, which is applicable to their
own Hobli or Panchayats. This has led
many farmers to call the Helpdesk very
often for information before taking
decisions on agriculture.
Table 2.5: Distribution of sample respondents by type of stakeholders contacted
Resourceful officials contacted Respondent Per cent
Not Consulted 34 37.36
Officials from Agriculture Department and KSNMDC 2 2.20
Agriculture Department 7 7.69
KSNDMC 36 39.56
J D, Horticulture 2 2.20
Krishi Vijnana Kendra 2 2.20
Agriculture University 1 1.10
Krishi Samparka Kendra 1 1.10
Gram Sevak 6 6.59
Total 91 100

Page 19
CHAPTER 3: THE FARMERS’ RESPONSES
3.1: Introduction
During the initial discussions with the
farmers, only their personal background was
collected. The initial discussions though
brief, have familiarized the researchers and
helped in collection of information regarding
the utility of services offered by the
KSNDMC. A detailed analysis of the
information collected about the services of
KSNDMC is presented in the subsequent
sections.
3.2: Source of Information
Though the KSNDMC is providing
several services to the farmers in the
state, the main source of information
about the services of KSNDMC
organization was through Media
(56 percent) which includes News Papers
(41.76 percent), Television (8.79 percent)
and the Radio (5.49 percent). The
information about the availability of
different services and their importance
was spread across the farmer community
through their friendship network and
relatives (37.36 per cent), by the officials
of the Agricultural department (6.59 per
cent) during village meetings, through
neighborhood gossips, relatives, etc,
(Map: 3.1).
3.3: Number of Calls Made
The number of calls made to contact the
helpdesk by the farmers to seek the
needed information is a strong indicator
of the significance of the KSNDMC.

Page 20

Page 21

Page 22
Map 3.2 shows that nearly 90 per cent of
the farmers who contacted the Helpdesk
for information, have made calls more
than 5 times. About 20.88 per cent of
respondents each had contacted more
than 100 times. Those who called
KSNDMC Helpdesk 5 to 10 times also
constitute 20.88 per cent. Similarly 19.78
per cent had approached the organization
11 to 25 times and 15.38 per cent had
made calls to the organization 26 to 50
times to get information about rain and
other issues. Only those who knew about
the organization recently had called once
(4.40 per cent) or 2 to 4 times (7.69 per
cent). It is evident from the above that
almost all farmers keep calling the
helpdesk as and when they need
information. It only endorses the
significance of the information provided
by KSNDMC helpdesk to the farmers.
Figure 3.1: Distribution of respondents by number of time calls made to KSNDMC
3.4: Duration of Call
The length of discussion over phone
directly relates to the familiarity of the
persons (officials) and/or significance of
the services. This seems to be true, as one
analyses the Figure 3.2. A large majority
(89 per cent) of respondents discussed
with KSNDMC helpdesk for about 2
minutes to 10 minutes. Among them
39.56 per cent of respondents had
reported that they had a conversation for
about 4 to 5 minutes followed by 29.67
per cent who spent about 2 to 3 minutes
and 19.78 per cent held discussions for
about 6 to 10 minutes with KSNDMC
Helpdesk officials collecting information

Page 23
they needed. Another 3.3 per cent of
respondents had reported that they had
discussions with KSNDMC helpdesk
officials for about 11 to 15 minutes and
the rest (4.4 per cent) had long
discussions of more than 15 minutes with
KSNDMC helpdesk officials. Everyone
who had contacted with the officials of
KSNDMC helpdesk felt that they had
fruitful discussions and had sufficient
time to get their doubts cleared.
Figure 3.2: Distribution of sample respondents by duration of each call made to the
Helpdesk
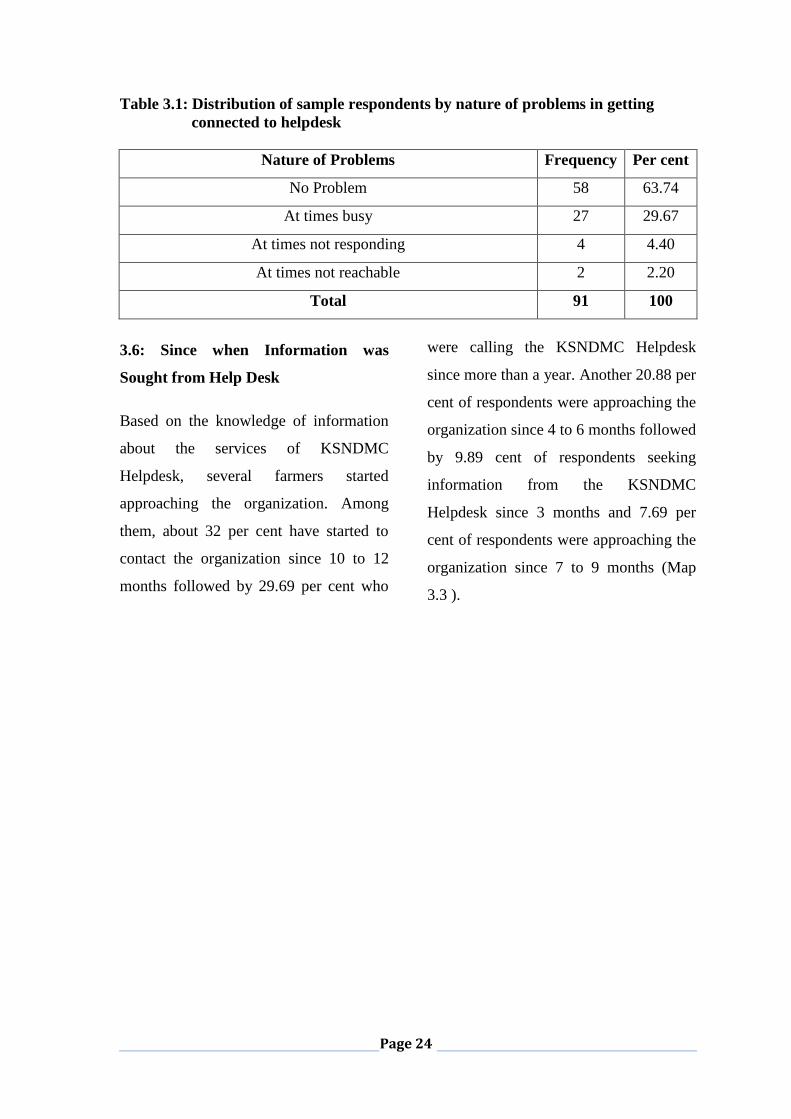
3.5: Nature of Problems in Getting the
Telephone Line/Connection
Majority of respondents (63.74 per cent)
reported that they never faced any
problem to get their mobile or land line
connected with the KSNDMC Helpdesk.
The remaining respondents had
encountered one or the other problem to
get the helpline connected. Among them,
29.67 per cent of respondents had
reported that they made several attempts
to get Helpdesk line connected as it was
busy and one had to wait for their turn.
Similarly, another 4.40 per cent reported
that they were unable to contact the
Helpdesk as there was ‘no response’
followed by 2.20 per cent who reported
that they got a response as ‘not reachable’
(Table 3.1). Since there were only two
telephone lines during the course of the
study, the above problems seem to be
realistic. However the KSNDMC has
recently added another 8 lines to the
existing 2 lines to overcome the above
problems.
Page 24
Table 3.1: Distribution of sample respondents by nature of problems in getting
connected to helpdesk
Nature of Problems Frequency Per cent
No Problem 58 63.74
At times busy 27 29.67
At times not responding 4 4.40
At times not reachable 2 2.20
Total 91 100
3.6: Since when Information was
Sought from Help Desk
Based on the knowledge of information
about the services of KSNDMC
Helpdesk, several farmers started
approaching the organization. Among
them, about 32 per cent have started to
contact the organization since 10 to 12
months followed by 29.69 per cent who
were calling the KSNDMC Helpdesk
since more than a year. Another 20.88 per
cent of respondents were approaching the
organization since 4 to 6 months followed
by 9.89 cent of respondents seeking
information from the KSNDMC
Helpdesk since 3 months and 7.69 per
cent of respondents were approaching the
organization since 7 to 9 months (Map
3.3 ).

Page 25

Page 26
Though the KSNDMC established its
Helpdesk during 2007, it required a lot of
time to be known to the farmers at large.
It is not out of place to mention the
untiring efforts of Dr. V.S. Prakash,
Director, KSNDMC and his staff in
bringing the Helpdesk close to the people
by organizing the farmer’s meetings.
They also made use of the radio,
television, news papers with special
interviews and programme to create
awareness among the public regarding the
services of KSNDMC. In addition, they
used the services of organizations like
Krishi Vijnana Kendras, Raitha Samparka
Kendras and other training centres to
demonstrate the usefulness of the services
of KSNDMC to the different sections of
population.
3.7: Nature of Information (Help)
Sought From the Help Desk
Though the KSNDMC Helpdesk provides
several services to the people, different
sections of population sought information
pertaining to their needs. In the present
context the respondents being farmers
who are naturally interested in knowing
information which help agriculture
particularly the forecasts regarding rain,
cyclone, floods, temperature, etc. With
such information in advance, will enable
the farmers to take suitable steps at
different stages of agricultural operations.
Map no 3.4 reveals that a large proportion
(90.11 per cent) of respondents
approached the KSNDMC helpdesk to
know the possibility of rain during the
next few days (within two to three days).
Only a few (6.59 per cent) had enquiries
with the Helpdesk about the rain and
temperature. The remaining 1.10 per cent
each had made enquiries regarding
cyclone and floods. The significant
information of rain in advance for
farming especially with farmers venturing
into commercial agriculture and also
horticulture is very crucial as the
information will help farmers to schedule
the activities and mitigate the impact and
loss.
3.8: Use of Information
The farmers who called the Helpdesk
have used the information to enhance the
agricultural production or to make a
business. In the present context a large
majority enquired about the possibility of
rain, the main purpose was either to start
sowing the seed or to harvest the crop.
Depending on the geographic
characteristics of the soil, farmers need to
sow the seed either prior to or after the
rains.

Page 27

Page 28
It is evident from Map 3.5, that 38.46 per
cent respondents have reported, they had
used the information for taking a decision
prior to sowing the seeds based on the
information availed from the Helpdesk. A
few farmers had reported that they could
postpone the sowing operations due to
rain and few others had taken a decision
to make preparations for sowing. This
had helped in avoiding significant losses.
Similarly 26.37 per cent of respondents
used the information prior to providing
additional irrigation. Another 26.37 per
cent of respondents used the information
to make preparations for harvesting the
crop and also for threshing. A few
farmers used the information prior to
applying pesticides and fertilizers (13.19
per cent) followed by 3.30 per cent of
respondents who wanted to know whether
it rains during flowering season or not so
as to assess the yield based on the
quantum of rain during the flowering
season. The remaining 1.10 per cent of
respondents are those who need to take a
decision to organize a drama (Street Play)
in the village and to make bricks in their
fields (Map 3.5).
3.9: Sharing of Information
It is customary among the farming
community to exchange their experience,
problems, etc not only pertaining to
agriculture but also of personal life.
Whenever a farmer introduces a new crop
or buys a new device, the information
spreads among the other farmers quickly.
In the same way, when a farmer calls the
Helpdesk and gets the information, he
immediately discusses the outcome with
his peers. Table 3.2 revealed that except
3.30 per cent of respondents, all others
have shared the information either with
other farmers (49.45 per cent) or with
their friends (34.07 per cent) and other
village members (8.79 per cent).

Page 29

Page 30
Table 3.2: Distribution of sample respondents about sharing the information
Sharing the Information Respondents Per cent
Not Sharing / Nobody 3 3.30
Friends 31 34.07
Village Members 8 8.79
Neighbors, Friends, Relatives 4 4.4
Farmers 45 49.44
Total 91 100
3.10: Use of Information by Others
Since the information given by the
respondents to the villagers, friends and
relatives seems to be of vital importance
for their agriculture, it seems almost all of
them used the information. It is evident
from Table 3.3 that about 86.81 per cent
of respondents reported that the
information they had passed on to others
used by them. That indicates the spillover
of the information to a large number of
farmers. On the contrary, 7.69 per cent of
respondents reported that the information
given by them was not used by other
farmers or friends. Only 2.20 per cent of
respondents have reported that they no
idea whether information given by them
was used or not by other farmers or
friends.
Table 3.3: Distribution of sample respondents by use of information by others
Use of information by others Frequency Per cent
Not applicable 3 3.30
Yes 79 86.81
No 7 7.69
Do not know 2 2.20
Total 91 100
3.11: Type of Usage of Information by
Others
Several farmers who got the information
from the farmers who approached
Helpdesk have also benefitted by using
that information. Majority of respondents
(46.16 per cent) reported that with the
information they pass on to their friends
and other farmers, several of them had

Page 31
either postponed the sowing operations
(25.28 per cent) and harvesting (16.48 per
cent) or both (4.40 per cent) due to rain or
make preparations for sowing or
harvesting accordingly. Another 17.58
per cent of respondents reported that a
few farmers had used the information to
provide irrigation. Similarly, 14.29 per
cent of respondents reported that their
friends used the information for spraying
pesticides and applying fertilizers, etc
(Table 3.10). 3.30 per cent of respondents
reported that they were unable to know
the reasons for not using the information
even though it was provided to them to
use for their betterment (Table 3.4).
Table 3.4: Distribution of respondents by type of usage of information by others
Purpose of Usage Respondents Per cent
Not Aware 3 3.30
Not applicable 12 13.19
Crop sowing 26 28.57
Providing Irrigation 18 19.78
Harvesting 14 15.38
Sowing and Harvesting 4 4.4
Chemicals spray and applying fertilizers 10 10.99
Crop sowing and Fertilizers application 2 2.20
Flowering season 1 1.10
Changed the crop 1 1.10
Total 91 100
3.12: Additional Information
Additional data from 28 farmers was
collected to validate the responses and
impressions we got earlier. The
information pertains to, how far the
services of KSNDMC were helpful to the
farmers. In order to arrive at a definite
conclusion we analyzed the farm
practices, especially sowing, harvesting
of fertilizers and pesticides prior and
application to and after availing the
services of KSNDMC by the farmers
Prior to the availability of information or
the services from the KSNDMC about the
rain forecasts, the farmers were
dependent on conventional beliefs
regarding the possibility of rains during
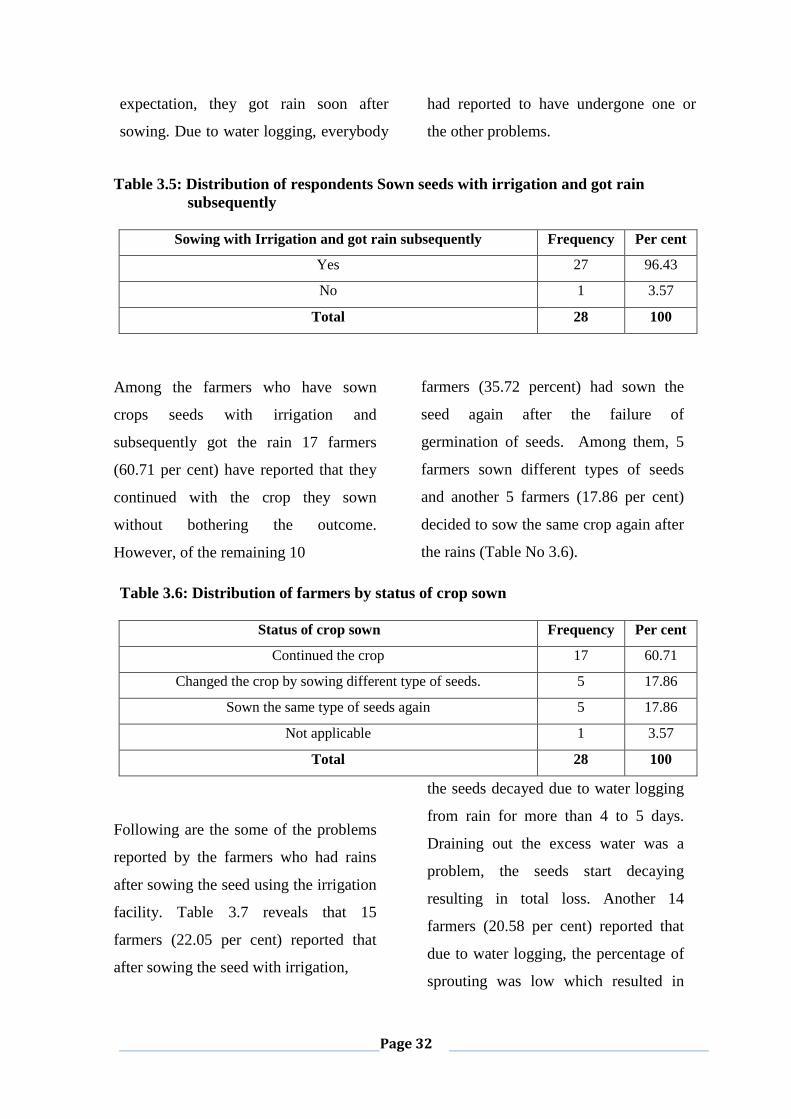
the period of sowing. Table No 3.5
reveals that except one respondent (3.57
per cent) all others have provided
irrigation during sowing prior to availing
KSNDMC services. Against their
Page 32
expectation, they got rain soon after
sowing. Due to water logging, everybody
had reported to have undergone one or
the other problems.
Table 3.5: Distribution of respondents Sown seeds with irrigation and got rain
subsequently
Sowing with Irrigation and got rain subsequently Frequency Per cent
Yes 27 96.43
No 1 3.57
Total 28 100
Among the farmers who have sown
crops seeds with irrigation and
subsequently got the rain 17 farmers
(60.71 per cent) have reported that they
continued with the crop they sown
without bothering the outcome.
However, of the remaining 10
farmers (35.72 percent) had sown the
seed again after the failure of
germination of seeds. Among them, 5
farmers sown different types of seeds
and another 5 farmers (17.86 per cent)
decided to sow the same crop again after
the rains (Table No 3.6).
Table 3.6: Distribution of farmers by status of crop sown
Status of crop sown Frequency Per cent
Continued the crop 17 60.71
Changed the crop by sowing different type of seeds. 5 17.86
Sown the same type of seeds again 5 17.86
Not applicable 1 3.57
Total 28 100
Following are the some of the problems
reported by the farmers who had rains
after sowing the seed using the irrigation
facility. Table 3.7 reveals that 15
farmers (22.05 per cent) reported that
after sowing the seed with irrigation,
the seeds decayed due to water logging
from rain for more than 4 to 5 days.
Draining out the excess water was a
problem, the seeds start decaying
resulting in total loss. Another 14
farmers (20.58 per cent) reported that
due to water logging, the percentage of
sprouting was low which resulted in

Page 33
low yields. In addition, many reported
that they had undergone losses due to
rains immediately after spraying,
pesticides and also application of
fertilizers (39.70 per cent).
Table 3.7: Distribution of respondents by type of problem
Type of problem Frequency Per cent
Seed decay 15 22.05
Problems in sprouting 14 20.58
Mud covering the seed 10 14.70
Flowers decay 1 1.47
Loss of pesticide and Fertilizers 27 39.70
Not applicable 1 1.47
Total 68 100.00
Note: Multiple responses.
Through a few had changed the crops or
sown the same crop sown again after
rains, it was reported that 3 farmers
(10.71 per cent) had got less yield and
undergone a loss to the extent of 30 per
cent. Similarly, 14 farmers (50 per cent)
had reported that their loss was between
30 to 50 per cent as the yield was below
normal. Such a loss was between 51 to
80 per cent in case of 7 farmers (25 per
cent) and it was reported by 3 farmers
(10.71 per cent) that they did not get
anything and suffered 100 per cent loss
(Table3.8)
Table 3.8: Distribution of respondents by extent of loss undergone
Extent of loss undergone Respondent Per cent
Not applicable 1 3.57
Up to 30 per cent 3 10.71
31 to 50 per cent 14 50.00
51 to 80 per cent 7 25.00
100 per cent 3 10.71
Total 28 100
The loss of crop after sowing with
irrigation and application of fertilizer
and pesticide was common in the past.
Table 3.9 reveals that about 10 farmers
(34.48 per cent) had undergone loss for
about 2 to 3 times in the past. Similarly,
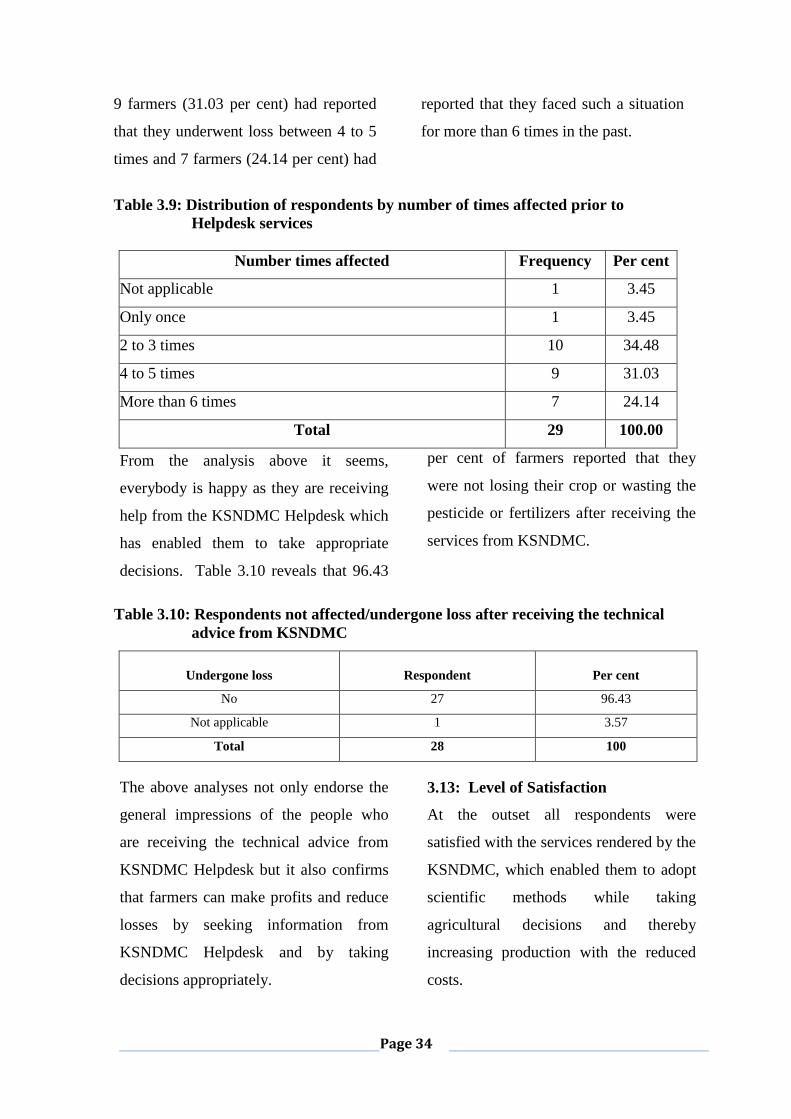
Page 34
9 farmers (31.03 per cent) had reported
that they underwent loss between 4 to 5
times and 7 farmers (24.14 per cent) had
reported that they faced such a situation
for more than 6 times in the past.
Table 3.9: Distribution of respondents by number of times affected prior to
Helpdesk services
Number times affected Frequency Per cent
Not applicable 1 3.45
Only once 1 3.45
2 to 3 times 10 34.48
4 to 5 times 9 31.03
More than 6 times 7 24.14
Total 29 100.00
From the analysis above it seems,
everybody is happy as they are receiving
help from the KSNDMC Helpdesk which
has enabled them to take appropriate
decisions. Table 3.10 reveals that 96.43
per cent of farmers reported that they
were not losing their crop or wasting the
pesticide or fertilizers after receiving the
services from KSNDMC.
Table 3.10: Respondents not affected/undergone loss after receiving the technical
advice from KSNDMC
Undergone loss Respondent Per cent
No 27 96.43
Not applicable 1 3.57
Total 28 100
The above analyses not only endorse the
general impressions of the people who
are receiving the technical advice from
KSNDMC Helpdesk but it also confirms
that farmers can make profits and reduce
losses by seeking information from
KSNDMC Helpdesk and by taking
decisions appropriately.
3.13: Level of Satisfaction
At the outset all respondents were
satisfied with the services rendered by the
KSNDMC, which enabled them to adopt
scientific methods while taking
agricultural decisions and thereby
increasing production with the reduced
costs.

Page 35

Page 36
A large majority (68.13 per cent) of
respondents rated the services of the
organization as ‘excellent’ followed by
24.18 per cent rated as ‘very good’. The
remaining 7.69 per cent of respondents
rated the services of the KSNDMC
organization as ‘good’ (Map 3.6)
Table 3.11: Correlations between the key variables and the level of satisfaction
Variables Level of satisfaction
Age of respondent -0.098 (0.355)
Educational level of respondent 0.073 (0.490)
Annual household income 0.222* (0.034)
Total land owned 0.015 (0.887)
Type of crops grown in dry land 0.066 (0.534)
Type of crops grown in irrigated land 0.057 (0.589)
Number of calls made 0.388** (0.000)
Duration of call 0.117 (0.268)
Note: The number of observations is 91. * indicates correlation is significant at the 5per cent
level. ** indicates correlation is significant at the 1per cent level. Probability levels of
significance for a two tailed test are given in parenthesis.
3.14: Correlations
Table 3.11 includes the correlations
between the variables pertaining to the
information gathered from the farmers
through telephonic questionnaires. Level
of satisfaction is considered to be the key
variable which is expected to be
influenced by a host of factors such as
income level of respondent, educational
level of respondent, type of crops grown
etc. Among all the variables considered in
our study, three factors stand out, viz;
number of calls made shows a very high
correlation with the level of satisfaction
(0.388) at the 1per cent level of
significance and a probability level of
significance higher than 0.05, which
indicates that the correlation is
significant. This indicates that the level of
satisfaction among the farmers seeking
the services of the Helpdesk is positively
and directly influenced by the number of
calls made. Secondly, the annual
household income variable is highly
correlated with the ‘level of satisfaction’
with a coefficient of 0.222 at the 5 per
cent significance level which is
statistically significant.

Page 37
Table 3.12: Distribution of sample respondents by their suggestions
Nature of Suggestions Respondent Per cent
No Comment 49 53.85
Extend the Services for 24X7 4 4.40
This service is enough 19 20.88
Gram level information needed 3 3.30
Daily SMS Required 2 2.20
Need forecasting monthly rainfall information 12 13.19
Need toll free telephone Service 2 2.20
Total 91 100

Page 38
CHAPTER 4: RESPONSE OF THE OFFICIALS
4.1: Introduction
As mentioned earlier in the
methodology, our efforts to get response
for the questionnaire sent by email to all
the stakeholders in Karnataka yielded
poor results. In spite of several
reminders, except 4 persons from media
and an equal number from the
bureaucracy there was no response from
others. As a last resort and after
elaborate discussions with the Director,
KSNDMC, we decided to call the
officials through telephone. Accordingly
we tried to contact 127 officials
constituting 45 Assistant Directors, 44
Tahsildars, 30 District collectors
(Deputy Commissioners), 3 Joint
Directors of Agriculture and 1 Associate
Director of Research apart from 4
persons from the electronic media (Table
4.1). Among them we were able to get
response from 105 officials including
media persons. There was no response
from others the remaining 22 persons
This shows that the response has been
more than 82.67 per cent.
Among the Tahsildars, it was 86.36 per
cent followed by Deputy Commissioners
with 80 per cent and Assistant Directors
with 73.33 per cent. All the Joint
Directors of Agriculture, representatives
from the media and Assistant Director of
Research responded to our calls. Those
of the mobiles which were switched off
even after calling them for more than
three times during different times of the
day were pertains to the Assistant
Director (4.44 per cent) and Deputy
Commissioners (3.33 per cent).
4.2 Receipt of Daily SMS and Other
Services
Among those who responded to our
queries, except 2 persons all others have
reported that they were in receipt of the
SMS, email messages of the information
sent by KSNDMC as alerts, forecasts and
reports. Of the total officials contacted,
majority (81.10 per cent) have reported
that they are receiving the rainfall data on
daily basis. (Table 4.1).

Page 39
Table 4.1: Distribution of sample respondents by receipt of the services from
KSNDMC
Receipt of the services from KSNDMC Frequency Per cent
Yes 103 98.09
No 2 1.90
Total 105 100
Table 4.2: Distribution of sample respondents by usefulness and continuation of the
Services from KSNDMC
Officials Is it useful for you
Total Yes Not Applicable No
Assistant Director 33 1 0 34
Tahsildar 38 0 1 39
District Commissioner 24 0 0 24
Joint director of agriculture 3 0 0 3
Media 4 0 0 4
Associate director of research 1 0 0 1
Total 103 1 1 105
Different officials have to take different
decisions based on the needs and
priorities of the situation. For example,
the Deputy Commissioner, being the head
of the district administration need to
attend the grievances of several people
including the farmers. In order to make
proper arrangements for the visits of VIP,
the DC needs to be appraised of climatic
conditions like the day’s temperature,
probability of rains, wind speed, etc.
Safety measures must be planned during
natural calamities like floods, cyclone,
drought, etc to mitigate the impact with
the precautionary measures. The
information from the KSNDMC comes in
handy to make proper decisions.
As far as the officials of the agricultural
department are concerned, several
officials reported that the information
from the KSNDMC as alerts and reports
directly influence the decisions of the day
to day functioning of the department. It
enables the agricultural officials to give
suggestions to the farmers to take up
agricultural operations, application of
fertilizers and pesticides. Also alert the
local fertilizer and pesticide dealers to
make necessary procurements of fertilizer
and pesticide along with the seeds to meet
the sowing season demand.
Page 40
With respect to the media, the
information not only forms a part of the
day to day publications but is also used to
alert the government to take proper
measures for the welfare of the citizens
and also information for personal safety.
Since the information provided by
KSNDMC facilitates to take proper
decisions, all the officials have reported
that the services should be continued.
Except 2.27 per cent of Tahsildars, all
other have reported that the services
provided by the KSNDMC were useful to
them.
The information provided by the
organization seems to be very important
to both the officials in the government as
well as to the persons from the media.
Table 4.3 shows that hundred per cent of
respondents endorsed that the information
sent by KSNDMC is vital and help to
take proper precautions and decisions not
only during emergencies, but also for day
to day administration. Hence everybody
reported that the services should be
continued.
4.3: PROBLEMS
A few problems were reported by the
officials. The main problem pertains to
the information sent as SMS to several
officials was not related to their present
place of work. It pertains to either their
earlier work place or prior to that.
However, the officials reported that they
will call KSNDMC whenever they need
information. On enquiry with the officials
of KSNDMC, it was found that the
concerned officials did not inform the
KSNDMC as soon as the officials get
transferred to a new place. The place of
transfer is important as it would enable
the organization to update the transfer
details especially the new place of work.
Similarly, the official or personal
telephone (Mobile) numbers registered
with KSNDMC should be reported to the
KSNDMC soon after transfer of staff.

Page 41
CHAPTER 5: SUMMARY AND RECOMMENDATIONS
5.1 Summary
Scientists and technocrats offer several
measures to mitigate impact of the natural
disasters. They also help the administration
to take proper rehabilitative measures to
comfort the affected population. Of late,
science and technology has offered several
inventions to forecast the occurrence of
such disasters well in advance such that the
concerned administration could take proper
measures and mitigate the adverse
implications of the natural disasters on
human population. In this direction, the
Karnataka State Natural Disaster
Monitoring Centre (KSNDMC) is
providing several services to the people
of Karnataka and the Government not
only to take timely and proactive steps to
prevent and get away from the sloth of
disaster caused by various natural
disasters but also enable the farmer to
improve the farm output and reduce the
cost of cultivation.
Disaster Management is multidisciplinary
and has complexity of information
sharing and reporting. It comprises
installation of field monitoring sensors -
weather, geological, hydrological,
collection of data on real time,
transmission of the same to a central
computational/analysis centre, data
processing, analysis, alert recognition,
simulation through appropriate
mathematical models, customized report
generation, dissemination of the
information through the alerts, reports
and advisories to the users.
The evaluation study formulated the
following twin objectives:
To analyze the perception of
beneficiaries and stakeholders
who use the various services
provided by the KSNDMC.
To suggest appropriate and
suitable measures to improve the
existing system.
An attempt was made to study the impact
of the services of the KSNDMC on
various beneficiaries and stakeholders
starting from the top government officials
to the farmers in the field. The study was
mainly based on telephonic interviews
and emails with the stakeholders by using
a structured questionnaire to collect the
quantitative data..

Page 42
The KSNDMC has provided about 122
telephone numbers of farmers who
approached the Helpdesk to seek the
assistance of its services. We tried to
approach all the farmers and tried calling
the numbers provided by them. Out of
122 numbers called, we were able to get
responses from 91 farmers.
The main source of information for
farmers and general public about the
services of KSNDMC organization was
through Media which includes News
Papers, Television and the Radio. Later
on, the information was spread across the
farmer community through their
friendship network and relatives, by the
officials of the Agricultural department
through neighbourhood gossips, etc. For
the officials and media it was through the
emails and the SMS sent by the
KSNDMC.
A large share (90 per cent) of farmers
who contacted the Helpdesk for
information had called the Helpdesk for
more than 5 times. Majority (89 per cent)
had discussions with KSNDMC Helpdesk
for about 2 minutes to 10 minutes. About
32 per cent of the sample farmers have
started to contact the KSNDMC Helpdesk
since 10 to 12 months followed by 29.69
per cent who were calling the KSNDMC
Helpdesk since more than a year. A large
majority (90.11 per cent) of respondents
approached the KSNDMC helpdesk to know
the possibility of rain during the next few
days (within two- three days).
About 38 per cent of respondents
reported that they had used the
information for taking a decision prior to
sowing the seed. Few farmers have
reported that they had to postpone the
sowing operations due to rain and few
others had took a decision to make
preparations for sowing based on the
information availed from the Helpdesk.
Similarly 26.37 per cent of respondents
have used the information prior to
irrigation decisions. Another 26.37 per
cent of respondents have used the
information to make preparation for
harvesting the crop and also for threshing.
Few farmers used it prior to applying
pesticides and fertilizers (13.19 per cent).
About 97 per cent of respondents have
shared the information either with other
farmers or with their friends and other
village members. About 46.16 per cent
reported that they shared the information
with friends and other farmers. They used
the information and accordingly several
of them had either postponed the sowing
operations and harvesting or both due to
rain or make preparations for sowing or
harvesting accordingly.
Page 43
Prior to the availability of the services
from the KSNDMC, several farmers
reported that they depended on traditional
knowledge for agricultural operations.
Several farmers reported that they had
rains several times in the past after
sowing the seed using the irrigation
facility. Since draining out the excess
water was a problem, the seeds start to
decay resulting in total loss. 50 per cent
of farmers reported that due to water
logging the percentage of germination
was low which resulted in low yields. In
addition, many reported that they had
undergone loss due to rains immediately
after spraying, pesticides and also
application of fertilizers (96.43 per cent).
Therefore, the information provided by
KSNDMC becomes quite useful.
The above analysis not only endorse the
general impressions of the people who
are receiving the technical advice from
KSNDMC Helpdesk but it also confirms
that farmers can make profits and reduce
losses by seeking information from
KSNDMC Helpdesk and taking decisions
appropriately. While farmers seek the
information from the KSNDMC, the
organization provides the information to
the bureaucracy, media, and other
research institutions and organizations.
Such information seems to be very
important to both the officials in the
government as well as to the persons
from the media. This is evident as cent
per cent of respondents endorsed that the
information sent by KSNDMC is vital
and help to take proper precautions and
decisions not only during emergencies,
but also for day to day administration.
Hence everybody reported that the
services should be continued.
The main problem reported by the
officials was that the information
provided by the KSNDMC to the officials
was not related to their present place of
work but pertains to the place of their
immediate transfer or of the earlier place
of work. The telephone (Mobile) numbers
registered with KSNDMC either official
or personal should be reported to the
KSNDMC soon after transfer of staff in
order to update the transfer details
especially the new place of work.
Updating of information about the change
in the mobile numbers is quintessential
for the use of information provided.
In executing its work in providing a
common platform to the various
stakeholders both across the government
officials at the district and taluk levels
and the farmers, the KSNDMC Helpdesk
facility has fared quite well with positive
response throughout. About 69 per cent
of the respondents have rated the services

Page 44
of the organization as ‘excellent’
followed by 24.18 per cent rated as ‘very
good’. The remaining 7.69 per cent of
respondents rated the services of the
KSNDMC organization as ‘good’.
5.2 Recommendations
Some of the suggestions arising out of the
discussions with the farmers and officials
are given below
If possible additional data on
technological options such as
temperature and humidity along with
the wind speed and cloud movement
to be supplemented as part of the
daily SMS.
The SMS facility to be extended to
the lower level field staff who work
at the Panchayat and Hobli level
with the information pertaining to
the particular Hobli and Panchayat
level. This could be achieved
through two or three layer
communication, one based at District
and another at Hobli level.
Like rainfall data, it would be useful
if the information (forecast)
regarding the probability of
occurrence of pests and diseases to
crops. Such information could be
provided by the Department of
Agriculture.
KSNDMC should send a proposal
to the GOK to provide mobile
phone numbers and the place of
transfer of officials, such that the
official receives the information of
the concerned place only.
In addition to the Hobli level
information, it would be useful if
the information pertains to an area
which falls under a particular
problem such as landslide, floods,
drought, cyclone, etc by labeling the
zone as “Flood Zone” or Cyclone
Zone”, which may cover more than
one taluk or district or and call them
as “Hot Spots”.
Expand the list of recipients to
include some peripheral
functionaries.
Phase out the traditional manual
rain gauges as telemetric rain
gauges provide quick information.
All officials concerned should be
provided with “Mobile Phones”
who use the KSNDMC services for
day to day administration and also
transfer the information to the
general public.

Page 45
APPENDIX
Appendix.1: Official responses
Is it useful for you Frequency Per cent
Yes 103 81.10
Not Applicable 23 18.11
No 1 0.79
Total 127 100.00
Appendix.2: Additional farmers’ data
Getting information after any problem Frequency Per cent
No 27 29.67
Not applicable 64 70.33
Total 91 100

Page 46
Appendix.3: Distribution of respondents’ by household income (Rs. in Lakhs)
District Name Not Mentioned 0-0.5 0.5-1 1-2 2-5 Above 5 TOTAL
Bagalkot 2 2 1 0 1 2 8
Bangaloreurban 0 0 0 0 0 0 0
Bangalorerural 0 0 0 0 0 0 0
Belgaum 1 0 0 0 0 0 1
Bellary 0 1 0 0 1 0 2
Bidar 1 0 0 1 0 0 2
Bijapur 2 1 0 1 1 1 6
Chamarajanagar 0 1 1 0 0 0 2
Chikkaballapura 2 0 0 0 1 0 3
Chikmagalur 2 0 2 1 1 0 6
Chitradurga 4 1 0 0 0 0 5
Dakshinakannada 0 0 0 0 0 0 0
Davanagere 0 0 0 0 0 1 1
Dharwad 0 1 1 0 0 0 2
Gadag 4 2 0 0 4 1 11
Gulbarga 1 3 0 1 0 0 5
Hassan 0 1 0 0 0 0 1
Haveri 4 0 0 2 2 1 9
Kodagu 0 0 0 0 0 0 0
Kolar 0 0 0 0 0 0 0
Koppal 0 2 0 0 0 0 2
Mandya 0 0 0 0 0 0 0
Mysore 1 0 0 0 0 0 1
Raichur 0 1 0 1 0 0 2
Ramanagara 0 0 0 0 0 0 0
Shimoga 0 0 0 1 1 0 2
Tumkur 2 2 0 1 2 1 8
Udupi 0 2 0 0 0 0 2
Uttarakannada 0 0 0 1 0 0 1
Yadgir 2 0 1 3 2 1 9
Total 28 20 6 13 16 8 91

Page 47
Appendix.4: Distribution of respondents’ by type of land Owned
District Name Landless Marginal Small Semi Medium Medium Large Total
Bagalkot 0 1 0 2 2 3 8
Bangaloreurban 0 0 0 0 0 0 0
Bangalorerural 0 0 0 0 0 0 0
Belgaum 0 0 0 0 1 0 1
Bellary 1 0 0 0 0 1 2
Bidar 0 0 0 0 2 0 2
Bijapur 0 0 0 1 2 3 6
Chamarajanagar 0 0 0 1 0 1 2
Chikkaballapura 0 0 1 0 2 0 3
Chikmagalur 0 0 1 0 4 1 6
Chitradurga 0 0 2 1 0 2 5
Dakshinakannada 0 0 0 0 0 0 0
Davanagere 0 0 0 0 1 0 1
Dharwad 0 0 0 0 1 1 2
Gadag 0 0 1 1 1 8 11
Gulbarga 0 0 0 1 3 1 5
Hassan 0 1 0 0 0 0 1
Haveri 0 1 0 4 1 3 9
Kodagu 0 0 0 0 0 0 0
Kolar 0 0 0 0 0 0 0
Koppal 0 0 1 1 0 0 2
Mandya 0 0 0 0 0 0 0
Mysore 0 0 0 1 0 0 1
Raichur 0 0 1 0 0 1 2
Ramanagara 0 0 0 0 0 0 0
Shimoga 0 0 0 1 1 0 2
Tumkur 0 2 2 2 1 1 8
Udupi 0 1 1 0 0 0 2
Uttarakannada 0 0 0 1 0 0 1
Yadgir 0 0 2 0 0 7 9
Total 1 6 12 17 22 33 91

Page 48
Appendix.5: Distribution of respondents’ source of information about KSNDMC
District Name Radio TV News Friends Relatives Agricultural Dept. Friends
Relatives Total
Bagalkot 0 0 4 1 2 1 0 8
Bangaloreurban 0 0 0 0 0 0 0 0
Bangalorerural 0 0 0 0 0 0 0 0
Belgaum 0 0 1 0 0 0 0 1
Bellary 1 1 0 0 0 0 0 2
Bidar 0 0 2 0 0 0 0 2
Bijapur 0 1 2 2 0 1 0 6
Chamarajanagar 0 1 1 0 0 0 0 2
Chikkaballapura 0 0 3 0 0 0 0 3
Chikmagalur 0 0 2 2 2 0 0 6
Chitradurga 1 0 3 1 0 0 0 5
Dakshinakannada 0 0 0 0 0 0 0 0
Davanagere 0 0 1 0 0 0 0 1
Dharwad 0 0 0 1 0 1 0 2
Gadag 0 2 4 1 2 2 0 11
Gulbarga 0 0 4 0 0 0 1 5
Hassan 0 1 0 0 0 0 0 1
Haveri 0 1 3 4 0 1 0 9
Kodagu 0 0 0 0 0 0 0 0
Kolar 0 0 0 0 0 0 0 0
Koppal 0 0 2 0 0 0 0 2
Mandya 0 0 0 0 0 0 0 0
Mysore 0 0 1 0 0 0 0 1
Raichur 0 0 0 2 0 0 0 2
Ramanagara 0 0 0 0 0 0 0 0
Shimoga 1 0 1 0 0 0 0 2
Tumkur 0 0 4 4 0 0 0 8
Udupi 1 0 0 1 0 0 0 2
Uttarakannada 0 0 0 1 0 0 0 1
Yadgir 1 1 0 6 1 0 0 9
Total 5 8 38 26 7 6 1 91

Page 49
Appendix.6: Distribution of number of respondents’ contacted KSNDMC
District Name No of Respondents
Bagalkot 8
Bangaloreurban 0
Bangalorerural 0
Belgaum 1
Bellary 2
Bidar 2
Bijapur 6
Chamarajanagar 2
Chikkaballapura 3
Chikmagalur 6
Chitradurga 5
Dakshinakannada 0
Davanagere 1
Dharwad 2
Gadag 11
Gulbarga 5
Hassan 1
Haveri 9
Kodagu 0
Kolar 0
Koppal 2
Mandya 0
Mysore 1
Raichur 2
Ramanagara 0
Shimoga 2
Tumkur 8
Udupi 2
Uttarakannada 1
Yadgir 9
Total 91

Page 50
Appendix.7: Distribution of time frame of information sought from KSNDMC by
respondents
District Name 3 Months 4-6Months 7-9 Months 10-12 Months More Than A Year Total
Bagalkot 0 2 0 5 1 8
Bangaloreurban 0 0 0 0 0 0
Bangalorerural 0 0 0 0 0 0
Belgaum 0 0 0 1 0 1
Bellary 0 0 0 0 2 2
Bidar 0 0 0 2 0 2
Bijapur 1 1 1 2 1 6
Chamarajanagar 1 0 0 1 0 2
Chikkaballapura 0 1 0 1 1 3
Chikmagalur 1 3 1 1 0 6
Chitradurga 1 1 1 1 1 5
Dakshinakannada 0 0 0 0 0 0
Davanagere 0 1 0 0 0 1
Dharwad 0 0 1 1 0 2
Gadag 0 1 1 3 6 11
Gulbarga 1 1 0 3 0 5
Hassan 0 0 0 0 1 1
Haveri 1 1 0 1 6 9
Kodagu 0 0 0 0 0 0
Kolar 0 0 0 0 0 0
Koppal 0 0 0 1 1 2
Mandya 0 0 0 0 0 0
Mysore 0 0 0 1 0 1
Raichur 0 1 1 0 0 2
Ramanagara 0 0 0 0 0 0
Shimoga 0 1 0 0 1 2
Tumkur 2 1 0 5 0 8
Udupi 1 0 0 0 1 2
Uttarakannada 0 1 0 0 0 1
Yadgir 0 3 1 0 5 9
Total 9 19 7 29 27 91
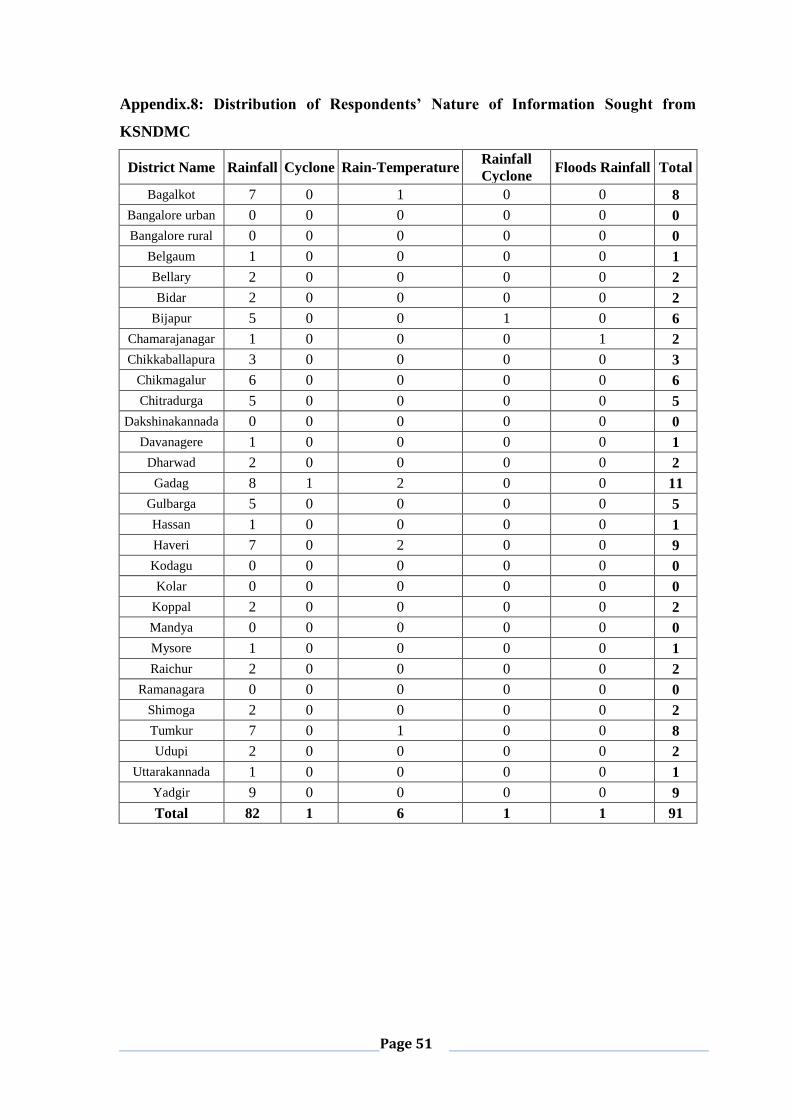
Page 51
Appendix.8: Distribution of Respondents’ Nature of Information Sought from
KSNDMC
District Name Rainfall Cyclone Rain-Temperature Rainfall
Cyclone Floods Rainfall Total
Bagalkot 7 0 1 0 0 8
Bangalore urban 0 0 0 0 0 0
Bangalore rural 0 0 0 0 0 0
Belgaum 1 0 0 0 0 1
Bellary 2 0 0 0 0 2
Bidar 2 0 0 0 0 2
Bijapur 5 0 0 1 0 6
Chamarajanagar 1 0 0 0 1 2
Chikkaballapura 3 0 0 0 0 3
Chikmagalur 6 0 0 0 0 6
Chitradurga 5 0 0 0 0 5
Dakshinakannada 0 0 0 0 0 0
Davanagere 1 0 0 0 0 1
Dharwad 2 0 0 0 0 2
Gadag 8 1 2 0 0 11
Gulbarga 5 0 0 0 0 5
Hassan 1 0 0 0 0 1
Haveri 7 0 2 0 0 9
Kodagu 0 0 0 0 0 0
Kolar 0 0 0 0 0 0
Koppal 2 0 0 0 0 2
Mandya 0 0 0 0 0 0
Mysore 1 0 0 0 0 1
Raichur 2 0 0 0 0 2
Ramanagara 0 0 0 0 0 0
Shimoga 2 0 0 0 0 2
Tumkur 7 0 1 0 0 8
Udupi 2 0 0 0 0 2
Uttarakannada 1 0 0 0 0 1
Yadgir 9 0 0 0 0 9
Total 82 1 6 1 1 91

Page 52
Appendix.9: Distribution of Respondents by Usage of Information Sought from
KSNDMC
District Name Crop
Sowing
Providing
Irrigation
Rainfall
and
Temperature
Chemicals
to Spray
and Fertilizers
Street
Play
Brick
Making Total
Bagalkote 5 1 1 1 0 0 8
Belgaum 1 0 0 0 0 0 1
Bellary 1 0 0 0 1 0 2
Bidar 1 0 0 1 0 0 2
Bijapur 2 3 1 0 0 0 6
Chamarajanagara 2 0 0 0 0 0 2
Chickaballapura 1 1 0 1 0 0 3
Chickmagalur 2 3 1 0 0 0 6
Chitradurga 2 2 0 1 0 0 5
Davanagere 0 1 0 0 0 0 1
Dharwad 2 0 0 0 0 0 2
Gadag 9 2 0 0 0 0 11
Gulbarga 4 1 0 0 0 0 5
Hassan 0 1 0 0 0 0 1
Haveri 5 1 1 2 0 0 9
Karwar 1 0 0 0 0 0 1
Koppal 1 0 1 0 0 0 2
Mysore 1 0 0 0 0 0 1
Raichur 2 0 0 0 0 0 2
Shimoga 1 0 1 0 0 0 2
Tumkur 3 1 0 3 0 1 8
Udupi 2 0 0 0 0 0 2
Yadgir 5 2 0 2 0 0 9
Total 53 19 6 11 1 1 91
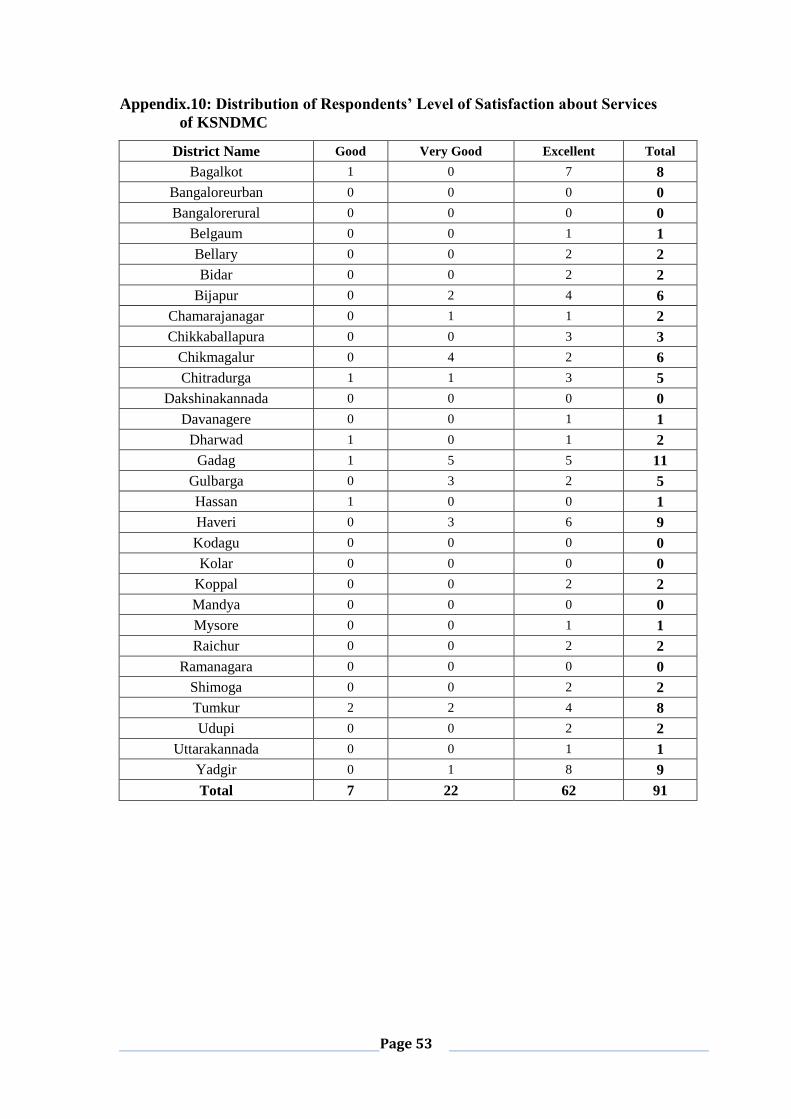
Page 53
Appendix.10: Distribution of Respondents’ Level of Satisfaction about Services
of KSNDMC
District Name Good Very Good Excellent Total
Bagalkot 1 0 7 8
Bangaloreurban 0 0 0 0
Bangalorerural 0 0 0 0
Belgaum 0 0 1 1
Bellary 0 0 2 2
Bidar 0 0 2 2
Bijapur 0 2 4 6
Chamarajanagar 0 1 1 2
Chikkaballapura 0 0 3 3
Chikmagalur 0 4 2 6
Chitradurga 1 1 3 5
Dakshinakannada 0 0 0 0
Davanagere 0 0 1 1
Dharwad 1 0 1 2
Gadag 1 5 5 11
Gulbarga 0 3 2 5
Hassan 1 0 0 1
Haveri 0 3 6 9
Kodagu 0 0 0 0
Kolar 0 0 0 0
Koppal 0 0 2 2
Mandya 0 0 0 0
Mysore 0 0 1 1
Raichur 0 0 2 2
Ramanagara 0 0 0 0
Shimoga 0 0 2 2
Tumkur 2 2 4 8
Udupi 0 0 2 2
Uttarakannada 0 0 1 1
Yadgir 0 1 8 9
Total 7 22 62 91

Page 54
Appendix 11: Questionnaire for Officials
Are you receiving rainfall data as SMS on your mobile being disseminated from
KSNDMC?
Yes
No
How do you rate the programme at SL no 1?
Excellent
Very Good
Good
Fair
Unsatisfactory
Are you receiving high intensity rainfall alerts / very heavy rainfall alerts / heavy
rainfall alerts?
Yes
No
How do you rate the information at Sl. No. 3 on a scale of 1 to 10? ( )
Are you receiving the rainfall forecasts details?
Yes
No
Are you receiving the severe weather warnings from KSNDMC?
Yes
No
Are you receiving daily reports of KSNDMC?
Yes
No
Your overall assessment of the services of KSNDMC
Excellent
Very Good
Good
Fair
Poor

Page 55
Appendix 12: Questionnaire for Farmers
Respondent Name ……………………………………………….
Village
Hobali
Taluk
District
Gender Male Female
Age(year) 10-20 20-30 30-40 40-50 > 50
Educational
Background Primary High
School Diploma Graduate
Others
Number of family
members 0-5 5-10 Above 10
Income(Annually)
Total Land owned (in Hectares)
a. Marginal
(Less than 1h)
b. Small
(1. to 2.)
c. Semi-Medium
(2. to 4.)
d. Medium
(4. to 10.)
e. Large
(> 10)
Type of Ownership
Single Joint
From where did you get to know about Help Desk
Radio TV News Friends Govt or NGOs
How many calls have you made till now?.........................
How long you are the getting information from Helpdesk
a.3 Months b. 6 Months c. 9 Months d. 1 Years e. > 1 year
Regarding which issue you generally contact the Helpdesk?
Drought flood Rainfall Earthquake Landslide cyclone Temperature Tsunami
winds
Annually how many crops do you sow in the land
1 2 3 > 3

Page 56
How much time will you spend to take information from the department over phone
(minute)
0-5 5-10 10-15 >15
What is the satisfaction level from this department
poor Ok good excellent
Among whom your sharing the information which is provided by the department
Neighbors Friends Village
Member
Relatives Others
Any suggestion you would like to give for this Department
……………………………………………
Has he implemented the services?
Was it useful for him?
By sharing the information has the farmer implemented the same?
What kind of crops will he grow, food or commercial?
How much time did you spend in connecting to a phone line?
What was the initial reaction from the department?
Did you get sufficient time to discuss with the concerned person?

Page 57
Appendix 13: List of Farmers Contacted
SL NO DATE CONTACT NUMBERS REMARKS
1 8/2/2012 9164825449 Response
2 8/2/2012 9632985523 Response
3 8/2/2012 9964097202 Doesn't exist
4 8/2/2012 9591347771 Response
5 8/2/2012 7760000370 Response
6 9/2/2012 9902338933 Response
7 9/2/2012 8105121589 No response
8 9/2/2012 9535442175 Response
9 9/2/2012 8748878795 Response
10 10/2/2012 9740489134 Response
11 10/2/2012 9008856357 Response
12 10/2/2012 9611189594 Response
13 10/2/2012 9480749779 Switched off
14 10/2/2012 9880088984 Response
15 10/2/2012 9844232134 Response
16 10/2/2012 7411508292 Switch off
17 10/2/2012 9916610439 Response
18 10/2/2012 9620491157 Temporarily out of service
19 10/2/2012 9980784788 No response
20 10/2/2012 9980957389 Not Reachable
21 10/2/2012 9008895290 response
22 10/2/2012 9844882733 Not Reachable
23 10/2/2012 9972679578 Response
24 10/2/2012 9591934140 Response
25 10/2/2012 9972679578 Response
26 14/2/2012 9663670411 Response
27 14/2/2012 94481137115 wrong number

Page 58
28 14/2/2012 9902472630 Response
29 14/02/2012 9880750148 Response
30 14/02/2012 9901163479 Response
31 14/02/2012 9945221791 Response
32 14/02/2012 9980508584 Response
33 14/02/2012 9481349497 Response
34 14/02/2012 9741798555 Response
35 14/02/2012 9964065021 No response
36 14/02/2012 8867226961 Response
37 14/02/2012 9901100408 Response
38 21/02/2012 9900776432 Response
39 21/02/2012 9743067390 Response
40 21/02/2012 9448641806 Response
41 21/02/2012 9972777759 Response
42 21/02/2012 9448576703 Response
43 21/02/2012 9481349497 Response
44 23/02/2012 9743054333 Response
45 23/02/2012 08970-464584 Response
46 23/02/2012 9901003968 Response
47 23/02/2012 9449693547 Response
48 23/02/2012 9844150509 Switched off
49 23/02/2012 9742054918 Response
50 23/02/2012 9901780986 Response
51 23/02/2012 9449945322 No response
52 23/02/2012 08362-793939 Response
53 23/02/2012 9591644184 Response
54 24/02/2012 9448337115 Response
55 24/02/2012 9972324802 Not reachable
56 24/02/2012 9886067899 Temporarily out service
57 24/02/2012 9916603174 Response
58 24/02/2012 9164204002 Doesn’t exist
59 24/02/2012 9739441111 Response
60 24/02/2012 9740424170 Response
61 24/02/2012 9448100754 Response
62 24/02/2012 9740312530 Response
63 24/02/2012 08197-787759 Response

Page 59
64 24/02/2012 9480073070 Response
65 27/02/2012 9972784144 Switched off
66 27/02/2012 9902836214 Response
67 27/02/2012 9902451732 Response
68 27/02/2012 9611035005 Response
69 27/02/2012 8971366609 Response
70 27/02/2012 9731249102 Response
71 1/3/2012 9448435232 Response
72 1/3/2012 9731961059 Response
73 1/3/2012 9480148004 Response
74 1/3/2012 9844998258 Response
75 1/3/2012 9901002387 No response
76 1/3/2012 9845111344 Doesn’t exist
77 1/3/2012 9900762644 No response
78 1/3/2012 8971169841 Response
79 2/3/2012 8869605710 Doesn’t exist
80 2/3/2012 9845383844 Response
81 2/3/2012 9141402082 Switched off
82 2/3/2012 9741830311 No response
83 2/3/2012 9742633496 No response
84 2/3/2012 9980428271 Response
85 2/3/2012 9945209921 Response
86 2/3/2012 9620411019 Response
87 2/3/2012 9448670060 Response
88 2/3/2012 9880862303 Response
89 2/3/2012 948088845 wrong number
90 2/3/2012 9845235439 Response
91 2/3/2012 08384-272602 Response
92 27/3/2012 8277659282 Not reachable
93 27/3/2012 9663752854 Response
94 27/3/2012 9886692829 Response
95 27/3/2012 9845419011 Response
96 27/3/2012 8722709977 Response
97 29/3/2012 9480378229 Response
98 29/3/2012 9880498034 No response
99 29/3/2012 8181254635 Doesn’t exist

Page 60
100 29/3/2012 8861845342 Response
101 29/3/2012 9242230017 Response
102 29/3/2012 8722377148 Response
103 29/3/2012 9538570454 Response
104 29/3/2012 9008075691 Response
105 29/3/2012 9902589492 Response
106 29/3/2012 9535060096 Response
107 29/3/2012 9945320530 Response
108 29/3/2012 9972570721 Response
109 30/3/2012 8272225732 Doesn’t exist
110 30/3/2012 9731249102 Response
111 30/3/2012 9620993042 Response
112 30/3/2012 9620880095 no response
113 30/3/2012 9743470798 Response
114 30/3/2012 9742633496 Response
115 30/3/2012 9480417797 Doesn’t exist
116 30/3/2012 8762469753 Response
117 2/4/2012 9448211179 Response
118 2/4/2012 9449246881 Response
119 2/4/2012 8722709977 Response
120 2/4/2012 9901573698 Response
121 2/4/2012 9845227597 Response
122 3/4/2012 9742672902 No response


