60
IMPACT EVALUATION OF LABOUR MARKET TRAINING Estonian Unemployment Insurance Fund Anne Lauringson Kristi Villsaar Liis Tammik Teele Luhavee December 2011

IMPACT EVALUATION OF LABOUR MARKET TRAINING
Estonian Unemployment Insurance Fund
Anne Lauringson
Kristi Villsaar
Liis Tammik
Teele Luhavee
December 2011

Estonian Unemployment Insurance Fund. Impact Evaluation of Training
2
TABLE OF CONTENTS
INTRODUCTION ....................................................................................................................................... 4
1. CONTENT AND PRINCIPLES OF TRAINING IN PERIODS UNDER STUDY ............................................... 5
2. EVALUATION METHODS ...................................................................................................................... 8
3. PREVIOUS EVALUATIONS OF TRAINING IMPACT IN ESTONIA AND OTHER COUNTRIES .................. 11
4. DATA USED FOR ANALYSIS ................................................................................................................ 14
5. IMPACT OF TRAINING ON EMPLOYMENT AND INCOME .................................................................. 22
5.1. Impact of occupational training ................................................................................................. 22
5.1.1. Impact of training on income from wage ........................................................................... 22
5.1.2. Impact of training on employment ..................................................................................... 24
5.1.3. Impact of training on wage ................................................................................................. 27
5.1.4. Impact of training on unemployment benefit expenses .................................................... 28
5.2. Impact of Estonian language courses ........................................................................................ 30
5.3. Impact of personalised training voucher and procured training in 2010 .................................. 32
5.4. Impact of occupational training by socio-demographic characteristics .................................... 34
5.4.1. Impact of training by gender............................................................................................... 34
5.4.2. Impact of training by age .................................................................................................... 35
5.4.3. Impact of training by duration of unemployment .............................................................. 36
5.4.4. Impact of training by education level ................................................................................. 38
5.4.5. Impact of training by main language of communication .................................................... 38
6. COST-BENEFIT ANALYSIS OF TRAINING ............................................................................................. 40
CONCLUSIONS ....................................................................................................................................... 44
REFERENCES .......................................................................................................................................... 47
Appendix 1. Trainings finished in the periods studied by sector .......................................................... 49
Appendix 2. Description of variables used for matching ...................................................................... 50
Appendix 3. The impact of occupational training on income from wage ............................................. 52
Appendix 4. The impact of occupational training on employment ...................................................... 52
Appendix 5. The impact of occupational training on wage .................................................................. 53
Appendix 6. The impact of Estonian courses on income from wage .................................................... 53
Appendix 7. The impact of Estonian courses on employment ............................................................. 54
Appendix 8. The impact of training on employment and income from wage by procured trainings and
voucher-based trainings in 2010........................................................................................................... 54
Appendix 9. The impact of training on employment and income from wage by gender ..................... 55
Appendix 10. The impact of training on employment and income from wage by age in 2009 ........... 56

Estonian Unemployment Insurance Fund. Impact Evaluation of Training
3
Appendix 11. The impact of training on employment and income from wage by age in 2010 ........... 56
Appendix 12. The impact of training on employment and income from wage in 2009 by registered
unemployment period .......................................................................................................................... 57
Appendix 13. The impact of training on employment and income from wage in 2010 by registered
unemployment period .......................................................................................................................... 57
Appendix 14. The impact of training on employment and income from wage in 2009 by total
unemployment period .......................................................................................................................... 58
Appendix 15. The impact of training on employment and income from wage in 2010 by total
unemployment period .......................................................................................................................... 58
Appendix 16. The impact of training on employment and income from wage by education level in
2009 ...................................................................................................................................................... 59
Appendix 17. The impact of training on employment and income from wage by education level in
2010 ...................................................................................................................................................... 59
Appendix 18. The impact of training on employment and income from wage by main language ...... 60

INTRODUCTION
The objective of this analysis is to find out whether the labour market training measure provided by the Estonian Unemployment Insurance Fund in 2009 and 2010 had an impact on the labour market outcomes of the participants in the training. In particular, the analysis studies whether participation in training has increased the persons’ income from wages and employment. The periods May to September 2009 and April to October 2010 are subject to analysis. These time frames are chosen in order to be able to evaluate the impact of training during periods when different training principles applied. In 2009 the provision of training services was rather based on the wishes of the participants but in 2010 a transition to needs-based training took place. However, it is not possible to conclude on the basis of the analysis to what extent the change in principles accounts for the impact of training on the labour market outcomes, given the rapid changes in the state of the economy at the same time.
The impact of training is assessed by using propensity score matching, a method widely used in similar evaluations. Persons registered as unemployed during the same period who are statistically as similar as possible to those who completed the training are used as a control group. The results of the estimations of the impact of labour market training on labour market outcomes are used for conducting a cost-benefit analysis.
Estimations on both the 2009 and 2010 sample show that training has had a significant positive impact on both employment and income. As expected, the estimations on the 2010 sample show a higher impact of training than on the 2009 sample. For example, in the case of the 2009 sample the employment rate a year after completing the training was higher by ten percentage points than in the comparison group and in the case of the 2010 sample by almost 13 percentage points. The impact of training increased in the course of the first year after completing the training and stabilised during the second year at the level achieved by the end of the first year.
The 2010 results also show a stronger impact of training than in 2009 when broken down by the various socio-demographic characteristics (gender, age, unemployment duration, education, main language of communication). For example, training has been more useful for women, the elderly, persons with a lower level of education and those who had been unemployed for a shorter period of time. The cost-benefit analysis conducted on the basis of the 2010 estimations shows that training has been a cost-effective measure.
The first chapter of the analysis discusses in detail the changes in training principles that were implemented during the periods under study. The second chapter provides an overview of the methods used for evaluating labour market measures, focusing primarily on the methods used for this analysis. The third chapter is a brief summary of the previous studies on training services in Estonia and other countries. Chapter four is devoted to the data used in the analysis. Chapter five presents the estimation results concerning the impact of training on employment and income, whereas chapter six provides the results of cost-benefit analysis conducted on the basis of the impact estimations. The final part of this paper concludes the results.
Estonian Unemployment Insurance Fund – Impact Evaluation of Training
5
1. CONTENT AND PRINCIPLES OF TRAINING IN PERIODS UNDER
STUDY
Kristi Villsaar, Anne Lauringson
On 1 May 2009 the Estonian Unemployment Insurance Fund took over the duties of the Labour Market Board and thus the payment of unemployment benefits and provision of labour market services came under the responsibility of a single institution. In parallel with the reorganisation the principles of providing the services underwent considerable changes. A transition from providing training based on the wishes of the unemployed to a needs-based approach took place. Under the earlier arrangement the job-seekers were allowed to participate in training, which they found interesting and not much attention was paid to whether the chosen training would actually increase their competitiveness and whether there was a demand for such specialists on the labour market. Pursuant to the new principles, applied since February 2010, the unemployed can be assigned to training courses only after establishing, which type of knowledge and skills they need in order to find a new job and after analysing the regional demand for labour (labour demand/supply ratio).
The aim of labour market training is to help the unemployed find work through learning or developing the required skills and knowledge. The prospects for finding a new job are the best at the early stage of unemployment and therefore it is important to motivate such persons at that time and provide them active support in their search for a job. Following the principles of providing the services, mostly job mediation and, if necessary, assistance and counselling in job-seeking are offered during the early stage of being unemployed.
Feedback from a person’s job-seeking efforts serves as a basis for analysing1, which are the main circumstances facilitating or hindering employment and a decision is made whether training would help remedy the situation. As a rule training is considered as one possible means of increasing a job-seeker’s competitiveness if the person has failed to find a job after some period of active search. Earlier intervention could be justified in case of job-seekers belonging to a risk group (e.g. the young or long-term unemployed, persons released from prison).
According to the principles of providing labour market training, assigning a job-seeker for training is justified in case the unemployed person has not found a job despite actively seeking for a job and the reason for failing in the attempts lies in the lack or low level of the specific knowledge or skills. Given that the Unemployment Insurance Fund has the possibility to provide to the unemployed further training or retraining and not formal education, it is important that the required knowledge and skills could be acquired by undertaking short-term training. Prior to making a decision on the need to undergo training the regional labour demand and supply ratio for the speciality is carefully studied. Such preliminary analysis was used in 2010 in particular, given the small number of vacant jobs available at the time.
The training needs that have been established are entered in the information system of the Unemployment Insurance Fund. There are two possibilities for arranging labour market
1 Based on counselling in job-seeking, the job mediation consultant/case manager determines the training needs, proceeding from the principles of labour market training and, if necessary, discussing the case with a career counsellor, training consultant or employers’ consultant.
Estonian Unemployment Insurance Fund – Impact Evaluation of Training
6
services – placing an order through the Services Department or by using personalised training vouchers. The training manager uses the information gathered as a basis for deciding, which areas of training are in the highest demand and launches the procurement process for obtaining such training. After selecting the providers of services training groups are formed from the job-seekers.
Personalised training vouchers were introduced as a parallel option to procured training in October 2009. The personalised training voucher is a flexible tool to match the training as precisely as possible to the individual needs of the job-seeker. The personalised training voucher allows the unemployed take more specific training in specialities where the demand for training is not very high. The training vouchers can be used to choose a course offered by training providers approved by the Unemployment Insurance Fund. However, vouchers are not awarded for management training, general social skills or qualities training. In 2009-2010 only further training was available on the basis of training vouchers, but from 2011 they can be used for retraining as well. During one job-seeking period a customer can use up to EUR 2 500 worth of personalised training vouchers (until 31 July 2011 the ceiling was EUR 959).
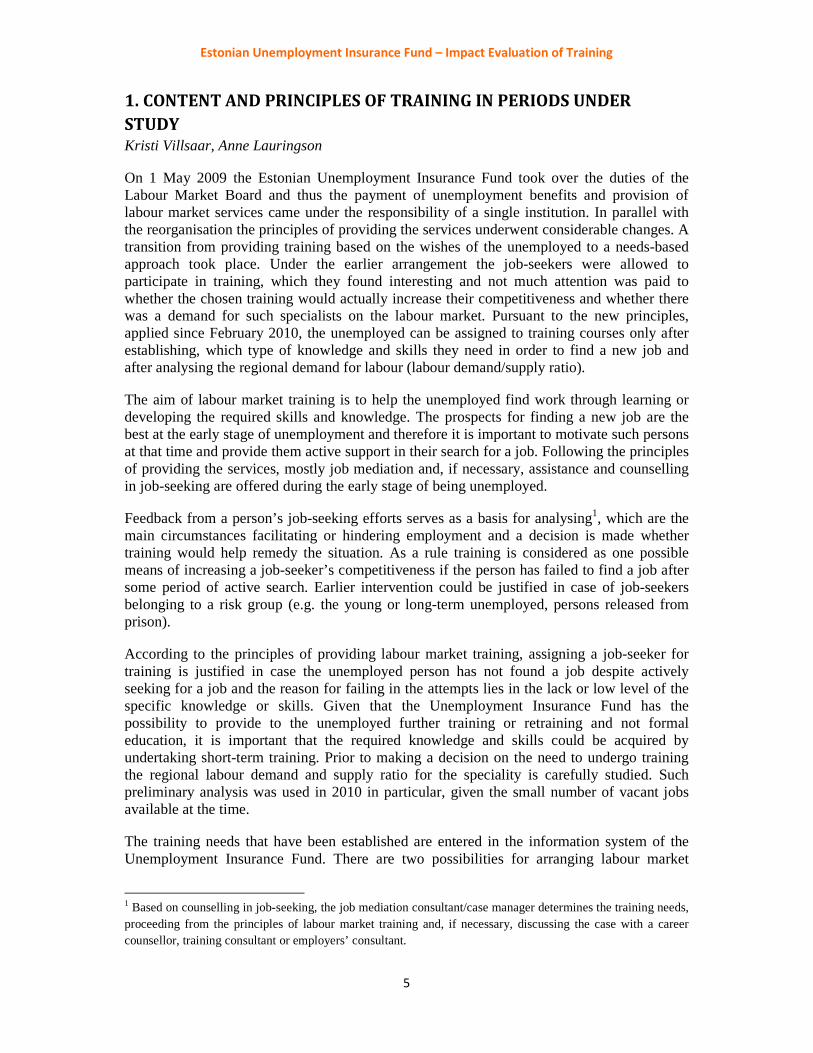
When the Estonian Unemployment Insurance Fund took over the responsibilities of the Labour Market Board, the principles of providing training services also underwent extensive changes. Therefore for the purposes of this study the impact of training is analysed separately for the participants in the two periods (Figure 1). One group is made up of those who completed their training between May 2009 and September 2009. This period concerns trainings organised at the time when the Unemployment Insurance Fund had just started operating trainings, the training vouchers had not been introduced and the new training principles did not apply yet. The other group includes persons who completed their training between April 2010 and October 2010. These constitute trainings arranged after the training vouchers were launched and the new training principles became applicable (however, at that time the training vouchers could not yet be used for retraining and the ceiling was lower).
Figure 1. Scope of impact evaluation of training
0
2000
4000
6000
8000
10000
12000
14000
16000
0
20 000
40 000
60 000
80 000
100 000
120 000
140 000
160 000
I II III IV I II III IV I II III IV I II III IV I II III
2007 2008 2009 2010 2011
Nu
mb
er
of
pa
rtic
ipa
nts
in
tra
inin
g
Nu
mb
er
of
un
em
plo
ye
d
Number of unemployed (aged 15-74) Registered unemployed (aged 16 - pension age)
Outflow from training (right axis) Inflow to training (right axis)
Entrancies to employment (I period)I period studied
II period studiedEntrancies to employment (II period)

Estonian Unemployment Insurance Fund – Impact Evaluation of Training
7
In addition to applying different labour market training principles the economic situation in the two periods differed as well. The 2009 sample falls into a period of continuing rapid increase in unemployment and a reduction in vacancies. The 2010 sample was formed in the period when unemployment had just peaked and started to fall fairly fast thereafter. Thus the level of unemployment in both periods was relatively similar, although in 2009 there was an upward trend and in 2010 a downward trend. Therefore it is quite difficult to separate the impact of the change in training principles from the effect of better training results caused by the economic situation in the two periods under study. In other words, the impact of training in the case of the 2010 sample could be slightly higher due to the fact that transition to employment was easier. Consequently, the impact estimations of training in the two periods may not be completely comparable.
Estonian Unemployment Insurance Fund – Impact Evaluation of Training
8
2. EVALUATION METHODS
Anne Lauringson
Scientific literature offers various different models for evaluating policies like active or passive labour market measures. The choice of the evaluation method depends primarily on the objective of the evaluation and the data available.
The focal issue of policy evaluation is whether the treatment of a policy affects a person in the outcome variable being studied. The outcome variables for labour market programmes usually concern employment and earnings after a treatment compared to how things would be if the treatment had not been received. As it is never possible in real life to see the outcome for the same individual following treatment and non-treatment, a fundamental evaluation problem arises (Caliendo 2006). Different evaluation strategies try to find a plausible comparison group or control group in different ways in order to overcome this problem.
Generally the best way to deal with the fundamental evaluation problem is to use experimental evaluation (also known as randomised controlled experiment or social experiment). In this case the persons are assigned randomly to the treatment and control groups. Thus experimental evaluation helps eliminate the selection bias from the mean-impact estimates and avoid the problems of identification of causal effects. However, experimental data for evaluating labour market measures are rarely available; therefore the usual approach is to find a suitable method for using non-experimental data. In recent years researchers have come to the conclusion that there is no universal method that would suit each and every set of non-experimental data. Depending on the data available (cross-sectional or longitudinal data) different methods can be used that invoke different identifying assumptions in handling selection bias. An estimator will produce consistent estimates only if the assumptions hold (Smith 2004).
Based on the treatment of selection bias the evaluation methods fall into two broad groups: 1) methods assuming that selection is based on observable characteristics; 2) methods assuming that selection is based on both observable and unobservable characteristics (Caliendo 2006). The more popular methods in the first group are matching and linear regression analysis. Methods like the before-after estimator, difference-in-differences method, the method of instrumental variables and the selection model method belong to the second group. The assumption that selection is based on observables means that selection to treatment is assumed to be determined by observable characteristics, but the selection to treatment does not depend on outcomes in the absence of treatment. Selection based on unobservables means that unobservable characteristics are also used to determine selection to treatment (Smith 2004).
With selection on observables it is sufficient for solving the selection bias problem to condition on the variables that determine selection to treatment. Though linear regression analysis is the most popular strategy when selection on observables is assumed, matching has several advantages over the linear regression approach. Above all, matching methods avoid any functional form restrictions, as the basic idea of matching is to find those persons among non-participants who are similar or identical to the participants in treatment in all relevant pre-treatment variables (Caliendo 2006). In addition, in contrast to regression, matching methods focus on the support problem that arises when there are some treated observations in the data that do not have similar untreated observations (Smith 2004). This is why matching

Estonian Unemployment Insurance Fund – Impact Evaluation of Training
9
models have gained in popularity in recent years, in particular for evaluating labour market policies.
This analysis uses the matching method for evaluating the impact of training. As mentioned above, matching has several advantages over regression analysis and can be used when selection over observables is assumed and a rich dataset is available. For matching on a higher number of observable characteristics, matching on some balancing scores (functions of relevant observables) tends to be more used than cell matching. Propensity score matching as a balancing score is particularly popular in evaluating labour market measures.
Rosenbaum and Rubin (1983) proposed the propensity score, defining it as the conditional probability of assignment to a particular treatment given a vector of observed pre-treatment variables. Propensity score matching (PSM) is a semi-parametric two-step estimation, where the first step is to estimate the propensity scores parametrically and the second step involves non-parametric comparison of these propensity scores. In the usual binary treatment case of treatment versus non-treatment, the propensity scores are usually estimated by either probit or logit models. The second step is implemented by matching the individuals with these scores; this is achieved by using a variety of algorithms (matching with nearest neighbour(s) with or without replacement, radius matching etc., see for example Caliendo and Kopeinig 2008). The choice between different algorithms is generally a trade-off between bias and variance, though asymptotically these strategies should produce the same estimation results.
The two most frequent parameters of evaluating policies found in literature are the population average treatment effect (ATE) and the average treatment effect on the treated (ATT). ATE is the average difference in expected outcome between treated and non-treated individuals. ATE is relevant for random assignment to treatment. ATT is better suited for measures focusing on specific groups in the society. Thus one could argue that ATT is of more relevance to policy-makers as it excludes the effect on those individuals for whom the measure was not intended. In the case of the PSM, ATT is the mean difference of the outcomes over the common support region2 that has been weighted with the propensity score (Caliendo and Kopeinig 2008):
ATT��� �E��| ���E�Y1�|D � 1, PX�� � E�Y0�|D � 0, PX��� where Y(1) – outcome in the situation of treatment Y(0) – outcome in the situation of no treatment D – treatment assignment (equals 1 in case of treatment received, otherwise 0) X – observed pre-treatment covariates
Although the PSM method is widely used in policy evaluation literature, there are some concerns that a researcher has to bear in mind. According to Blundell and Costa Dias (2009) the main weakness of PSM is connected to the data availability and the difficulties in choosing the right set of covariates for matching. Matching needs richer data than the “traditional” approaches and a failure to find the appropriate variables can end in biased results. Dehejia (2005) also stresses the importance of examining the sensitivity of the
2 With PSM, only those observations in the treatment and control groups that have an overlap in terms of pre-treatment variables are compared (see Dehejia and Wahba 1999). The fact that only comparable observations are analysed in matching is also considered to be one of the reasons for preferring matching over regression analysis.

Estonian Unemployment Insurance Fund – Impact Evaluation of Training
10
estimated effects to small changes in the specification of the propensity score3. As long as these concerns are kept in mind, PSM can be a powerful tool for evaluating a policy.
In this analysis the PSM method is implemented by using Stata modules by Leuven and Sianesi (2003) and Gangl (2004). Matching with one nearest neighbour with replacement is chosen as the matching algorithm. Propensity scores are estimated by probit models. Average treatment effects on the treated (ATT) are estimated over the common support area.
3 There are also some more formal tests that have been developed for assessing whether the assumption of selection on observables holds, meaning sensitivity due to unobserved heterogeneity such as Rosenbaum Bounds, see DiPrete and Gangl (2004) and Becker and Caliendo (2007).

Estonian Unemployment Insurance Fund – Impact Evaluation of Training
11
3. PREVIOUS EVALUATIONS OF TRAINING IMPACT IN ESTONIA AND
OTHER COUNTRIES
Teele Luhavee, Anne Lauringson, Kristi Villsaar
A study by Kluve (2006) is a collection of impact evaluations of the active labour market services and measures based on the data of several European countries. The focus is mainly on research conducted in the late 1990s and early 2000s. Labour market training turns out to be one of the more widely used and evaluated labour policy measures. The study by Kluve shows that different impact evaluations have produced both positive as well as negative results. However, the majority of impact evaluations of training show positive impacts. The positive effect of training programmes is most prevalent in the case of participants with better labour market prospects and women, whose employment probability increases after training. The positive effect is more evident in studies looking at long-term impacts, where it outweighs the negative locking-in effect accompanying training programmes4.
The paper studying the effectiveness of training on the basis of data from East Germany finds that refresher courses offering general and more specific knowledge produce positive medium- and long-run effects (Fitzenberger and Völter 2007). As regards retraining, the study finds positive effects only in two cases out of six. Similarly to the findings mentioned by Kluve (2006) in his conclusions, this study points to a strong short-run locking-in effect, which at the same time increases the share of benefit recipients. Participants in training are often given grants, their travel and accommodation costs are covered, leading to increased expenses on measures on the one hand and increasing the possibility of the locking-in effect on the other, for the unemployed might consider it more useful to participate in the measure than seek work.
Countries offering active labour market measures are increasingly moving towards combining labour market training conducted in classroom with on-the-job practical training. The unemployed are offered the possibility to gain knowledge through training and then put their newly acquired knowledge to practical use at the workplace. Studies have shown that such combined training might be more effective. In comparison with traditional training the combined approach increases the likelihood of positive impacts by 21-37% (Fares and Puerto 2009). The effectiveness of training programmes is further increased through cooperation with enterprises in determining their training needs and conducting the actual training. Structural unemployment is reduced as a result of supplementing the persons’ knowledge in areas required by the employers. Participation of enterprises in the training process allows the employers to choose suitable staff already during the training, as they can have a better understanding of the qualifications of the new employees.
In a study evaluating training programmes on the basis of Swedish data Sianesi (2008) observed a negative impact of both training and workplace practice on increasing employment among the unemployed. The employment rate among the participants was lower than among those who did not participate in the programme and they were also more likely to
4 Active labour market measures also bring about some negative influences on the labour market, which reduce the benefits resulting from the measures. One negative example is the so-called locking-in effect, observed in participants of active labour market programmes. Due to participation in the programmes the intensity of job search declines and the persons remain unemployed over a longer period of time. This could even happen ahead of joining a programme, if the unemployed person knows in advance that he/she has to join a measure. The more attractive and useful the programme offered seems to the unemployed person, the stronger the locking-in effect (Calmfors 1994).
Estonian Unemployment Insurance Fund – Impact Evaluation of Training
12
receive benefits. The negative impact can be explained by the situation on the labour market at the time, which did not support employment, but also by the fact that by participating in some measures the unemployed regained the right to benefits. At the same time the Swedish measures studied also included elements that were not directly necessary for carrying out ordinary work tasks at ordinary workplaces. The unemployed benefit more from such labour market training, which gives them practical skills for future work, which is considered useful by the employers and for which there is a demand. This was also proven by the evaluation in Sweden of the measure where the unemployed stood in for employees who were on temporary study leave. Such workplace training had a positive impact on the subsequent employment of the unemployed persons (Sianesi 2008).
Betcherman, Olivas and Dar (2004) have composed a thorough review of the impacts of various active measures with particular attention to the labour markets of developing and transition countries. They examined 49 evaluations of training programmes and found both positive and negative results. The positive impact occurred mostly with regards to employment; the effect on future earnings was less significant or of lower magnitude. The impact of training was found to depend to a large extent on the type of training. Like Kluve (2006), this study showed that trainings conducted in enterprises and with the participation of employers produced better results than training in classroom. Training leading to formal qualifications also had a more positive impact. Impact evaluations of training programmes conducted in transition countries show that training always has had a positive effect on employment in those countries, whereas the effect on wages has been neutral or negative. In the short run the impact was the same for both men and women, but in the long run the positive effect of training occurred only for women. This study also establishes that training programmes in transition countries are more cost-effective. In general, training is more effective during good times in the economy.
The impact and effectiveness of active labour market policies have not been studied extensively in Estonia. One of the more in-depth analyses was carried out by the Praxis Center for Policy Studies (Leetmaa et al. 2003). The Praxis study looked at persons who had participated in the active measures ending in 2000 and evaluated their employment status about two years later (in September 2002). Different methods were applied to evaluate the impact of training. Both the gross impact and net impact of training were evaluated. The linear regression model and statistical matching were used for determining the net impact. All the methods produced qualitatively similar results. First, it was established that participants in training (the treatment group) were more likely to be employed after receiving training than those who did not participate in training. Secondly, the impact of training was found to increase in time, i.e. as more time passed from the end of training the difference between the treatment group and the control group increased. A comparison of wages led to the conclusion that there was no significant statistical difference in wages between the treatment and the control group. Thus, the study concluded that participation in labour market training does not help find more highly paid jobs, it just helps find jobs.
The authors of the Praxis study evaluated the suitability of the different methods and concluded that statistical matching gave the most accurate results, while comparison of the averages and linear regression led to results, which appeared to slightly overestimate the impact of training. Matching showed that participation in training increased the likelihood of employment two years after completing the programme by 7%. The authors also analysed the change in time of the impact of training: the impact turned positive 4-5 months after finishing training; stayed around 6-7 percentage points from month 5 to 16 and climbed to 15% two

Estonian Unemployment Insurance Fund – Impact Evaluation of Training
13
years after the end of the programme. The cost-benefit analysis showed that the gross impact for the society as a whole was positive. Assuming that the impact of training on the likelihood of employment is 7% and that the impact lasts three years, each Estonian kroon invested in training returned 2.8 Estonian kroons for the society.
Leping (2004) has used the same data as Leetmaa et al. in their 2003 analysis to evaluate the impact of labour market training by types of training. The study distinguished between general programmes (computer and language studies) and specific training (all other trainings). Specific training turned out to increase the likelihood of employment more than general programmes, which had no significant positive effect. Moreover, his analysis confirmed the fact that the impact of labour market training on the likelihood of employment in general is positive and increases in time.
Studies of labour market measures conducted outside Estonia have pointed to both the locking-in effect and the threat effect5. Lauringson (2011) has studied both effects on the basis of Estonian measures. The analysis used the data of recipients of unemployment benefits during the crisis period (2008-2010) and showed that the locking-in effect related to the active measures (incl. occupational training and Estonian language courses) also occurred in Estonia. At the time of being enrolled in a programme the unemployed were slower in entering employment (either because they had less time for job search or had decided to complete the training before resuming job search). Several foreign studies have found the presence of the threat effect, which increases the intensity of job search; however, in Estonia’s case an opposite effect has occurred. Namely, prior to enrolment in a measure the rate of exiting unemployment among the unemployed participating in the measure was lower than that of non-participants. The reason for such effect could lie in the fact that participation in the measures is not mandatory in Estonia (as opposed for example to Denmark). If the unemployed can decide whether to agree to participate in a measure, they are more inclined towards participating in the measure, hoping that it would help them to find a job later. As a result job search becomes less intensive before and during participation in a programme.
In general, evaluation of the impact of training has produced similar results in Estonia as in other countries. Usually the impact is regarded as positive, but differences can be observed by types of training. As a rule the impact of training is noted to increase in time after the completion of training.
5 The locking-in effect reduces the intensity of job search; however, there is also an opposite phenomenon – the threat effect – arising from the threat of being made to participate in active labour market programmes. Participation in these programmes is not an attractive prospect for some unemployed persons. They consider it a waste of time and effort with limited results. Thus, they increase their search activity and lower their reservation wages, in order to get a job sooner and avoid being drawn into a programme (Rosholm, Svarer 2004). Taking the threat effect into account active labour market programmes could also reduce the period of unemployment.

Estonian Unemployment Insurance Fund – Impact Evaluation of Training
14
4. DATA USED FOR ANALYSIS
Kristi Villsaar, Anne Lauringson, Liis Tammik, Teele Luhavee
The following data about the registered unemployed are used in this analysis for evaluating the impact of labour market training offered for the unemployed: socio-demographic characteristics (gender, age, education etc.), prior periods of employment and unemployment, participation in various services and unemployment benefits received. The Tax and Customs Board administrative data concerning declared wages are used for observing the labour market outcome variables (income and transition to employment). The personal identification code links the data in the Unemployment Insurance Fund with those of the Tax and Customs Board, creating a database for statistical analysis.
Although the database of the Unemployment Insurance Fund includes also data about the reasons for de-registering as unemployed (e.g. taking up a job) the data from the Tax and Customs Board are used, for the latter are more accurate. Comparisons of the data from the Unemployment Insurance Fund and the data from the Tax and Customs Board have revealed that according to the Tax and Customs Board the share of unemployed persons who have entered employment is about 10% to 15% larger than known to the Unemployment Insurance Fund. In addition, the data from the Tax and Customs Board can also be used for analysing wages received.
In addition to working as salaried employees the unemployed can enter employment by becoming entrepreneurs. However, the share of persons registered as unemployed who have established their own enterprise is not very large. For example according to the Unemployment Insurance Fund data only 954 persons had de-registered as unemployed because of becoming entrepreneurs, this is just 1% of all cases of ending registration as unemployed (2% of unemployed persons who entered employment). As an entrepreneur a person needs not necessarily earn wages, despite having entered employment. However, this analysis can only use data concerning wages. Therefore persons who have received business start-up subsidies from the Unemployment Insurance Fund are not studied in this analysis. For the same reason this analysis cannot evaluate the impacts of training for business start-ups. Training primarily aimed at finding a job abroad is not included either, because the Tax and Customs Board has no data about the wages paid to such persons (e.g. training aimed at obtaining a Nordic card permitting hot work concerning roofs and hydro-insulation, Nordic hot work card, Finnish electrical safety card, Finnish occupational safety card).
Only administrative data have been used in this analysis. The use of administrative data for estimating the impact of training on transition to employment by unemployed persons has several advantages. First, the use of administrative data is cheap, since the necessary data exist already and no time and money have to be spent on collecting the data (e.g. for conducting a survey). Secondly, the administrative data can be used at any time, thus facilitating and speeding up the process of analysing. There is always a certain delay when collecting data through surveys, interviews or observations. Thirdly, regularity and continuity are always important when evaluating the impact of policies. With the administrative data always available, the analysis can be conducted at any desired moment (e.g. every year). However, accuracy is the main advantage of administrative data in comparison with survey data. When people are answering questions they have to try to remember events of the past and this can cause errors. In studying the impact of training on employment, one may not remember the exact time of taking up a job or the wages received. Often the impact of participation in a programme (including a training programme) is measured after
Estonian Unemployment Insurance Fund – Impact Evaluation of Training
15
considerable time has passed and this increases even more the risk of remembering incorrectly.
At the same time the use of administrative data has certain limitations that should not be overlooked in the analysis. First, the extent of data found in the administrative databases is limited and important variables could be therefore left out of the analysis. For example the database of the Unemployment Insurance Fund contains no data about the marital status and number of children of the unemployed, but this is information that may influence their labour market behaviour. The data from the Tax and Customs Board make it possible to evaluate the employment of individuals who were previously registered as unemployed, by looking at whether and when the individual has started to receive wages and the wage level associated with that. However, these data do not reveal what kind of job was accepted, whether it meets the acquired speciality or qualification, or whether it was due to training that the individual got the job, how the job was found, whether the individual is satisfied with the new job or would like to move on if possible etc. Consequently administrative data concerning wages only show whether and how fast participants in training programmes found a job in comparison with those who did not have training and whether their average wages differ. Administrative data cannot be used for analysing the persons’ attitudes or opinions.
Another problem with administrative data is that they only reflect what is “official”. When evaluating the impact of training to employment on the basis of administrative data, the so-called undeclared work is left out. Thus, when interpreting the results, it has to be taken into account that a certain number of people who actually work (i.e. they do undeclared work), appear to be unemployed according to these data. In a survey at least some of those engaged in undeclared work might say so. However, even in a survey they need not necessarily admit that they are working.
This impact evaluation studies the labour market outcomes of persons who participated in labour market training in two different periods. The first group comprises those who completed labour market training between May and September 2009 and the second group those completing training between April and October 2010. The labour market training offered to the unemployed in these two periods and the profile of the participants in training programmes is discussed below.
In the 2009 period 60086 persons and in the 2010 period 4041 persons finished training (see Table 1)7. For a number of reasons some types of training were left out of the impact evaluation (see Appendix 1). For example, trainings which effectiveness cannot be evaluated on the basis of wages declared in Estonia were not included (as mentioned above, training for business start-ups and training aimed at finding a job abroad come under this category). Trainings not aimed at improving the qualifications of the unemployed persons but rather at developing job search skills (e.g. elementary computer training on how to look for a job using the computer) were not included either.
Consequently, the analysis does not include training for business start-ups, hot work and occupational safety training and elementary computer training. The analysis does cover occupational training (incl. more specialised computer training) and Estonian language
6 Does not include job search training. Until December 2009 job search training was considered a sub-type of training, procured from service providers outside the Unemployment Insurance Fund. From 2010 job search training is a separate service (job search workshop) provided by the Unemployment Insurance Fund. 7 The number of persons who finished training includes persons who dropped out during the programme.

Estonian Unemployment Insurance Fund – Impact Evaluation of Training
16
courses. Given that more specific skills are acquired through occupational training and more general skills through Estonian language learning, the impact of the two types of training is analysed separately.
Table 1. Population and sample size
2009 2010 Total number of finished trainings 6 008 4 041
Including unique persons* 5 626 3 632
Trainings included in the analysis (after selection of specialities**) 4 694 2 447 Including occupational trainings 4 160 2 193 Including Estonian language courses 534 254
Unique persons (population)* 4 275 2 089
Persons included in impact evaluation (sample)* 3 285 1 737 * A person who was registered as unemployed several times during the period studied (i.e. a person had several different periods of registered unemployment) is included repeatedly. ** Elementary computer training, hot work and occupational safety training and training for business start-ups is excluded. After selection of specialities the number of occupational trainings to be studied in the impact evaluation for 2009 and 2010 was 4 160 and 2193 respectively. The total number of persons who took Estonian language courses was 534 in the first period and 254 in the second period. Table 2 contains a breakdown of occupational training by sectors. Among the trainings finished in the 2009 period transport, marine activities and logistics took the biggest share, with manufacturing and processing following closely. During the period lasting from April to October 2010 the largest number of persons trained in business, administration and personnel related matters, while in transport, marine activities and logistics only slightly less. 66% of the trainings finished between April and October 2010 constituted trainings with training vouchers8.
Table 2. Occupational training by sectors
Training sector 2009 2010 Including with training
voucher Gardening, agriculture, forestry, environmental protection - 48 Building and real estate activities 314 62 41 Electrical work and energy 50 220 140 Electronics and control engineering - 1 1 Education, culture, sport 11 62 58 Beauty treatments 81 5 5 Information technology 50 95 95 Language training (English) - 8 8 Other services 374 144 1 Public health, care, social work, psychology 462 213 34 Manufacturing and processing 802 246 178 Transport, marine activities, logistics, vehicles 814 456 405 Working environment, occupational safety, first aid 17 8 8 Law enforcement 10 5 2 Business, administration and personnel 518 468 318 General training 19 9 9 Other 638 143 138 Total number of trainings included in the analysis 4 160 2 193 1 441
8 The training vouchers were introduced in October 2009.

Estonian Unemployment Insurance Fund – Impact Evaluation of Training
17
In both periods studied the trainings were relatively short in duration, and on the average the 2010 trainings were shorter than those of 2009 (the actual duration was taken into account, i.e. in case of drop-outs the actual number of days was included). In 2009 the occupational trainings lasted 62 days on average, however, in 2010 the duration was cut by half, i.e. lasting only on average for 33 days. Estonian language courses in both periods were longer, lasting slightly more than three months on average.
Table 3 summarises the average duration of training by sector: in the 2009 period beauticians spent the longest in training – on average for 254 days. Trainings in the field of education, culture and sport, public health, care, social work and psychology also lasted more than one hundred days. Trainings in working environment, occupational safety and first aid were the shortest, taking only two days on average to complete. In 2010 the longest trainings were in the field of education, culture and sport and learning the Estonian language, lasting 113 and 110 days respectively. The shortest trainings in 2010 lasted an average of five days and were conducted in the field of electronics and control engineering.
Table 3. Average duration of training by sectors (days)
Sector 2009 2010 Gardening, agriculture, forestry, environmental protection 23 Computer use (further training) 36 Estonian language 93 110 Construction and real estate activities 59 25 Electricity, gas, steam and air conditioning supply 24 10 Electronics and control engineering 5 Education, culture, sport 160 113 Beauty treatments 254 27 Information technology 55 30 Language training 72 Other client service activities 51 40 Other 48 12 Public health, care, social work, psychology 104 41 Manufacturing and processing 61 16 Transport, marine activities, logistics, vehicles 35 19 Working environment, occupational safety, first aid 2 10 Law enforcement 78 22 Business, administration and personnel 68 55 General training 18 96
Table 4 shows a breakdown of trainings by duration. Almost one-third of the occupational trainings in 2009 lasted up to one month, one-third a little less than two months and one-third up to three months. Thus a large majority of trainings (82%) were completed in three months. In 2010 two-thirds of the trainings were up to one month in duration and almost all (93%) were over in three months. Estonian language courses lasted a little over three months in both years (any shorter period usually indicated a drop-out).
In addition to the selection of areas of training described above, some further steps were taken to form the final sample for the impact evaluation of training. In order to establish as accurately as possible the net impact of training the persons who participated in other active measures in addition to training were left out of the final sample. For this purpose all active measures conducted between January 2007 and March 2011 were taken into account (for example, a participant in training who had undertaken work practice at any time since 2007
Estonian Unemployment Insurance Fund – Impact Evaluation of Training
18
was not included in the sample. Persons who had had some training at one point before the study period were excluded as well). However, persons who in addition to training had had career counselling and/or job search training (incl. job search workshop) were not left out of the sample. Persons about whom the significant background characteristics (e.g. education level, age, place of residence etc.) were not available and therefore they could not be matched with the control group, were removed from the sample as well. Also excluded from the sample were the persons for whom no sufficiently close counterpart existed in the control group, regarding all the significant characteristics (in the 2009 sample there were two such persons in the Estonian language training group, in the 2010 sample there were three persons in the Estonian language training group and three in the occupational training group). Eventually the total sample size for trainings in 2009 (occupational training + Estonian language training) was 3285 persons and in 2010 1737 persons (see Table 1).
Table 4. Occupational and Estonian language trainings by duration
Duration of trainings
Occupational trainings Estonian language
trainings 2009 2010 2009 2010
1-30 days 29.7% 66.3% 5.1% 1.6%
31-60 days 22.6% 13.4% 5.2% 2.0%
61-90 days 30.1% 13.7% 15.2% 1.2%
91-120 days 7.3% 2.3% 71.2% 95.3%
121-150 days 4.7% 1.4% 3.4% -
151-180 days 0.7% 1.0% - -
More than 180 days 4.9% 2.0% - -
Total 100% 100% 100% 100%
The following is a description of the breakdown of the population by the various socio-demographic characteristics and a comparison of the population with the sample. In 2009 there were 56% men in the sample of participants in training; in 2010 the respective share of men was 46% (see Table 5). A comparison of the population and sample by gender shows a slightly higher share of men in the sample. Given that persons who in addition to training participated in other active measures were removed from the sample, one can assume that among women there were more participants in several measures.
In the first period the average age of participants in training was 38 years and in the second period 41 years. The average age in the population and in the sample was almost the same, with the difference slightly higher in 2010. In the treatment group the highest share of unemployed persons had vocational secondary education (in 2010 – 33.5%; in 2009 – 29.3%), followed by persons with general secondary education. The distribution of persons by education is very similar in the population and in the sample. The greatest difference (1.9 percentage points) was noted in the share of unemployed persons with general secondary education in 2010.
In the treatment group the highest share of unemployed persons had previously been craft and related trades workers (almost a quarter). With regard to distribution by previous occupation, the persons in the population and sample were similar as well. The biggest difference – almost 3 percentage points – was observed in the share of craft and related trades workers in 2009. In the population some individuals did not have data concerning prior occupation.

Estonian Unemployment Insurance Fund – Impact Evaluation of Training
19
Either they did not have prior work experience or the Unemployment Insurance Fund database did not have data about their previous job. In the case of persons included in the sample the data about the latest job was taken from the TTIS database9, therefore the data concerning prior employment are somewhat more accurate in the sample.
Table 5. Comparison of population and sample * Population Sample
2009 2010 2009 2010 Total observations 4 275 2 089 3 285 1 737 Gender: male 56.0% 45.7% 60.3% 48.5% Average age 38.2 40.8 38.4 42.6 Education Primary education or less 1.4% 0.6% 1.5% 0.7% Basic education 18.1% 10.2% 19.5% 11.1% General secondary education 26.8% 20.4% 27.6% 22.3% Vocational secondary education 33.5% 29.3% 33.3% 27.9% Professional secondary education 8.8% 13.9% 8.0% 15.1% Professional higher education 2.7% 5.1% 2.4% 4.4% Bachelor’s degree 5.9% 13.2% 5.4% 11.7% Master’s or doctor’s degree 2.5% 7.2% 2.2% 6.7% Not specified 0.3% 0.1% - - Prior occupation ** Managers 4.4% 9.2% 4.4% 8.7% Professionals 3.5% 7.0% 3.4% 6.7% Technicians and associate professionals 8.3% 14.2% 8.0% 13.1% Clerical support workers 5.0% 6.9% 4.8% 6.6% Service and sales workers 11.4% 12.3% 11.8% 13.7% Skilled agricultural, forestry and fishery workers 0.9% 0.8% 0.9% 0.6% Craft and related trades workers 26.5% 22.1% 29.8% 23.0% Plant and machine operators, and assemblers 13.6% 10.6% 14.4% 10.9% Elementary occupations 15.2% 9.8% 14.0% 10.5% No work experience or not specified 11.1% 7.1% 8.5% 6.2% Main language of communication: Estonian 49.7% 52.2% 52.0% 51.6% Place of residence: urban (vs rural) 67.6% 71.6% 65.5% 72.6% Region of registration as unemployed Harju County 22.8% 43.1% 22.4% 50.0% Southern Estonia 10.7% 8.5% 11.3% 7.6% Ida-Viru County 28.3% 20.5% 24.2% 15.8% Central and Western Estonia 38.2% 27.9% 42.1% 26.7% With a disability 7.9% 4.3% 7.7% 4.8%
*Includes participants in occupational training and Estonian language courses. ** The data of the sample were supplemented with TTIS data.
The main language of communication is Estonian among nearly one-half of the members of the treatment group and more than two-thirds of the treatment group are urban dwellers. The difference in the sample and the population with regard to the breakdown of the language of communication and place of residence is a couple of percentage points. The members of the treatment group are divided into four regional groups, based on the county where they registered as unemployed: the Harju County, Southern Estonia, Ida-Viru County and Central
9 TTIS was the database used by the Labour Market Board, and was mostly replaced in the Unemployment Insurance Fund by a newer database by the end of 2011. The data extracted from the new database have been supplemented with the data from TTIS, since not all earlier data were exported into the new database.

Estonian Unemployment Insurance Fund – Impact Evaluation of Training
20
and Western Estonia. The breakdown into the regions takes into account the special nature of the regional labour markets. The greatest difference between the distribution of the population and the sample with regards to regions lay in the share of persons registered as unemployed in the Harju County in 2010. In the first period approximately 8% and in the second period roughly 4% of the members of the treatment group had a disability. Nevertheless, given that in general there were no significant differences in the mean values of the characteristics between the sample and the population, additional weights were not used in the analysis for the sample of the treatment group.
For the purposes of this analysis the members of the treatment group are compared with persons who had been registered as unemployed during the studied periods. Like the treatment group, the control group also excludes persons who had been participating in different active measures from January 2007 to March 2011 (with the exception of career counselling, job search training and job search workshop). Persons about whom the characteristics necessary for matching were missing in the database (e.g. gender, education etc.) were excluded as well.
Table 6 presents the mean values of the various characteristics for the treatment group and the control group in 2009 and 2010, prior to matching. The table shows a significant difference between the mean values of several characteristics of the treatment group and their control group both in 2009 and 2010 (the table also includes the significance of the differences in the mean value).
The table shows that in both years the distribution by gender in the treatment group differed considerably from that of the control group. In 2009 the share of men in the treatment group was larger than in the control group; in 2010 it was the opposite as the share of men was smaller in the treatment group than in the control group. A comparison of the share of men in the treatment group in both years shows that it was significantly larger in 2009. In 2010 there was also a significant difference in average age between the treatment group and the control group. On average, those in training were older than the control group members.
There were also differences between the education levels of the treatment group and the control group in 2009. For example, the share of persons with vocational secondary education was larger, whereas the share of persons with a Bachelor’s degree was smaller in the treatment group. In 2010 the shares of the treatment group and the control group regarding education were also fairly different. For example, the share of persons in the treatment group with lower education levels is lower than in the control group, whereas in the case of higher education levels the opposite is true.
The tenure in previous job of the treatment group differed from that of the control group in both 2009 and 2010. In both years the average length of tenure of the training participants was considerably longer. Also in both years the average duration of prior registered unemployment was shorter and the average daily rate of the unemployment benefit was higher in the treatment group than in the control group.
The differences between the treatment group and the control group show clearly that inflow to training is not random and that persons with certain characteristics are more likely to receive training than others. Therefore this analysis is conducted by using matching, i.e. comparing only comparable observations.
Estonian Unemployment Insurance Fund – Impact Evaluation of Training
21
Table 6. Characteristics of the treatment group and the control group before matching
Mean value 2009 Mean value 2010
Characteristics Treatment group
Control group p>t
Treatment group
Control group p>t
Gender: male 60.3% 57.4% 0.001 48.5% 55.5% 0.000 Age (in years) 38.40 38.09 0.178 42.56 38.48 0.000 Education Primary education or less 1.5% 2.6% 0.000 0.7% 2.6% 0.000 Basic education 19.5% 20.9% 0.053 11.1% 20.5% 0.000 General secondary education 27.6% 28.8% 0.150 22.3% 28.1% 0.000 Vocational secondary education 33.3% 29.1% 0.000 27.9% 26.1% 0.081 Professional secondary education 8.0% 7.2% 0.056 15.1% 10.6% 0.000 Professional higher education 2.4% 2.7% 0.410 4.4% 2.9% 0.000 Bachelor’s degree 5.4% 6.4% 0.019 11.7% 6.5% 0.000 Master’s or doctor’s degree 2.2% 2.4% 0.449 6.7% 2.8% 0.000 Prior occupation Managers 4.4% 5.1% 0.053 8.7% 5.4% 0.000 Professionals 3.4% 4.0% 0.093 6.7% 4.2% 0.000 Technicians and associate professionals 8.0% 7.0% 0.035 13.1% 6.6% 0.000 Clerical support workers 4.8% 4.6% 0.469 6.6% 5.6% 0.073 Service and sales workers 11.8% 13.4% 0.011 13.7% 14.3% 0.500 Skilled agricultural workers 0.9% 1.0% 0.518 0.6% 1.1% 0.073 Craft and related trades workers 29.8% 25.1% 0.000 23.0% 21.7% 0.192 Plant and machine operators, assemblers 14.4% 9.5% 0.000 10.9% 9.2% 0.012 Elementary occupations 14.0% 16.5% 0.000 10.5% 15.5% 0.000 Language of communication: Estonian 52.0% 52.7% 0.442 51.6% 53.5% 0.134 Tenure in previous job (in years) 3.11 2.59 0.000 3.81 2.63 0.000 Place of residence: urban (vs rural) 65.5% 69.8% 0.000 72.6% 68.8% 0.001 Region of registration as unemployed Harju County 22.4% 43.0% 0.000 50.0% 44.1% 0.000 Southern Estonia 11.3% 6.7% 0.000 7.6% 6.4% 0.052 Ida-Viru County 24.2% 15.9% 0.000 15.8% 15.6% 0.885 Central and Western Estonia 42.1% 34.5% 0.000 26.7% 33.8% 0.000 With a disability 7.7% 6.4% 0.002 4.8% 4.5% 0.533 Prior periods of registered unemployment (times) 1.63 1.69 0.006 1.68 1.85 0.000 Duration of prior periods of registered unemployment (years) 0.27 0.31 0.000 0.32 0.40 0.000 Share of recipients of unemployment benefits Unemployment insurance benefit for 180 days 18.8% 19.9% 0.153 17.6% 16.7% 0.329 Unemployment insurance benefit for 270 days 29.3% 25.4% 0.000 43.4% 25.7% 0.000 Unemployment allowance 30.7% 29.1% 0.038 22.1% 24.8% 0.010 Daily rate of unemployment benefit (in Euros) 6.21 5.89 0.010 8.38 5.12 0.000 Cause of termination of employment On the initiative of the employer 57.7% 57.6% 0.894 69.7% 54.4% 0.000 Voluntary 21.3% 17.7% 0.000 13.9% 14.2% 0.772 Number of observations 3285 74525 1737 103531
Note: Please refer to Appendix 2 for a more detailed description of the characteristics.
Estonian Unemployment Insurance Fund – Impact Evaluation of Training
22
5. IMPACT OF TRAINING ON EMPLOYMENT AND INCOME
Anne Lauringson, Liis Tammik, Teele Luhavee
5.1. Impact of occupational training
In the case of occupational training the analysis looks at the impact of training on income, employment and receipts of unemployment benefits, using the data of the whole sample. Subsection 5.2 studies the impact of Estonian language courses on income and employment. Subsection 5.3 distinguishes between the impact of occupational training with personalised training vouchers and procured training (in 2010) and subsection 5.4 studies the impact of occupational training by the different socio-demographic characteristics.
For the purposes of the evaluations exact matching is carried out by the month in which training was finished and propensity matching is used for all other variables. For example, the control group for those who finished training in May 2009 can only contain persons who were registered unemployed in May 2009 etc. The probit model is estimated by each month (of finishing training) for matching other variables. The variables used for matching are described in Appendix 2.
5.1.1. Impact of training on income from wage
Appendix 3 and Figure 2 describe the impact of occupational training on income from wage. In the case of trainings conducted in 2009 the available data enables to study the impact of training during 23 months after finishing the training, but after 19 months the number of observations drops (for example, the impact of trainings finished in September 2009 can only be observed during the next 19 months, since the data concerning the receipt of wages are available until April 2011). In the case of the 2010 trainings the impact can be analysed during 12 months after training and the number of observations decreases after 6 months.
The variable showing income from wage is influenced both by the level of wage and by the fact whether the individual was paid any wages at all in the observed month. In other words, in the database the income from wage equals zero if the person is not employed and is indicated as the person’s gross wage, if he or she is employed. This variable is of particular importance for tax revenues, since it shows the impact of training on the increase of the total tax base.
Figure 2 depicts that both in 2009 and 2010 the impact of training increases in the course of the first year. There is practically no difference in the income between the treatment group and the control group in the first month following the training (the difference estimated is relatively small and statistically insignificant10). Over the subsequent months the impact on income increases and becomes statistically significant (at the 0.01 significance level). In the case of individuals who finished training in 2009 the level achieved by the end of the first year is maintained during the second year after training as well (the considerable drop in the number of observations at the end of the period is probably the reason why the evaluated impact turns insignificant at the 0.1 significance level). As with the 2009 sample, the increase in impact is observed to slow down by the end of the first year in the case of the 2010
10 The formula proposed by Lechner (2001) was used to calculate standard errors.
Estonian Unemployment Insurance Fund – Impact Evaluation of Training
23
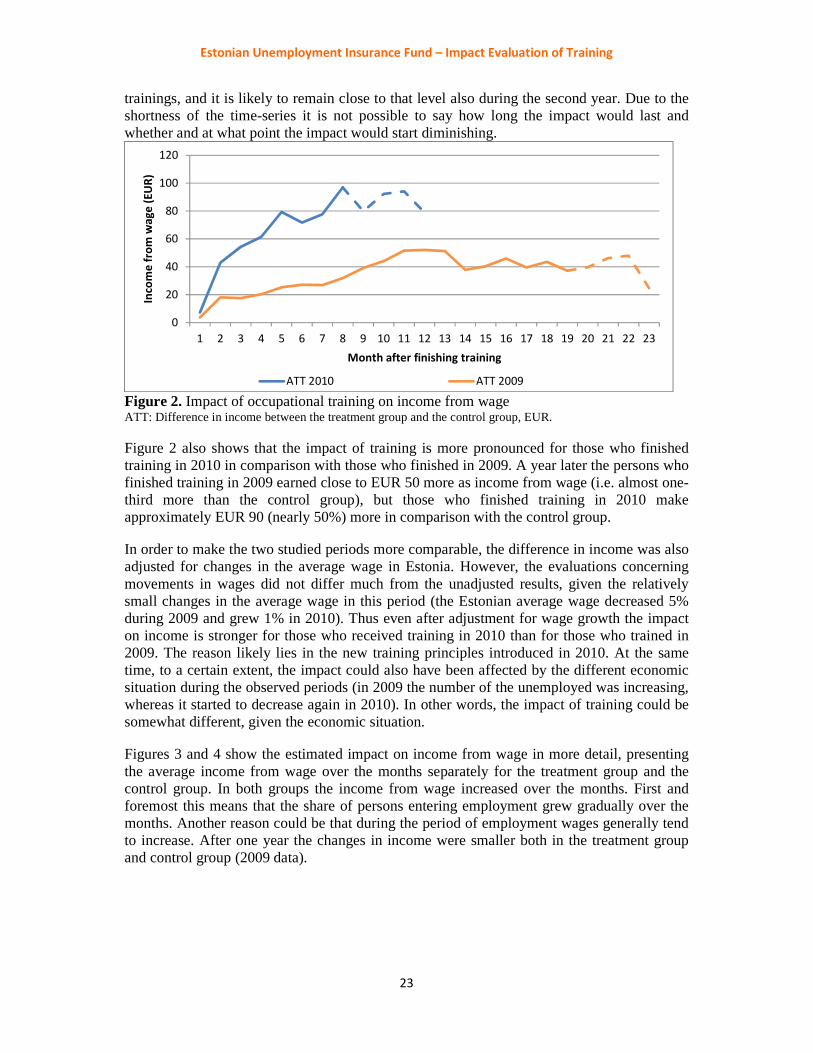
trainings, and it is likely to remain close to that level also during the second year. Due to the shortness of the time-series it is not possible to say how long the impact would last and whether and at what point the impact would start diminishing.
Figure 2. Impact of occupational training on income from wage ATT: Difference in income between the treatment group and the control group, EUR.
Figure 2 also shows that the impact of training is more pronounced for those who finished training in 2010 in comparison with those who finished in 2009. A year later the persons who finished training in 2009 earned close to EUR 50 more as income from wage (i.e. almost one-third more than the control group), but those who finished training in 2010 make approximately EUR 90 (nearly 50%) more in comparison with the control group.
In order to make the two studied periods more comparable, the difference in income was also adjusted for changes in the average wage in Estonia. However, the evaluations concerning movements in wages did not differ much from the unadjusted results, given the relatively small changes in the average wage in this period (the Estonian average wage decreased 5% during 2009 and grew 1% in 2010). Thus even after adjustment for wage growth the impact on income is stronger for those who received training in 2010 than for those who trained in 2009. The reason likely lies in the new training principles introduced in 2010. At the same time, to a certain extent, the impact could also have been affected by the different economic situation during the observed periods (in 2009 the number of the unemployed was increasing, whereas it started to decrease again in 2010). In other words, the impact of training could be somewhat different, given the economic situation.
Figures 3 and 4 show the estimated impact on income from wage in more detail, presenting the average income from wage over the months separately for the treatment group and the control group. In both groups the income from wage increased over the months. First and foremost this means that the share of persons entering employment grew gradually over the months. Another reason could be that during the period of employment wages generally tend to increase. After one year the changes in income were smaller both in the treatment group and control group (2009 data).
0
20
40
60
80
100
120
1 2 3 4 5 6 7 8 9 10 11 12 13 14 15 16 17 18 19 20 21 22 23
Inco
me
fro
m w
ag
e (
EU
R)
Month after finishing training
ATT 2010 ATT 2009

Estonian Unemployment Insurance Fund – Impact Evaluation of Training
24
Figure 3. Income from wage in the treatment group and the control group and the difference between the groups in 2010
Figure 4. Income from wage in the treatment group and the control group and the difference between the groups in 2009
5.1.2. Impact of training on employment
The impact estimations of occupational training on employment are presented in Appendix 4 and shown graphically in Figure 5. In the data a person is considered as employed, if his or her employer has declared to the Tax and Customs Board the wages (irrespective of the amount) paid to the person in the given month. The estimated impact is significant in all months studied (at the 0.01 significance level), despite a considerable reduction in the number of observations towards the end of the period.
The impact estimations of the 2009 trainings on employment show that in the first month after finishing training transition to employment was 2 percentage points higher in the treatment group than in the control group. During one year after training the impact of training increased steadily, reaching approximately 10 percentage points. In the second year the impact of training remained similar to the level achieved during the first year, even dropping slightly rather than growing further.
In the case of the 2010 trainings the impact can be observed only during one year after finishing training. The impact estimated on this sample also increased in the course of the
0
50
100
150
200
250
300
350
1 2 3 4 5 6 7 8 9 10 11 12 13 14 15 16 17 18 19 20 21 22 23
Inco
me
fro
m w
ag
e (
EU
R)
Month after finishing training
ATT 2010 Participants in training 2010 Control group 2010
0
50
100
150
200
250
1 2 3 4 5 6 7 8 9 10 11 12 13 14 15 16 17 18 19 20 21 22 23
Inco
me
fro
m w
ag
e (
EU
R)
Month after finishing training
ATT 2009 Participants in training 2009 Control group 2009

Estonian Unemployment Insurance Fund – Impact Evaluation of Training
25
first year, nearing 13 percentage points by the end of the year. One can assume that in the second year the impact would stabilise on the level reached, as was the case with the 2009 sample, but given the lack of data it is not possible to say, whether there would be some further growth or a reduction in impact would occur.
Figure 5. Impact of occupational training on employment
Similarly to the impact of training on incomes, the impact on employment was also of higher magnitude in 2010 than in 2009. Thus it is likely that the effectiveness of training has increased due to the change in training principles.
Figures 6 and 7 illustrate the share of people in employment by month after training, distinguishing between the treatment group and control group and showing the difference in the employment rate between the groups (impact estimation). The share of people in employment increased over the months, leading also to an increase in income from wage (as discussed in more detail in Subsection 5.1.1.). 36% of the people who finished training in 2009 were in employment one year later, whereas only 26% of the control group members were employed at the same time. The share of people in employment continued to increase during the second year after training as well and by the 19th month 40% of the treatment group and 31% of the control group were employed. According to the estimations, employment in both groups stabilised during the subsequent months. However, in those months the size of the sample was smaller and thus the evaluation of the total sample could turn out to be somewhat different.
Of the people who finished training in 2010 34% were employed six months later, whereas the employment rate of the control group was 25%. A year after training approximately 46% of the treatment group and 34% of the control group members were in employment (towards the end of the period the sample of the treatment group was relatively small, therefore the impact could have been slightly underestimated).
0%
2%
4%
6%
8%
10%
12%
14%
1 2 3 4 5 6 7 8 9 10 11 12 13 14 15 16 17 18 19 20 21 22 23
Sh
are
of
pe
op
le i
n e
mp
loy
me
nt
Month after finishing training
ATT 2010 ATT 2009

Estonian Unemployment Insurance Fund – Impact Evaluation of Training
26
Figure 6. Share of people in employment in the treatment group and in the control group, and the difference between the two groups in 2009.
Figure 7. Share of people in employment in the treatment group and in the control group, and the difference between the two groups in 2010
The impact of occupational training on employment and income was additionally estimated separately by the month in which training was finished. One cannot conclude on the basis of the more detailed estimations that the impact of training was influenced by seasonality or more generally by the economic situation (a longer time-series is required for drawing more in-depth conclusions). The difference in impact by month is more likely caused by the specific trainings offered in the corresponding month (the smaller the number of persons finishing training in a given month, the more it is influenced by the results of any specific training group; for example July and August 2010 were the months with the smallest number of observations and the estimation results in those months differ widely).
0%
5%
10%
15%
20%
25%
30%
35%
40%
45%
1 2 3 4 5 6 7 8 9 10 11 12 13 14 15 16 17 18 19 20 21 22 23
Sh
are
of
pe
op
le i
n e
mp
loy
me
nt
Month after finishing training
ATT 2009 Participants in training 2009 Control group 2009
0%
5%
10%
15%
20%
25%
30%
35%
40%
45%
50%
1 2 3 4 5 6 7 8 9 10 11 12 13 14 15 16 17 18 19 20 21 22 23
Sh
are
of
pe
op
le in
em
plo
ym
en
t
Month after finishing training
ATT 2010 Participants in training 2010 Control group 2010

Estonian Unemployment Insurance Fund – Impact Evaluation of Training
27
5.1.3. Impact of training on wage
The impact of training on income described in Subsection 5.1.1. is in addition to employment also influenced by the impact of training on wages. Therefore it is necessary to observe the wage level received by the training participants and the control group members. The same matching model is used here as in Subsection 5.1.1., though the outcome variable is defined differently. Instead of using zero as the income from wage for persons who are not employed, here the outcome variable is observed for only those persons who received some wage income.
The impact of training on wage is shown in Appendix 5 and in Figure 8. The estimations produced on the 2009 sample show that the impact of training on wage was statistically entirely insignificant. Only a few months had statistically significant results and as a rule they showed rather smaller wages for the persons who finished training compared to the control group.
In the 2010 sample the impact of training on wage was statistically insignificant during the first three months, when the number of persons entering employment was still small. In subsequent months training started having a statistically significant positive impact on wage and six months after finishing training the treatment group received 12% higher wages than the control group. The impact estimation results decreased and became statistically more insignificant as the size of the sample available decreased.
Figure 8. Impact of occupational training on wage
To sum up, the evaluations in Subsection 5.1.1. concerning the income of the people who finished training were influenced by employment in the case of both the 2009 and 2010 samples. The impact of training on wage level increased the impact of training on income only in the case of the 2010 sample (in the case of the 2009 sample the impact of training on wage level actually decreased the total impact to some extent).
-25%
-20%
-15%
-10%
-5%
0%
5%
10%
15%
20%
25%
1 2 3 4 5 6 7 8 9 10 11 12 13 14 15 16 17 18 19 20 21 22 23
Dif
fere
nce
in
wa
ge
Month after finishing training
ATT 2010 ATT 2009
Estonian Unemployment Insurance Fund – Impact Evaluation of Training
28
5.1.4. Impact of training on unemployment benefit expenses
As due to training the unemployed enter employment faster, training could also influence the duration of paying unemployment benefits. In other words, participation in training helps to reduce the expenses on paying unemployment insurance benefits and unemployment allowances (paid by the Estonian Unemployment Insurance Fund). In this subsection such impact is evaluated with regards to occupational training. The same models are used to study the impact as in the case of employment and income, with the added criterion of the receipt of benefits. Therefore to evaluate the impact only these persons are taken into account who were due to receive some unemployment insurance benefits or unemployment allowances after finishing training (i.e. potential days, not actual days for which benefits were due are used for exact matching). In addition the number of potential days of benefits is used for matching in the probit model, as was the case with employment and income. The different types of benefits are subjected to exact matching (persons for whom unemployment insurance benefit is granted for 180 days, persons for whom unemployment insurance benefit is granted for 270 days, persons qualifying only for unemployment allowances). Exact matching is carried out by types of benefits because the daily rates of the benefits differ considerably and one of the aims is to evaluate the impact of training on the total amount paid as unemployment benefits. The probit model includes the daily rates of benefits as well, so as to be able to make matching by levels of benefits more accurate. In addition to the main period of benefits (unemployment insurance benefit or unemployment allowance period), also the additional potential 90-day period of unemployment allowance after the 180-day unemployment insurance benefit is taken into account as well as an additional period of unemployment allowance for up to 180 days for persons close to the retirement age.
The impact of training on the duration of unemployment benefits receipts and the amounts paid are presented in Table 7. The results are shown separately by types of benefits and also as averages for all recipients of benefits together. The table shows for each group the average number of potential days for which benefits were due, the number of actual days for which benefits were paid and the total amount of benefits paid after finishing training (for the control group after a date in the period of unemployment determined by matching). In 2009 almost 57% of the treatment group had the right for benefits after finishing training, in 2010 this share was 47%. Those who finished training in 2010 had more potential days of benefits left with regards to all types of benefits (on average they had the right to almost a week more of benefit days).
The estimations on the 2010 sample show that occupational training has a statistically significant decreasing impact on the number of actual benefit days and the amount of benefits paid. On average the actual period of receiving benefits is by ten days (13%) shorter in the treatment group than in the control group and the actual expense per benefit recipient was EUR 67 (12%) smaller. Among the types of benefits the group receiving unemployment insurance benefits during 270 days contributes most towards reducing the benefits. The impact estimations of training in the group receiving unemployment insurance benefits during 180 days and among the persons qualifying for unemployment allowances indicate a reduction in the periods of receiving benefits, but the impact remains statistically insignificant.
The estimations on the 2009 sample also show that training reduces the actual period of paying benefits across all types of benefits. Nevertheless the impact estimations are not statistically significant in any of the groups. In the whole sample the average actual period of

Estonian Unemployment Insurance Fund – Impact Evaluation of Training
29
receiving benefits after finishing training is 2.9 days (4%) shorter in the treatment group than in the control group, but this is not significant at the 0.1 significance level.
Table 7. Impact of occupational training on the duration of unemployment benefit receipts and the amounts paid
All
reci
pie
nts
of b
enef
its
2010 2009
No.
of
obs
er-
vatio
ns
Treatment group
Control group ATT p-value
No.
of
obs
er-
vatio
ns
Treatment group
Control group ATT p-value
Number of potential benefit days
7
63
98.7 97.5 0.683
1
819
90.3 89.6 0.598 Number of actual benefit days 67.7 77.8 -10.1 0.001 70.9 73.8 -2.9 0.106 Actual amount of benefits paid, € 501.0 568.0 -67.0 0.051 432.7 445.8 -13.1 0.433
TK
H-1
80
Number of potential benefit days
1
66
60.0 61.3 0.762
4
48
63.7 63.4 0.902 Number of actual benefit days 55.3 64.1 -8.8 0.139 72.0 72.0 -0.1 0.988 Actual amount of benefits paid, € 270.4 250.4 20.0 0.642 343.5 331.2 12.3 0.635
TK
H-2
70
Number of potential benefit days
430
106.5 108.0 0.724
70
4
100.8 98.2 0.290 Number of actual benefit days 71.3 85.8 -14.4 0.000 73.9 78.4 -4.5 0.117 Actual amount of benefits paid, € 726.7 853.2 -126.5 0.030 765.2 800.9 -35.7 0.366
TT
Number of potential benefit days
167
116.8 110.0 0.355
667
97.9 97.9 1.000 Number of actual benefit days 70.7 70.8 -0.1 0.988 67.1 70.1 -3.0 0.319 Actual amount of benefits paid, € 149.2 149.4 -0.2 0.988 141.6 148.0 -6.4 0.319
Number of observations: Number of persons finishing training who had the right to unemployment benefits after finishing training (after matching). ATT: Difference in the number of actual benefit days / actual amount of benefits paid between the treatment group and control group from the moment of finishing training. p-value: significance of ATT (H0: ATT = 0); in the case of potential benefit days the significance of the differences in the mean value of the days of the treatment group and the control group. TKH-180: persons for whom unemployment insurance benefit is granted for 180 days. TKH-270: persons for whom unemployment insurance benefit is granted for 270 days. TT: persons qualifying only for unemployment allowances.
The impact of training on the duration of benefits and the amounts paid depends on the impact of training on the entry into employment and on the potential period of benefits. In both samples the average potential period of paying benefits after finishing training is only 2-3 months. Thus the impact of training on receiving benefits can only occur during a relatively short period. On the other hand, it is in the first months after finishing training that the impact of training on receiving benefits is lower, since the impact of training on entering employment in the first months is also lower and starts to increase considerably only in the subsequent months. Altogether the impact estimations of training on benefit receipts using 2010 sample shows a higher and more significant impact than in the case of the 2009 sample, for in the 2010 sample the average potential benefit period after training was longer and for also a higher impact of training on entering employment occurred in the first months. A more general conclusion can be drawn as well: the more generous the system of paying unemployment benefits, the stronger the impact of training on saving expenses for benefits.
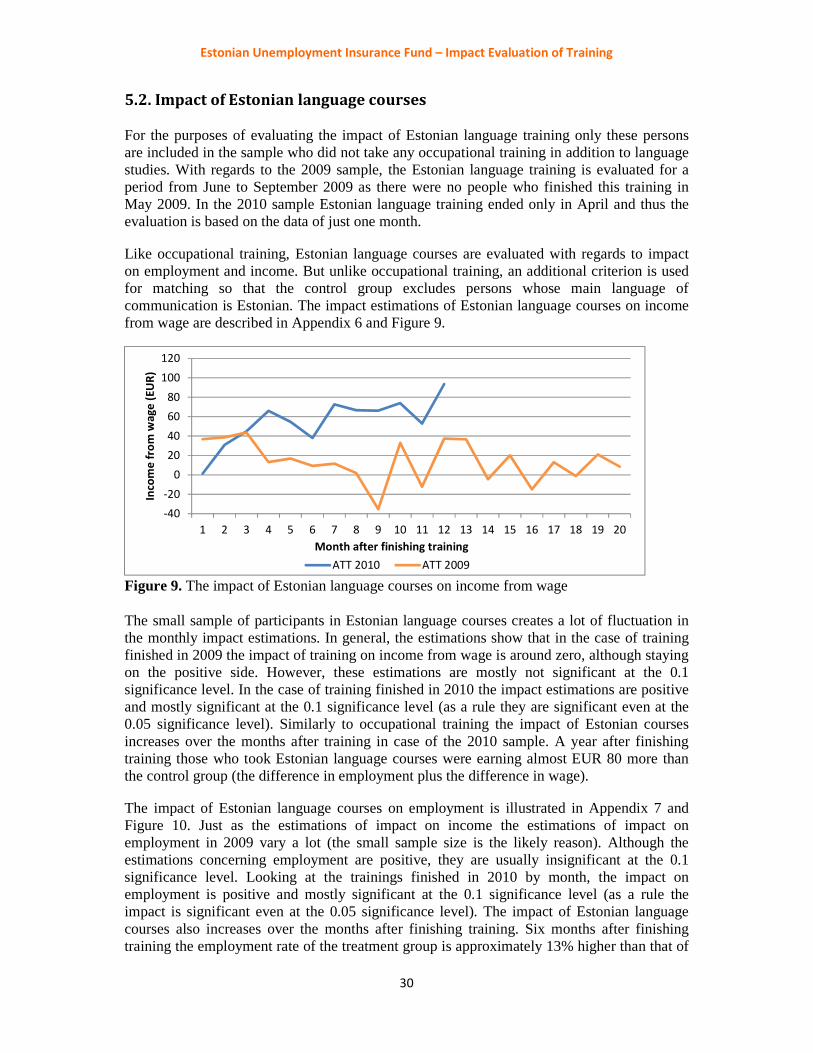
Estonian Unemployment Insurance Fund – Impact Evaluation of Training
30
5.2. Impact of Estonian language courses
For the purposes of evaluating the impact of Estonian language training only these persons are included in the sample who did not take any occupational training in addition to language studies. With regards to the 2009 sample, the Estonian language training is evaluated for a period from June to September 2009 as there were no people who finished this training in May 2009. In the 2010 sample Estonian language training ended only in April and thus the evaluation is based on the data of just one month.
Like occupational training, Estonian language courses are evaluated with regards to impact on employment and income. But unlike occupational training, an additional criterion is used for matching so that the control group excludes persons whose main language of communication is Estonian. The impact estimations of Estonian language courses on income from wage are described in Appendix 6 and Figure 9.
Figure 9. The impact of Estonian language courses on income from wage
The small sample of participants in Estonian language courses creates a lot of fluctuation in the monthly impact estimations. In general, the estimations show that in the case of training finished in 2009 the impact of training on income from wage is around zero, although staying on the positive side. However, these estimations are mostly not significant at the 0.1 significance level. In the case of training finished in 2010 the impact estimations are positive and mostly significant at the 0.1 significance level (as a rule they are significant even at the 0.05 significance level). Similarly to occupational training the impact of Estonian courses increases over the months after training in case of the 2010 sample. A year after finishing training those who took Estonian language courses were earning almost EUR 80 more than the control group (the difference in employment plus the difference in wage).
The impact of Estonian language courses on employment is illustrated in Appendix 7 and Figure 10. Just as the estimations of impact on income the estimations of impact on employment in 2009 vary a lot (the small sample size is the likely reason). Although the estimations concerning employment are positive, they are usually insignificant at the 0.1 significance level. Looking at the trainings finished in 2010 by month, the impact on employment is positive and mostly significant at the 0.1 significance level (as a rule the impact is significant even at the 0.05 significance level). The impact of Estonian language courses also increases over the months after finishing training. Six months after finishing training the employment rate of the treatment group is approximately 13% higher than that of
-40
-20
0
20
40
60
80
100
120
1 2 3 4 5 6 7 8 9 10 11 12 13 14 15 16 17 18 19 20
Inco
me
fro
m w
ag
e (
EU
R)
Month after finishing training
ATT 2010 ATT 2009

Estonian Unemployment Insurance Fund – Impact Evaluation of Training
31
the control group. After one year, the difference has grown to 18 percentage points. Given that the growth of the impact over months follows a slowing trend, one can assume that the impact of the Estonian courses on employment would stabilise by the end of the second year at the level close to that achieved by the end of the first year, as is the case with occupational training. Due to the shortness of the time-series available for evaluation, it is not possible to estimate the impact during the second year more precisely.
Figure 10. The impact of Estonian language courses on employment
The estimation results concerning the Estonian language training in 2009 and 2010 reflect the principles of service provision applicable during those years. Namely, based on the Employment Programme for 2010-2011 only work related Estonian language training was to be offered. In 2009 the rules for Estonian language courses were not as strict. In summary the results show that both occupational training and Estonian language courses had a positive impact on the employment and income of those who finished training in 2010. In 2009 the impact of occupational training was also positive, even though not as great as with occupational training in 2010. But the Estonian language courses in 2009 had no statistically significant impact on employment and income. The 2009 results thus are similar to those by Lauringson (2011) analysing unemployment duration on the data from the crisis period. Lauringson studies in this paper the transition of unemployment benefit recipients form unemployment to employment since the end of 2008 until the beginning of 2010. The unemployment duration models in that analysis also include the periods of receiving the various services, waiting periods for the services and periods after receiving the services. Given the period under study the analysis covers first and foremost the services provided in 2009. The estimations show that the hazard to leave unemployment for employment is significantly higher after occupational training for persons qualifying for unemployment insurance benefits as well as for unemployment allowances. However, in the case of Estonian language courses a statistically significant positive impact appears only among the recipients of unemployment allowances but not among the recipients of unemployment insurance benefits.
The same analysis (Lauringson 2011) also shows a statistically significant locking-in effect and anticipation effect in the 2009 training. This means that the transition of the unemployed from unemployment to employment decreases in anticipation of training and during the training. One of the reasons could be that job search is less active in the hope of finding a new job more easily after finishing training (so they first undertake the training). At the same time it is true that during training less time is left over for actual job search. The same effects
0%
5%
10%
15%
20%
1 2 3 4 5 6 7 8 9 10 11 12 13 14 15 16 17 18 19 20Sh
are
of
pe
op
le i
n e
mp
loy
me
nt
Month after finishing training
ATT 2010 ATT 2009

Estonian Unemployment Insurance Fund – Impact Evaluation of Training
32
can also have an influence on the impact evaluations conducted in this analysis. Thus the impact of training on employment and income could be somewhat lower, given that people were not looking for a job so actively before and during training and it took longer to enter into employment because of that. However, the training programmes offered through the Unemployment Insurance Fund are relatively short in duration (as shown in Table 4) and therefore the locking-in effect can only apply during a limited period of time. As the 2010 trainings were shorter than those in 2009, the impact of the locking-in effect on trainings in 2010 is even weaker. It is also probable that by 2010 the people had become more aware of the principle introduced from 1 July 2009, which allowed continuing participation in labour market training after taking a job. The possibility of using the personalised training voucher since the end of 2009 supported working and training at the same time even further, because the voucher based courses are more likely to be held after hours, which is usually not the case with procured training.
5.3. Impact of personalised training voucher and procured training in 2010
From October 2009, in addition to procured training11 labour market training started to be organised on the basis of personalised training vouchers. Thus it is possible to distinguish between procured training and voucher-based training in the 2010 sample and evaluate their individual impact. The results should be interpreted, though, bearing in mind that the impacts of these two types of training are not directly comparable for their targets are slightly different (they offer different kinds of trainings).
Only occupational training is analysed for the impact of training based on personalised training vouchers and procured training (the same sample that was used for Subsection 5.1.). Voucher-based training is defined in the data as follows: if at least one training during the observed period was undertaken on the basis of a voucher, the observation is deemed voucher-based (in very few cases one and the same individual participated in more than one training during the study period). As in the previous subsections concerning the trainings of 2010, the impact on the whole sample could be evaluated for the first six months following the training and the number of observations decreases from the seventh month.
Appendix 8 and Figures 11 and 12 describe the impact on employment and income of training based on personalised training vouchers and procured training finished in 2010. Both types of training show a statistically significant positive impact on employment, which increases over the months. On the whole voucher-based training tends to influence employment more than procured training. Six months after finishing training employment in the group that used training vouchers is almost 12% higher than in the control group, whereas the impact on employment in the group participating in procured training is close to 6%. A year after training the share of people in employment is nearly 14 percentage points higher in both treatment groups than in their control groups.
11 In this analysis procured training includes all trainings except those based on personalised training vouchers, i.e. also professional examinations for which state fees are paid.
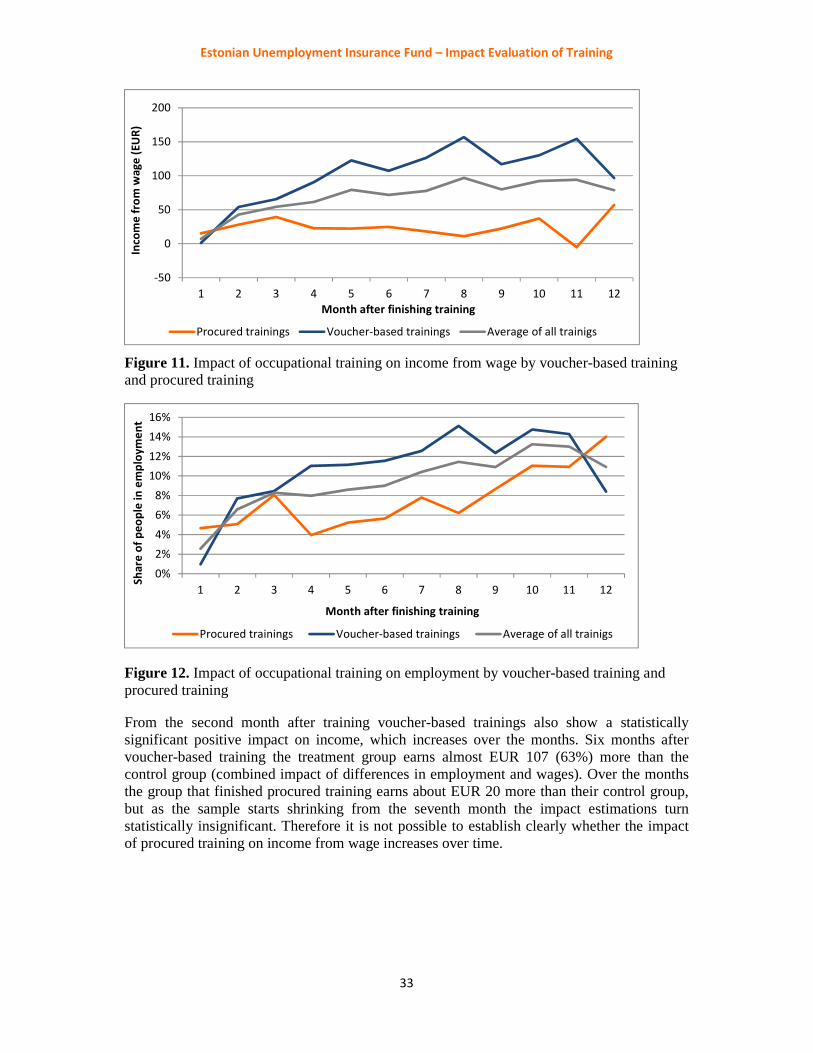
Estonian Unemployment Insurance Fund – Impact Evaluation of Training
33
Figure 11. Impact of occupational training on income from wage by voucher-based training and procured training
Figure 12. Impact of occupational training on employment by voucher-based training and procured training
From the second month after training voucher-based trainings also show a statistically significant positive impact on income, which increases over the months. Six months after voucher-based training the treatment group earns almost EUR 107 (63%) more than the control group (combined impact of differences in employment and wages). Over the months the group that finished procured training earns about EUR 20 more than their control group, but as the sample starts shrinking from the seventh month the impact estimations turn statistically insignificant. Therefore it is not possible to establish clearly whether the impact of procured training on income from wage increases over time.
-50
0
50
100
150
200
1 2 3 4 5 6 7 8 9 10 11 12
Inco
me
fro
m w
ag
e (
EU
R)
Month after finishing training
Procured trainings Voucher-based trainings Average of all trainigs
0%
2%
4%
6%
8%
10%
12%
14%
16%
1 2 3 4 5 6 7 8 9 10 11 12
Sh
are
of
pe
op
le i
n e
mp
loy
me
nt
Month after finishing training
Procured trainings Voucher-based trainings Average of all trainigs
Estonian Unemployment Insurance Fund – Impact Evaluation of Training
34
5.4. Impact of occupational training by socio-demographic characteristics
This subsection presents the impact estimations of training on employment and income broken down by different socio-demographic characteristics. The sample is the same and the models are analogous to those used in Subsection 5.1. In addition the models use exact matching by the characteristics studied (for example matching women with only women, the young with only the young etc.). Therefore the averages over the estimations for subgroups in this subsection may not coincide entirely with those for the whole sample of Subsection 5.1. Namely, the criterion of exact matching for one variable could result in a slight deterioration in the quality of matching with regards to other variables, as the control group decreases from which the best corresponding match is sought. Despite exact matching of the variables the averages over the estimations for subgroups in this subsection are very similar to those for the whole sample presented in Subsection 5.1, which is an indication of the reliability of the estimations.
5.4.1. Impact of training by gender
In this subsection the impact of occupational training on employment and income is evaluated separately for men and women (Appendix 9). According to estimations the impact of training on both employment and income has been stronger in 2010 for men and women separately as well. In addition to the increase in impact the gap between the impact on men and on women has widened. In other words, participation in training in 2009 produced a more similar result for men and women than in 2010, as regards the increase in income from wage and the employment rate.
One year later, the men who finished training in 2009 were earning approximately EUR 50 more per month than the control group. The impact was slightly weaker for women, who made an additional EUR 40 in income. A year after finishing training in 2010 the men were making almost EUR 100 more than the control group, whereas the additional income for women was less than EUR 80. However, given the slightly higher average income of men as opposed to women, the additional income earned by women due to training constitutes even a larger share for women than for men.
While the additional income in both samples has been higher in absolute terms for men because on average men are paid higher wages, the impact on the employment rate is higher for women in both years. In the case of the 2009 sample less than 8% of men and approximately 9% of women were employed a year after training. A year after finishing training in 2010 more than 8% of men and around 15% of women were employed.
In conclusion, women have gained slightly more from occupational training than men. Participation in training put more women than men into employment and their income also increased more in comparison with what they made without training. The 2010 sample saw an increase in the impact of training for both men and women, but the rise in impact was more pronounced for women.
Estonian Unemployment Insurance Fund – Impact Evaluation of Training
35
5.4.2. Impact of training by age
The impact estimations of occupational training on employment and income by age groups are presented in Appendix 10 for the 2009 sample and in Appendix 11 for the 2010 sample. As both samples are broken into three age groups the samples evaluated are sometimes quite small, thus the estimations can vary and be statistically more insignificant.
In the 2009 sample the impact estimations of training on the income of young people (up to 24 years of age) are relatively modest and statistically insignificant throughout. The impact on income is higher and always statistically significant in the group of people of older age (50+). In the group of middle-aged people (age 25 – 49), which is the most numerous in the sample, the statistically significant impact occurs only since the ninth month after training.
In comparison with the 2009 sample the impact estimations of training on the income on the 2010 sample are more pronounced and statistically more significant in all age groups. In the groups of people of older and middle age the impact estimations are statistically significant throughout and very close to each other. The estimations concerning young people in the 2010 sample are also more pronounced and statistically more significant than in the 2009 sample, but still less so than in other age groups. An analysis of additional income earned by the age groups in comparison with the control group shows that the people of older age have earned the highest additional income in relative terms (in general the control group for the people of older age earned less than other age groups).
The estimation results concerning the impact of training on employment by age groups are somewhat similar to the impact on income. In the 2009 sample the estimations concerning the employment of young people are also relatively modest and mostly statistically insignificant. The best and statistically most significant estimations concern people of older age. Similarly to income, the impact of training on employment tends to be more modest and statistically more insignificant in the first months following training, but starts increasing over the months to catch up with the group of middle-aged people.
In comparison with 2009 the impact of training on employment has been of higher magnitude in all age groups of the 2010 sample. In the first months after training the impact on employment in the groups of people of older and middle age is very similar, but six months after training the impact of training in the middle-aged group exceeds that of the people of older age. However, in light of the lower employment level of the control group for the people of older age, their relative increase in employment resulting from training is still higher than in the group of middle-aged people. The impact of training on the employment of young people is statistically insignificant in the first months but starts increasing over the subsequent months and reached the level of the other age groups.
To conclude, the group of people of older age has gained slightly more from training in both years than the other age groups. As a rule the estimation results are the lowest and generally statistically insignificant for the group of young people (at the same time this group is considerably smaller than the others, i.e. a larger sample could produce more significant results).
Estonian Unemployment Insurance Fund – Impact Evaluation of Training
36
5.4.3. Impact of training by duration of unemployment
This subsection contains the impact estimations of training on employment and income firstly by registered unemployment period and secondly by total unemployment period. Only this registered unemployment period is considered in which the person participated in training (for the control group this is the period of registration into which the moment of comparison falls). In other words, exact matching does not take into account previous periods of registration as unemployed (however these are taken into account for propensity score matching). The total unemployment period starts from the date that the person's last employment ended. Although for many people the two periods coincide, they could differ in some cases, caused for example, by the motivation to register as unemployed. Thus also the estimations for the impact of training could differ, depending on how the duration of unemployment is treated.
The impact estimations by the registered unemployment period are presented in Appendix 12 for the 2009 sample and in Appendix 13 for the 2010 sample. For the 2009 sample the impact of training on income is relatively similar to those who had been registered as unemployed less than six months and to those who had been registered from six months to one year after finishing training (the additional income earned by those whose period of registration was shorter is only slightly higher). The impact estimations for persons who had been registered as unemployed over one year (the smallest group among those who finished training) are the lowest among all groups and are statistically insignificant in several months.
The impact of training on income for the 2010 sample exhibit a great increase in the group whose period of registration was the shortest, the increase is slightly smaller among those who had been registered less than a year and the smallest in the group whose members had been registered as unemployed the longest. In the latter group the statistically significant impact of training on income can be seen only during the first six months, when the whole sample can be observed.
The impact estimations of training on employment are similar to those on income. In the 2009 sample the impact estimation is only slightly higher for those who had been registered for a short time than for those who had been registered less than one year. The impact for those who had been registered longer remains modest and in several months statistically insignificant.
In comparison with the 2009 sample the impact on employment in the 2010 sample shows higher impact in all groups, and is the highest among those who had been registered as unemployed for the shortest period. Although in absolute terms the impact of training on the employment rate differs in the different groups, the relative increase in the employment rate is fairly similar across all groups (the control group of those who had been registered longer also have a lower employment rate). In general, looking at the registered unemployment periods in both years, the impact of training on the labour market outcomes has been the strongest among those who had been registered as unemployed during a shorter period.
The impact estimations of occupational training by the total unemployment period are presented in Appendices 14 and 15. Persons about whom the database showed not a single previous episode of employment are included among those whose total unemployment period had been over 12 months (the number of persons who had never been employed is so small in the sample that it is not possible to make a separate estimate about them).

Estonian Unemployment Insurance Fund – Impact Evaluation of Training
37
In the 2009 sample the impact of training on income is relatively similar among persons who had been unemployed up to one year and those whose unemployment had lasted more than a year. In the group where the total unemployment period is the longest, the impact of training increases even slightly faster over the months and therefore two years after training the impact on income in that group is higher than in the group in which the total unemployment period had lasted up to 12 months. Among those who had been unemployed during the shortest period training has no statistically significant impact on income in the first nine months. In subsequent months the impact on that group grows stronger than on those who had been unemployed during longer periods. In this case the group of persons who had been unemployed less than six months is the smallest. As the total unemployment period is somewhat longer than the registered unemployment period, the people belonging to this group have been registered as unemployed for a very short time, they have only had time to participate in very short trainings and have had very little time to look for a job that would meet their new qualifications. This could be the reason why it takes longer in this group for the impact of training to appear.
In comparison with the 2009 sample the impact estimates on the 2010 sample are higher in all groups. The impact of training is also more similar in the groups that had been unemployed longer, particularly in the first months after training. In the group that had been unemployed for the shortest period the statistically significant impact of training occurs from the third month and remained somewhat higher from then on in comparison with other groups.
In the 2009 sample the impact estimates of training on employment are generally statistically more significant than impact estimates on income and there is higher variation by groups. The impact of training on employment follows a similar pattern in the groups whose members had been unemployed longer, but still the impact is slightly stronger among those who had been unemployed from 6-12 months than among those who had been unemployed at least 12 months. The impact on employment also increases during the first year among those who had been unemployed for the shortest period. In the second year this impact considerably exceeds the impact of the longer term unemployed.
In the 2010 sample the impact of training on employment is of higher magnitude in all groups. Moreover, in relative terms the impact of training has increased the most among those who had been unemployed for the longest period (this could be caused by the changes in the training principles but also by the changes in the composition of the group that included persons who had been unemployed the longest). In the 2010 sample the impact of training during the first year has increased most among those who had been unemployed for the shortest period and towards the end of the observed period exceeds the impact in other groups. As the control group of those who had been unemployed longer have a lower employment rate than in other groups, the relative increase of the employment rate is actually higher in this group in comparison with the other groups.
In conclusion, in both years the impact of training on income and employment has been the strongest among those who had been unemployed during the shortest period. This result is similar in the models looking at the registered unemployment period and in the models analysing the total unemployment period. However, as a rule transition to employment is more difficult as the period of unemployment becomes longer, therefore the relative impact of training is more similar across the groups.

Estonian Unemployment Insurance Fund – Impact Evaluation of Training
38
5.4.4. Impact of training by education level
The impact estimations of occupational training on employment and income are presented in Appendix 16 for the 2009 sample and in Appendix 17 for the 2010 sample. The group "basic education or less" includes persons who have acquired as the highest level of education the following: basic education with vocational education, basic education, vocational education without basic education, primary education or less. The secondary education group includes those who have acquired vocational secondary education on the basis of basic education or vocational secondary education on the basis of secondary education or general secondary education. The higher education group consists of persons with the following education: professional secondary education, professional higher education, Bachelor's, Master's or Doctor's degree.
In the case of the 2009 sample the impact of training on both income and employment is the highest (and statistically more significant) for persons with secondary education. The impact estimations for persons with higher education and with basic education or less are quite similar. But as the labour market outcomes for persons with basic education or less are not as good as those for persons with higher education, the relative positive impact from training is stronger for persons with basic education.
Estimates based on the 2010 sample show that training has had the strongest impact on income for people with higher education. The impact estimations for persons with secondary education and with basic education or less are more similar (as the income levels of people with basic education or less are lower, the relative impact is stronger in their group).
In the 2010 sample the impact on employment is the highest in the group with basic education or less. The impact of training on employment is slightly lower for people with secondary education and the lowest for those with secondary education.
To conclude, persons with secondary education have gained the most from training in the 2009 sample, followed closely by those with basic education or less. In the 2010 sample training has been the most advantageous for people with basic education or less, and a little less so for those with higher education. A comparison between the two years reveals that people with basic education and higher education have experienced the highest increase in the impact of training on employment and income, but for people with secondary education the impact has almost not changed.
5.4.5. Impact of training by main language of communication
This section estimates the impact of occupational training on employment and income by the main language of communication. A distinction is made between those whose main language of communication is Estonian and those who have stated another language as their main language of communication (mostly Russian, but other languages are represented as well). Appendix 18 contains the estimations conducted.
The impact of training on income has been slightly stronger among the people speaking Estonian in both the 2009 and 2010 sample. However, the difference between the speakers of Estonian and other languages is relatively small. Given that the income of speakers of other

Estonian Unemployment Insurance Fund – Impact Evaluation of Training
39
languages is somewhat lower, its relative increase as a result of training has been even a little higher in that group.
As regards employment the impact is also to a certain extent higher in the group speaking Estonian. The difference in impact on employment has been bigger in the 2009 sample, but almost non-existent in 2010. Looking at employment levels without training the relative increase in employment has been actually greater among persons speaking another language.
In summary the estimations concerning the impact of training on income and employment in 2010 are considerably higher than in 2009 in both language groups. The estimations within the same year are very similar among the speakers of Estonian and other languages.

Estonian Unemployment Insurance Fund – Impact Evaluation of Training
40
6. COST-BENEFIT ANALYSIS OF TRAINING
Kristi Villsaar
This chapter presents the cost-benefit analysis of labour market training, which is conducted to establish the usefulness of providing training to the unemployed for the society and for the state. The cost-benefit analysis looks at the difference between the costs and benefits related to training and compares the result with the situation when no training takes place. The cost-benefit analysis is carried out on the basis of the data concerning people who finished training between April and October 2010. The cost-benefit analysis sample includes 1 642 persons. The cost-benefit analysis does not cover the trainings finished in 2009, as no data about the cost per training place are available in the database for that year. The analysis compares the costs and benefits for the society as a whole and looks separately at the impact on the budget of the government sector.
For the purposes of the analysis costs of training include the cost of the training course and the grants and travel and accommodation subsidies given to participants in training. The revenues consist of wage income earned by people who entered employment and taxes paid on their wages. Unemployment benefits (unemployment allowance and unemployment insurance benefit) saved when the unemployed enter employment are also included on the revenue side. Along with the decrease in unemployment benefit costs, transition to employment should also help to reduce the number of persons in need of subsistence benefits. However, savings from subsistence benefits are not included in this analysis, as the relevant data were not available.
The taxes payable by employers include social tax (33% of the gross wage) and the employer's share of the unemployment insurance premium (1.4% of the gross wage). Taxes due by the employees include the employee's share of the unemployment insurance premium (2.8% of the gross wage) and income tax (21%). The employee's share of the unemployment insurance premium and the basic exemption (EUR 144 per month) are deducted from the gross wage before calculating income tax. The funded pension contributions (2nd pillar) are not taken into account for the purpose of calculating the taxes, due to the lack of data about the number of persons in the sample who had joined the funded pension system or who had continued making contributions in the system in 2010, when those who so wished, could suspend their funded pension contributions. As a result of leaving out the funded pension contributions the income tax revenues could be shown as being somewhat higher, as the funded pension contribution is not deducted from the gross wage before calculating income tax.
The average cost per participant who finished training between April and October 2010 was EUR 618.78, of which the average cost per training place was EUR 504.79, the average grant paid was EUR 54.77 and the average travel and accommodation cost subsidy was EUR 59.23.
The revenues are estimated by comparing the wages of the treatment group and the control group after finishing training and assessing the taxes due on the wages. Figure 13 shows the impact of training on income from wage: the average income from wage over the months for the treatment group and the control group, as well as the difference in wages of the two groups (ATT). In both groups income from wage increases over the months; caused mainly by the increasing share of people who enter employment over the months. The fact that during employment wages tend to increase as a rule could also played a role here. The
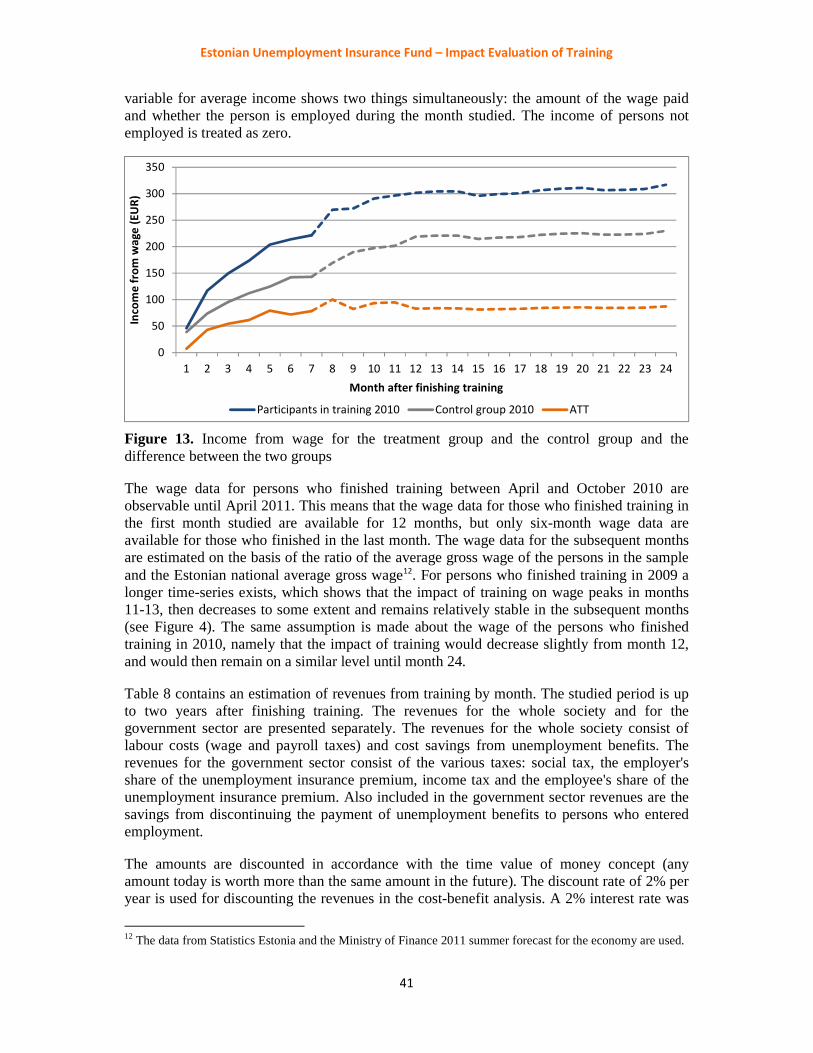
Estonian Unemployment Insurance Fund – Impact Evaluation of Training
41
variable for average income shows two things simultaneously: the amount of the wage paid and whether the person is employed during the month studied. The income of persons not employed is treated as zero.
Figure 13. Income from wage for the treatment group and the control group and the difference between the two groups
The wage data for persons who finished training between April and October 2010 are observable until April 2011. This means that the wage data for those who finished training in the first month studied are available for 12 months, but only six-month wage data are available for those who finished in the last month. The wage data for the subsequent months are estimated on the basis of the ratio of the average gross wage of the persons in the sample and the Estonian national average gross wage12. For persons who finished training in 2009 a longer time-series exists, which shows that the impact of training on wage peaks in months 11-13, then decreases to some extent and remains relatively stable in the subsequent months (see Figure 4). The same assumption is made about the wage of the persons who finished training in 2010, namely that the impact of training would decrease slightly from month 12, and would then remain on a similar level until month 24.
Table 8 contains an estimation of revenues from training by month. The studied period is up to two years after finishing training. The revenues for the whole society and for the government sector are presented separately. The revenues for the whole society consist of labour costs (wage and payroll taxes) and cost savings from unemployment benefits. The revenues for the government sector consist of the various taxes: social tax, the employer's share of the unemployment insurance premium, income tax and the employee's share of the unemployment insurance premium. Also included in the government sector revenues are the savings from discontinuing the payment of unemployment benefits to persons who entered employment.
The amounts are discounted in accordance with the time value of money concept (any amount today is worth more than the same amount in the future). The discount rate of 2% per year is used for discounting the revenues in the cost-benefit analysis. A 2% interest rate was
12 The data from Statistics Estonia and the Ministry of Finance 2011 summer forecast for the economy are used.
0
50
100
150
200
250
300
350
1 2 3 4 5 6 7 8 9 10 11 12 13 14 15 16 17 18 19 20 21 22 23 24
Inco
me
fro
m w
ag
e (
EU
R)
Month after finishing training
Participants in training 2010 Control group 2010 ATT
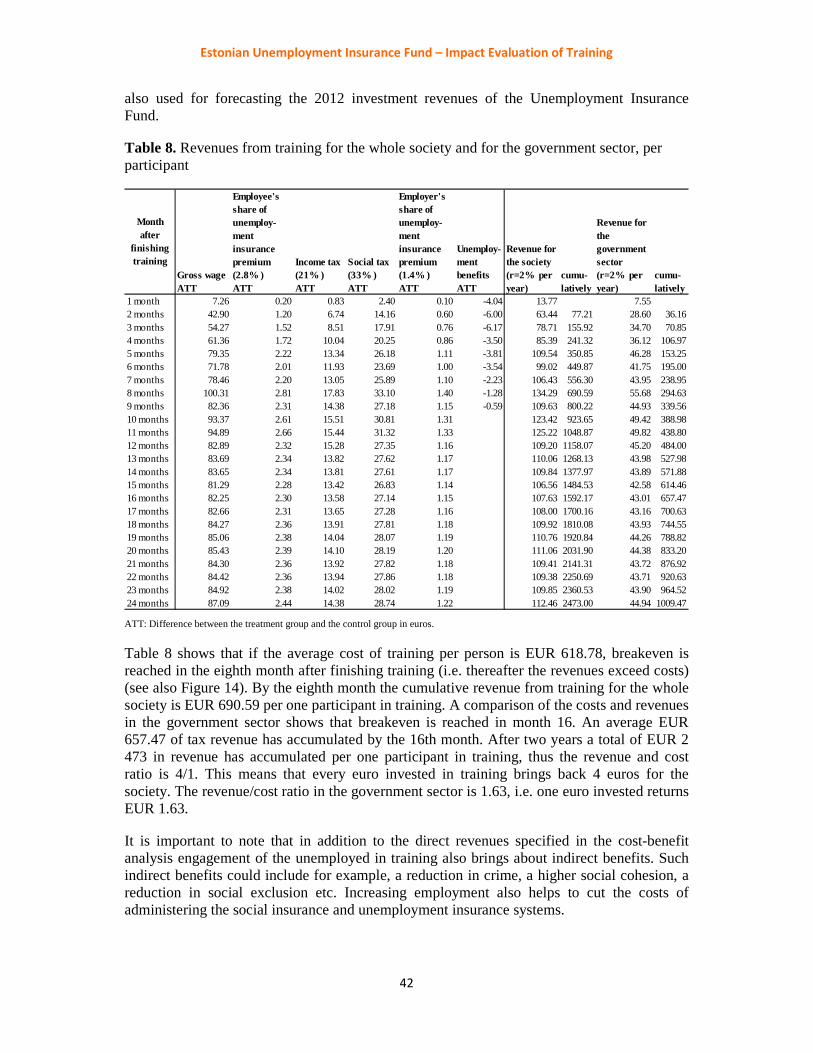
Estonian Unemployment Insurance Fund – Impact Evaluation of Training
42
also used for forecasting the 2012 investment revenues of the Unemployment Insurance Fund.
Table 8. Revenues from training for the whole society and for the government sector, per participant
ATT: Difference between the treatment group and the control group in euros.
Table 8 shows that if the average cost of training per person is EUR 618.78, breakeven is reached in the eighth month after finishing training (i.e. thereafter the revenues exceed costs) (see also Figure 14). By the eighth month the cumulative revenue from training for the whole society is EUR 690.59 per one participant in training. A comparison of the costs and revenues in the government sector shows that breakeven is reached in month 16. An average EUR 657.47 of tax revenue has accumulated by the 16th month. After two years a total of EUR 2 473 in revenue has accumulated per one participant in training, thus the revenue and cost ratio is 4/1. This means that every euro invested in training brings back 4 euros for the society. The revenue/cost ratio in the government sector is 1.63, i.e. one euro invested returns EUR 1.63.
It is important to note that in addition to the direct revenues specified in the cost-benefit analysis engagement of the unemployed in training also brings about indirect benefits. Such indirect benefits could include for example, a reduction in crime, a higher social cohesion, a reduction in social exclusion etc. Increasing employment also helps to cut the costs of administering the social insurance and unemployment insurance systems.
cumu- latively
cumu- latively
1 month 7.26 0.20 0.83 2.40 0.10 -4.04 13.77 7.552 months 42.90 1.20 6.74 14.16 0.60 -6.00 63.44 77.21 28.60 36.163 months 54.27 1.52 8.51 17.91 0.76 -6.17 78.71 155.92 34.7070.854 months 61.36 1.72 10.04 20.25 0.86 -3.50 85.39 241.32 36.12 106.975 months 79.35 2.22 13.34 26.18 1.11 -3.81 109.54 350.85 46.28 153.256 months 71.78 2.01 11.93 23.69 1.00 -3.54 99.02 449.87 41.75 195.007 months 78.46 2.20 13.05 25.89 1.10 -2.23 106.43 556.30 43.95 238.958 months 100.31 2.81 17.83 33.10 1.40 -1.28 134.29 690.59 55.68 294.639 months 82.36 2.31 14.38 27.18 1.15 -0.59 109.63 800.22 44.93 339.5610 months 93.37 2.61 15.51 30.81 1.31 123.42 923.65 49.42 388.9811 months 94.89 2.66 15.44 31.32 1.33 125.22 1048.87 49.82 438.8012 months 82.89 2.32 15.28 27.35 1.16 109.20 1158.07 45.20 484.0013 months 83.69 2.34 13.82 27.62 1.17 110.06 1268.13 43.98 527.9814 months 83.65 2.34 13.81 27.61 1.17 109.84 1377.97 43.89 571.8815 months 81.29 2.28 13.42 26.83 1.14 106.56 1484.53 42.58 614.4616 months 82.25 2.30 13.58 27.14 1.15 107.63 1592.17 43.01 657.4717 months 82.66 2.31 13.65 27.28 1.16 108.00 1700.16 43.16 700.6318 months 84.27 2.36 13.91 27.81 1.18 109.92 1810.08 43.93 744.5519 months 85.06 2.38 14.04 28.07 1.19 110.76 1920.84 44.26 788.8220 months 85.43 2.39 14.10 28.19 1.20 111.06 2031.90 44.38 833.2021 months 84.30 2.36 13.92 27.82 1.18 109.41 2141.31 43.72 876.9222 months 84.42 2.36 13.94 27.86 1.18 109.38 2250.69 43.71 920.6323 months 84.92 2.38 14.02 28.02 1.19 109.85 2360.53 43.90 964.5224 months 87.09 2.44 14.38 28.74 1.22 112.46 2473.00 44.94 1009.47
Employer'sshare of unemploy-ment insurance premium (1.4% )ATT
Unemploy-ment benefitsATT
Revenue for the society (r=2% per year)
Revenue for the government sector (r=2% per year)
Month after
finishing training
Gross wage ATT
Employee'sshare of unemploy-ment insurance premium (2.8% )ATT
Income tax (21% ) ATT
Social tax (33% ) ATT

Estonian Unemployment Insurance Fund – Impact Evaluation of Training
43
Figure 14. Costs and benefits of training.
Another aspect to be taken into account is the fact that the cost-benefit analysis is conducted on the basis of trainings finished in 2010 – a period of rapid improvement on the labour market. Should the economic situation be less advantageous for exit from unemployment the revenues accompanying training could be smaller and the breakeven point could be postponed. In addition, the time-series of revenues available at the time of conducting the analysis have been limited and therefore the revenues generated in the later months are only estimated. The actual revenues could turn out to be somewhat different from the estimates if the time-series were extended by using real data.
0
500
1 000
1 500
2 000
2 500
3 000
1 2 3 4 5 6 7 8 9 10 11 12 13 14 15 16 17 18 19 20 21 22 23 24
EU
R
Month after finishing training
Revenues for the society Revenues for the government sector Expenditures on training

Estonian Unemployment Insurance Fund – Impact Evaluation of Training
44
CONCLUSIONS
The objective of this analysis was to find out whether the labour market training provided in 2009 and 2010 had an impact on the labour market outcomes of the participants in the training. In 2009 the provision of training was rather based on the wishes of the participants and occurred at the time when unemployment was increasing rapidly. In 2010 a transition to needs-based training took place and the economic situation was more favourable, as unemployment had just started to decrease again after a peak. Therefore it was somewhat difficult in the impact estimations to distinguish between the role played by the change in training principles and the change in economic situation. However, as in addition to the whole sample the impact of training was estimated separately by month, and that no seasonality or direct effect of the economic situation on the labour market outcomes was revealed, the training principles probably also made an impact. In other words, the estimates produced on the two samples were certainly influenced by the composition of the groups and the types of training in the relevant periods.
The impact of training on both samples was estimated by using propensity score matching (persons registered as unemployed who were statistically as similar as possible to those who participated in training were used as a control group). The impact estimations showed that occupational training had a positive impact on income from wage and on employment both in 2009 and in 2010. In both samples the impact of training increased in the course of the first year. In the case of the 2009 sample it was possible to observe the impact of training on income and employment during the second year after training as well. According to the results the impact of training in the second year stayed at approximately the level reached by the end of the first year.
The estimations derived on the basis of the 2010 sample exceeded those of the 2009 sample both with regard to income13 and employment. A year later the persons who finished training in 2009 earned close to EUR 50 more as income from wage (i.e. almost one-third more than the control group), but those who finished training in 2010 made approximately EUR 90 (nearly 50%) more in comparison with the control group. According to the estimations for 2009 the impact of training on employment increased steadily during one year and reached 10% percentage points. The impact of 2010 trainings also increased and peaked around 13 percentage points by the end of the first year after training.
Estimations of occupational training on wage indicated a statistically significant positive impact for the trainings of 2010. The estimations based on the 2009 sample failed to produce a statistically significant impact on wages (the results rather indicate to a low negative impact).
With regard to unemployment benefit expenses, the estimations showed that occupational training in 2010 had a statistically significant impact on reducing the actual period of paying benefits and the amounts of benefits paid. On average the actual period of receiving benefits was by ten days (13%) shorter in the treatment group than in the control group and the actual expense per benefit recipient was EUR 67 (12%) smaller than in the control group. The estimations on the 2009 sample also showed that training reduced the actual period of paying benefits across all types of benefits. The estimation results concerning the savings on benefits
13 Income takes into account income from wage and is influenced both by the share of people in employment and by the amount of wage in the case of persons in employment.

Estonian Unemployment Insurance Fund – Impact Evaluation of Training
45
are influenced by the duration of the potential period during which benefits can be paid. Therefore, the more generous the system of paying benefits, the stronger the impact of training on saving expenses on benefits.
In addition to occupational training the analysis also estimated the impact of Estonian language courses on employment and income. Like occupational training the estimations of the impact of Estonian language courses were positive in the case of the 2010 sample. The estimations on the 2009 sample, however, did not show a statistically significant positive impact. The reason why the results differed by year could lie in the fact that in 2010 only work related Estonian language training was offered, whereas language training in 2009 focused more on general language learning.
From October 2009 training started to be organised on the basis of personalised training vouchers in addition to procured trainings. Thus it was possible to estimate separately the impact of procured training and voucher-based training in the analysis. Both procured training and voucher-based training had a statistically significant positive impact on employment and income, which grew over the months. In general, the impact of voucher-based training on employment and income was somewhat stronger than the impact of procured training. Six months after finishing training employment in the group that used training vouchers was almost 12% higher than in their control group, whereas the impact on employment in the group participating in procured training was close to 6%. A year after training the share of people in employment was nearly 14 percentage points higher in both treatment groups than in their control groups. Six months after voucher-based training the treatment group earned almost EUR 107 more than the control group and the group that finished procured training earned about EUR 20 more than their control group.
A more in-depth analysis was conducted for the impact of occupational training on employment and income by different socio-demographic characteristics. In general women gained more from occupational training than men, as participation in training increased their employment rate more and their additional income was also higher in comparison with what they made without training. Compared to the 2009 sample the 2010 sample saw an increase in the impact of training for both men and women, but the rise in impact was more pronounced for women.
With regard to age groups, the group of people of older age gained slightly more from training in both years than the other age groups. As a rule the estimations were the lowest and generally statistically insignificant for the group of young people (at the same time this group was considerably smaller than the others, i.e. a larger sample could produce more significant results).
Estimations of the impact of training by duration of unemployment showed that in both years the impact of training on income and employment was the strongest among those who had been unemployed during the shortest period. This result was similar in models looking at the registered unemployment period and in models analysing the total unemployment period. However, as a rule transition to employment is more difficult as the period of unemployment becomes longer, therefore the relative impact of training has been more similar across the groups.
The analysis of the impact of training by education levels showed that in the case of the 2009 sample the impact of training on both income and employment was the strongest for persons with secondary education, in the case of the 2010 sample for persons with basic education or

Estonian Unemployment Insurance Fund – Impact Evaluation of Training
46
less and for persons with higher education. As the employment and income levels of people with basic education or less are generally lower, they have benefited comparatively more from training. The impact of training by the main language of communication showed that the impact was relatively similar among speakers of Estonian and speakers of other languages. In summary the impact of occupational training on employment and income was stronger in 2010 than in 2009 in all groups studied.
The cost-benefit analysis conducted the estimation results for the impact of occupational training showed that breakeven was achieved in the eighth month after finishing training (i.e. thereafter the revenues exceed costs). A comparison of the costs and revenues in the government sector showed that breakeven was reached in month 16. After two years the revenue and cost ratio was 4/1. This means that every euro invested in training brought back 4 euros for the society. The revenue/cost ratio in the government sector was 1.63, i.e. one euro invested returned EUR 1.63.
The estimation results of this analysis resemble those for other countries. The impact evaluations of training conducted in other countries have also shown mostly positive results about the labour market outcomes of the participants in training. Similarly an increase of the positive impact during the period following training has been noted. In addition, it is often observed that women and persons who have been unemployed for a shorter period tend to benefit more from training, and that the impact of training can differ by type of training. Studies in other countries have also depicted that training has a positive impact primarily on employment, whereas the impact on wages is less pronounced. The same is true for this analysis as the impact of training on employment turned out to be positive in the case of both samples, but the impact on wages was positive and statistically significant only in the 2010 sample.
The results achieved in other countries sometimes also point to the locking-in effect, which means that job-seeking may not be so active during participation in training (either because less time is available for job search or the participants expect that their prospects on the labour market would increase considerably after completing the training). As this analysis studied the impact only after finishing training, the gross impact of training, starting from the moment a person is assigned to training, could be slightly weaker because of the locking-in effect. However, in this analysis the impact of the locking-in effect can be only very limited, as the trainings offered in the observed periods where as a rule very short in duration. For example in the 2009 sample one-third of the trainings lasted less than one month and almost all were shorter than three months. In the case of the 2010 sample the locking-in effect was even less significant, since two-thirds of the trainings were shorter than one month and close to 100% did not last longer than three months. Based on Estonian data, the locking-in effect could have a limited impact also because it is possible to continue training after a person has entered employment.

Estonian Unemployment Insurance Fund – Impact Evaluation of Training
47
REFERENCES
1. Becker, S. O. and Caliendo, M. (2007), „Sensitivity Analysis for Average Treatment Effects“, Stata Journal, Vol. 7, No. 1, pp. 71-83.
2. Betcherman, G., Olivas, K., Dar A. (2004), „Impacts of Active Labor Market Programs: New Evidence from Evaluations with Particular Attention to Developing and Transition Countries“, Social Protection Discussion Paper Series, No. 0402, 94 p.
3. Blundell, R. and Costa Dias, M. (2009), „Alternative Approaches to Evaluation in Empirical Microeconometrics“, Journal of Human Resources, Vol. 44, No. 3, pp. 565-640.
4. Caliendo, M. (2006), „Microeconometric Evaluation of Labour Market Policies“, Lecture Notes in Economics and Mathematical Systems, Springer-Verlag Berlin Heidelberg. 260 p.
5. Caliendo, M. and Kopeinig, S. (2008), “Some Practical Guidance for the Implementation of Propensity Score Matching”, Journal of Economic Surveys, Vol. 22, No. 1, pp. 31-72.
6. Dehejia, R. H. (2005), „Practical Propensity Score Matching: A Reply to Smith and Todd“, Journal of Econometrics, Vol. 125, pp. 355-364.
7. Dehejia, R. H. and Wahba, S. (1999), „Causal Effects in Nonexperimental Studies: Reevaluating the Evaluation of Training Programs“, Journal of the American Statistical Association, Vol. 94, No. 448, pp. 1053-1062.
8. DiPrete, T and Gangl, M. (2004), “Assessing bias in the estimation of causal effects: Rosenbaum bounds on matching estimators and instrumental variables estimation with imperfect instruments”, Sociological Methodology, Vol. 34, pp. 271-310.
9. Fares, J., Puerto, O.S. „Towards Comprehensive Training“, SP Discussion Paper, 2009, No. 0924, 53 p.
10. Fitzenberger, B., Völter, R. „Long-run effects of training programs for the unemployed in East Germany“, Labour Economics, 2007, No. 14, pp.730-755.
11. Gangl, M. (2004), “RBOUNDS: Stata module to perform Rosenbaum sensitivity analysis for average treatment effects on the treated”, software, http://ideas.repec.org/c/boc/bocode/ s438301.html.
12. Kluve, J. „The Effectiveness of European Active Labor Market Policy“, IZA Discussion Paper, 2006, No. 2018, 47 p.
13. Lauringson, A. “Unemployment Benefits in the Period of Crisis: the Effect on Unemployment Duration” – Working Paper No. 82, University of Tartu, Faculty of Economics and Business Administration, 2011, 31 p. http://www.mtk.ut.ee/orb.aw/class=file/action=preview/id=1071568/Febawb82.pdf
14. Lechner, M. (2001), „Identification and estimation of causal effects of multiple treatments under the conditional independence assumption“, in Econometric Evaluation of Labour Market Policies, ed. by Lechner, M. and Pfeiffer, F, pp. 1-18.
15. Leetmaa, R., Võrk, A., Eamets, R., Sõstra, K. „Aktiivse tööpoliitika tulemuslikkuse analüüs Eestis“, Poliitikauuringute Keskus Praxia, Tallinn, 2003, 108 lk.

Estonian Unemployment Insurance Fund – Impact Evaluation of Training
48
16. Leping, K-O. „Aktiivse tööpoliitika meetmete mõju hindamine Eesti näitel“, TÜ rahvamajanduse instituut, 2004, 92 lk. (magistriprojekt)
17. Leuven, E. and Sianesi, B. (2003), “PSMATCH2: Stata module to perform full Mahalanobis and propensity score matching, common support graphing, and covariate imbalance testing”, software, http://ideas.repec.org/c/boc/bocode/s432001.html.
18. Rosenbaum, P. and Rubin, D. (1983), „The Central Role of the Propensity Score in Observational Studies for Causal Effects“, Biometrika, Vol. 70, Issue 1, pp. 41–55.
19. Rosholm, M., Svarer, M. „Estimating the Threat Effect of Active Labour Market Programmes“, IZA Discussion Paper, 2004, No. 1300, 40p.
20. Sianesi, B. „Differential effects of active labour market programs for the unemployed“, Labour Economics, 2008, No. 15, pp. 370-399.
21. Smith, J. A. (2004), „Evaluating Local Economic Development Policies: Theory and Practice“, in Evaluating Local Economic and Employment Development. How to Assess What Works among Programs and Policies, OECD, pp. 287-332.
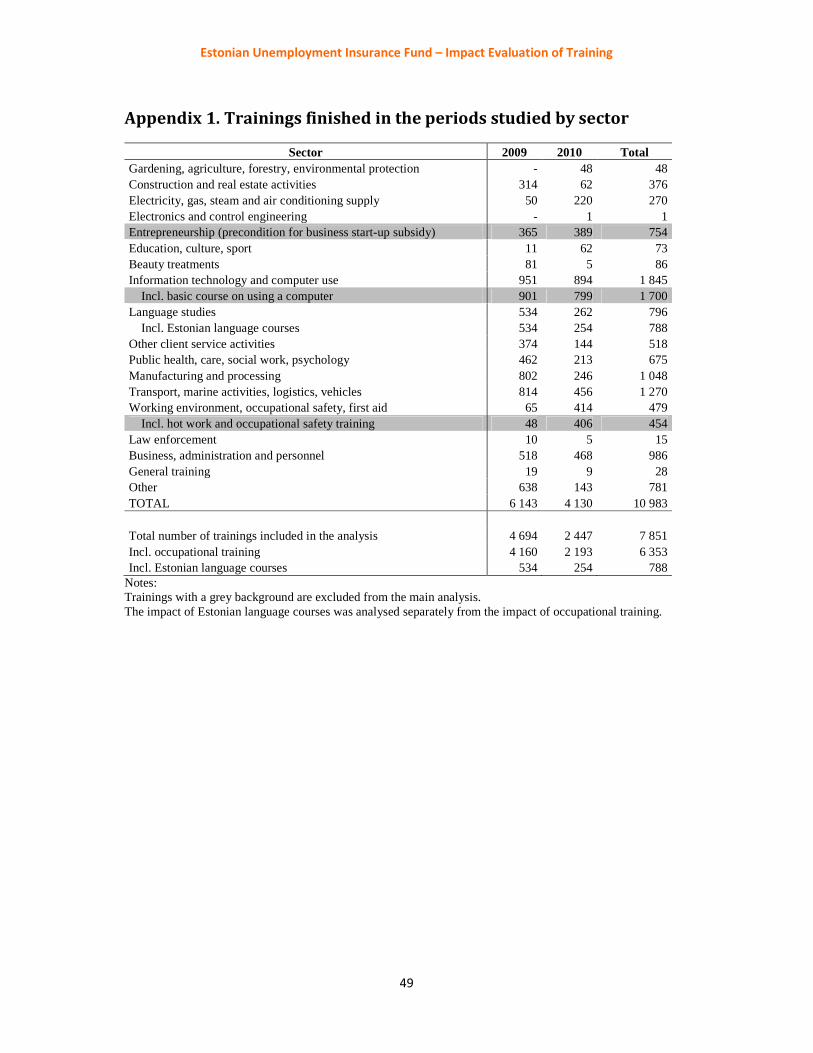
Estonian Unemployment Insurance Fund – Impact Evaluation of Training
49
Appendix 1. Trainings finished in the periods studied by sector
Sector 2009 2010 Total Gardening, agriculture, forestry, environmental protection - 48 48 Construction and real estate activities 314 62 376 Electricity, gas, steam and air conditioning supply 50 220 270 Electronics and control engineering - 1 1 Entrepreneurship (precondition for business start-up subsidy) 365 389 754 Education, culture, sport 11 62 73 Beauty treatments 81 5 86 Information technology and computer use 951 894 1 845
Incl. basic course on using a computer 901 799 1 700 Language studies 534 262 796
Incl. Estonian language courses 534 254 788 Other client service activities 374 144 518 Public health, care, social work, psychology 462 213 675 Manufacturing and processing 802 246 1 048 Transport, marine activities, logistics, vehicles 814 456 1 270 Working environment, occupational safety, first aid 65 414 479
Incl. hot work and occupational safety training 48 406 454 Law enforcement 10 5 15 Business, administration and personnel 518 468 986 General training 19 9 28 Other 638 143 781 TOTAL 6 143 4 130 10 983 Total number of trainings included in the analysis 4 694 2 447 7 851 Incl. occupational training 4 160 2 193 6 353 Incl. Estonian language courses 534 254 788
Notes: Trainings with a grey background are excluded from the main analysis. The impact of Estonian language courses was analysed separately from the impact of occupational training.

Estonian Unemployment Insurance Fund – Impact Evaluation of Training
50
Appendix 2. Description of variables used for matching
Variables used for matching
Variable Description Comparison group
Male Gender: male Female Age Age as of the period studied Age squared Age as of the period studied, squared
Primary education or less Vocational education without basic education, primary education or less
General secondary education
Basic education Basic education, basic education with vocational education Vocational secondary education
Vocational secondary education based on basic education, vocational secondary education based on secondary education
Professional secondary education
Professional secondary education
Professional higher education Professional higher education, professional higher education Bachelor’s degree Bachelor’s degree Master’s or doctor’s degree Master’s or doctor’s degree Managers Senior officials and managers
No prior work experience
Professionals Professionals Technicians Associate professionals and technicians Clerks Clerical support workers Service and sales workers Service and sales workers Agricultural workers Skilled agricultural, forestry and fishery workers Craft workers Craft and related trades workers Plant and machine operators Plant and machine operators Elementary occupations Elementary occupations
Language of communication: Estonian
Estonian has been stated as the main language of communication
Another language has been stated as the main language of communication
Tenure in previous job Length of tenure in previous job (in years)
Place of residence: urban A town or city has been stated as the place of residence Place of residence: rural municipality
Harju County The person has been registered as unemployed at the regional office of the Unemployment Insurance Fund in Tallinn and Harju County
The person has been registered as unemployed in Lääne, Saare, Hiiu, Pärnu, Rapla, Tartu, Jõgeva, Lääne-Viru, Viljandi or Järva County
Southern Estonia The person has been registered as unemployed at the regional office of the Unemployment Insurance Fund in Põlva, Valga or Võru County
Ida-Viru County The person has been registered as unemployed at the regional office of the Unemployment Insurance Fund in Ida-Viru County
With a disability During the period of registration the person belonged to the risk group of persons with disabilities
Persons not belonging to this risk group
Prior periods of registered unemployment
The number of periods of registered unemployment since 2003 (before the studied period)
Duration of prior periods of registered unemployment
The total duration of all prior periods of registered unemployment since 2003 (years) (before the studied period)
Duration of registered unemployment
Duration in days of the studied period of registered unemployment, as of the moment of observation
Duration of registered unemployment, squared
Duration in days of the studied period of registered unemployment, as of the moment of observation, squared
Potential period of unemployment benefits
The number of unused days for which unemployment benefits (unemployment insurance benefit, unemployment allowance) are due, as of the moment observed. In other words, during how many days the person is still entitled to receive benefits.

Estonian Unemployment Insurance Fund – Impact Evaluation of Training
51
Recipient of unemployment insurance benefit for 180 days
During the corresponding period of registered unemployment the person has been granted unemployment insurance benefit for 180 days The person has been
granted no unemployment insurance benefit or unemployment allowance
Recipient of unemployment insurance benefit for 270 days
During the corresponding period of registered unemployment the person has been granted unemployment insurance benefit for 270 days
Recipient of unemployment allowance
During the corresponding period of registered unemployment the person has been granted unemployment allowance (the person had not been previously granted insurance benefit during the same period of registered unemployment)
Daily rate of unemployment benefit
The daily rate of the unemployment insurance benefit or the daily rate of the unemployment allowance, depending on which benefit was granted to the person
Cause of termination of employment: on the initiative of the employer
Cause of termination of the latest employment. All the different causes of termination of employment initiated by the employer (redundancy, bankruptcy, failure to pass the probationary period etc.)
Cause of termination of employment has not been stated
Cause of termination of employment: voluntary
The latest employment was terminated by agreement between the parties or upon the initiative of the employee

Estonian Unemployment Insurance Fund – Impact Evaluation of Training
52
Appendix 3. The impact of occupational training on income from wage
Outcome variable
2010 2009
No. of observ.
ATT, €
Diffe-rence
Standard error p-value
No. of observ.
ATT, €
Diffe-rence
Standard error p-value
Income from wage on 1st month 1642 7.2 19% 8.76 0.408 3226 3.7 18% 2.97 0.213 2nd month 1642 42.9 58% 12.78 0.001 3226 18.0 46% 4.14 0.000 3rd month 1642 54.2 57% 11.64 0.000 3226 17.4 30% 5.12 0.001
4th month 1642 61.3 55% 12.12 0.000 3226 20.3 29% 5.60 0.000 5th month 1642 79.3 64% 13.41 0.000 3226 25.2 31% 6.10 0.000 6th month 1642 71.7 50% 13.07 0.000 3226 27.0 32% 6.12 0.000
7th month 1392 77.6 55% 14.32 0.000 3226 26.8 29% 6.48 0.000 8th month 1135 96.9 59% 18.76 0.000 3226 31.8 33% 6.36 0.000 9th month 972 79.9 44% 18.30 0.000 3226 39.0 37% 6.95 0.000 10th month 891 92.3 47% 20.48 0.000 3226 44.0 36% 8.51 0.000 11th month 630 94.0 47% 23.91 0.000 3226 51.5 39% 8.19 0.000 12th month 366 78.9 38% 28.68 0.006 3226 52.0 37% 8.23 0.000 13th month 3226 51.2 35% 8.11 0.000 14th month 3226 37.7 24% 8.48 0.000 15th month 3226 40.4 24% 8.77 0.000 16th month 3226 45.8 28% 8.81 0.000 17th month 3226 39.5 23% 8.94 0.000 18th month 3226 43.5 25% 9.32 0.000 19th month 3226 37.1 21% 8.75 0.000 20th month 2645 39.6 24% 9.35 0.000 21st month 2085 46.2 29% 10.42 0.000
22nd month 1471 47.9 29% 13.14 0.000 23rd month 712 24.7 14% 17.81 0.166
Number of observations: Number of people who finished training (after matching with people not in training). ATT: Difference in income between the treatment group and the control group (EUR). Difference: ATT divided by the average income of the control group. Standard error: Estimated standard error of ATT. p-value: significance of ATT (H0: ATT = 0).
Appendix 4. The impact of occupational training on employment
Outcome variable
2010 2009
No. of observ. ATT
Standard error p-value
No. of observ. ATT
Standard error p-value
Employment rate on 1st month 1642 2.6% 0.010 0.009 3226 2.2% 0.006 0.000 2nd month 1642 6.6% 0.012 0.000 3226 4.8% 0.008 0.000 3rd month 1642 8.3% 0.014 0.000 3226 5.4% 0.009 0.000 4th month 1642 8.0% 0.015 0.000 3226 5.9% 0.009 0.000 5th month 1642 8.6% 0.015 0.000 3226 5.5% 0.010 0.000 6th month 1642 9.0% 0.016 0.000 3226 5.8% 0.010 0.000 7th month 1392 10.4% 0.017 0.000 3226 6.1% 0.010 0.000 8th month 1135 11.5% 0.019 0.000 3226 7.6% 0.011 0.000 9th month 972 10.9% 0.021 0.000 3226 8.4% 0.011 0.000 10th month 891 13.2% 0.023 0.000 3226 9.0% 0.011 0.000 11th month 630 13.0% 0.027 0.000 3226 10.0% 0.011 0.000 12th month 366 10.9% 0.035 0.002 3226 9.6% 0.012 0.000 13th month 3226 10.0% 0.012 0.000 14th month 3226 8.7% 0.012 0.000 15th month 3226 8.7% 0.012 0.000 16th month 3226 9.5% 0.012 0.000 17th month 3226 8.4% 0.012 0.000 18th month 3226 8.3% 0.012 0.000 19th month 3226 8.8% 0.012 0.000 20th month 2645 8.1% 0.013 0.000 21st month 2085 8.4% 0.015 0.000
22nd month 1471 9.6% 0.017 0.000 23rd month 712 7.6% 0.025 0.003
Number of observations: Number of people who finished training (after matching with people not in training). ATT: Difference in the share of employed people between the treatment group and the control group. Standard error: Estimated standard error of ATT. p-value: significance of ATT (H0: ATT = 0).

Estonian Unemployment Insurance Fund – Impact Evaluation of Training
53
Appendix 5. The impact of occupational training on wage
Month
2010 2009 No. of observ. ATT, €
Difference in %
Standard error p-value
No. of observ. ATT, €
Difference in %
Standard error p-value
1 159 -69.1 -7% 74.43 0.354 238 -71.0 -22% 29.19 0.016 2 309 16.8 2% 56.52 0.766 434 -26.8 -8% 19.07 0.160 3 392 15.1 3% 34.77 0.663 556 -50.4 -12% 19.22 0.009 4 447 54.6 10% 30.90 0.078 656 -42.1 -11% 17.61 0.017 5 508 101.7 20% 32.75 0.002 723 -5.8 -2% 17.63 0.741 6 557 60.0 12% 27.92 0.032 767 -2.7 -1% 16.35 0.868 7 496 53.7 11% 30.01 0.074 810 -12.0 -3% 16.63 0.470 8 448 75.6 15% 36.73 0.040 889 -18.7 -5% 14.66 0.202 9 409 37.4 7% 32.65 0.252 956 -9.1 -2% 15.60 0.560
10 401 24.6 4% 35.64 0.491 1032 -12.8 -2% 19.72 0.517 11 290 32.8 6% 39.76 0.409 1108 -5.0 -1% 16.27 0.760 12 166 28.2 6% 46.43 0.544 1160 0.6 0% 15.12 0.967 13 1200 -5.5 -1% 14.14 0.698 14 1209 -27.7 -6% 14.99 0.064 15 1246 -21.5 -5% 15.32 0.160 16 1266 -18.3 -4% 15.41 0.236 17 1247 -20.3 -5% 15.55 0.193 18 1265 -7.8 -2% 16.95 0.647 19 1291 -31.3 -7% 14.98 0.037 20 1028 -9.3 -2% 16.80 0.579 21 831 7.3 2% 17.71 0.680 22 581 -10.9 -3% 22.68 0.632 23 281 -44.1 -11% 28.88 0.127
Number of observations: Number of people who finished training and for whom wage was declared (after matching). ATT: Difference in wage level between the treatment group and the control group (EUR). Difference: ATT divided by the average wage of the control group. Standard error: Estimated standard error of ATT. p-value: significance of ATT (H0: ATT = 0).
Appendix 6. The impact of Estonian courses on income from wage
Outcome variable
2010 2009
No. of observ. ATT
Difference in %
Standard error p-value
No. of observ. ATT
Difference in %
Standard error p-value
Income from wage on 1st month
82 1.2 15% 6.82 0.858 58 36.8 631% 17.88 0.044
2nd month 82 31.0 122% 25.12 0.222 58 38.7 120% 32.23 0.235 3rd month 82 45.1 251% 21.05 0.035 58 43.6 142% 32.38 0.183 4th month 82 66.1 237% 24.86 0.009 58 13.1 22% 28.50 0.648 5th month 82 54.6 120% 26.72 0.044 58 16.8 26% 36.88 0.651 6th month 82 38.0 60% 33.79 0.266 58 9.3 17% 30.28 0.760 7th month 82 72.6 117% 39.68 0.071 58 11.6 19% 35.44 0.744 8th month 82 66.7 87% 41.98 0.116 58 1.9 3% 33.94 0.956 9th month 82 66.1 111% 38.05 0.086 58 -35.3 -46% 36.25 0.334 10th month 82 73.9 95% 41.46 0.079 58 33.1 50% 38.97 0.399 11th month 82 52.9 62% 43.17 0.226 58 -12.2 -11% 57.05 0.832 12th month 82 93.5 124% 47.88 0.055 58 37.5 82% 32.15 0.249 13th month 58 36.7 49% 41.54 0.381 14th month 58 -4.4 -4% 48.63 0.928 15th month 58 20.1 23% 41.98 0.634 16th month 58 -15.1 -17% 40.82 0.714 17th month 58 13.0 13% 48.80 0.791 18th month 58 -1.3 -1% 38.88 0.975 19th month 52 21.1 22% 50.44 0.678 20th month 52 8.5 8% 53.33 0.874 21st month 22 -26.5 -24% 69.86 0.709
22nd month 8 -48.3 -34% 85.47 0.587 Number of observations: Number of people who finished training (after matching with people not in training). ATT: Difference in income between the treatment group and the control group (EUR). Difference: ATT divided by the average income of the control group. Standard error: Estimated standard error of ATT. p-value: significance of ATT (H0: ATT = 0).

Estonian Unemployment Insurance Fund – Impact Evaluation of Training
54
Appendix 7. The impact of Estonian courses on employment
Outcome variable
2010 2009
No. of obs.
ATT Standard error
p-value No. of obs.
ATT Standard error
p-value
Employment on 1st month 82 1.2% 0.04 0.742 58 12.1% 0.05 0.018 2nd month 82 7.3% 0.04 0.105 58 10.3% 0.06 0.083
3rd month 82 8.5% 0.05 0.101 58 12.1% 0.06 0.051 4th month 82 13.4% 0.06 0.025 58 3.4% 0.05 0.532 5th month 82 13.4% 0.07 0.044 58 1.7% 0.05 0.742 6th month 82 13.4% 0.06 0.040 58 5.2% 0.06 0.370
7th month 82 18.3% 0.06 0.006 58 6.9% 0.06 0.252 8th month 82 15.9% 0.07 0.020 58 1.7% 0.05 0.742
9th month 82 15.9% 0.07 0.017 58 0.0% 0.06 1.000 10th month 82 15.9% 0.07 0.020 58 8.6% 0.07 0.199 11th month 82 18.3% 0.07 0.008 58 12.1% 0.07 0.090 12th month 82 18.3% 0.07 0.010 58 10.3% 0.08 0.182 13th month 58 6.9% 0.08 0.398 14th month 58 1.7% 0.08 0.829 15th month 58 1.7% 0.08 0.821
16th month 58 1.7% 0.08 0.821 17th month 58 1.7% 0.08 0.829 18th month 58 1.7% 0.08 0.821 19th month 58 5.2% 0.08 0.496 20th month 52 1.9% 0.08 0.811
21st month 22 -4.5% 0.12 0.715 22nd month 8 -12.5% 0.23 0.596
Number of observations: Number of people who finished training (after matching with people not in training). ATT: Difference in the share of employed people between the treatment group and the control group. Standard error: Estimated standard error of ATT. p-value: significance of ATT (H0: ATT = 0).
Appendix 8. The impact of training on employment and income from
wage by procured trainings and voucher-based trainings in 2010
Month
Income from wage, EUR Employment rate
Procured Voucher Procured Voucher
No. of observ. ATT Diffe-
rence p-value No. of observ. ATT Diffe-
rence p-value ATT p-value ATT p-value
1 708 15.4 121% 0.006 936 1.1 3% 0.913 4.70% 0.000 1.00% 0.456 2 708 28.1 72% 0.002 936 54.2 71% 0.004 5.10% 0.005 7.70% 0.000 3 708 39.4 72% 0.002 936 65.5 64% 0.000 8.10% 0.000 8.50% 0.000 4 708 22.8 31% 0.064 936 90.6 64% 0.000 4.00% 0.058 11.00% 0.000 5 708 22.4 27% 0.061 936 122.5 80% 0.000 5.20% 0.018 11.10% 0.000 6 708 24.8 24% 0.068 936 107.4 63% 0.000 5.60% 0.012 11.60% 0.000 7 628 18.2 15% 0.278 766 126.5 56% 0.000 7.80% 0.002 12.60% 0.000 8 467 11.2 8% 0.580 670 156.8 65% 0.000 6.20% 0.039 15.10% 0.000 9 381 22.3 16% 0.300 593 117.1 47% 0.000 8.70% 0.010 12.40% 0.000
10 362 37.2 26% 0.115 531 130 51% 0.000 11.00% 0.002 14.70% 0.000 11 238 -5.1 -3% 0.872 393 154.3 55% 0.000 10.90% 0.015 14.30% 0.000 12 164 57 33% 0.070 202 96.8 35% 0.038 14.00% 0.008 8.40% 0.078
Number of observations: Number of people who finished training (after matching with people not in training). ATT: Difference in income between the treatment group and the control group (EUR) / difference in the share of employed people between the treatment group and the control group. Difference: ATT divided by the average income of the control group. p-value: significance of ATT (H0: ATT = 0).

Estonian Unemployment Insurance Fund – Impact Evaluation of Training
55
Appendix 9. The impact of training on employment and income from
wage by gender
Number of observations: Number of people who finished training (after matching with people not in training). ATT: Difference in income between the treatment group and the control group (EUR) / difference in the share of employed people between the treatment group and the control group. Difference: ATT divided by the average income of the control group. p-value: significance of ATT (H0: ATT = 0).
Income from wage, EUR Employment rate
Month
2010 2009 2010 2009
Men Women Men Women Men Women Men Women
ATT p-value ATT p-value ATT p-value ATT p-value ATT p-value ATT p-
value ATT p-value ATT p-value 1 5.3 0.534 32.3 0.000 4.0 0.341 8.2 0.013 -0.6% 0.632 5.8% 0.000 1.1% 0.158 3.3% 0.0012 16.6 0.297 70.9 0.000 12.6 0.044 18.0 0.002 3.9% 0.030 9.6% 0.000 2.8% 0.004 5.6% 0.0003 52.7 0.005 51.1 0.000 18.2 0.008 22.9 0.001 4.9% 0.014 10.6% 0.000 4.1% 0.000 6.5% 0.0004 59.2 0.003 54.1 0.000 24.8 0.001 25.5 0.000 6.0% 0.004 7.0% 0.001 5.4% 0.000 6.1% 0.0005 90.8 0.000 47.4 0.003 36.5 0.000 19.8 0.013 7.1% 0.001 6.9% 0.002 5.6% 0.000 5.9% 0.0006 68.4 0.001 44.8 0.005 29.5 0.001 28.2 0.001 5.7% 0.009 9.7% 0.000 6.2% 0.000 6.0% 0.0007 63.1 0.010 50.2 0.005 33.4 0.000 23.6 0.008 4.1% 0.109 11.1% 0.000 6.0% 0.000 6.3% 0.0008 97.8 0.003 26.9 0.342 30.5 0.001 30.8 0.000 7.7% 0.010 10.1% 0.000 6.8% 0.000 7.7% 0.0009 99.0 0.001 70.1 0.001 30.5 0.003 32.3 0.000 9.2% 0.004 12.6% 0.000 6.1% 0.000 8.8% 0.000
10 97.5 0.006 77.0 0.001 43.0 0.000 38.3 0.000 8.5% 0.010 14.9% 0.000 7.0% 0.000 9.5% 0.00011 41.8 0.333 78.1 0.008 53.5 0.000 33.2 0.001 2.8% 0.484 17.0% 0.000 8.0% 0.000 7.8% 0.00012 1.7 0.976 70.4 0.049 48.5 0.000 43.2 0.000 4.0% 0.481 14.4% 0.003 7.4% 0.000 9.2% 0.00013 45.9 0.000 26.7 0.013 7.9% 0.000 7.5% 0.00014 43.1 0.000 16.9 0.102 7.0% 0.000 7.8% 0.00015 44.0 0.000 21.6 0.120 7.0% 0.000 8.8% 0.00016 51.3 0.000 25.7 0.016 8.7% 0.000 8.2% 0.00017 52.7 0.000 18.8 0.070 7.9% 0.000 6.9% 0.00018 51.9 0.000 31.9 0.006 8.2% 0.000 8.5% 0.00019 35.9 0.005 20.0 0.089 8.1% 0.000 7.8% 0.00020 36.5 0.015 26.4 0.011 7.4% 0.000 7.1% 0.00021 52.2 0.002 21.8 0.082 9.2% 0.000 7.3% 0.00122 32.4 0.151 29.3 0.048 5.7% 0.027 6.9% 0.00823 17.8 0.539 41.4 0.033 4.1% 0.254 12.0% 0.002

Estonian Unemployment Insurance Fund – Impact Evaluation of Training
56
Appendix 10. The impact of training on employment and income from
wage by age in 2009
Income from wage, EUR Employment rate
Month
16-24 25-49 50+ 16-24 25-49 50+
ATT p-value ATT p-value ATT p-value ATT p-value ATT p-value ATT p-value 1 0.9 0.882 -2.5 0.579 8.4 0.103 0.4% 0.797 0.6% 0.432 2.6% 0.053 2 0.7 0.948 -2.5 0.698 31.1 0.000 2.7% 0.213 0.7% 0.473 7.9% 0.000 3 1.6 0.890 -4.4 0.554 23.0 0.029 0.8% 0.728 1.1% 0.341 7.5% 0.000 4 5.3 0.690 1.7 0.829 23.2 0.036 2.1% 0.421 2.2% 0.078 6.1% 0.003 5 18.4 0.260 1.4 0.871 20.6 0.112 3.3% 0.217 1.6% 0.215 4.9% 0.028 6 18.3 0.160 4.3 0.627 25.7 0.046 4.6% 0.090 2.1% 0.107 5.5% 0.014 7 12.4 0.405 10.9 0.237 14.1 0.323 2.1% 0.441 3.4% 0.013 5.2% 0.022 8 16.9 0.223 14.9 0.108 24.0 0.053 3.1% 0.255 4.6% 0.001 7.9% 0.001 9 11.7 0.461 23.3 0.015 41.8 0.002 0.6% 0.821 5.9% 0.000 9.9% 0.000
10 0.0 1.000 35.7 0.001 35.8 0.018 0.2% 0.941 7.0% 0.000 7.0% 0.004 11 16.7 0.358 49.5 0.000 20.4 0.203 3.5% 0.221 7.2% 0.000 6.3% 0.012 12 17.9 0.339 38.4 0.001 29.7 0.069 2.9% 0.330 8.0% 0.000 7.3% 0.003 13 -0.2 0.992 29.6 0.012 44.4 0.006 3.7% 0.229 7.6% 0.000 8.7% 0.001 14 20.0 0.296 28.3 0.011 33.5 0.032 3.7% 0.217 7.0% 0.000 7.5% 0.003 15 3.0 0.886 31.7 0.007 28.1 0.084 1.5% 0.627 6.7% 0.000 7.3% 0.004 16 1.0 0.961 30.4 0.010 28.8 0.108 3.3% 0.268 5.9% 0.000 7.3% 0.004 17 27.7 0.175 24.2 0.032 36.5 0.021 1.7% 0.566 5.2% 0.001 7.3% 0.004 18 3.1 0.871 35.0 0.005 41.0 0.007 -1.2% 0.667 5.7% 0.000 8.5% 0.001 19 -11.5 0.596 24.5 0.040 34.2 0.024 1.0% 0.735 6.0% 0.000 9.5% 0.000 20 -0.3 0.988 30.3 0.016 45.8 0.011 2.9% 0.401 6.2% 0.000 7.8% 0.004 21 23.5 0.362 32.4 0.024 21.0 0.272 6.0% 0.123 6.8% 0.000 3.7% 0.244 22 25.7 0.410 28.8 0.103 -13.8 0.627 4.9% 0.303 6.0% 0.008 4.8% 0.186 23 -3.1 0.935 -5.8 0.825 -4.2 0.899 -1.0% 0.880 3.9% 0.236 -2.0% 0.746
Number of observations: Number of people who finished training (after matching with people not in training). ATT: Difference in income between the treatment group and the control group (EUR) / difference in the share of employed people between the treatment group and the control group. Difference: ATT divided by the average income of the control group. p-value: significance of ATT (H0: ATT = 0).
Appendix 11. The impact of training on employment and income from
wage by age in 2010
Income from wage, EUR Employment rate
Month
16-24 25-49 50+ 16-24 25-49 50+
ATT p-value ATT p-value ATT p-value ATT p-value ATT p-value ATT p-value 1 12.9 0.318 12.7 0.151 21.6 0.014 3.6% 0.287 3.6% 0.003 3.0% 0.059 2 10.8 0.687 55.1 0.001 45.5 0.004 2.7% 0.580 6.6% 0.000 6.5% 0.002 3 20.3 0.578 61.6 0.000 61.2 0.001 3.6% 0.519 7.2% 0.000 7.7% 0.001 4 47.6 0.261 62.4 0.000 76.2 0.000 7.1% 0.219 8.4% 0.000 8.3% 0.000 5 12.4 0.733 103.4 0.000 82.7 0.000 6.3% 0.252 12.4% 0.000 6.9% 0.007 6 66.5 0.077 92.5 0.000 92.4 0.000 12.5% 0.034 12.7% 0.000 8.3% 0.002 7 76.6 0.146 93.5 0.000 79.6 0.001 7.9% 0.219 12.0% 0.000 10.2% 0.001 8 60.2 0.256 119.1 0.000 110.7 0.000 10.2% 0.151 14.1% 0.000 10.8% 0.002 9 37.5 0.416 117.0 0.000 124.7 0.000 16.0% 0.039 14.0% 0.000 14.2% 0.000
10 114.6 0.032 117.1 0.000 115.0 0.002 20.0% 0.018 13.4% 0.000 15.5% 0.000 11 141.3 0.027 86.4 0.002 105.3 0.053 22.6% 0.009 10.3% 0.002 8.6% 0.107 12 54.1 0.477 78.2 0.049 31.2 0.547 6.3% 0.625 11.9% 0.005 3.6% 0.615
Number of observations: Number of people who finished training (after matching with people not in training). ATT: Difference in income between the treatment group and the control group (EUR) / difference in the share of employed people between the treatment group and the control group. Difference: ATT divided by the average income of the control group. p-value: significance of ATT (H0: ATT = 0).
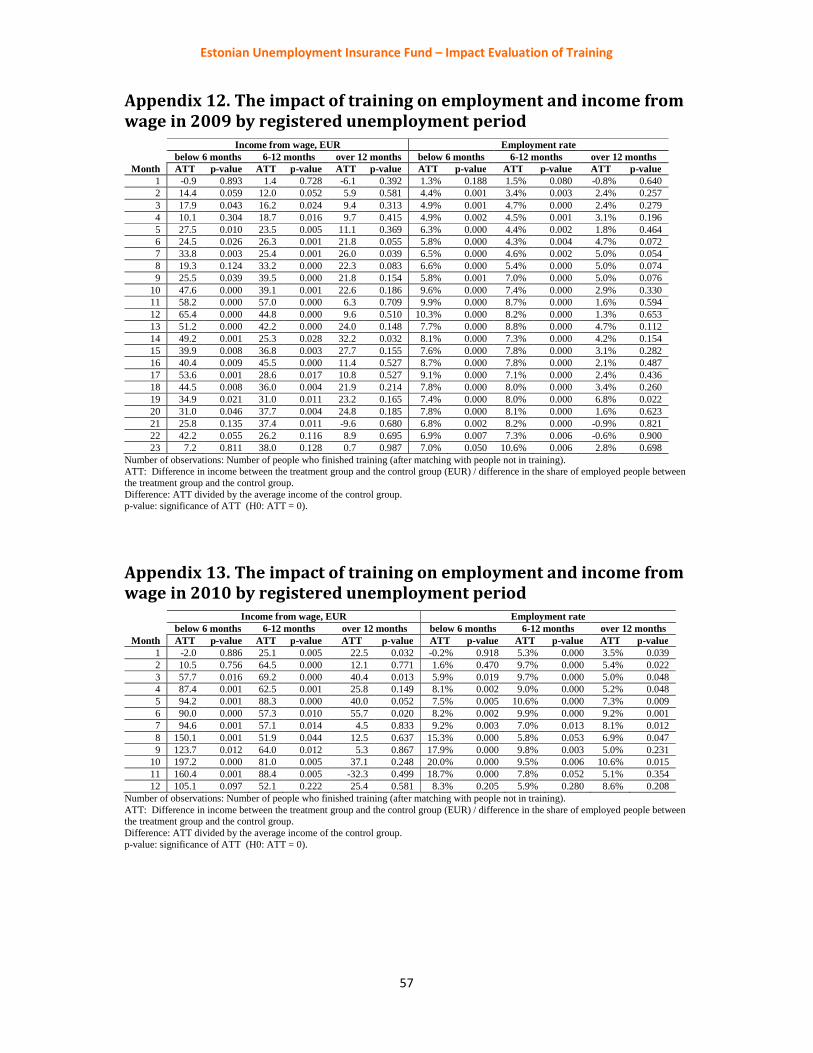
Estonian Unemployment Insurance Fund – Impact Evaluation of Training
57
Appendix 12. The impact of training on employment and income from
wage in 2009 by registered unemployment period
Income from wage, EUR Employment rate
Month below 6 months 6-12 months over 12 months below 6 months 6-12 months over 12 months ATT p-value ATT p-value ATT p-value ATT p-value ATT p-value ATT p-value
1 -0.9 0.893 1.4 0.728 -6.1 0.392 1.3% 0.188 1.5% 0.080 -0.8% 0.640 2 14.4 0.059 12.0 0.052 5.9 0.581 4.4% 0.001 3.4% 0.003 2.4% 0.257 3 17.9 0.043 16.2 0.024 9.4 0.313 4.9% 0.001 4.7% 0.000 2.4% 0.279 4 10.1 0.304 18.7 0.016 9.7 0.415 4.9% 0.002 4.5% 0.001 3.1% 0.196 5 27.5 0.010 23.5 0.005 11.1 0.369 6.3% 0.000 4.4% 0.002 1.8% 0.464 6 24.5 0.026 26.3 0.001 21.8 0.055 5.8% 0.000 4.3% 0.004 4.7% 0.072 7 33.8 0.003 25.4 0.001 26.0 0.039 6.5% 0.000 4.6% 0.002 5.0% 0.054 8 19.3 0.124 33.2 0.000 22.3 0.083 6.6% 0.000 5.4% 0.000 5.0% 0.074 9 25.5 0.039 39.5 0.000 21.8 0.154 5.8% 0.001 7.0% 0.000 5.0% 0.076
10 47.6 0.000 39.1 0.001 22.6 0.186 9.6% 0.000 7.4% 0.000 2.9% 0.330 11 58.2 0.000 57.0 0.000 6.3 0.709 9.9% 0.000 8.7% 0.000 1.6% 0.594 12 65.4 0.000 44.8 0.000 9.6 0.510 10.3% 0.000 8.2% 0.000 1.3% 0.653 13 51.2 0.000 42.2 0.000 24.0 0.148 7.7% 0.000 8.8% 0.000 4.7% 0.112 14 49.2 0.001 25.3 0.028 32.2 0.032 8.1% 0.000 7.3% 0.000 4.2% 0.154 15 39.9 0.008 36.8 0.003 27.7 0.155 7.6% 0.000 7.8% 0.000 3.1% 0.282 16 40.4 0.009 45.5 0.000 11.4 0.527 8.7% 0.000 7.8% 0.000 2.1% 0.487 17 53.6 0.001 28.6 0.017 10.8 0.527 9.1% 0.000 7.1% 0.000 2.4% 0.436 18 44.5 0.008 36.0 0.004 21.9 0.214 7.8% 0.000 8.0% 0.000 3.4% 0.260 19 34.9 0.021 31.0 0.011 23.2 0.165 7.4% 0.000 8.0% 0.000 6.8% 0.022 20 31.0 0.046 37.7 0.004 24.8 0.185 7.8% 0.000 8.1% 0.000 1.6% 0.623 21 25.8 0.135 37.4 0.011 -9.6 0.680 6.8% 0.002 8.2% 0.000 -0.9% 0.821 22 42.2 0.055 26.2 0.116 8.9 0.695 6.9% 0.007 7.3% 0.006 -0.6% 0.900 23 7.2 0.811 38.0 0.128 0.7 0.987 7.0% 0.050 10.6% 0.006 2.8% 0.698
Number of observations: Number of people who finished training (after matching with people not in training). ATT: Difference in income between the treatment group and the control group (EUR) / difference in the share of employed people between the treatment group and the control group. Difference: ATT divided by the average income of the control group. p-value: significance of ATT (H0: ATT = 0).
Appendix 13. The impact of training on employment and income from
wage in 2010 by registered unemployment period
Income from wage, EUR Employment rate
Month below 6 months 6-12 months over 12 months below 6 months 6-12 months over 12 months ATT p-value ATT p-value ATT p-value ATT p-value ATT p-value ATT p-value
1 -2.0 0.886 25.1 0.005 22.5 0.032 -0.2% 0.918 5.3% 0.000 3.5% 0.039 2 10.5 0.756 64.5 0.000 12.1 0.771 1.6% 0.470 9.7% 0.000 5.4% 0.022 3 57.7 0.016 69.2 0.000 40.4 0.013 5.9% 0.019 9.7% 0.000 5.0% 0.048 4 87.4 0.001 62.5 0.001 25.8 0.149 8.1% 0.002 9.0% 0.000 5.2% 0.048 5 94.2 0.001 88.3 0.000 40.0 0.052 7.5% 0.005 10.6% 0.000 7.3% 0.009 6 90.0 0.000 57.3 0.010 55.7 0.020 8.2% 0.002 9.9% 0.000 9.2% 0.001 7 94.6 0.001 57.1 0.014 4.5 0.833 9.2% 0.003 7.0% 0.013 8.1% 0.012 8 150.1 0.001 51.9 0.044 12.5 0.637 15.3% 0.000 5.8% 0.053 6.9% 0.047 9 123.7 0.012 64.0 0.012 5.3 0.867 17.9% 0.000 9.8% 0.003 5.0% 0.231
10 197.2 0.000 81.0 0.005 37.1 0.248 20.0% 0.000 9.5% 0.006 10.6% 0.015 11 160.4 0.001 88.4 0.005 -32.3 0.499 18.7% 0.000 7.8% 0.052 5.1% 0.354 12 105.1 0.097 52.1 0.222 25.4 0.581 8.3% 0.205 5.9% 0.280 8.6% 0.208
Number of observations: Number of people who finished training (after matching with people not in training). ATT: Difference in income between the treatment group and the control group (EUR) / difference in the share of employed people between the treatment group and the control group. Difference: ATT divided by the average income of the control group. p-value: significance of ATT (H0: ATT = 0).

Estonian Unemployment Insurance Fund – Impact Evaluation of Training
58
Appendix 14. The impact of training on employment and income from
wage in 2009 by total unemployment period
Income from wage, EUR Employment rate
Month below 6 months 6-12 months over 12 months below 6 months 6-12 months over 12 months ATT p-value ATT p-value ATT p-value ATT p-value ATT p-value ATT p-value
1 -2.8 0.779 -8.7 0.063 7.9 0.032 2.0% 0.157 0.4% 0.665 1.9% 0.041 2 2.8 0.840 6.0 0.386 16.9 0.002 4.8% 0.011 2.2% 0.071 3.6% 0.003 3 -5.6 0.718 15.6 0.097 11.5 0.057 4.4% 0.039 5.0% 0.000 1.9% 0.163 4 -14.4 0.428 18.2 0.032 14.9 0.055 5.1% 0.026 4.2% 0.003 3.4% 0.014 5 -11.4 0.568 18.4 0.062 19.8 0.035 5.5% 0.022 5.0% 0.001 2.2% 0.127 6 9.3 0.642 22.8 0.013 18.9 0.010 5.1% 0.043 5.2% 0.001 2.6% 0.077 7 16.3 0.386 21.9 0.021 18.9 0.018 5.8% 0.021 5.2% 0.001 3.1% 0.045 8 16.7 0.358 31.4 0.001 24.7 0.001 8.6% 0.001 6.0% 0.000 4.7% 0.003 9 22.2 0.226 35.2 0.001 31.1 0.000 7.6% 0.003 6.2% 0.000 5.3% 0.001
10 47.1 0.014 41.9 0.000 42.0 0.000 10.4% 0.000 7.8% 0.000 5.3% 0.001 11 64.7 0.001 43.0 0.000 52.8 0.000 12.4% 0.000 7.9% 0.000 6.6% 0.000 12 66.4 0.002 37.8 0.002 40.6 0.000 12.6% 0.000 7.5% 0.000 5.8% 0.001 13 75.4 0.000 32.1 0.008 46.0 0.000 12.8% 0.000 6.5% 0.000 8.1% 0.000 14 53.9 0.015 22.7 0.070 40.4 0.000 11.4% 0.000 5.7% 0.001 6.9% 0.000 15 40.1 0.063 30.3 0.020 41.7 0.000 9.3% 0.000 6.8% 0.000 6.7% 0.000 16 49.1 0.021 39.6 0.002 41.7 0.000 8.5% 0.002 7.1% 0.000 6.9% 0.000 17 33.0 0.168 34.1 0.007 31.2 0.006 8.3% 0.002 6.5% 0.000 4.5% 0.013 18 48.1 0.025 35.2 0.008 41.7 0.004 9.3% 0.001 6.8% 0.000 5.4% 0.003 19 53.3 0.022 31.8 0.011 27.7 0.009 10.5% 0.000 7.8% 0.000 6.0% 0.001 20 36.0 0.099 27.9 0.045 36.6 0.007 8.7% 0.003 6.5% 0.001 3.8% 0.065 21 21.1 0.391 20.5 0.166 37.6 0.032 8.9% 0.006 6.4% 0.002 2.5% 0.300 22 38.0 0.192 13.1 0.481 26.8 0.239 8.2% 0.024 4.0% 0.130 3.1% 0.275 23 -21.5 0.642 -48.7 0.090 15.3 0.596 6.0% 0.222 0.3% 0.933 5.2% 0.265
Number of observations: Number of people who finished training (after matching with people not in training). ATT: Difference in income between the treatment group and the control group (EUR) / difference in the share of employed people between the treatment group and the control group. Difference: ATT divided by the average income of the control group. p-value: significance of ATT (H0: ATT = 0).
Appendix 15. The impact of training on employment and income from
wage in 2010 by total unemployment period
Income from wage, EUR Employment rate
Month below 6 months 6-12 months over 12 months below 6 months 6-12 months over 12 months ATT p-value ATT p-value ATT p-value ATT p-value ATT p-value ATT p-value
1 -139.2 0.379 22.0 0.041 18.2 0.016 0.0% 1.000 4.8% 0.006 4.1% 0.001 2 54.9 0.215 53.7 0.002 54.4 0.000 1.6% 0.605 7.9% 0.001 8.8% 0.000 3 73.6 0.027 54.1 0.006 47.7 0.000 4.7% 0.187 7.7% 0.002 7.4% 0.000 4 100.5 0.006 62.5 0.001 47.5 0.000 6.9% 0.044 6.3% 0.017 7.0% 0.001 5 162.3 0.000 65.3 0.003 55.1 0.000 8.2% 0.018 6.3% 0.022 8.3% 0.000 6 94.3 0.012 44.6 0.037 61.8 0.000 7.2% 0.053 5.3% 0.056 8.8% 0.000 7 110.0 0.019 34.2 0.159 42.8 0.009 10.8% 0.009 4.3% 0.158 8.9% 0.000 8 124.0 0.081 52.1 0.059 43.9 0.049 9.9% 0.045 7.8% 0.015 7.7% 0.007 9 67.0 0.275 86.4 0.003 52.3 0.018 12.1% 0.021 11.4% 0.001 8.1% 0.011
10 116.8 0.055 116.7 0.000 59.8 0.013 14.4% 0.009 12.8% 0.001 8.5% 0.011 11 97.4 0.219 74.8 0.043 32.2 0.280 15.4% 0.014 8.0% 0.060 8.4% 0.040 12 31.5 0.767 73.6 0.093 16.3 0.653 6.2% 0.484 9.5% 0.090 3.9% 0.469
Number of observations: Number of people who finished training (after matching with people not in training). ATT: Difference in income between the treatment group and the control group (EUR) / difference in the share of employed people between the treatment group and the control group. Difference: ATT divided by the average income of the control group. p-value: significance of ATT (H0: ATT = 0).

Estonian Unemployment Insurance Fund – Impact Evaluation of Training
59
Appendix 16. The impact of training on employment and income from
wage by education level in 2009
Income from wage, EUR Employment rate
Month Basic education or
less Secondary education Higher education Basic education or
less Secondary education Higher education
ATT p-value ATT p-value ATT p-value ATT p-value ATT p-value ATT p-value 1 -7.8 0.068 6.8 0.106 3.1 0.711 -0.7% 0.529 2.2% 0.005 2.7% 0.092 2 -4.5 0.545 9.9 0.089 18.7 0.227 1.2% 0.454 3.7% 0.000 6.3% 0.002 3 11.3 0.230 10.7 0.106 11.9 0.467 3.7% 0.045 4.2% 0.000 5.5% 0.013 4 14.5 0.187 20.4 0.004 0.8 0.964 4.9% 0.015 5.5% 0.000 4.6% 0.047 5 22.3 0.058 19.4 0.019 -9.4 0.653 4.1% 0.041 5.6% 0.000 3.3% 0.176 6 14.7 0.262 23.1 0.002 -5.1 0.780 1.6% 0.445 5.8% 0.000 2.9% 0.240 7 15.3 0.186 33.4 0.000 -30.5 0.389 4.1% 0.050 6.7% 0.000 1.5% 0.545 8 19.4 0.091 39.1 0.000 -3.3 0.856 5.4% 0.013 7.5% 0.000 4.5% 0.085 9 14.5 0.246 48.4 0.000 19.3 0.283 3.2% 0.147 9.8% 0.000 6.7% 0.010
10 17.4 0.225 59.0 0.000 47.6 0.018 4.7% 0.040 10.9% 0.000 6.5% 0.016 11 46.3 0.003 57.8 0.000 39.3 0.042 7.2% 0.002 10.9% 0.000 6.0% 0.031 12 22.3 0.180 61.6 0.000 32.9 0.134 6.0% 0.013 10.9% 0.000 6.9% 0.012 13 20.2 0.259 49.6 0.000 16.6 0.453 6.9% 0.006 9.8% 0.000 6.9% 0.014 14 15.3 0.392 50.7 0.000 42.0 0.049 6.5% 0.010 9.3% 0.000 8.9% 0.001 15 21.8 0.231 56.4 0.000 22.4 0.423 6.0% 0.018 9.4% 0.000 9.4% 0.001 16 29.4 0.093 56.6 0.000 37.7 0.074 6.2% 0.016 9.9% 0.000 8.2% 0.004 17 29.4 0.107 50.8 0.000 4.0 0.873 7.5% 0.003 9.1% 0.000 8.9% 0.002 18 42.8 0.025 53.5 0.000 51.6 0.020 9.1% 0.000 8.9% 0.000 9.9% 0.000 19 30.2 0.067 42.3 0.000 33.2 0.154 7.5% 0.003 9.2% 0.000 8.1% 0.005 20 29.8 0.143 38.7 0.001 51.6 0.024 5.9% 0.034 8.7% 0.000 6.4% 0.042 21 52.3 0.025 46.1 0.000 22.1 0.384 7.7% 0.011 9.5% 0.000 4.2% 0.214 22 65.3 0.031 22.7 0.125 56.6 0.054 9.2% 0.008 6.2% 0.006 7.0% 0.062 23 56.6 0.067 -6.8 0.770 -8.1 0.881 11.6% 0.016 3.4% 0.281 8.4% 0.128
Number of observations: Number of people who finished training (after matching with people not in training). ATT: Difference in income between the treatment group and the control group (EUR) / difference in the share of employed people between the treatment group and the control group. Difference: ATT divided by the average income of the control group. p-value: significance of ATT (H0: ATT = 0).
Appendix 17. The impact of training on employment and income from
wage by education level in 2010
Income from wage, EUR Employment rate
Month Basic education or
less Secondary education
Higher education Basic education or less
Secondary education Higher education
ATT p-value ATT p-value ATT p-value ATT p-value ATT p-value ATT p-value 1 -4.8 0.675 12.6 0.131 -89.9 0.279 -2.5% 0.298 2.6% 0.052 3.2% 0.063 2 15.6 0.359 30.3 0.011 76.4 0.005 5.9% 0.064 5.5% 0.002 6.7% 0.002 3 49.3 0.047 33.7 0.017 60.1 0.015 9.4% 0.011 5.9% 0.003 7.5% 0.002 4 52.9 0.041 37.9 0.011 31.6 0.308 10.9% 0.005 6.8% 0.001 6.4% 0.012 5 51.0 0.018 49.6 0.004 81.4 0.005 11.9% 0.003 7.5% 0.001 7.5% 0.004 6 53.6 0.027 46.3 0.007 94.2 0.000 12.9% 0.002 6.4% 0.004 9.9% 0.000 7 45.0 0.102 19.5 0.288 96.8 0.001 10.1% 0.021 6.1% 0.016 10.5% 0.000 8 22.8 0.472 61.5 0.011 98.5 0.008 8.7% 0.086 6.0% 0.039 12.5% 0.000 9 8.0 0.783 46.7 0.085 86.7 0.013 10.2% 0.077 8.2% 0.014 11.9% 0.001
10 89.6 0.025 72.7 0.012 95.5 0.007 18.5% 0.004 7.7% 0.024 14.5% 0.000 11 41.0 0.328 53.6 0.116 97.7 0.026 16.2% 0.027 8.4% 0.041 12.2% 0.003 12 142.0 0.028 76.4 0.119 -1.7 0.973 31.6% 0.002 9.5% 0.059 6.9% 0.228
Number of observations: Number of people who finished training (after matching with people not in training). ATT: Difference in income between the treatment group and the control group (EUR) / difference in the share of employed people between the treatment group and the control group. Difference: ATT divided by the average income of the control group. p-value: significance of ATT (H0: ATT = 0).

Estonian Unemployment Insurance Fund – Impact Evaluation of Training
60
Appendix 18. The impact of training on employment and income from
wage by main language
Income from wage, EUR Employment rate
Month
2010 2009 2010 2009 Estonian Other Estonian Other Estonian Other Estonian Other
ATT p-value ATT p-value ATT p-value ATT p-value ATT p-value ATT p-value
ATT p-value ATT p-value
1 31.7 0.000 10.2 0.121 1.7 0.733 5.3 0.086 3.9% 0.005 2.8% 0.024 2.0% 0.025 1.4% 0.084
2 69.0 0.000 34.8 0.002 10.6 0.131 15.5 0.002 7.1% 0.000 5.2% 0.004 3.6% 0.002 3.1% 0.003
3 76.5 0.000 51.2 0.000 9.4 0.245 15.0 0.016 8.9% 0.000 5.0% 0.012 4.0% 0.002 3.5% 0.003
4 80.7 0.000 52.3 0.000 16.6 0.060 15.4 0.019 7.3% 0.000 6.2% 0.003 5.5% 0.000 2.6% 0.042
5 77.4 0.000 77.7 0.000 28.4 0.004 7.7 0.376 6.6% 0.002 8.2% 0.000 6.3% 0.000 1.8% 0.157
6 73.6 0.000 69.6 0.000 12.2 0.270 15.7 0.035 8.1% 0.000 8.5% 0.000 6.4% 0.000 1.3% 0.350
7 50.8 0.027 61.6 0.001 27.4 0.006 13.5 0.082 7.5% 0.003 8.4% 0.001 6.3% 0.000 2.2% 0.119
8 106.0 0.000 59.4 0.006 35.8 0.000 12.3 0.114 9.9% 0.000 8.5% 0.002 8.5% 0.000 3.5% 0.016
9 66.9 0.017 74.4 0.001 39.5 0.000 14.2 0.095 10.3% 0.001 10.7
% 0.001 8.4% 0.000 4.0% 0.008
10 90.1 0.003 83.1 0.001 48.9 0.000 37.9 0.000 12.2% 0.000 13.8
% 0.000 9.5% 0.000 5.8% 0.000
11 93.0 0.020 39.5 0.240 60.5 0.000 33.8 0.000 10.5% 0.006 14.1
% 0.000 10.4% 0.000 6.1% 0.000
12 4.2 0.940 84.2 0.031 56.8 0.000 34.9 0.001 1.8% 0.749 16.7%
0.001 10.0% 0.000 7.4% 0.000
13 50.2 0.000 31.2 0.004 9.3% 0.000 7.9% 0.000
14 35.2 0.006 40.6 0.000 8.2% 0.000 7.4% 0.000
15 39.7 0.002 33.7 0.004 7.7% 0.000 8.3% 0.000
16 53.0 0.000 30.4 0.009 8.5% 0.000 8.0% 0.000
17 50.0 0.000 25.5 0.014 7.0% 0.000 6.9% 0.000
18 47.9 0.001 27.0 0.020 8.6% 0.000 6.1% 0.000
19 46.9 0.000 37.4 0.001 8.8% 0.000 7.8% 0.000
20 50.6 0.000 32.6 0.006 9.4% 0.000 5.7% 0.002
21 36.0 0.027 27.8 0.040 8.3% 0.000 6.1% 0.005
22 38.6 0.060 19.4 0.210 7.6% 0.002 5.2% 0.041
23 -22.2 0.397 22.1 0.410 2.2% 0.524 6.5% 0.086 Number of observations: Number of people who finished training (after matching with people not in training). ATT: Difference in income between the treatment group and the control group (EUR) / difference in the share of employed people between the treatment group and the control group. Difference: ATT divided by the average income of the control group. p-value: significance of ATT (H0: ATT = 0).


