Page 1
Impact of Affirmative Action in Higher Education for the
Other Backward Classes in India
Rakesh Basant
Gitanjali Sen
W.P. No. 2016-07-01 July 2016
The main objective of the working paper series of the IIMA is to help faculty members, research staff and
doctoral students to speedily share their research findings with professional colleagues and test their
research findings at the pre-publication stage. IIMA is committed to maintain academic freedom. The
opinion(s), view(s) and conclusion(s) expressed in the working paper are those of the authors and not that
of IIMA.
INDIAN INSTITUTE OF MANAGEMENT
AHMEDABAD-380 015
INDIA
INDIAN INSTITUTE OF MANAGEMENT AHMEDABAD INDIA
Research and Publications
Page 2
IIMA INDIA Research and Publications
Page No. 2 W.P. No. 2016-07-01
Impact of Affirmative Action in Higher Education for the
Other Backward Classes in India1
Rakesh Basant2
Indian Institute of Management, Ahmedabad, India
Gitanjali Sen3
Shiv Nadar University, India
ABSTRACT
This paper measures the impact of quota-based affirmative action in higher education (HE) in
India for Other Backward Classes (OBC), implemented from 2008. Since the immediate impact
would be felt by OBCs who were eligible to go to college at the time of the implementation, we
compare the differences in participation in HE by the younger (18-23 years) and the older (24-29
years) age groups within eligible OBCs, with similar differences in the general caste population.
The same double difference is also compared across states with different histories of affirmative
action to ascertain if there are regional variations in the impact of the policy, with the expectation
that the impact would be higher in regions with no history of affirmative action. Our results from
the Difference in Difference (DD) estimates based on National Sample Survey data for 2011-12
do not show a positive impact of the policy on the participation of OBCs. In fact, the impact
seems to be negative in all regions, though statistically insignificant, except the East which lacks
the long history of affirmative action. A comparison of the East without a long history of
affirmative action with the South having a long history of such policy, using triple difference
method, produces positive treatment effects, but the estimate loses statistical significance once
we control for observable covariates. Our results suggest that the generalized nation-wide policy
of this kind may not be relevant for issues which are more regional in nature. (JEL Codes: H75,
I23, I24, I25, I28, J15, O15).
Key words: Higher education, affirmative action, caste, reservations, India.
1 Both authors acknowledge the Indian Institutions of Management, Ahmedabad, India, for financial support. The
authors also acknowledge the excellent research assistance of Rakesh Sinha for extraction of the National Sample
Survey (NSS) data. However, all errors rest with authors. 2 Indian Institute of Management, Ahmedabad, India.
3 Corresponding author, #E383, Shiv Nadar University, UP, India, Pin 201314. Email: [email protected] ,
[email protected]
Page 3
IIMA INDIA Research and Publications
Page No. 3 W.P. No. 2016-07-01
1. Introduction
Affirmative actions, through positive discrimination policies in employment and education
domains have been in place around the world for close to a century (Sowell 2004), and have
always been a matter of debate, leading to wide variations in policies and implementation across
nations (Cunningham, 2001). In India, the implementation has been one of the oldest; although
initially through few fragmented initiatives, that date back to several decades before the
formation of the Indian republic (Osborne 2001, Zwart 2000). Without the support of any
nationwide mandate, affirmative action was being practiced more in certain parts of country,
particularly in the four southern states of Tamil Nadu, Kerala, Karnataka, and Andhra Pradesh4.
The policy received constitutional support for the specific groups, namely, Schedules Castes
(SC), Scheduled Tribes (ST) in the year 1950. The primary target of this policy was to encourage
higher participation of the historically disadvantaged groups, initially in employment; later
extended to education and political domains.
Although, the quota for the SCs and STs in both the education and employment domains in India
have been present from the beginning of the state formation, the reservations for the Other
Backwards Classes (OBCs) started much later. Unlike the SCs and STs, the OBCs were not
formed from any homogeneous set of caste groups, but it was a list of groups to be decided by
the center or the states, based on their status on being historically disadvantaged (Deshpande
2011). In the year 2008, the Central Educational Institutions (Reservations in Admissions)
Amendment Bill was passed in Indian parliament, recommending the implementation of the
4Throughout this study, the above four states are referred as southern states. The state of Andhra Pradesh includes
the recently formed state of Telangana as well.
Page 4
IIMA INDIA Research and Publications
Page No. 4 W.P. No. 2016-07-01
Central Educational Institutions (Reservations in Admission) Act, 2006 from the year 20085. The
Act requires 27 percent reservations of seats for OBC students in public funded institutions of
higher education in the country, to be implemented in a phased manner across India. The bill was
amended in the year 2012 again, with a guideline to complete the implementation by the year
2014. In addition to this federal mandate, certain state-governments continued their own
reservation policies, as was being practiced even before the year 2008.The private educational
institutions, minority institutions, and few institutions of national importance, as declared by the
government of India, still remain outside the purview of this nationwide caste based reservation
policy.
Since the implementation of the OBC quota in the centrally funded institutions, the issue of
whether the percentages reserved for OBCs in institutions of higher education actually under-
represents or over-represents the share of OBCs in total population, has cropped up frequently .
Questions have also been raised regarding the uniformity in the lists of castes considered as
OBCs across states of India. The most recent cabinet decision of inclusion of Jats in the list of
OBCs (Ghildiyal 2014) just before the nationwide parliamentary election in the year 2014,
indicates the importance of caste-based reservation policy in Indian politics, and the political
weightage of interest groups (Osborne 2001). Interestingly, majority of the Jat population resides
in the states of Uttar Pradesh, Uttarakhand, Rajasthan, Haryana, and parts of Madhya Pradesh
and Gujarat, constituting the power lobby of Indian politics and a significant share of electoral
seats. Following the recommendation of the Ministry of Human Resource Development, from
the year 2008-09, Government of India has allocated additional funds to the tune of Rs. 21,668.9
5 The Central Educational Institutions (Reservations in Admission) Act, 2006 and consequent amendments to the
Act can be found at http://www.judis.nic.in/ accessed on 1st May, 2014.
Page 5
IIMA INDIA Research and Publications
Page No. 5 W.P. No. 2016-07-01
million to the central universities and Rs. 42,274.6 million to the centrally funded technical
institutions for a 54 percent capacity expansion in each central institution. This was done to
implement the policy of OBC reservations, without cutting down general category seats.
The present paper attempts to measure the impact of the new legislation, the Central Educational
Institutions (Reservations in Admissions) Amendment Bill, 2008 (henceforth, the Act) on
educational participation of the OBCs. However, the Act being very recent, we have data for
only one period after the implementation, which is the year 2011-12. We begin with the premise
that the impact of the legislation would be felt by OBCs who were eligible to go to college at the
time of the implementation of the Act. Typically, these persons would be in the age cohort of 18-
23 years in 2011-12; participation of persons of the older age group would not have been
affected by the Act. To assess the impact of the Act, we use the data for this year to make two
types of comparisons: (1) compare differences in participation in HE by the younger (18-23
years) with the participation of older age cohort (24-29) within OBCs with differences in the
general caste population; and (2) compare the second difference across states with different
histories of affirmative action to ascertain if there are regional variations in the impact of the Act
as we expect the impact to be higher in regions with no history of affirmative action. Difference
in Difference estimates (DD) are used to measure the Intent-to-treat effect (ITT) on the basis of
the first comparison. DD analysis is done separately for different regions for the second
comparison. An attempt is also made to measure the ITT effect of the Act through a triple
difference (DDD) estimation strategy by exploiting the variation of implementation across states
of India.
Page 6
IIMA INDIA Research and Publications
Page No. 6 W.P. No. 2016-07-01
Our results do not show a positive impact of the Act on the participation of OBCs. In fact, the
participation of the general population has increased faster than that of OBCs in the relevant age
group after the implementation of the Act. For the full sample consisting of all regions, our
estimates indicate that the positive difference between the treated (18-23 years) and control (24-
29 years) cohort of OBCs are less than the positive difference of the same among general
population indicating a 0.04 point less age-relevant enrolment of OBCs than general population,
even after the affirmative action. However, when we conduct the analysis separately for selected
regions, we do not find a statistically significant effect on participation of OBCs in higher
education in any of the four regions, but the effects seem to be negative in sign in all regions
except for the East. Since the Eastern region is the one with no history of affirmative action, this
result is consistent with our a priori expectations. Following these positive effects in the Eastern
region, when we use the quasi-experimental estimation strategy (using triple difference method)
to compare Southern region (non-experimental with long history of affirmative action) with
Eastern (experimental with no history), we find positive treatment effects indicating a positive
impact of the Act on OBC participation in states with no history of affirmative action. However,
the estimate loses statistical significance once we control for observable covariates but the
coefficient remains positive which may be credited to the Act.
There has been simultaneous expansion of higher education institutions across the country, but
that is not expected to bias our estimates because that is supposed to affect both the OBCs and
general population, and of both cohorts, in similar manner.
To our knowledge this is the first study attempting to measure the causal impact of nationwide
affirmative action policy in India. The complexity of caste based affirmative action in a nation
Page 7
IIMA INDIA Research and Publications
Page No. 7 W.P. No. 2016-07-01
where educational policies are both state and federal subject is addressed throughout the paper.
Affirmative action policies in different domains being an increasingly popular policy issue
globally, the simplified research design of this paper can be further suited to the specific
geographic location or domain.
The rest of the paper is organized as follows. Section 2 discusses the history of reservation
polices in India, issues, context and relevant literature. Section 3 explains the data and empirical
strategy. Section 4 discusses the major findings of this paper. Section 5 concludes with policy
recommendation.
2. Issues, Context and Contribution to Literature
2.1. History of Reservations in India
Reservations in India date back to early nineteenth century. The British Indian Government
implemented a policy of reserving places for Muslims in Indian educational institutions in the
year 1882 (Hunter Commission). But during that period the reservation was not specifically
designed for any particular group, caste, religion or ethnicity and therefore, was not based on the
representation of any group in total population; rather, it was only meant to provide equal
opportunity. The caste based reservations for the SCs and the STs across few Indian states started
in the year 1935, with the operation of the ‘Pune pact’ between Mahatma Gandhi and B R
Ambedkar. With the landmark decision of honorable Supreme Court of India in 1963, it was
mandated that reservations in any institution could not exceed the quota of 50 percent (Kaur and
Suri 2009, pp 113). The 93rd amendment of the constitution of India also mandated a maximum
Page 8
IIMA INDIA Research and Publications
Page No. 8 W.P. No. 2016-07-01
of 50 percent seats that could be reserved for this purpose, in state and centrally funded
institutions of higher education.
States of Tamil Nadu and Karnataka started implementing reservations policy for OBCs through
quota in the 1970s (Baely 1999). The distinction between the southern part of India and the
northern part may be noted in this respect (Kumar 1992). Historically, caste discrimination has
been worse in south India, as in certain parts of Bengal and northern India. Even though non-
Brahmins6 were placed in government jobs, it was almost impossible in southern part of India in
absence of reservation policies.
Apart from the four southern states, reservations for OBCs have been in place in varying degrees
in some north-central states. The OBC reservations started in a very slow and fragmented
manner during late seventies and eighties in the north-central states of Gujarat, Rajasthan,
Maharashtra, Bihar, Uttar Pradesh, Punjab, Haryana and Himachal Pradesh (Parikh 2001)7. In
the eastern states of West Bengal, Orissa, Assam, and in most of the north-eastern states8,
reservations for OBCs barely existed due to the nature of the historical evolution of the caste
pattern. After the federal government handed over the responsibility of exploring the status of
OBCs in the country to a commission (known as Mandal commission), it came up with the
recommendation of about 27 percent reservation of seats in employment and education domains
in the year 1981. However, due to a huge debate on this issue, followed by nationwide protests,
6Brahmins refer to the most upper castes among Hindu society.
7 The state of Bihar includes Jharkhand, and the state of Uttar Pradesh includes Uttarakhand, as both states were
curved out in first decade of 21st century, and NSS data can only identify them from 2004-05 onwards.
8 Comprising of the states of Arunachal Pradesh, Nagaland, Manipur, Mizoram, Tripura, and Meghalaya.
Page 9
IIMA INDIA Research and Publications
Page No. 9 W.P. No. 2016-07-01
the implementation happened much later. In the year 1992, a reservation of 27 percent seats in
public sector employment was implemented.
2.2. Issues in Implementation
A major issue about caste based reservation in India that complicates the process of
implementation further is, the list of castes designated as the OBCs are prepared separately at the
central and the state level. Hence, certain castes scheduled as OBCs for the purpose of central
government jobs, may not be listed as OBCs in state government jobs (Galanter, 1984).
The primary argument for this kind of ‘positive discrimination’ through quota for a certain
historically disadvantaged section of society is to encourage participation in higher education. In
fact, some studies show that participation of backward classes has actually increased over years
(Azam and Blom, 2008). However, the studies do not establish causality to show that the
increased participation was indeed an effect of ‘positive discrimination’ policy. The estimates of
participation of both the stock and flow measures, using the 61st round of the National Sample
Survey (NSS) data (Basant and Sen 2010), indicate that an appropriate measure of deficit may
change the debate around affirmative action towards the issue of supply side constraints. Using
the NSS data of last one decade, Basant and Sen (2014a) show that the overall hierarchy of
participation has not changed over years but convergence can be seen if appropriate measures are
used. Due to the complexities in implementation of the reservation policies in its current form,
they also argue that parental education can be used as a criterion for affirmative action (Basant
and Sen, 2014b).
Page 10
IIMA INDIA Research and Publications
Page No. 10 W.P. No. 2016-07-01
To measure the impact of a program of reservation of seats for the OBCs at the state funded
institutions of higher education that is implemented throughout the country at a specific point of
time, is difficult. The fact that only a few years have elapsed since the program roll-out, adds to
the difficulty in measuring the impact.
2.3. Relevant Literature and Hypothesis Generation
The literature in this area is mostly limited to discussions of the eligibility of the OBCs, or even
SCs, STs as a group to receive such positive discrimination (Rao & Ramchander 1982, Thorat et
al 2016), or the rationales for extension of reservation policies to private sectors (Bertrand et al
2010). A recent study by Bagde et al (2016) measures the causal impact of the affirmative action
policy in India for all the social groups, using data from one engineering college. It also lists
some similar studies across the world. However, this most recent addition in affirmative action
targeting the OBC in India is yet to be evaluated. Apart from few studies to document the
progress of these disadvantaged groups over years (Basant and Sen 2014b), there is no study
available in public domain that evaluates the causal impact of such policy at the national level.
The challenges involved in such an exercise are many. One, in India, education being a state
subject as well, reservations for OBC in higher education have existed at varying degrees for
different periods of time across different states of India. So, even if the nationwide law applies
from the year 2008-09 onwards, finding a suitable counterfactual for identification of the
program effect is a challenge. Second, the impact of such an Act on participation can take time
as in higher education neither demand, nor supply is generated overnight. With the passage of
time, the Act should also encourage supply side expansions of institutions to meet the higher
demand that gets generated due to the policy change. The supply side expansion affects the
Page 11
IIMA INDIA Research and Publications
Page No. 11 W.P. No. 2016-07-01
higher enrolment too. So, it is important to dis-entangle the direct impact of the Act on enrolment
and its indirect effect through the supply side expansion.
Given the differences in the histories of affirmative action for OBCs across Indian states and the
differential supply of higher education institutions (HEIs), it is difficult to conceptualize and
meaningfully estimate the impact of OBC reservation. We start with the premise that the
immediate effect may take the form of higher enrolment of OBCs in HEIs. Since we are
analysing a short time period which follows the announcement of the reservation policy, this is
the only effect we can meaningfully estimate. Besides, this effect would be limited to only those
in the relevant age cohort among the OBC population who are eligible to go to college, i.e., those
who have crossed the school threshold. In the long run, such an affirmative action can
potentially create incentives for OBCs to cross the school threshold to become eligible to join a
HEI. Given this context, the following hypothesis can be postulated:
Hypothesis 1: Affirmative action for the OBCs will result in faster growth (or a lower decline) of
enrolment of eligible OBCs in HEIs than the enrolment of eligible population not benefiting
from affirmative action.
It needs to be noted only if OBCs do not experience a faster growth or lower decline than those
who are not benefiting from quotas, the change may simply reflect trends in overall participation
rates which are not caused by the policy intervention.
Page 12
IIMA INDIA Research and Publications
Page No. 12 W.P. No. 2016-07-01
Further, these impacts may vary by states. The impact in states with a long history of affirmative
action in the form of quotas (e.g., southern states) may be low as the potential of increased
enrolment have already been exhausted. States with shorter history of reservation or those where
such a quota system has not been as systematic (north-central states) may observe a higher
impact than in those states where systematic affirmative action has had a long history. Finally,
states with no history of reservation (east and north-eastern states) are likely to experience the
highest impact. Thus, the second hypothesis could be:
Hypothesis 2: The impact of affirmative action for OBC population in terms of higher increase
(or lower decline) in enrolment in HEIs among the eligible population would be the highest in
states with no history of affirmative action and the least in states with a long history of
affirmative action. The impact in states with limited reservation history is likely to be somewhere
in between.
While hypothesis 2 makes intuitive sense, a variable that can influence the relationship is the
supply of HEIs in various states, even when we recognize inter-state migration for education.
Affirmative action may increase overall demand for HEIs, resulting in the increase in the number
of HEIs, both in the private and the public sector. States with a history of affirmative action may
have seen such a supply response in the earlier period. However, states with no history of
reservations in higher education may not have adequate supply of HEIs to absorb increased
enrolment needs. Consequently, one needs to control for the supply of HEIs while estimating the
impact.
Page 13
IIMA INDIA Research and Publications
Page No. 13 W.P. No. 2016-07-01
The next section discusses the data, and the empirical strategy applied throughout the paper to
address the existing gap in literature.
3. Data and Empirical Strategy
3.1. Data:
We use the Unemployment and employment round of the NSS Data, which is a nationally
representative household level sample survey collected by the National Sample Survey
Organization of the Government of India. This quinquennial cross section household survey
collects details of all individuals in a selected household, including information on their
employment, education, rural land ownership, household expenditures and such. We primarily
use the data from 68th
round, collected in the year 2011-12, as that is the only employment
unemployment round that is available after the implementation rolled out throughout the
country. However, for the tests of assumptions of the model, we also use the other three rounds
of this data, collected in 1999-00, 2004-05, 2009-10. NSS is not a panel data. So households are
different for each year. The first three rounds are part of major quinquennial survey, and the last
one was almost same type of survey, apart from the fact that the sample size was marginally
smaller. Since, the 2009-10 data almost coincides with the implementation of the legislation9, we
do not expect any impact so soon. Then, the immediate next round of data and the most recent
nationally representative data of same nature available is the 2011-12 data, which is primarily
used in this study.
9 Keeping in mind that implementation of the Act was not expected to be immediate, as due to issues with existing
capacity, or nature of academic session, it took at least a year for the institutions to start phasing in the
implementation.
Page 14
IIMA INDIA Research and Publications
Page No. 14 W.P. No. 2016-07-01
The data on district level educational infrastructure are collected from the online list of Ministry
of Human Resource Development that covers all higher education institutions across the country.
This online data base helps us to generate the district level statistics of number of educational
institutions (both public and private) to capture the district-wise and state-wise statistics
measuring number of HEIs, and their growth during the period of our interest. However, we do
not have data on the actual capacity of each of these institutions. Consequently in our estimation,
we only include them as covariates in the model. Nonetheless, it is important to recognize that
the data has been painstakingly collected manually, cleaned/ and merged with NSS data to
provide a reasonable control measure to capture the expansion of supply of HEIs across regions.
It would have been useful to separate the nature of supply response. Increase in public sector
HEIs may have a higher impact on OBCs as reservation is in these institutions but there can be
spillovers to other institutions if the supply is not adequate for the eligible population. Private
sector HEIs can enhance participation of ‘general’ category more but the seats in public sector
HEIs for them are frozen and new public sector institutions can enhance opportunities for them
too. It may therefore be difficult to interpret the public-private division of HEIs.
3.2. Identification Strategy
The affirmative action policies in India are caste-based, and the country identifies a total of four
major caste categories for the purpose of social sector policies. The SCs and the STs among them
have been the most disadvantaged and have had the benefit of such positive discrimination
policies for a long time. The OBCs are the most recent inclusion. The remaining category,
known as ‘general’, remains outside the purview of such policy.
Page 15
IIMA INDIA Research and Publications
Page No. 15 W.P. No. 2016-07-01
As discussed earlier, the practice of reservations of seats in educational institutions for OBCs
have been in place in four southern states in India, long before the implementation of the Central
Act in 2008-09. These four southern states became ‘experimental states,’ long before the federal
act on reservation came into being. Since education is also a state subject in India, southern states
used that opportunity to advance the affirmative action in state funded institutions of higher
education much before this central legislation. Due to long history of quotas in these, there has
been high demand for higher education institutions, from a section of society not covered by the
quota. Therefore, proactive southern states had simultaneous expansion of higher education
institutions, with a higher share of private institutions10
.
However, eastern states and all north-eastern states, as listed earlier, did not do much towards
affirmative action for the OBCs in higher education and could be designated as ‘non-
experimental’ states till the 2008 Act11
. Broadly then, we identify four groups of states from our
sample with different expected program effects. In the first group, we have four southern states
with a long and systematic history of implementation of affirmative action and being in
experimental category before other states. So, in 2004-05 data these states constitute the
experimental category that turned non-experimental in 2008-09. Second group consists of the
eight north-central states mentioned earlier with some history of affirmative action policies, but
less systematic than the southern states. These states too remained in experimental category in
the year 2004-05 and turned non-experimental in 2008-09. In the third and fourth groups, we
have three eastern states, and six north-eastern states respectively, all of which remained in non-
10
See summary statistics in Appendix table A1. 11
Although the north-eastern states were similar to eastern states in terms lack of positive discrimination initiatives
for OBCs; but the socio-economic conditions of STs and OBCs were better in the former groups of states than the
latter. Share of ST population is higher in north-eastern (NE) states, but share of OBCs are closely same in both.
Page 16
IIMA INDIA Research and Publications
Page No. 16 W.P. No. 2016-07-01
experimental category till the year 2008-09 due to initiatives of lesser strengths12
. However,
there is a category reversal happening from the year 2008-09, as the last two groups turn
experimental due to the introduction of central legislation; whereas, the erstwhile experimental
states are not expected to have any significant change happening due to the Act.
For the identification of the impact of the Act on HE enrollment, we use the DD estimation
strategy and conduct the analysis separately for the four state groups. In a cross-section of data,
taken from the year 2011-12, the ‘treated cohort’ is the group of people aged 18 to 23 years. The
‘controlled cohort’ is the group of people aged 24 to 29 years, because the Act is expected to
make a negligible difference in the HE participation to the latter. Therefore, in our DD
estimation of Intent-to-treat effects, the first difference compares HE enrolment outcomes of
OBCs aged 18-23 years (‘treated’) to OBC aged 24-29 years (‘controlled’), in the year 2011-12.
For the age group 24-29 years we have included who are currently studying (enrolled) as well as
those who have completed HE. This is done because most of the persons in this age group would
have enrolled before the implementation of the Act and would have completed HE by 2011-12.
Currently enrolled persons in this age group would typically be those who are undergoing post-
graduate education. Admittedly, a small proportion of the enrolled persons in this age group
could have benefited by the Act; these would be those who benefited from affirmative action for
their enrolment in post-graduate courses. Since the difference could be confounded by other
factors affecting these two cohorts differently, we use the general population of the same age
cohort as control group in our second level of difference, because they would have gone through
the same changes that took place during this time, but were not eligible for quotas.
12
Few fragmented initiatives of affirmative actions through quota at state government-aided institutions in the state
of West Bengal, Orissa, which started much later in 1990s.
Page 17
IIMA INDIA Research and Publications
Page No. 17 W.P. No. 2016-07-01
Figure 1 Figure 2
Figure 3 Figure 4
However, when we plot the current enrollment estimates of eligible population of the 18-23
years cohort separately for each of the state groups defined earlier, figures 1-4 indicate that the
differential enrollment rates of OBCs over the years, have been different across regions.
Page 18
IIMA INDIA Research and Publications
Page No. 18 W.P. No. 2016-07-01
Table 1: Testing of Parallel Trends Assumption for full sample of all regions: Dependent variable is HE
Enrollment- 18-23 yr as treated
All India
OBC -0.011*
Treat 0.371***
OBC#Treat -0.034**
2004 0.023***
2009 0.035***
OBC#2004 -0.002
OBC#2009 -0.004
Treat#2004 0.061***
Treat#2009 0.155***
OBC#Treat#2004 -0.015
OBC#Treat#2009 0.009
R2 0.25
N 71,162
Note: Full sample includes 33 states, after merging Chhattisgarh with the parent state Madhya Pradesh,
and Jharkhand with the parent state Bihar. * p<0.1; ** p<0.05; *** p<0.01
We test for parallel trends in OBC and general enrolment growth in two periods prior to the
program (1999-00, 2004-05) and one coinciding with the program (2009-10) in a separate
univariate analysis, assuming the one coinciding with program implementation will not see a
major change in enrollment. From Table 1, and Panel A of Table 2, we cannot reject the null
hypothesis of coefficients of double interaction terms being same over the years for all India
sample or for separate state groups respectively. The only exception is the north-central group of
states, where the double interaction term is statistically significant at ten percent level, for the
year 2004-05.
Page 19
IIMA INDIA Research and Publications
Page No. 19 W.P. No. 2016-07-01
Table 2: Testing of Parallel Trends Assumption for DD estimation by State groups: Dependent variable is
HE participation dummy of 18-29 years
Panel A: OBC dummy interacted with years
South East Northcentral Northeast
OBC -0.001 -0.013 -0.04** 0.046
Yr:2004 0.074*** 0.102*** 0.039** 0.002
Yr:2009 0.113*** 0.152*** 0.121*** 0.109
OBC#2004 -0.034 -0.058 0.037* 0.051
OBC#2009 0.005 0.043 0.045 0.032
R2 0.01 0.02 0.01 0.02
N 16,619 7,265 33,213 2,670
Panel B: Treated (18-23 years) and OBC dummy interacted with years
OBC 0.007 -0.015 -0.02 -0.096***
treat 0.391*** 0.350*** 0.364*** 0.191*
OBC#treat -0.04 0.004 -0.033 0.301**
Yr:2004 0.019 0.029 0.024** -0.011
Yr:2009 0.044*** -0.01 0.025* -0.079***
OBC#2004 0.005 -0.042 -0.002 0.106***
OBC#2009 -0.016 0.004 0.011 0.135***
treat#2004 0.084** 0.134*** 0.028 0.012
treat#2009 0.099** 0.254*** 0.158*** 0.258**
OBC#treat#2004 -0.059 -0.046 0.039 -0.131
OBC#treat#2009 0.048 0.016 -0.005 -0.146
R2 0.24 0.30 0.24 0.24
N 16,619 7,265 33,213 2,670
Note: The sample includes a total of 21 states, which could reasonably be divided across four regions for
the purpose of the study. * p<0.1; ** p<0.05; *** p<0.01
This indicates that our DD estimation would provide valid and consistent estimates if we could
also control for time-varying treatment specific effects that are not due to the Act. However, the
only data point that we have post-implementation is from the year 2011-12, which does not allow
Page 20
IIMA INDIA Research and Publications
Page No. 20 W.P. No. 2016-07-01
us to control for the above fact. This leads us to use the 18-23 years cohort as the ‘treated’ in the
first difference.
Panel B of Table 2 shows that we cannot reject the null hypothesis of coefficients of double
interaction terms being same over years, as the triple interaction terms including the years prior
to the act are not statistically significant for any region. This indicates that the DD estimation
will provide estimates for valid treatment effects if we use 18-23 years cohort as treated as
against 24-29 years cohort as control group.
Also, the differential enrollment between OBCs and general population over years vary widely
across the regions. OBCs have been consistently doing better than the general population in
Northeast region, and that too without a long history of affirmative action policies. This
differential enrolment patterns in the Northeast indicates the South and East regions can further
be used for more precise estimates of the treatment effects.
Table 3: Percentage of OBCs Out of Total Population in Each State Group, Across Years
Note: All India sample of 33 states. The percentage distribution is closely the same when we look at distribution among 18-25 years old.
Table 3 also indicates that share of OBCs among all other castes are similar in South and East
regions. In the post Act period, Eastern states are the new experimental states as compared to
Percentages of OBCs among All Population in the Respective Group of States
(Weighted Mean)
Years / State group South North Central Northeast East Others
2004-05 0.55 0.45 0.20 0.16 0.38
2009-10 0.57 0.44 0.18 0.18 0.37
2011-12 0.61 0.47 0.16 0.18 0.39
Page 21
IIMA INDIA Research and Publications
Page No. 21 W.P. No. 2016-07-01
Southern states. Therefore, in the next stage we conduct a triple difference estimate, by
comparing the double difference computed above in the Eastern (experimental) states, with the
same double difference in Southern group of (non-experimental) states. The latter group serves
as a counterfactual for historical reasons explained earlier, and also because the trends in
enrollment for OBCs and general have been same in these regions. We test the parallel trend
assumption in period 1999, 2004, and 2009 and find that we do not reject the null hypothesis of
parallel trends with the coefficients on the triple and quadruple interaction terms not being
statistically significant (in columns 1 and 2, Table 4).
Table 4: Testing of Parallel Trends Assumption in DDD: Sample of South and East
Triple interaction including
year
Quadruple interaction
including year
OBC 0 0.014
East 0.001 0.024*
OBC#East -0.002 -0.005
Yr:2004 0.071*** 0.014
Yr:2009 0.111*** 0.042***
OBC#2004 -0.035 0.002
OBC#2009 0.008 -0.010
East#2004 0.030 0.010
East#2009 0.049 -0.033
OBC#East#2004 -0.038 -0.075*
OBC#East#2009 0.014 -0.032
Treat 0.371***
OBC#treat -0.051*
East#treat -0.040
OBC#East#treat 0.031
2004#treat 0.089**
2009#treat 0.101**
OBC#2004#treat -0.056
OBC#2009#treat 0.041
East#2004#treat 0.050
East#2009#treat 0.135**
Page 22
IIMA INDIA Research and Publications
Page No. 22 W.P. No. 2016-07-01
OBC#East#2004#treat 0.042
OBC#east#2009#treat 0.021
R2 0.01 0.23
N 23,857 23,857
Note: Sample of seven states. * p<0.1; ** p<0.05; *** p<0.01
However, comparing the OBC from different states may also include the impact of time-
invariant state specific effects that may have benefited OBC from the two groups of states
differently, which would bias our estimation results. For example, if southern states already had
higher educational participation on average than eastern states, then the impact of the Act would
be underestimated. We address this problem by including state-specific variables, such as state
level growth in number of HE institutions, both private and government. The estimate will also
include the year-specific effect which is correlated with but not due to the Act, such as, if the
participation has increased over years. So, our ‘Act’ variable will pick up all year-specific, state-
specific effects including the effects of Act. Therefore, we need to include a control group from
both groups of states for whom the Act should make no difference. The ‘general’ being the
closest to the OBCs amongst caste groups in terms of socio-economics conditions, and both
remaining outside the positive discrimination policy in higher education till the 2008 Act, we use
‘general’ as a comparison group. Therefore, we compare a ‘second level treatment’ group (OBC)
and ‘second level control’ group (general population) among ‘treated’ and ‘controlled’ age
cohorts, in each group of states for whom the Act made no difference, as against each group for
whom the Act mattered. The inclusion of treatment group dummy variable helps us to control for
treatment specific time-invariant national level differences, which leads us to estimate the
difference-in-difference-in difference model.
Page 23
IIMA INDIA Research and Publications
Page No. 23 W.P. No. 2016-07-01
Panels A and B of appendix table A1 provide basic statistics for caste groups and regions.
Interestingly, the sample characteristics do not seem to be different across caste groups and
regions. The only significant difference seems to be that the proportion of heads of households
having higher secondary or graduate education is lower in OBC households as compared to
‘general’ households.
We expect the triple difference estimate of the following model to produce an unbiased estimate
of the Act on HE enrollment of OBCs when the analysis is restricted two regions - the South and
the East, otherwise similar in educational achievements of both the groups:
Yihds = β0 + β1.Oihds*Tihds*Eihds+ β2.Oihds*Eihds + β3.Tihds*Eihds + β4.Oihds*Tihds + β5.Oihds + β6.Tihds
+ β7.Eihds + γ1.Xihds + uihds …. (2)
Where Yihds is the indicator for current HE enrolment of 18-29 years old (=1) of an individual i,
in household h, in district d, and in state s. Tihds is the indicator for the person being treated (of
age group 18-23, as against control being in age group 24-29), Oihds is the indicator for individual
belonging to the social group, OBC. Eihds takes a value of 1 if the individual belongs to the state
group East (else, it takes a value zero for individual from South). Xihds is the vector of individual,
household level, district and state level covariates13
, as explained below. We estimate the model
for the year 2011-12 data for the sample of 18-29 years cohort in the state groups of South and
East regions.
13
In different specifications, not shown in the text, we control for district level school infrastructure as available
from the DISE (District Information System in Education) data of the Government of India, instead of state level
infrastructure of higher education. Our findings remain same even with that specification.
Page 24
IIMA INDIA Research and Publications
Page No. 24 W.P. No. 2016-07-01
If ‘program’ effect is heterogeneous among individuals then pre-treatment differences in
observed characteristics can generate difference in outcomes (Abadie, 2005). Hence, we control
for individual and household level factors, which could be causally linked to the difference in
participation between the ‘treated’ and the ‘control’ groups. As individual level controls, we use
age, quadratic form of age, and sex dummies. To control for the changes in standards of living,
we use few categories of average household expenditures as covariates, categories being created
on the basis of poverty lines14
. We control for the dependency ratio in the household, defined by
the ratio of total number of people below 18 years and above 60 years, to the total household
size. As parent’s education is found to be highly correlated to children’s participation in HE
(Basant and Sen 2014b), we use the educational level of household head as a proxy for parental
education, as the latter is not reported in the data.
Since the central legislation was implemented only in the year 2008-09, and the latest available
nationally representative sample survey data that we have is of the year 2011-1215
, we focus on
the current enrolment figures in higher education to measure participation for the 18-23 age
cohort, instead of using completion rate16
. As mentioned, we use enrollment plus the completion
rate for the older age cohort (24-29). To check the robustness of our estimates, we have
estimated our model by using only enrollment rates for the older age cohort as well17
. We restrict
14
The poverty lines estimates are taken from the documents of the erstwhile Planning Commission, Government of
India, for the respective years. 15
Considering the fact that the data collected at 2009-10, almost coincided with when the implementation just
started in few institutions. 16
See the stock versus flow analysis of Basant and Sen (2010) for further details on difference in these
measurements. 17
All our estimation results are very similar if we include only the current enrollment figures of the controlled (24-
29 years) cohort, instead of both completion and enrollment together.
Page 25
IIMA INDIA Research and Publications
Page No. 25 W.P. No. 2016-07-01
the analysis among population, who has already crossed the threshold of school education to
become eligible for higher education, for two reasons: One, this way, we minimize the difference
in unobservables between OBCs and general population that would influence their decision to
participate in HE differently making our estimates biased and inconsistent. Second, the
immediate impact of policy can only be seen among population who are eligible for HE
participation.
4. Results
4.1. Discussion of results
The DD estimates of the country level sample18
are presented in table 5. The first columns
represent estimates of naïve models, without any covariates. In the second, third and fourth
columns, we have added individual, household, and state level covariates respectively. So, the
last column reports results of full sample estimates for each region.
18
This is done with the all India sample of 33 states, where the states of Chhattisgarh and Jharkhand have been
merged with their parent states Madhya Pradesh and Bihar respectively.
Page 26
IIMA INDIA Research and Publications
Page No. 26 W.P. No. 2016-07-01
Table 5: DD estimation of All India Sample: Dependent variable is HE Enrollment No Controls +Individual
controls
+Household
controls
+State controls
OBC -0.003 -0.008 0.01 0.021**
Treat 0.535*** 0.203*** 0.198*** 0.195***
OBC#Treat -0.03* -0.04** -0.039** -0.041**
male 0.055*** 0.058*** 0.058***
hh_mem_age -0.305*** -0.316*** -0.325***
agesq 0.005*** 0.005*** 0.006***
dep_ratio -0.03 -0.045
verypoor -0.194*** -0.212***
vulnble -0.043** -0.059***
midclass -0.019* -0.024**
sec_orbelow_hd 0.044*** 0.039***
hisec_hd 0.037* 0.032*
grad_hd 0.111*** 0.104***
fem_head 0.005 0.002
rural 0.002 -0.008
increase_state_govt_he0411 0
increase_state_pvt_he0411 0
R2 0.28 0.34 0.35 0.35
N 27241 27241 27241 27241
Note: All India sample of 33 states. * p<0.1; ** p<0.05; *** p<0.01
The full model with individual, household, and state fixed effects as produced in the last column
indicates that eligible OBCs seem to have a 0.02 point higher chance of participation than
general population of 18-29 age group in the year 2011-12. ‘Treated’ cohort of 18-23 years
seems to have 0.13 point higher chance of participation than the ‘controlled’ cohort of 24-29
years. However, the treatment effect, as indicated by the negative sign of the triple interaction
term implies that the difference between treated (18-23 years) cohort and control (24-29 years)
are 0.04 points lower for OBC than general after the implementation of the act. The eligible
OBCs of relevant age seem to participate less in HE than general population, even with complete
roll-out of affirmative action which rejects the first hypothesis.
Page 27
IIMA INDIA Research and Publications
Page No. 27 W.P. No. 2016-07-01
Table 6: DD estimation for the year 2011-12: Dependent variable is HE Participation
Panel A: South No Control + Individual
controls
+ Household
controls
+ State
controls
OBC -0.002 -0.005 0.003 -0.004
treat 0.532*** 0.128*** 0.114*** 0.115***
OBC#treat -0.049 -0.045 -0.033 -0.02
R2 0.26 0.35 0.37 0.37
N 6,495 6,495 6,495 6,495
Panel B: East No Control + Individual
controls
+ Household
controls
+ State
controls
OBC -0.009 -0.015 0.004 0.022
treat 0.578*** 0.236*** 0.215*** 0.208***
OBC#treat 0.055 0.019 0.020 0.021
R2 0.37 0.43 0.45 0.45
N 2,635 2,635 2,635 2,635
Panel C: Northcentral No Control + Individual
controls
+ Household
controls
+ State
controls
OBC 0.019 0.013 0.036** 0.037**
treat 0.515*** 0.212*** 0.210*** 0.207***
OBC#treat -0.018 -0.022 -0.026 -0.027
R2 0.27 0.32 0.33 0.33
N 12,932 12,932 12,932 12,932
Panel D: Northeast No Control + Individual
controls
+ Household
controls
+ State
controls
OBC -0.062* -0.057** -0.052 -0.070*
treat 0.676*** 0.294** 0.294** 0.291**
OBC#treat -0.021 -0.052 -0.039 -0.037
R2 0.45 0.52 0.54 0.54
N 943 943 943 943
* p<0.1; ** p<0.05; *** p<0.01
The DD estimation results for four regions are presented in Table 6. The treated cohort has 0.12
to .29 (Panel A – D) point higher chances of participation than controlled cohort among both the
groups in all regions.
However, the double interaction term in the full model is not statistically significant in any
region, resulting in failure to accept the first hypothesis. The treated cohort among OBCs may
Page 28
IIMA INDIA Research and Publications
Page No. 28 W.P. No. 2016-07-01
not have been able to reap the benefit of the Act after the implementation to make a differential
growth of participation as compared to the general population. The signs are negative in all
regions, except for the East, which indicates that the treated cohort among OBCs in the eastern
region only might have been slightly benefitted from the Act.
The result from the East region strengthens the importance of our second hypothesis further,
where we conduct a triple difference strategy to compare the outcome in East (experimental
region) vis-à-vis the South (non-experimental region).
It is important to note here, that the OBCs of Northcentral region seem to have 0.04 point higher
participation than general population (Panel C of Table 6), which cannot be attributed to the Act.
This finding seems noteworthy in the context that the Northcentral region is the power lobby of
India politics with a strong interest in affirmative action for OBCs, and which has seen several
incidents of violent protests in recent times.
Other covariates have signs as expected in all the regions other than the Northeast. Being a male
or being younger in age increases the chances of participation in other three regions. The positive
and statistically significant estimates of the quadratic form of age indicate convexity in the
relationship. Households have lower chances of children’s HE enrolment if they are poor, or
their heads have lower levels of education in general.19
The demography of the northeastern
region being very different, comprising of a very low share of general population, the gender
inequality is less. Household head’s education seem to have a negative relationship in the
Northeast regions at the lower levels of education, which indicates that that certain unobservable
19
Full sample estimation results is presented in appendix table A2
Page 29
IIMA INDIA Research and Publications
Page No. 29 W.P. No. 2016-07-01
characteristics of that region might be correlated to the head’s education and making that
estimate biased. Northeast has more supply side constraints in education infrastructure at all
levels, which might have affected the head’s education, and children’s educational participation.
Increase in number of government and private higher education institutions at the state does not
seem to have a strong effect in our model, which may be due to the fact that we only have the
number of institutions and are not able to capture actual capacity. However, dropping them from
the regression changes the coefficients slightly in few specifications.
Table 7: DDD estimation: South Compared to East
No
Covariates
Add Individual
covariates
Add Household
covariates
Add State
covariates
OBC -0.002 -0.004 0.002 -0.005
treat 0.532*** 0.131*** 0.115*** 0.114***
OBC#treat -0.049 -0.045 -0.034 -0.031
East -0.004 -0.005 0.004 0.017
OBC#East -0.007 -0.013 -0.002 0.003
treat#East 0.046 0.091** 0.099*** 0.102***
OBC#treat#East 0.104* 0.064 0.054 0.052
Male 0.056*** 0.055*** 0.055***
Age -0.392*** -0.422*** -0.419***
Age square 0.007*** 0.008*** 0.007***
Dependent Ratio -0.078** -0.077*
Very poor -0.067 -0.048
Vulnerable -0.105*** -0.102***
Middle class -0.058*** -0.058***
Secor below head 0.041* 0.045*
HS head 0.046* 0.051*
Grad head 0.1*** 0.103***
Female head 0.005
Rural 0.009
Increase of state_govt_he0411 0.0*
Increase of state_pvt_he0411 0.00
R2 0.28 0.37 0.38 0.39
N 9,130 9,130 9,130 9,130
Note: Sample of seven states. * p<0.1; ** p<0.05; *** p<0.01
Page 30
IIMA INDIA Research and Publications
Page No. 30 W.P. No. 2016-07-01
The triple difference estimates of the sample for the South and Eastern regions are presented in
table 7. The OBCs do not seem to be very different from general population in HE participation
in these regions, although the sign of the coefficient in full sample is negative, but value is as
small as 0.005. The treated cohort seems to enroll more in HE, in all specifications, with a lower
bound of 0.11.
The estimates for the triple interaction terms are positive and lose statistical significance once we
include all covariates in the full model. This indicates that experimental Eastern states may have
been benefited by the Act, as compared to non-experimental southern states. However, the high
standard errors for the triple interaction term limit our conclusion.
For further explanation of the results, the first difference can be seen as the difference in
enrollment between the treated cohort and controlled cohort. The second difference is the
difference of above difference between the OBCs and the general, which seems to be negative
(although not statistically significant). This indicates that younger cohort of OBCs seem to be
participating less than the younger cohort of general population. So, the triple difference
estimates measure the extent to which eastern (experimental) states performed better than the
southern (non-experimental) states in bridging the caste gap between cohorts. If the affirmative
action works as expected, then the signs of the triple interaction terms should be positive.
Although, our results from the triple difference estimation is positive, but are not statistically
significant when we control for individual, household and state fixed effects. Estimates for all
other covariates of the model have signs as expected.
Page 31
IIMA INDIA Research and Publications
Page No. 31 W.P. No. 2016-07-01
The findings from both the double difference estimation done at regional levels, and triple
difference estimation for two seemingly comparable regions point out that while the difference in
HE participation between OBCs and general is not very significant to begin with, the desired
outcomes of affirmative action is still inconclusive, and causal impact is not in the expected
direction. The all India sample, which includes 12 more states than our regional level analyses,
also indicates negative treatment effects.
4.2. Supply side expansion
These findings lead us to explore if the supply side capacity expansion in India could be
correlated with higher HE participation simultaneously. For this purpose, we collate the data on
HE institutions in India, from the online sources of Ministry of Human Resources of the
Government of India. The data indicates a steep expansion of HE institutions in southern states
between the year 2004-05 to 2009-10 (about 855 institutions per year), followed by a much
slower growth (223 institutions per year) in the second period. This is shown in table 8 and
figure 2a-figure 2b, and corresponds positively to the rate of OBC participation in southern states
between these two periods. In Eastern region too, the rate of expansion in first period has been
larger than second period, although not as large a difference as in southern states (a yearly
growth of 47 institutions in first period as against 16 institutions in second period). The growth
in OBC participation in these states follows that pattern as well; that is, increase in participation
in first period followed by a drop in second period. Without having the data on capacity of these
institutions, it is not possible to draw any conclusion on the simultaneous impact of the supply
side expansion. However, our estimates should not be affected by the capacity expansion as that
would generate similar opportunities for the OBCs and general population. The government
institutions had to expand their capacities for accommodating the designated ‘quota’ of OBCs,
Page 32
IIMA INDIA Research and Publications
Page No. 32 W.P. No. 2016-07-01
without compromising the space for general population. Private institutions do not fall under this
legislation.
In Northeast region, there has been marginal expansion in number of HE institutions between
two periods (growth of 5 institutions per year in first period as against 3.5 institutions per year in
second period). This does not correspond to the continuous increase in OBC participation in both
the periods, and again, we cannot causally link the change in participation to capacity expansion
because we do not have information on capacity of each of them.
5. Conclusion
There has been a policy change to encourage participation in higher education among OBCs. The
general trend of participation of OBCs indicates that participation has indeed increased over
years, but whether that can be credited to the affirmative action policy or it is merely a
representation of the overall trend cannot be established without testing for a causal relationship.
OBC participation has increased post 2009 (table 8), but if the positive discrimination through
quota is to be credited for that, then higher OBC participation should be reflected through: one,
higher increase in age-relevant enrolment among OBCs as compared to groups which did not
benefit from affirmative action; two, higher age-relevant enrollment of OBCs in states which
newly introduced this policy; three, more enrollment in government institutions; and four, more
enrollment in states that have experienced faster expansion of HE institutions.
Our estimation strategies are able to find a causal relationship through the first two channels. For
all India sample, 18-29 years cohort of OBCs are doing better than the general population in HE
participation in most recent data; 18-23 years cohort has higher chances of participation than 24-
Page 33
IIMA INDIA Research and Publications
Page No. 33 W.P. No. 2016-07-01
29 years cohort; but the positive difference in participation between younger 18-23 years cohort
and older 24-29 years cohort among OBCs is less than the same among general population. This
indicates that even after implementation of affirmative action, the enrollment rates in HE of
eligible OBCs are still not ‘increasing’ faster than the enrollment rates of the eligible general
population.
The expectation was that the Act would have higher impact in states which have no or very
limited experience of affirmative action (experimental states) as compared to those having some
history of affirmative action prior to the implementation of the Act (non-experimental states). As
we compare the experimental states for which the policy is expected to have a stronger impact,
with the other non-experimental states (with already existing policies), the intent-to-treatment
effect seems to be positive but not statistically significant. Apparently, the Act has not had a
significant positive impact on OBC participation in states which newly introduced this policy.
This difference in findings between our double-difference and triple-difference estimation results
raises concerns regarding the generalized nation-wide policy for issues which are more regional
in nature.
An evaluation of the deficits in HE participation by different socio-religious groups has shown
that if one focuses on the population in the relevant age group which is eligible to go to college,
OBCs do not show any deficits; their share among the enrolled in fact is slightly higher than their
share in the eligible population (Basant and Sen, 2010). In such a situation, the incremental
impact of the 2008 Act may not be very significant as bulk of those among the eligible
population who wanted to participate in HE are already doing so. The impact may become
Page 34
IIMA INDIA Research and Publications
Page No. 34 W.P. No. 2016-07-01
evident if OBC reservation incentivizes more and more persons in the social group to cross the
school threshold. But, as has been argued by Basant and Sen (2014a) such an increase in demand
may face supply constraints at the school level.
The supply side constraints may also be operational at the HE level. Consequently, one can
argue that encouraging participation through capacity expansion of HE system is a better policy
option to address such problems of lower participation. And this may be even more relevant as a
complement to the policies of affirmative action. But, due to paucity of data that can capture
capacity of HE institutions in India (public and private), we are unable to design a measure to
estimate the causal impact of capacity expansion. Consequently, the last two channels remain
unexplored but they remain important areas for future work.
However, as a note of caution, one should mention that the policy of OBC reservation is still
quite recent and a decent amount of time may be required to assess its impact and reach an
unequivocal verdict. In that context, our exercise can be seen as a first step of evaluating the
policy and can be replicated after a lapse of few years, to ascertain if the same findings persist
before articulating a clear policy recommendation. Also, in order to control for the fact that
impact may not be immediate; one could use the lagged treatment variable analysis after few
years, which cannot be done so soon.
Page 35
IIMA INDIA Research and Publications
Page No. 35 W.P. No. 2016-07-01
References
Alona, Sigal and Ofer Malamudb. (2014). “The impact of Israel’s class-based affirmative action
policy on admission and academic outcomes,” Economics of Education Review, 40,
pp123–139.
Angrist, Joshua D. and Jorn-Steen Pischke. (2009). Mostly Harmless Econometrics. Princeton,
NJ: Princeton University Press, p 79.
Azam, Mehtabul and Andreas Blom. (2008). “Progress in Participation in Tertiary Education in
India from 1983 to 2004,” Policy Research working paper 4793, Human Development
Department, The World Bank, South Asia Region, December.
Bagde, Surendrakumar., Dennis Epple, and Lowell Taylor. (2016). “Does Affirmative Action
Work? Caste, Gender, College Quality, and Academic Success in India, American
Economic Review, forthcoming.
Baley, Susan. (1999). “Caste, Society and Politics in India from the Eighteenth Century to the
Modern Age,” The New Cambridge History of India, Volume IV, Cambridge: Cambridge
University Press.
Basant, Rakesh and Gitanjali Sen. (2010). “Who Participates in Higher Education in India?
Rethinking the Role of Affirmative Action,” Economic and Political Weekly, Vol xlv
(39), September.
Basant, Rakesh and Gitanjali Sen. (2014a). “Access to higher education in India: an exploration
of its Antecedents,” Economic and Political Weekly, December.
Basant, Rakesh and Gitanjali Sen. (2014b). “Parental Education as a Criterion for Affirmative
Action.” World Development, December.
Bertrand, Marianne. Rema Hanna, and Sendhil Mullainathan. (2010). “Affirmative action in
education: Evidence from engineering college admissions in India,” Journal of Public
Economics, 94(1–2): 16-29.
Chan, Jimmy and Erik Eyster. (2003). “Does Banning Affirmative Action Lower College
Student Quality?” American Economic Review, 93(3):858-873.
Cunningham, C. D. (2001). “Affirmative Action: Comparative Policies and Controversies,”
International Encyclopedia of the Social & Behavioral Sciences, pp. 210–214
Deshpande, Ashwini. (2011). Grammar of Castes: Economic Discrimination in Contemporary
India, Oxford University Press, India.
Galanter, Marc. (1984). Competing Equalities: Law and the Backward Classes in India,
Berkeley: University of California Press; New Delhi: Oxford University Press.
Ghildiyal, Subodh. (2014). “UPA's poll sop: Cabinet okays inclusion of jats in OBC list,” Times
of India, March 3, available at: http://timesofindia.indiatimes.com/india/UPAs-poll-sop-
Cabinet-okays-inclusion-of-jats-in-OBC-list/articleshow/31299546.cms, accessed on
March 31, 2014.
Hinrichs, Peter. (2014). “Affirmative action bans and college graduation rates,” Economics of
Education Review, 42:43–52.
Holzer, Harry and David Neumark. (2000). “Assessing Affirmative Action,” Journal of
Economic Literature, Vol. XXXVIII, September, pp. 483–568.
Kaur, Harpreet and R. K. Suri. (2009). Reservation in India, Recent Perspective in Higher
Education.
Page 36
IIMA INDIA Research and Publications
Page No. 36 W.P. No. 2016-07-01
Osborne, Evan. (2001). “Culture, Development, and Government: Reservations in India,”
Economic Development and Cultural Change, 49(3):659-685.
Parikh, Sunita. (2001). “Affirmative action, caste, and party politics in contemporary India,” in
Color lines: Affirmative action, immigration, and civil rights options for America, ed.
John David Skrentny.
Rao, D. Narsimha. and M. Ramchander, (1982). ‘‘Reservations in Backward Classes: In Search
of Criteria,’’ in Reservation Policy in India, ed. B. A. V Sharma and Madhusudhan
Reddy, New Delhi: Light and Life.
Sodhi, Prerna. (2009). “OBC admissions better, but still on lower side,” The Indian Express, July
4, accessed online at http://indianexpress.com/article/cities/delhi/obc-admissions-better-
but-still-on-lower-side/ .
Sowell, Thomas. (2004). Affirmative action around the world – An empirical study. Yale
University Press.
Thorat, Sukhadeo, Nitin Tagade, Ajaya K Naik. (2016). “Prejudice against Reservation Policies -
How and Why?” Economic and Political Weekly, LI(8), February 20.
Zwart, Frank de. (2000). “The Logic of Affirmative Action: Caste, Class and Quotas in India,”
Acta Sociologica, 43(3): 235-249. Sage Publications, Ltd.
Page 37
IIMA INDIA Research and Publications
Page No. 37 W.P. No. 2016-07-01
Table 8: Growth of OBC Enrolment in HE and Growth of HE Institutions in 3 States Groups in last
decade
% Currently in HE: In 18-
25 age group of OBC
Average Yearly Change in
Participation
Average Yearly growth in
number of HE institutions
Year 04-05 09-10 11-12 1st period* 2nd period** 1st period 2nd period
South 0.36 0.47 0.45 0.02 -0.01 855.2 223
Northeast 0.43 0.55 0.59 0.03 0.02 5.2 3.5
East 0.37 0.57 0.53 0.04 -0.02 47.2 16
*1st period refers to the period between 2004-05 to 2009-10, before the implementation of 2008 Act.
**2nd period refers to the period after implementation, that are, between years 2009-10 to 2011-12.
figure 2A figure 2B
0.00
0.20
0.40
0.60
0.80
% o
f cu
rre
nt
HE
par
tici
pat
ion
Years in increasing order: 3 data points are for 2004-05, 2009-10, 2011-12
% Currently in HE among 18-25 yrs eligible OBCs: by State Regions
South
Northeast
East
0
2000
4000
6000
8000
10000
12000N
um
be
r o
f H
E In
stit
uti
on
s in
eac
h
gro
up
of
Stat
es
Years in Increasing order
Number of HE Institutions across years
South
Northeast
East
Page 38
IIMA INDIA Research and Publications
Page No. 38 W.P. No. 2016-07-01
Appendix Table A1 Panel A: Descriptive Statistics of Treatment and Control for all region sample
Treated cohort: 18-23 Control cohort: 24-29
OBC Others OBC Others
Variable Obs Mean Obs Mean Obs Mean Obs Mean
HE participation 6940 0.57 6234 0.59 4708 0.07 5123 0.06
Male (=1) 6948 0.55 6246 0.56 4708 0.57 5123 0.53
Age 6948 20.33 6246 20.49 4708 26.13 5123 26.18
Age square 6948 416.02 6246 422.57 4708 685.31 5123 688.16
Dependent ratio 6948 0.27 6246 0.25 4708 0.26 5123 0.25
Very poor 6948 0.01 6246 0.00 4708 0.01 5123 0.00
Vulnerable 6948 0.10 6246 0.05 4708 0.08 5123 0.05
Middle class 6948 0.45 6246 0.37 4708 0.41 5123 0.33
High income 6948 0.44 6246 0.58 4708 0.50 5123 0.62
Head prim or below 6948 0.41 6246 0.25 4708 0.27 5123 0.18
Head Sec or below 6948 0.32 6246 0.34 4708 0.31 5123 0.30
HS head 6948 0.15 6246 0.20 4708 0.19 5123 0.19
Grad head 6948 0.13 6246 0.21 4708 0.23 5123 0.33
Female head 6948 0.12 6246 0.11 4708 0.12 5123 0.10
Rural House 6948 0.58 6246 0.48 4708 0.47 5123 0.41
Increase State gov HE 04-
11 6948 78.41 6246 68.35 4708 78.04 5123 63.32
Increase State pvt HE 04-
11 6948 790.41 6246 662.91 4708 803.17 5123 627.29
Note: The sample consists of all 18-29 years old eligible (completed HS) OBC and general population,
residing in one of the 21 states that could be divided into four regions. For the household where head’s
education is missing is not part of the sample.
Page 39
IIMA INDIA Research and Publications
Page No. 39 W.P. No. 2016-07-01
Appendix Table A1 Panel B: Descriptive Statistics of Region wise sample
All regions South
East
Northcentral Northeast
Variable Obs Mean Obs Mean Obs Mean Obs Mean Obs Mean
HE participation 23005 0.37 943 0.43 2635 0.38 12932 0.38 943 0.43
OBC 23025 0.51 948 0.54 2640 0.25 12941 0.43 948 0.54
Treat 23025 0.59 948 0.54 2640 0.56 12941 0.59 948 0.54
Male 23025 0.55 948 0.55 2640 0.56 12941 0.57 948 0.55
Age 23025 22.76 948 23.11 2640 23.14 12941 22.77 948 23.11
Age square 23025 528.58 948 544.35 2640 546.24 12941 528.68 948 544.35
Dependent ratio 23025 0.26 948 0.26 2640 0.23 12941 0.28 948 0.26
Very poor 23025 0.01 948 0.00 2640 0.00 12941 0.01 948 0.00
Vulnerable 23025 0.07 948 0.10 2640 0.08 12941 0.08 948 0.10
Middle class 23025 0.39 948 0.53 2640 0.49 12941 0.39 948 0.53
High income 23025 0.53 948 0.37 2640 0.43 12941 0.51 948 0.37
Head prim or below 23025 0.29 948 0.26 2640 0.26 12941 0.27 948 0.26
Head Sec or below 23025 0.32 948 0.34 2640 0.37 12941 0.32 948 0.34
HS head 23025 0.18 948 0.18 2640 0.16 12941 0.18 948 0.18
Grad head 23025 0.21 948 0.22 2640 0.22 12941 0.23 948 0.22
Female head 23025 0.11 948 0.09 2640 0.11 12941 0.10 948 0.09
Rural House 23025 0.49 948 0.52 2640 0.54 12941 0.52 948 0.52
Increase State gov
HE 04-11 23025 72.35 948 3.59 2640 14.48 12941 47.61 948 3.59
Increase State pvt
HE 04-11 23025 722.93 948 2.85 2640 95.92 12941 579.49 948 2.85
Note: The sample consists of all 18-29 years old eligible (completed HS) OBC and general population,
residing in
one of the 21 states that are part of this study. For the household where head’s education is missing is not
part of the sample.
Page 40
IIMA INDIA Research and Publications
Page No. 40 W.P. No. 2016-07-01
Table A2: DD estimation of year 2011-12 by State group: Dependent variable is HE Enrollment
South East Northeast Northcentral
OBC -0.004 0.022 -0.07* 0.037**
treat 0.115*** 0.208*** 0.291*** 0.207***
OBC#treat -0.03 0.021 -0.037 -0.027
Male 0.06*** 0.023 -0.018 0.053***
Age -0.424*** -0.403*** -0.364*** -0.286***
Age square 0.008*** 0.007*** 0.006** 0.005***
Dependent ratio -0.074 -0.068 0.021 -0.035
Very poor -0.028 -0.157 -0.545** -0.251***
Vulnerable -0.107** -0.095** -0.085 -0.043*
Middle class -0.052** -0.063** -0.067 -0.028**
Sec or below head 0.073** -0.049* -0.137* 0.037*
HS head 0.055* 0.029 -0.132** 0.021
Grad head 0.125*** 0.019 -0.075 0.098***
Female head 0.006 -0.008 -0.037 0.011
Rural 0.019 -0.017 -0.059 -0.02
Increase of state_govt_he0411 0* -0.041** 0.004 0
Increase of state_pvt_he0411 0* 0.006** -0.026* 0***
R2 0.37 0.45 0.54 0.33
N 6,495 2,635 943 12,932
Note: The sample consists of all 18-29 years old eligible (completed HS) OBC and general population,
residing in one of the 21 states that are part of this study. For the household where head’s education is
missing is not part of the sample.
Page 41
IIMA INDIA Research and Publications
Page No. 41 W.P. No. 2016-07-01
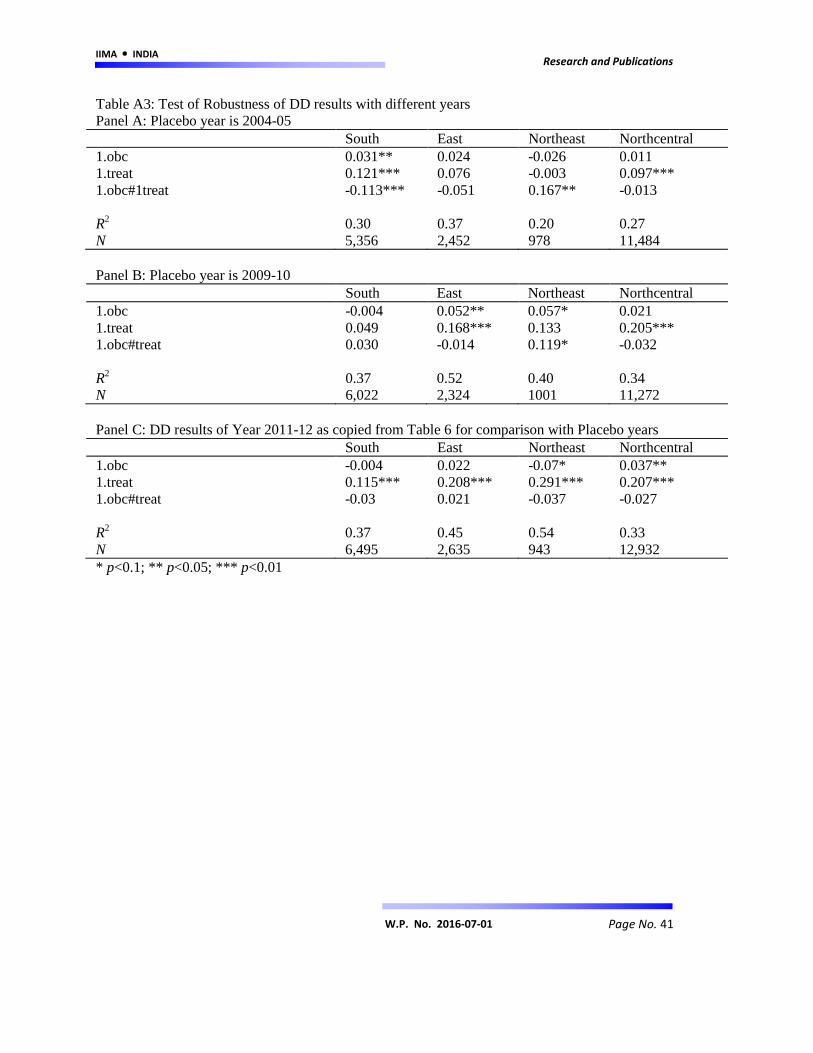
Table A3: Test of Robustness of DD results with different years
Panel A: Placebo year is 2004-05
South East Northeast Northcentral
1.obc 0.031** 0.024 -0.026 0.011
1.treat 0.121*** 0.076 -0.003 0.097***
1.obc#1treat -0.113*** -0.051 0.167** -0.013
R2 0.30 0.37 0.20 0.27
N 5,356 2,452 978 11,484
Panel B: Placebo year is 2009-10
South East Northeast Northcentral
1.obc -0.004 0.052** 0.057* 0.021
1.treat 0.049 0.168*** 0.133 0.205***
1.obc#treat 0.030 -0.014 0.119* -0.032
R2 0.37 0.52 0.40 0.34
N 6,022 2,324 1001 11,272
Panel C: DD results of Year 2011-12 as copied from Table 6 for comparison with Placebo years
South East Northeast Northcentral
1.obc -0.004 0.022 -0.07* 0.037**
1.treat 0.115*** 0.208*** 0.291*** 0.207***
1.obc#treat -0.03 0.021 -0.037 -0.027
R2 0.37 0.45 0.54 0.33
N 6,495 2,635 943 12,932
* p<0.1; ** p<0.05; *** p<0.01