Page 1
i
IMPACT OF CLIMATE VARIABILITY ON HONEY PRODUCTION: A CASE OF
RATAT AND MARIGAT, BARINGO COUNTY, KENYA
AKALA HARON
A Thesis Submitted to the Graduate School in Partial Fulfillment for the Requirements of
the Award of Degree of Master of Science in Environmental Science of Egerton University
Egerton University
May, 2019
Page 2
ii
DECLARATION AND RECOMMENDATION
This thesis is my original work and has not been submitted or presented for examination in any
other University, either in part or as a whole.
Signature……………………….. Date…………………………
Akala Haron
NM12/14173/15
This thesis has been submitted for examination with our recommendation and approval as
University Supervisors.
Signature……………………….. Date…………………………
Dr. Stanley Makindi (Ph.D)
Department of Environmental Science
Egerton University.
Signature……………………….. Date…………………………
Dr. Moses Esilaba (Ph.D)
Department of Environmental Science
Egerton University
Page 3
iii
COPYRIGHT
All Rights reserved. No part of this thesis should be reproduced, stored in any retrieval form, or
transmitted in any way, electronic, mechanical, photocopying, recording or translated in any
language or otherwise, without the permission of the author or Egerton University on that behalf.
©2019 Akala Haron
All Rights Reserved
Page 4
iv
DEDICATION
I dedicate this work to Mother Scolastica Gabriel Shayo, my late Father.
Page 5
v
ACKNOWLEDGEMENT
I thank the Almighty God for the gift of life and health during my entire period of study
endeavor.
I would like to acknowledge the efforts put in this thesis by my supervisors; Dr. Stanley Makindi
and Dr. Moses Esilaba for their moral support and guidance. I also wish to thank Dr. Mutinda for
his guidance in data analysis.
My gratitude goes to the staff of Marigat KARLO, Rachemo SACCO, Marigat District water
office and Marigat Sub-county office for their support during data collection, and my friends
Elizabeth Chepsoo, Jared Ochieng’ and Isaiah Aleri for their encouragement. Finally, my
heartfelt acknowledgement goes to my family members especially to Faith Muhenje for
overwhelming support and prayers. To all, may God bless you.
Page 6
vi
ABSTRACT
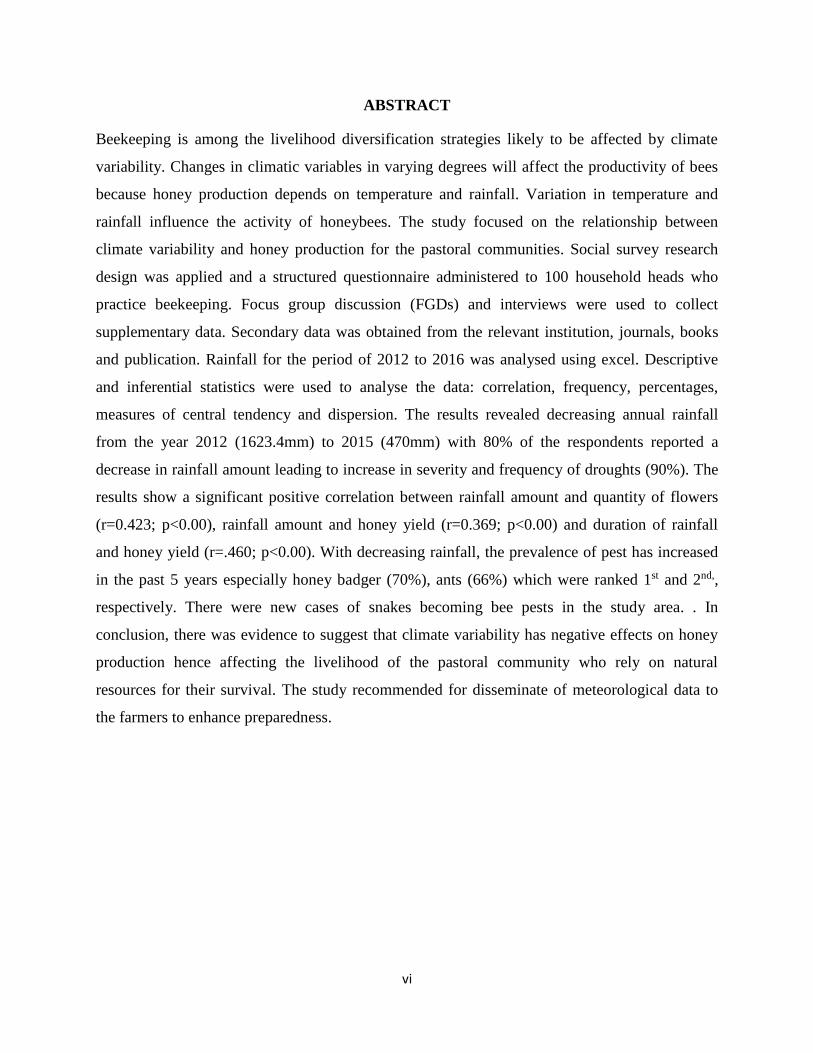
Beekeeping is among the livelihood diversification strategies likely to be affected by climate
variability. Changes in climatic variables in varying degrees will affect the productivity of bees
because honey production depends on temperature and rainfall. Variation in temperature and
rainfall influence the activity of honeybees. The study focused on the relationship between
climate variability and honey production for the pastoral communities. Social survey research
design was applied and a structured questionnaire administered to 100 household heads who
practice beekeeping. Focus group discussion (FGDs) and interviews were used to collect
supplementary data. Secondary data was obtained from the relevant institution, journals, books
and publication. Rainfall for the period of 2012 to 2016 was analysed using excel. Descriptive
and inferential statistics were used to analyse the data: correlation, frequency, percentages,
measures of central tendency and dispersion. The results revealed decreasing annual rainfall
from the year 2012 (1623.4mm) to 2015 (470mm) with 80% of the respondents reported a
decrease in rainfall amount leading to increase in severity and frequency of droughts (90%). The
results show a significant positive correlation between rainfall amount and quantity of flowers
(r=0.423; p<0.00), rainfall amount and honey yield (r=0.369; p<0.00) and duration of rainfall
and honey yield (r=.460; p<0.00). With decreasing rainfall, the prevalence of pest has increased
in the past 5 years especially honey badger (70%), ants (66%) which were ranked 1st and 2nd,,
respectively. There were new cases of snakes becoming bee pests in the study area. . In
conclusion, there was evidence to suggest that climate variability has negative effects on honey
production hence affecting the livelihood of the pastoral community who rely on natural
resources for their survival. The study recommended for disseminate of meteorological data to
the farmers to enhance preparedness.
Page 7
vii
TABLE OF CONTENT
DECLARATION AND RECOMMENDATION ....................................................................... ii
COPYRIGHT ............................................................................................................................... iii
DEDICATION.............................................................................................................................. iv
ACKNOWLEDGEMENT ............................................................................................................ v
ABSTRACT .................................................................................................................................. vi
TABLE OF CONTENT .............................................................................................................. vii
LIST OF TABLES ....................................................................................................................... xi
LIST OF FIGURES .................................................................................................................... xii
LIST OF TEXT BOX ................................................................................................................ xiii
LIST OF PLATES ..................................................................................................................... xiv
LIST OF ABBREVIATIONS AND ACRONYMS .................................................................. xv
CHAPTER ONE ........................................................................................................................... 1
INTRODUCTION......................................................................................................................... 1
1.1 Background Information ....................................................................................................... 1
1.2 Statement of the Problem ...................................................................................................... 3
1.3.1 Broad Objective .............................................................................................................. 3
1.3.2 Specific Objectives ......................................................................................................... 3
1.4 Research Questions ............................................................................................................... 3
1.5 Justification of the Study ....................................................................................................... 4
1.6 Scope and Limitations ........................................................................................................... 4
1.7 Assumptions of the study ...................................................................................................... 5
1.7 Operational definitions of terms and concepts ...................................................................... 6
CHAPTER TWO .......................................................................................................................... 7
LITERATURE REVIEW ............................................................................................................ 7
Page 8
viii
2.1 Introduction ........................................................................................................................... 7
2.2 Beekeeping and its contribution to the society...................................................................... 7
2.3 Overview of Climate variability ............................................................................................ 7
2.4 Climate variability and forage for bees ................................................................................. 8
2.5 Climate variability, water and bees ..................................................................................... 11
2.6 Climate variability and pest infestation ............................................................................... 12
2.7 Policy review ....................................................................................................................... 13
2.8 Conceptual Framework ....................................................................................................... 14
2.9 Operationalization of variables ........................................................................................... 15
CHAPTER THREE .................................................................................................................... 17
RESEARCH METHODOLOGY .............................................................................................. 17
3.1 Introduction ......................................................................................................................... 17
3.2 Study Area ........................................................................................................................... 17
3.2.1 Geographical Location and Size ................................................................................... 17
3.2.2 Climate and Topography .............................................................................................. 17
3.2.3 Vegetation Type ........................................................................................................... 19
3.2.4 Soil type and Water Status............................................................................................ 19
3.2.5 Socio-economic Characteristics ................................................................................... 19
3.3 Research Design .................................................................................................................. 20
3.4 Sample Size ......................................................................................................................... 20
3.5 Ethical Consideration .......................................................................................................... 21
3.6 Data Collection .................................................................................................................... 22
3.6.1 Validity and Reliability ............................................................................................... 22
3.7 Data Analysis ...................................................................................................................... 22
CHAPTER FOUR ....................................................................................................................... 24
Page 9
ix
RESULTS AND DISCUSSION ................................................................................................. 24
4.1 Introduction ......................................................................................................................... 24
4.2 Characteristics of the Respondents ..................................................................................... 24
4.2.1 Gender and marital status of the respondents ............................................................... 24
4.2.2 Age of the Respondents ................................................................................................ 25
4.2.3 Education level of the respondents ............................................................................... 26
4.2.4 Occupation of the Respondents .................................................................................... 28
4.2.5 Beekeeping activity ...................................................................................................... 28
4.3 Climate Variability and Respondents Perception on its variation....................................... 32
4.3.1 Temperature and Rainfall Patterns and Trends ............................................................ 32
4.3.2 Local people perceptions on climate variability ........................................................... 37
4.4 Relationship between rainfall variability and forage phenology ........................................ 42
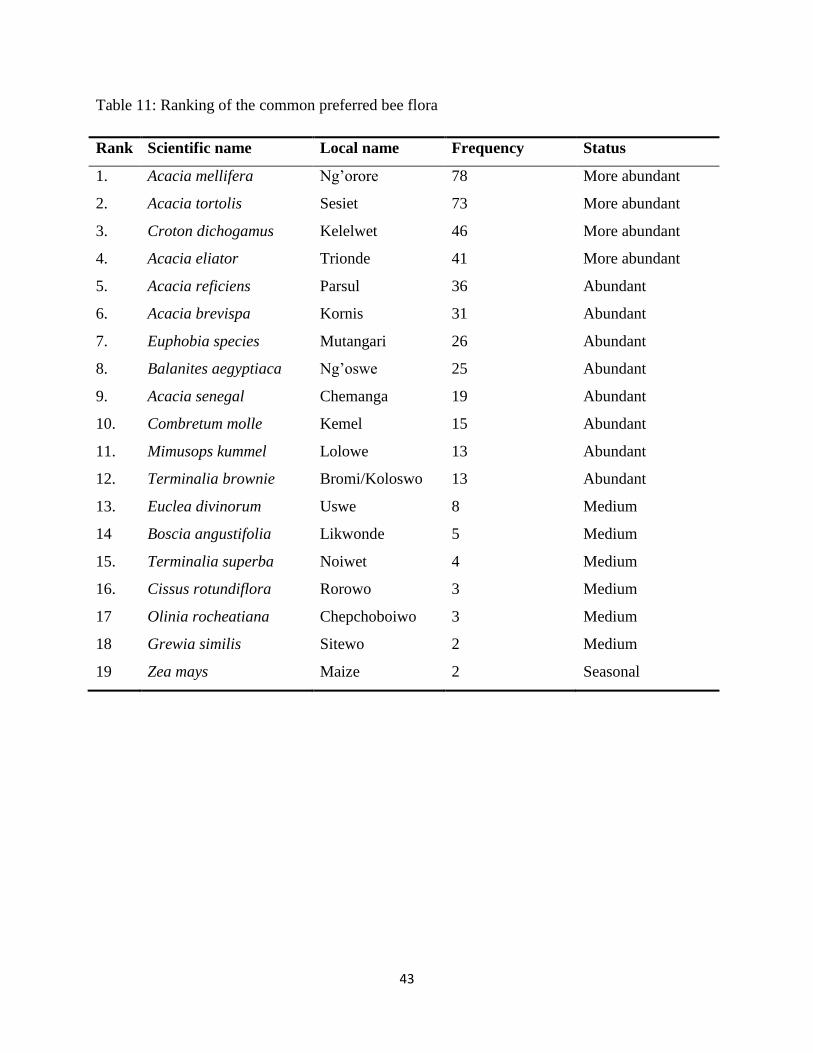
4.4.1 Plant species preferred by the bees ............................................................................... 42
4.4.2 Flowering of the plants ................................................................................................. 45
4.5 Effects of temperature and rainfall variability on honey yield............................................ 50
4.5.1 Honey production in Marigat and Ratat. ...................................................................... 50
4.5.2 The relationship between rainfall variability and honey yield ..................................... 51
4.6.1 Inspection of the beehives ............................................................................................ 54
4.6.2 Honeybee pests ............................................................................................................. 55
CHAPTER FIVE ........................................................................................................................ 60
SUMMARY OF FINDINGS ...................................................................................................... 60
CONCLUSION AND RECOMMENDATIONS ...................................................................... 60
5.1 Conclusion ........................................................................................................................... 60
5.2 Recommendations ............................................................................................................... 60
5.3 Further research ................................................................................................................... 61
Page 10
x
REFERENCES ............................................................................................................................ 62
APPENDICES ............................................................................................................................. 77
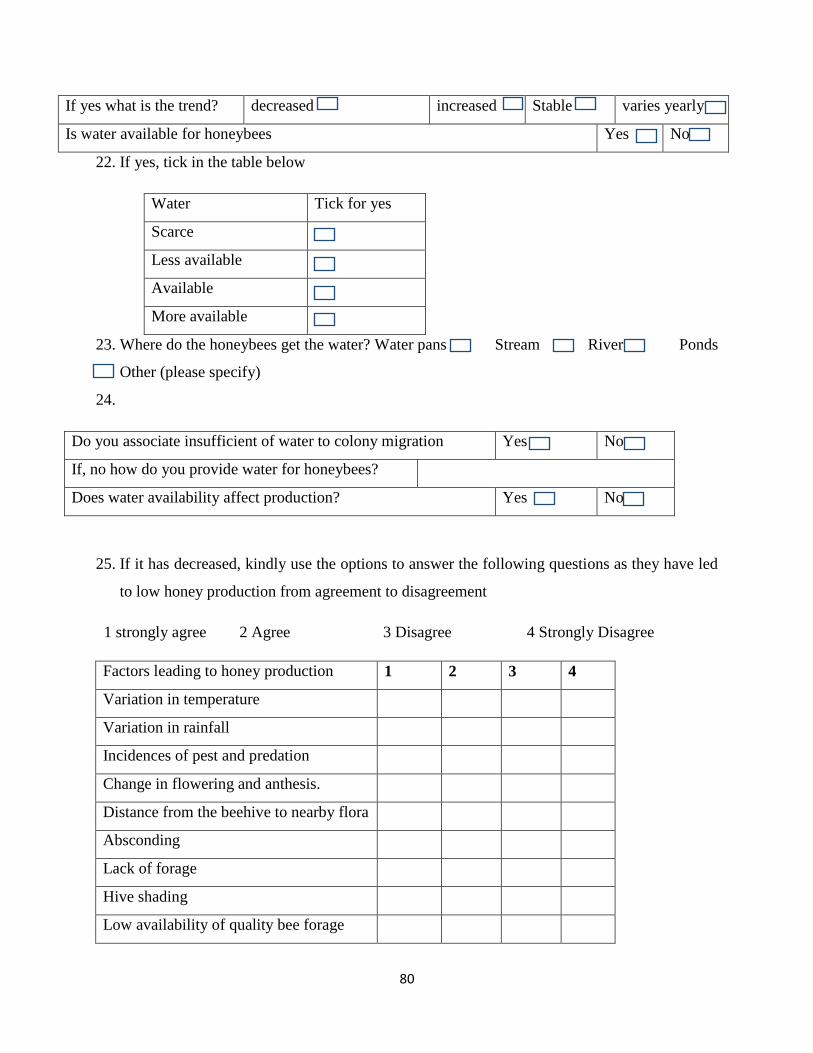
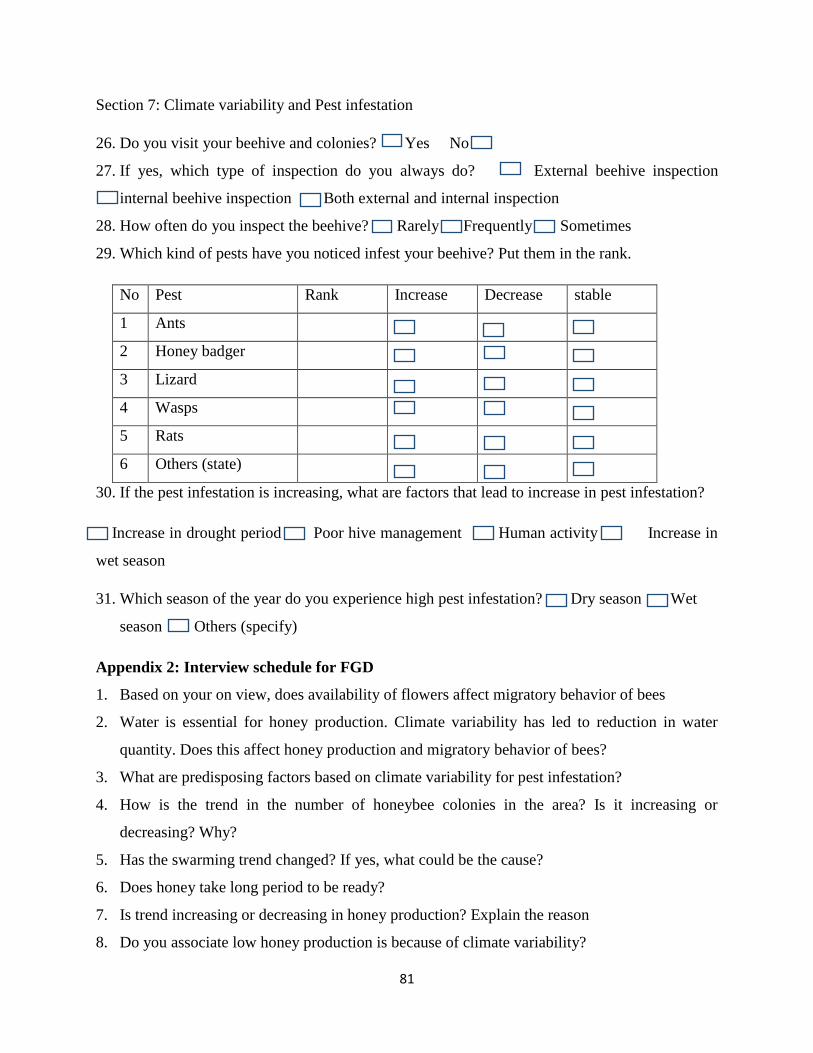
Appendix 1: Questionnaire........................................................................................................ 77
Appendix 2: Interview schedule for FGD ................................................................................. 81
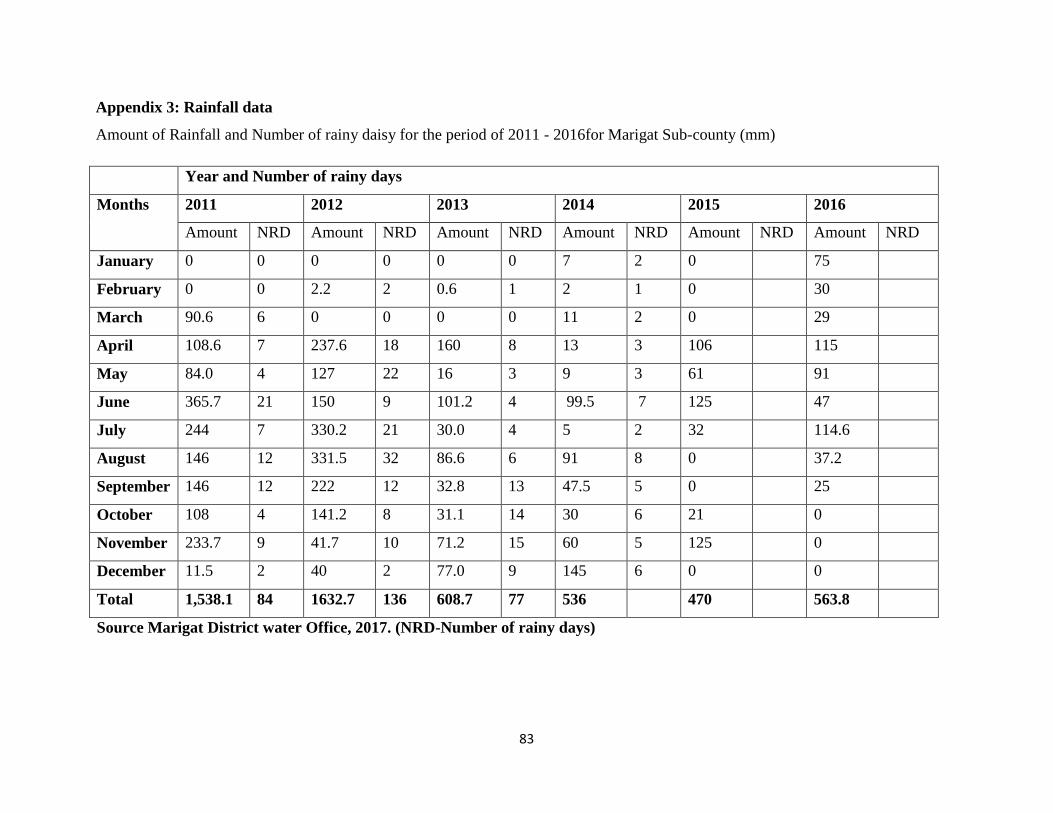
Appendix 3: Rainfall data ......................................................................................................... 83
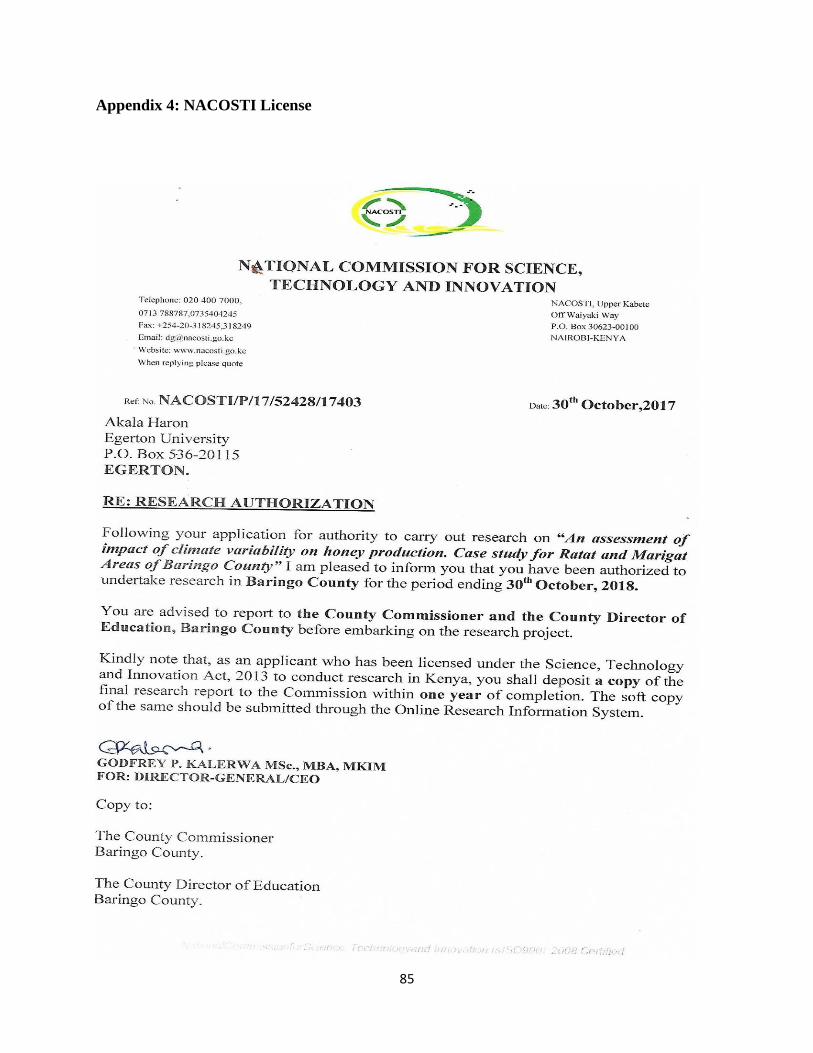
Appendix 4: NACOSTI License ............................................................................................... 85
Page 11
xi
LIST OF TABLES
Table 1: Raw Materials and bee products ..................................................................................... 10
Table 2: Composition of several bee products .............................................................................. 12
Table 3: Distribution of the sample frame .................................................................................... 21
Table 4: Summary of table of Data analysis ................................................................................. 23
Table 5: Age of the respondents ................................................................................................... 26
Table 6: Educational level of the respondents .............................................................................. 27
Table 7: Major occupation of the respondents .............................................................................. 28
Table 8: The descriptive statistics showing the mean comparison of age of respondents,
experience of beekeeping and number of beehives ...................................................................... 30
Table 9: Beehive types .................................................................................................................. 31
Table 10: Reasons for Engaging in Beekeeping ........................................................................... 32
Table 11: Ranking of the common preferred bee flora ................................................................. 43
Table 12: Respondents’ perception on flowering of plants .......................................................... 45
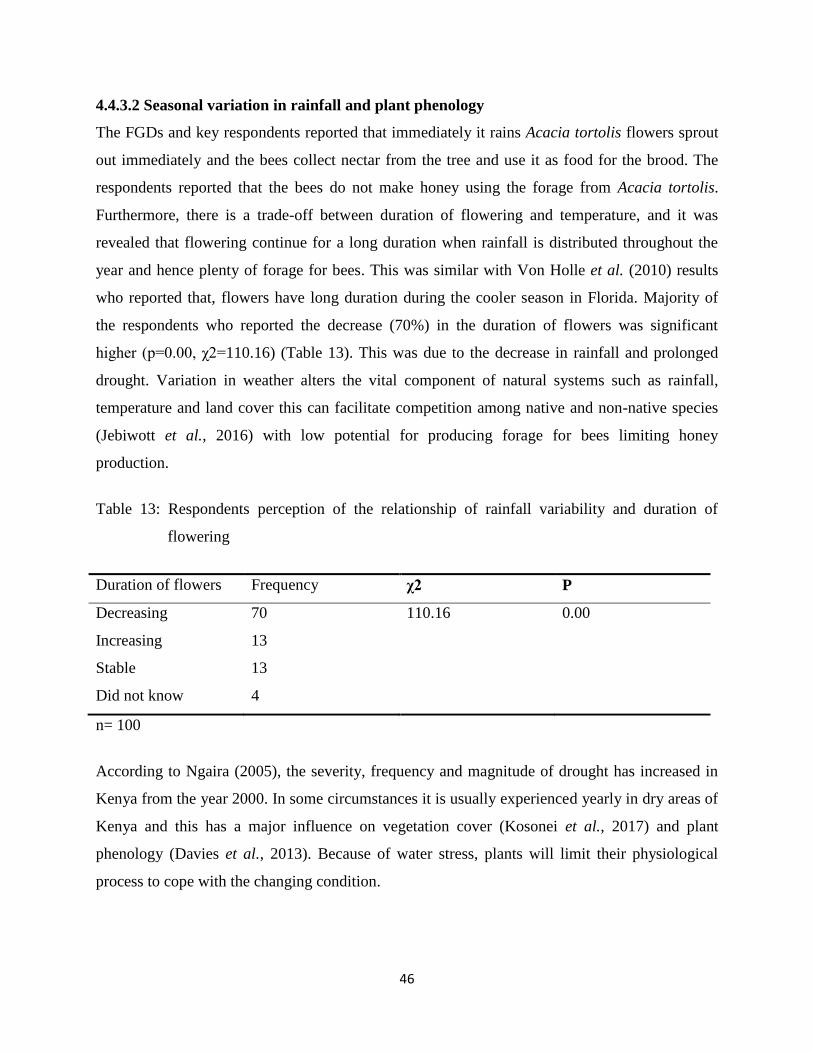
Table 13: Respondents perception of the relationship of rainfall variability and duration of
flowering ....................................................................................................................................... 46
Table 14: Change of the quantity of flowers ................................................................................ 48
Table 15: Correlation of change in rainfall amount and change in quantity of flowers ............... 48
Table 16: Migration pattern of the bees ........................................................................................ 51
Table 17: Trend of honey yield ..................................................................................................... 52
Table 18: Correlation analysis of the relationship between Rainfall amount and honey yield .... 52
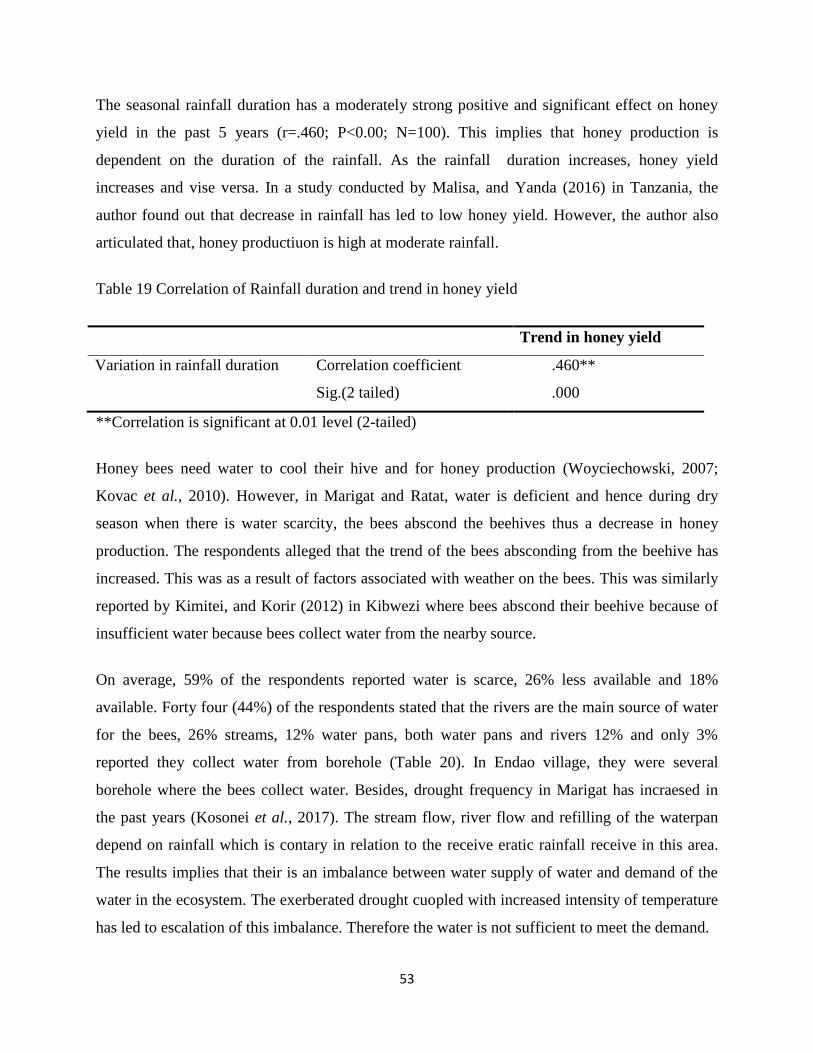
Table 19 Correlation of Rainfall duration and trend in honey yield ............................................. 53
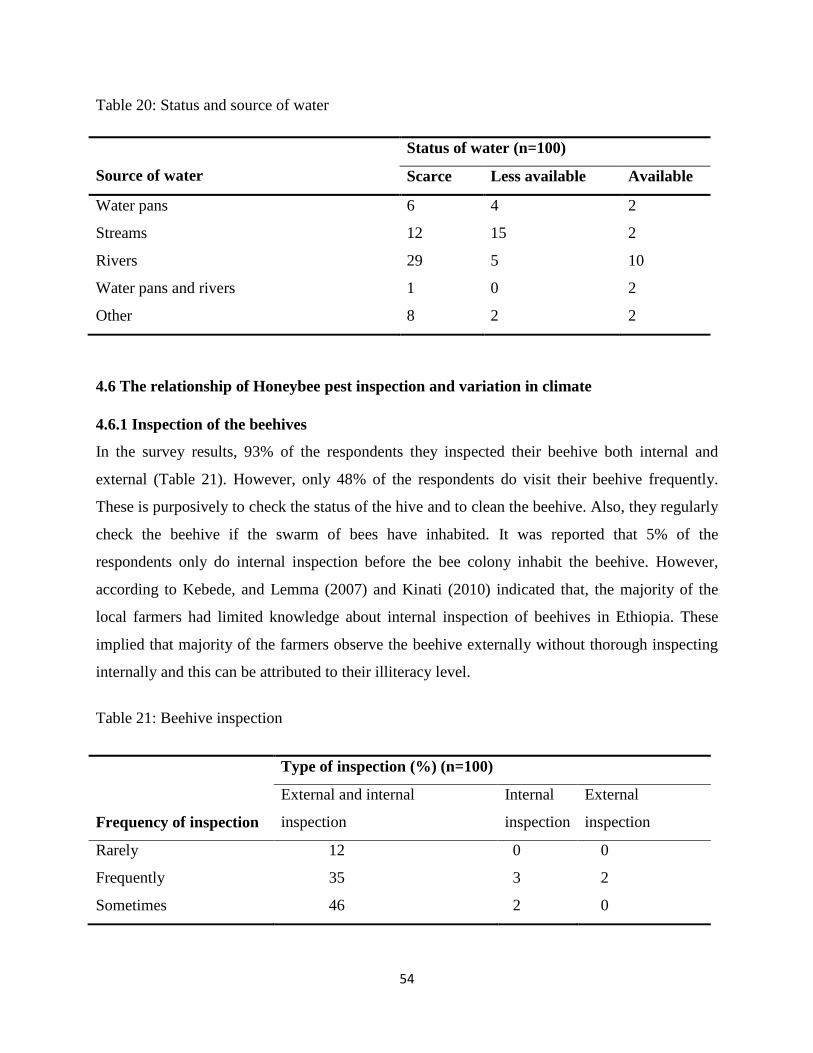
Table 20: Status and source of water ............................................................................................ 54
Table 21: Beehive inspection ........................................................................................................ 54
Table 22: Ranking of the major bee pest and their status ............................................................. 55
Table 23: Correlation analysis of the relationship between prevalence of pest and honey yield . 57
Page 12
xii
LIST OF FIGURES
Figure 1: Interaction of drivers that leads to decline in honey. .................................................... 13
Figure 2: Conceptual framework showing relationship between variables .................................. 15
Figure 3: Study area map. ............................................................................................................. 18
Figure 4: Gender and marital status of the respondents ................................................................ 25
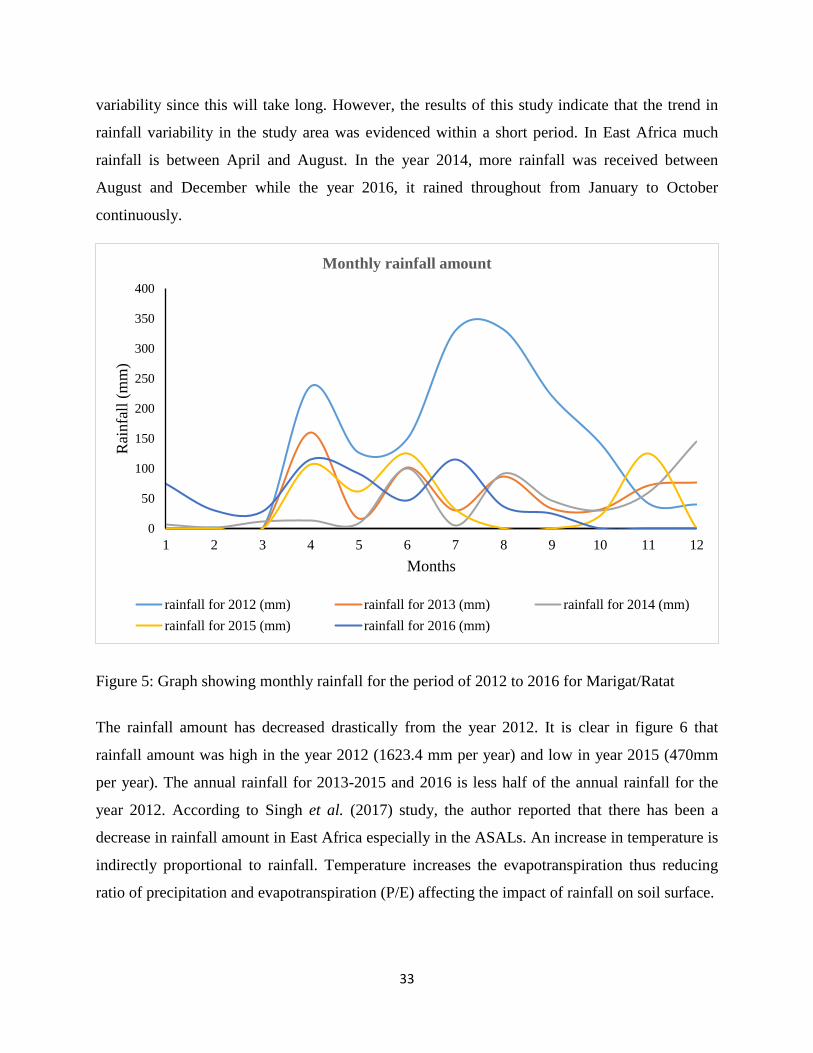
Figure 5: Graph showing monthly rainfall for the period of 2012 to 2016 for Marigat/Ratat ..... 33
Figure 6: Graph showing the annual trend in rainfall amount for the study area ......................... 34
Figure 7: The standard error graph showing the annual rainfall for 2012-2016. .......................... 35
Figure 8: The line graph showing the Annual Temperature in the study area. ............................ 36
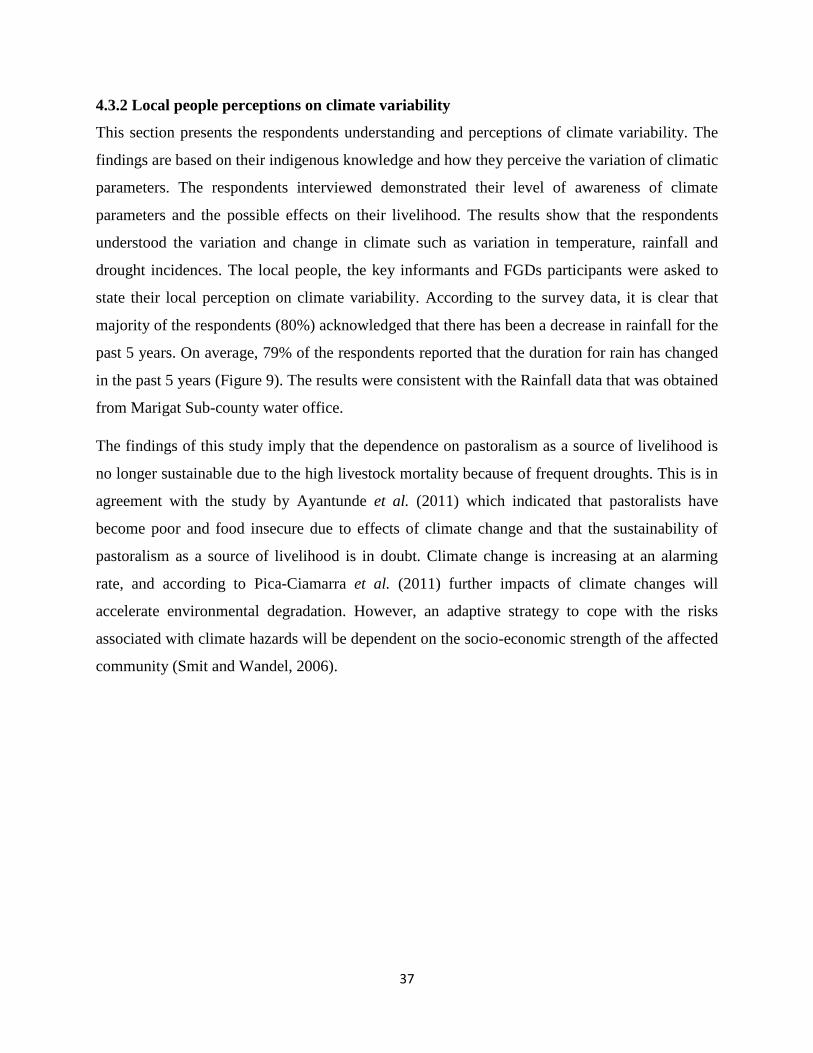
Figure 9: Trends of rainfall amount and duration ......................................................................... 38
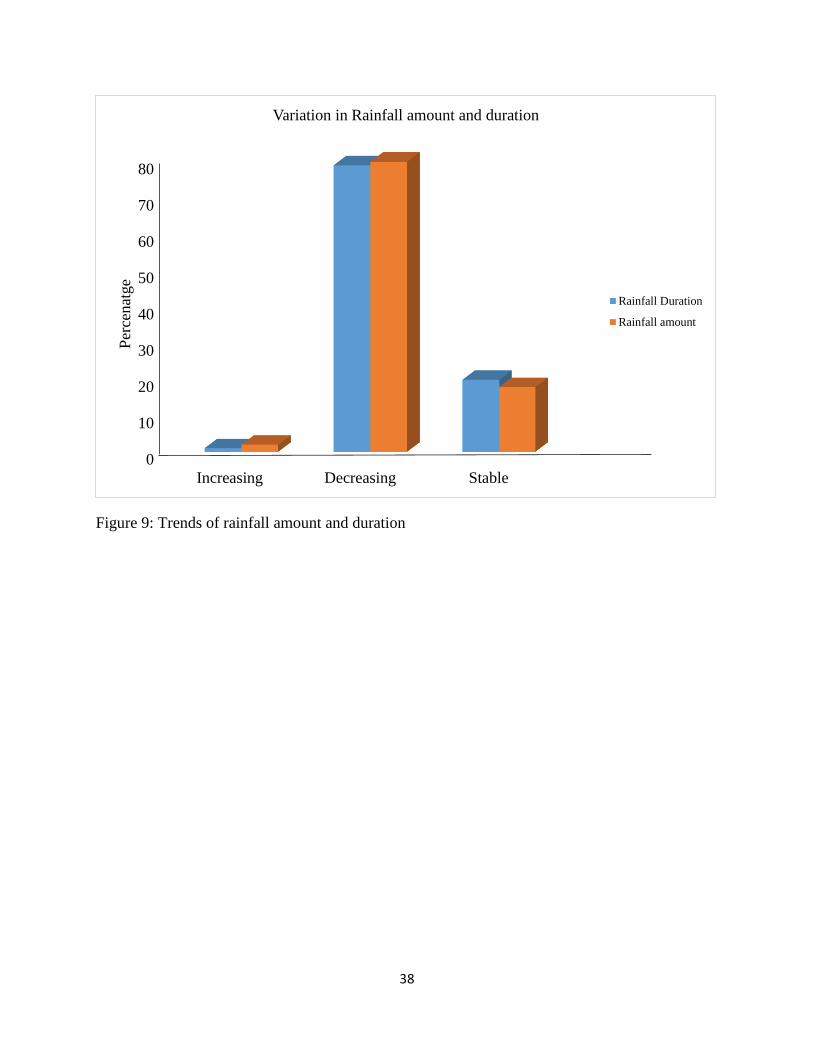
Figure 10: Respondents perception on severity and frequency of drought and temperature........ 40
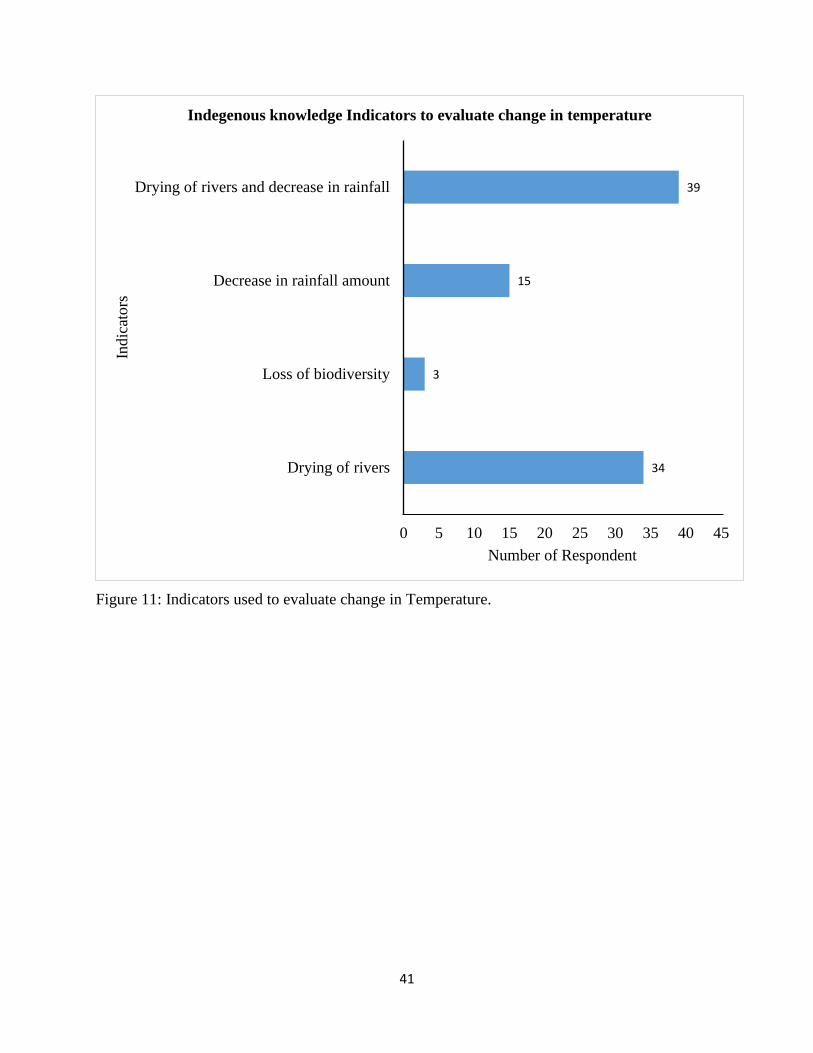
Figure 11: Indicators used to evaluate change in Temperature. ................................................... 41
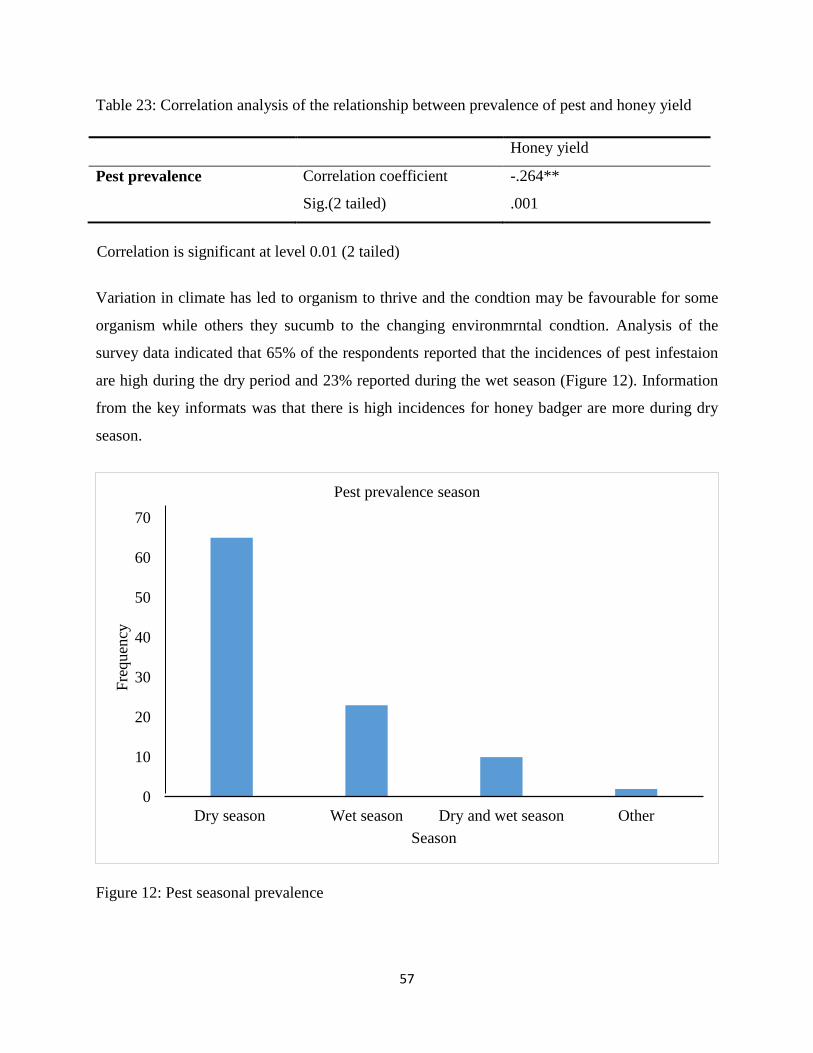
Figure 12: Pest seasonal prevalence ............................................................................................. 57
Page 13
xiii
LIST OF TEXT BOX
Text box 1: Climate variability experience from key informant .................................................. 39
Page 14
xiv
LIST OF PLATES
Plate 1: The abundance of flora decreasing towards the roadside (1), Euphorbia species most
preferred by bees (2), and poisonous plant with a long flowering duration (3). ........................... 44
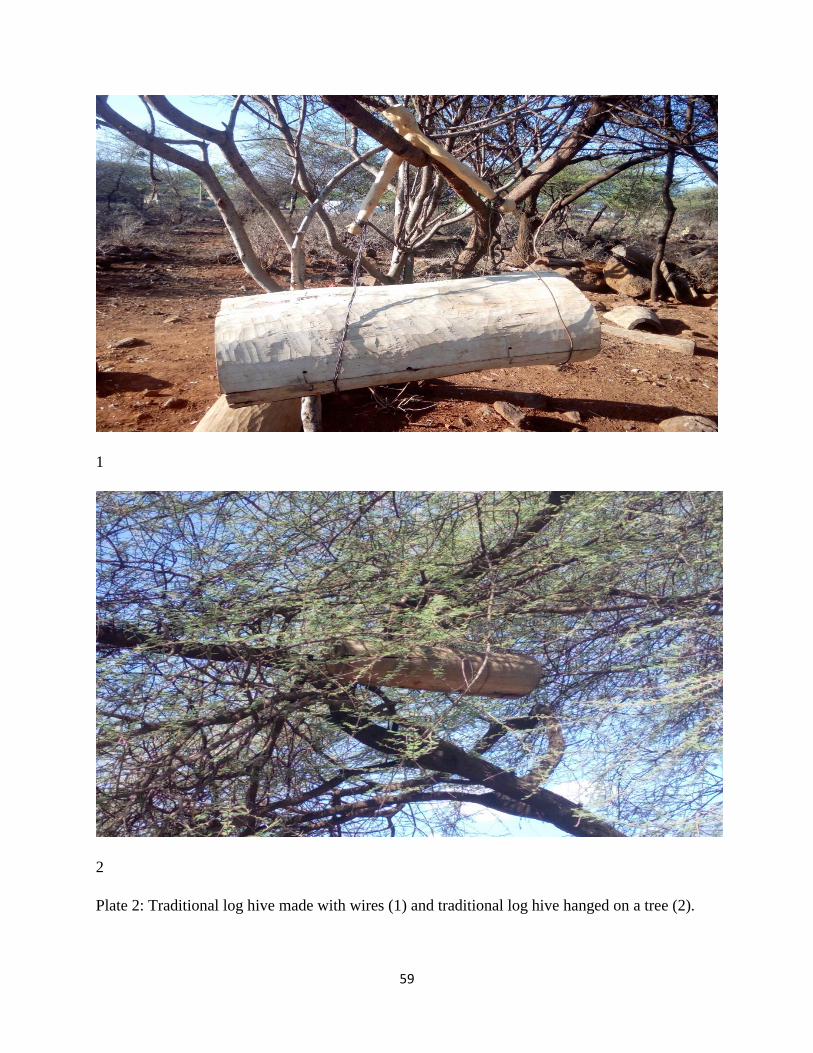
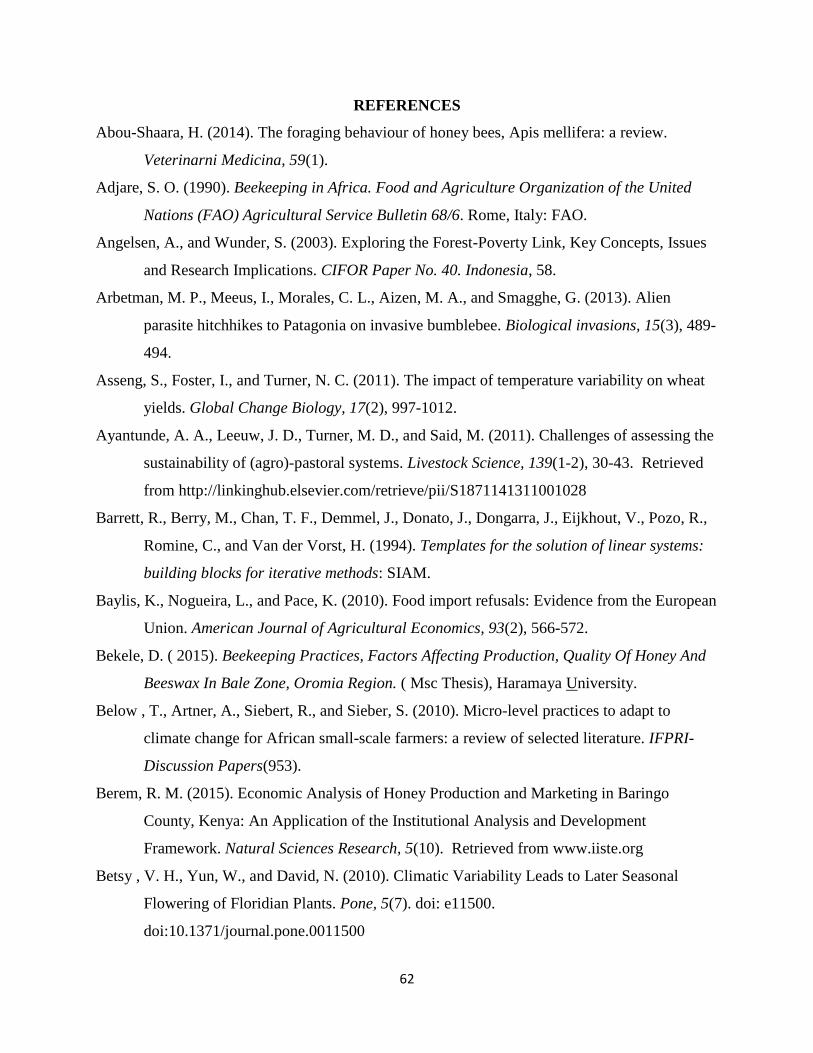
Plate 2: Traditional log hive made with wires (1) and traditional log hive hanged on a tree (2). 59
Page 15
xv
LIST OF ABBREVIATIONS AND ACRONYMS
ASALs: Arid and Semi- Arid Lands
FGDs: Focused Group Discussions
GoK: Government of Kenya
IPCC: Intergovernmental Panel on Climate Change
KShs: Kenya Shilling
MRNA: Messenger Ribonucleic Acid
NACOSTI: National Commission for Science, Technology and Innovation
NGO: Non-Governmental Organisation
NCCRS: National Climate Change Response Strategy
UNEP: United Nations Environmental Programme
KARLO: Kenya Agricultural and Livestock Research Organisation
SACCO: Saving and Credit Co-operative
SDGs: Sustainable Development Goals
Page 16
1
CHAPTER ONE
INTRODUCTION
1.1 Background Information
Climate change and variability is a global issue of concern and its impacts vary spatially,
geographically and temporally. Some areas experience an increase in rainfall whereas others
document a decrease (IPCC, 2014; Smith et al., 2014). The global terrestrial temperature has
increased by 0.8°C in the past century and 0.6°C in the past three decades because of
anthropogenic activities (Hansen et al., 2006). Climate change is encroaching slow but steady
with an increase of temperatures of 0.5°C per decade (Hulme et al., 2001). This change has had
impacts on people’s livelihoods thereby affecting development, economic stability, biodiversity
and ecosystems (Thornton et al., 2011)
The impact of climate change and variability is manifested both in developing and developed
countries (Simms, 2005). Africa as a continent with limited natural resources is susceptible to
impacts of climate variability and change leading to poverty escalation, increase in food price,
high inequality, food insecurity, increase in energy price, an impediment to development and
high incidences of disasters (Boko et al., 2007; IPCC, 2007). In East Africa, climate variability
and change effects are evidenced by increased sea level (IPCC, 2001), rise in water in lakes and
change in seasonal migration of wildlife (Thirgood et al., 2004), rainfall uncertainty (Simms,
2005) and other associated effects.
Apiculture is an important element of agriculture as it plays a major role in rural self-
employment, economic development and source of food (human nutrition). The key product of
beekeeping is honey and wax and is a source of income to many farmers. Honey is used for
several purposes such as food, medicine, cultural ceremonies and for religious purposes (Yirga
and Teferi, 2010). Seventy three percent of the world crop pollinators are bees. These have an
economic significance of €156 billion per year (Gallai et al., 2009). Honey production has grown
globally. However, there has been a reduction in the production after the European Union banned
the Chinese honey (Dong and Jensen, 2004), where they depend on organic honey from Kenya
(Baylis et al., 2010).
Page 17
2
In Kenya, beekeeping has been practiced for many years with only about a quarter of honey
produced in arid and semi-arid lands of Kenya (Thomas, 2006). In Baringo County, beekeeping
is among the top important income generating activities. It is a source of livelihood for many
households. Honey production is the third source of income for the County after cash crop
farming and livestock keeping (GoK, 2014). The Kenya potential for honey production is over
100,000 metric tons. Baringo county has 176,000 hives and 576 tons of honey is harvested every
year that accounts to 1.44 million KSh per month and 5 billion shillings per year (Ngigi, 2013).
Approximately, seventy-six percent of the beekeepers sell their honey to middlemen (Gichora,
2003). The honey harvest is at peak between September and December. The farmers sell crude
honey at a high price especially during dry season. The products have a long shelf life with high
nutritional and medicinal value. This has enhanced poverty reduction, gender equality and extent
habitat conservation (Raina et al., 2011).
The County Government of Baringo currently has embarked on how to increase honey
production. The decline in honey production has led to indigenous communities of Baringo to
engage in charcoal burning and other socio-economic activities (GoK, 2014). This escalates
environmental degradation with poor forage production persist in dry conditions and thus a
decline in water availability, which are some of the perceived problems in the area (GoK, 2014).
According to the Baringo County development plan (2014-2015), the major problems facing
Baringo County include environmental degradation due to deforestation, desertification,
pollution and climate change. Climate change and variability have led to increased intensity and
rate of recurrence of extreme weather conditions, floods, landslides and drought in the area
(GoK, 2014).
There has been a decline in natural pollinators because of habitat loss and fragmentation,
intensive use of chemicals in agriculture, invasive species, climate change and variability (Potts
et al., 2010; GoK, 2014). These impacts of climate variability are experienced highly in medium
and low potential zones than in high agricultural areas (Thornton et al., 2011; IPCC, 2014). In
low and medium potential areas, most people depend on environmental resources for their
livelihood, which include; forage production and construction materials, among others.
Therefore, environmental changes has affected people's livelihoods. According to UNEP (2006),
African countries had the directive to assess the impacts of climate variability on livelihoods that
Page 18
3
would help to provide response strategy toward climate variability. This formed the basis of this
study that focused on assessment of impacts of climate variability on honey production in Ratat
and Marigat areas within Baringo County.
1.2 Statement of the Problem
Honey production a natural resource that complement livestock production activities in ASALs.
Current trends in climate warming coupled with the increase in human populations are placing
new stresses on the production ability of the fragile ecosystem to sustain the indigenous
populations of Baringo. There is need to establish the link between land management in the
context of honey production and climate variability. Since climate variability has led to an
interruption of the ecosystem services, therefore, the purpose of this study was to assess the
relationship between climate variability and honey production in Marigat and Ratat, Baringo
County, Kenya.
1.3 Objectives
1.3.1 Broad Objective
The overall aim of the study was to analyze the variation in climate (rainfall and temperature)
and assess its implication on honey production in Ratat and Marigat.
1.3.2 Specific Objectives
(i) To determine rainfall variability patterns for the period 2012 to 2016.
(ii) To assess the relationship between rainfall variability and forage phenology.
(iii) To assess the effects of climate variability on honey yield for the period 2012 to 2016.
(iv) To assess the effects of climate variability on bee pest infestation.
1.4 Research Questions
(i) How has rainfall varied for the period 2012 to 2016?
(ii) What is the relationship between rainfall variability and forage phenology?
(iii) What are the effects of climate variability on honey yield for the period 2012-2016?
(iv) How has climate variability influenced bee pest infestation?
Page 19
4
1.5 Justification of the Study
Globally, dry area covers about 41% of the entire land. Since climate variability is both a threat
and an opportunity, these dry areas are more vulnerable to climatic threat than opportunities.
Climate prediction shows that some parts of the world will become hotter and others drier. This
will alter societal performance, poverty escalation, hunger, and environmental degradation.
Apiculture is a source of livelihood for the Baringo community and depends on favourable
weather condition. Although people have diversified their livelihood in order to cope with
unfavourable weather condition, it has been observed that the weather related impacts are
manifested in all sectors. The shortage of water, high temperature, and increase net radiation
affects plant phenology and pest infestation that affects honey production. Kenya agricultural
sector is vulnerable to impacts of climate variability, and the agricultural strategy is inadequate
to provide adequate measures to deal with climate variability. The findings of the study provided
useful information that will help in the management of ASALs resources and improving the
livelihoods of the people through increased honey production. This study enlighten issues being
faced by the honey dependent local people because of climate variability. The information is
important for adaptive and poverty alleviation strategies among households in Kenyan
rangelands and to meet the Sustainable Development Goals 1 (End poverty), 2 (zero hunger) and
13 (climate action) and the Kenyan vision 2030.
1.6 Scope and Limitations
The study focused on impacts of climate variability on honey production in Ratat and Marigat. It
focused on establishing the relationship between climate variability and effects on honey
production; forage availability for bees, water availability, pest and disease infestation, migration
and movement of bees. The study focused on two items: first, assessment of the climate
variability based on climatic variable (parameters) i.e. temperature and rainfall. Secondly, to
assess the effects of climate variability on forage availability and pest infestation. Rainfall data
for the period of 2012 to 2016 was analysed to determine the trend and variation. The baseline
rainfall in the study area is 600mm per year.
Page 20
5
The limitation of the study was inability to have access to the time series information from the
Perkera irrigation scheme and County government. This is because the institutions though were
provided with the modern instrument for measuring rainfall and temperature and they were still
adopting no how to use them. There was also lack of time series recorded data on honey
production among the farmers. It was difficult to deduce the trend in honey production since
majority of the farmers did not keep records. Furthermore, the Saving and Credit Cooparative
(SACCO) and groups did not have seasonal concise data on honey yield since the buy honey in
bulk. Some farmers buy honey from the nearby neighbours and reserve it until the price is high
so that they can sell to fetch a high profit. This was mitigated by relying on farmers’ perception
on honey yield. There was a challenge in answering question among the respondents because of
language. This was mitigated by use of the local enumerator to translate some of the question to
local language.
1.7 Assumptions of the study
The assumption of the study is that climate variability has led to reduction in honey production
affecting the socio-economic status of the people. In addition, it was assumed that the data
collected was normally distributed and the sample was representative.
Page 21
6
1.7 Operational definitions of terms and concepts
Apiculture - The science and art of bee farming.
Absconding- this is the situation where bees totally leave the beehive because of unfavorable
condition.
Climate change: variation and change of weather condition for an extended period of over 35
years of a given area.
Climate variability: The temporal and spatial variation in weather condition beyond the normal
weather events of given area.
Food Security- It refers to a household's or country's ability to provide future physical and
economic access to sufficient, safe, and nutritious food that fulfills the dietary needs and food
preferences for living an active and healthy lifestyle.
Bee migration- The seasonal movements of whole honeybee colonies from one area to another.
Honey yield- Quantity of honey in a single hive
Honey production- Quantity of honey in multiple hives
Swarming- The movement of the bee colony to a new site with a new queen, leaving behind a
portion of the colony.
Phenology- The timing, duration and abundance of recurrent biological phenomena, including
reproductive events such as flowering, fruiting, seed dispersal and germination.
Pest infestation: Invasion of pest or parasites
Forage type: The type of forage that is bees prefer to collect nectar, propolis and other raw
materials
Forage distribution: This spatial and temporal distribution/allocation of forage.
Forage: Raw materials used by bees to make honey
Page 22
7
CHAPTER TWO
LITERATURE REVIEW
2.1 Introduction
This chapter consists of the literature review of previous studies related to the study objectives
and divided into themes in relation to the information relevant to the study. It also presents
policy review and conceptual framework that illustrates the cause-effect relationship between the
variables.
2.2 Beekeeping and its contribution to the society
Organisms are adapted to different types of environments because of the differences in climatic
conditions. Africa has various types of wild honeybees (Adjare, 1990) with three sub species of
Apis mellifera that have slightly similar morphology (Crewe et al., 1994). Beekeeping has been a
traditional activity among many societies. The African societies have for a long time practiced
beekeeping using traditional hives. In the late 1960s, modern technology was introduced in
Kenya which has improved management and increase output in honey production (Caroll, 2006).
Furthermore, beekeeping does not require an extensive and intensive labour and capital to start
as it requires little input but it has a higher output and it is easy to harvest, process, and transport
(FAO, 2012). Thus, every individual in the society can practice it. The ASALs communities use
honey for traditional ceremonies for the purpose of strengthening social ties and other social
activities such as marriage, reconciliation, birth and circumcision ceremony (FAO, 2009).
Furthermore, bees are important pollinators in the world and indicators for terrestrial
environmental change (Klein et al., 2006).
2.3 Overview of Climate variability
Climate variability is associated with extreme weather condition that affects farmers' output. The
impacts varies with the magnitude from and one area to another (Davis and Ali, 2014). Kushnir,
and Wallace (1989) and (Trenberth et al., 1998) predicted that regions would experience
different weather condition in the late 1990s. Some areas will be drier, whereas other areas will
experience warmer and others cooler weather conditions thus unpredictable weather with
increasing temperature and change in the onset of rainfall altering the growth of fauna and flora
(Roncoli et al., 2010). Therefore, the erratic nature of weather patterns results in reduction in
agricultural production thus affecting the socio economic activities of many farmers (Cassman,
Page 23
8
1999) impacting on livelihood of people who live in marginal areas because of fragile
ecosystems (Maracchi, 2005; IPCC, 2007). These effects vary spatially depending on
geographical location and socio-economic status of individuals and groups (McMichael, 2013;
IPCC, 2014). According to IPCC (2014), some physical system or ecosystems are at risk of
temporal or permanent damage. The effects are manifested more among the farmers who depend
on rain-fed agriculture especially in ASALs leading to food insecurity (FAO, 2012; IPCC, 2014),
especially in sub-Saharan Africa.
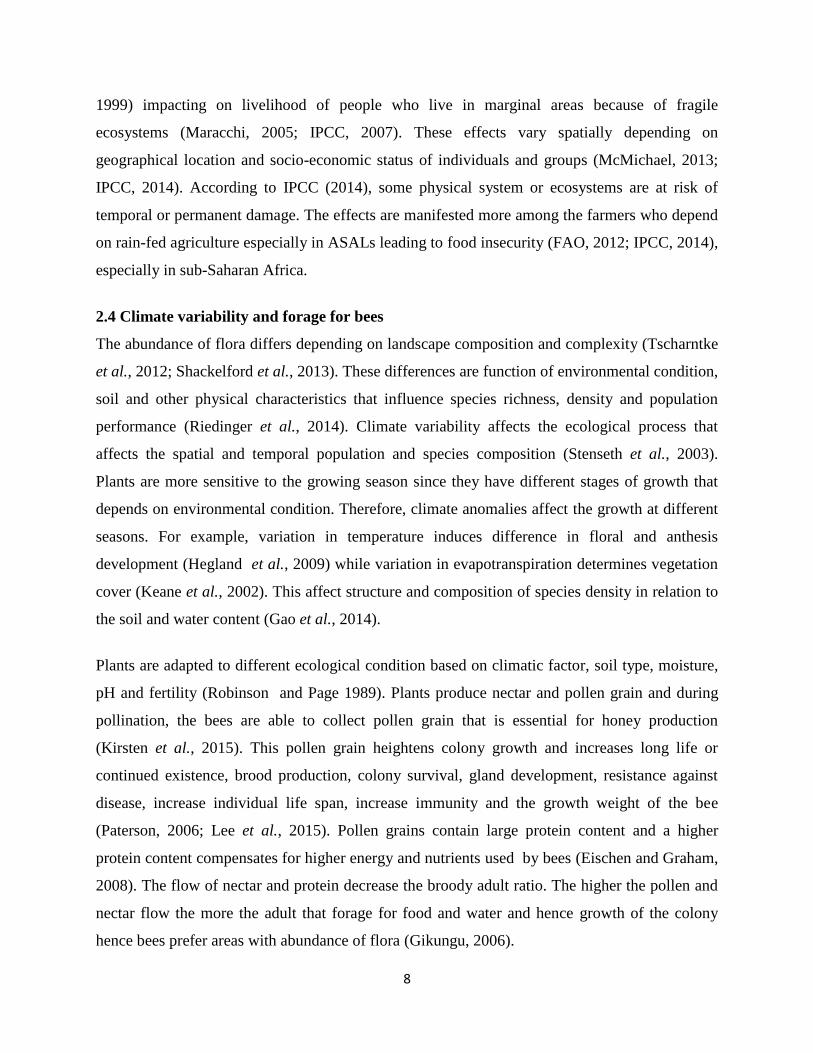
2.4 Climate variability and forage for bees
The abundance of flora differs depending on landscape composition and complexity (Tscharntke
et al., 2012; Shackelford et al., 2013). These differences are function of environmental condition,
soil and other physical characteristics that influence species richness, density and population
performance (Riedinger et al., 2014). Climate variability affects the ecological process that
affects the spatial and temporal population and species composition (Stenseth et al., 2003).
Plants are more sensitive to the growing season since they have different stages of growth that
depends on environmental condition. Therefore, climate anomalies affect the growth at different
seasons. For example, variation in temperature induces difference in floral and anthesis
development (Hegland et al., 2009) while variation in evapotranspiration determines vegetation
cover (Keane et al., 2002). This affect structure and composition of species density in relation to
the soil and water content (Gao et al., 2014).
Plants are adapted to different ecological condition based on climatic factor, soil type, moisture,
pH and fertility (Robinson and Page 1989). Plants produce nectar and pollen grain and during
pollination, the bees are able to collect pollen grain that is essential for honey production
(Kirsten et al., 2015). This pollen grain heightens colony growth and increases long life or
continued existence, brood production, colony survival, gland development, resistance against
disease, increase individual life span, increase immunity and the growth weight of the bee
(Paterson, 2006; Lee et al., 2015). Pollen grains contain large protein content and a higher
protein content compensates for higher energy and nutrients used by bees (Eischen and Graham,
2008). The flow of nectar and protein decrease the broody adult ratio. The higher the pollen and
nectar flow the more the adult that forage for food and water and hence growth of the colony
hence bees prefer areas with abundance of flora (Gikungu, 2006).
Page 24
9
Although plants and animals live in a mutual relationship, climate change and variability have
interfered with this relationship since climate variability poses a threat to pollination (Hegland et
al., 2009; Schweiger et al., 2010). For instance, trees flower at different point in a season
because temperature influences flowering, pollination, and anthesis. Plants will flower depending
on the temperature of the season and the change in the temperature and rainfall alters flowering
of the plants (Hegland et al., 2009; Luo, 2011). Depending on environmental condition and the
position of the beehive, sometimes pollination will tend to decrease with distance from the
beehive (Ricketts et al., 2008).
Species diversity, richness/and abundance vary with landscape composition and complexity. This
has an impact on the population of bees that tends to be abundant depending in areas with
widespread of the flora (Grundel et al., 2010; Tscharntke et al., 2012). Honey composition also
varies geographically depending on plant species except for Phytochemicals composition that
depend on climatic conditions (Gemechis, 2012). Therefore, different bees are adapted to
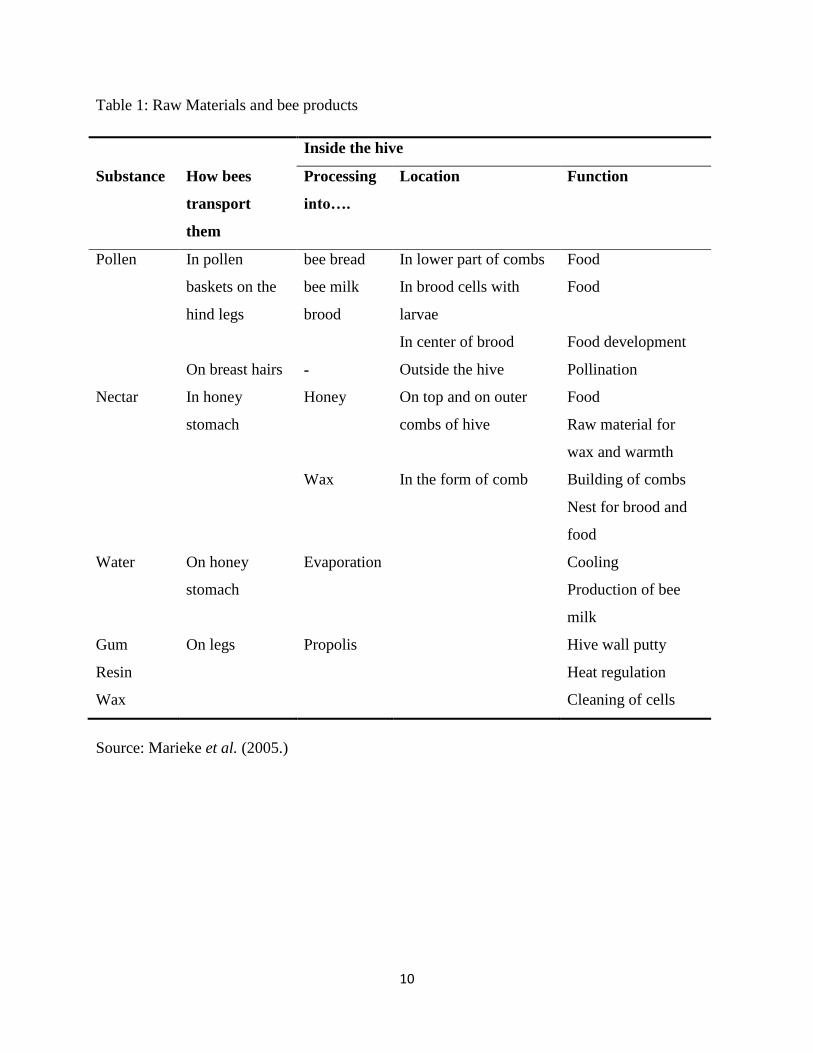
different condition in a given geographical area or environment (Ruttner, 1975). As indicated in
Table 1, the raw materials for honey production are extracted from the interlinked environmental
service. For instance, nectar is converted into honey and pollen into protein and lipids, which are
source of food for the bee colony (Crailsheim, 1992).
Page 25
10
Table 1: Raw Materials and bee products
Inside the hive
Substance How bees
transport
them
Processing
into….
Location Function
Pollen In pollen
baskets on the
hind legs
bee bread
bee milk
brood
In lower part of combs
In brood cells with
larvae
In center of brood
Food
Food
Food development
On breast hairs - Outside the hive Pollination
Nectar In honey
stomach
Honey On top and on outer
combs of hive
Food
Raw material for
wax and warmth
Wax In the form of comb Building of combs
Nest for brood and
food
Water On honey
stomach
Evaporation Cooling
Production of bee
milk
Gum
Resin
Wax
On legs Propolis Hive wall putty
Heat regulation
Cleaning of cells
Source: Marieke et al. (2005.)
Page 26
11
2.5 Climate variability, water and bees
Variation in weather condition has resulted in change in net radiation, temperature and speed of
wind which varies temporally and spatially (Tang et al., 2011; McVicar et al., 2012). Increase in
temperature has led to evaporation that is higher than replenish level of surface water and hence
the reduction in water (Donohue et al., 2006; Tabari et al., 2011). Areas with a thick cloud cover
have less evaporation, whereas sunlight duration affects evapotranspiration (Irmak et al., 2012).
Insufficient water affects agriculture and plant growth since plants require water to carry out
physiological processes. Some crops are more water demanding, however they wither when
rainfall distribution is erratic especially during the season (WRMA, 2013; Recha et al., 2015).
The imbalance between water and water supply and erratic rainfall has led to increased
frequency of flood, surface runoff, drought, and stream pollution (Wei et al., 2013; WRMA,
2013). Many studies has been conducted in several areas such as China (Shi et al., 2013), Kenya
(Mango et al., 2011), USA (Wang and Dickinson, 2012) and other areas in the world which
articulate the effects of climate variability on water.
Climate variability affects availability of water resource on the earth. For instance, change in the
variation in weather affect both the quantity and quality of water resources accessible for
drinking, recreation, irrigation, fish farming, hydroelectric power generation and other uses.
Surface and subsurface water is threatened by climate change and variability in the tropics
(Ozturk et al., 2015). There is insufficient water access, especially in the ASALs (Ozturk et al.,
2015; Kosonei et al., 2017). The quantity and quality have decreased (IPCC, 2014) affecting
flowering thus decrease in pollen and nectar for bees (IPCC, 2007; Inouye, 2008). Water is
essential for thermoregulation and honey production (Seeley, 1995) as indicated in Table 2.
Therefore, when water is limited, bees use high amount of energy to swarm for long distance to
search for water and food. They sprinkle water around the hive to control the temperature on hot
days whereas they also fan their wings or move out of the hive to regulate temperature (Heinrich,
1985). Temperature below the optimum level increases the duration for brood development and
increases the colony susceptible to disease and pest. Furthermore, water is essential for preparing
jelly for feeding brood. The water should have a pH of 5 or 6 (Woyciechowski, 2007).
Page 27
12
Table 2: Composition of several bee products
Concentration and weight in percentage
Product Water Protein Fat Carbohydrates Ash
Honey 17-21 0.4 0 79-83 0.1
Pollen 25=>11 22 5 31 3
Bee bread 20=>14 20 3 24-35 3
Raw jelly 67 11 6 9 1
'=>'; refers moisture content after drying. Source: Marieke et al. (2005.)
2.6 Climate variability and pest infestation
In the past century, total world pollinators have declined because of increased outburst,
incidences of infectious diseases and degradation of habitats, reduction in resource diversity, and
competition with the introduced pollinators, climate change, decline in genetic diversity and
pesticide use that causes either direct or indirect effect on them (Ghini and Morandi 2006).
These pollinators are vulnerable to pathogens, predators, and parasites (Le Conte and Navajas,
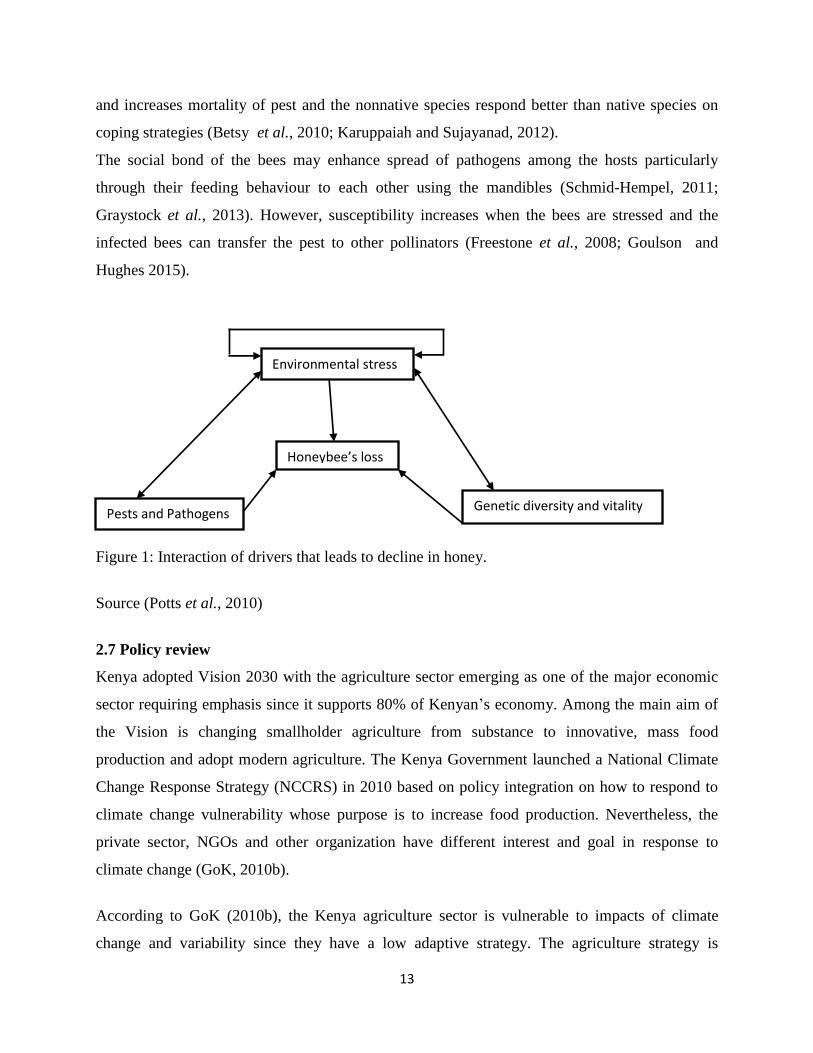
2008). Figure 1 shows how climate change and variability have led to a favourable condition for
the pest to bloom, to emerge and re-emergence (Garrett et al., 2006; UNEP, 2014). For example,
destruction of natural habitat can reduce the number of natural predators affecting the dominance
of certain species and create a favourable condition for pest and disease host. This is also
necessitated by human activity which increases incidences of bee diseases and pests (Ratnieks
and Carreck, 2010; Henry et al., 2012).
Temperature and humidity alter growth and development of an organism, survival, density and
population which may be either positive or negative. This change in weather conditions may
provide favourable environment for the pest to increase in population leading to invasion of new
pest that is capable of coping and adapting to the current environmental condition (Gunderson
2000; Mijatović et al., 2013). In addition, the condition may favour the emergence of disease
pathogen that may be a threat to the bees (Arbetman et al., 2013). A change in abiotic factor
increases the dynamics and outbreak of pest by increasing their density, distribution and
abundance as temperature above the optimal level reduces reproduction, growth, development
Page 28
13
and increases mortality of pest and the nonnative species respond better than native species on
coping strategies (Betsy et al., 2010; Karuppaiah and Sujayanad, 2012).
The social bond of the bees may enhance spread of pathogens among the hosts particularly
through their feeding behaviour to each other using the mandibles (Schmid-Hempel, 2011;
Graystock et al., 2013). However, susceptibility increases when the bees are stressed and the
infected bees can transfer the pest to other pollinators (Freestone et al., 2008; Goulson and
Hughes 2015).
Figure 1: Interaction of drivers that leads to decline in honey.
Source (Potts et al., 2010)
2.7 Policy review
Kenya adopted Vision 2030 with the agriculture sector emerging as one of the major economic
sector requiring emphasis since it supports 80% of Kenyan’s economy. Among the main aim of
the Vision is changing smallholder agriculture from substance to innovative, mass food
production and adopt modern agriculture. The Kenya Government launched a National Climate
Change Response Strategy (NCCRS) in 2010 based on policy integration on how to respond to
climate change vulnerability whose purpose is to increase food production. Nevertheless, the
private sector, NGOs and other organization have different interest and goal in response to
climate change (GoK, 2010b).
According to GoK (2010b), the Kenya agriculture sector is vulnerable to impacts of climate
change and variability since they have a low adaptive strategy. The agriculture strategy is
Environmental stress
Honeybee’s loss
Genetic diversity and vitality Pests and Pathogens
Page 29
14
inadequate to provide adequate measures to deal with climate change. The National beekeeping
policy of 2009 aims at improving honey production and enhancing awareness through providing
extension to farmers, research and training. This will enhance practicing beekeeping especially in
areas covered with expansive forests (GoK, 2010a). This will help in poverty reduction and
achieve vision 2030. The Policy acknowledges the impacts of climate change, climate
variability, pest, predators and disease on beekeeping (GoK, 2010a). According to the Water act
of 2002, the Water Resources Management Authority has the mandate to proclaim principles and
arrangements for conservation, management and control of water resources. The regulatory
board is supposed to gather data and maintain the information on water services and distribution,
access and utilization, promote conservation, monitor water services, monitor compliance with
terms and condition. This will promote a resilient environment (GoK, 2002).
Sustainable Development Goals number 1, 2 and 13 are geared towards poverty and hunger
reduction and strategies to combat climate change and its impacts, respectively. Climate change
escalates hunger and poverty especially in communities that have low risk management
strategies. Adoption of strategies proposed under the policy of 2014 to combat climate change
and reduce hunger and poverty among many people is important (GoK, 2011).
2.8 Conceptual Framework
The conceptual framework in Figure 2 shows the relationship between variables. The arrows in
the framework represent the feedback loops that show the relationships among the variables.
Honey production is determined by several factors; weather conditions and anthropogenic
factors. Thus, climate variability in turn, influences the livelihood of the people, which affects
livestock production, crop production, soil quality, and nature conservation. Rainfall and
temperature variability influence plants growth, water availability, forage availability and pest
infestation. The increase in temperature will increase the growth of flora up to an optimum level
beyond which the production decreases. In addition, it will provide a favorite environment for
pest to infest. Anthropogenic factors, socio economic activities, and legal framework will affect
honey production.
Page 30
15
Independent variables Dependent variable
Intervening variables
Figure 2: Conceptual framework showing relationship between variables
2.9 Operationalization of variables
Honey production; beekeeping is among major socio-economic activity for the people in
Baringo. The variables that were measured include quantity of honey produced, frequency of
harvesting in the year and factors that affect honey production
Temperature; Measurement of temperature is based on degree of temperature distribution and
interrelationship with other variables.
Rainfall; Characterize the rainfall variability; the amount of rain and frequency of rainfall.
Pest infestation; this involved documenting the types and frequency of pest infestation and the
factors influencing their prevalence.
Socio-economic activities; these will include human activities that directly and indirectly affect
honey production.
Legal framework
(Economic policy and
Environmental law)
Climate variability
Rainfall variability (Water
availability)
Temperature variability
Pest infestation
Prevalence
Forage phenology
Onset of Flowering
Flowering duration
Honey production
Quantity
Invasive species
Anthropogenic activities
Page 31
16
Policies; this include all legal framework including the traditional norms that influence honey
production.
Page 32
17
CHAPTER THREE
RESEARCH METHODOLOGY
3.1 Introduction
This chapter describes the study area, the climatic condition, socio-economic activities of the
local residents, vegetation type, topographic characteristics and techniques for data collection
and analysis.
3.2 Study Area
3.2.1 Geographical Location and Size
Baringo County is situated in the Rift Valley region. It boarders Turkana and Samburu counties
to the North, Laikipia to the East, Nakuru to the South, Uasin Gishu to the South west, and
Elgeiyo Marakwet and West Pokot to the west. It is located 36º31′ and 36º30′ E and between
latitudes 0º10′ and 1º40′ S (Figure 3). The equator passes across the County at the Southern part
(GoK, 2014). Baringo area covers an area of 11,0153sq Km of which 165sq Km is covered by
surface water Lake Baringo, Lake Bogoria and Kamnarok . The population estimate was 613,376
in 2012 and is estimated to increase to 677,209 and 723,411 by 2015 and 2017, respectively. The
human poverty index is 30.6% compared to the national level of 29% (GoK, 2013, 2014).
3.2.2 Climate and Topography
Baringo County varies in altitude between 3000m above sea level at its highest points and nearly
700m above the sea level at its low points. The mean annual rainfall varies between 1000 mm to
1500 mm in the highlands and 600 mm per annum in the lowlands. Due to their varied altitude,
the sub-counties receive different levels of rainfall. The mean annual temperature in the region
lies between 25ºC and 30ºC in the southern part and 30ºC and occasionally rises over 35ºC. The
hottest months are January to March. The mean, minimum annual temperature ranges from 16ºC
to 18ºC but sometimes drops up to 10ºC in the Tugen Hills (GoK, 2013, 2014).
Page 33
18
Figure 3: Study area map.
Source is (www.diva-gis.org)
Page 34
19
3.2.3 Vegetation Type
Topography differs from one area to another determining the soil type, climate and the type of
vegetation in the area. The county has both exotic and indigenous forest that is dominant. The
exotic trees are Grevillea robusta, Cuppressus lusitanica, Eucalyptus saligna and Prosopis
juliflora (dominant in Marigat). Some of the indigenous trees include Podo (Podocarpus
latifolius), Cedar (Cedrus libani), Osyris lanceolate and Acacia species. Other vegetation
includes coffee at Tugen hills and fruit trees. However, due to the prolific cutting of trees for
charcoal burning, there has been a decrease in the vegetation cover density (GoK, 2013, 2014).
3.2.4 Soil type and Water Status
The soils at lowland and highland type vary. The highland consists of well-drained soil that is
suitable for agricultural activities while the lowland soil is saline. It is composed of complex
alluvial soil, shallow stony, lava, boulders, and sandy soils. This soil is prone to erosion. Baringo
County has insufficient available water and cannot meet the need and demand of the population.
The sources of water are from the lake, streams, water pans, dams, rivers, boreholes, wells and
springs. The County has 5 major rivers: Perkerra, Molo, Kerio, Waseges, Emnos and other
seasonal rivers; Amaya, Arabal, Mukutani and Nginyangi (GoK, 2013, 2014).
3.2.5 Socio-economic Characteristics
The main socio-economic activity in Baringo is pastoralism. The communities rely on
pastoralism as their major source of livelihood. They keep goats, sheep, cattle and camels, and
beekeeping forming their major livestock activities. The communities also grow maize,
groundnuts, cotton, vegetables and practice agroforestry. Some members of the communities in
the lowland areas undertake charcoal burning as an alternative source of income since the erratic
rainfall is not reliable for agriculture. Other socio-economic activities include; ecotourism (Lake
Bogoria National game reserve and Lake Baringo) and mining (at Opal near Perkera) (GoK,
2013, 2014).
Page 35
20
3.3 Research Design
The study applied a social survey research design. Data collection was through administration of
questionnaire and interviews. Purposive random sampling technique was used in selecting the
village and the respondents. The key informants were selected based on their experience and
association with bee farmers. The sample units entailed the household heads, which was
generated based on population statistics. Structured questionnaires were administered to
household heads. The respondents were the local residents aged above 20 years who practice bee
farming.
3.4 Sample Size
The target population was the small-scale and large-scale beekeepers who have hives in the study
area. A cluster sampling approach was used for data collection in Marigat villages (Maoi,
Kamung’eyi, Loberer, Endao, Kapkukui, Perkera, Arabal, Koriema and Kimalel). The total
population in Marigat is 4393 with 1209 household and 940 (www.opendata.go.ke) in Ratat,
Bekibon sub-location with 203 household. Since the exact number of bee farmers is not known,
the sample size was determined using the formula by (Naissuma, 2000);
n= NC2/(C2+(N-1)e2)
Where
n: is the sample size;
N: is the population size of 1422;
C: is the coefficient of variation (30) and e is the margin of error (3%).
Therefore, the sample size was calculated as follows;
n=1422× 0.32/(0.32+1422×0.032)= 99.5≈100 households heads
100 household heads were included in the sample (Table 3). The proportionate distribution of the
sample size was calculated as follows;
With total households of 1209 in Marigat, the number of households sampled was calculated as
follows;
Page 36
21
n=1209×100 = 85 households head
1422
In Marigat 85 household heads were interviewed as per the following cluster per sampling unit.
Nine villages were sampled in Marigat; Kamung’eyi, Kapkuikui, Koriema, Endao, Maoi,
Perkera, Kimalel, Loberer and Arabal.
In Ratat, the total household was 203;
n=203×100 =15 households heads
1422
Table 3: Distribution of the sample frame
Village Frequency
Ratat 15
Kamung’eyi 12
Kapkuikui 11
Koriema 13
Endao 12
Maoi 15
Perkera 2
Kimalel 3
Loberer 11
Arabal 6
TOTAL 100
3.5 Ethical Consideration
Written permission to undertake the study was granted by the NACOSTI (Appendix 4) and the
Board of Postgraduate studies in Egerton University and the local area chief. Permission was
also obtained from the relevant county authority and local chiefs. Respondents participation was
based on their willingness based on informed consent. The information provided was used
entirely for academic purposes and personal information of respondents was kept confidential.
Page 37
22
3.6 Data Collection
Data was collected from both primary and secondary sources. Primary data were obtained
through administering questionnaires (Appendix 1), FGDs and scheduled interviews (Appendix
2). The questionnaires were administered to the household heads by the researcher and four key
informants from KALRO Marigat, Marigat Sub-county, Rachemo SACCO and Kamung’eyi
selected for a scheduled interview. Two FGDs at Ratat and Kamung’eyi were conducted with the
help of the local leaders who identified 5 people to participate in the discussion. Secondary data
were obtained from Marigat District water office (Appendix 3-data of rainfall 2012 to 2016),
Rachemo SACCO, KALRO Marigat, previous studies and literature review. This was to show
the relationship between environmental parameters and honey production in the study area.
3.6.1 Validity and Reliability
A pilot study was conducted in Sandai where 12 questionnaires were administered to
respondents to show the reliability of the study instruments. This was pretested prior to the main
study. During analysis of the pilot survey questionnaire, it was realized the questions relating to
plant phenology and pest infestation were not clear. Therefore, changes were made to take into
consideration of the raised issues and make them inclusive.
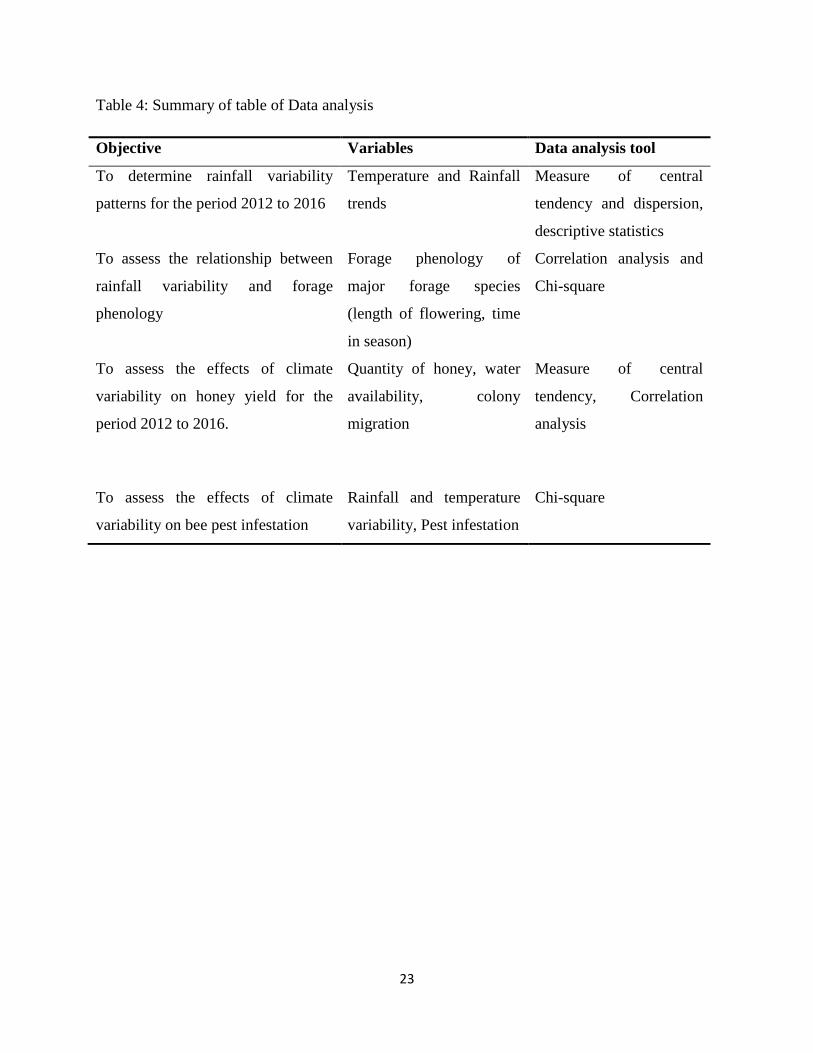
3.7 Data Analysis
The data was coded and analyzed using SPSS computer software version 20. Rainfall data was
tabulated and analysed using Microsoft excel. Excel was used for descriptive statistics to
determine the standard error, means, and range. Inferential and descriptive statistics; Chi-square
and Correlation analysis were used to determine the relationship between the dependent variable
and independent variables, frequency and percentage for qualitative description. This is
elaborated in Table 4.
Page 38
23
Table 4: Summary of table of Data analysis
Objective Variables Data analysis tool
To determine rainfall variability
patterns for the period 2012 to 2016
Temperature and Rainfall
trends
Measure of central
tendency and dispersion,
descriptive statistics
To assess the relationship between
rainfall variability and forage
phenology
Forage phenology of
major forage species
(length of flowering, time
in season)
Correlation analysis and
Chi-square
To assess the effects of climate
variability on honey yield for the
period 2012 to 2016.
Quantity of honey, water
availability, colony
migration
Measure of central
tendency, Correlation
analysis
To assess the effects of climate
variability on bee pest infestation
Rainfall and temperature
variability, Pest infestation
Chi-square
Page 39
24
CHAPTER FOUR
RESULTS AND DISCUSSION
4.1 Introduction
This chapter presents the results and discussion of the study in connection to the set objectives.
The segment is divided into two sections; demographic characteristics and the findings of the
study.
4.2 Characteristics of the Respondents
The demographic characteristics of the respondents interviewed in the study are gender, marital
status, age, educational level and occupation. Age, sex, marital status, education level and
occupation may influence the level of knowledge in relation to beekeeping.
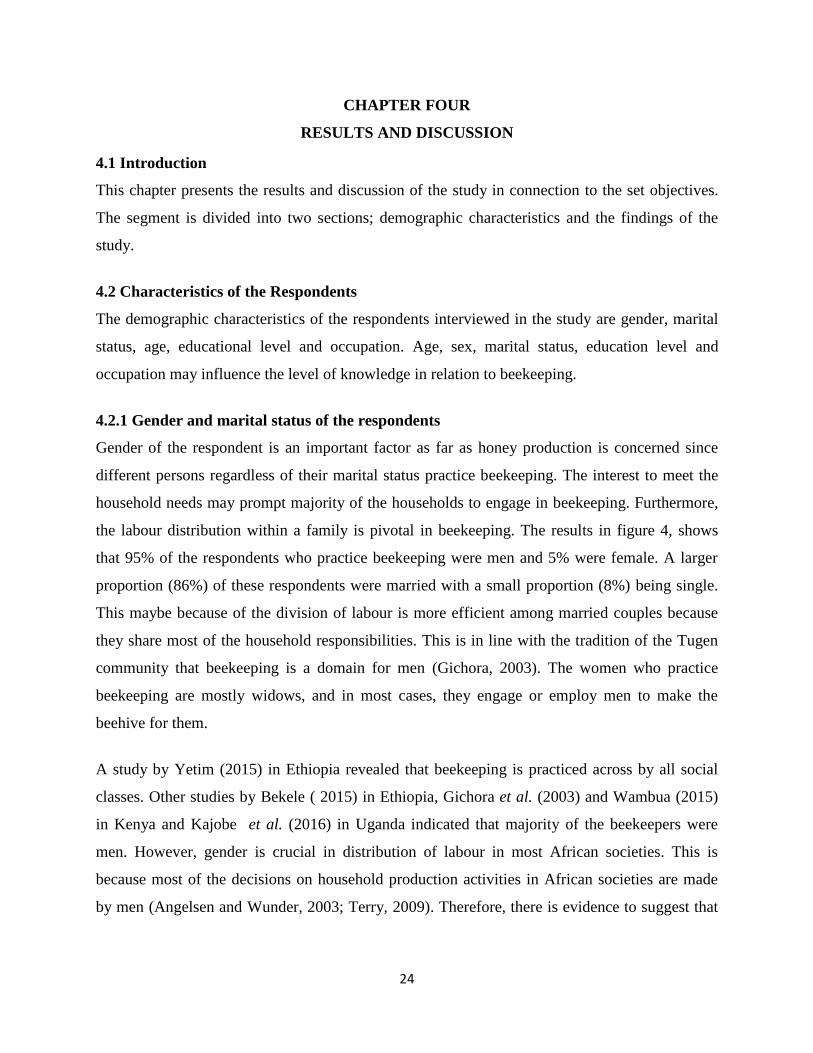
4.2.1 Gender and marital status of the respondents
Gender of the respondent is an important factor as far as honey production is concerned since
different persons regardless of their marital status practice beekeeping. The interest to meet the
household needs may prompt majority of the households to engage in beekeeping. Furthermore,
the labour distribution within a family is pivotal in beekeeping. The results in figure 4, shows
that 95% of the respondents who practice beekeeping were men and 5% were female. A larger
proportion (86%) of these respondents were married with a small proportion (8%) being single.
This maybe because of the division of labour is more efficient among married couples because
they share most of the household responsibilities. This is in line with the tradition of the Tugen
community that beekeeping is a domain for men (Gichora, 2003). The women who practice
beekeeping are mostly widows, and in most cases, they engage or employ men to make the
beehive for them.
A study by Yetim (2015) in Ethiopia revealed that beekeeping is practiced across by all social
classes. Other studies by Bekele ( 2015) in Ethiopia, Gichora et al. (2003) and Wambua (2015)
in Kenya and Kajobe et al. (2016) in Uganda indicated that majority of the beekeepers were
men. However, gender is crucial in distribution of labour in most African societies. This is
because most of the decisions on household production activities in African societies are made
by men (Angelsen and Wunder, 2003; Terry, 2009). Therefore, there is evidence to suggest that
Page 40
25
men dominance in beekeeping may be because of the societal setup. This portrays how important
beekeeping is as a source of livelihood for the pastoral community and it is inclusive.
Figure 4: Gender and marital status of the respondents
4.2.2 Age of the Respondents
The age of the respondents is important as it determines their level of understanding of bee
management and the change and variation in climate. Out of the sample, 25% of the respondents
were above 50 years, 13% between 44-49 years, 10% between 38-43 years, 22% between 32-37
years, 17% between 26-31 years and 13% between 20-25 years (Table 5). It is evident from the
results that persons of different age groups ranging from youths to the elderly practice
beekeeping. Kinati (2010) and Bekele ( 2015) in Ethiopia also found that beekeeping is an
activity that is practiced by younger age group to the elderly. In another study by Yetim (2015),
the author found out in most of the households, the younger age provides labour to their parent at
their tender age as they gain experience.
Page 41
26
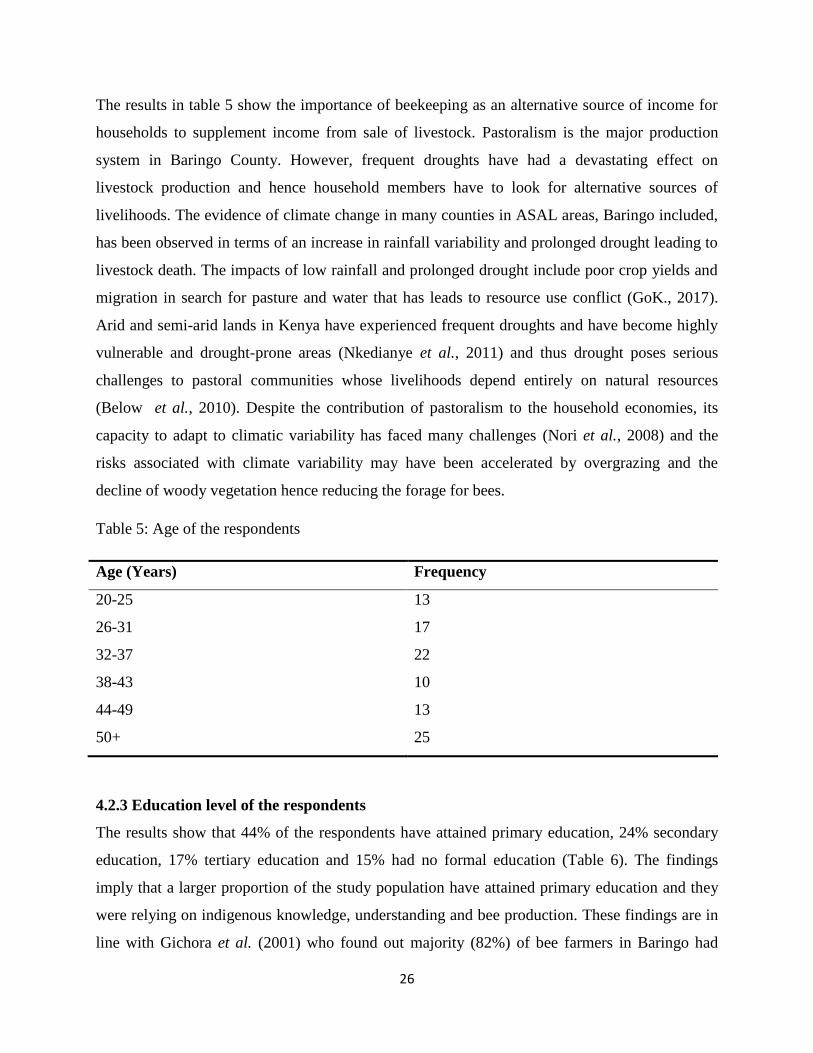
The results in table 5 show the importance of beekeeping as an alternative source of income for
households to supplement income from sale of livestock. Pastoralism is the major production
system in Baringo County. However, frequent droughts have had a devastating effect on
livestock production and hence household members have to look for alternative sources of
livelihoods. The evidence of climate change in many counties in ASAL areas, Baringo included,
has been observed in terms of an increase in rainfall variability and prolonged drought leading to
livestock death. The impacts of low rainfall and prolonged drought include poor crop yields and
migration in search for pasture and water that has leads to resource use conflict (GoK., 2017).
Arid and semi-arid lands in Kenya have experienced frequent droughts and have become highly
vulnerable and drought-prone areas (Nkedianye et al., 2011) and thus drought poses serious
challenges to pastoral communities whose livelihoods depend entirely on natural resources
(Below et al., 2010). Despite the contribution of pastoralism to the household economies, its
capacity to adapt to climatic variability has faced many challenges (Nori et al., 2008) and the
risks associated with climate variability may have been accelerated by overgrazing and the
decline of woody vegetation hence reducing the forage for bees.
Table 5: Age of the respondents
Age (Years) Frequency
20-25 13
26-31 17
32-37 22
38-43 10
44-49 13
50+ 25
4.2.3 Education level of the respondents
The results show that 44% of the respondents have attained primary education, 24% secondary
education, 17% tertiary education and 15% had no formal education (Table 6). The findings
imply that a larger proportion of the study population have attained primary education and they
were relying on indigenous knowledge, understanding and bee production. These findings are in
line with Gichora et al. (2001) who found out majority (82%) of bee farmers in Baringo had
Page 42
27
attained primary education. However, as compared to the authors’ results, there is an increase in
literacy level since the percentage who attained primary education was (44%) was lower as
compared to 82%. Education level is an important parameter as it influences adoption of new
technology, seeking extension services, proper care of the bee colony and understanding the
effects of climate variability on honey production. Furthermore, it was assumed that high level of
literacy contributes to the better management of the beehives and understanding of the impacts of
climate on apiculture.
Table 6: Educational level of the respondents
Educational level Frequency
No formal education 15
Primary 44
Secondary 24
Tertiary 17
Wasonga (2009) noted that education level is important to pastoral communities in determining
different socio-economic activities they engage in. High level of illiteracy is an indication of the
farmers unable to seek for formal employment and their reliability on honey production.
According to the OECD (1999) report, environmental communication is a two-way social
interaction process enabling people to understand key environmental issues such as climate
change and people’s interdependencies and how to respond to problems associated with the
phenomena competently. Information on environmental issues creates a new mind set and
perceptions that changes peoples’ lifestyles and judgement and efficient use of valuable
environmental resources. Environmental communication media plays a critical role in the
understanding of the environmental issues which enable people to take actions that lead to
mitigation measures to reducing the effectiveness and impacts of adverse changes in the
environment (Hansen., 2011).
Page 43
28
4.2.4 Occupation of the Respondents
The type of occupation influences the ability of an individual to provide labour, monitor the
beehive and understand the variations in honey production. In addition, this was assumed to
determine the level of understanding since those who provide tender care to the bees are more
knowledgeable than those who rely on casual labourers. Analysis of the survey data indicated
that 82% of the respondents were farmers. This makes it easy activity to undertake since it is
traditional art inherited from one generation to another (Table 7). The findings also indicated that
households’ members with other forms of employment rely on beekeeping as an alternative form
of livelihood. Kimani (2015) reported that socio-economic activities of Baringo community are
founded on their cultural endeavors. Moreover, this also determine the level of income and the
capability of the respondent to access to modern beehive and determine the indulgence in
apiculture. Beekeeping is an important source of income among the respondents. This was in line
with a study by Gichora et al. (2001), the author found that the major source of income for the
people in Baringo were livestock (49%) and beekeeping (25%).
Table 7: Major occupation of the respondents
Occupation Frequency Percentage
Farmer 82 82
Teacher 4 4
Enterprise 9 9
Other 5 5
4.2.5 Beekeeping activity
The mean experience number of years a person has gained experience in beekeeping was 17
years with a minimum of 3 years and maximum of 57 years (Table 8). There is a strong
correlation between the age of the beekeepers and experience that is represented by the strong
positive and high significant correlation (r=0.769, p=0.00). The results depict participation of
beekeeping activity from young to adults. These results are in agreement with those of Gichora et
al. (2003) at Baringo who found out that, there is positive correlation (r=0.67, p=0.001) between
the age and experience of the respondents.
Page 44
29
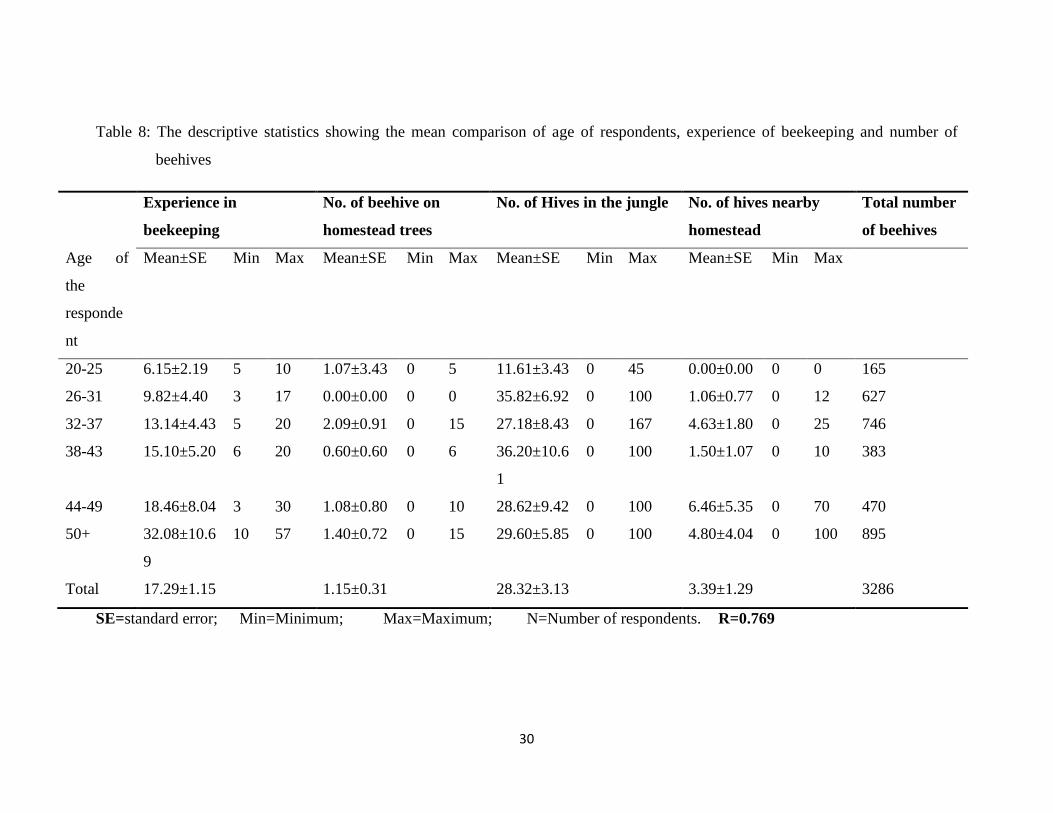
Majority of the respondents place their hive in the jungle with a maximum of 100 hives and a
mean average of 28 hives per person. A small proportion of the respondents place their hive at
their homestead (mean average of 1 hive per person) and with some of them preferring to place
the beehive at homestead with a mean average of 3 beehives per respondent (Table 8). The
results illustrate communities’ diversification in their socio-economic activities in order to meet
their household needs and thus they have more beehives. It was envisaged that the location of
the beehive would influence harvesting of honey by the farmers and ability of the farmers to
monitor the effect of climate variability on honey production. Therefore, farmers have to set
more beehives in different locations to increase their possibility to catch the swarm of bees.
Majority of the respondents placed their beehives in the jungle since this area has adequate
nectar as it is rich in flora (GoK, 2013). The findings indicate the full involvement of all
individuals in apiculture as a livelihood. Moreover, majority of the respondents with more
beehives were between the age bracket of 25-37. This is possibly because they are energetic and
mature and they actively participate in beekeeping. Information from some of the respondents
was that, the preference of placing the beehive in the jungle was because of the changing daily
temperature and pest infestation. The hive placed high on the tree provides a conducive
environment as it is cooler. In addition, placing the beehive away from the homestead and nearby
at the roads reduces disturbances since when temperature is moderate, the bees are more
aggressive, and they can cause injury to humans and animals. This is in agreement with Wambua
(2015) findings, who contend that hives that are placed on the trees are cooler than those placed
near the ground.
Page 45
30
Table 8: The descriptive statistics showing the mean comparison of age of respondents, experience of beekeeping and number of
beehives
Experience in
beekeeping
No. of beehive on
homestead trees
No. of Hives in the jungle No. of hives nearby
homestead
Total number
of beehives
Age of
the
responde
nt
Mean±SE Min Max Mean±SE Min Max Mean±SE Min Max Mean±SE Min Max
20-25 6.15±2.19 5 10 1.07±3.43 0 5 11.61±3.43 0 45 0.00±0.00 0 0 165
26-31 9.82±4.40 3 17 0.00±0.00 0 0 35.82±6.92 0 100 1.06±0.77 0 12 627
32-37 13.14±4.43 5 20 2.09±0.91 0 15 27.18±8.43 0 167 4.63±1.80 0 25 746
38-43 15.10±5.20 6 20 0.60±0.60 0 6 36.20±10.6
1
0 100 1.50±1.07 0 10 383
44-49 18.46±8.04 3 30 1.08±0.80 0 10 28.62±9.42 0 100 6.46±5.35 0 70 470
50+ 32.08±10.6
9
10 57 1.40±0.72 0 15 29.60±5.85 0 100 4.80±4.04 0 100 895
Total 17.29±1.15 1.15±0.31 28.32±3.13 3.39±1.29 3286
SE=standard error; Min=Minimum; Max=Maximum; N=Number of respondents. R=0.769
Page 46
31
4.2.5.1 The Type of Beehive
Variation in honey can also be determined with the type of beehive. Farmers with modern
beehives monitor their beehive frequently and do harvest more honey. The traditional beehive is
constructed with logs and is only capable of providing ambient condition for the bees’ survival.
The results indicate that 88% of the respondents have traditional log hives and on average 10%
had both modern hive and traditional log hives (Table 9). This is an indication of the local
society`s inability to adopt the new modern technology. It is also evident that majority of the
respondents started beekeeping at a tender age by observing and copying from their neighbours,
own interest or by inheritance from their parents (Table 10). The society prefers the locally made
log hives because they are cheaper and easily available. In a study conducted by Teferi et al.
(2011) and Yetim (2015) in Ethiopia, majority of the local people prefer traditional beehive
because it is easy to construct and manage, low maintenance cost, it is cheaper and locally
available. However, according to Kimitei, and Korir (2012) majority of farmers in Kibwezi in
Kenya lacked sufficient funds to buy the modern beehive leading preference of the traditional log
hives which is cheaper.
Table 9: Beehive types
Type of beehive % of the respondent
Only traditional beehive 88
Only modern beehive 2
Both modern and traditional beehive 10
n=100
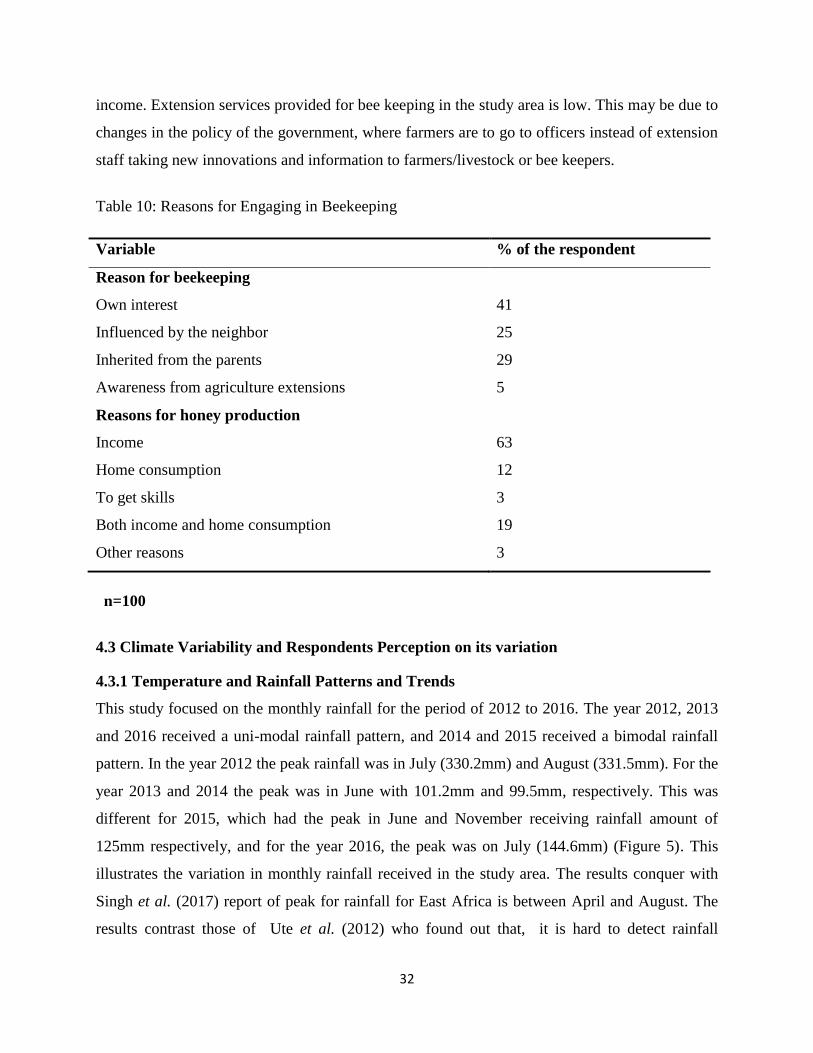
The respondents had varied reason for practicing beekeeping. The results in table 10 indicates
that, 63% of respondents practice beekeeping as source of income. The income from sale of
honey is mainly for subsistence. According to Gichora et al. (2001), farmers sell unrefined honey
at a higher price because of the multiple uses of the end product. However, climate variability
has had a great impact on honey production. Therefore, the need to put in place urgent measures
to cushion risks associated with effects of climate change. The response of many households to
climate shocks is that some members do migrate to urban areas to seek for employment in towns
(Bohra-Mishra et al., 2014) or use of the natural resources to generate and diversify household
Page 47
32
income. Extension services provided for bee keeping in the study area is low. This may be due to
changes in the policy of the government, where farmers are to go to officers instead of extension
staff taking new innovations and information to farmers/livestock or bee keepers.
Table 10: Reasons for Engaging in Beekeeping
Variable % of the respondent
Reason for beekeeping
Own interest 41
Influenced by the neighbor 25
Inherited from the parents 29
Awareness from agriculture extensions 5
Reasons for honey production
Income 63
Home consumption 12
To get skills 3
Both income and home consumption 19
Other reasons 3
n=100
4.3 Climate Variability and Respondents Perception on its variation
4.3.1 Temperature and Rainfall Patterns and Trends
This study focused on the monthly rainfall for the period of 2012 to 2016. The year 2012, 2013
and 2016 received a uni-modal rainfall pattern, and 2014 and 2015 received a bimodal rainfall
pattern. In the year 2012 the peak rainfall was in July (330.2mm) and August (331.5mm). For the
year 2013 and 2014 the peak was in June with 101.2mm and 99.5mm, respectively. This was
different for 2015, which had the peak in June and November receiving rainfall amount of
125mm respectively, and for the year 2016, the peak was on July (144.6mm) (Figure 5). This
illustrates the variation in monthly rainfall received in the study area. The results conquer with
Singh et al. (2017) report of peak for rainfall for East Africa is between April and August. The
results contrast those of Ute et al. (2012) who found out that, it is hard to detect rainfall
Page 48
33
variability since this will take long. However, the results of this study indicate that the trend in
rainfall variability in the study area was evidenced within a short period. In East Africa much
rainfall is between April and August. In the year 2014, more rainfall was received between
August and December while the year 2016, it rained throughout from January to October
continuously.
Figure 5: Graph showing monthly rainfall for the period of 2012 to 2016 for Marigat/Ratat
The rainfall amount has decreased drastically from the year 2012. It is clear in figure 6 that
rainfall amount was high in the year 2012 (1623.4 mm per year) and low in year 2015 (470mm
per year). The annual rainfall for 2013-2015 and 2016 is less half of the annual rainfall for the
year 2012. According to Singh et al. (2017) study, the author reported that there has been a
decrease in rainfall amount in East Africa especially in the ASALs. An increase in temperature is
indirectly proportional to rainfall. Temperature increases the evapotranspiration thus reducing
ratio of precipitation and evapotranspiration (P/E) affecting the impact of rainfall on soil surface.
0
50
100
150
200
250
300
350
400
1 2 3 4 5 6 7 8 9 10 11 12
Rai
nfa
ll (
mm
)
Months
Monthly rainfall amount
rainfall for 2012 (mm) rainfall for 2013 (mm) rainfall for 2014 (mm)
rainfall for 2015 (mm) rainfall for 2016 (mm)
Page 49
34
Figure 6: Graph showing the annual trend in rainfall amount for the study area
Source: Marigat District Water Office 2017
From 2012 to 2016, there is the presence of statistically significant decreasing trends in rainfall
amount. This depicted from the standard error bar, Figure 7. High rainfall was received in 2012
with a mean average of 135.28±35.56 and the least in the year 2015 with an average of
39.17±14.89. Despite the decrease in rainfall, the maximum rainfall was high in the year 2012
(331.5 mm) and decreased throughout the year (160 mm, 145 mm, 125 mm and 115 mm
respectively) with a minimum rainfall of 0 mm for 2012, 2013, 2014 and 2016 and 2 mm for
2014. In the year 2012, this area received rainfall above the average rainfall for ASALs while
2015 received rainfall below the average level. ASALs in Kenya have experienced frequent
droughts and have become highly vulnerable and drought poses a serious challenge for pastoral
communities whose livelihoods depend entirely on natural resources (Below et al., 2010;
Nicholson 2014).
0
200
400
600
800
1000
1200
1400
1600
1800
2011 2012 2013 2014 2015 2016
Rai
nfa
ll a
mount
(mm
)
Year
Annual Rainfall
Page 50
35
Figure 7: The standard error graph showing the annual rainfall for 2012-2016.
Source: Marigat District Water Office 2017
The exposed soil increases evaporation of the little soil moisture available further accelerating
the impacts of climate change (Okoti et al., 2014) on the ASAL environment. The high
dependence on rain-fed agriculture (Asseng et al., 2011; Lobell et al., 2011), and forage for bees
and livestock production combined with frequent droughts have had adverse effects on both
sectors affecting the livelihoods of pastoral communities in Baringo County.
The lowest average temperature was recorded in the year 2012 (16.75 °C) while highest in 2014
(18.58 °C). There is a steady increase in Temperature in 2012 to 2014. The average maximum
temperature was high in 2014 (33.8°C) lowest in 2012 (30.5) °C (Figure 8). During the day, the
temperatures are high while at night the area experience a cool temperature. The annual average
temperature was high in 2014 (26.19°C). It is depicted from figure 8 that, there is slight in in
0
200
400
600
800
1000
1200
1400
1600
1800
Year 2012 Year 2013 Year 2014 Year 2015 Year 2016
Rai
nfa
ll a
mount
(mm
)Annual rainfall amount
Page 51
36
temperature from 2012 to 2014. According to Ozturk et al. (2015), climate warming has led to
hot condition and an increase in dry conditions in Africa.
Figure 8: The line graph showing the Annual Temperature in the study area.
15
20
25
30
35
2012 2013 2014 2015 2016
Tem
per
atu
re
Year
Annual Temperature
Average low Temeperature Average High Temperature Average Temeperature
Page 52
37
4.3.2 Local people perceptions on climate variability
This section presents the respondents understanding and perceptions of climate variability. The
findings are based on their indigenous knowledge and how they perceive the variation of climatic
parameters. The respondents interviewed demonstrated their level of awareness of climate
parameters and the possible effects on their livelihood. The results show that the respondents
understood the variation and change in climate such as variation in temperature, rainfall and
drought incidences. The local people, the key informants and FGDs participants were asked to
state their local perception on climate variability. According to the survey data, it is clear that
majority of the respondents (80%) acknowledged that there has been a decrease in rainfall for the
past 5 years. On average, 79% of the respondents reported that the duration for rain has changed
in the past 5 years (Figure 9). The results were consistent with the Rainfall data that was obtained
from Marigat Sub-county water office.
The findings of this study imply that the dependence on pastoralism as a source of livelihood is
no longer sustainable due to the high livestock mortality because of frequent droughts. This is in
agreement with the study by Ayantunde et al. (2011) which indicated that pastoralists have
become poor and food insecure due to effects of climate change and that the sustainability of
pastoralism as a source of livelihood is in doubt. Climate change is increasing at an alarming
rate, and according to Pica-Ciamarra et al. (2011) further impacts of climate changes will
accelerate environmental degradation. However, an adaptive strategy to cope with the risks
associated with climate hazards will be dependent on the socio-economic strength of the affected
community (Smit and Wandel, 2006).
Page 53
38
Figure 9: Trends of rainfall amount and duration
0
10
20
30
40
50
60
70
80
Increasing Decreasing Stable
Per
cenat
ge
Variation in Rainfall amount and duration
Rainfall Duration
Rainfall amount
Page 54
39
The information from key informants, FGDs perception (Text box 1) and respondents perception
on rainfall amount (Figure 9) correlate with the Figure 6. The findings from FGDs in text Box1
is in correlates the findings.
Text box 1: Climate variability experience from key informant
The results in Figure 10 show that, 90% of the respondents reported an increase in severity of
drought for the past years (Figure 9) which is in agreement with Herror et al. (2010) findings that
Kenya experienced drought with different magnitudes after a period of 3-4 years. In addition, the
results indicated that, 92% of the respondents acknowledged the rise in temperature, with only
2% of the respondents reporting decrease in temperature. Globally, increase in temperature
varies geographically and spatially. In East Africa, the temperature has increased by an average
of 0.21˚C after every ten years (Ongoma and Chen, 2017). Information from the interview with
the key informants and FGDs, it was clear that the intensity of temperature has been increasing
steadily (Figure 9). The findings of this study are in agreement with Kimani (2015) and Kosonei
et al. (2017) findings in the same area who reported that there has been a steady increase in
temperature in Baringo. According to Kosonei et al. (2017) results, the frequency of drought
incidences has increased in Marigat and is becoming a yearly hazard.
The results indicate there is an increase in temperature intensity. The respondents reported they
do understand the indicators they use to evaluate the change. However, this was difficult among
the elderly above 65 years. They are more adhered to the traditional customs that prevent them to
access to information on weather and how they can evaluate it and the high level of illiteracy.
“In the years from 2011 and 2012, this area has been receiving more rainfall but in the year 2013
to date, the amount of rainfall has decreased drastically which has led to many people to change
socio-economic activity. The community has experience severe drought, with some of them
selling their livestock at throw way price. Temperature has increased and rainfall amount has
decreased. In most occasions, we usually receive more rainfall between April and August, with
climate variability this has changed. For example for the years 2015, this area received less
rainfall.”
Page 55
40
According to the information obtained from the key informants, farmers currently are unable to
predict climatic change because the incidences of drought has increased.
Figure 10: Respondents perception on severity and frequency of drought and temperature
Several indicators were used to evaluate the change in temperature. The indicators were divided
into five categories as shown in figure 11. On average, 39% of the respondents mentioned an
increase in temperature was depicted by drying of rivers and decrease in rainfall amount, 34%
drying of rivers, 15% decrease in rainfall amount, and 3% loss of biodiversity (Figure 11). This
is important to farmers and beekeepers because temperature influences the quality of honey and
other activities in the ASALs. Temperature affects most of the activities in ASALs. The
respondents understanding of factors to evaluate the temperature was based on effects of
temperature on their daily socio-economic activities. Drying of rivers is associated with drought.
0
10
20
30
40
50
60
70
80
90
100
Increasing Decreasing Stable
Per
centa
ge
Drought severity and frequency Change in Temperature
Respondent perception on Temperature and drought severity
Page 56
41
Figure 11: Indicators used to evaluate change in Temperature.
34
3
15
39
0 5 10 15 20 25 30 35 40 45
Drying of rivers
Loss of biodiversity
Decrease in rainfall amount
Drying of rivers and decrease in rainfall
Number of Respondent
Indic
ators
Indegenous knowledge Indicators to evaluate change in temperature
Page 57
42
4.4 Relationship between rainfall variability and forage phenology
4.4.1 Plant species preferred by the bees
The respondents identified 19 plant species that the bees prefer (Table 11) which included trees,
shrubs, grass and farm crops. Information obtained from the FGDs and the key informant was
that immediately it rains the Acacia tortolis flowers sprout out immediately hence the bees
collect nectar for brood development. However, the respondents acknowledged that the bees
prefer collecting nectar from particular plant species. This is because of the adequate nectar,
pollen and the energy it contains (Eischen and Graham, 2008). The results imply the ability of
the local people to apprehend the different types of plant species that the bees prefer and their
flowering period. The findings are in line with Delaplane et al. (2010) and Teklay (2011) who
reported that local farmers are well informed in relation to the type of forage the bees prefer and
their flowering period. Furthermore, results were in accordance with another study by Mattu et
al. (2012) in Himalaya and Abou-Shaara (2014) in Egypt, who found out that bees have
preference on type of forage that they collect nectar and pollen and source of water.
The forage availability varied from one area to another and from one season to another. For
instance, the abundance of the Acacia mellifera and Acacia tortolis varied from lowland valleys
towards the hills. They are more abundant at valleys and less abundant on the hills (This is
illustrated in Plate 1). Acacia brevispa and Acacia reficiens are dominant plant species in Ratat.
This was different to Marigat where Acacia mellifera is dominant. Plant diversity affects the
quality of honey, which differs from one geographical area to another thus influencing the bee
population. Gichora et al. (2003), Kimitei, and Korir (2012) and Kimani (2015) acknowledged
the role of indigenous knowledge on forage preference by bees. However, with changing and
variation in weather, there is decline in plant species diversity in ASALs due to frequency of
droughts that have negative impacts on bee population and hence low honey production. This
was similarly reported by Wasonga et al. (2011) that, the abumdance of perrenial plants in
Baringo has decreased because of the decrease in rainfall that has led to drought escalation.
Page 58
43
Table 11: Ranking of the common preferred bee flora
Rank Scientific name Local name Frequency Status
1. Acacia mellifera Ng’orore 78 More abundant
2. Acacia tortolis Sesiet 73 More abundant
3. Croton dichogamus Kelelwet 46 More abundant
4. Acacia eliator Trionde 41 More abundant
5. Acacia reficiens Parsul 36 Abundant
6. Acacia brevispa Kornis 31 Abundant
7. Euphobia species Mutangari 26 Abundant
8. Balanites aegyptiaca Ng’oswe 25 Abundant
9. Acacia senegal Chemanga 19 Abundant
10. Combretum molle Kemel 15 Abundant
11. Mimusops kummel Lolowe 13 Abundant
12. Terminalia brownie Bromi/Koloswo 13 Abundant
13. Euclea divinorum Uswe 8 Medium
14 Boscia angustifolia Likwonde 5 Medium
15. Terminalia superba Noiwet 4 Medium
16. Cissus rotundiflora Rorowo 3 Medium
17 Olinia rocheatiana Chepchoboiwo 3 Medium
18 Grewia similis Sitewo 2 Medium
19 Zea mays Maize 2 Seasonal
Page 59
44
1 2
3
Plate 1: The abundance of flora decreasing towards the roadside (1), Euphorbia species most
preferred by bees (2), and poisonous plant with a long flowering duration (3).
Page 60
45
4.4.2 Flowering of the plants
4.4.2.1 Variation in flowering
Results in Table 12 show that, 99% of the respondents indicated that variation in weather affect
flowering and 96% indicated that there is change in flowering pattern in the past 5 years as a
result of rainfall variability (Table 12). There is evidence to suggest that variation in weather has
had major impacts on flowering of plants. The change in flowering is triggered with variation in
weather parameter especially temperature and rainfall. The unpredictable weather coupled with
increased sunlight intensity and the physicochemical parameters of soil affects natural resource
distribution and plants reproduction. A study by Von Holle et al. (2010) revealed that, flowering
of plants is triggered by environmental changes of the season which alters the phenophase of
plants. Different plants produce flowers at different season depending on the water availability
and the physicochemical characteristics of the soil (Riedinger et al., 2014). According to Liseki,
and Boniphace (2008) and Delaplane et al. (2010), seasonal variability in weather has led plants
to produce flowers late or even earlier and this determines specific activity in managing the
beehive in relation to variation in flowering, since farmers monitor the change in the season in
order to manage the bees and monitor their progress.
Table 12: Respondents’ perception on flowering of plants
Variable Frequency
Variation in weather in relation to flowering
Agreed
Do not Agree
99
1
Change in flowering in the past years
Change
No change
Do not know
96
3
1
n=100
Page 61
46
4.4.3.2 Seasonal variation in rainfall and plant phenology
The FGDs and key respondents reported that immediately it rains Acacia tortolis flowers sprout
out immediately and the bees collect nectar from the tree and use it as food for the brood. The
respondents reported that the bees do not make honey using the forage from Acacia tortolis.
Furthermore, there is a trade-off between duration of flowering and temperature, and it was
revealed that flowering continue for a long duration when rainfall is distributed throughout the
year and hence plenty of forage for bees. This was similar with Von Holle et al. (2010) results
who reported that, flowers have long duration during the cooler season in Florida. Majority of
the respondents who reported the decrease (70%) in the duration of flowers was significant
higher (p=0.00, χ2=110.16) (Table 13). This was due to the decrease in rainfall and prolonged
drought. Variation in weather alters the vital component of natural systems such as rainfall,
temperature and land cover this can facilitate competition among native and non-native species
(Jebiwott et al., 2016) with low potential for producing forage for bees limiting honey
production.
Table 13: Respondents perception of the relationship of rainfall variability and duration of
flowering
Duration of flowers Frequency χ2 P
Decreasing 70 110.16 0.00
Increasing 13
Stable 13
Did not know 4
n= 100
According to Ngaira (2005), the severity, frequency and magnitude of drought has increased in
Kenya from the year 2000. In some circumstances it is usually experienced yearly in dry areas of
Kenya and this has a major influence on vegetation cover (Kosonei et al., 2017) and plant
phenology (Davies et al., 2013). Because of water stress, plants will limit their physiological
process to cope with the changing condition.
Page 62
47
It was reported by FGD and Key informant that, immediately the rain season began the grass
species sprout and thus an increase in flower that bees prefer. It was revealed that the type of
forage the bees collect nectar and pollen from determines the quality and taste of honey.
According to the key informant at KARLO Marigat, the quality and taste of honey from Baringo
County varies from other honey in Kenya. This was because Baringo has a lot of diversity of
plant species that the bee visits. Some of the respondents reported that the honey made from
grass species has different sweet taste. In a study by Wasonga et al. (2011) in Baringo, it was
revealed that the sprouting of grass and their abundance have decreased drastically. Another
study in Marigat by Kosonei et al. (2017) found out that, there have been a decrease in grass
species and abundance of trees species in riparian zones. This was expressed because of decrease
in the amount of rainfall and increase in temperature.
The results in table 14 show that, 38.6% of the respondents reported that there is a decrease in
the quantity of flowers and the change was much significantly higher (P<0.00, χ2=30.50) and
only 18.8% of the respondents reporting that the change was very much. This result implies that
the erratic rainfall has led to plants to change their physiological process to adjust with the
condition. This was in agreement with Primack (1985), Stratton (1989) and Miranda et al. (2011)
whose results indicated that, decrease in rainfall that has led to bees collect nectar and pollen
from other plants whose nectar and pollen does not provide quality honey. In some
circumstances especially in Ratat and Kamung’eyi the bees opt in collecting nectar from
poisonous plants that have a long flowering duration.
Because of drought, the bees migrate to areas where there is nectar and they come back
immediately the season change especially when there is more nectar and pollen. This has
reduced the frequency of harvesting honey once or twice a year. For example, Balanites
aegyptiaca (Ng’oswe) flowers once per year and the flowers have a long duration. Plants have to
alter their metabolic activity in order to cope with water stress. According to (Goodwillie and
Ness, 2005) change in pollination mode leads to changing number of flowers produced by plant
reducing the amount of nectar and pollen available for the bees. Barrett et al. (1994) found out
that, pollination would influence the number of flowers and the longevity of the flowers display.
The respondents affirmed that the duration of flowers has changed because of the erratic rainfall.
This implies that the longer the duration of flowering, the higher the nectar and pollen is
Page 63
48
available for bees hence high honey production. However, some plants have a short life span as
coping strategy hence they have short flower duration and affect honey production.
Table 14: Change of the quantity of flowers
Extend of change Percentage χ2 P
Very much 18.8 30.500 0.00
Much 38.6
Minimal 15.6
Very minimal 27
n=100
4.4.3.3 The correlation of rainfall amount and plant phenology
There is positive and significant correlation between rainfall amount and quantity of flowers (r=
.423; N=100; P=0.00) (Table 15). The survey results revealed that with decrease in rainfall
amount, there is decrease in quantity of flowers. This was in agreement with the study by Elsa et
al. (2007) who reported that, plant phenology depends more on variation in precipitation in the
tropics than variation in temperature. With the erratic cyclone rainfall, bee forage becomes
scarce and therefore this influences the activity of the bees.
Table 15: Correlation of change in rainfall amount and change in quantity of flowers
Change in the quantity of
flower
Variation in rainfall amount Correlation coefficient
Sig.(2 tailed)
.423**
.000
**Correlation is significant at .001 level (2-tailed)
There is evidence to suggest that, the erratic cyclonic rainfall has led to variation in flowering
thus affecting honey production. As the distance from the beehive to nearby forage increases,
honey production decreases. The bees will consume more honey for daily activity and hence the
Page 64
49
available honey will be low. According to (Ricketts et al., 2008), variation in pollination of
plants is because of variation of weather thus leading to variation in flowering of plants.
Therefore, the author postulated that, this has led to flowering to decrease or increase with
distance from the beehive. According to Eischen, and Graham (2008), the bees need more energy
to fly for a long distance thus, they will have to fuel their wings by consuming more pollen
because it has higher energy content. This decreases the amount of pollen and nectar available
for honey production.
Some species are able to alter their phenology in order to respond to change in weather.
Therefore, bee forage decrease because of seasonal variation in climate (Kebede and Lemma,
2007). In a study by Tessega (2009), Haftom et al. (2013) and Yetim (2015) in Ethiopia, it was
revealed that the seasonal variation in flowering affects honey production. According to Bista,
and Shivakoti (2001), seasonal variation plant phenology is because of the seasonal fluctuation
of climatic conditions and topographic characteristics of the area. Furthermore, the soil
characteristics vary in relation to topography, thus plants will blossom seasonally causing
variation in the bee production and the well-being of various organisms inherent in such
ecosystems (Gao et al., 2014).
It was depicted that, the shortage for forage for bees starts from November through December to
March. During the month of January to March, there is critical shortage of forage for bees due to
dry conditions that prevalent in ASALs areas. This was attributed to low rainfall that is received
during the period between January to March. It is evident that plant species increase their fitness
by flowering at different time in an ecosystem (Gordo and Sanz, 2010). The low rainfall amount
and temperature affect phylogenetic of plants and plant flowering phenology especially the
number of flowers and timing of flowers development (Crimmins et al., 2010). Robbirt et al.
(2011) reported that, there is a significant relationship between peak for flowering and
temperature.
Page 65
50
4.5 Effects of temperature and rainfall variability on honey yield
4.5.1 Honey production in Marigat and Ratat.
They results indicated that all (100%) the bee farmers practice migratory beekeeping. Based on
their experience in beekeeping, they place the beehive in an ideal position for the bee to inhabit
along the migratory bee routes. Bees are some of the organisms that follow a migratory pattern.
he and hence famers do place more beehives and they clean the old beehives during the
swarming season. This increases the chances of having beehives inhabited by the bees. Some
respondents reported that, currently there has been decrease in chances of the bees settling in the
beehives as compared to the past years. The possibility of the bees to inhabit a beehive has
decreased and sometimes this takes long than usual because of the unfavourable condition.
The results on Table 16 shows that, 85% of the respondents affirmed there is change in the
migratory patterns in the past 5 years with only 84% of the respondents agreeing that the change
in the migration pattern is because of change in weather. Owing to the variation in weather, the
respondents asserted that the bees migrate from lowlands to and from highlands (Tugen hills).
They believe that variation in climate and plant phenology has a significant influence on
migration of bees. It is evident that the bees migrate to areas with adequate nectar, pollen and
water. As drought condition increase, the bees become more vulnerable to this impact.
It was noted from the information from FGDs and key informants that the swarms of bees have
reduced in number and when they migrate to highlands, the number of bee colony swarming
back to lowland has decreased. There is probability that the bees prefer the highland since there
is decrease in the amount of flowers in the lowland. Similar observation were reported by
Malisa, and Yanda (2016) in Tanzania that bees prefer areas with high amount of nectar and
pollen on flowering plants. According to Yetim (2015), migration of bees is influenced by the
availability of pollen and nectar. The results of this study was also in agreement with those of
Sharma et al. (2013) who reported that bees have a migration pattern and as season changes and
farmers objectively set their beehive during the migration period for the bees to occupy them
during the migration period.
Page 66
51
Table 16: Migration pattern of the bees
Variable Frequency
Migratory beeping
Agreed
100
Change in Migration pattern
There has been a change
No change
85
15
Variation in weather has influenced migration
Agreed
Did not Agree
84
15
n=100
4.5.2 The relationship between rainfall variability and honey yield
Results on table 17b shows that, majority (60%) of the respondents harvest honey twice a year,
25% harvest once, 14% harvest three times and 1% harvest more than once per year. This can be
attributed to the rainfall patterms in the area. This area mostly receive a bimodal rainfall with
peak varying yearly. However, the farmers acknowledged that the peak for honey harvesting
corelates with rainfall availability. The peak for honey production is on June and from August to
September. However, majority of the respondents said they do not keep records of the honey
they harvest (95%). In a study by Teklay (2011) in Ethiopia, the author found out that the peak
for honey harvesting is related to high flow of pollen for the bees. Another study by Yetim
(2015) revealed that, a low proportion of bee farmers harvest more than thrice per year.
Page 67
52
Table 17: Trend of honey yield
Variable Frequency
Annual Honey harvest
Once
Twice
Thrice
More than 3 times
25
60
14
1
Trend in honey production
Increasing
Decreasing
Stable
Varies yearly
19
62
19
12
n=100
Rainfall variability has a moderately strong positive and significant effect on honey yield
(r=3.69; P<0.00; N=100). As Rainfall amount decrease, there is a decrease in honey production.
A larger proportion (62%) of the respondents reported that honey production has decreased
(χ2=72.92; P=0.00) (Table 17). Therefore, there is evidence to suggest that the erratic rainfall
aggravates stress on honeybees leading to low honey production. This implies the limited amount
of rainfall amount coupled with the demand for water by the plants and the bees to carry out their
physiological process and for honey production has led to low honey production.
Table 18: Correlation analysis of the relationship between Rainfall amount and honey yield
Trend in honey
yield
Variation in rainfall amount Correlation coefficient
Sig.(2 tailed)
.369**
.000
**Correlation is significant at 0.01 level (2-tailed)
Page 68
53
The seasonal rainfall duration has a moderately strong positive and significant effect on honey
yield in the past 5 years (r=.460; P<0.00; N=100). This implies that honey production is
dependent on the duration of the rainfall. As the rainfall duration increases, honey yield
increases and vise versa. In a study conducted by Malisa, and Yanda (2016) in Tanzania, the
author found out that decrease in rainfall has led to low honey yield. However, the author also
articulated that, honey productiuon is high at moderate rainfall.
Table 19 Correlation of Rainfall duration and trend in honey yield
Trend in honey yield
Variation in rainfall duration Correlation coefficient
Sig.(2 tailed)
.460**
.000
**Correlation is significant at 0.01 level (2-tailed)
Honey bees need water to cool their hive and for honey production (Woyciechowski, 2007;
Kovac et al., 2010). However, in Marigat and Ratat, water is deficient and hence during dry
season when there is water scarcity, the bees abscond the beehives thus a decrease in honey
production. The respondents alleged that the trend of the bees absconding from the beehive has
increased. This was as a result of factors associated with weather on the bees. This was similarly
reported by Kimitei, and Korir (2012) in Kibwezi where bees abscond their beehive because of
insufficient water because bees collect water from the nearby source.
On average, 59% of the respondents reported water is scarce, 26% less available and 18%
available. Forty four (44%) of the respondents stated that the rivers are the main source of water
for the bees, 26% streams, 12% water pans, both water pans and rivers 12% and only 3%
reported they collect water from borehole (Table 20). In Endao village, they were several
borehole where the bees collect water. Besides, drought frequency in Marigat has incraesed in
the past years (Kosonei et al., 2017). The stream flow, river flow and refilling of the waterpan
depend on rainfall which is contary in relation to the receive eratic rainfall receive in this area.
The results implies that their is an imbalance between water supply of water and demand of the
water in the ecosystem. The exerberated drought cuopled with increased intensity of temperature
has led to escalation of this imbalance. Therefore the water is not sufficient to meet the demand.
Page 69
54
Table 20: Status and source of water
Source of water
Status of water (n=100)
Scarce Less available Available
Water pans
Streams
Rivers
Water pans and rivers
Other
6
12
29
1
8
4
15
5
0
2
2
2
10
2
2
4.6 The relationship of Honeybee pest inspection and variation in climate
4.6.1 Inspection of the beehives
In the survey results, 93% of the respondents they inspected their beehive both internal and
external (Table 21). However, only 48% of the respondents do visit their beehive frequently.
These is purposively to check the status of the hive and to clean the beehive. Also, they regularly
check the beehive if the swarm of bees have inhabited. It was reported that 5% of the
respondents only do internal inspection before the bee colony inhabit the beehive. However,
according to Kebede, and Lemma (2007) and Kinati (2010) indicated that, the majority of the
local farmers had limited knowledge about internal inspection of beehives in Ethiopia. These
implied that majority of the farmers observe the beehive externally without thorough inspecting
internally and this can be attributed to their illiteracy level.
Table 21: Beehive inspection
Type of inspection (%) (n=100)
Frequency of inspection
External and internal
inspection
Internal
inspection
External
inspection
Rarely
Frequently
Sometimes
12
35
46
0
3
2
0
2
0
Page 70
55
4.6.2 Honeybee pests
Majority of the bee respondents (54%) reported that honey badger as a serious pest causing
major loss to beehives. Honey badger was ranked the first followed by Ants (Table 22). Honey
badgers are the most destructive of all pest reported because they do climb the tree and drop the
whole beehive on the ground, thus destroying their whole beehive. The results are similar with
the findings by Maurice (2004) and Muli et al. (2015), who reported that honey badger is a threat
to beekeeping in Kenya. The incidences of honey badger in Baringo were also reported by
Gichora et al. (2003) and Berem (2015).
Table 22: Ranking of the major bee pest and their status
Ranks Major pest Frequency Status of the pest χ2 P
Increase (f) Decrease (f) Stable (f)
1st Honey Badger 54 70 5 20 114.00 .000
2nd Ants 38 66 3 18 94.32 .000
3rd Wasps 31 18 19 38 10.16 .017
4th Lizard 26 13 28 34 9.36 .025
5th Rats 17 32 20 15 9.52 .023
6th Others 12 25 3 6 106.16 .000
According to Gichora et al. (2003), the incidences of honey badger are common in remote areas.
For instance, they were few cases honey badger reported attacking the beehive nearby to the
homestead and even along the road. However, Masehela (2017) reported that, the incidences of
honey badger are more when a beehive is located in forest habitats where the honey badger
inhabits. In Kamung’eyi village, the incidences of honey badger were low since most of the trees
in the area are tall and the honey badger cannot climb to the top. However, ants were the major
pest that is prevalent in the area. According to Teklu (2016), ants destroy the brood reducing
honey production and leading to the bees abscond the beehive because they are nuisance and
they feed on both dead and alive bees. Information from the key informant was that majority of
the farmers in Kamung’eyi place their beehives indirect contact with the tree, which has led to
high infestation by ants. The impacts of ants vary in relation to the type of beehive and type bee
Page 71
56
species (FAO, 2005). Other pest reported includes; snakes, bee eating birds, tree squirrel, and
spider.
Lizards inhabit near the beehive and feed on the bees, and sometimes they find a way into the
beehive. Bee-eater birds feed on foraging bees and the rats create their house nearby the beehive
that has led to absconding of the bee. However, snakes were new cases as bee pest in Baringo
County. They were common in Arabal village as the major bee pest. Tesfay (2014) in a study in
Ethiopia and Kajobe et al. (2016) in Uganda found out snake as pest but the incidences were
minimal in Uganda. Low honey production can therefore be attributed to climate variability and
increase in pest infestation as well. This was in agreement with Malisa, and Yanda (2016)
findings in Tanzania. Despite the changing season that favour the pest prevalence. Majority of
the respondents reported an increase (70%) in the incidences of honey badger (P=0.00,
χ2=114.00) and ants (P=0.00, χ2=94.320) (Table 22). This as a results of the condition favouring
the pest prevalence has prolonged over the years. Kosonei et al. (2017) reported Marigat
sometimes experince drought yearly.
Prevalence of pest has a negative significant effect on honey yield (r=.-264; P<0.001; N=100)
(Table 23). This implies that, with an increase in the incidences of pest, the farmers incurs a lot
of loss since honey yield will decrease. This pest incidence increase with an increase in drought
perid. This can be attributed to the flow of nectar which is high at the beginning of dry period.
Therefore, the flow of honey is also high leading to high incidences of pest in dry period as they
feed on honey. The resopondent alledged that, sometimes the bees abscond the beehive when
they face the threats from the pest. Munyuli et al. (2016) had similar results with this study in
Democratic Republic of Congo. Furthermore, according to Harrison, and Fewell (2002) study,
hive activity are high at high temperature leading to more honey production when temperature
are high. According to Mcmenamin et al. (2017) study on the impact of hive type on the
behaviour and health of honey bee colonies (Apis mellifera) in Kenya, majority of the bees
abscond their beehive during the hot and dry period. Furthermore, the author found the pest
infestation led to the bees absconding their beehive.
Page 72
57
Table 23: Correlation analysis of the relationship between prevalence of pest and honey yield
Honey yield
Pest prevalence Correlation coefficient
Sig.(2 tailed)
-.264**
.001
Correlation is significant at level 0.01 (2 tailed)
Variation in climate has led to organism to thrive and the condtion may be favourable for some
organism while others they sucumb to the changing environmrntal condtion. Analysis of the
survey data indicated that 65% of the respondents reported that the incidences of pest infestaion
are high during the dry period and 23% reported during the wet season (Figure 12). Information
from the key informats was that there is high incidences for honey badger are more during dry
season.
Figure 12: Pest seasonal prevalence
0
10
20
30
40
50
60
70
Dry season Wet season Dry and wet season Other
Fre
quen
cy
Season
Pest prevalence season
Page 73
58
The results imply drought as a factor that has led to high pest infestation. There is a possibility
that with the limited available food and escalation of drought incidences, the organism ought to
cope with the situation. Therefore, the bees are more vulnerable because during the drought
season there is high flow of nectar/pollen and they ought to make more honey which is food for
some pest. However, some pest like the bird eating bees, lizards and snakes feed on the bees.
This was similar to Chemurot et al. (2016) and Munyuli et al. (2016) results who reported the
prevalence of Varroa mites infestation was high during the dry period than in the wet season in
Uganda since this condition was favourable for them to blossom. However, according to Teklu
(2016), the author reported high pest infestation during the rainy season in Ethopia because of
the flow of honey. It was depicted that, farmers do hang their beehive on a piece of wire to
reduce the incidences of honey badger. This is illustrated in plate 2. They also smear grease on
the wire to reduce incidences of ants.
Page 74
59
1
2
Plate 2: Traditional log hive made with wires (1) and traditional log hive hanged on a tree (2).
Page 75
60
CHAPTER FIVE
SUMMARY OF FINDINGS
CONCLUSION AND RECOMMENDATIONS
5.1 Conclusion
The study investigated the impacts of climate variability on honey production. This involved
assessing beekeepers’ farmer perception on variation in rainfall and temperature in relation to
honey production. The results indicated there has been a variation in rainfall and temperature that
has led to increase in severity and magnitude of drought. The rainfall has decreased and the
intensity of temperature has increased steadily.
Women participation in beekeeping was low with men dominating and most of the respondents
were farmers. These respondents were knowledgeable about the relationship between climate
variability and honey production. Variation in rainfall has had a significant effect on honey
production by affecting plant phenology and water availability for bees. Furthermore, increase in
frequency of drought has led to high incidences of pest. With regard to honey production,
majority of the farmers reported the yield has decreased. They associated with decreasing rainfall
amount and duration, increase pest incidences, decrease forage for bees and water scarcity.
Therefore, there is evidence to suggest variation in climate has had negative impacts on honey
production in Baringo.
5.2 Recommendations
i) There is need to disseminate weather information to the local community and educate them
on the need to plan for the changing season.
ii) Rehabilitation of ASALs by planting flora that have long flower duration, alternate
seasonally, preferred by bees and are drought resistance.
iii) The local community needs to be enlightened on the need to form self-help group. These will
provide them a platform to access more incentives and be able to share more information in
relation to honey yield and to put more emphasis on providing food and water to bees during
dry season.
Page 76
61
iv) There is need for regular inspection of the beehive to enable management of the beehive
hence reducing the incidences of pest infestation. Since the incidences of pest infestation are
increasing, the beekeepers need to seek for extension services.
5.3 Further research
1. The study has produced a relevant information on climate variability and honey production.
The important area research study is on relative abundance of flora preferred by bees and the
quantity of pollen and nectar the plant produce.
2. Establish the actual quantity of honey yield over a period.
Page 77
62
REFERENCES
Abou-Shaara, H. (2014). The foraging behaviour of honey bees, Apis mellifera: a review.
Veterinarni Medicina, 59(1).
Adjare, S. O. (1990). Beekeeping in Africa. Food and Agriculture Organization of the United
Nations (FAO) Agricultural Service Bulletin 68/6. Rome, Italy: FAO.
Angelsen, A., and Wunder, S. (2003). Exploring the Forest-Poverty Link, Key Concepts, Issues
and Research Implications. CIFOR Paper No. 40. Indonesia, 58.
Arbetman, M. P., Meeus, I., Morales, C. L., Aizen, M. A., and Smagghe, G. (2013). Alien
parasite hitchhikes to Patagonia on invasive bumblebee. Biological invasions, 15(3), 489-
494.
Asseng, S., Foster, I., and Turner, N. C. (2011). The impact of temperature variability on wheat
yields. Global Change Biology, 17(2), 997-1012.
Ayantunde, A. A., Leeuw, J. D., Turner, M. D., and Said, M. (2011). Challenges of assessing the
sustainability of (agro)-pastoral systems. Livestock Science, 139(1-2), 30-43. Retrieved
from http://linkinghub.elsevier.com/retrieve/pii/S1871141311001028
Barrett, R., Berry, M., Chan, T. F., Demmel, J., Donato, J., Dongarra, J., Eijkhout, V., Pozo, R.,
Romine, C., and Van der Vorst, H. (1994). Templates for the solution of linear systems:
building blocks for iterative methods: SIAM.
Baylis, K., Nogueira, L., and Pace, K. (2010). Food import refusals: Evidence from the European
Union. American Journal of Agricultural Economics, 93(2), 566-572.
Bekele, D. ( 2015). Beekeeping Practices, Factors Affecting Production, Quality Of Honey And
Beeswax In Bale Zone, Oromia Region. ( Msc Thesis), Haramaya University.
Below , T., Artner, A., Siebert, R., and Sieber, S. (2010). Micro-level practices to adapt to
climate change for African small-scale farmers: a review of selected literature. IFPRI-
Discussion Papers(953).
Berem, R. M. (2015). Economic Analysis of Honey Production and Marketing in Baringo
County, Kenya: An Application of the Institutional Analysis and Development
Framework. Natural Sciences Research, 5(10). Retrieved from www.iiste.org
Betsy , V. H., Yun, W., and David, N. (2010). Climatic Variability Leads to Later Seasonal
Flowering of Floridian Plants. Pone, 5(7). doi: e11500.
doi:10.1371/journal.pone.0011500
Page 78
63
Bista, S., and Shivakoti, G. P. (2001). Honeybee Flora at Kabre, Dolakha District. Nepal
Agriculture Research Journal, 18-25.
Bohra-Mishra, P., Oppenheimer, M., and Hsiang, S. M. (2014). Nonlinear permanent migration
response to climatic variations but minimal response to disasters. Proceedings of the
National Academy of Sciences, 111(27), 9780–9785.
Boko, M. I., Niang, A., Nyong, C., Vogel, A., Githeko, M., Medany, B., and Yanda, P. (2007).
Africa climate change 2007: Impacts, adaptation and vulnerability. UK: Cambridge
University Press.
Caroll, T. (2006). A beginner’s guide to beekeeping in Kenya. Nairobi, Kenya: Legacy Books
Press.
Cassman, K. G. (1999). Ecological intensification of cereal production systems: yield potential,
soil quality, and precision agriculture. Proceedings of the National Academy of Sciences,
96(11), 5952-5959.
Chemurot, M., Akol, A. M., Masembe, C., De Smet, L., Descamps, T., and de Graaf, D. C.
(2016). Factors influencing the prevalence and infestation levels of Varroa destructor in
honeybee colonies in two highland agro-ecological zones of Uganda. Experimental and
Applied Acarology, 68(4), 497-508.
Crailsheim, K. (1992). The flow of jelly within a honeybee colony. Journal of comparative
physiology B, 162(8), 681-689.
Crewe, R. M., Hepburn, H. R., and Moritz, R. F. A. (1994). Morphometric analysis of two
southern African races of honeybee. Apidologie, 25, 61-70.
Crimmins, T. M., Crimmins, M. A., and David Bertelsen, C. (2010). Complex responses to
climate drivers in onset of spring flowering across a semi‐arid elevation gradient. Journal
of Ecology, 98(5), 1042-1051.
Davies, T. J., Wolkovich, E. M., Kraft, N. J., Salamin, N., Allen, J. M., Ault, T. R., Betancourt,
J. L., Bolmgren, K., Cleland, E. E., and Cook, B. I. (2013). Phylogenetic conservatism in
plant phenology. Journal of Ecology, 101(6), 1520-1530.
Davis, P., and Ali, S. (2014). Exploring Local Perceptions of Climate Change Impact and
Adaptation in Rural Bangladesh. IFPRI Discussion Paper 01322. Washington, DC:
International Food Policy Research Institute.
Page 79
64
Delaplane, K. S., Thomas, P. A., and McLaurin, W. J. (2010). Bee pollination of Georgia crop
plants.
Dong, F., and Jensen, H. H. (2004). The challenge of conforming to sanitary and phytosanitary
measures for China's agricultural exports.
Donohue, R., Roderick, M., and McVicar, T. R. (2006). On the importance of including
vegetation dynamics in Budyko? s hydrological model. Hydrology and Earth System
Sciences Discussions, 3(4), 1517-1551.
Eischen, F. A., and Graham, R. H. (2008). Feeding overwintering honey bee colonies infected
with Nosema ceranae. Paper presented at the Proceedings of the American Bee Research
Conference, Am. Bee J.
Elsa, E. C., Chuine, I., Menzel, A., Mooney, H. A., and Schwartz, M. D. (2007). Shifting plant
phenology in response to global change. TRENDS in Ecology and Evolution, 22(7).
FAO. (2005). Honey bee diseases and pests: a practical guide. Agricultural and food
engineering technical report. Retrieved from Rome, Itally:
http://www.fao.org/icatalog/inter-e.htm
FAO. (2009). Bees and their role in forest livelihoods (Non-wood forest products) (Vol. 19).
Rome, Italy: FAO.
FAO. (2012). Beekeeping and Sustainable Livelihoods.FAO Diversification booklet number 1 (2
ed.). Rome, Italy: FAO.
Freestone, P. P. E., Sandrini, S. M., Haigh, R. D., and Lyte, M. (2008). Microbial endocrinology:
how stress influences susceptibility to infection. Trends in microbiology, 16(2), 55-64.
Gallai, N., Salles, J.-M., Settele, J., and Vaissière, B. E. (2009). Economic valuation of the
vulnerability of world agriculture confronted with pollinator decline. Ecological
economics, 68(3), 810-821.
Gao, X., Wu, P., Zhao, X., Wang, J., and Shi, Y. (2014). Effects of land use on soil moisture
variation in a semiarid catchment: implications for land and agricultural water
management. Degradation & Developmen, 25, 163–172. doi:10.1002/ldr.1156
Garrett, K. A., Dendy, S. P., Frank, E. E., Rouse, M. N., and Travers, S. E. (2006). Climate
change effects on plant disease: genomes to ecosystems. Annu Rev Phytopathol, 44, 489-
509.
Page 80
65
Gemechis, L., K. W. (2012). Apiculture research achievements in Ethiopia, Oromia Agricultural
Research Institute,Holeta Bee Research Center. Holeta, Ethiopia.
Ghini , R., and Morandi , M. A. B. (2006). Biotic and abiotic factors associated with soil
suppressiveness to Rhizoctonia solani. Scientia Agricola, 63(2), 153-160.
Gichora, M. (2003). Towards realization of Kenya's full beekeeping potential: A case study of
Baringo district: Cuvillier Göttingen.
Gichora, M., Vlek, P. L., Denich, M., Martius, C., and van de Giesen, N. (2003). Ecology and
Development Series No. 6, 2003.
Gichora, M., Wittmann, D., and Odulaja, A. (2001). Beekeeping in Baringo District, Kenya:
Which way Forward for Research and Extension? Paper presented at the Proceedings of
the 37th International Apicultural Congress, 28 October, Durban, South Africa.
Gikungu, M. (2006). Bee diversity and some aspects of their ecological interactions with plants
in a successional tropical community. (PhD thesis), Bonn University, Geermany.
GoK. (2002). Water act.: Government of Kenya.
GoK. (2010a). National Beekeeping Policy. Nairobi: Goverment of Kenya.
GoK. (2010b). National Climate Change Response Strategy. Nairobi, Kenya: Ministry of
Environment and Mineral Resources.
GoK. (2011). Vision 2030 Development Strategy Northern Kenya and other Arid Lands:
Government of Kenya.
GoK. (2013). First County Integrated Development Plan 2013-2017. Kenya: County
Government of Baringo.
GoK. (2014). Annual County Integrated Development Plan 2015-2016. . Kenya: County
Government of Baringo.
GoK. (2017). Drought situation and early warning phase classification. National Drought
Management Authority drought early warning bulleting. Nairobi, Kenya: Government
Printing Press.
Goodwillie, C., and Ness, J. M. (2005). Correlated evolution in floral morphology and the timing
of self-compatibility in Leptosiphon jepsonii (Polemoniaceae). International Journal of
Plant Sciences, 166(5), 741-751.
Gordo, O., and Sanz, J. J. (2010). Impact of climate change on plant phenology in Mediterranean
ecosystems. Global Change Biology, 16(3), 1082-1106.
Page 81
66
Goulson , D., and Hughes , W. O. (2015). Mitigating the anthropogenic spread of bee parasites to
protect wild pollinators. Biological Conservation, 191, 10-19.
Graystock, P., Yates, K., Darvill, B., Goulson, D., and Hughes, W. H. (2013). Emerging dangers:
deadly effects of an emergent parasite in a new pollinator host. Journal of invertebrate
pathology, 114(2), 114-119.
Grundel, R., Jean, R. P., Frohnapple, K. J., Glowacki, G. A., Scott, P. E., and Pavlovic, N. B.
(2010). Floral and nesting resources, habitat structure, and fire influence bee distribution
across an open‐forest gradient. Ecological applications, 20(6), 1678-1692.
Gunderson , L. H. (2000). Ecological resilience—in theory and application. Annual review of
ecology and systematics, 31(1), 425-439.
Haftom, G., Tesfay, Z., Murutse, G., and Estifanos, A. (2013). Seasonal honeybee forage
availability, swarming, absconding and honey harvesting in Debrekidan and Begasheka
Watersheds of Tigray, Northern Ethiopia. Livestock Research for Rural Development, 25.
Retrieved from www.lrrd.org/lrrd25/4/haft25061.htm
Hansen, J. R., Ruedy, M., and Sato, K. L. (2006). NASA Goddard Institute for Space Studies and
Columbia University Earth Institute. New York, USA.
Hansen., A. (2011). Communication, media and environment: Towards reconnecting research
on the production, content and social implications in environmental communication.
London, United Kingdom: SAGE publisher.
Harrison, J. F., and Fewell, J. H. (2002). Environmental and genetic influences on flight
metabolic rate in the honey bee, Apis mellifera. Comparative Biochemistry and
Physiology Part A: Molecular & Integrative Physiology, 133(2), 323-333.
Hegland , S. J., Nielsen , A., Lázaro , A., Bjerknes , A. L., and Totland , Ø. (2009). How does
climate warming affect plant‐pollinator interactions? Ecology letters, 12(2), 184-195.
Heinrich, B. (1985). The social physiology of temperature regulation in honeybees. In:
Experimental Behavioral Ecology and Sociobiology. Sinauer, Sunderland, Mass.
Henry, M., Béguin, M., Requier, F., Rollin, O., Odoux, J.-F., Aupinel, P., Aptel, J.,
Tchamitchian, S., and Decourtye, A. (2012). A common pesticide decreases
foragingsuccess and survival in honeybees. Science, 336, 348–350.
Page 82
67
Herror, M., Ringler, C., van de Steeg, J., Thorton, P., Zhu, T., and Brayan, E., et al. (2010).
Climate variability and climate change and their impacts on Kenya Agricultural sector.
Nairobi: International Livestock Research Institute.
Hulme, M., Doherty, R., Ngara, T., New, M., and Lister, D. (2001). African climate change:
1900 – 2100. Climate Research, 17, 145-168.
Inouye, D. (2008). Effects of climate change on phenology, frost damage, and floral abundance
of montane wildflowers. Ecology, 89, 353-362.
IPCC. (2001). Impacts, Adaptation and Vulnerability–Contribution of working group II to the
third assessment report of the ipcc. fttp://www. ipcc. ch> Acesso em, 5, 2006.
IPCC. (2007). Climate change 2007: synthesis report. Contribution of Working Groups I, II and
III to the fourth assessment report of the Intergovernmental Panel on Climate Change.
Intergovernmental Panel on Climate Change, 1.
IPCC. (2014). Climate change 2014: impacts, adaptation, and vulnerability-Part B: regional
aspects-Contribution of Working Group II to the Fifth Assessment Report of the
Intergovernmental Panel on Climate Change.
Irmak, S., Kabenge, I., Skaggs, K. E., and Mutiibwa, D. (2012). Trend and magnitude of changes
in climate variables and reference evapotranspiration over 116-yrperiod in the Platte
River Basin, Central Nebraska-USA. Hydrology, 420–421, 228–244.
Jebiwott, A., Ogendi, G. M., Makindi, S. M., and Esilaba, M. O. (2016). Drivers of Forest Cover
Change and Indicators of Climate Change in Katimok Forest Reserve, Kenya. Imperial
Journal of Interdisciplinary Research (IJIR), 2(11).
Kajobe , R., Kato, E. K., Otim, S. A., Kasangaki, P., and Abila, P. P. (2016). The status of
honeybee pests in Uganda. Bulletin of Animal Health and Production in Africa, 64(1),
105-117.
Karuppaiah, V., and Sujayanad, G. K. (2012). Impact of Climate Change on Population
Dynamics of Insect Pests. World Journal of Agricultural Sciences, 8(3), 240-246.
Keane, R. E., Parsons, R. A., and Hessburg, P. F. (2002). Estimating historical range and
variation of landscape patch dynamics: limitations of the simulation approach. Ecological
Modelling, 151(1), 29-49.
Page 83
68
Kebede, T., and Lemma, T. (2007). Study of honey production system in Adami Tulu Jido
Kombolcha district in mid rift valley of Ethiopia. Livestock Research for Rural
Development, 19, 11.
Kimani, E. W. (2015). Climate Change Adaptation Strategies Among Agro-pastrolists in
Baringo County,Kenya. (PhD), Egerton University.
Kimitei, R. K., and Korir, B. K. (2012). Indigenous Beekeeping for Sustainable Beekeeping
Development: A Case Study in Kibwezi District, Kenya. Paper presented at the
NATIONAL COUNCIL FOR SCIENCE AND TECHNOLOGY, KICC.
Kinati, C. (2010). Honey Production, Marketing System and Quality Assessment in Gomma
Woreda, South Western Ethiopia.
Kirsten, S. T., Yves Le Conte, E., R., and Jr., P. (2015). Age matters: pheromone profiles of
larvae differentially influence foraging behaviour in the honeybee, Apis mellifera. Animal
Behaviour, 99, 1-8.
Klein, A.-M., Vaissiere, B. E., Cane, J. H., Steffan-Dewenter, I., Cunningham, S. A., Kremen,
C., and Tscharntke, T. (2006). Importance of pollinators in changing landscapes for
world crops. Proceedings of the royal society B: biological sciences, 274(1608), 303-313.
Kosonei, R. C., Abuom, O., Bosire, E., and Huho, J. (2017). Effects of drought dynamics on
vegetation cover in Marigat Sub-county, Baringo County, Kenya. International Journal
of Scientific and Research Publications, 7(5).
Kovac, H., Anton, S., and Sigurd, S. (2010). Thermoregulation of water foraging honeybees—
Balancing of endothermic activity with radiative heat gain and functional requirements.
Insect Physiology, 56, 1834–1845.
Kushnir, Y., and Wallace, J. M. (1989). Low-frequency variability in the northern hemisphere
winter: geographical distribution, structure and time-scale dependence. Journal of the
Atmospheric Sciences, 46(20), 3122-3143.
Le Conte, Y., and Navajas, M. (2008). Climate change: impact on honey bee populations and
diseases. Rev Sci Tech-Office International des Epizooties, 27, 499-510.
Lee, K. V., Steinhauer, N., Rennich, K., Wilson, M. E., Tarpy, D. R., Caron, D. M., Rose, R.,
Delaplane, K. S., Baylis, K., Lengerich, E. J., Pettis, J., Skinner, J. A., Wilkes, J. T.,
Sagili, R., and vanEngelsdorp, D. (2015). A national survey of managed honey bee 2013–
2014 annual colony losses. Apidologie, 46(3), 292-305.
Page 84
69
Liseki, S., and Boniphace , T. (2008). Honeybee colony development and the flowering calendar.
Journal of Bees for Development, 32, 89.
Lobell , D. B., Schlenker, W., and Costa-Roberts, J. (2011). Climate trends and global crop
production since 1980. Science, 333(6042), 616-620.
Luo, Q. (2011). Temperature thresholds and crop production: a review. Climatic Change, 109(3-
4), 583-598.
Malisa, G., and Yanda, P. (2016). Impacts of climate variability and change on beekeeping
productivity. Bulletin of Animal Health and Production in Africa, 64(1), 49-55.
Mango, L. M., Melesse, A. M., McClain, M. E., Gann, D., and Setegn, S. (2011). Land use and
climate change impacts on the hydrology of the upper Mara River Basin, Kenya: results
of a modeling study to support better resource management. Hydrology and Earth System
Sciences, 15(7), 2245.
Maracchi, G. O. (2005). Impacts of presentvand future climate variability on agriculture and
forestry in the regions: Europe.
Marieke, M., Henk-van, B., Leen-van, t. L., Jaap, K., and Jan-va-de, W. (2005.). Bee products
properties, processing and marketing (First ed.). Netherlands: Netherlands Expertise
Centre for (sub)Tropical Apicultural Resources.
Masehela, T. S. (2017). An assessment of different beekeeping practices in South Africa based on
their needs (bee forage use), services (pollination services) and threats (hive theft and
vandalism). Stellenbosch: Stellenbosch University.
Mattu, V. K., Raj, H., and Thakur, M. L. (2012). Foraging behavior of honeybees on apple crop
and its variation with altitude in Shimla hills of western Himalaya. International Journal
of Science and Nature, 3, 296–301.
Maurice, S. (2004). Lessons from the Equator Initiative: Honey Care Africa’s Beekeeping in
Rural Kenya: Centre for Community Based Resource Management, Natural Resources
Institute, University of Manitoba, Winnipeg.
Mcmenamin, A., Fiona, M., Maryann, F., Joseph, K., Bernard, M., Tracey, B., Harland, P.,
Baldwyn, T., Daniel, M., James, T., Christina, G., and Elliud, M. (2017). The impact of
hive type on the behavior and health of honey bee colonies (Apis mellifera ) in Kenya.
Apidologie. doi:10.1007/s13592-017-0515-5
Page 85
70
McMichael, A. (2013). Globalization, climate change, and human health. N Engl Med, 368,
1335–1343.
McVicar, T. R., Roderick, M. L., Donohue, R. J., Li, L. T., Van Niel, T. G., Thomas, A., Grieser,
J., Jhajharia, D., Himri, Y., Mahowald, N. M., Mescherskaya, A. V., Kruger, A. C.,
Rehman, S., and Dinpashoh, Y. (2012). Global review and synthesis of trends in
observed.
Mijatović, D., Van Oudenhoven, F., Eyzaguirre, P., and Hodgkin, T. (2013). The role of
agricultural biodiversity in strengthening resilience to climate change: towards an
analytical framework. International journal of agricultural sustainability, 11(2), 95-107.
Miranda, J. d. D., Armas, C., Padilla, F., and Pugnaire, F. (2011). Climatic change and rainfall
patterns: effects on semi-arid plant communities of the Iberian Southeast. Journal of Arid
Environments, 75(12), 1302-1309.
Muli, E. M., Kilonzo, J. W., and Ngang’a, J. K. (2015). Adoption of frame hives: Challenges
facing beekeepers in Kenya. Global Journal of Agricultural Economics, Extension and
Rural Development, 3(6), 251-257. Retrieved from
http://www.globalscienceresearchjournals.org/
Munyuli, T., Rubabura, D., Kana, C., and Batumike, S. (2016). Preliminary observations on
enemies of stingless bees and honeybee (Apis Mellifera adansonii L.) Colonies from the
Miticivanga-Tshibinda sector east of Kahuzi Biega National Park, South-Kivu Province,
eastern DR Congo. Bulletin of Animal Health and Production in Africa, 64(1), 143-156.
Naissuma, D. (2000). Survey and sampling methods. Nairobi: University of Nairobi Press.
Ngaira, J. (2005). Hydrometeorological disasters and their impact on development: The Kenya
experience. Maseno journal of education, arts and sciences, 5(1).
Ngigi, G. (2013). Barclays Sheds 50 Jobs in Second Round of Lay Offs,[Online] Available
http://www. businessdailyafrica. com, Accessed on 8th October 2013. http://www.
businessdailyafrica. com. Accessed on 5th October.
Nicholson , S. E. (2014). A detailed look at the recent drought situation in the Greater Horn of
Africa. Journal of Arid Environments, 103, 71-79.
Nkedianye, D., de Leeuw, J., Ogutu, J. O., Said, M. Y., Saidimu, T. L., Kifugo, S. C., Kaelo, D.
S., and R.S., R. (2011). Mobility and livestock mortality in communally used pastoral
Page 86
71
areas: The impact of the 2005–2006 droughts on livestock mortality in Maasailand.
Pastoralism: Research, Policy and Practice, 1(17), 1-17.
Nori, M., Taylor, M., and Sensi, A. (2008). Browsing on Fences: Pastoral Land Rights,
Livelihoods and Adaptation to Climate Change. IIED Issue Paper 148.
OECD. (1999). Environmental communication. Applying communication tools towards
sustainable development. Working paper of Working Party on development Cooperation
and Environment. France: OECD Publications 2 rue Andre-Pascal 75775 Paris Cedex 16.
Okoti, M., Kung’u, J., and Obando, J. (2014). Impact of Climate Variability in Pastoral
Household and adaptation STRATEGIES IN Garissa County, Nothern Kenya.
Ongoma, V., and Chen, H. (2017). Temporal and spatial variability of temperature and
precipitation over East Africa from 1951 to 2010. Meteorology and Atmospheric Physics,
129(2), 131-144.
Ozturk, T., Ceber, Z. P., Türkeş, M., and Kurnaz, M. L. (2015). Projections of climate change in
the Mediterranean Basin by using downscaled global climate model outputs.
International Journal of Climatology, 35(14), 4276-4292.
Paterson, P. (2006). The tropical agriculturist.: Mcmillan Publishers Limited.
Pica-Ciamarra, U., Nouala, S., Otte, J., and N’guetta, A. (2011). Investing in Livestock to Drive
Economic Growth in Africa: AU Inter-African Bureau for Animal Resources: Nairobi.
Potts, S. G., Biesmeijer, J. C., Kremen, C., Neumann, P., Schweiger, O., and Kunin, W. E.
(2010). Global pollinator declines: trends, impacts and drivers. Trends in ecology &
evolution, 25(6), 345-353.
Primack, R. B. (1985). Longevity of individual flowers. Annual review of ecology and
systematics, 16(1), 15-37.
Raina, S. K., Kioko, E., Zethner, O., and Wren, S. (2011). Forest habitat conservation in Africa
using commercially important insects. Annual Review of Entomology, 56, 465 – 485.
Ratnieks, F. L. W., and Carreck, N. L. (2010). Carity on honeybee collapse? Science, 327(152-
153).
Recha, C. W., Mukopi, M. N., and Otieno, J. O. (2015). Socio‐economic determinants of
adoption of rainwater harvesting and conservation techniques in semi‐arid Tharaka
sub‐county, Kenya. Land Degradation & Development, 26(7), 765-773.
Page 87
72
Ricketts , T. H., Regetz, J., Steffan‐Dewenter, I., Cunningham, S. A., Kremen, C., Bogdanski,
A., Gemmill‐Herren, B., Greenleaf, S. S., Klein, A. M., and Mayfield, M. M. (2008).
Landscape effects on crop pollination services: are there general patterns? Ecology
letters, 11(5), 499-515.
Riedinger, V., Renner, M., Rundlöf, M., Steffan-Dewenter, I., and Holzschuh, A. (2014). Early
mass-flowering crops mitigate pollinator dilution in late-flowering crops. Landscape
Ecology, 29(3), 425-435.
Robbirt, K. M., Davy, A. J., Hutchings, M. J., and Roberts, D. L. (2011). Validation of biological
collections as a source of phenological data for use in climate change studies: a case
study with the orchid Ophrys sphegodes. Journal of Ecology, 99(1), 235-241.
Robinson , G. E., and Page , R. E. (1989). Genetic determination of nectar foraging, pollen
foraging, and nest-site scouting in honey bee colonies. Behavioral Ecology and
Sociobiology, 24(5), 317-323.
Roncoli, C., Okoba, B., Gathaara, V., Ngugi, J., and Nganga, T. (2010). Adaptation to climate
change for smallholder agriculture in Kenya: community-based perspectives from five
districts. Report to the World Bank of the project:"Adaptation of Smallholder
Agriculture.
Ruttner, F. (1975). African races of honeybees. Proceedings of 25th International Beekeeping
Congress. Grenoble,France.
Schmid-Hempel, P. (2011). Evolutionary Parasitology. The Integrated Study of Infections,
Immunology, Ecology and Genetics: Oxford University Press.
Schweiger, O., Biesmeijer, J. C., Bommarco, R., Hickler, T., Hulme, P., Klotz, S., Kühn, I.,
Moora, M., Nielsen, A., Ohlemuller, R., Petanidou, T., Potts, S. G., Pysek, P., Stout, J.
C., Sykes, M., Tscheulin, T., Vilà, M., Wather, G. R., and Westphal, C. (2010). Multiple
stressors on biotic interactions: how climate change and alien species interact to affect
pollination. Biological reviews, 85, 777-795.
Seeley, T. (1995). The Wisdom of the Hive. Harvard University. Cambridge, USA.
Shackelford, G., Steward, P. R., Benton, T. G., Kunin, W. E., Potts, S. G., Biesmeijer, J. C., and
Sait, S. M. (2013). Comparison of pollinators and natural enemies: a meta‐analysis of
landscape and local effects on abundance and richness in crops. Biological reviews,
88(4), 1002-1021.
Page 88
73
Sharma, D., Abrol, D., Ahmad, H., Srivastva, K., and Vir, V. (2013). Migratory Beekeeping in
Jammu and Kashmir, India. Bee World, 90(2), 44-47.
Shi, P., Ma, X., Hou, Y., Li, Q., Zhang, Z., Qu, S., Chen, C., Cai, T., and Fang, X. (2013).
Effects of land-use and climate change on hydrological processes in the Upstream of
Huai River, China. Water resources management, 27(5), 1263-1278.
Simms, A. (2005). Africa: up in smoke? The second report from the Working Group on Climate
Change and Development. New Economics Foundation: London.
Singh, C., Daron, J., Bazaz, A., Ziervogel, G., Spear, D., Krishnaswamy, J., Zaroug, M., and
Kituyi, E. (2017). The utility of weather and climate information for adaptation decision-
making: current uses and future prospects in Africa and India. Climate and Development,
1-17.
Smit, B., and Wandel, J. (2006). Adaptation, adaptive capacity and vulnerability. Global
environmental change, 16(3), 282-292.
Smith, K. R., Woodward, A., Campbell-Lendrum, D., Chadee, D. D., Honda, Y., Liu, Q.,
Olwoch, J. M., Revich, B., and Sauerborn, R. (2014). Human health: impacts,
adaptation, and co-benefits. In: Climate change 2014: impacts, adaptation, and
vulnerability. Retrieved from
Stenseth, N. C., Ottersen, G., Hurrell, J. W., Mysterud, A., Lima, M., Chan, K.-S., Yoccoz, N.
G., and Ådlandsvik, B. (2003). Studying climate effects on ecology through the use of
climate indices, the North Atlantic Oscillation, El Niño Southern Oscillation and , El
Niño Southern Oscillation and beyond. Biol. Sci, 270, 2087–2096.
Stratton, D. A. (1989). Longevity of individual flowers in a Costa Rican cloud forest: ecological
correlates and phylogenetic constraints. Biotropica, 308-318.
Tabari, H., Marofi, S., Aeini, A., Talaee, P. H., and Mohammadi, K. (2011). Trend analysis of
reference evapotranspiration in the western half of Iran. Agricultural and Forest
Meteorology, 151(2), 128-136.
Tang, B., Tong, L., Kang, S., and Zhang, L. (2011). Impacts of climate variability onreference
evapotranspiration over 58 years in the Haihe river basin of northChina. Agric. Water, 98,
1660–1670.
Teferi, M., Yirga, G., Hailemichael, T., and Amare, S. (2011). Prospects of beekeeping in the
Northern Ethiopian highlands. Scientific Research and Essays, 6(29), 6039-6043.
Page 89
74
Teklay, A. (2011). Seasonal availability of common bee flora in relation to land use and colony
performance in Gergera Watershed Atsbi Wemberta District, Eastern Zone of Tigray,
Ethiopia. Hawassa University.
Teklu, G. W. (2016). Survey on honeybee pests and predators in Sidama and Gedeo zones of
Southern Ethiopia with emphasis on control practices.
Terry, G. (2009). No climate justice without gender justice: An over view of the issue; Gender
development. London, Uk.: Rouledge.
Tesfay, H. (2014). Honey Bee Diseases, Pest and Their Economic Importance in Ethiopia.
International Journal of Innovation and Scientific Research, 10(2), 527-535. Retrieved
from www.ijisr.issr-journals.org/
Tessega, B. (2009). Honeybee Production and Marketing Systems, Constraints and opportunities
in Burie District of Amhara Region, Ethiopia. (MSC), School of Graduate Studies Bahir
dar University.
Thirgood, S., Mosser, A., Tham, S., Hopcraft, G., Mwangomo, E., Mlengeya, T., Kilewo, M.,
Fryxell, J., Sinclair, A., and Borner, M. (2004). Can parks protect migratory ungulates?
The case of the Serengeti wildebeest. Paper presented at the Animal Conservation forum.
Thomas, C. (2006). A Beginner‟s Guide To Beekeeping In Kenya. Lulu.com U.S.A.
Thornton, P. K., Jones, P. G., Ericksen, P. J., and Challinor, A. J. (2011). Agriculture and food
systems in sub- Saharan Africa in a four-plus degree world. Philosophical Transactions
of the Royal Society Series A, 369, 117–136.
Trenberth, K. E., Branstator, G. W., Karoly, D., Kumar, A., Lau, N. C., and Ropelewski, C.
(1998). Progress during TOGA in understanding and modeling global teleconnections
associated with tropical sea surface temperatures. Journal of Geophysical Research:
Oceans, 103(C7), 14291-14324.
Tscharntke , T., Tylianakis , J. M., Rand , T. A., Didham , R. K., Fahrig , L., Batary , P.,
Bengtsson , J., Clough , Y., Crist , T. O., and Dormann , C. F. (2012). Landscape
moderation of biodiversity patterns and processes‐eight hypotheses. Biological reviews,
87(3), 661-685.
UNEP. (2006). Africa's lakes: Atlas of our changing environment: United Nations Environment
Programme. Earthprint.
UNEP. (2014). Emerging Issues in Our Global Environment. UNEP year book. Nairobi, Kenya.
Page 90
75
Ute, D., Dieval, S., Dyer, N., Kronik, J., Macharia, J., and Moiko, S. (2012). Indigenous peoples
and climate change in Africa; traditional Knowledge and adaptation strategies.
Retrieved from Charapa Consult & Rainforest Foundation:
Von Holle, B., Wei, Y., and Nickerson, D. (2010). Climatic Variability Leads to Later Seasonal
Flowering of Floridian Plants. Pone, 5(7). doi:10.1371
Wambua, B. M. (2015). Assessment of Performance Indices of Frame Hive Beekeeping and the
Traditional Technology in Kenya A Case Study of Kitui County. (Master of Science in
Agricultural Resource Management Master), South Eastern Kenya University.
Wang, K., and Dickinson, R. E. (2012). A review of global terrestrial evapotranspiration:
Observation, modeling, climatology, and climatic variability. Reviews of Geophysics,
50(2).
Wasonga, V. O. (2009). Linkages between land-use, land degradation and poverty in semi-arid
rangelands of Kenya: The case of Baringo district. (Doctoral dissertation), University of
Nairobi.
Wasonga , V. O., Nyariki, D. M., and Ngugi, R. K. (2011). Assessing socioecological change
dynamics using local knowledge in the semi-arid lowlands of Baringo district, Kenya. 5,
1(11-17).
Wasonga, V. O., Nyariki, D. M., and Ngugi, R. K. (2011). Assessing socioecological change
dynamics using local knowledge in the semi-arid lowlands of Baringo district, Kenya.
Environmental Research Journal, 5(1), 11-17.
Wei, X. H., Liu, W. F., and Zhou, P. C. (2013). Quantifying the relative contributions of forest
change and climatic variability to hydrology in large watersheds: a critical review of
research methods. Water, 5, 728–746.
Woyciechowski, M. (2007). Risk of water collecting in honeybee (Apis mellifera) workers
(Hymenoptera: Apidae). Sociobiology, 50, 1059–1068.
WRMA. (2013). Final Report - Surface and Groundwater Assessment and Planning in Respect
to the Isiolo County. Mid Term ASAL Program Study. Nairobi, Kenya: Earth Water Ltd.
Yetim, G. G. (2015). Characterization of Beekeeping Systems and Honey Value Chain, and
Effects of Storage Containers and Durations on Physico-Chemical Properties of Honey
in Kilte Awlaelo District, Eastern Tigray, Ethiopia. (PhD Program in Animal
Page 91
76
Production), Addis Ababa University, College of Veterinary Medicine and Agriculture.
(0011/05/015)
Yirga, G., and Teferi, M. (2010). Participatory technology and constraints assessment to improve
the livelihood of beekeepers in Tigray Region, northern Ethiopia. Momona Ethiopian
Journal of Science, 2(1).
Page 92
77
APPENDICES
Appendix 1: Questionnaire
My name is Akala Haron, I am a Master’s student pursuing master’s degree in Environmental
Science in the department of Environmental Science of Egerton University. I am interested in
studying impacts of climate variability on honey production in Baringo County. The information
provided will be used entirely for academic purposes and personal information of respondents
will be kept confidential.
SECTION 1: Details
County Division District / Sub-County Location Sub-location Village SECCTION 2: Demography
1. Name of the respondent
Gender of the respondent Male Female
Location Marigat Ratat
Marital status Married Divorced widowed single
Educational level No formal education Primary Secondary Tertiary
Age 20-25 26-31 32-37 38-43 44-49 50+
Occupation Farmer Teacher Enterprise other
Section 3: Socio-economic activities
2. How many honey do you have? Traditional hive Modern hive
3. How did you start beekeeping? Own interest Influenced by neighbor and relatives
Inherited from the parents Awareness by agriculture extension ……Other reason
(specify)
4. How long have practiced beekeeping? ………….
5. Where do you keep the bees colonies?
Site of the hive Tick appropriately Number of hives
Hanging on homestead trees
In the jungle
Page 93
78
Nearby to the homestead
Backyard
Section 4: Climate variability
6. Have you ever noticed the following changes in weather over the last 5 years?
Trend over the last 5 years(tick the appropriate trend)
Increasing Decreasing No change
Amount of rainfall
Duration of rain
Severity and frequency of drought
Temperature
7. If you answer the above question (6), change in temperature, what are the indicators do you
use to evaluate climate temperature?Drying of rivers and streams Loss of biodiversity
Decrease in rainfall amount
Section 5: Effects of climate variability on forage availability and distribution
8. It is known that Baringo County is among major honey producers in Kenya; there are
different types of flora that support the activity. Kindly list them and rank them from more
abundance to less abundance.
Species abundance
Local name of the flora More abundant Abundant Medium Rare Very rare
1.
2.
3.
4.
5.
6.
9. Do you think variation in weather has led to the change in flowering and anthesis of flora.
Y
e
s
Page 94
79
Yes No
10. If yes, has the flowering of flora changed in the past years? Yes No
11. How is the change? Very much Much Minimal Very minimal
12. Which season of the year does shortage in bee forage does happen.
Season Month of the year Critical shortage Less shortage
13. Have ever noticed the impacts of climate variability on flora?
Trends over the past years
Increasing Decreasing Stable
Quantity of flowers
Duration of flowers on the flora
Quantity of flora preferred
Invasion of un-preferred flora
Poisonous plants
Section 6: Climate variability and Honey production
14. What are the driving forces that influenced you to start honey production?
Income Home consumption To get skill others specify
15. How many times do you harvest honey per year from a single beehive? Once Twice
Thrice More than three times Sometimes never
16. . When is the peak for honey harvesting in the year?...........
17. Do you practice migratory beekeeping? Yes No
18. How long does your colony remain in the hive?0-1yrs 2-3yrs 4 years
19. Are there any patterns that the bees follow? Yes No
20. Are there any change in the migratory routes? Yes No
21.
If yes, do you think change in weather modification has led to change in the
migration?
Yes No
Is there variation in honey yield production in past 5 years? Yes No
Y
e
s
N
o
Y
e
s
N
o
0
-
1
y
r
s
0
-
1
y
r
s
0
-
1
y
r
s
Page 95
80
If yes what is the trend? decreased increased Stable varies yearly
Is water available for honeybees Yes No
22. If yes, tick in the table below
Water Tick for yes
Scarce
Less available
Available
More available
23. Where do the honeybees get the water? Water pans Stream River Ponds
Other (please specify)
24.
Do you associate insufficient of water to colony migration Yes No
If, no how do you provide water for honeybees?
Does water availability affect production? Yes No
25. If it has decreased, kindly use the options to answer the following questions as they have led
to low honey production from agreement to disagreement
1 strongly agree 2 Agree 3 Disagree 4 Strongly Disagree
Factors leading to honey production 1 2 3 4
Variation in temperature
Variation in rainfall
Incidences of pest and predation
Change in flowering and anthesis.
Distance from the beehive to nearby flora
Absconding
Lack of forage
Hive shading
Low availability of quality bee forage
Page 96
81
Section 7: Climate variability and Pest infestation
26. Do you visit your beehive and colonies? Yes No
27. If yes, which type of inspection do you always do? External beehive inspection
internal beehive inspection Both external and internal inspection
28. How often do you inspect the beehive? Rarely Frequently Sometimes
29. Which kind of pests have you noticed infest your beehive? Put them in the rank.
No Pest Rank Increase Decrease stable
1 Ants
2 Honey badger
3 Lizard
4 Wasps
5 Rats
6 Others (state)
30. If the pest infestation is increasing, what are factors that lead to increase in pest infestation?
Increase in drought period Poor hive management Human activity Increase in
wet season
31. Which season of the year do you experience high pest infestation? Dry season Wet
season Others (specify)
Appendix 2: Interview schedule for FGD
1. Based on your on view, does availability of flowers affect migratory behavior of bees
2. Water is essential for honey production. Climate variability has led to reduction in water
quantity. Does this affect honey production and migratory behavior of bees?
3. What are predisposing factors based on climate variability for pest infestation?
4. How is the trend in the number of honeybee colonies in the area? Is it increasing or
decreasing? Why?
5. Has the swarming trend changed? If yes, what could be the cause?
6. Does honey take long period to be ready?
7. Is trend increasing or decreasing in honey production? Explain the reason
8. Do you associate low honey production is because of climate variability?
Page 97
82
9. Has the quantity of honey changed over the past 5 years?
10. Are there new pest that have emerged because of the weather condition suitable for it to
thrive?
Key informants
Name
Position
Date
1. Have you noticed variation in temperature and rainfall in the past years?
2. If yes, what are the changes?
3. From your records, has honey production varied based on variation in climatic weather
condition?
4. What are the most common pests reported by the farmers that are rampant?
5. Which season of the year when pest infestation is rampant?
6. Major bee forage and their flowering period in the year
Page 98
83
Appendix 3: Rainfall data
Amount of Rainfall and Number of rainy daisy for the period of 2011 - 2016for Marigat Sub-county (mm)
Year and Number of rainy days
Months 2011 2012 2013 2014 2015 2016
Amount NRD Amount NRD Amount NRD Amount NRD Amount NRD Amount NRD
January 0 0 0 0 0 0 7 2 0 75
February 0 0 2.2 2 0.6 1 2 1 0 30
March 90.6 6 0 0 0 0 11 2 0 29
April 108.6 7 237.6 18 160 8 13 3 106 115
May 84.0 4 127 22 16 3 9 3 61 91
June 365.7 21 150 9 101.2 4 99.5 7 125 47
July 244 7 330.2 21 30.0 4 5 2 32 114.6
August 146 12 331.5 32 86.6 6 91 8 0 37.2
September 146 12 222 12 32.8 13 47.5 5 0 25
October 108 4 141.2 8 31.1 14 30 6 21 0
November 233.7 9 41.7 10 71.2 15 60 5 125 0
December 11.5 2 40 2 77.0 9 145 6 0 0
Total 1,538.1 84 1632.7 136 608.7 77 536 470 563.8
Source Marigat District water Office, 2017. (NRD-Number of rainy days)
Page 99
84
Interviewing the respondent with the help of the local enumerator at Kamung’eyi
Page 100
85
Appendix 4: NACOSTI License