J.D. Power | © 2014 J.D. Power, McGraw Hill Financial. All Rights Reserved.
Mike VanNieuwkuykExecutive Director, Global AutomotiveJ.D. Power
Panel 1:The Next‐Generation HMI
Impact of Complexity on the In‐Car Experience
2 J.D. Power | © 2014 J.D. Power, McGraw Hill Financial. All Rights Reserved.
Quality Redefined Competitive Landscape: The In‐Vehicle Experience
Automotive Trends
3 J.D. Power | © 2014 J.D. Power, McGraw Hill Financial. All Rights Reserved.
Quality Equality
Source: J.D. Power 1987 through 2012 U.S. Initial Quality Study (IQS)
Quality gap between best and worst models
334
220
80 78
1987 1997 2008 2012 2013
Quality as a Differentiator Quality as a Given
Pro
blem
s P
er 1
00 V
ehic
les
(PP
100)
4 J.D. Power | © 2014 J.D. Power, McGraw Hill Financial. All Rights Reserved.
Quality Improvement In The US Market: Last 10 Years
Reported Problems
Overall Vehicle Problems
Reported Problems by Vehicle Category
Interior Problems
Feature / Control / Display Problems
Ride and Handling Problems
Exterior Problems
Tire Problems
HVAC Problems
Engine / Transmission Problems
Seat Problems
Multimedia Problems
Navigation System ProblemsIncreased Complexity
(Design Issues: Soft “Inadequacies”)
Usability has Taken on Greater Importance
Source: J.D. Power
5 J.D. Power | © 2014 J.D. Power, McGraw Hill Financial. All Rights Reserved.
WarrantyCases
Malfunctionsnot brought to
warranty
Soft “Inadequacies” needs addressed but not as
preferred
Missed Opportunities
vehicle misalignment with market expectations
Redefinition of Quality
WarrantyCases
Malfunctionsnot brought to
warranty
Soft “Inadequacies” needs addressed but not as
preferred
Missed Opportunities
vehicle misalignment with market expectations
Traditional Quality Consumer Quality
Design Quality
Consumer Behavior
6 J.D. Power | © 2014 J.D. Power, McGraw Hill Financial. All Rights Reserved.
Quality Equality
Source: J.D. Power 1987 through 2013 U.S. Initial Quality Study (IQS)
Quality gap between best and worst models
334
220
80 78
163
1987 1997 2008 2012 2013
Quality as a Differentiator Quality as a Given
Prob
lems Per 1
00 Veh
icles (PP1
00)
Consumer Defined Quality
2013 Redesigned Quality Study
‐ Added Usability and New
Technologies
7 J.D. Power | © 2014 J.D. Power, McGraw Hill Financial. All Rights Reserved.
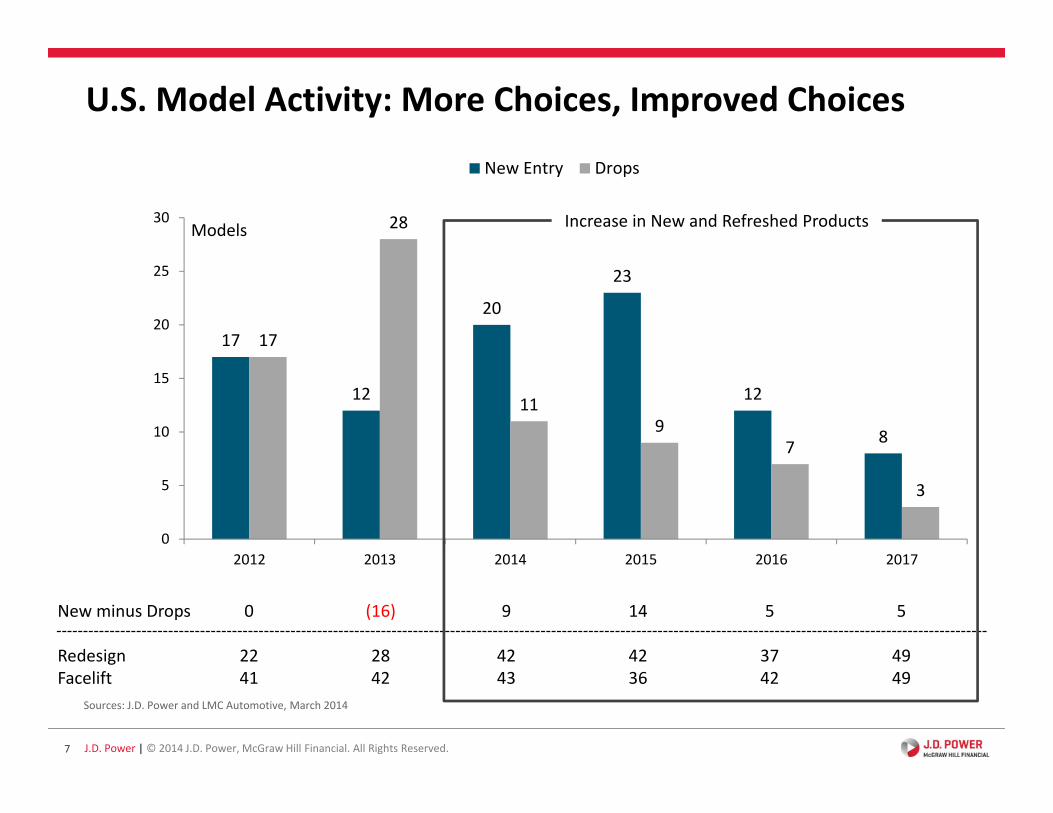
17
12
20
23
12
8
17
28
119
7
3
0
5
10
15
20
25
30
2012 2013 2014 2015 2016 2017
Models
New Entry Drops
New minus Drops 0 (16) 9 14 5 5
Redesign 22 28 42 42 37 49Facelift 41 42 43 36 42 49
Increase in New and Refreshed Products
U.S. Model Activity: More Choices, Improved Choices
Sources: J.D. Power and LMC Automotive, March 2014
8 J.D. Power | © 2014 J.D. Power, McGraw Hill Financial. All Rights Reserved.
It’s What’s On The Inside That Counts
9 J.D. Power | © 2014 J.D. Power, McGraw Hill Financial. All Rights Reserved.
Product development and delivery market alignment
Market Driven Content and Delivery
– MARKET MISALIGNMENT
– CONSUMER DISSATISFACTION
– MISSED PROGRAM TARGETS
– NEGATIVE BRAND IMPACTSUPPLIER SOLUTIONS
OEM PLANS
CONSUMEREXPECTATIONS
DEALER DELIVERY SUPPORT/TRAINING
TO REDUCE THE IMPACT OF COMPLEXITY
+ MARKET ALIGNMENT
+ CONSUMER SATISFACTION
+ ACHIEVED PROGRAM TARGETS
+ ENHANCED BRAND IMPACT
+ POSITIVE SUPPLIER PERCEPTION
CONSUMEREXPECTATIONS
SUPPLIER SOLUTIONS
OEM PLANS
– CONSUMER DISSATISFACTION
– MISSED PROGRAM TARGETS
– NEGATIVE BRAND IMPACT
– NEGATIVE SUPPLIER PERCEPTIONOEM PLANS CONSUMER
EXPECTATIONSSUPPLIER SOLUTIONS
10 J.D. Power | © 2014 J.D. Power, McGraw Hill Financial. All Rights Reserved.
Technology Interests and Usability
11 J.D. Power | © 2014 J.D. Power, McGraw Hill Financial. All Rights Reserved.
Individual Technology Interest Technology Category Average
Percen
t Definite
ly/Proba
bly Interested
Highest interest categories with
moderate variability among the individual technologies
Lowest interest categories with very little variability
among individual technologies
Large variability among the individual technologies within
these categories
Technology Category Interest Rank and Variability
Usability FeaturesSource: J.D. Power 2014 U.S. Emerging Technologies Study
12 J.D. Power | © 2014 J.D. Power, McGraw Hill Financial. All Rights Reserved.
0% 20% 40% 60% 80% 100%
Mobile RouterProgrammable Instrument Cluster
Active Sound ManagementRemote Vehicle Diagnostics
Smart IntersectionLane Departure Prevention System
Blind Spot Detection and Prevention…Electronic Window Tint
Natural Language Voice‐ActivationAutomatic Head Restraint
Voice‐Activated Personal Assistant…Stop/Start System
Predictive MaintenanceWireless Infotainment System Updates
Emergency Braking and SteeringActive Rear‐Spoiler
Enhanced Collision Mitigation SystemWireless Connectivity SystemSmartphone Voice Integration
Lifetime Navigation Map UpdatesActive Wheel ShuttersActive Front Air Dam
Low‐Speed Collision Avoidance SystemNear Field Communication
Cylinder DeactivationSmartphone Navigation Vehicle InterfaceAdvanced Accident Notification System
Wireless Charging StationActive Shutter Grille Vents
Surround View Camera SystemDevice‐Application Link
0% 20% 40% 60% 80% 100%
Hand Gesture Controlled CockpitLaser Headlights
Multi‐user Infotainment SystemTactile Touch Screen
Energy Recovery SuspensionEye Tracking ControlsVehicle Body Control
Speed Limit Assist SystemCustomizable Home Screen
Factory‐Installed Dual‐View Navigation…Adaptive Highbeam AssistBiometric Driver Sensors
In‐wheel MotorAutonomous Driving ModeCloud Online Data Storage
Smart HeadlightsWi‐Fi Direct Pedestrian Detection System
Hand Gesture Controlled SeatSolar Glass Roof
Vehicle Communication SystemTraffic Jam Assist
Enhanced Adaptive Cruise ControlAir‐balance Fragrance Package
Fully Autonomous Parking SystemHand‐Gesture Activated DoorsDrowsiness Detection System
Next Generation Head‐Up Display (HUD)Mobile Router SubscriptionReal‐Time Traffic Updates
Personal Assistance Services (PAS)Percent Definitely/Probably Interested
61 New and Emerging Vehicle Technologies
Source: J.D. Power 2014 U.S. Emerging Technologies Study
Data from the 2014 US Automotive Emerging Technologies Study has been removed from this presentation
For more information on the results from this study, please contact:
Mike VanNieuwkuyk [email protected]
13 J.D. Power | © 2014 J.D. Power, McGraw Hill Financial. All Rights Reserved.
Factory‐Installed Navigation Systems
The Impact of Usability
14 J.D. Power | © 2014 J.D. Power, McGraw Hill Financial. All Rights Reserved.
Today’s Navigation Systems are:• More Complex• In All Segments of the
Market• Competing with
Smartphones
Source: J.D. Power & Associates
Reported Problems
Overall Vehicle Problems
Reported Problems by Vehicle Category
Interior Problems
Feature / Control / Display Problems
Ride and Handling Problems
Exterior Problems
Tire Problems
HVAC Problems
Engine / Transmission Problems
Seat Problems
Multimedia Problems
Navigation System Problems
Usability Driving Problem Counts Up for Audio and Navi
Source: J.D. Power
15 J.D. Power | © 2014 J.D. Power, McGraw Hill Financial. All Rights Reserved.
Ease of Use 34%
Routing 19%
Navigation Display
Screen 15%
Speed of System 13%
Voice Directions
10%
Voice Activation
10%
Weights may not sum to 100 due to rounding
2013 Navigation Satisfaction Index Weights Ease of Use and Voice
Activation are the areas of Navigation Satisfaction that
are most aligned with Complexity
“Ease of Use” Accounts for a Third of Navi Satisfaction
Source: J.D. Power 2013 U.S. Navigation Usage and Satisfaction Study
16 J.D. Power | © 2014 J.D. Power, McGraw Hill Financial. All Rights Reserved.
527
623
665
701
739
756
672
400 500 600 700 800 900 1000
Voice Activation
Ease of Use
Voice Directions
Speed of System
Routing
Navigation DisplayScreen
Navigation SystemIndex
Navigation Satisfaction Index FactorsStudy AverageWeight
100%
15%
19%
13%
10%
34%
10%
“Ease of Use” and “Voice Activation” Navi Shortfalls
Source: J.D. Power 2013 U.S. Navigation Usage and Satisfaction Study
17 J.D. Power | © 2014 J.D. Power, McGraw Hill Financial. All Rights Reserved.
Control Method Primarily Used for Navigation System Most Preferred Control Method for Navigation System
“Voice Activation” Still a Desired Control Type for Navi
Source: J.D. Power 2013 U.S. Navigation Usage and Satisfaction Study
8%
10%
18%
20%
30%
52%
75%
0% 20% 40% 60% 80% 100%
Touchpad Controls withFinger Stylus
Joystick
Hard Buttons
Steering Wheel Control
Dial/Knob
Voice Activation
Touch Screen
2012 2013
13%
10%
14%
28%
20%
65%
69%
0% 20% 40% 60% 80% 100%
Touchpad Controls withFinger Stylus
Joystick
Hard Buttons
Steering Wheel Control
Dial/Knob
Voice Activation
Touch Screen
2013
18 J.D. Power | © 2014 J.D. Power, McGraw Hill Financial. All Rights Reserved.
635
686
573
660
500 550 600 650 700
12 Minute or Less
More Than 12 Minutes
Did Not ReceiveDemonstration
ReceivedDemonstration
635
686
573
660
500 550 600 650 700
12 Minute or Less
More Than 12 Minutes
Did Not ReceiveDemonstration
ReceivedDemonstration
635
686
573
660
500 550 600 650 700
12 Minute or Less
More Than 12 Minutes
Did Not ReceiveDemonstration
ReceivedDemonstration
494
604
746
0 200 400 600 800
Not At All Helpful
Somewhat Helpful
Very Helpful
Helpfulness of Navigation System Demonstration(among those who received a demonstration)
Navigation System Demonstration
Time Dealer Spent on Demonstration(among those who received a demonstration)
Navigation System Demonstration
Time Dealer Spent on Demonstration(among those who received a demonstration)
Navigation System Ease of Use Index Average Rating: 637
Dealer Delivery can Influence “Ease of Use”
Source: J.D. Power 2013 U.S. Navigation Usage and Satisfaction Study
19 J.D. Power | © 2014 J.D. Power, McGraw Hill Financial. All Rights Reserved.
Complexity of Driving
20 J.D. Power | © 2014 J.D. Power, McGraw Hill Financial. All Rights Reserved.
21 J.D. Power | © 2014 J.D. Power, McGraw Hill Financial. All Rights Reserved.
Challenge: Complex Value, Simple Use
22 J.D. Power | © 2014 J.D. Power, McGraw Hill Financial. All Rights Reserved.
Thank You
23 J.D. Power | © 2014 J.D. Power, McGraw Hill Financial. All Rights Reserved.