1 Introduction Annual production of crushed rock aggregates across Europe is currently 3000 million tonnes, a figure which is expected to increase over the next few decades with increasing demand for building material. For geological reasons many sources of aggregates occur in upland areas often within areas of great natural beauty with vulnerable cultural landscapes, archaeological sites and historic buildings. This paper describes research to investigate the physical impacts of extraction and transportation of aggregates on the fragile historic landscapes of England. The impacts of noise, vibration and dust on buildings and the quality of the environment are investigated at two case study sites, representing areas where large aggregate quarries are operating in close proximity to historic villages and landscapes. In England many of the aggregates quarries are located in or close by to areas designated as National Parks due to their quality of natural and cultural landscape. For instance in the East Midlands out of a total of 2166 Crushed Rock Permissions, 284 fell within the Peak District National Park, whilst in the Yorkshire and Humber region, 149 Crushed Rock Permissions out of a total of 471 were in a National Park. The vast majority of these were in the Yorkshire Dales National Park with a few permissions in the North Yorkshire Moors National Park. The trend towards the exploitation of larger quarries in remote areas and the closure of smaller local quarries as these have become uneconomic resulted in aggregates being transported over much greater distances than previously. In 1997 road transport accounted for 94.5% of these journeys, with the remainder consisting of rail (5%) and water (0.5%). So as well as the direct impact of quarrying, road transportation is also an issue of concern. 2 Potential Quarry Impacts on the Historic Environment The main environmental impacts of hard rock aggregates extraction and transportation on the historic villages and cultural landscapes were identified as noise, vibration and dust. 2.1 Noise Impact Noise, whilst not actually harmful to the physical historic environment, reduces the quality of life of communities and the quality of the experience and enjoyment of visitors to historic areas. Noise generated at open sites such as crushed rock aggregate quarries can, depending on distance, surrounding topography and prevailing wind direction, be transmitted beyond site boundaries. Sources of noise at crushed rock quarries include: • Mobile plant (e.g. Excavators, front loading shovels, dozers and haulage vehicles) • Static plant (e.g. permanent processing plant) Impacts of Crushed Rock Quarries on Historic Villages and Cultural Landscapes Nigel Blades 1 , Gemma Marchant 1 and Paul Greening 2 1 Centre for Sustainable Heritage, University College London, UK 2 Department of Civil and Environmental Engineering, University College London, UK Key words: aggregates, historic environment, noise, dust, vibration
Transcript
1 Introduction
Annual production of crushed rock aggregates across Europe is currently 3000 million tonnes, a figure which is expected to increase over the next few decades with increasing demand for building material. For geological reasons many sources of aggregates occur in upland areas often within areas of great natural beauty with vulnerable cultural landscapes, archaeological sites and historic buildings. This paper describes research to investigate the physical impacts of extraction and transportation of aggregates on the fragile historic landscapes of England. The impacts of noise, vibration and dust on buildings and the quality of the environment are investigated at two case study sites, representing areas where large aggregate quarries are operating in close proximity to historic villages and landscapes.
In England many of the aggregates quarries are located in or close by to areas designated as National Parks due to their quality of natural and cultural landscape. For instance in the East Midlands out of a total of 2166 Crushed Rock Permissions, 284 fell within the Peak District National Park, whilst in the Yorkshire and Humber region, 149 Crushed Rock Permissions out of a total of 471 were in a National Park. The vast majority of these were in the Yorkshire Dales National Park with a few permissions in the North Yorkshire Moors National Park. The trend towards the exploitation of larger quarries in remote areas and the closure of smaller local quarries as these have become uneconomic resulted in aggregates being transported over much greater distances than previously. In 1997 road transport accounted for 94.5% of these journeys, with the remainder consisting of rail (5%) and water (0.5%). So as well as the direct impact of quarrying, road transportation is also an issue of concern.
2 Potential Quarry Impacts on the Historic Environment
The main environmental impacts of hard rock aggregates extraction and transportation on the historic villages and cultural landscapes were identified as noise, vibration and dust.
2.1 Noise ImpactNoise, whilst not actually harmful to the physical historic environment, reduces the quality of life of communities and the quality of the experience and enjoyment of visitors to historic areas. Noise generated at open sites such as crushed rock aggregate quarries can, depending on distance, surrounding topography and prevailing wind direction, be transmitted beyond site boundaries. Sources of noise at crushed rock quarries include:
• Mobile plant (e.g. Excavators, front loading shovels, dozers and haulage vehicles)• Static plant (e.g. permanent processing plant)
Impacts of Crushed Rock Quarries on Historic Villages and Cultural Landscapes Nigel Blades1, Gemma Marchant1 and Paul Greening2
1Centre for Sustainable Heritage, University College London, UK2Department of Civil and Environmental Engineering, University College London, UK
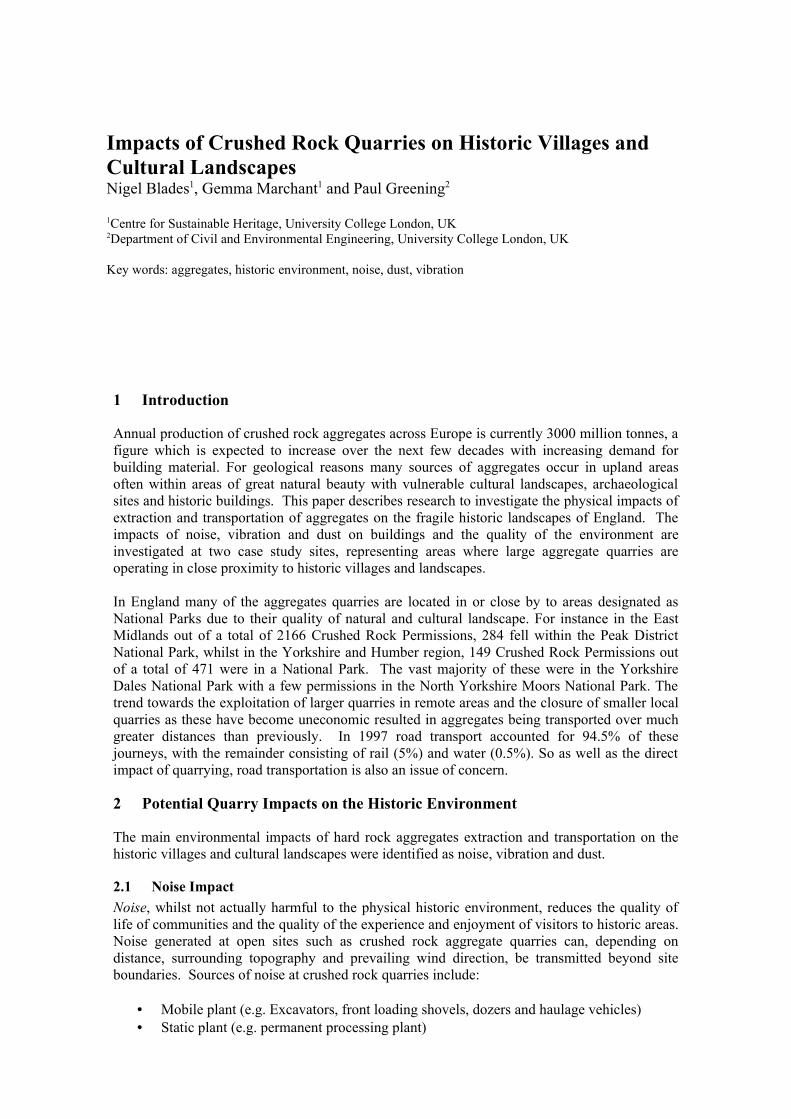
• Semi –mobile plant (e.g. mobile processing [figure 1] and screening plant)• Road wagons transporting material to market/depots (figure 2)
Figures 1 and 2: Mobile processing plant at Arcow Quarry, North Yorkshire (figure 1, left) and a quarry wagon crosses a historic bridge, Horton in Ribblesdale, (figure 2, right).
2.2 Dust ImpactRock dust can be emitted from passing aggregate lorries and then distributed further a field by re-suspension by other vehicles, pedestrians and the action of the wind. Most rock dust will consist of fairly large particles, which cannot travel very far before falling out of the atmosphere due to gravity. However smaller particles will also be generated and these could be transported much further because they are not so readily deposited from the atmosphere. Two main damage effects to the historic environment are likely to be caused by rock dust:
• Soiling is the visible dirtying of building exteriors, interiors, furnishings and fittings due to the accumulation of dust. Many quarry dusts will be light in colour and therefore show up more clearly on dark materials. Soiling may be harmless in itself, but it could necessitate frequent cleaning in order to meet aesthetic expectations.
• Dust can also bring about chemical attack on some materials. An accumulation of surface dust may increase or deplete the moisture content of the surface; rock dusts (e.g. from limestone and sandstone) are likely to be alkaline in nature and possibly chemically reactive on a wide range of surfaces.
There is no universal size definition for dust, although for industrial emissions it’s usually understood as comprising organic and inorganic particles with a diameter in the size range 1-75 µm [1]. Particles less than 1µm in diameter tend to behave more like gases than solids and are referred to as ‘fumes’, due to their size these particles have a long airborne residence time. Particles which are above 75µm are known as silt or sand and have a very short airborne residence time. As a result of quarrying activity, a range of dust particles are produced and can be transported outside the quarry location according to their mass and size. The distance dust particles can be transported also varies according to meteorological conditions and surrounding topography. It is important to note that dust is always present in the atmosphere and quarrying is just one source, other sources include combustion (e.g. fires, power stations and motor vehicles) and building and demolition work [2].
Dust particles can be produced at the following stages of mineral working:• Soil movement- soil stripping and storage• Overburden excavation• Mineral type and moisture present• Blasting events (figure 4)
• Mechanical handling of minerals such as during crushing and grading• Vehicle movements on roads on and off site
2.3 Vibration ImpactVibration causes several types of damage to historic buildings and monuments: physical separation and cracking of renders and plasters; failures and cracks in the building fabric; gradual or slow movement of objects inside buildings, for instance those located in display cases or on shelves. Vibration can be transmitted from aggregate activity through air, within the range 20Hz-20KHz, this manifests itself as noise. However, this research is interested in ground borne vibration which moves through the ground and can affect historic buildings and structures. It is supposed that over long time periods, load reversals can result in damage to delicate historic finishes such as renders and plasters. When amplified through the height of a structure or as a result of responsive floors, there is some evidence that ground borne vibrations can result in museum exhibits moving along surfaces.
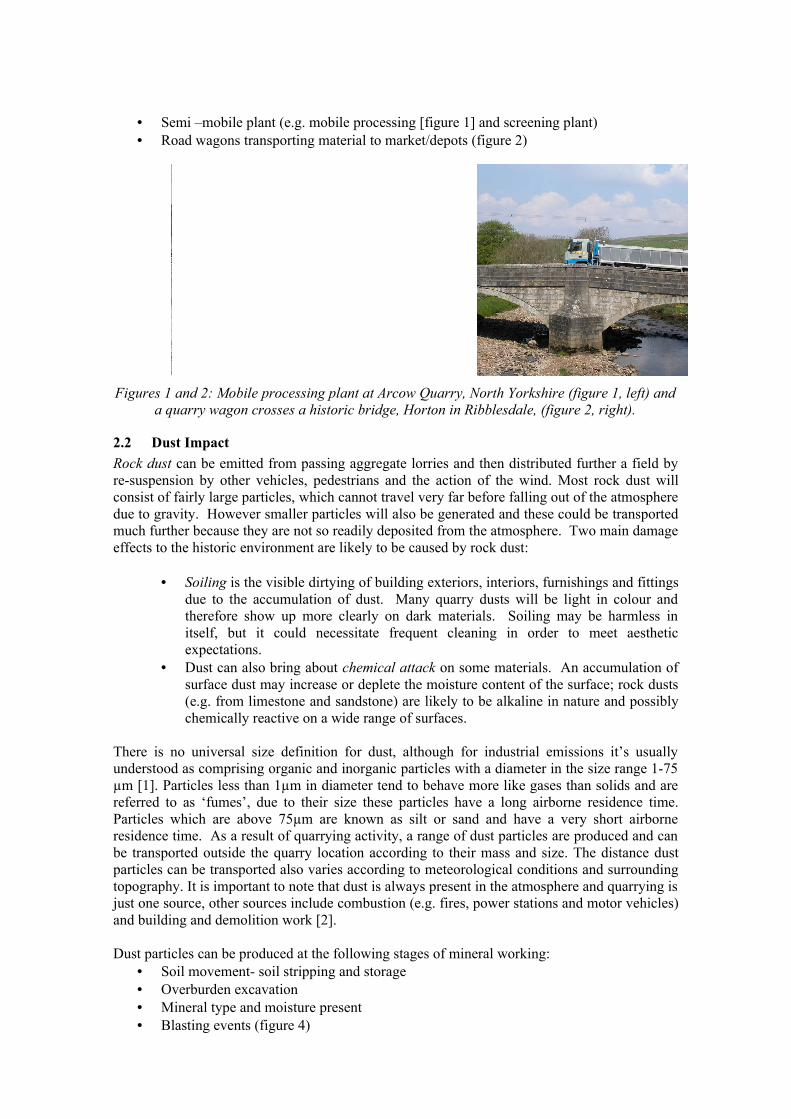
Blasting of hard rock is the most common source of vibration in aggregates extraction, a source which is eliminated in sand and gravel extraction. Some ground borne vibration can also be generated through processing plant and vehicle movement. For example wagons climbing steep hills in villages (figure 3).
Figures 3 and 4: quarry wagon ascending hill within the historic village of Cromford figure 3, (left); dislodged material after a blast at Horton Quarry (figure 4, right).
3 Case Study Methodology
The case study sites were chosen so that the impact on the historic environment of both aggregates extraction and transport, often along small country roads and through towns and villages, could be considered and for a methodology that can be replicated elsewhere, to be developed. The project identified three possible case study areas where there was deemed to be an established interaction between aggregate quarrying activity and the historic environment through noise, dust and vibration as described above. This was achieved through consultation with:
• The British Geological Survey (BGS), contractors on the project to undertake the dust analysis work. Access was gained to a database containing details of British aggregate quarries and through the Directory of Mines and Quarries (Cameron et al, 2002)
• Ordnance Survey (OS) maps and Geographical Information Systems (GIS)• English Heritage, who funded the project through the Aggregates Levy Sustainability
Fund (ALSF), predominantly the ALSF Advisers were consulted• Local authority representatives (e.g. mineral planning officers and conservation and
design officers), who were able to indicate areas of potential interest
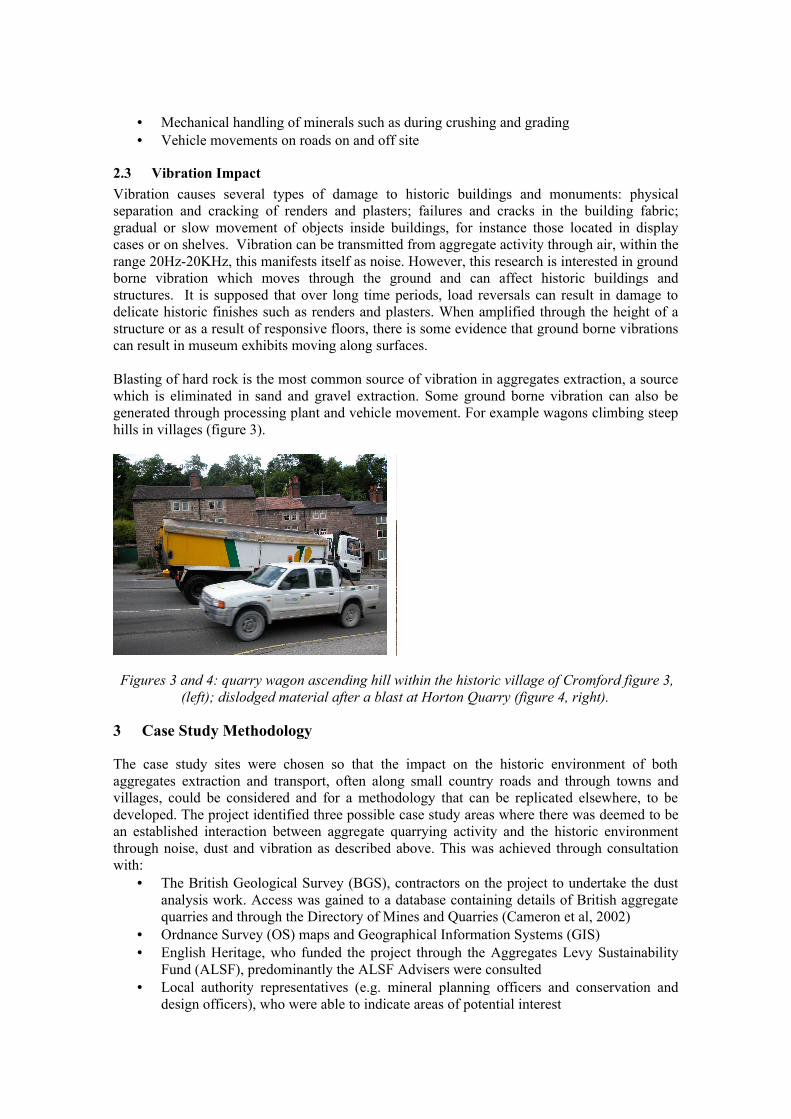
Scoping visits to the three possible areas, two in upland limestone areas in the North of England where crushed rock is quarried, the Yorkshire Dales and Derbyshire (figure 5). The other area was the Purbecks in Dorset, a low lying coastal area of southern England where sand and gravel is extracted. After visiting these areas it was acknowledged that two specific sites in the North of England stood out as displaying the interactions which would be most suitable to the projects objectives.
Figure 5: Geographical locations, within the UK, of the three areas where scoping visits were made to determine specific sites to investigate during the project.
The two case study sites selected were Horton in Ribblesdale in North Yorkshire and Cromford in Derbyshire, both produce crushed limestone aggregate. The Quarry in Horton in Ribblesdale, Horton Quarry, began operating in the 1880s, it is currently permitted to extract 600,000 tonnes per annum. The village (figure 6.) has several listed buildings and bridges and is located, in some parts, a matter of metres from the perimeter of the quarry, although this isn’t the boundary of extraction activities. The transport route for quarry wagons from the quarry runs through the village en route to depots and markets further south. Cromford holds significant cultural and historical importance. It lies within the area known as the Derwent Valley Mills, a World Heritage Site designated for its links with Richard Arkwright’s pioneering cotton mills, dating back to 1771. Dene Quarry in Cromford began operating in 1947 and currently extracts 850,000 tonnes per annum. The village (figure 7) has a high concentration of listed buildings, many of which are in close proximity to the quarry perimeter and lie within the transportation route for quarry traffic.
With the help of the project GIS and local knowledge, properties of interest identified during the scoping visits were contacted by post to ask for access to their properties during the project. A good response rate ensued, resulting in properties closely fitting the project criteria in terms of proximity to quarrying activity and transportation and historical value were selected.
3.1 Monitoring Techniques at Case Study Sites
3.1.1 Dust
The measurement strategy was a combination of short-term active sampling of airborne dust to understand how particle concentrations varied over a few hours and hence the influence of factors such as working hours and traffic levels on local dust concentrations; and passive sampling of deposited dust to assess seasonal effects and compare deposition rates at different heights and inside and outside buildings. By subjecting these dust samples to analyses which would establish mineralogy and morphology it was hoped the origin of the dust could be established
The quarrying activity in Dorset was interesting, there was also an important surrounding historic environment and the contrast between the two aggregates would have been interesting to investigate. However, the quarrying activity in this area was on a much smaller scale and didn’t exhibit the direct interaction which was found at other sites.
North Yorkshire
Derbyshire
Dorset
Figure 6 and 7: GIS output maps of case study sites, Horton in Ribblesdale, North Yorkshire (top) and Cromford, Derbyshire (bottom). Circles=Historic listed buildings, Squares=project
monitoring sites. The solid line s drawn along roads indicate quarry transport routes. On each map the quarry boundaries, bottom left corner are marked with a solid line.
For the collection of deposited dust small adhesive tabs, mounted on 11mm scanning electron microscope aluminium stubs were attached to the interior and exterior of the case study
buildings. This method has previously been employed by British Geological Survey (BGS) and is similar to the method used by Yoon and Brimblecombe [3] to collect deposited dust inside museums and historic houses. The adhesive surface of each stub was exposed to allow uninterrupted dust settlement to occur during the exposure period. The stubs were positioned on selected walls in a vertical profile at 0.2, 1 and 2 m heights above ground level. Stubs were assembled in this formation for the winter and summer sampling campaigns and retrieved after 6 weeks and then delivered to BGS for analysis.
Suspended atmospheric dust particles were counted inside and outside at each selected property using an optical particle counter (Grimm Portable Dust Monitor Series 1.100). This instrument uses a pump to draw in air and a laser technique to count the particles the air contains, the particles are classified into eight size ranges, from 0.75-15µm and > 15µm. A measurement for each size range is logged every minute, enabling a real time picture of the variation in dust concentrations over a time period to be built up. The particle counter was deployed for 2-3 hour periods at each of the case study sampling sites.
3.2 Sound Intensity MeterTwo different units were used to measure the sound intensity. The first, an inexpensive hand-held unit gave an instantaneous reading integrating the sound intensity over the last second in time. A second unit with the facility to log the aggregated sound intensity over a given period was used. The collection period was set at the lowest possible value of 1s to characterise most effectively the “soundscape” at each location. In both cases, the reading is given with respect to a decibel (dB) scale which is related to the logarithm of the ratio of the change in pressure which manifests itself as sound to the pressure representing sound at the threshold of perceptibility. A change in sound intensity of 10dB represents a doubling / halving of the underlying pressure parameter. In all cases the sound measured is weighted so that, as far as human perception of the nuisance is concerned, the reading is independent of the frequency – or pitch – of the sound. The World Health Organisation recommends noise guideline for inside dwellings in day time and evening to be 35 LAeq, T dB and inside bedrooms during the night to be 30 LAeq, T dB. Outdoors, the WHO suggests 55 LAeq, T dB as being the level at which noise becomes annoying [4].
3.3 Vibration A Vibrock seismograph was used to establish the ground borne vibrations as close as possible to the foundations of the buildings being examined. The transducer itself is a geophone which gives a readout of vibration in terms of velocity (mm/s). The unit was set to trigger at 0.1mm/s. In other words, the unit would start collecting information about vibration experienced by the geophone as soon as the level reached 0.1mm/s. This was the lowest trigger level available and was close to the resolution of the instrument.
4 Results
4.1 Dust The passive dust samplers were analysed using a Leo 435VP scanning electron microscope. The general appearance of the samples and individual particle morphology were studied on digital images of the stubs, recorded at x50 and x200 magnification. An Oxford Instruments ISIS 300 energy-dispersive x-ray fluorescence spectrometer was used to qualitatively analyse the chemical composition of particles. Samplers from 1m height indoors and outdoors were analysed using automated image analysis, based on the KS400 Petrographic Image Analysis system, to count the number of mineral particles on a representative area of the samplers. Studies of the inorganic particle morphology and chemical composition found that calcite particles dominated the outdoor samples from both Horton and Cromford. Calcite is the main mineral constituent of the limestone rock that is quarried at both sites, though it can also occur in soils formed by the natural weathering of such rock. Close examination of the calcite particle
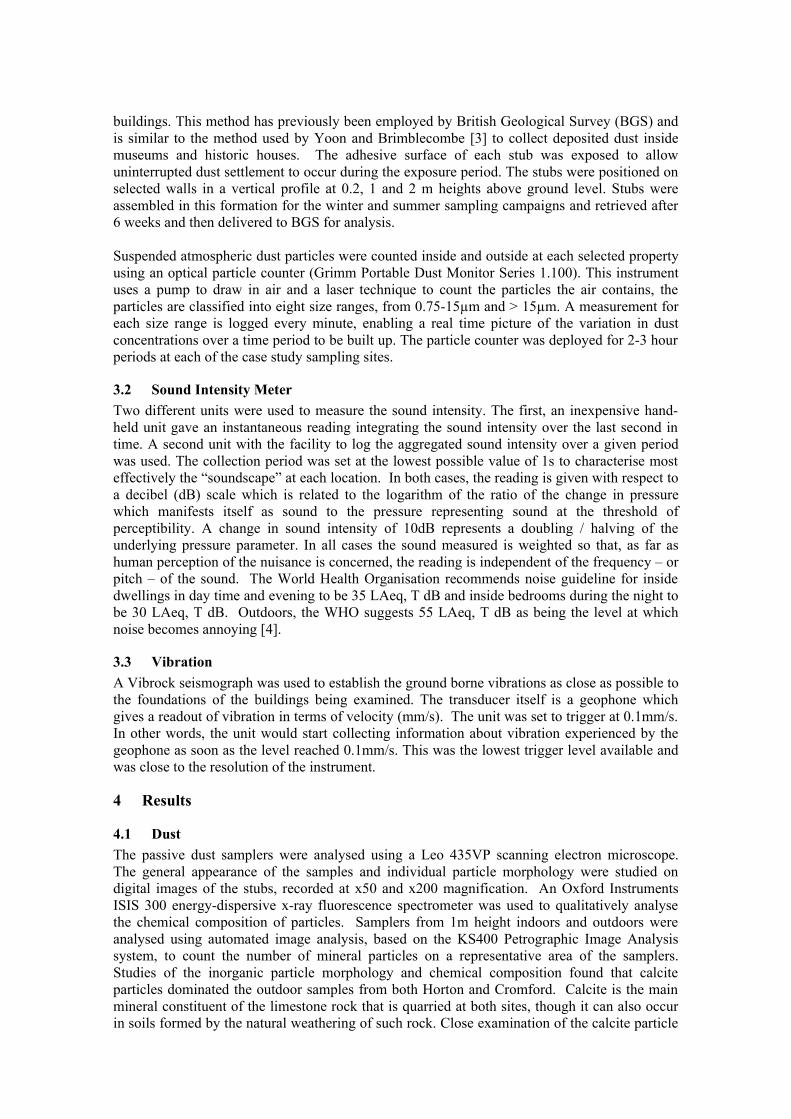
morphology showed that many particles had an angular appearance with sharp edges, as if cut in some mechanical process (figure 8). This is consistent with them being freshly formed in aggregates crushing processes at the nearby quarries. It is interesting to note that village residents at Cromford commented that dust deposited on vehicles had to be removed carefully as it was sharp to the touch and could easily scratch paintwork. Other particles were well-rounded and showed evidence of etching from rainwater dissolution, indicating that they have probably been in the environment for a longer time, or may be derived from soils (figure 9).
Figures 8 and 9: Calcite particles from outside 2 Bransghyll Terrace, Horton. Figure 8, left: angular particle, possibly from quarry processing; figure 9, right: weathered particle.
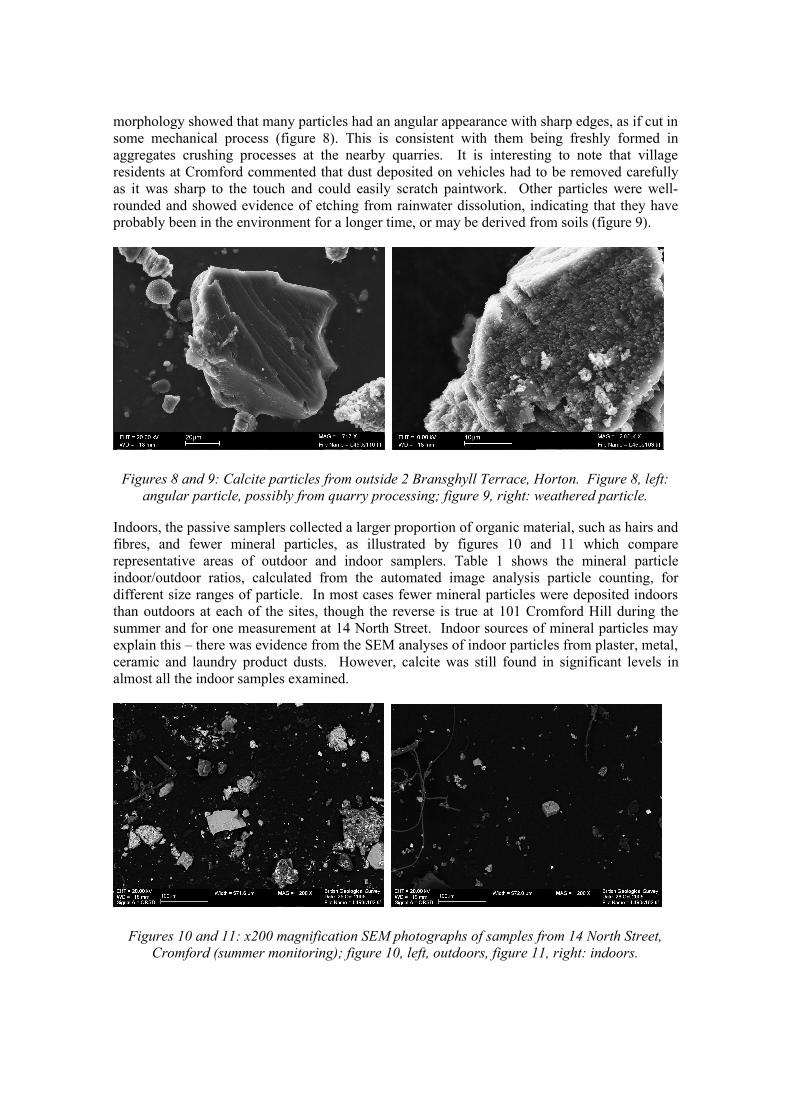
Indoors, the passive samplers collected a larger proportion of organic material, such as hairs and fibres, and fewer mineral particles, as illustrated by figures 10 and 11 which compare representative areas of outdoor and indoor samplers. Table 1 shows the mineral particle indoor/outdoor ratios, calculated from the automated image analysis particle counting, for different size ranges of particle. In most cases fewer mineral particles were deposited indoors than outdoors at each of the sites, though the reverse is true at 101 Cromford Hill during the summer and for one measurement at 14 North Street. Indoor sources of mineral particles may explain this – there was evidence from the SEM analyses of indoor particles from plaster, metal, ceramic and laundry product dusts. However, calcite was still found in significant levels in almost all the indoor samples examined.
Figures 10 and 11: x200 magnification SEM photographs of samples from 14 North Street, Cromford (summer monitoring); figure 10, left, outdoors, figure 11, right: indoors.
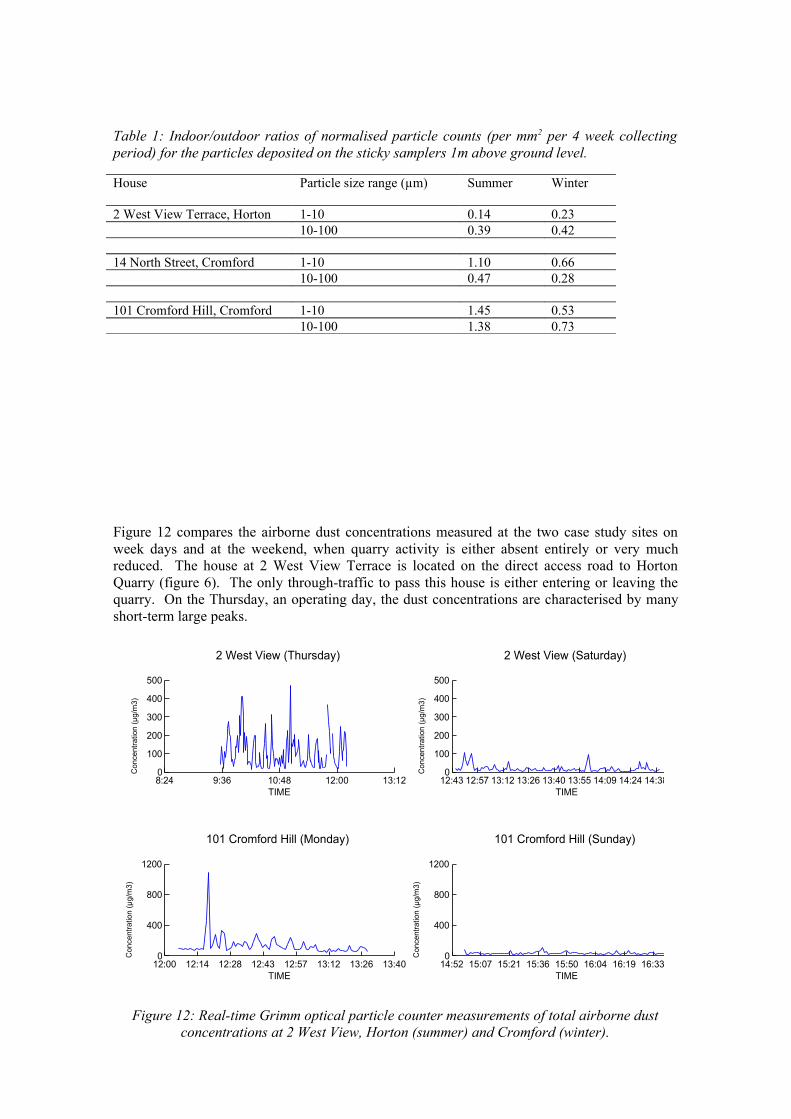
Table 1: Indoor/outdoor ratios of normalised particle counts (per mm2 per 4 week collecting period) for the particles deposited on the sticky samplers 1m above ground level.
Figure 12 compares the airborne dust concentrations measured at the two case study sites on week days and at the weekend, when quarry activity is either absent entirely or very much reduced. The house at 2 West View Terrace is located on the direct access road to Horton Quarry (figure 6). The only through-traffic to pass this house is either entering or leaving the quarry. On the Thursday, an operating day, the dust concentrations are characterised by many short-term large peaks.
Figure 12: Real-time Grimm optical particle counter measurements of total airborne dust concentrations at 2 West View, Horton (summer) and Cromford (winter).
House Particle size range (µm) Summer Winter
2 West View Terrace, Horton 1-10 0.14 0.2310-100 0.39 0.42
14 North Street, Cromford 1-10 1.10 0.6610-100 0.47 0.28
101 Cromford Hill, Cromford 1-10 1.45 0.5310-100 1.38 0.73
An examination of the size distribution of this data (not reproduced here for reasons of space) showed that the peak concentrations contained a greater proportion of large particles than the background dust, consistent with the peaks being caused by heavier particles resuspended to the air by passing vehicle wheels, or given off by the vehicles themselves, which then quickly redeposit on the ground and other surfaces. On the Saturday, when the quarry was not working, both the peak and background concentrations were much lower. This pattern is also evident, in the data from Cromford, where a much lower concentration is measured on a Sunday compared with the Monday. During all these measurements the weather conditions were similar: being dry with very little wind. These data suggest that airborne dust levels are increased by passing quarry traffic at 2 West View, Horton, but the situation is less clear at Cromford Hill, where the road is busy with many other vehicles apart from quarry wagons. These probably also contribute to the resuspension of dust deposited by quarry wagons or from other sources.
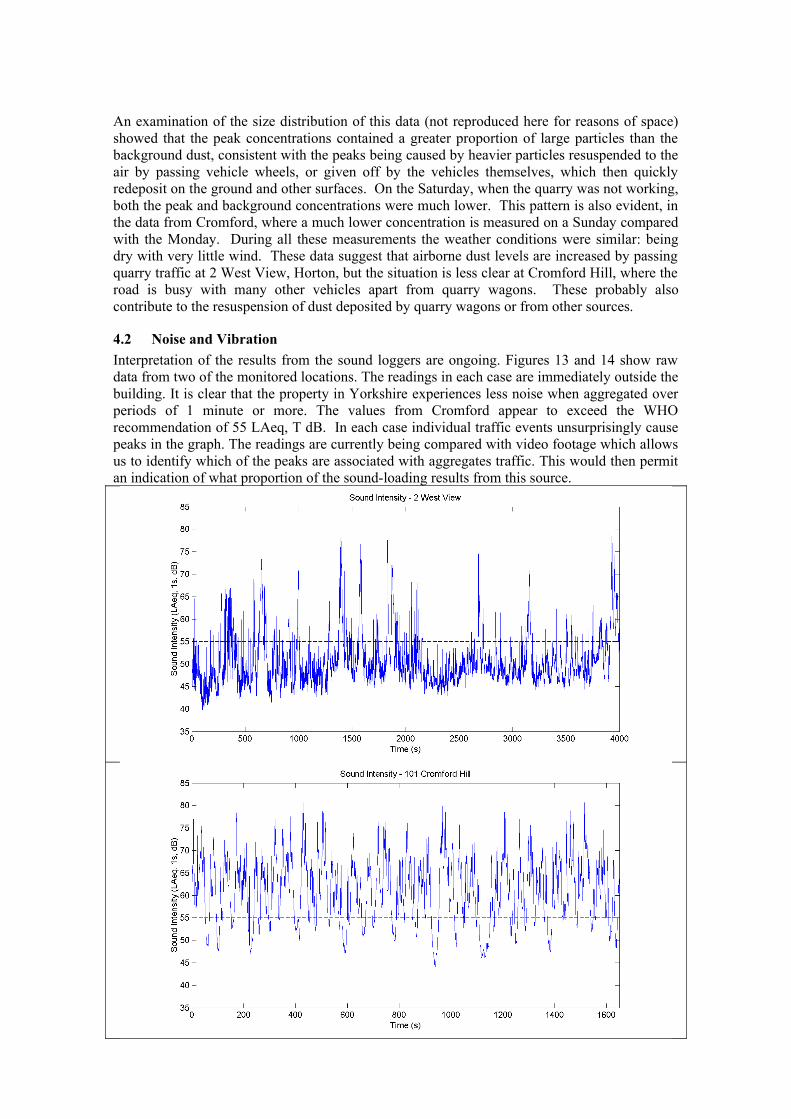
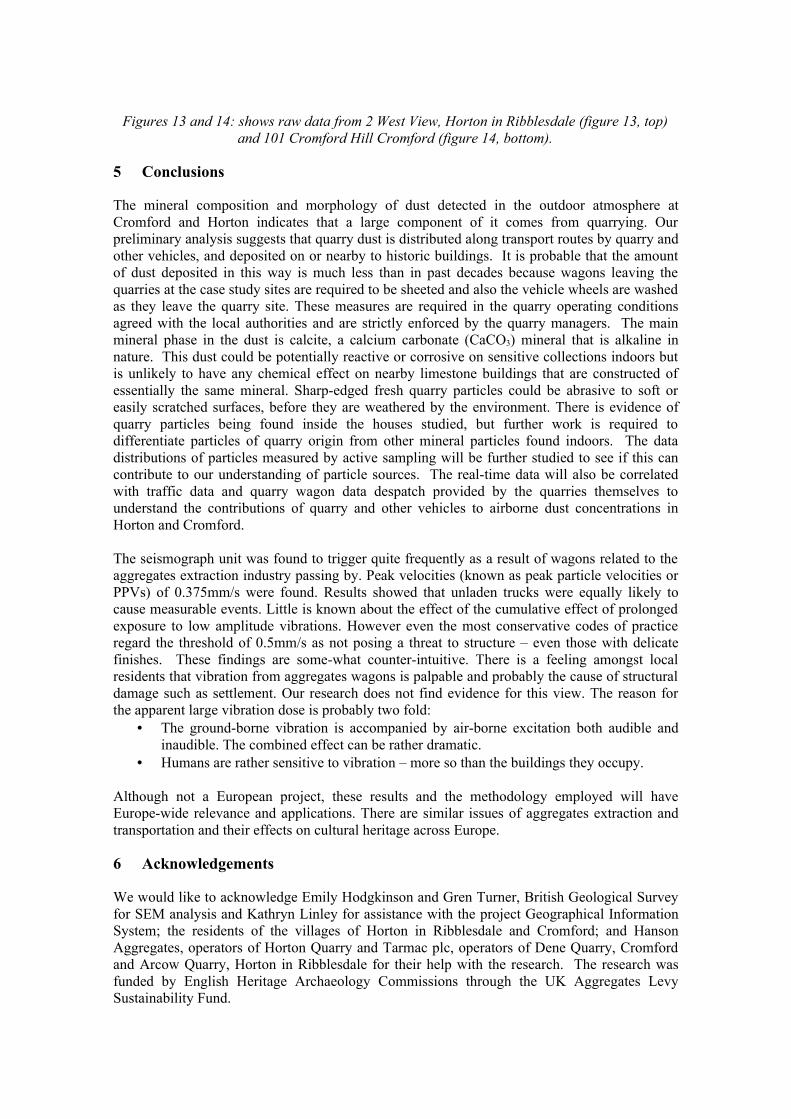
4.2 Noise and VibrationInterpretation of the results from the sound loggers are ongoing. Figures 13 and 14 show raw data from two of the monitored locations. The readings in each case are immediately outside the building. It is clear that the property in Yorkshire experiences less noise when aggregated over periods of 1 minute or more. The values from Cromford appear to exceed the WHO recommendation of 55 LAeq, T dB. In each case individual traffic events unsurprisingly cause peaks in the graph. The readings are currently being compared with video footage which allows us to identify which of the peaks are associated with aggregates traffic. This would then permit an indication of what proportion of the sound-loading results from this source.
Figures 13 and 14: shows raw data from 2 West View, Horton in Ribblesdale (figure 13, top) and 101 Cromford Hill Cromford (figure 14, bottom).
5 Conclusions
The mineral composition and morphology of dust detected in the outdoor atmosphere at Cromford and Horton indicates that a large component of it comes from quarrying. Our preliminary analysis suggests that quarry dust is distributed along transport routes by quarry and other vehicles, and deposited on or nearby to historic buildings. It is probable that the amount of dust deposited in this way is much less than in past decades because wagons leaving the quarries at the case study sites are required to be sheeted and also the vehicle wheels are washed as they leave the quarry site. These measures are required in the quarry operating conditions agreed with the local authorities and are strictly enforced by the quarry managers. The main mineral phase in the dust is calcite, a calcium carbonate (CaCO3) mineral that is alkaline in nature. This dust could be potentially reactive or corrosive on sensitive collections indoors but is unlikely to have any chemical effect on nearby limestone buildings that are constructed of essentially the same mineral. Sharp-edged fresh quarry particles could be abrasive to soft or easily scratched surfaces, before they are weathered by the environment. There is evidence of quarry particles being found inside the houses studied, but further work is required to differentiate particles of quarry origin from other mineral particles found indoors. The data distributions of particles measured by active sampling will be further studied to see if this can contribute to our understanding of particle sources. The real-time data will also be correlated with traffic data and quarry wagon data despatch provided by the quarries themselves to understand the contributions of quarry and other vehicles to airborne dust concentrations in Horton and Cromford.
The seismograph unit was found to trigger quite frequently as a result of wagons related to the aggregates extraction industry passing by. Peak velocities (known as peak particle velocities or PPVs) of 0.375mm/s were found. Results showed that unladen trucks were equally likely to cause measurable events. Little is known about the effect of the cumulative effect of prolonged exposure to low amplitude vibrations. However even the most conservative codes of practice regard the threshold of 0.5mm/s as not posing a threat to structure – even those with delicate finishes. These findings are some-what counter-intuitive. There is a feeling amongst local residents that vibration from aggregates wagons is palpable and probably the cause of structural damage such as settlement. Our research does not find evidence for this view. The reason for the apparent large vibration dose is probably two fold:
• The ground-borne vibration is accompanied by air-borne excitation both audible and inaudible. The combined effect can be rather dramatic.
• Humans are rather sensitive to vibration – more so than the buildings they occupy.
Although not a European project, these results and the methodology employed will have Europe-wide relevance and applications. There are similar issues of aggregates extraction and transportation and their effects on cultural heritage across Europe.
6 Acknowledgements
We would like to acknowledge Emily Hodgkinson and Gren Turner, British Geological Survey for SEM analysis and Kathryn Linley for assistance with the project Geographical Information System; the residents of the villages of Horton in Ribblesdale and Cromford; and Hanson Aggregates, operators of Horton Quarry and Tarmac plc, operators of Dene Quarry, Cromford and Arcow Quarry, Horton in Ribblesdale for their help with the research. The research was funded by English Heritage Archaeology Commissions through the UK Aggregates Levy Sustainability Fund.
7 References
[1] ODPM, Environmental Management Guidance Manual for SME Aggregates Companies (Pre-Publication Copy), March 2004.[2] Cameron, DG, Bartlett, E L, Coats, J S, Highly, D E, Lott, G K, Flight, D, Hillier, JA and Harrison., Directory of Mines and Quarries 2002: 6th Edition, British Geological Survey, Nottingham, 2002.[3] Yoon Y.H. and Brimblecombe P, ‘The distribution of soiling by coarse particulate matter in the
museum environment’ Indoor Air 11, 2001, pp. 232-240.[4] World Health Organisation, ‘Occupational and community noise’, Factsheet No. 258, 2001. URL: