8
| Date post: | 30-Dec-2015 |
| Category: |
Documents |
| Upload: | ori-gutierrez |
| View: | 48 times |
| Download: | 0 times |


Impact of DLFThe introduction of DLF in2008/09 created many changes to the funding methodology
> Learner-responsive age split
> Train to Gain installments
> SLN per learner ratio
In the next half an hour I amgoing to consider three, and their impact on planning andperformance management atLewisham College
Note: there will be differentapproaches to the same issues
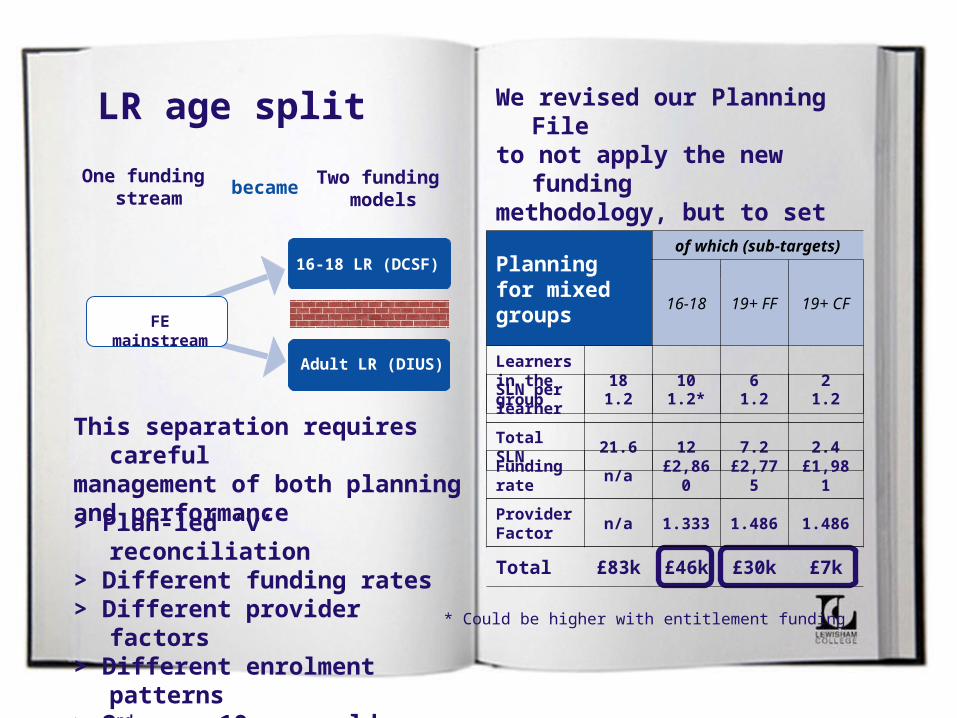
LR age split
One funding stream
Adult LR (DIUS)
16-18 LR (DCSF)
FE mainstream
Two funding models
became
* Could be higher with entitlement funding
> Plan-led ‘v’ reconciliation> Different funding rates> Different provider factors> Different enrolment patterns> 2nd year 19 year-old complexity
We revised our Planning Fileto not apply the new fundingmethodology, but to set the age and fee related sub-targets
This separation requires carefulmanagement of both planning and performance
Planning for mixed groups
of which (sub-targets)
16-1819+ FF
19+ CF
Learners in the group
18 10 6 2
SLN per learner
1.2 1.2* 1.2 1.2
Total SLN 21.6 12 7.2 2.4
Funding rate
n/a £2,860£2,77
5£1,981
Provider Factor
n/a 1.333 1.486 1.486
Total £83k £46k £30k £7k
£100
£200
£300
£400
£500
£0
Jan Feb Mar Apr May Jun Jul
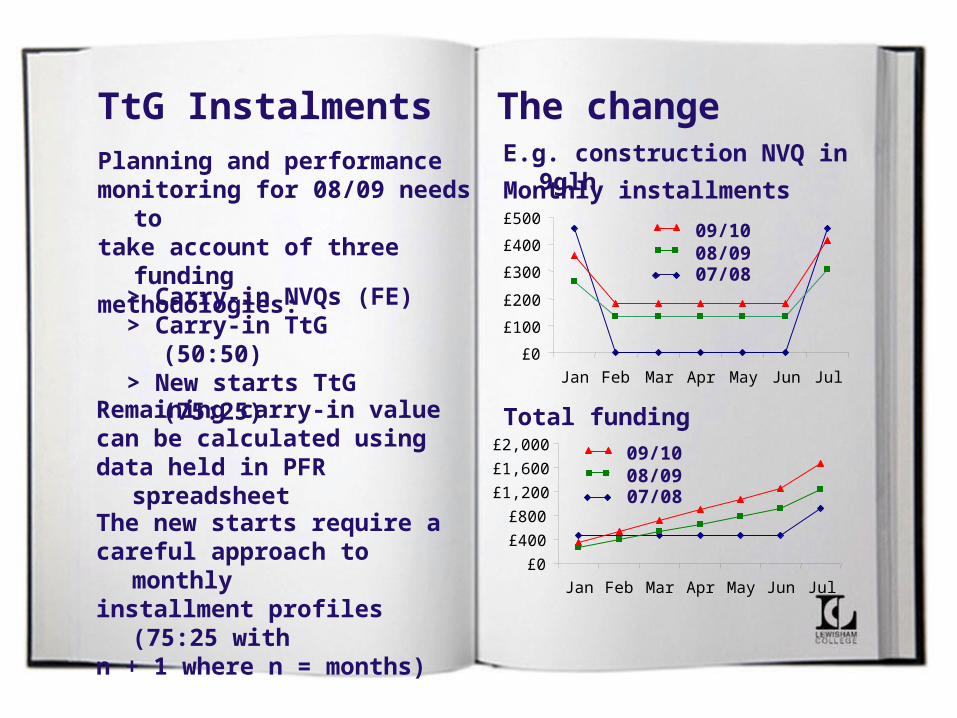
TtG InstalmentsPlanning and performancemonitoring for 08/09 needs totake account of three fundingmethodologies:
Monthly installments
Total funding
07/08
09/1008/09
> Carry-in NVQs (FE)> Carry-in TtG (50:50)> New starts TtG (75:25)
Remaining carry-in valuecan be calculated usingdata held in PFR spreadsheet
The new starts require a careful approach to monthlyinstallment profiles (75:25 withn + 1 where n = months)
The changeE.g. construction NVQ in 9glh
07/08
09/1008/09
£0
£400
£800
£1,200
£1,600
£2,000
Jan Feb Mar Apr May Jun Jul

TtG approach
We’ve focused on the newstarts to create a planningprofile which replicates the LIS
We update the profile eachmonth to include actual and adjust the remaining profile tomaintain annual funding target
SO TARGET FOR STARTSADJUSTED EACH MONTH
This becomes critical when, forexample, learners start later than planned
Our summary planning profile takes account of:
> Funding rates> Sector Subject Area> Delivery location> Start month> Duration (glh and months)> Early withdrawals> Non-achievement
This calculates a per monthfunding total, which allows usto model and monitor the yearend funding forecast
Removing the high and lowrates in 2009/10 should make planning even easieras glh becomes irrelevant

SLN per learner
More SLNs per learner equals more LSC currencyper person equals less VfM?
2200
2600
3000
3400
2007/08 2008/09 2009/10
Learners down yet SLNs up?
SLNs
Understand the FT/PT mix, evenif the LSC have stopped asking
Learners
The LSC are using this ratio toset 2009/10 allocations based on ratios in 07/08 and 08/09 F01
Do you know why and whenyour SLN ratio changes?
Shifts in learner type and/orchanges to the curriculum?
The SLN is LSC currency, theFR x PF is the exchange rate
Example above 07/08 08/09 09/10
Total learners 2500 2450 2400
Total SLNs 3000 3030 3060
FT learners 2000 2050 2100
FT SLN ratio 1.4 1.4 1.4
PT learners 500 400 300
PT SLN ratio 0.4 0.4 0.4
Total SLN ratio 1.20 1.24 1.28

And finally….This presentation and otherresources are available online
Complete your card for access
Oh, and the unofficial funding guide is proving popular with a wide range of FE staff
www.fundingguide.co.uk

Thank you
Any questions?


