30
Impact of Economic slowdown on Indian Textile and Clothing Industry A Study assigned by CITI, Texprocil, AEPC and SRTEPC. June 2009 ICRA Management Consulting Services Limited

Impact of Economic slowdown on
Indian Textile and Clothing Industry
A Study assigned by CITI, Texprocil, AEPC and SRTEPC.
June 2009
ICRA Management Consulting Services Limited

2
1. Introduction
Indian Textile and Clothing (T&C) industry is currently one of the largest and most important
industries in the Indian economy in terms of output, foreign exchange earnings and employment. The
industry contributes 4% to the country’s GDP, 14% to the country’s industrial production and around
12% to the country’s foreign exchange earnings. During 2007-08, Indian T&C exports were valued at
US $ 22.4 billion of which Textile exports accounted for US $ 12.7 billion and Garment exports
accounted for US $ 9.7 billion.
Indian T&C industry is also the second largest employment generating industry, after agriculture with
direct employment of 33.17 million1 people (as of March 2006). In addition, the industry generates
significant employment through forward and backward linkages; the large number of skilled and
unskilled activities in the industry makes it extremely important from the perspective of inclusive
growth.
Ministry of Textiles has targeted a growth of 16% per annum for the Indian T&C industry to reach
US $ 115 billion by the end of Eleventh Five Year Plan2. It also wants to secure a 7% share in global
T&C trade by the end of the Eleventh Five Year Plan. Provided the targeted growth is achieved,
Indian T&C industry has potential to employ 45 million2 people by 2012. Further, the export earnings
from this industry are estimated to increase to US $ 55 billion2 by 2012. However, during the period
April – December, 2008 T&C exports have missed the expected growth targets on account of
economic slowdown in major T&C export markets. As a result, production of T&C has also declined
during the same period as against the estimated levels under the Eleventh Plan.
Under these circumstances, the T&C industry is unlikely to achieve the envisioned targets unless the
industry makes a strategic shift in the coming year. Confederation of Indian Textile Industry (CITI)
and The Cotton Textiles Export Promotion Council (TEXPROCIL) have therefore commissioned
ICRA Management Consulting Services Limited (IMaCS) to conduct a detailed study to assess the
1 This also includes employment in Handloom, Sericulture, Handicraft and Jute industry.
2 Report of the Working Group on Textiles & Jute Industry for the Eleventh Five Year Plan

3
impact of ongoing economic slowdown on the Indian T&C industry and suggest suitable
interventions to enable sustained growth for the industry including exports.
Based on the agreed terms of reference IMaCS conducted a detailed research to analyse the impact of
the global economic slowdown on demand of T&C in select global markets i.e. EU27, UK, US and
Japan. IMaCS also conducted a detailed analysis of the performance of Indian T&C industry vis-à-vis
identified competing countries i.e. China, Bangladesh, Sri Lanka, Vietnam and Turkey through
secondary research. In addition, IMaCS conducted a primary survey of Indian T&C companies and
had detailed one-on-one discussions with the member companies of CITI, TEXPROCIL and The
Southern India Mills’ Association (SIMA). Further, IMaCS also conducted an analysis of the policy
approach impacting the Indian T&C industry as well as the policy interventions made by
Governments in competing countries. Accordingly, IMaCS has recommended certain interventions
required for the Indian T&C industry by both the Government and the Industry.
2. Analysis of Indian Textile and Clothing industry
Indian T&C market is estimated at Rs. 2.55 Trillion (2007-08) with exports accounting for 35% of the
total market value. The industry has significant dependence on exports with EU27 being the largest
export market, accounting for 33% of the total T&C exports by value in 2007-08. US is the second
largest export market for Indian T&C products with a share of 21% by value of total T&C exports in
2007-08. Other important export markets are UAE (6%), China (5%), Bangladesh (3%) and Japan
(1%).
The recent economic slowdown has significantly impacted the major export markets of Indian T&C
industry i.e. EU27, US and Japan thus, negatively impacting the Indian T&C industry. During Apr –
Dec 2008, India’s garment exports grew by 7% (y-o-y) as against a growth of 9% (y-o-y) in FY08
whereas India’s Textile exports declined by 4% (y-o-y) as against a growth of 21% (y-o-y) in FY08.
Decline in export demand has resulted in drop in production of T&C industry. The Index of Industrial
Production (IIP) for Cotton textiles has declined by 3.7% (y-o-y) in Dec 2008, 6.2% (y-o-y) in Jan
2009 and 12.1% (y-o-y) in Feb 2009. Decline has also been observed in the IIP for Textile products
including apparel (2.3% y-o-y in Feb 2009). This has severely affected the financial performance of
Indian T&C industry. Analysis of a sample of Indian T&C companies reveals that both operating
profit margin and net profit margin have declined significantly from Q3FY08 to Q3FY09 (refer Table

4
2.1). Majority of surveyed T&C manufacturers have reported an order book status of 15 days to a
month thus, indicating a pessimistic future outlook.
Table 2.1: Net profit margin of Indian T&C companies3
Q3
FY08
Q4
FY08
Q1
FY09
Q2
FY09
Q3
FY09
Spinning companies -3% -8% -5% -9% -18%
Weaving companies 7% 5% 4% 4% 3%
Garment companies 7% 7% 6% 5% 1%
Made-ups companies 3% 0% -4% -4% -2%
Over the last few years, Indian T&C industry had witnessed debt-funded capacity expansion,
primarily driven by interest compensation under TUFS. The recent drop in production has resulted in
under utilisation of capacities leading to inadequate absorption of fixed costs and weak debt coverage
indicators. As highlighted in Table 2.2, the interest coverage ratio of T&C manufacturers has declined
significantly from Q3FY08 to Q3FY09.
Table 2.2: Interest coverage ratio4 of Indian T&C companies
3
Q3
FY08
Q4
FY08
Q1
FY09
Q2
FY09
Q3
FY09
Spinning companies 0.6 Negative 0.3 Negative Negative
Weaving companies 2.9 3.1 1.9 2.1 1.8
Garment companies 4.5 4.3 3.4 2.3 1.6
Made-ups companies 1.8 0.9 0.3 Negative 0.7
Decline in production of T&C industry has also negatively influenced employment in the sector.
Since information from primary survey was not sufficient to draw statistically significant inferences
regarding job loss in this industry, IMaCS has analysed the job loss in Indian T&C industry based on
3 Based on analysis of a sample of 81 Indian companies
4 Interest coverage ratio has been calculated by dividing earnings before interest and taxes (EBIT) by the interest
expenses of the same period. The lower the ratio, the more the company is burdened by debt expense.

5
the decline in average IIP5. The average IIP for Textiles and Textile products has witnessed decline of
1.44% (month-on-month average) from June 2008 to February 2009; considering that T&C industry
has not witnessed any major technological change over the nine month period under discussion, the
loss in production of 1.44% is estimated to have resulted in a loss of 5 – 6 lakh jobs.
3. Impact of economic slowdown on the demand of textile and clothing
3.1 Impact of economic slowdown on T&C imports by EU27
EU27 is the largest export market for Indian T&C industry, accounting for 33% of India’s total T&C
exports by value in 2007-08. It is the largest export market for Indian yarn (accounting for 17% of
India’s total yarn export by value) and Indian garments (accounting for 47% of India’s total garment
export by value) as well as the second largest export market for fabric (accounting for 13% of the
total fabric export by value) and Indian made-ups (accounting for 39% of India’s total made-ups
export by value) in 2007-08.
EU27 witnessed an economic slowdown from the third quarter of 2008 with its GDP declining by
0.2% (quarter on quarter) in Q3, 2008, followed by a decline of 1.5% in Q4, 2008.
Table 3.1: Increase / decrease in T&C imports by EU27 in value terms during 2008 (2007)
Q1 Q2 Q3 Q4 Jan- Dec
Yarn -8% -10% -15% -21% -13%
(5%) (-0.2%) (2%) (-2%) (1%)
Fabric -9% -13% -12% -18% -13%
(3%) (0%) (-0.1%) (-4%) (-0.2%)
Garments -0.6% 0.3% 0.8% 0.6% 0.3%
(6%) (5%) (5%) (4%) (5%)
Made-ups -3% -0.7% 0.4% -4% -2%
(10%) (4%) (10%) (5%) (7%)
Total T&C -2.3% -2.5% -1.8% -5% -2.9%
(5%) (3.3%) (4.6%) (2.4%) (4.0%)
As seen from Table 3.1, yarn imports by EU27 witnessed an impact of this economic slowdown with
value-wise yarn imports declining by 15% (y-o-y) in Q3, 2008 (as against an increase of 2% y-o-y in
5 Refer Annexure III of the report for details

6
Q3, 2007) and 21% (y-o-y) in Q4, 2008 (as against a decline of 2% in Q4, 2007). Likewise, value-
wise fabric imports declined by 12% (y-o-y) in Q3, 2008 and by 18% (y-o-y) in Q4, 2008.
Impact of economic slowdown was also observed in garment imports with the import value almost
stagnating in Q3, 2008 and Q4, 2008 (as against an increase of 5% y-o-y and 4% y-o-y respectively in
the same period of previous year). The import of made-ups by EU27 also registered a decline of 4%
(y-o-y) by value in Q4, 2008 as against an increase of 5% (y-o-y) in Q4, 2007.
3.2 Impact of economic slowdown on T&C imports by UK
UK is the largest export market for Indian T&C industry in the EU27, accounting for 7.5% of India’s
total T&C exports by value in 2007-08. The country accounts for 1.5% of India’s total yarn export
value, 4.7% of India’s total fabric export value, 12.3% of India’s total garment export value and 7%
of India’s total made-ups export value in 2007-08.
UK witnessed an economic slowdown from Q3, 2008 with its GDP falling by 1.5% in Q4, 2008 after
a 0.6% drop in the previous quarter.
Table 3.2: Increase / decrease in T&C imports by UK in value terms during 2008 (2007)
Q1 Q2 Q3 Q4 Jan- Dec
Yarn -16% -12% -21% -20% -17%
(-4%) (-7%) (-5%) (-11%) (-7%)
Fabric -11% -19% -22% -24% -19%
(-0.6%) (7%) (3%) (-6%) (0.5%)
Garments -11% -13% -7% -3% -9%
(1%) (4%) (3%) (-1%) (2%)
Made-ups -12% -11% -15% -9% -12%
(13%) (2%) (4%) (-10%) (2%)
Total T&C -11% -13% -10% -7% -10%
(1.6%) (3.2%) (2.9%) (-2.4%) (1.3%)
As observed in Table 3.2, yarn imports by UK witnessed an impact of economic slowdown with
value-wise imports declining by 21% (y-o-y) in Q3, 2008 (as against a decline of 5% y-o-y in Q3,
2007) and by 20% (y-o-y) in Q4, 2008 (as against a decline of 11% y-o-y in Q4, 2007). Likewise,

7
value-wise fabric imports declined by 22% (y-o-y) in Q3, 2008 (as against an increase of 3% y-o-y in
Q3, 2007) and by 24% (y-o-y) in Q4, 2008 (as against a decline of 6% y-o-y in Q4, 2007).
Garment imports in value terms declined significantly in Q1, 2008 (by 11% y-o-y), Q2, 2008 (by 13%
y-o-y) and Q3, 2008 (by 7% y-o-y) as against an increase in each of the three quarters of 2007;
though the decline moderated in Q4, 2008 (to 3% y-o-y). Made-ups imports by UK also witnessed a
significant decline during 2008 with made-ups import value declining by 12% (y-o-y) in Q1, 2008,
11% (y-o-y) in Q2, 2008, 15% (y-o-y) in Q3, 2008 and 9% (y-o-y) in Q4, 2008.
3.3 Impact of economic slowdown on T&C imports by US
US is the second largest export market for Indian T&C industry, accounting for 21% of India’s total
T&C exports by value in 2007-08. The country is the largest export market for Indian made-ups
(accounting for 43% of India’s total made-ups export value) and the second largest export market for
garments (accounting for 28% of India’s total garment export value). Indian T&C industry also
exports yarn and fabric to US however, US accounts for only 2% and 6% share of India’s total yarn
export value and fabric export value, respectively.
Economic growth in US fell by 0.3% between June and September, 2008. Retail sales of clothing and
clothing accessories in US started declining from September, 2008 with a significant decline in
November, 2008 (by 8% y-o-y), December, 2008 (by 10% y-o-y) and January, 2009 (by 10% y-o-y)
owing to the economic slowdown and resulting drop in expenditure. On account of reduced sales, the
inventory to sales ratio of the US clothing and clothing accessories stores has increased from 2.55 in
September, 2008 to 2.73 in December 2008.

8
Table 3.3 (a): Increase / decrease in T&C imports by US in value terms during 2008 (2007)
Q1 Q2 Q3 Q4 Jan- Dec
Yarn -9% -10% -4% -13% -9%
(-11%) (-12%) (-10%) (-4%) (-9%)
Fabric -0.04% -5% -6% -19% -7%
(-2%) (0%) (3%) (4%) (1%)
Garments -5% -3% -2% -3% -3%
(10%) (4%) (1%) (-1%) (3%)
Made-ups 1% -0.3% -3% -6% -2%
(7%) (5%) (7%) (7%) (6%)
Total T&C -3.8% -2.7% -2.4% -4.5% -3.3%
(8%) (3.5%) (1.9%) (0.7%) (3.4%)
Table 3.3 (b): Increase / decrease in T&C imports by US in value terms during 2009 (2008)
Jan Feb
Yarn -27% -29%
(-6%) (-5%)
Fabric -25% -32%
(3.5%) (4%)
Garments -6% -17%
(-5%) (1.8%)
Made-ups -11% -24%
(-0.6%) (11%)
Total T&C -8% -19%
(-4%) (3.8%)
As observed in Table 3.3(a), garment imports by US witnessed a decline since Q1, 2008 with garment
import value declining by 3.2% (y-o-y) in Jan – Dec 2008 (as against an increase of 3.2% y-o-y in
2007). As seen from Table 3.3(b), decline in garment imports continued in 2009 with the import value
declining by 6.3% (y-o-y) in January 2009 and by 16.5% (y-o-y) in February, 2009.
Jan – Dec 2008 also witnessed a decline of 2.1% (y-o-y) in made-ups import value by US (as against
an increase of 6.4% y-o-y in 2007). Decline in made-ups import value worsened in H2, 2008 with
import value declining by 3% (y-o-y) in Q3, 2008 (as against an increase of 7% y-o-y in Q3, 2007)

9
and by 6% (y-o-y) in Q4, 2008 (as against an increase of 7% in Q4, 2007). Decline in imports
continued in 2009 with made-ups import value declining by 10.7% (y-o-y) in January 2009 and
23.6% (y-o-y) in February 2009.
Yarn import value by US also declined in each quarter of 2008 however, in line with the decline
observed in 2007; the trend continued in January 2009 and February 2009 with value-wise yarn
imports declining by 26.5% (y-o-y) and 28.5% (y-o-y) respectively. Fabric imports by US declined
19% (y-o-y) by value in Q4, 2008 (as against an increase of 4% y-o-y in Q4, 2007) indicating an
impact of economic slowdown. Decline in fabric imports continued in 2009, with import value
declining by 25.2% (y-o-y) and 31.5% (y-o-y) in January and February respectively.
3.4 Impact of economic slowdown on T&C imports by Japan
Japan accounts for only 1% of India’s total T&C export value (2007-08); China being the major
exporter of textile and clothing products to Japan, accounts for over 70% of Japan’s total T&C
imports.
Japan accounts for 2.2% of India’s total yarn export value, 0.4% of India’s total fabric export value
and 1.4% of India’s total made-ups export value in 2007-08. Though Japan is world’s third largest
importer of garments with a share of 6.7% in world clothing imports in 2007, the country accounts for
only 1.1% of India’s total garment export value in 2007-08.
Japan is witnessing an economic slowdown with the country’s economy shrinking by 0.1% in Q3,
2008 after shrinking by 0.9% in the April to June, 2008.

10
Table 3.4: Increase / decrease in T&C imports by Japan in value terms during 2008
Q1 Q2 Q3 Q4 Jan- Dec
Yarn -2% -0.7% -2% -17% -5%
Fabric -3% -5% 5% -14% -5%
Garments -7% -10% -3% -3% -6%
Made-ups -3% -4% 7% 3% 0.8%
Total T&C -6% -9% -1.7% -4.1% -5%
As observed in Table 3.4, value-wise yarn imports by Japan declined by 17% (y-o-y) in Q4, 2008
indicating an impact of economic slowdown. Decline in yarn imports continued in January 2009 with
import value declining by 31.6% (y-o-y). Similar trend was observed in fabric imports with import
value declining by 14% (y-o-y) in Q4, 2008 and by 22.4% (y-o-y) in January 2009.
Value-wise garment imports by Japan witnessed a significant decline in Q1, 2008 (by 7% y-o-y) and
Q2, 2008 (by 10% y-o-y) however, the decline moderated to 3% (y-o-y) in Q3, 2008 and Q4, 2008.
The trend reversed in January 2009 with garment import value increasing by 7.5% (y-o-y) (as against
a decline of 2.5% y-o-y in January 2008). Made-ups imports by Japan witnessed a growth of 7% (y-o-
y) in Q3, 2008 and 3% (y-o-y) in Q4, 2008 in value terms. The trend continued in January 2009 with
import value increasing by 11% (y-o-y).
4. Comparative performance of Indian T&C industry in identified global markets
4.1 Yarn exports to identified global markets
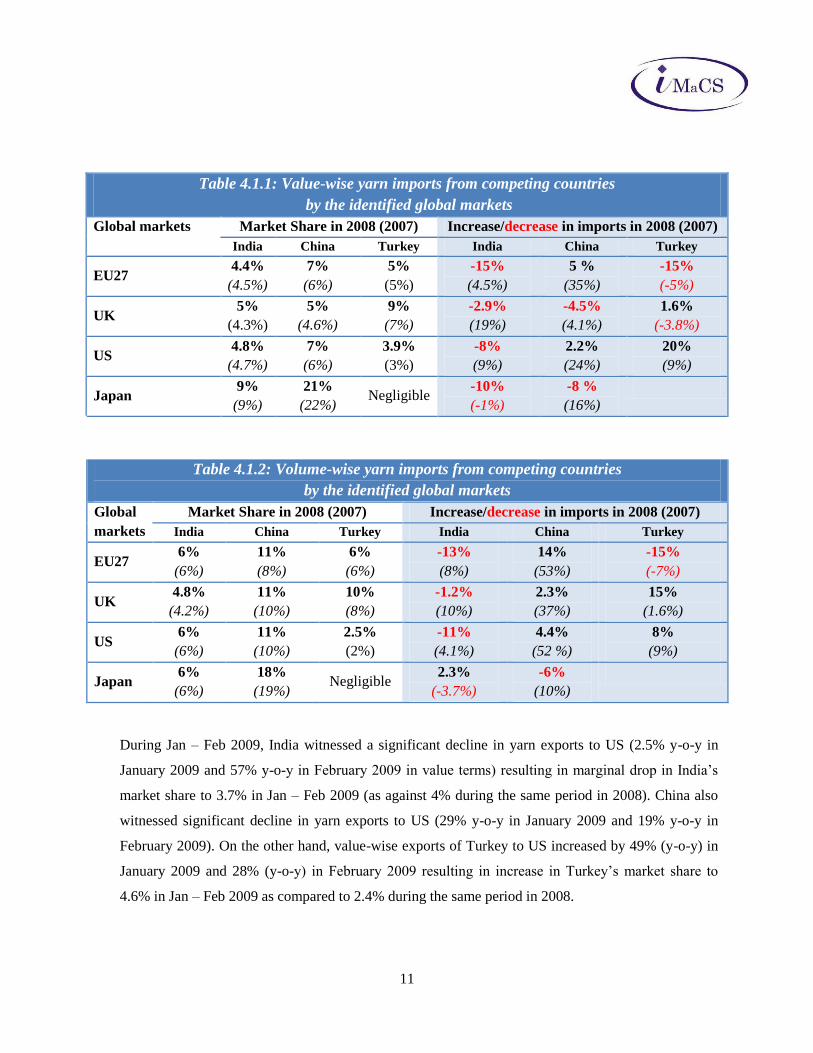
As observed in Table 4.1.1, India maintained its value share in the yarn imports of EU27, US and
Japan and registered marginal gain in value share of UK’s yarn imports during 2008. However, owing
to the decline in total yarn imports by these markets, India’s value-wise yarn exports to these regions
declined significantly. On the other hand, China’s yarn exports to EU27 and US increased in value
terms. Turkey also witnessed an increase in export value to US and UK.
11
Table 4.1.1: Value-wise yarn imports from competing countries
by the identified global markets
Global markets Market Share in 2008 (2007) Increase/decrease in imports in 2008 (2007)
India China Turkey India China Turkey
EU27 4.4%
(4.5%)
7%
(6%)
5%
(5%)
-15%
(4.5%)
5 %
(35%)
-15%
(-5%)
UK 5%
(4.3%)
5%
(4.6%)
9%
(7%)
-2.9%
(19%)
-4.5%
(4.1%)
1.6%
(-3.8%)
US 4.8%
(4.7%)
7%
(6%)
3.9%
(3%)
-8%
(9%)
2.2%
(24%)
20%
(9%)
Japan 9%
(9%)
21%
(22%) Negligible
-10%
(-1%)
-8 %
(16%)
Table 4.1.2: Volume-wise yarn imports from competing countries
by the identified global markets
Global
markets
Market Share in 2008 (2007) Increase/decrease in imports in 2008 (2007)
India China Turkey India China Turkey
EU27 6%
(6%)
11%
(8%)
6%
(6%)
-13%
(8%)
14%
(53%)
-15%
(-7%)
UK 4.8%
(4.2%)
11%
(10%)
10%
(8%)
-1.2%
(10%)
2.3%
(37%)
15%
(1.6%)
US 6%
(6%)
11%
(10%)
2.5%
(2%)
-11%
(4.1%)
4.4%
(52 %)
8%
(9%)
Japan 6%
(6%)
18%
(19%) Negligible
2.3%
(-3.7%)
-6%
(10%)
During Jan – Feb 2009, India witnessed a significant decline in yarn exports to US (2.5% y-o-y in
January 2009 and 57% y-o-y in February 2009 in value terms) resulting in marginal drop in India’s
market share to 3.7% in Jan – Feb 2009 (as against 4% during the same period in 2008). China also
witnessed significant decline in yarn exports to US (29% y-o-y in January 2009 and 19% y-o-y in
February 2009). On the other hand, value-wise exports of Turkey to US increased by 49% (y-o-y) in
January 2009 and 28% (y-o-y) in February 2009 resulting in increase in Turkey’s market share to
4.6% in Jan – Feb 2009 as compared to 2.4% during the same period in 2008.

12
Price realisation in terms of Euros/kg of yarn was also affected in 2008 with average price realisation
for yarn exports to EU27 declining by 1.4% (y-o-y) and that for yarn exports to UK declining by
2.2% (y-o-y).
4.2 Fabric exports to identified global markets
As seen from Table 4.2.1, India’s value-wise fabric exports to EU27 (which is the second largest
export market for Indian fabric) declined by 7% (y-o-y) during 2008. However, on account of decline
in total fabric imports by EU27, India maintained its value share in the fabric imports of EU27.
India’s fabric exports to US increased significantly (23% y-o-y by value) during 2008 resulting in
increase in market share. China witnessed an increase in fabric exports to EU27 and US resulting in
increase in market share whereas Turkey witnessed a significant decline in exports to each of the
identified global markets.
Table 4.2.1: Value-wise fabric imports from competing countries
by the identified global markets
Global
markets
Market Share in 2008 (2007) Increase/decrease in imports in 2008 (2007)
India China Turkey India China Turkey
EU27 2.1%
(2%)
10%
(9%)
7%
(7%)
-7%
(-3.2%)
1.9%
(8%)
-14%
(5%)
UK 8%
(7%)
8%
(8%)
8%
(9%)
-11%
(-1.7%)
-18%
(7%)
-23%
(9%)
US 4.2%
(3.2%)
22%
(18%)
2.5%
(2.4%)
23%
(1.5%)
11%
(10%)
-5%
(6%)
Japan 1.4%
(1.4%)
42%
(41%)
0.6%
(0.7%)
-0.5%
(29 %)
-3.1%
(2.1%)
-19%
(16%)

13
Table 4.2.2: Volume-wise fabric imports from competing countries
by the identified global markets
Global
markets
Market Share in 2008 (2007) Increase/decrease in imports in 2008 (2007)
India China Turkey India China Turkey
EU27 3.1%
(3.7%)
18%
(19%)
8%
(9%)
-9%
(2.1%)
3%
(19%)
-11%
(7%)
UK 8%
(8%)
12%
(12%)
6%
(7%)
-13%
(-13%)
-16%
(8%)
-23 %
(5%)
US 6%
(4.6%)
22%
(18%)
1.7%
(1.9%)
27%
(1.8%)
8%
(4.5%)
-16%
(13%)
Japan 2.9%
(2.7%)
48%
(50%) Negligible
8%
(20%)
-3.4%
(-3.5%)
During Jan – Feb 2009, India witnessed a significant decline in fabric exports to US (5.4% y-o-y in
January 2009 and 35% y-o-y in February 2009 in value terms) however, India’s market share
increased marginally to 4% in Jan – Feb 2009 (as against 3.6% during the same period in 2008) on
account of a significant decline in total fabric imports by US during the same period. China also
witnessed significant decline in fabric exports to US (21% y-o-y in January 2009 and 37% y-o-y in
February 2009). Decline was also observed in Turkey’s fabric exports to US with export value
declining by 37% (y-o-y) in January 2009 and by 28% (y-o-y) in February 2009.
4.3 Garment exports to identified global markets
As observed in Table 4.3.1, India’s garment exports to US declined by 3% (y-o-y) in value terms
during 2008. Since total garment imports by US declined by 3% (y-o-y) during the same period, India
maintained its value share in the garment imports of US. On the other hand, despite decrease in total
garment imports by US during 2008, Bangladesh and Vietnam witnessed a significant increase in
garment export to US.
India’s garment exports to EU27 increased by 3.2% (y-o-y) during 2008 resulting in marginal
increase in market share however, Bangladesh, China, Sri Lanka and Vietnam witnessed
comparatively higher increase in their garment export value to EU27. India’s garment export to Japan
increased by 5% y-o-y during 2008.

14
Table 4.3.1(a): Value-wise garment imports from competing countries
by the identified global markets
Global
markets
Market Share in 2008 (2007) Increase/decrease in imports in 2008 (2007)
India Bangladesh China India Bangladesh China
EU27 3.8%
(3.7%)
4.2%
(3.9%)
24%
(21%)
3.2%
(1.1%)
7%
(-4.6%)
14%
(14%)
UK 6%
(6%)
6%
(5 %)
33%
(26%)
-6%
(14%)
-1.1%
(-2.7%)
17%
(12%)
US 4.3%
(4.3%)
4.8%
(4.2%)
32%
(31%)
-3%
(-0.5%)
11%
(7%)
0.8%
(23%)
Japan 0.8%
(0.7%) Negligible
84%
(84%)
5%
(-10%) -5%
(2.5%)
Table 4.3.1(b): Value-wise garment imports from competing countries
by the identified global markets
Global
markets
Market Share in 2008 (2007) Increase/decrease in imports in 2008 (2007)
Sri Lanka Turkey Vietnam Sri Lanka Turkey Vietnam
EU27 1%
(1%)
7%
(8%)
1.2%
(1%)
8%
(7%)
-11%
(8%)
10%
(11%)
UK 3.9%
(3.3%)
10%
(12%)
1.5%
(1.3%)
6%
(0.3%)
-27%
(9%)
10%
(9%)
US 2.1%
(2.1%)
0.6%
(0.8%)
7%
(6%)
-7%
(-7%)
-28%
(-23%)
20%
(35%)
Japan Negligible Negligible 3.5%
(3.1%) 7%
(13%)
Table 4.3.2(a): Volume-wise garment imports from competing countries
by the identified global markets
Global
markets
Market Share in 2008 (2007) Increase/decrease in imports in 2008 (2007)
India Bangladesh China India Bangladesh China
EU27 3%
(4%)
6%
(8%)
28%
(34%)
3.9%
(6%)
7%
(-1.2 %)
12%
(14%)
UK 6%
(6%)
9%
(9%)
35%
(32%)
1.5%
(22%)
3.6%
(-1.2 %)
14%
(22%)
US 3.9%
(3.7%)
6%
(6%)
34%
(34%)
1.7%
(3.3%)
6%
(3.4%)
-3.1%
(24%)
Japan 0.5%
(0.4%) Negligible
91%
(92%)
1.2%
(-16 %)
-1.9%
(-2.3%)

15
Table 4.3.2(b): Volume-wise garment imports from competing countries
by the identified global markets
Global
markets
Market Share in 2008 (2007) Increase/decrease in imports in 2008 (2007)
Sri Lanka Turkey Vietnam Sri Lanka Turkey Vietnam
EU27 0.9%
(1.2%)
4.6%
(7%)
1.6%
(3.1%)
6%
(7%)
-12%
(3.7%)
-30%
(25%)
UK 3.7%
(3.6%)
7%
(9%)
2%
(2%)
9%
(9%)
-22%
(3.7%)
2.4%
(17%)
US 1.7%
(1.8%)
0.3%
(0.5%)
7%
(5%)
-7 %
(-9%)
-38%
(-33%)
20%
(34%)
Japan Negligible Negligible 2.9%
(2.5%)
15%
(12%)
During Jan – Feb 2009, India’s garment exports to US in value terms declined by 7.8% (y-o-y) in
January 2009 and 8.6% (y-o-y) in February 2009, though India maintained its market share in US
garment import value on account of decline in total garment imports by US during the same period.
Unlike India, China and Vietnam witnessed an increase in garment exports to US during January
2009 (7.5% y-o-y and 16% y-o-y respectively in value terms) but exports declined in February 2009
(12% y-o-y and 6% y-o-y respectively in value terms). As a result, market share of China in Jan – Feb
2009 increased to 33% (as against 29% during the same period in 2008) and that of Vietnam
increased to 8.5% (as against 7.2% during the same period in 2008). Bangladesh witnessed an
increase in the garment export value to US by 15% (y-o-y) in each of January 2009 and February
2009, hence its market share increased to 6% in Jan – Feb 2009 (as against 4.6% during the same
period in 2008).
4.4 Made-ups exports to identified global markets
As seen from Table 4.4.1, India’s made-ups exports to EU27 declined by 6% (y-o-y) in value terms as
against Bangladesh and China who witnessed a significant increase in made-ups exports by value
during 2008. However, India maintained its value share in the made-ups imports of EU27 since the
total made-ups imports by EU27 declined during the same period.
India’s made-ups exports to US witnessed a growth of 2.1% (y-o-y) though the growth moderated as
compared to 2007 (5% y-o-y).

16
Table 4.4.1 (a): Value-wise made-ups imports from competing countries
by the identified global markets
Global
markets
Market Share in 2008 (2007) Increase/decrease in imports in 2008 (2007)
India Bangladesh China India Bangladesh China
EU27 7%
(7%)
2.1%
(1.9%)
23%
(21%)
-6%
(11%)
8%
(19%)
6%
(9%)
UK 11%
(11%)
5%
(5%)
35%
(31%)
-12%
(10%)
-11%
(-3%)
-0.2%
(2.1%)
US 11%
(11%)
0.6%
(0.6%)
56%
(55%)
2.1%
(5%)
9%
(7%)
0.7%
(12%)
Japan 1.2%
(1.2%) Negligible
84%
(84%)
1.9%
(-0.5%) 1.3%
(3.4%)
Table 4.4.1 (b): Value-wise made-ups imports from competing countries
by the identified global markets
Global
markets
Market Share in 2008 (2007) Increase/decrease in imports in 2008 (2007)
Sri Lanka Turkey Vietnam Sri Lanka Turkey Vietnam
EU27 Negligible 10%
(10%)
0.9%
(0.9%) -7%
(2.5%)
-6%
(8%)
UK Negligible 8%
(9%)
0.7%
(0.7%) -25%
(-7%)
-17%
(0%)
US Negligible 2.3%
(2.7%)
1.1%
(1.1%) -15%
(-2.1%)
-1.8%
(8%)
Japan Negligible Negligible 3.4%
(3.2%) 4.5%
(9%)
Table 4.4.2 (a): Volume-wise made-ups imports from competing countries
by the identified global markets
Global
markets
Market Share in 2008 (2007) Increase/decrease in imports in 2008 (2007)
India Bangladesh China India Bangladesh China
EU27 9%
(9%)
3.2%
(2.7%)
30%
(28%)
-1.8%
(15%)
16%
(18%)
8%
(16%)
UK 13%
(14%)
7%
(7%)
35%
(33%)
-9%
(11%)
0.2%
(3.6%)
3.3%
(19%)
US 8%
(7%)
1.4%
(1.1%)
64%
(64%)
1.2%
(2.1%)
14%
(10%)
-6%
(10%)
Japan 0.9%
(0.8%)
0.7%
(0.6%)
86%
(86%)
14%
(-7%)
24%
(7%)
1.8%
(-0.4%)

17
Table 4.4.2(b): Volume-wise made-ups imports from competing countries
by the identified global markets
Global
markets
Market Share in 2008 (2007) Increase/decrease in imports in 2008 (2007)
Sri Lanka Turkey Vietnam Sri Lanka Turkey Vietnam
EU27 Negligible 9%
(9%)
1.4%
(1.5%) -7%
(1.9%)
-5%
(9%)
UK Negligible 6%
(7%)
0.8%
(1.1%) -16%
(-11%)
-24%
(3.6%)
US Negligible 1.6%
(1.7%)
0.8%
(0.6%)
-14%
(-10%)
29%
(-17%)
Japan Negligible Negligible 4.6%
(4.6%)
2%
(2.2%)
During Jan – Feb 2009, India witnessed a decline in made-ups exports to US (11% y-o-y in January
2009 and 24% y-o-y in February 2009 in value terms) but India was able to maintain its market share
at 12.7% owing to a decline in total made-ups imports by US during the same period. China also
witnessed significant decline in made-ups exports to US (6% y-o-y in January 2009 and 29% y-o-y in
February 2009). Imports from Vietnam witnessed an increase in January 2009 (50% y-o-y in value
terms) followed by a marginal decline in February 2009 (3% y-o-y in value terms) resulting in increase
in its market share in Jan – Feb 2009 to 1.6% (as against 1.1% during the same period in 2008).
Though Bangladesh has a small market share in US made-ups imports (1% in Jan – Feb 2009), the
country witnessed an increase in its made-ups export value to US by 7% (y-o-y) in January 2009 and
33% (y-o-y) in February 2009.
Analysis of performance of competing countries reveals that the economic slowdown has impacted all
competing countries but the intensity of impact is varied across these countries.
5. Analysis of cost competitiveness of Indian T&C industry vis-à-vis competing
countries
IMaCS conducted an analysis of cost competitiveness of Indian T&C industry vis-à-vis identified
competing countries. For benchmarking costs in India against the competing countries, the cost
structure of each segment of the Indian T&C industry was analysed. Different cost drivers were then
studied to evaluate their impact on the cost structure in India vis-à-vis the competing countries. The
cost drivers analysed included raw material cost, labour cost, costs of power, infrastructure issues,
interest rates, taxes and duties and their cascading impact, etc.

18
Since each of the competing countries was competitive in certain product segments while was not a
key player in certain other product segments, the comparison of cost competitiveness was based on a
product country matrix.
Sub-sector Product – country matrix
China Bangladesh Sri Lanka Vietnam Turkey
Yarn
Fabric
Apparel &
Made-ups
To devise a product-country matrix India’s share in total product imports of identified global markets
was set as benchmark. Countries having a market share equal to or higher than that of India were
considered for comparison6.
As seen from Table 5.1, India has a significant cost disadvantage in manufacturing of cotton yarn,
manmade yarn, cotton fabric and manmade fabric vis-à-vis China on account of high raw material
cost, high power cost and high finance cost.
6 Though Sri Lanka’s market share in garment imports of identified global markets is less than that of India, the
country is gaining share in garment imports of EU27 and UK thus, it has been included in comparative analysis.

19
Table 5.1: Total manufacturing cost advantage / (disadvantage)7
of Indian T&C industry vis-à-vis competing countries
China Turkey
Cotton yarn manufacturing (3.6%) 32.7%
Manmade yarn manufacturing (6.4%) 26.2%
Cotton fabric manufacturing (7%) 10.6%
Manmade fabric manufacturing (4.3%) 13.3%
China Turkey Bangladesh Vietnam Sri Lanka
Cotton garment manufacturing (1.5%) 30.9% (10.1%) (5%) (6%)
Cotton made-ups manufacturing (4.2%) 31.9% (11.8%) (7.9%) (5.2%)
As regards manufacturing of garments and made-ups, India has a significant cost disadvantage vis-à-
vis each competing country except Turkey. India’s cost disadvantage in garment manufacturing vis-à-
vis China is primarily on account of high power cost and high finance cost. However, Bangladesh,
Vietnam and Sri Lanka have a cost advantage over India with regards, raw material cost, employee
cost and power cost which results in their cost competitiveness in garment and made-ups
manufacturing. Moreover, on account of free market access available to Bangladesh (for exports to
EU27 and Japan) and to Sri Lanka (for exports to EU27), the countries have a further cost advantage
vis-à-vis India.
In addition to the analysed costs, Indian T&C manufacturers and exporters incur additional costs on
account of the following:
Non-refund of state level taxes and duties.
Anomaly in duty drawback rates; the rates are insufficient to neutralize the incidence of
all duties.
High transaction costs
7 This does not factor in the market access advantages and logistics cost differentials and impact of taxes and duties

20
6. Major policy aspects impacting the industry
Government of India has taken certain measures for improving the competitiveness of Indian T&C
industry though, certain policy related issues are impacting the growth of the industry.
6.1 Policy approach towards Cotton fibre
Hike in cotton MSP
MSP for cotton has been increased from Rs 2,055 per quintal in CY2007-08 to Rs 2,850 per quintal in
CY2008-09 which has resulted in strengthening of cotton prices. In December 2008, S-6 variety of
cotton was priced at Rs 21,950 per candy as against Rs 19,800 per candy in December 2007. This
hike in cotton price is estimated to have resulted in 6.2% increase in cost of yarn, 3.7% increase in
cost of fabric and 1.9% increase in cost of garment.
Moreover, hike in MSP has resulted in artificial shortage of cotton in domestic market with
procurement by CCI (up to January 20th of CY2008-09) going up by 6 times (y-o-y), of which 99%
has been procured under MSP.
5% export incentive for raw cotton
On 17th February 2009, Central Government has introduced 5% export incentive for raw cotton
through the ‘Vishesh Krishi aur Gramodyog Yojana’. Majority of raw cotton from India is exported to
China, Bangladesh and Pakistan who are the key competitors to Indian T&C industry. Export of
cotton at competitive prices to these countries is likely to hamper the competitiveness of Indian T&C
industry vis-à-vis these countries.
6.2 Policy approach towards manmade fibre
India is one of the largest producers of manmade fibres in the world; the country is a net exporter of
polyester staple fibre and filament yarn with exports increasing significantly over the years. However,
despite a strong base in manmade fibre production, manmade fibres constituted only 36% of India’s
total fibre consumption in 2007 as against 62% in world fibre consumption. High polyester prices in
India, unlike China could be one of reasons for preference in cotton consumption. Anomaly in duty

21
structure8 of manmade fibres is partly responsible for the existing price differential between cotton
and polyester.
6.3 Stringent labour laws
T&C industry comes under the purview of Contract Labour Act, 1970 which prohibits contract labour
for the work that is perennial in nature. In addition, The Factories Act, 1948 poses restriction on the
maximum working hours which restricts the ability of units to meet peak season demand.
Moreover, units employing over 100 people currently fall under the purview of the Industrial
Disputes Act, 1947 (IDA, 1947). This creates unfair discrimination amongst large companies and the
smaller ones and thus, is partly responsible for lack of economies of scale and poor competitiveness
of Indian T&C industry.
6.4 Delay in disbursements of refunds
Though TUFS has supported modernisation and expansion in the T&C industry, delay in
disbursement of interest compensation under TUFS has been a major deterrent. Analysis reveals that
there has been on an average one year backlog in the disbursement of interest compensation. This is
a significant cost to the industry and has compounded the current working capital problems of the
industry.
8 Refer slide 259 and 260 of the report for details

22
7. Analysis of government interventions by competing countries
7.1 Key interventions made by Chinese government
Tax Credits and Rebates
Chinese government has raised the export rebate rate for textiles and apparels thrice,
from 11% at the beginning of 2008, to 15% by February 2009, the highest level in 10
years.
1% increase in export rebate is estimated to distribute 7.6 billion Yuan (US $ 1.11
billion) to exporting companies.
Reduction in lending rates
Government is supporting T&C industry by helping them in getting low-interest
loans from the state-owned banks.
Textile plan for revamping T&C industry, which focuses on
Developing new markets like Russia, Brazil, India and Africa as well as domestic
market with focus on rural markets
Investing in updated technology and developing brands
Saving energy
Providing financial support to SMEs in terms of credit guarantees
7.2 Key interventions made by Vietnamese government
Reduction in taxes
Vietnamese government has announced plans to halve the value-added tax on cotton
imports from 10% to 5%.
Export subsidies
Vietnamese government has agreed to provide support to the country’s T&C industry
at a ratio of forty Vietnamese dong per one dollar in exports value i.e. exports valued
at US $ 1 million would be given a support of VND 40 million from the government.
Vietnam T&C industry achieved an export turnover of US $ 9.1 billion in 2008; this
equates to around US $ 21 million in export subsidies.
Reduction in lending rates
Vietnamese government has assigned the State Bank of Vietnam to grant low-interest
loans to Vietnam Textile Corporation (VTC) in order to import cotton.
7.3 Key interventions made by Turkish government

23
Reduction in lending rates
Government has reduced lending rates by 3.75% over the period of October to
December 2008.
Protection for domestic yarn industry
Government has taken anti-dumping sanctions to protect the spun and filament yarn
manufactures from Asian competition
7.4 Key interventions made by Bangladeshi government
Incentives for the development of backward linkages
15% cash subsidy of the fabric cost is given to exporters who source fabric locally.
Incentives are extended to "deemed exporters" supplying indigenous raw materials to
export-oriented industries.
7.5 Key interventions made by Sri Lankan government
Export incentive program based on maintaining revenue and employment
Sri Lanka's government is giving a 5% incentive payment in domestic currency to
exporters who show 5% increase in export proceeds remitted to the country over the
same quarter last year. Such exports are required to have prescribed minimum
domestic value addition. The incentive payment made will be tax-free.
Depreciation of Rupee
In order to limit the slowdown in export sales, the Central Bank accepted a
depreciation of the rupee which fell about 7% in 2008 against the dollar.
8. Recommendations
Indian T&C industry has a significant employment potential and export potential in case the
envisioned growth target is achieved. However, during Apr - Dec, 2008 production and exports of
T&C industry have missed the expected growth targets thus, requiring a strategic intervention to
24
realise the envisioned targets. Analysis reveals that the Indian T&C industry is facing issues at two
broad levels:
Current issues, arising because of recent economic slowdown
• Decline in demand from global markets
• Liquidity crisis
Issues, affecting long term growth of industry
• Significant dependence on Cotton products
• Lack of skilled labour
The major impediments to the growth of Indian T&C industry are:
Lack of cost competitiveness in majority of T&C products as compared to China, Bangladesh,
Vietnam and Sri Lanka
Delay in disbursement of TUFS assistance and other assistance
High working capital interest
High dependence on cotton products
Lack of availability of skilled labour
High dependence of T&C trade on EU27 and US markets
Strategic interventions are required by both the Government and the industry to ensure the growth of
T&C industry.
8.1 Cost competitiveness
The major factors that have caused cost disadvantage in T&C industry are:
High power cost
High labour cost
Anomalies in taxes and duties
High transaction cost
High import tariffs by global markets

25
Government should take steps to reduce the cost disadvantage of T&C manufacturers which is
created on account of unfavorable government policies.
Captive power generation should be supported in the regions suffering from acute power
shortage
Power cost in India is on an average around 40% higher than that in the analysed competing
countries. Moreover, the Indian T&C industry suffers from shortage of power for instance Tamil
Nadu which accounts for around 40% of India’s spinning activity and over 25% of total T&C
activities has a declared power cut of 40%. Long term steps are being taken by the government to
reduce the power shortage however, the industry needs a support during this crisis period.
Many T&C mills have their own captive power generation to meet their power requirement
because of non-availability of quality and adequate power. However, as per industry feedback,
captive power is two to three times costlier as compared to grid power. Liquid Fuels such as
furnace oil and diesel used for captive power generation attract 10% basic customs duty and 14%
excise duty; this coupled with high fuel prices makes the captive power costly.
Government should support captive power generation in the regions of acute power shortage by
allowing exemption of customs and excise duty paid for the liquid fuels that are used for captive
power generation.
Government should increase labour flexibility especially for the labour intensive sectors of
T&C industry
Indian Garment and Made-ups industry suffers from labour cost disadvantage as compared to the
key competitors i.e. Bangladesh, Vietnam and Sri Lanka. To make this industry competitive,
measures should be taken by the Government to increase labour flexibility by:
Extending labour working hours
Allowing Contract labour

26
Government should consider routing the National Rural Employment Guarantee
Programme (NREGA) through the T&C industry; in this regard, the industry can
commit employment guarantee on the lines of the NREGA.
Relaxing the norms of Industrial Disputes Act, 1947 with regards the number of workers.
Anomalies in taxes and duties should be streamlined
Taxes and duties charged by the State Governments and local bodies are not refunded to the T&C
manufacturers and exporters. Moreover, the duty drawback rates fixed by the Ministry of Finance
are not sufficient to neutralize the incidence of all the duties paid by the exporters. In addition,
there is delay in disbursal of duty drawback claims to the level of 40 – 60 days which affects the
cash flow of the companies. Government should take the following steps to overcome this
anomaly:
Refund State level taxes and duties
Till systematic corrections in the taxation policy are implemented, central government
should devise a mechanism to refund the state level taxes and duties to the T&C
exporters, the incidence of which is on an average 4%9 of the ex-factory price.
Revise duty drawback rates and expedite the drawback claim disbursal
Government should revise duty drawback rates to completely neutralize the incidence of
all duties paid.
The disbursal of duty drawback claims should be expedited.
Other interventions required from the government
Negotiate better trade terms with major global T&C markets
9 Government levies an additional customs duty of 4% on imported goods to countervail the sales tax, value added
tax, local taxes and other charges leviable on sale or purchase or transportation of like goods in India.
Similarly a refund of 4%, equivalent to the incidence of state level taxes and duties should be provided to the T&C
exporters to bring them at par with the global players.

27
Indian T&C trade faces comparative disadvantage on account of free market access available
to Bangladesh, Sri Lanka and Turkey. Ministry of Commerce should negotiate better trade
terms with the global T&C markets including Japan10
.
Streamline EXIM procedures to reduce the transaction costs
Indian EXIM processes involve more documentary procedures as compared to that in
analysed competing countries which results in comparatively higher transaction costs.
Documentary procedures at the ports should be simplified to reduce the transaction costs
incurred by the exporters. Efforts should be made to increase port capacity and to improve
rail/road connectivity to ports.
8.2 TUFS assistance
Government should take immediate steps to clear the backlog of TUFS as well as to revise
the TUFS procedures for future applications
Delay in disbursement of TUFS assistance results in significant additional cost. Government
should take immediate steps to allocate sufficient funds in order to clear the back log of TUFS till
date. Moreover, for future loans under TUFS the mills should be permitted to pay interest net of
interest compensation to the banks; Government should arrange to remit the interest
compensation amounts directly to banks concerned.
8.3 Working capital
Government should take measures to overcome the working capital related problems of the
industry
T&C manufacturers pay working capital interest at the rate of 11 – 13%. Working capital
requirement of the Cotton textile industry has increased on account of hike in cotton prices.
Government should make provision to provide working capital loan for cotton on terms
applicable for agriculture by reducing interest rate for working capital loan to 7%. Moreover,
considering the liquidity related problems of the T&C industry, the margin money for working
capital loan for cotton should be reduced to 10% (from the current 25%) and the duration of such
loan should be extended to 9 months.

28
8.4 Dependence on Cotton fibre
Unlike World T&C industry, Indian T&C industry is cotton dominated with Cotton fibre
accounting for 62% of total fibre consumption (2007) and cotton T&C accounting for
substantially higher share of the total T&C exports of India. Measures should be taken by the
Government to promote the domestic consumption of manmade fibres.
Comprehensive Fibre Policy
A Comprehensive Fibre Policy should be formulated in order to
Reduce the dependence of Indian T&C industry on Cotton, which is an agricultural
product
Ensure availability of raw material (especially cotton and polyester) to the domestic T&C
industry at competitive prices.
Till a fibre policy is formulated, Government should support the industry to reduce its
dependence on cotton by the following measures:
Abolish import duty on manmade fibres and their intermediates
Manmade fibres attract a 5% import duty as against cotton fibre on which the import duty has
been recently reduced to zero. Moreover, polyester fibre intermediates attract a basic import
duty of 5%. Import duty on polyester (and its intermediates), which is an important raw
material for the T&C industry, affects its usage. Government should abolish the import duty
on polyester fibre and its intermediates; this will aid reduction of polyester prices thereby
increasing its share in total fibre consumption.
Abolish excise duty on manmade fibre and their intermediates
Manmade fibres and textiles attract an effective excise duty of 4.12% as compared to zero
excise duty on cotton. Moreover, polyester intermediate MEG attracts a higher excise duty
(8.24%) as compared to polyester resulting in accumulation of CENVAT credit. Excise duty
on manmade fibre and their intermediates should be abolished to promote the use of
manmade fibres.
Policy framework should promote export of value added products rather than fibres

29
Indian T&C industry should strive to export value added products since, this would result in
more employment generation in the country. Government should consider withdrawing the
export incentive for various fibres especially when the domestic industry is suffering from
high raw material prices.
In addition to above, the following measures are required to ensure sustained growth of Indian
T&C industry:
Joint Working Group with representation from Government and T&C industry, should
be formulated to periodically review the performance of T&C industry
Joint Working Group (JWG) comprising of members from the Ministry of Textiles, the
Ministry of Finance, the Ministry of Commerce and members from T&C industry
associations, should be formulated to periodically review the performance of T&C industry.
The Working Group should periodically review the dynamics of the T&C export markets and
examine the factors affecting the competitiveness of the T&C industry. The findings of the
Working Group should support the Government to make necessary policy interventions in
order to ensure long term growth of the industry.
Fabric and Garment sectors of the industry should improve cost competitiveness by
upgrading technology and achieving economies of scale
Weaving, Processing and Garment sectors of the industry are fragmented thus, lacking
economies of scale. Moreover, of the total TUFS disbursement up to December 2008, weaving
industry accounted for only 7.7% and Garment industry accounted for only 5% as against 34%
of Spinning industry. This indicates that the sectors have not undergone significant technology
up-gradation. Fabric industry and Garment industry should undertake technology up gradation
as well as achieve economies of scale to become cost competitive.
Garment industry should explore new markets to reduce trade dependence on EU27 and
US
Indian garment exports have significant dependence on EU27 and US; EU27 accounts for 47%
share of India’s total garment export value whereas US accounts for 29%. Though India’s

30
trade dependence on EU27 and US is in line with the World garment trade, Indian garment
exports to the other leading garment importers are comparatively less.
Japan10
which is the third largest garment importer with a share of 6.7% in world clothing
imports in 2007, accounts for only 1.1% of India’s total garment export value. Similarly,
Russia which is the fifth largest garment importer with a share of 4.1% in world clothing
imports in 2007, accounts for only 0.6% of India's total garment export value.
Efforts should be made by the industry to diversify the garment export market by developing
business in these markets to reduce its trade dependence on the EU27 and US.
Industry associations should ensure the availability of skilled labour for the industry
Non-availability of trained labour is one of the primary business constraints mentioned by the
industry. The initial cost of training is high which acts as a deterrent to in-house training
initiatives by the industry because of high chances of loosing the trained man power.
Associations should establish Skill Development centres to ensure availability of skilled
labour to the industry. The Skill Development centres should run certified training courses
focusing on the specific skills required by the industry. Registration of skilled workers should
be done at the Skill Development centres to maintain a databank of skilled labour.
10
Japan intends to reduce the share of Chinese textile and clothing in its total T&C imports to around 50% from the
current 77%. This is likely to generate significant business opportunity for the other Asian garment exporters. Source: Japan’s International T&C Trade Office at Japan’s Ministry of Economy


