Impact of Environmental Regulation on Small Scale Industries - Cost-Benefit Approach for Secondary Lead Smelting Units Snigdha Chakrabarti Economic Research Unit Indian Statistical Institute Calcutta, India Nita Mitra Department of Economics Calcutta University Calcutta, India Abstract For protecting the global environment, the adoption of abatement technology and improved production process is almost mandatory now in the industrial sector. As a consequence, one finds various environmental regulations being implemented. However, the small scale industry components of the industrial sectors, which contributes significantly to total pollution, are yet to adopt such abatement technology on a wide scale. A major cause for such a situation may be the difficulties that the small units encounter in being able to calculate correctly the net benefits of investing in abatement related. An empirical exercise on estimation of socio-economic and environmental impact of environmental regulation implemented in Secondary Lead Smelting industry suggests that the Cost-benefit Analysis may be the most appropriate method for comparative assessment of the decisions of the investors regarding additional investment in this respect. It also helps to identify the exact factor(s) influencing their decision making. Key words: Cost-Benefit Analysis, Environmental Regulation, Small-scale industry, Abatement Technology and Secondary lead smelting units. ____________________________________ Address for communication Snigdha Chakrabarti Economic Research Unit Indian Statistical Institute 203 B. T. Road Calcutta 700 035, India Email : [email protected]
Transcript
Impact of Environmental Regulation on Small Scale Industries- Cost-Benefit Approach for Secondary Lead Smelting Units
Snigdha ChakrabartiEconomic Research Unit
Indian Statistical InstituteCalcutta, India
Nita MitraDepartment of Economics
Calcutta UniversityCalcutta, India
Abstract
For protecting the global environment, the adoption of abatement technology and improvedproduction process is almost mandatory now in the industrial sector. As a consequence, onefinds various environmental regulations being implemented. However, the small scaleindustry components of the industrial sectors, which contributes significantly to totalpollution, are yet to adopt such abatement technology on a wide scale. A major cause for sucha situation may be the difficulties that the small units encounter in being able to calculatecorrectly the net benefits of investing in abatement related. An empirical exercise onestimation of socio-economic and environmental impact of environmental regulationimplemented in Secondary Lead Smelting industry suggests that the Cost-benefit Analysismay be the most appropriate method for comparative assessment of the decisions of theinvestors regarding additional investment in this respect. It also helps to identify the exactfactor(s) influencing their decision making.
Key words: Cost-Benefit Analysis, Environmental Regulation, Small-scale industry,Abatement Technology and Secondary lead smelting units.
____________________________________Address for communication
Snigdha ChakrabartiEconomic Research UnitIndian Statistical Institute203 B. T. RoadCalcutta 700 035, IndiaEmail : [email protected]
1
Impact of Environmental Regulation on Small Scale Industry-Cost-Benefit Approach Applied in the Secondary Lead Smelting Units1
1.Introduction:
To control the emission from production process, air quality regulation lays downsstringent equipment specification that require to be implemented by the pollutingindustries. The adoption of production and abatement technology is mandatory now withrespect to global environmental problem. However while relevant technology and controlequipment may be developed and available for use, the important question is whetherthey may be adopted or by-passed by the firm. Obviously, the decision to adopt is largelydetermined by a proper assessment or comparison of cost and benefits of such devices.Thus from the regulatory authority’s point of view the improvement of air quality is veryimportant. While such improvement would be beneficial to the environment and to theoverall societies welfare, from the polluting firm’s point of view investment in equipment/technology that enhance air quality, would be worthwhile when the effective rate ofreturn from such investment may exceed the cost of adoption. In other words, the twoalternative course of action before the firm, namely, the decision to produce by regulatingemissions or to opt for closure of operations is influenced by an assessment of thecomparative cost and benefits of these alternative options. One thus realizes that theobjective function of the regulator and regulated, so far as air pollution abatement isconcerned, may not necessarily converge. While social planner are more concerned withthe overall social welfare, the private investors’ decision regarding the additionalinvestment for the adoption of the controlling technology may be guided by their ownprofit maximization motives.
This paper is an attempt in exploring the way in which optimal decisions relatingto air pollution control technology are reached in a particular industry belonging to thesmall-scale sector. Now the small-scale sector in India which contributes to more than40per cent of the value added in manufacturing and more than 35per cent of the exports(both direct and indirect)2, occupies an important place in India’s industrial structure.With this sector’s desirable features in terms of labour intensity, distributionalimplications, flexibility, decentralization potential and entrepreneurship development3,the overall growth of this sector has been quite impressive. The 1999-2000 figures put thegrowth rate achieved at 8.33per cent over the previous year, which is a higher rate thanthe 6.4per cent growth of the overall industrial sector. Under the present liberalizedregime and the transition of the industrial sector towards greater market orientation, thefuture growth prospects of this sector (SSI) appears to be bright. With subcontractingemerging to be an important strategy of large multinationals under the economic reforms4,productive activities are expected to gravitate towards the small and the unorganized
1 This is a part of a research project. We are extremely thankful to West Bengal Pollution Control Board(WBPCB)
for providing funds and Nodal Research Centre(NRC) to carry out the study smoothly. We are grateful toProfessor D.K.Bose who took keen interest in every stage of the study. We would like to thank Shri SomnathNarayan, Environmental Engineer and Ms. Sharmistha Kundu, Assistant Environmental Enginner, WBPCB, forextending their help in conducting the survey and giving access to the secondary informations available with theBoard. We would like to thank Professor Robin Mukherjee and Professor Dipankar Coondoo of Indian StatisticalInstitute, Calcutta for their suggestions and comments regarding the study.
2 Approach to the Ninth Five Year Plan (1999-2000)3 Hussain (1997)4 Janardhan (1997); Ramaswamy (1999)
2
sector. With the considerable employment potential of the small enterprises, investmentand technology upgradation is of much importance under the present scenario.
However, in the literature on development and environment, one finds emphasison two controversial characteristics of small-scale enterprises. On the one hand, from thepoint of view of sustainable development, small industries are valued in developingcountries5, on the other hand, from the environment point of view, since they add to thepollution problem, are considered to be relatively hazardous. One thus encounters adilemma in this respect. It is here that the search of the policy makers is towards thedevelopment of appropriate pollution control technology specific to the type of industry,such that the paradoxical situation may not persist. The development and availability ofsuch technology is now a reality. While a few units in the small sector have been able toadopt such abatement devices, most others have failed to install them. Operating withunskilled labour, under highly competitive unregulated market, the willingness and abilityto control the level of pollution effectively, have generally been found to be missing. Alsothe actual knowledge about the economic, social and environmental feasibility of suchabatement technology may be difficult to acquire or calculate on the part of such smallproducers. Thus it becomes clear that pollution abatement in small-scale enterprisesrequires two pre-conditions. First is the development of clean technology and second isthe calculation of economic, social and environmental significance of such technology inclear terms of actual benefits that may be accrued.
In this regard now the widely used and popular analysis that is generally adoptedin economics for such comparative assessment of decisions is the Cost-Benefit Analysis.This paper deals with an exercise on the Cost – Benefit approach for calculating theimpact of environmental regulation applying to the Secondary Lead Smelting units of thesmall-scale enterprise, that are located in and around Calcutta metropolitan area. Thisstudy also helps to identify the relevant factors that may be crucial in explaining theflexibility and viability of technology adoption. On the basis of a case study of thefew firm which have been able to install the abatement device, it will be objective tounderstand the constraints that may operate with respect to the other firms that are yetto install the technology for air pollution abatement
The report has been organized as follows. In the next section, a review of the secondarylead smelting units within our study area, details regarding their activities and role inpollution control have been discussed in brief. The production process, developedabatement technology and its use in these units has been described there. The nextsection is devoted to a detailed discussion about the data set and methodology that hasbeen used in the study. The analysis of the data is reported in section four. Conclusionshave been presented in the final section.
2. Secondary Lead Smelting Units and Air Pollution: A Review
In Calcutta over the last 40 to 50 years, a number of secondary lead smelting factorieshave been continuing production. As evidence shows almost all the owners of suchunits came from the adjoining state of Bihar and Uttar Pradesh. The reason for thelocation of such units in the state of West Bengal may perhaps be traced to theweather of the state, which along with other factors was conducive to the productionof battery (wet), for which the major input is lead. The battery industry is both the
5 Schumacher (1989)
3
major consumer of lead as also the generator of hazardous industrial waste containinglead. Quite a substantial amount of lead is being recovered from lead sheathings,waste lead, acid batteries and so on together making up for about 50 per cent of thetotal supply of lead used in various industrial applications. This share may beexpected to increase further in the coming years.While Secondary Lead smelting units play significant role in recycling of hazardouswastes, at the same time, on account of their emission of flue gas and dust, they are asource of air pollution. It is largely on account of the intensity of their contribution toair pollution, that such units have been classified by the authorities as belonging to the“red category” of industry. In recent years, these units, being located within or inclose proximity to residential areas, have been subjected to much community pressurefor improved environmental program. Such pressures are in addition to the stringentregulations that have been introduced by the Pollution Control Board. The regulatorhas also involved the services of, scientists, engineers and technologists to evolveappropriate technology, the adoption of, which may be both feasible and viable to thefirms.In these units the production process is simple where smelting operation is carried outin an oven, called ‘vatti’, where charcoal is used as fuel and waste lead as input.Liquid melted lead along with slag comes out after a period of time. The slag is firstseparated out from the liquid lead and then final output, called lead ingot, is made bypouring the liquid into moulds. Two or three charges are required to extract maximumamount of lead from the lead waste, and after that the slag containing about 2 per centlead is finally disposed of. The entire production process is carried out by threelabourers. At the time of operation a flue gas and lead dust are generated which arehazardous in nature and have to be cleaned. The purpose of the control device is toclean and de-dust the flue gas containing chemical components and lead dust particlesthat are generated in the process of smelting operation, before it is released to theatmosphere. A diagram of the production process and controlling system has been shownin Appendix 1. The flue gas and dust are trapped in the control device with the help of IDfan(induced draught fan) and pass through (i) a cyclone/impact separator, (ii) bag filterand (iii) a scrubber. While cyclone / impact separators are designed for the collection ofbigger sized particles, bag filters in the bag house arrest almost all the dust from the dustand allow only cleaned gas to pass through.
3. Data and methodology:3.1 Methodology
The use of air pollution control technology is one such measure, which obviously hastwo sides, it creates values and it imposes costs. To a producer in a smelting unit theinvestment for the installation of any abatement technology along with its operationand maintenance cost is an additional one over and above the cost of productionwhich is relatively lower. On the other hand, benefit may be obtained from the use ofdevice in two ways, by preserving heat for the use of improved ‘vatti’(productionprocess) required for operating the device which saves the consumption of fuel and byreusing the dust collected with the help of control device. A profit maximizingproducer or private investor takes the investment decision regarding controltechnology by taking into account the net profit at the margin. From his point ofview, it is the involved cost and the generated profit that are crucial variables indetermining the choice of control technology.
4
LetK0 = investment cost for installing an air pollution control device (inclusive of related construction work) in the current year.
cmt = maintenance cost in tth year.
cot = operation cost in tth year consisting of cost of electricity and cost of bags used in Bag house for filtering of green house gases coming out at the time of operation of the device.
i.e., tbftt
ett bfpEpc += .0 …………………………(1)
where, Et = consumption of electricity units at time t,bft = number of bags replaced at time t and
jtp = price of jth input at time t
Then, tc = otmt ccKi ++0* ……………………(2)where tc = total running cost, i = rate of interest on the capital investment.
On the benefit side, additional facilities obtained from the introduction of controllingsystem include the following: (i) saving of coal, an important input, due to thepreservation of heat and (ii) collection of dust on account of the device, which may againbe used as input, leading to cost economy. Lesser quantity of inputs needs to bepurchased, for some lead can be recovered from the waste dust that accumulates.
ptb = Benefit obtained directly from production at time t for the use of the device by
reducing the consumption of charcoal and reusing the dust collected through bag house.
i.e., tdtt
ft
pt dpfpb .. += ……………………………..(3)
where ft = Consumption of charcoal at time t, dt = Amount of dust at time t, and j
tp = Price of jth input at time t.In contrast, a social planner or policy maker is interested more with social cost andbenefits of any action i.e. the cost a society bears and the benefits accruing from therelevant activity. The ultimate objective should be to maximize the social welfareassociated with any action. As it is related to the social welfare problem, the adoption ofany abatement technology may not be successful unless it is acceptable to the pollutersand sufferers. The use of controlling device, instead, may help the society by offering aclean environment. As a result, the productivity of human being may increase throughreduction in loss of mandays due to the containment of health hazards that uncleantechnology creates. The benefit of this increased productivity of human being would beenjoyed also by the producers. In addition, the production of the controlling device and itsrelated accessories may generate more employment. The environ mental and socialbenefit may then be written as
evtb = benefit for reduction in loss of mandays due to adverse environmental impact on
human health; and
5
stb = benefit from generating income from new economic activities.
Therefore, the total benefit obtained isst
evt
ptt bbbb ++=
The Cost-benefit approach is intended to compare the net present value of the present andfuture flow of costs and benefits.
Hence, the net present value total costs is
tt
rc
L
tKC
)1(
1
00 +
−
=∑+= ………………………………(4)
and total benefit is
∑−
=+
=1
0)1(
L
tr
bt
tB ……………………………………(5)
Where r = rate of discount, L= life of the device.
The positive net benefit, i.e, (B/C) > 1 indicates the justification of any investment.
For this industry at the present year price level the corresponding net present value of costand benefit would be
trc
L
t
KC)1(
1
00 +
−
=∑+= …………………………….(6) and
∑−
=+
=1
0)1(
L
tr
btB …………………………………….(7)
as 1210 ......... −==== Lcccc and 1210 ..... −==== Lbbbb .The break-even period T is that time point where NPV of cost and benefit would be
equal, i.e., ∑∑−
=+
−
=+
=+1
0)1(
1
0)1(0
T
tr
bT
tr
cttK ……………………………..(8)
If the price of inputs changes, i.e., inflation is allowed at (say) π rate per unit of timethese relation would become then
∑∑−
=++
++
−
=
=+1
0)1(.)1(
)1(.)1(
1
00
T
tr
br
cT
tt
t
t
t
K ππ …………………………(9).
The payback period l, which is that period of time when cumulative expenditure incurredfor the installation of the device will be equal to the cumulative benefit earned from this.
i.e., ∑ ∑=+= =
l
i
l
ibck
1 10 …………………………………... (10)
3.2 Data
6
The evaluation of costs incurred by and benefit obtained from the adoption of controllingmeasure with respect to engineering and technological specification is simple because thegoods are marketed goods. But the evaluation of social and environmental costs andbenefit cannot be done easily due to the fact that most of them are non- marketed goods.Various indirect methods are used for estimation of such benefits.
Our attempted cost - benefit analysis of such decision making to evaluate the efficiency ofthe adopted technology was based on primary and secondary information that werecollected from many sources namely from the owners themselves, the workers of suchunits, WBPCB and the producer of the device. The primary data were collected throughfield enquiry.
As has been mentioned earlier, due to the very small size of the secondary lead smeltingunits, which belong to the unorganized informal sector, well maintained and compileddata set were difficult to come by. Records regarding the production system, outputproduced, input used, the cost and price figures, from all the producers were not availableto the extent desirable6. For such information the study had to depend on secondarysources also.
The required information regarding production level, input used, emission levels etc, forthe respective units could therefore be obtained from the reports submitted to theWBPCB. However, in order to enrich the data set, since no single source of data wasconsidered sufficient for the analysis, further information collected from technologists,scientists, engineers, local people, doctors as also from other records, reports and books,were supplemented.
4.Results: Measurement of Costs and Benefits.
4.1 Financial Aspect
As mentioned earlier, due to non-availability of information about the level ofexpenditure, revenue earned and other such data it is the additional benefit derived as aresult of additional expenditure incurred on account of the installation of control device,that has been sought to be compared, instead of comparing the benefits obtained ‘before’and ‘after’ the installation of abatement device.
For the actual estimation purpose, the information collected from both secondary sourcesand primary sources have been used. As a complete series of information is not available,both cost and benefit have been sought to be estimated by taking a number of alternativevalues. Table 1 depicts the range of values for each of cost and price variables that havebeen collected from different sources. In addition, following assumptions have been madeon the basis of primary and secondary sources of information.
(i) It may be mentioned that the oldest device has been operating for the past six yearssince 1994, without any major shortcoming. Except for some unnatural causes, it may beexpected to run another few years in its present condition. The expected life of the devicemay be assumed to be at least 10 years.
6 Though the questionnaire was prepared to enquire about all such information, ultimately that questionnairecould not be followed strictly. Instead, based on that questionnaire the information have been collectedthrough discussion.
7
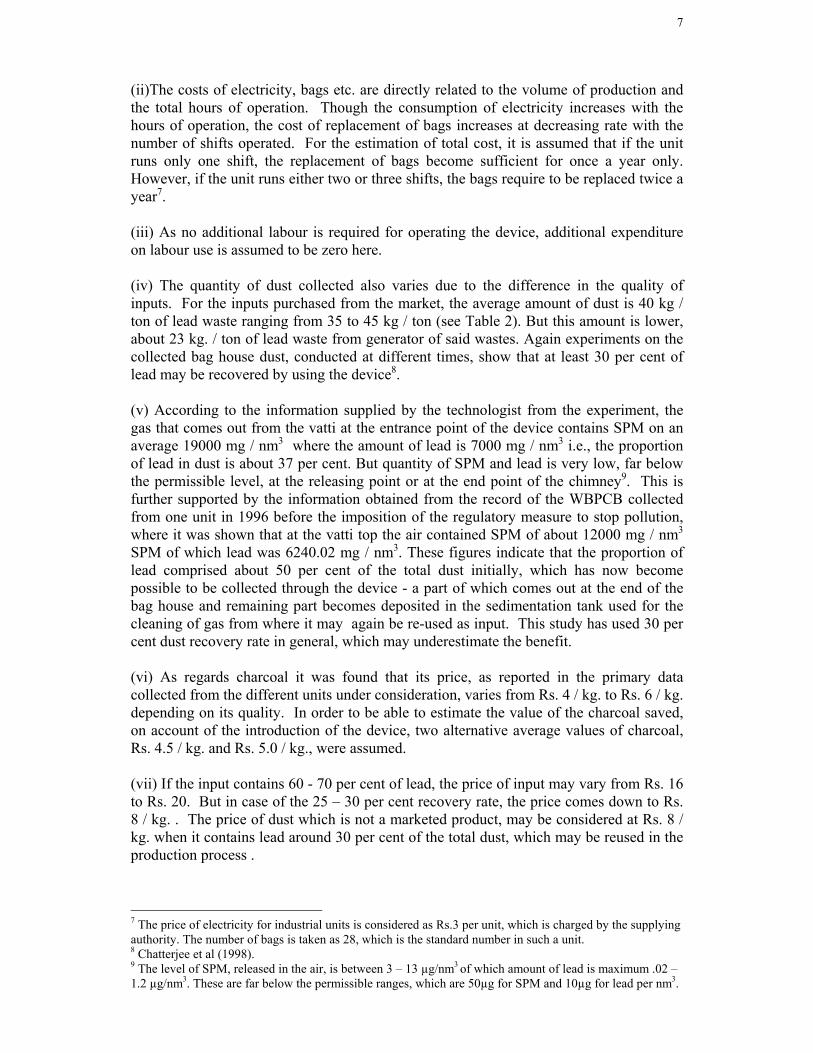
(ii)The costs of electricity, bags etc. are directly related to the volume of production andthe total hours of operation. Though the consumption of electricity increases with thehours of operation, the cost of replacement of bags increases at decreasing rate with thenumber of shifts operated. For the estimation of total cost, it is assumed that if the unitruns only one shift, the replacement of bags become sufficient for once a year only.However, if the unit runs either two or three shifts, the bags require to be replaced twice ayear7.
(iii) As no additional labour is required for operating the device, additional expenditureon labour use is assumed to be zero here.
(iv) The quantity of dust collected also varies due to the difference in the quality ofinputs. For the inputs purchased from the market, the average amount of dust is 40 kg /ton of lead waste ranging from 35 to 45 kg / ton (see Table 2). But this amount is lower,about 23 kg. / ton of lead waste from generator of said wastes. Again experiments on thecollected bag house dust, conducted at different times, show that at least 30 per cent oflead may be recovered by using the device8.
(v) According to the information supplied by the technologist from the experiment, thegas that comes out from the vatti at the entrance point of the device contains SPM on anaverage 19000 mg / nm3 where the amount of lead is 7000 mg / nm3 i.e., the proportionof lead in dust is about 37 per cent. But quantity of SPM and lead is very low, far belowthe permissible level, at the releasing point or at the end point of the chimney9. This isfurther supported by the information obtained from the record of the WBPCB collectedfrom one unit in 1996 before the imposition of the regulatory measure to stop pollution,where it was shown that at the vatti top the air contained SPM of about 12000 mg / nm3
SPM of which lead was 6240.02 mg / nm3. These figures indicate that the proportion oflead comprised about 50 per cent of the total dust initially, which has now becomepossible to be collected through the device - a part of which comes out at the end of thebag house and remaining part becomes deposited in the sedimentation tank used for thecleaning of gas from where it may again be re-used as input. This study has used 30 percent dust recovery rate in general, which may underestimate the benefit.
(vi) As regards charcoal it was found that its price, as reported in the primary datacollected from the different units under consideration, varies from Rs. 4 / kg. to Rs. 6 / kg.depending on its quality. In order to be able to estimate the value of the charcoal saved,on account of the introduction of the device, two alternative average values of charcoal,Rs. 4.5 / kg. and Rs. 5.0 / kg., were assumed.
(vii) If the input contains 60 - 70 per cent of lead, the price of input may vary from Rs. 16to Rs. 20. But in case of the 25 – 30 per cent recovery rate, the price comes down to Rs.8 / kg. . The price of dust which is not a marketed product, may be considered at Rs. 8 /kg. when it contains lead around 30 per cent of the total dust, which may be reused in theproduction process .
7 The price of electricity for industrial units is considered as Rs.3 per unit, which is charged by the supplyingauthority. The number of bags is taken as 28, which is the standard number in such a unit.8 Chatterjee et al (1998).9 The level of SPM, released in the air, is between 3 – 13 µg/nm3 of which amount of lead is maximum .02 –1.2 µg/nm3. These are far below the permissible ranges, which are 50µg for SPM and 10µg for lead per nm3.
8
The estimation of additional cost and benefit realised by a firm of a given size has beendone for different alternative values of fixed costs, maintenance cost, number of shiftsoperated, rate of interest and rate of recovery of dust. The social rate of discounting,which is a national parameter generally adopted by the policy makers in India10, has beentaken as 12 per cent for the estimation of the present value of costs and benefit.Alternatively a 10 per cent rate of discount, based on the market rate of interest, has alsobeen tried.
But, the results have been presented finally for a set of alternative values, given in Table2, of investment, maintenance cost, amount of dust generated for the different quality ofinputs used, price of charcoal and for the number of shifts operated for a given level ofprice of electricity, raw material and bag in tables 4 to 6. All the costs and benefits havebeen estimated at the 1999 price level.
It had been mentioned earlier that previously the secondary lead smelting units wereallowed to run at night. But the installation of the device now enables them to operatealso during the day time. However, the results show that after the introduction of thedevice the running of the units in only one shift, i.e., for 6 to 7 hours per day using only 1MT of lead waste for 300 days per year does not appear to be economically viable, asexpected, if sufficient amount of dust is not being recovered. (see Table 3). On the otherhand, the increase in the amount of dust makes, though marginally, the net benefitpositive irrespective of the rate of interest, level of investment. But it is evidenced that theoperation of the units only for two shifts per day (around 6-7 hours with 1 MT of leadwaste per shift) and on an average of a total of 300 days per year generates quite asignificant amount of additional benefit over the additional expenditure for the device asresult of collection of more dust. The internal rate of return is also significantly high. Thepay back period could be achieved within two to five years just after the installation of themachine (see Table 4). Hence, amount of dust collected through the control device, whichwould save the purchase of raw material, is a crucial factor in achieving the net benefitfrom this additional investment. It is mentioned earlier that the dust collected from thebag house is a portion of the total dust generated. Therefore, the use of total amount ofdust generated may help to obtain positive benefit even by running one shift per day.
In general the recycling industry is constrained by the lack of guaranteed demand andlack of assured supply of waste. But as the demand for lead is significantly high for itsvarious uses and more than about 50 per cent of total lead supplied in the market comesfrom the secondary lead smelting units, operation of two shifts, which is possible undersuch the situation, should be taken. However, belonging to the informal sector and beingsmall in size their control in the input market may not be smooth. Under suchcircumstances expected benefit may not be realised. Provided there exists assured supplyof lead waste, the results then show that the introduction of the device, which involvesexpenditure, is financially gainful from the producer’s point of view if it is properlymaintained and operated.
Tables 5 depicts the values of break-even point, on which the firms investment decisiondepends, for different alternative values of investment cost, price of charcoal, rate ofinterest, recovery rate, and for the number of shifts operated for a given level of operationand maintenance costs and benefits. It is observed from the tables that at a given level ofbenefits and costs the firm may achieve the break-even point earlier by operating morenumber of shifts per day. But no change is observed as such in the achievement of break- 10 Murthy et al (1998).
9
even point even if the inflation is allowed up to 10 per cent in the estimation of benefit orcost or both except in few cases.
4.2 Environmental Aspect
It is well known that the secondary lead smelting industries contribute to environmentaldegradation. There is no reason to deny that air pollution due to the emission from theseunits containing considerable amount of lead in the suspended particulate matter (SPM)and some gaseous components have serious negative impacts on human health andvarious economic goods and services both in and outside the production place. Theexternal effects lead to the reduction of productivity of human resources and also ofnatural resources and imposes important economic and social costs on the society.
The situation, therefore, makes it imperative that the measures have to be taken to reducethe negative environmental impact for the sake of industry and society. Hence along withcomparison of financial benefits and costs achieved due to the introduction of suchmeasures, the evaluation of health impact associated with it, is also essential for settingpriority of action in this respect. The estimation of net environmental benefitsquantitatively (if not possible, then qualitatively) helps the society to make more rationaldecision for allocating scarce financial resources.
The numerical estimation of environmental impacts, though these are non-marketedgoods, is not impossible if proper information is available. In one method, valuation isdone before the installation to assess the feasibility of technology in this context byestimating the willingness to pay to avoid the degradation of the environment and to beable to live in a pure environment. But difficulty may arise due to the existing populationdistribution. The willingness to pay may be much higher in case of rich people comparedto that of poor, as being wealthier, they turn their attention increasingly to the quality oftheir living environment. Hence the estimation may become biased.
Alternatively, the estimation of change in the health effect due to the change incomponents of pollutants in the air, either qualitatively or quantitatively, may give an ideaabout the impact of air pollution on human health and environment.
In the secondary lead smelting industry the most important pollutant is lead coming outwith SPM. Lead poisoning may cause a great variety of diseases: a specific syndromedoes not exist11.
It has both short and long term effects on human health. Most important short- term effectof lead on human health is the abdominal pain, loss off appetite, metallic taste in themouth etc. The long-term effects are renal problems affecting kidney function,hypertension, effects on bone, fatigue, joint pain, anemia etc.
The deposition of lead on the root, leaf and surface of the plant has the lead toxic effectcausing a problem in photosynthesis, growth and other parameters12.
The focus may be made on the estimation of the short run impacts on human health bothin and outside of the factory premises and environment, compared to that of the long run.This is because it is difficult to isolate the impacts of particular type of effluent in the
11 Sue et al (1983)12 WHO (1989)
10
long run. It has to be mentioned that the measurement of the impact on environment dueto the change in the level of pollution is possible only if the required information isavailable. In the present case of secondary lead smelting units, no information on thecomponents of air pollution ‘prior’ to the introduction of control device were recordedproperly either by the WBPCB or by the factory owners. The only available informationfrom the survey of the units is the amount of dust collected through the device, whichwere previously being released in the air. It is, however, possible to reconstruct the levelof pollution that would prevail in the absence of control device in the factories from thecurrent information on the emission of pollutants recorded by WBPCB officers and thesurvey data on the dust collected through the device. The two together would indicate thepotential for pollution of the factory concerned.
The lead dust is absorbed into human health by inhalation and ingestion through food.The change in the human health and in the surroundings within the factory premises dueto the installation of the device were recorded from the survey by interviewing the olderworkers, if any, who were found to be working since the ‘no-device’ period. Accordingto these workers, the abdominal pain, loss of appetite, metallic tastes in the mouth - all theimmediate effects of lead absorption, which were the regular health features experiencedby them previously, were reported to be totally absent at present.
One possible method of estimation of the damage to health in monetary terms of this lead- related health hazards would be to estimate the total expenditure made by the affectedpersons towards curing such diseases. However, due to the very nature of theemployment pattern observed in these small-scale industries such estimation could not beattempted. The labourers employed in such units were mostly temporary workers, whomigrated from neighboring places. It has been reported that they were used to workingfor short spans in these jobs in the pre - device period. However, in the post - deviceperiod the quit - rate or the frequency of leaving jobs had declined significantly. Due tothe better work environments in the present context the workers are willing to continuewith their jobs in these units. Alternatively an attempt may be made to estimate the lossof labour hours due to absentism in the job, as a result of ill health, as a proxy of healthimpact. For example, if it is assumed that a labour may loose minimum two years fromhis total service period of thirty two years13, the loss of earning then may be estimated asabout Rs. 937 per year at the rate of Rs. 50 per day for 300 days in a year for a labourwithin the tenure of his working age. Then for the introduction of device in an unitemploying three labours per shift, it may be possible to earn at least Rs. 5622.0 more peryear from operating two shifts by saving the loss of working period as a result ofimproved environment. The net present value of this flow of benefit at 10 per cent rate ofdiscount is about Rs. 28000.0 during the life years of the device. It would also beconsidered as the additional income generated in the society and should be added to thesocial benefit obtained from the introduction of the device.
The growth of fruits and flowers, the absence of any trace of lead dust on the leaves oftrees, in the pond or water bodies inside the factory premises may also be taken as anindicator of cleaner environment experienced in the post device period.
The benefits from the change in the air quality may be realized in terms of (i) increasingproductivity of the labour on account of improvement in the quality of health and (ii)increased efficiency on account of being able to remain in the same occupation and unitfor a greater length of his working life. 13 The working age of a hard working labour is assumed as 18 to 50 years.
11
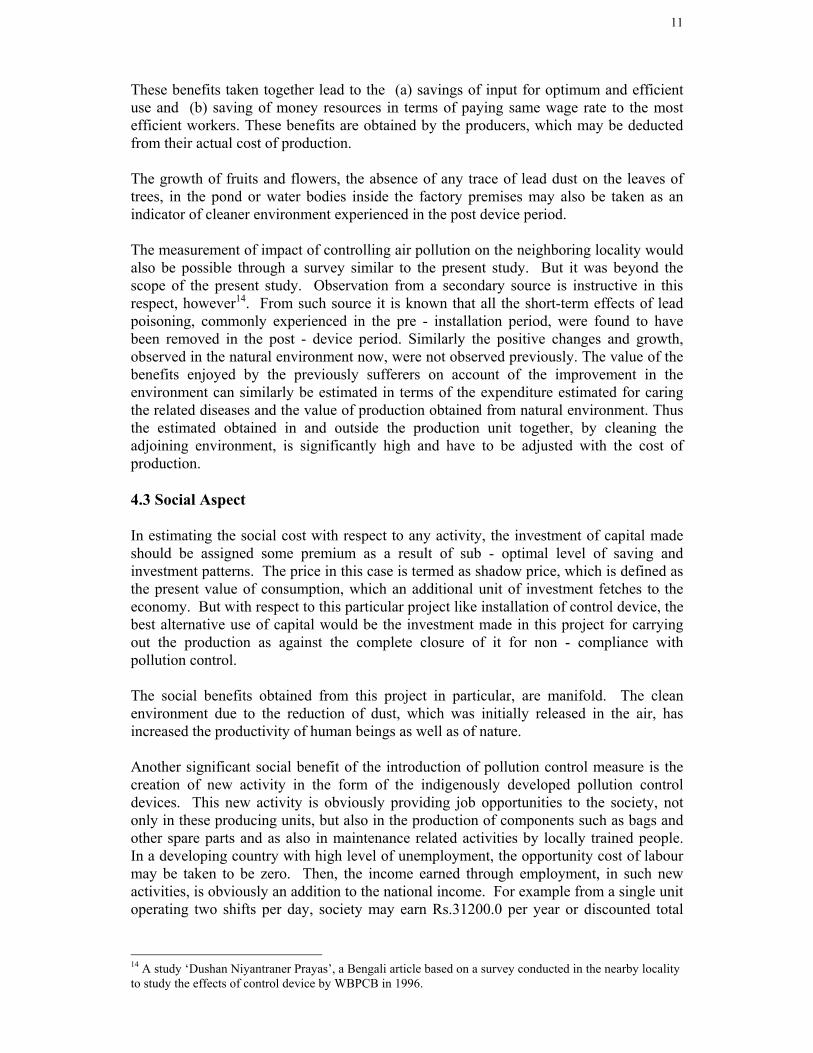
These benefits taken together lead to the (a) savings of input for optimum and efficientuse and (b) saving of money resources in terms of paying same wage rate to the mostefficient workers. These benefits are obtained by the producers, which may be deductedfrom their actual cost of production.
The growth of fruits and flowers, the absence of any trace of lead dust on the leaves oftrees, in the pond or water bodies inside the factory premises may also be taken as anindicator of cleaner environment experienced in the post device period.
The measurement of impact of controlling air pollution on the neighboring locality wouldalso be possible through a survey similar to the present study. But it was beyond thescope of the present study. Observation from a secondary source is instructive in thisrespect, however14. From such source it is known that all the short-term effects of leadpoisoning, commonly experienced in the pre - installation period, were found to havebeen removed in the post - device period. Similarly the positive changes and growth,observed in the natural environment now, were not observed previously. The value of thebenefits enjoyed by the previously sufferers on account of the improvement in theenvironment can similarly be estimated in terms of the expenditure estimated for caringthe related diseases and the value of production obtained from natural environment. Thusthe estimated obtained in and outside the production unit together, by cleaning theadjoining environment, is significantly high and have to be adjusted with the cost ofproduction.
4.3 Social Aspect
In estimating the social cost with respect to any activity, the investment of capital madeshould be assigned some premium as a result of sub - optimal level of saving andinvestment patterns. The price in this case is termed as shadow price, which is defined asthe present value of consumption, which an additional unit of investment fetches to theeconomy. But with respect to this particular project like installation of control device, thebest alternative use of capital would be the investment made in this project for carryingout the production as against the complete closure of it for non - compliance withpollution control.
The social benefits obtained from this project in particular, are manifold. The cleanenvironment due to the reduction of dust, which was initially released in the air, hasincreased the productivity of human beings as well as of nature.
Another significant social benefit of the introduction of pollution control measure is thecreation of new activity in the form of the indigenously developed pollution controldevices. This new activity is obviously providing job opportunities to the society, notonly in these producing units, but also in the production of components such as bags andother spare parts and as also in maintenance related activities by locally trained people.In a developing country with high level of unemployment, the opportunity cost of labourmay be taken to be zero. Then, the income earned through employment, in such newactivities, is obviously an addition to the national income. For example from a single unitoperating two shifts per day, society may earn Rs.31200.0 per year or discounted total
14 A study ‘Dushan Niyantraner Prayas’, a Bengali article based on a survey conducted in the nearby localityto study the effects of control device by WBPCB in 1996.
12
income about Rs. 2.0 lakhs over 10 years period in the first round only by renderingmaintenance services and producing bags15.
Therefore, addition of the value of benefits obtained from cleaning environment, creatingnew job opportunities with the net physical benefit puts overall net benefit of theintroduction of controlling device to a much higher level. As a result, operation of oneshift may be viewed as viable from the point of view of society and environment. Theaggregate, therefore, indicates the significance of the abatement technology at the social,environmental and commercial levels.
5. Summary and conclusion
At the beginning of this decade the sole regulatory measure that was adopted by thepollution control authority of West Bengal was to stop the production of lead by thesecondary lead smelting units as this production entailed the disposal of ‘hazardoussubstance’ which polluted the environment. However, the policy makers realized that therecycling of hazardous wastes which these Secondary Lead Smelting units undertook andconsequent recovery of lead on their part, which was an important intermediate input forvarious productive activities, could not be ignored. Hence, the WBPCB, with the help oflocal scientists developed an air pollution control device, which might be installed bythese units. Hence, as against ‘closure option’, there was now before the firms, anotheralternative, namely, the adoption of such control device.
However, what was puzzling was that, despite this available alternative, there appeared tobe few takers. In other words, while many firms chose the closure option, only a fewopted for the control device that had been developed. Why were there such a few takers?A possible explanation may either be that there was not much awareness relating to theutility or disutility of adopting such device as because it is difficult to estimate theaccrued benefits from adopting the control device, or the high installation cost, or both.This study was an attempt in estimating the net benefits that was achieved by the unitsand society at large, from the adoption of control device, even though it involvesadditional installation costs.
The necessary information to carryout such a study have been collected from differentsecondary sources along with the primary source by survey of the existing units withinCalcutta that adopted the technology.
A cost-benefit method was applied to the data collected and supposed to be the mostappropriate method for the comparison of costs incurred for and the benefits obtainedfrom the installation of the control device from economic, social and environmentalpoints of view to study the appropriateness of the investment in this regard.
It has been observed from the cost–benefit analyses that as against confining theproduction only to the night shift as was the practice earlier, the use of the device enabledthe secondary lead smelting units to operate the factories throughout the day or to utilizetheir full productive capacity to meet the existing demand for their products. The lack ofassured supply of inputs would be the only constraint in this respect. The results showthat the amount of dust collected is a crucial factor to determine the level of net benefitobtained from the installation of the device. It is further observed that if dust is collectedproperly, then for all combination of costs and prices, each of the units may be operated 15 It is the sum of earnings of Rs.20000.0 per year by providing maintenance services and Rs.11200.0(28x2x200) for the sale of bags.
13
profitably even if it runs one shift only. However, it will be highly profitable if the unitsrun two shifts per day using one MT of raw materials per shift for 300 days per year.These findings may be crucial from the point of view of other units in introducing similarinvestment decisions regarding the adoption of the developed technology.
Apart from the financial profitability considerations the system developed by the WBPCBand the scientists involves also considerable social and environmental significance for theworkers and the immediate neighborhood surrounding these units. Therefore, efforts toincrease the awareness of the owners of the respective units regarding the financialviability of technology and the judiciousness of their investment decisions relating to itare of crucial importance. For the benefit of industry from the socio-economic andenvironmental points of view financial assistance could also be considered.
The detailed analysis of the productivity of the device indicates that it is not onlybeneficial from the point of view of the private producers, but it also benefits theenvironment and the society at large. As against the closure option, from the societypoint of view, it is meaningful to continue the productive activity, which is possible byadopting this technology. Hence, since the initial investment costs which the firms arerequired to bear is quite significant, it may be captured if financial assistance by way ofloans for installation of device could be provided to these small units. Lastly, it is also tobe mentioned that a proper maintenance of the device through regular checking of thepollution level by the regulatory authority is an important component to ensure theexpected air pollution abatement results.
Table 1: Financial and Other Information of the Secondary Lead Smelting Units
ValuesItem of InformationMaximum Minimum Average
(1) (2) (3) (4)
14
Cost of Air Pollution ControlDeviceCost of civil construction worksCost of maintenance(yearly)(Rs. Lakh in 1996)
2.5
0.15
2.0
0.25
2.25
0,600.20
Number of Filter Bags used 36 24Price of Raw Materials(Rs. / kg.)(i) Battery scrap(ii) Slag(iii) Slag containing 25-30per
cent lead
2038
142.5
172.75
8
Price of coal(Rs. / kg) 6 4 5Price of Bag (Rs. / bag) 225 175 200Price of lead ingot (Rs. / kg) 36 30 33Collection of dust from baghouse(kg./kg of raw material)(i) Output/Input Ratio-25per
cent(ii) Output/Input Ratio-30per
cent
0.0450.027
0.0350.019
0.0400.023
Source: Reports from WBPCB, Survey data.
Table 2: Alternative values of Items Used in the Estimation of Cost and Benefit.
Items Alternative Values
(1) (2)Price of device includingconstruction cost (Rs. Lakh)
4.00 4.50
Average maintenance cost /year(Rs. Lakh)
0.15 0.20 0.25
Per unit price of electricity (Rs.) 3.00Price of bag / piece (Rs.) 200.00Price of charcoal / kg (Rs.) 4.50 5.00Price of dust / kg (Rs.) 8.00Life of the device(years) 10Rate of interest (per cent) 12Rate of discount (per cent) 12 10Proportion of lead in dust(percent)
30
No. of bag used 28Working day per year 300Source: See Table 1
Table 3: Estimated Physical Benefit-Cost Ratio (B/C ratio), Internal Rate of Return (IRR),and Pay Back Period (at 1999 price level) for a Given Level of Investment and Rate of
Recovery of Dust in a Unit Operating One Shift.
A Level of investment –Rs.4.0 lakhs and rate of recovery of dust – 0.023 kg per kg of input.
15
Price of charcoalRs. 4.5 per kg Rs. 5.0 per kg.
Investment(Rs. Lakh)
Recoveryrate ofdust/kg ofinput(kg)
Rate ofinterest(per cent)
Maintenance cost/year(Rs. Lakh) B/C ratio IRR Pay back
Table4 :Estimated Physical Benefit-Cost Ratio (B/C ratio), Internal Rate of Return (IRR),and Pay Back Period (at 1999 price level) for a Given Level of Investment and Rate of
Recovery of Dust in a Unit Operating Two Shifts.
16
A: Level of investment – Rs.4.0 lakhs and rate of recovery of dust – 0.023 kg per kg of input.
Price of charcoalRs. 4.5 per kg Rs. 5.0 per kg.
Investment(Rs. Lakh)
Recoveryrate ofdust/kg ofinput(kg)
Rate ofinterest(per cent)
Maintenance cost/year(Rs. Lakh) B/C ratio IRR Pay back
1. Chatterjee J, S. Roy, M. Sarkar and V.Vijayan : Trace of Heavy Elements inIndustrial Wastes In West Bengal , Saha Institute Of Nuclear Physics (pre print)
2. Cropper, M.L., N.B. Simon, A. Alberini and P.K. Sharma ( ) : The Health Effects ofAir Pollution In Delhi, India, World Bank Working Paper No 1832.
3. Dasgupta A.K and D.W. Pearce (1972) : Cost - Benefit Analysis - Theory andPractice; Macmillan.
4. Dasgupta S, R.E.B. Lucas and D. Wheeler (1998) : Small Plants,Pollution andProverty : ‘New Evidence From Brazil and Mexico; DECRG; InfrastructureEnvironment Group, World Bank.
5. Dixon J.A ( ) : The Economic Valuation of Health Inputs; Working Paper, WorldBank
6. HeHige M, M. Huq, S. Pargal and D. Wheeler (1996) : Determinants of PollutionAbatement In Developing Countries: Evidence From South and South Western Asia,World Development, December.
7. Hussain, Abid (1997) : Expert Committee on Small Enterprises.
8. Janardhan, V, (1997) : The Search for Flexibility in Indian Manufacturing : NewEvidence Outsourcing Activities; Economic and Political Weekly, August 30 –September 5, pp L2 – L19.
9. Little , I.M.D. and J. Mirless (1968 ) : Manual of Industrial Project Analysis InDeveloping Countries, Vol II, O.E.C.D.
10. Mishan E.J. (1972) : Cost - Benefit Analysis, Allen and Reath.
11. Pargal, S and D. Wheeler (1996) : In formal Regulation of Industrial Pollution InDeveloping Countries: Evidence from Indonesia; Journal of Political Economy,December.
12. Planning Commission (1996) : Approach to the Ninth Five-Year Plan, 1997-2002,Government of India, Planning Commission.
13. Ramaswamy, K. V. (1999) : Globalization of Capital, Multinational Corporations andLabour : Towards a Perspective; Economic And Political Weekly, February 6 –12.
14. Schumacher , E.F (1989) : Small Is Beautiful : Economics As If People Mattered;N.Y. Harper Collins.
15. Singh, R (1994) : Social Cost Benefit Analysis of Investment In Irrigation;Economic and Political Weekly, May 14.
16. Sues, M. J., K. Green, D.W. Reinisde (1983): Ambient Air Pollutants from Industrial Sources: On Behalf of W.H.O., Elsevier.
17. UNIDO ( 1972 ) : Guidelines for Project Evaluation
19
18. West Bengal Pollution Control Board (1996): “Dushan Niyantraner Prayas” – ABengali Article .
19. West Bengal Pollution Control Board(1997) : Air Pollution Control Technology ForSecondary Lead Smelting Units.
20. World Health Organization (1989) : Environmental Health criteria 85- Lead -Environment Aspect, U.N.Em.Prog. I.L.O.
APPENDIX 1
Diagram of the production process and control device