FOCUS: Journal of International Business
Vol. 5(1), Jan-Jun 2018, pp. 81-95
DOI: 10.17492/focus.v5i01.13139
www.journalpressindia.com/fjib
© 2018 Journal Press India
Impact of Foreign Institutional Investors on the Volatility of Indian Stock
Market using GARCH Model
Prateek Kumar Bansal* and Om Prakash Agrawal**
ABSTRACT
Foreign institutional investors have played an important role in the development of
Indian stock market. In this paper, we study the relationship between the FII capital
flows and the volatility of Indian stock market. To conduct the study, daily Index and
trading data of SENSEX, NIFTY and FIIs was collected for fifteen years from April 1,
2001 to March 31, 2017. After testing for data stationarity using Augmented Dickey
Fuller test (ADF) unit root test, different statistical tools were applied such as S.D.,
mean, variance, skewness, correlation and GARCH model for testing the impact of FIIs
flows on stock market volatility. The study concludes that there is strong relationship
between the FIIs and the stock market return. Further, positive correlation exists
between the variables and volatility transmission is there from FIIs to both the indices.
Keywords: FIIs; Indian Stock Market; NIFTY; SENSEX; GARCH.
1.0 Introduction
For the big challenge to create investment opportunities for the investor. There are a
lot of factors which economy it’s a affect the investors’ decision which includes economic
condition, returns, market future, political situations, Growth etc. Investors outside India can
invest in two ways - Foreign Direct Investment (FDI) where investment is made directly to
a firm and other is Foreign Institutional Investors (FIIs) where they can invest to the equity
and debt market of the destination economy in the listed or unlisted securities of the
companies. FDI is considered as a developmental tool and they help in achievement of
robust growth of an economy. It helps in capital formation, enhancing efficiency of the
economy and development of infrastructure.
_____________________
*Corresponding author: Assistant Professor, Institute of Business Management, GLA University,
Mathura, Uttar Pradesh, India. (Email: [email protected])
**Assistant Professor, Institute of Business Management, GLA University, Mathura, Uttar
Pradesh, India. (Email: [email protected])
82 FOCUS: Journal of International Business, Volume 5, Issue 1, Jan-Jun 2018
On the other hand, FIIs are the foreign investors who plays a dynamic role in
development of economy and shape the stock market and effect the stock prices of
companies in the country. Foreign institutional investment provides various ways of
financing by sharing different risk and return of stock market (Han at el., 2000;
Singhania and Saini, 2016).
India receives more than 19.788 million US $ from the investment done by the
FIIs during the April to December 2017. Further, if we compare current year then, it
shows the highest year FIIs volume of investment to previous trend. The reasons can be
enumerated as changing government policies which back the expectations of FIIs and
falling interest rates, improving earnings outlook, low barriers for FIIs investment and
introduction of reform in indirect taxation (GST) etc.
FII can invest in the debt as well as equity market which stood in the year 2017
as 7.46 billion US $ and as cumulative value stood $183.69 billion. India records high in
terms of investment in the private equity investment which worth’s 24.4 billion US $ and
the private equity investment shows the growth rate of 9% in the logistic industry which
leads to the investment of $501.71 million during 2016-17.
FIIs investment improves the market efficiency as it leads to decline in the cost
of capital but FIIs capital flow in stock market affect the indexes which create volatility
in stock market. The reason of volatility is that FIIs tap the primary market because they
deploy large amount at a fixed price in one go which is not possible in secondary market
easily and FIIs capital flow affect primary market stock usually relatively at low price as
compared to secondary market. The FIIs affects investment pattern of domestic investors
also. Hence, it becomes imperative to study the association between select indices and
FII flows. Further, volatility transmission can also be assessed between FIIs flows and
SENSEX and NIFTY.
Volatility is explained as the degree of changes in price between the share prices
of a security for a period. Sometime volatility is required in the stock market so that the
interest of investors is there and they invest in the way of market ups and down, this
desirable action changes value across economic activities which facilitate for the
allocation of resources but on the other hand when this volatility is high then investors
feel lack of confidence which can be negative for the economic growth. Volatility
describes the stability and instability of any variable. It can also be used as a common
statistical measure of depression of regularity in any random variable such as market-to-
market values, earnings, losses due to default, market value etc. Many a times it is
questioned that the Foreign Investors create volatility in stock market and they affect the
inflow and outflow in stock market. so this study is related to study the FIIs impact on
the Volatility of India’s two largest stock exchanges.
Impact of Foreign Institutional Investors on the Volatility of Indian Stock Market 83
Government is taking numerous initiatives to increase the Foreign Investment.
The Securities and Exchange Board of India (SEBI) has increased the limit up to 25%
for the strategic investors so that they can make boost up in the REITs and INvlTs. The
Govt. of India has made major reforms in the economy like demonetization and
implementation of GST. As SEBI regulates all the securities markets, hence it creates
rules and regulation for the purpose of making securities markets a safe avenue for
investors to invest
SEBI has made changes in their regulation as SEBI (FII) regulation 1995 to
SEBI(FPI) regulation 2014 in June 2014. Which merge all FIIs, QFIIs and Sub-accounts
of FIIs are FPIs. It’s effect was that the number of registered investors increased in the
Indian stock markets.
More than 1300 new FPIs are get registered during the year as compared to the
previous year this is because of the continuous interest of the foreign investors in the
Indian equity and debt market (Figure 1). In the previous year total registered FPIs are
7807 and in this year it is 9136. SEBI to control and manage approved depositories to
make the procedure easy and they work as an intermediary between the FIIs and SEBI
they care called DDPs after getting the certificate form the SEBI.
Figure 1: Country-Wise AUC (Crore) and Number of Registered FPIs
Source: SEBI Annual Report 2016-17
3024
1007
677 608 518
493
392
304
1758
857945
238682
72,299 511293
136022
71,043
73,082
274472
470930 AUC
No.of FIIs
USA
Luxembourg
Canada
Mauritius
UnitedKingdomIreland
Japan
84 FOCUS: Journal of International Business, Volume 5, Issue 1, Jan-Jun 2018
According to the SEBI annual report 2016-17, 18 DDPs are approved and total
FPIs registered shown in fig 1 was from the USA (3024); Luxembourg (1,007), Canada
(677) and Mauritius (608) (Figure 2.25). In terms of AUC as well, FPIs from the USA
had the maximum AUC (8,57,945 crore), followed by Mauritius (5,11,293 crore),
Singapore (2,74,472 crore) and Luxembourg (2,38,642 crore).
The opportunities to get more investment in the future by the foreign investors is
expected because of the growth in the economic condition and the strong support from
the side of Government. Most of the investors seek the developing countries to invest
their funds because there is more chance of growth in Indian market as it shows the best
investment destination based on the various variables like long – term economic growth
potential demographic growth and increase productivity.
2.0 Review of Literature
Mukherjee et al. (2002) empirically tests the relationship of FIIs flows to the
Indian equity market. Author taken daily traded time series data from 1999 to 2002 and
also tries to explore the interrelationship by using Granger causality test. Author
concluded that the flow of FIIs is total based upon the near past return of the stock and
there is no other way. Prasanna (2008) examined the relationship of BSE listed
companies’ share price and the FIIs. Author concluded that the FIIs are willing to invest
their fund only in those share which are owned by the general public in large number.
Author also tried to establish the relationship among the investment and capital structure,
financial performance and stock performance.
Chandra (2012) examined the cause and effect relationship between the trading
behaviour of FIIs and the Stock market return. The main purpose of this paper was to
explain the direction of relationship between them and vice versa. Using Granger-
causality approach author find that FIIs and India stock market return have bi-directional
relationship and also suggested that the stock market return causes the change in the
behaviour of FIIs trading. Dharani et.al. (2015) examined the volatility pattern of Shariah
complaint stocks in India. At first author calculated the return for each Shariah complaint
stock and secondly data tested for stationery by using ADF test and then autocorrelation
by using Q test. This study revealed that the return series showing stationary at level and
the existence of autocorrelation for all selected Shariah compliant stocks.
Garg and Mitra (2015) stated that the foreign ownership of host country’s stocks
increase due to liberalization of financial markets in emerging economies. Huge amount
of investment through FIIs may have a prominent impact on host country’s stock market.
In this study the author wants to investigate the investment pattern of FIIs investment
Impact of Foreign Institutional Investors on the Volatility of Indian Stock Market 85
and their relation with the return of Indian stock market. Author concluded that FIIs
investment pattern can create the short term volatility and also suggested that FIIs are
having intense to buying rather than focusing on sale side.
Kumari and Mahakud (2015) examined the relationship between stock market
volatility and macroeconomic volatility in Indian stock market. In this study author
examined the problem with two phase estimation techniques. Conditional volatility is
take out by using univariate autoregressive conditional heteroscedasticity models and for
further analysis author used multivariate VAR technique with the impulse response.
Author find linkage between stock market volatility and macroeconomic volatility.
Dhingra et.al. (2016) investigated the interactions of FIIs with market volatility and
market return in the context of India by using daily basis data and used static and
dynamic models both. According to them foreign investors have positive feedback
traders at the time of investment and negative feedback traders at the time of withdrawal.
Poshakwale and Mandal (2016) studied the sources of stock return in both
economic and non-economic terms in the emerging Indian stock market as well as in the
established stock market of US, Germany, U K, France, Canada and Japan. Authors
concluded that the probability value s higher in economic expansion system as compared
to the economic contraction system. It is also revealed that inflation, uncertainty,
international interest rates and dividend yields are the main components of asymmetric
return in co-movements. Singhania and Saini (2016) states that FIIs ownership does not
provide only adequate capital but also marketing skills, managerial skills, business
connections and training to the host country. FIIs provide alternative ways of financing
by sharing the risk in the domestic stock market, and they reduce the risk exposure of
listed firms. Additionally, FIIs inflow help to improve the quality of information in
domestic markets with good corporate governance.
Vyas and Shah (2016) studied the quarterly appraisal between the FIIs and their
impact on the SENSEX movement. Author used regression analysis to find the
significance effect of FIIs on the SENSEX movement and also used t-test to find the
significant relationship between them and taken 5 years’ data of SENSEX and FIIs. They
concluded that FIIs not having any significant impact on the share price movement and
there is no significant relationship exist between them and also suggested to take the
weekly data for the further study.
3.0 Objectives
To understand the dynamics of relation between foreign institutional investors and
Indian stock market.
86 FOCUS: Journal of International Business, Volume 5, Issue 1, Jan-Jun 2018
To examine the trend of Indian major stock exchange and FIIs.
4.0 Research Methodology
The main aim of this paper is to determine whether there is some relationship
exists between the stock market indices return and Foreign Institutional investors in this
paper the volatility of Indian stock market is also determine. To complete the objective
secondary data from April 1st 2001 to March 31
st 2017 has been used. Daily trading data
of FIIs, Daily closing data of National stock exchange index (NSE) and Bombay stock
exchange index (SENSEX) data has been collected from www.sebi.gov.in,
www.nseindia.com, www.bseindia.com and the depository of SEBI websites
https://www.fpi.nsdl.co.inandhttps://www.cdslindia.com. FIIs net investment data used
of equity and debt market.
Eviews 9.0 software used to apply the tools to find out the results. To find out
the volatility tools S.D. (Standard Deviation), correlation and GARCH Model are used.
At First correlation between the FIIs and Indian Stock Exchange will be considering and
after that data converted in to stationarity because the data is time series, to convert data
into stationarity Augmented Dickey Fuller test is used. and Finally, Foreign Institutional
Investors Volatility is checked using GARCH model according to Kim and Singhal
(1993);Agarwal (1997); Radelet and Sachs, (1998); buckley et. al., (2002); Batra (2003);
Singh (2004); Kulwantraj, (2004); pal (2005); Bhattacharya and Mukherjee (2005);
Biswas (2005); Mohan (2006); Upadhyay (2006); Karmakar (2006); Banerjee and Sarkar
(2006);Behera (2010); Gupta (2011);Sultana and Pardhasadhi (2012).
4.1 Hypothesis
H0: There is no significant impact of FIIs on the Volatility of Indian Stock
Market.
H1: There is significant impact of FIIs on the Volatility of Indian Stock Market.
4.2 Stationary test
Stationarity of data means when a data is constant over a time period in
reference to mean and its deviation. As, the time series tools can be applied only if the
select time series is stationary. It means the mean and variance are not varying with time.
In this study, Foreign Institutional Investors Daily Net Purchase and sale in Equity as
well as in debts Market is considered.
In statistics, the Dickey-Fuller test check the hypothesis that data is stationarity
or not and unit root is present in an autoregressive model.
Impact of Foreign Institutional Investors on the Volatility of Indian Stock Market 87
In present study to check the relationship the Augmented Dickey Fuller (ADF)
test is used.
Null Hypothesis is that Data is stationarity
Alternative Hypothesis is data is not stationarity
To check the hypothesis, the following equation is used
∇𝑦𝑡 = 𝛿𝑦𝑡−1 + 𝑢𝑡
In the above equation, the null hypothesis of unit root, 𝛿 = 0 is taken and the
alternative hypothesis of 𝛿 < 0 is tested. So, the null hypothesis of non-stationarity
would be rejected, if, 𝛿 is negative and significantly different from zero.
4.3 Model used
To check the volatility, the most appropriate tools by Modern economics is the
least square model. In this it is determine that how much one variable will change the
response of other variable.
Least square model assumes that the expected value of the all error tem and
when it is squared at the same given point. This process is called homoscedasticity and
this assumption focused on ARCH and GARCH Model. These Models are used as basic
model to use the volatility in data.
5. 0 Empirical Results and Findings
5.1 Trend analysis
Figure 2 depicts the trend analysis and it shows that the flow of FIIs is increasing
from time to time and in the last decades it shows more fluctuations. It means that FIIs
have interest in Indian Stock Market. Various factors do influence FIIs investment
behaviour like political situation, inflation, market condition and investment
opportunities, Stock returns etc. FIIs shows positive interest in Indian economy because
of investment opportunities is available in Indian Market. BSE SENSEX and NSE
NIFTY are the Indian Stock Market Index which is well recognizable in Indian as well
as in international market. The trend of daily net trade of FIIs and daily closing of both
the indexes is presented and all variables are moving together and show increasing trend
from April 1st 2001 to March 31
st 2017.
5.2 Descriptive analysis
Table 1 depicts the central tendency and dispersion properties of the data series.
It comprises of mean, maximum, minimum values, median, standard deviation. It also
tells about presence of asymmetry and peak in the data series through skewness and
88 FOCUS: Journal of International Business, Volume 5, Issue 1, Jan-Jun 2018
kurtosis respectively. From the table it is evident that both indices bear same amount of
risk i.e. 1.65% and 1.67% but risk in SENSEX is relatively more.
Figure 2: Present the Flow of NIFTY, SENSEX and NET FIIs
-20,000
-10,000
0
10,000
20,000
30,000
40,000
01 02 03 04 05 07 08 09 10 11 12 13 14 15 16
Net FIIs Nifty Sensex
Source: Computed data
Table 1: Descriptive Analysis of NIFTY, SENSEX and NET FIIs
NET_FIIS NIFTY_RETURN SENSEX_RETURN
Mean 295.4889 0.000575 0.000583
Median 104.6000 0.000766 0.000807
Maximum 16377.57 0.409962 0.443217
Minimum -10675.40 -0.130539 -0.118092
Std. Dev. 1336.725 0.016597 0.016743
Skewness 1.853093 3.977256 5.051912
Kurtosis 25.16077 111.0501 142.5194
Jarque-Bera 76040.83 1768052. 2947394.
Probability 0.000000 0.000000 0.000000
Sum 1068193. 2.078151 2.106317
Sum Sq. Dev. 6.46E+09 0.995510 1.013166
Observations 3615 3615 3615
Source: Computed data
Impact of Foreign Institutional Investors on the Volatility of Indian Stock Market 89
Further the value of skewness is more than 0 and value of kurtosis is more than 3
for all the data series, hence it confers the presence of asymmetry in the data. All the
series are positively skewed. The p value of Jarque-Bera statistic is less than .05 which
means the rejection of null hypothesis that data is normal.
5.3 Volatility analysis
Volatility is a rate in which the security increases or decreases for a given set of
returns. it measures the S.D. (Standard Deviation) over the time period and estimate the
fluctuations. Stock Market Volatility indicates the variances between the Indexes during
a particular time period. Stock market is fluctuating timely because of different
economic activities which is desirable but when it fluctuate more then it creates
uncertainty in market which shakes the confidence of the investor. While the overall
stock market volatility has fluctuated over the time with no discernible trend, some
authors have argued that volatility is higher during the bear markets.
5.4 Correlation analysis
Correlation analysis is a method of statistics in which the degree of relation is
checked between two or more variable. Positive correlation shows that if one variable
change systematically then other variable is also have some systematic change. To find
the relationship between the Net Flows of FIIs, NIFTY and SENSEX Pearson correlation
analysis is used. 16 years Daily Closing Index data is taken and Daily Net traded data is
taken for Net FIIs. Table 2 shows the output of Correlation between all the variable.
From Table 2, it is concluded that there is positive Correlation between Net FIIs and
NIFTY (.141) and SENSEX (.139). There is a significant and positive relationship exists
between the Stock market and FIIs Investment.
Table 2: Correlation Analysis
Variable Correlation Significance Value
Net FIIs 1 0.0000
Sensex .141**
0.0000
Nifty .139**
0.0000
Source: Computed data
5.5 Augmented Dickey Fuller (ADF) test
Stationarity of time series data is required to apply the GARCH and ARCH
Model. Firstly, to apply the test, collected data is required to test for stationary properties
and for this Graph (to examine trend in the data) and Augmented Dicky Fuller Test is
90 FOCUS: Journal of International Business, Volume 5, Issue 1, Jan-Jun 2018
used. As already stated that following indices -NIFTY and SENSEX are taken for this
purpose. In this null Hypothesis (H0) is that data is stationary and Alternative
Hypothesis (H1) is data is non-stationary and after that data is tested on different levels.
Log returns are calculated for the closing values of SENSEX and NIFTY by the
following formula:
Log returns= ln(P1-P0)
The results of Augmented Dickey Fuller (ADF) test shows that H0 is rejected
because the t-statistic is -56.12776 for NSE NIFTY and -55.99155 BSE Sensex, -
14.94466 for NETFIIS and the probability value is less than 0.05. Hence, NIFTY and
SENSEX is not having any unit root problem which is basic requirement for GARCH
model. Now GARCH (1,1) model is applied to check the volatility of FIIs on stock
market.
Table 3: Stationary Test Results of ADF Test
Augmented Dickey-Fuller test statistic
Variables t-Statistic Prob.*
Test critical values:
1% level 5% level 10% level
FIIs Net -14.9447 0.0000 -3.43198 -2.86214 -2.56714
Nifty Return -56.1278 0.0001 -3.43197 -2.86214 -2.56713
SENSEX Return -55.9916 0.0001 -3.43197 -2.86214 -2.56713
*MacKinnon (1996) one-sided p-values.
Source: Computed Data
5.6 GARCH Test
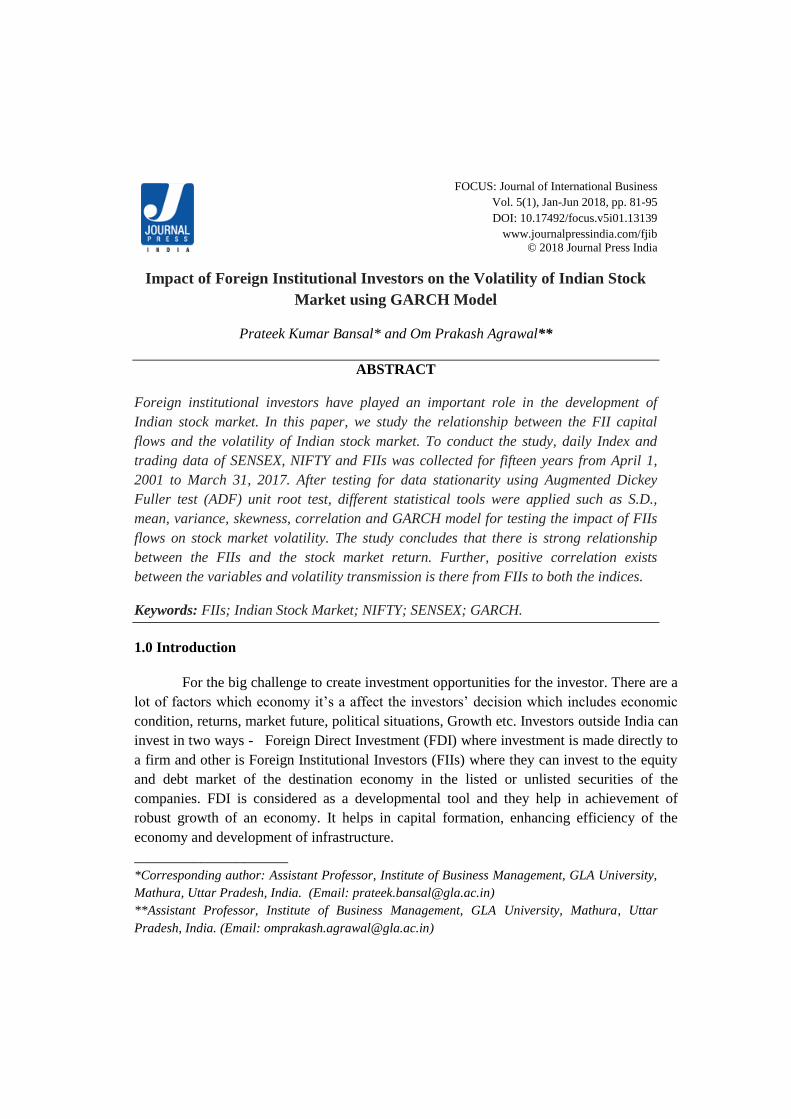
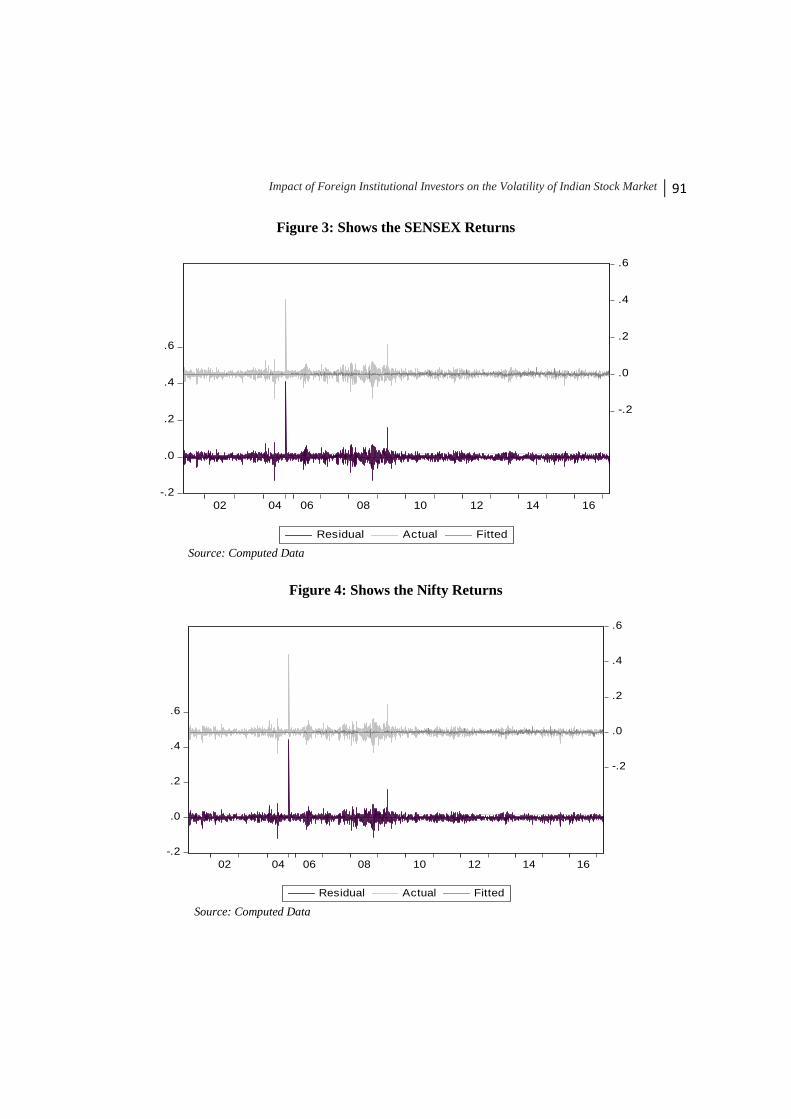
The results of Figure 3 and Figure 4 show the presence of ARCH effect in the
residuals. It means that period of high volatility is followed by high volatility and periods
of low volatility are followed by low volatility. Finally, after converting data into
stationarity GARCH (1,1) Model is used to get the results. Two different equations
prepare, in first equation NET FIIs consider as independent variable and NIFTY is
considering as dependent variable. In Second equation SENSEX is considering as
dependent variable.
The GARCH results of NIFTY return sows that the significant level and have
influenced by the information provided to them and results related to the SENSEX is
similar to the NIFTY. It is concluded that the FIIs Investment does have influence on the
Stock market volatility of India.
Impact of Foreign Institutional Investors on the Volatility of Indian Stock Market 91
Figure 3: Shows the SENSEX Returns
-.2
.0
.2
.4
.6
-.2
.0
.2
.4
.6
02 04 06 08 10 12 14 16
Residual Actual Fitted Source: Computed Data
Figure 4: Shows the Nifty Returns
-.2
.0
.2
.4
.6
-.2
.0
.2
.4
.6
02 04 06 08 10 12 14 16
Residual Actual Fitted Source: Computed Data
92 FOCUS: Journal of International Business, Volume 5, Issue 1, Jan-Jun 2018
6.0 GARCH Model
Model 1: Independent Variable NET FIIs Flows and Dependent Variable as SENSEX
RETURNS)
The result of Model 1 states that there is significant effect of ARCH and
GARCH on the Sensex returns. It means that current volatility is influenced by past
volatility. Also, the square values of the lag variables are significant. Further the series is
affected by volatility in values of FIIS as p value < 5% for all the series.
Table 4: GARCH Test with the Independent Variable as Net FIIs Flows and
Dependent as SENSX
GARCH = C(3) + C(4)*RESID(-1)^2 + C(5)*GARCH(-1)
Variance Equation
Coefficient Standard error T statistics p value
C 4.38E-05 2.99E-06 14.64123 0.0000**
RESID(-1)^2 0.576172 0.030753 18.73520 0.0000**
GARCH(-1) 0.482396 0.018617 25.91193 0.0000**
NET_FIIS 1.67E-06 1.24E-07 13.47464 0.0000**
Source: Computed Data
Model 2: Independent Variable NET FIIs Flows and Dependent Variable as NIFTY
RETURNS
The result of model 2 is also stating that there is significant effect of ARCH and
GARCH on the Sensex returns. It means that current volatility is influenced by past
volatility. Also, the square values of the lag variables are significant. Further the series is
affected by volatility in values of FIIS as p value < 5% for all the series.
Hence, FII does affect volatility of both the indices in India.
Table 5: GARCH Test with the Independent Variable as Net FIIs Flows and
Dependent as SENSX
Variance Equation
Coefficient Standard error T statistics p value
C 2.18E-05 1.86E-06 11.74275 0.0000**
RESID(-1)^2 0.441857 0.021080 20.96122 0.0000**
GARCH(-1) 0.624229 0.015859 39.36147 0.0000**
NET_FIIS 1.61E-06 1.13E-07 14.20969 0.0000**
Source: Computed Data
Note: **Significant at 5 %
Impact of Foreign Institutional Investors on the Volatility of Indian Stock Market 93
6.0 Conclusion
This paper has explored that the relationship between the FIIs and the Volatility
in NIFTY and SENSEX. Trend analysis shows the positive flow that as the Indexes
increases the flow FIIs investment is positively flow with the indexes. Correlation
analysis show a positive relation between the FIIs and the Indexes. Finally,
ARCH/GARCH test analysis shows the significant impact on NIFTY and SENSEX,
after analysis all the result concluded that there was inferred that the Indian Stock
Market volatility influenced by the volatility of previous and FIIs investment.
References
Agarwal, R. N. (1997). Foreign portfolio investment in some developing countries: A
case study of determinants and macroeconomic impact. Indian Economic Review,
XXXII(2), 217-229.
Banerjee, A., & Sarkar, S. (2006). Modelling daily volatility of the Indian stock market
using intra-day data. IIM Calcutta Working Paper Series 588.
Batra, A. (2003). The dynamics of foreign portfolio inflows and equity returns in
India. Indian Council for Research on International Economic Relations, Working
Paper 109.
Behera, H. K. (2010). An assessment of foreign investment in Indian capital market.
Retrieved from http: //ssrn.com/abstract=2258352.
Bhattacharya, B., & Mukherjee, J. (2005, December). An analysis of stock market
efficiency in the light of capital inflows and exchange rate movements: The Indian
context. In Annual Conference of Money & Finance. Mumbai: Indira Gandhi Institute of
Development Research.
Biswas, J. (2005). Foreign portfolios investment and stock market behavior in a
liberalized economy: An Indian experience. Asian Economic Review, 47(2), 221-232.
Buckley, P., Clegg, J., Wang, C., & Cross, A. (2002). FDI, regional differences and
economic growth: Penal data evidence from China. Transnational Corporation, 11(1), 1-
28.
94 FOCUS: Journal of International Business, Volume 5, Issue 1, Jan-Jun 2018
Chandra, A. (2012). Cause and effect between FII trading behaviour and stock market
returns: The Indian experience. Journal of Indian Business Research, 4(4), 286-300.
Dharani, M., Narayanamoorthy, V., & Natarajan, P. (2015). An Empirical Study on
Volatility Pattern of the Shariah Compliant Stocks in Indian Capital Market. Journal of
Economic Policy and Research, April – Sept, 2015, 10(2),150-165.
Dhingra, V. S., Gandhi, S., & Bulsara, H. P. (2016). Foreign institutional investments in
India: An empirical analysis of dynamic interactions with stock market return and
volatility. IIMB Management Review, 28(4), 212-224.
Garg, A. K., & Mitra, S. K. (2015). A study of lead-lag relation between FIIs herding
and stock market returns in emerging economies: Evidence from India. Decision, 42(3),
279–292.
Gupta, A. (2011). Does the stock market rise or fall due to FIIs in India. Researchers
World - Journal of Arts, Science & Commerce, 2(2), 99-107.
Han, K. E., & Singal, V. (2000). Stock market openings: Experience of emerging
economies. Journal of Business, 73(1), 25-66.
Karmakar, M. (2006). Stock market volatility in the long run 1965-2005. Economic and
Political Weekly, 41(18), 1796-1802.
Kim, E. H., & Singal, V. (1993). Opening up of stock markets by emerging economies:
Effects on portfolio flows and volatility of stock prices in portfolio investment in
developing countries. World Bank Discussion Paper No.228. Stijn Claessens and
Sudarshan Gooptu (Ed.) Washington: World Bank, 383-403.
Kulwantraj, N. B. (2004). The determinants of foreign institutional investments in India
and the role of risk, inflation and return. Indian Economic Review, 32(2), 217-229.
Kumari, J., & Mahakud, J. (2015). Relationship between conditional volatility of
domestic macroeconomic factors and conditional stock market volatility: some further
evidence from India. Asia-Pacific financial markets, 22(1), 87-111.
Impact of Foreign Institutional Investors on the Volatility of Indian Stock Market 95
Mohan, R. T. T. (2006). Neither dread nor encourage them. Economic and Political
Weekly, 41(2), 95-99. Retrieved from http://www.jstor.org/stable/4417661
Mukherjee, P., Bose, S. & Coondoo, D. (2002). Foreign institutional investment in
Indian equity market: an analysis of daily flows during January 1999-May 2002. ICRA
Bulletin Money and Finance, April-September, pp. 21-52
Pal, P. (2005). Volatility in the stock market in India and foreign institutional investors:
A study of the post-election crash. Economic and Political Weekly, 40(8), 765-772.
Poshakwale, S. S., & Mandal, A. (2016). Sources of time varying return comovements
during different economic regimes: Evidence from the emerging Indian equity
market. Review of Quantitative Finance and Accounting, 48(4), 859-892.
Prasanna, P. K. (2008). Foreign institutional investors: Investment preferences in India.
Journal of Administration & Governance, 3(2), 40-51
Radelet, S., & Sachs, J. (1998). The East Asian financial crisis: diagnosis, remedies,
prospects. The Brookings Paper on Economics Activity, 29(1), 1-90.
Singh, S. K. (2004). Foreign portfolio investment. The Indian Journal of Commerce,
57(4), 120-137.
Singhania, M., & Saini, N. (2016). FII, Stock Exchange Return, and the Leverage Effect:
Evidence from India. The Journal of Wealth Management, 19(1), 103-119
Sultana, S. T., & Pardhasaradhi, S. (2012). Impact of flow of FDI & FII on Indian stock
market. Finance Research, 1(3), 4-10.
Upadhyay, S. (2006). FIIs in the stock market and the question of volatility. Portfolio
Organizer, May, 12(5), 22-30.
Vyas, D. J., & Shah, M. D. (2016). Determinants of foreign institutional investors'
investment and its effect on Sensex movement-a quarterly appraisal. International
Education and Research Journal, 2(4), 111-115.