28
Impact of grid storage functions on battery degradation NIST Workshop PCS Architectures for PEV Fleets as Grid storage 06/13/2011

Impact of grid storage functions on
battery degradation
NIST Workshop
PCS Architectures for PEV Fleets as Grid storage
06/13/2011

Agenda
• Introduction
• Energy storage Grid applications
• Duty cycles
• Degradation modes
• Sample power applications
• closing
2

Grid Storage Applications- Energy
• Energy
• Hours
• Peak shifting
• Wind integration
• PV integration
3

Grid Storage Applications - high power applications
• Seconds to minutes
• Frequency Regulation
• Wind integration
• PV integration
• Microgrid integration
• Power quality solution
• Synthetic system inertia
• Synthetic System primary frequency control
• Black start
4

Energy Storage Attributes for These Applications
• Energy rating
• Power rating
• charge
• discharge
• Cycling capability
• Useful depth of discharge
• Energy efficiency
• Self-discharge characteristic
• Storage
• Calendar life
• Cycle life

Energy Storage Applications-Time & Size Range
ESA (Electricity Storage Association), provides a map of applications

Example: Frequency Regulation
In two Years of Operation in PJM ISO • Performed over 250,000 small cycles and charged or discharged over 3,300 MWhr
• Less than two percent energy capacity degradation and no significant power capacity degradation
• Expected to maintain rated power and energy capacity for over twenty years without battery replacements or upgrades
Typical 24 hour Profile

Grid Stability is maintained through the balancing of load and
supply
Regulation is near zero-energy service compensation for minute-to-minute
fluctuations in total system load and uncontrolled generation
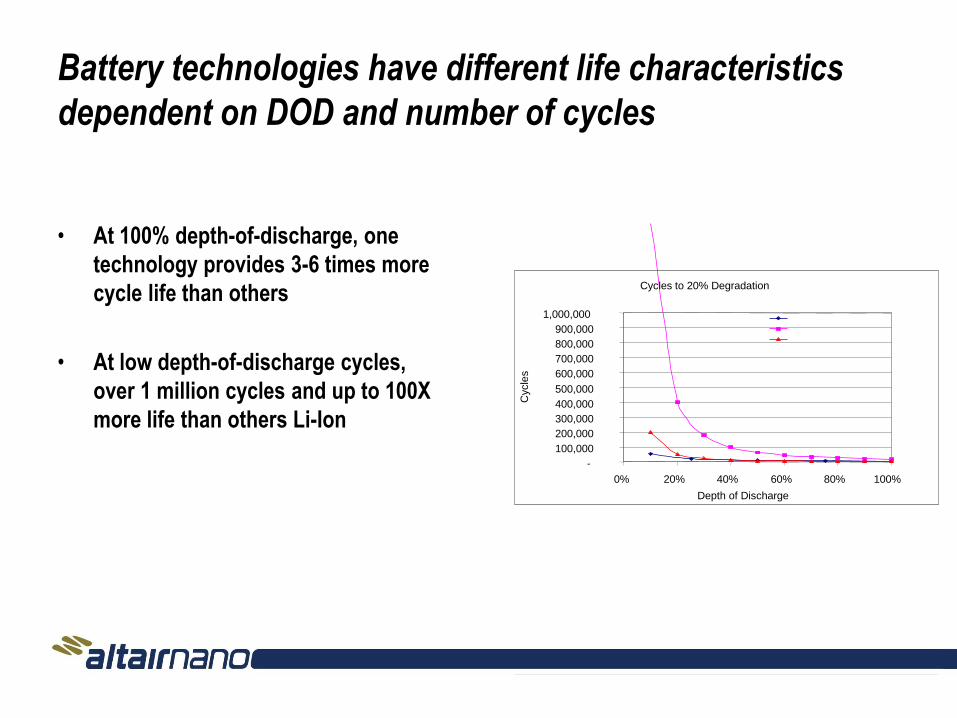
Battery technologies have different life characteristics
dependent on DOD and number of cycles
• At 100% depth-of-discharge, one
technology provides 3-6 times more
cycle life than others
• At low depth-of-discharge cycles,
over 1 million cycles and up to 100X
more life than others Li-Ion
Cycles to 20% Degradation
-
100,000
200,000
300,000
400,000
500,000
600,000
700,000
800,000
900,000
1,000,000
0% 20% 40% 60% 80% 100%
Depth of Discharge
Cycle
s

Types of Frequency Control by Timeframe
Source: LBNL

Actions of Frequency Control in a Loss of Generation
Incident
Inertia
Source: LBNL


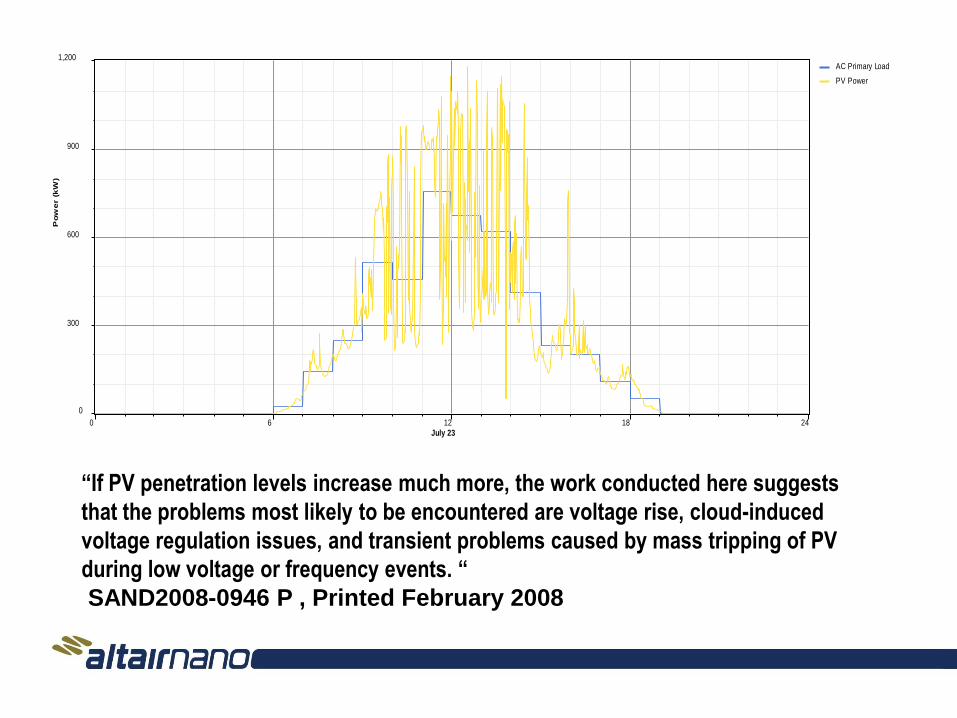
“If PV penetration levels increase much more, the work conducted here suggests
that the problems most likely to be encountered are voltage rise, cloud-induced
voltage regulation issues, and transient problems caused by mass tripping of PV
during low voltage or frequency events. “
SAND2008-0946 P , Printed February 2008
July 230 6 12 18 24
0
300
600
900
1,200P
ow
er (
kW
)
AC Primary Load
PV Power

South PointHawiLalamilo
South PointHawiLalamilo
At 40% wind penetration, system frequency
is severely affected Incremental additions of “fast”
energy storage increasingly
stabilizes system frequency
5MW of “fast” energy storage resulted in
similar frequency performance as the
baseline scenario; near-term potential
project
Big Island Energy Roadmap Study

Storage System Size Customized to Utility
Ramp Rate
• 4 MW Battery smoothes ramp rate of 18 MW wind farm to .5 MW/min
0%
20%
40%
60%
80%
100%
120%
140%
160%
180%
200%
9.50000
10.50000
11.50000
12.50000
13.50000
14.50000
15.50000
16.50000
1 70
13
9
20
8
27
7
34
6
41
5
48
4
55
3
62
2
69
1
76
0
82
9
89
8
96
7
10
36
11
05
11
74
12
43
13
12
13
81
14
50
15
19
15
88
16
57
17
26
17
95
18
64
19
33
20
02
20
71
21
40
22
09
22
78
23
47
24
16
24
85
25
54
Stat
e o
f C
har
ge
MW
s
1.5 Hour Event 2 Second Resolution
Actual Wind Farm Output-Smoothing Potential by Battery Storage
Raw Wind Power Out
Smoothed Wind Power
State of Charge

Peak Shifting
1 cycle per day
Expected life
50 years
Grid Stabilization and
Hybrid Applications
Many cycles per day
Expected life
20 years
Battery Cycle Life to 80% Capacity

Cycle life Comparison of Battery Technologies
Cycles to 20% Degradation
-
100,000
200,000
300,000
400,000
500,000
600,000
700,000
800,000
900,000
1,000,000
0% 20% 40% 60% 80% 100%
Depth of Discharge
Cycle
s

Calendar Life Capacity Degradation
• Arrhenius approach for calendar life prediction

Capacity Loss (Fade) is calculated from:
• Predicted capacity loss:
• Calendar life calculation
Capacity FadeCalendar Life
• Usage calculation
Capacity FadeUsage
• Combine results for total capacity degradation vs. time
Capacity FadeTotal =

Need Standardized Tests
• Applications
• Vehicle Usage
• Grid Energy
• Grid Power
• Assess
• Power
• Energy
• Impedance
21
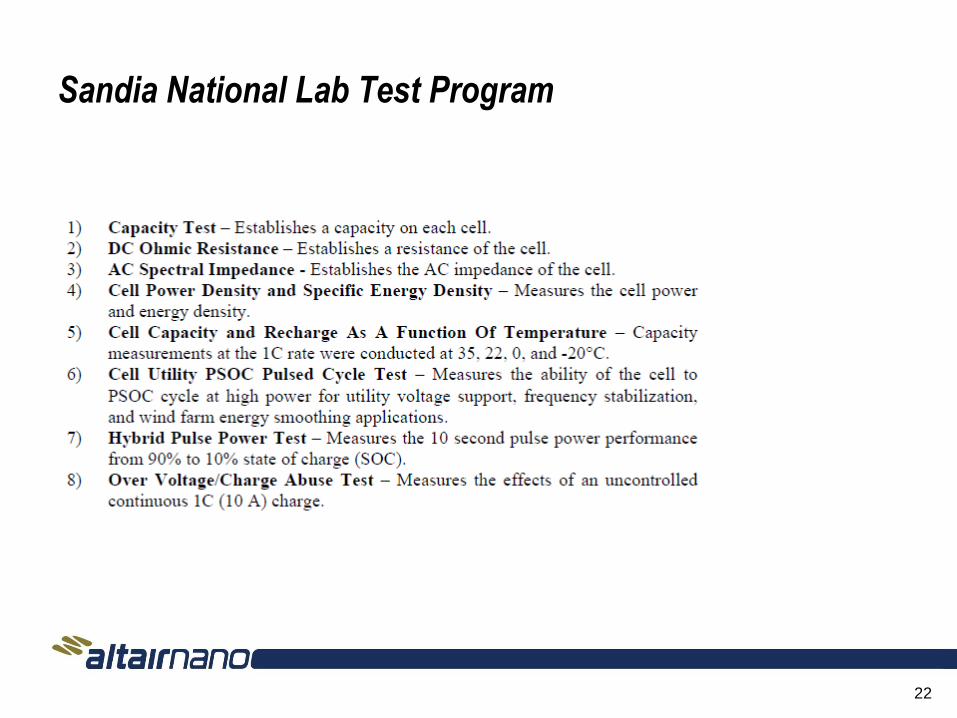
Sandia National Lab Test Program
22

Other Test Programs
• Vehicle Use
• PHEV Charge-depleting cycling test
• The mean charge/discharge rate of 1.42 C of this profile is very
close to mean discharge rate of the worst case PJM duty profile
of 1.38 C
• Carnegie Mellon University
• The effects of combined driving and vehicle-to-grid (V2G) usage on the
lifetime performance of relevant commercial Li-ion cells were studied
23

Closing comments
• Questions
• Discussion
• Next steps
24
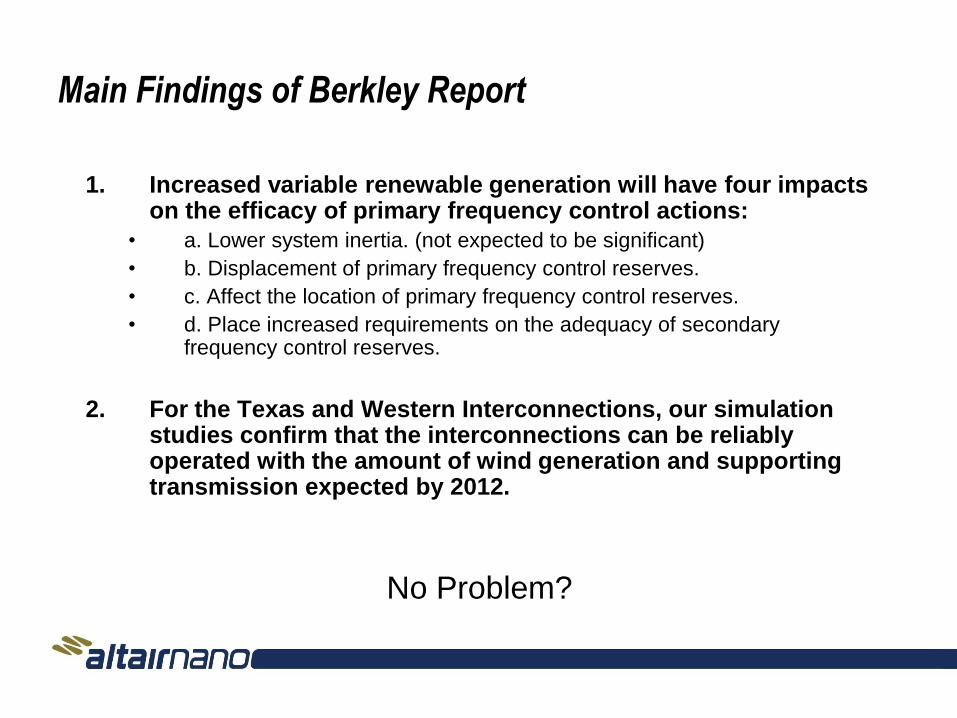
Main Findings of Berkley Report
1. Increased variable renewable generation will have four impacts on the efficacy of primary frequency control actions:
• a. Lower system inertia. (not expected to be significant)
• b. Displacement of primary frequency control reserves.
• c. Affect the location of primary frequency control reserves.
• d. Place increased requirements on the adequacy of secondary frequency control reserves.
2. For the Texas and Western Interconnections, our simulation studies confirm that the interconnections can be reliably operated with the amount of wind generation and supporting transmission expected by 2012.
No Problem?

Half Cycle Capacity Degradation Method
• Measure change in DoD for a single half cycle
• Record temperature for that half cycle
• Calculate degradation due to that half cycle
• Repeat for each half cycle
• Sum the degradation from all half cycles
27

PSOC - Partial State of Charge Test from Sandia National Laboratory
28


