Impact of high hydrostatic pressure on wheat, tapioca, and potato starches vorgelegt von Dipl.-Ing. Birgit Anika Rumpold von der Fakultät III – Prozesswissenschaften der Technischen Universität Berlin zur Erlangung des akademischen Grades Doktorin der Ingenieurwissenschaften - Dr.-Ing. - genehmigte Dissertation Promotionsausschuss: Vorsitzender: Prof. Dr. Herbert Kunzek Berichter: Prof. Dr. Dipl.-Ing. Dietrich Knorr Berichter: Prof. Dr. Dr. e.h. Friedrich Meuser Tag der wissenschaftlichen Aussprache: 16. August 2005 Berlin 2005 D 83
Transcript
Impact of high hydrostatic pressure on wheat, tapioca, and potato starches
vorgelegt von Dipl.-Ing.
Birgit Anika Rumpold
von der Fakultät III – Prozesswissenschaften der Technischen Universität Berlin
zur Erlangung des akademischen Grades
Doktorin der Ingenieurwissenschaften
- Dr.-Ing. -
genehmigte Dissertation
Promotionsausschuss: Vorsitzender: Prof. Dr. Herbert Kunzek Berichter: Prof. Dr. Dipl.-Ing. Dietrich Knorr Berichter: Prof. Dr. Dr. e.h. Friedrich Meuser Tag der wissenschaftlichen Aussprache: 16. August 2005
Berlin 2005 D 83
Danksagung Diese Arbeit ist in den vergangenen drei Jahren aller undichten Hochdruckanlagen
zum Trotz entstanden, und ich möchte mich an dieser Stelle bei denjenigen bedanken, die zu
ihrer Vollendung beigetragen haben.
Zuallererst gilt mein Dank meinem Doktorvater Prof. Dr. Dipl.-Ing. Dietrich Knorr, der mir
die Möglichkeit zu dieser Arbeit gegeben hat. Weiterhin danke ich Prof. Dr. Dr. e.h. Friedrich
Meuser, der so freundlich war, als Gutachter zu fungieren, und Prof. Dr. Herbert Kunzek, der
den Vorsitz übernommen hat.
Dr. Rolf Stute danke ich für seine förderlichen Gespräche und Ideen, für sein Interesse an der
Arbeit, und dafür, dass er mir die Möglichkeit verschafft hat, meine Ergebnisse auf der
Stärketagung 2004 vorzustellen. Frau Dr. Ulrike Einhorn-Stoll danke ich für die wertvollen
und Kraft spendenden Gespräche, für die Durchführung der DSC-Analyse und die
Unterstützung bei der statistischen Auswertung. In diesem Zusammenhang möchte ich mich
auch dafür bedanken, dass ich am Fachgebiet für Lebensmittelqualität und
Materialwissenschaften die Messungen der Feststoffdichte durchführen durfte. Dr. Blochwitz
vom Fachgebiet für Lebensmittelrheologie danke ich für die freundliche Leihgabe des
Muffelofens, und Dr. Hubert Rein der Friedrich-Wilhelms-Universität Bonn für die
Ausführung der Röntgenstrukturanalysen. Ebenso gilt mein Dank Prof. Rudolf Klingler und
seinen Mitarbeitern für die Unterstützung bei den Brotbackversuchen. Markus Hartmann
danke ich für die wundervolle Zusammenarbeit in Freising, bei der die mikroskopischen
Aufnahmen unter Hochdruck und eine Publikation entstanden sind. Besonderer Dank gilt
meiner ehemaligen Diplomandin Tanja Wiehle, die durch Fleiß und Ausdauer erheblich zu
meiner Arbeit beigetragen hat. An dieser Stelle möchte ich mich auch bei Bernd Kettlitz für
viele Hilfestellungen und Interesse auf dem Gebiet der resistenten Stärke bedanken.
Ich danke allen Kollegen für die schöne Zeit am Fachgebiet, besonders meiner Bürokollegin
Manuela, meinem Seelentröster Stefan Töpfl, Irene für viele beruhigende Gespräche, Roman
und Edwin, meine Retter an der multivessel, Bogu, dem Mann, der alles reparieren kann,
Cornelius, Ana, Anna, Alex, Gabi, Bunni, Gisi, Oliver Schlüter, Ute, Marcel, Volker und
allen, die ich hier leider vergessen habe.
Zuletzt möchte ich meiner Familie danken, vor allem meinen Eltern Dagmar und Wolfgang
Bauer, die mir diese Ausbildung ermöglicht haben und immer an mich glauben, und meinem
Mann Tino Rumpold, der mich immer unterstützt, versteht und mir Kraft und Gelassenheit
gibt.
I
CONTENT
CONTENT ................................................................................................................... I
LIST OF ABBREVIATIONS .............................. ........................................................ IV
LIST OF FIGURES..................................................................................................... V
LIST OF TABLES ..................................... ................................................................ IX
3.3.10 Degree of gelatinisation......................................................................................................................... 32
3.4 High hydrostatic pressure treatment............................................................................................................33 3.4.1 High pressure multivessel apparatus ....................................................................................................... 33 3.4.2 High volume-pressure unit I (National Forge) ........................................................................................ 33 3.4.3 High volume-pressure unit II (Unipress)................................................................................................. 34 3.4.4 In situ analysis with a high pressure cell ................................................................................................. 34 3.4.5 Statistical evaluation................................................................................................................................ 35
4.2 Optical In situ analysis of starch granules under high pressure................................................................45 4.2.1 Visual evaluation of starch pressurisation ............................................................................................... 45 4.2.2 Starches dyed with Lugol’s solution under pressure ............................................................................... 47
4.3 Physical properties of pressurised starch suspensions................................................................................50 4.3.1 Pressure gelatinisation curves and electrical conductivity ...................................................................... 50 4.3.2 Impact of pressurisation time on electrical conductivity ......................................................................... 53 4.3.3 Correlation of degree of gelatinisation and electrical conductivity ......................................................... 55 4.3.4 Water binding capacity............................................................................................................................ 56
4.4 Impact of pressure, temperature and treatment time on starch gelatinisation ........................................57 4.4.1 Phase diagrams........................................................................................................................................ 57 4.4.2 Pressure-induced gelatinisation curves.................................................................................................... 59 4.4.3 Pressurisation time .................................................................................................................................. 62 4.4.4 Starch suspensions as pressure time temperature integrator.................................................................... 64 4.4.5 Statistical evaluation................................................................................................................................ 66
4.5 Effect of water content and additives on pressure-induced starch gelatinisation ....................................67 4.5.1 Impact of water content........................................................................................................................... 68 4.5.2 Effect of sugars........................................................................................................................................ 69 4.5.3 Impact of sodium chloride....................................................................................................................... 72 4.5.4 Influence of salts ..................................................................................................................................... 75
4.6 Formation of resistant starch from pressurised wheat starch ...................................................................78 4.6.1 Preliminary tests...................................................................................................................................... 78 4.6.2 Resistant starch formation after high pressure treatment......................................................................... 81 4.6.3 Microscopic examination ........................................................................................................................ 84 4.6.4 X-ray analyses ......................................................................................................................................... 85 4.6.5 Résumé.................................................................................................................................................... 87
4.7 Impact of pressurised wheat starch on bread..............................................................................................88
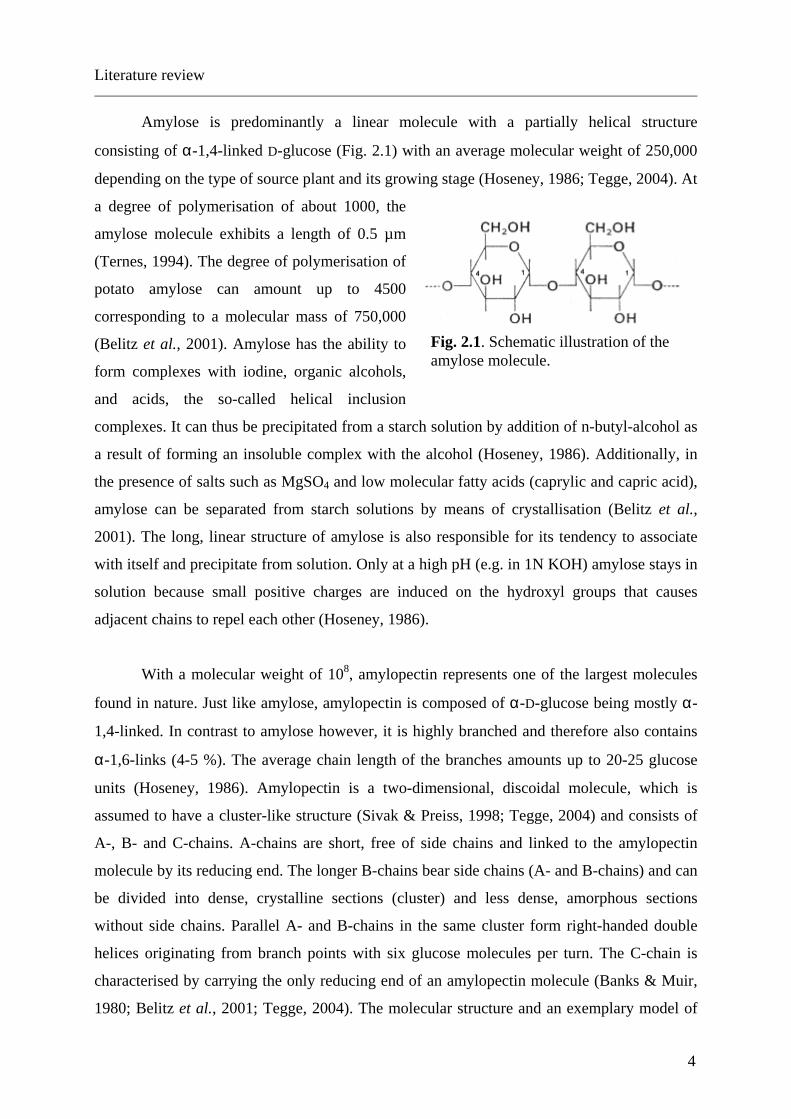
Fig. 2.1. Schematic illustration of the amylose molecule. ....................................................... 4
Fig. 2.2. Molecular structure of amylopectin and a model for the helical and cluster-structure of the amylopectin molecule (according to Banks & Muir, 1980; Belitz et al., 2001). ......................................................................................................................... 5
Fig. 2.3. Composition of starch blocklets and the assembly of small and large blocklets in soft and hard shells in a starch granule (Gallant, 1997). ........................................... 5
Fig. 2.4. Birefringent pattern of native potato starch granules in polarised light (x 400)........ 6
Fig. 2.5. Alignment of double helices in A- and B-type crystals of starches (Blanshard, 1987). ......................................................................................................................... 7
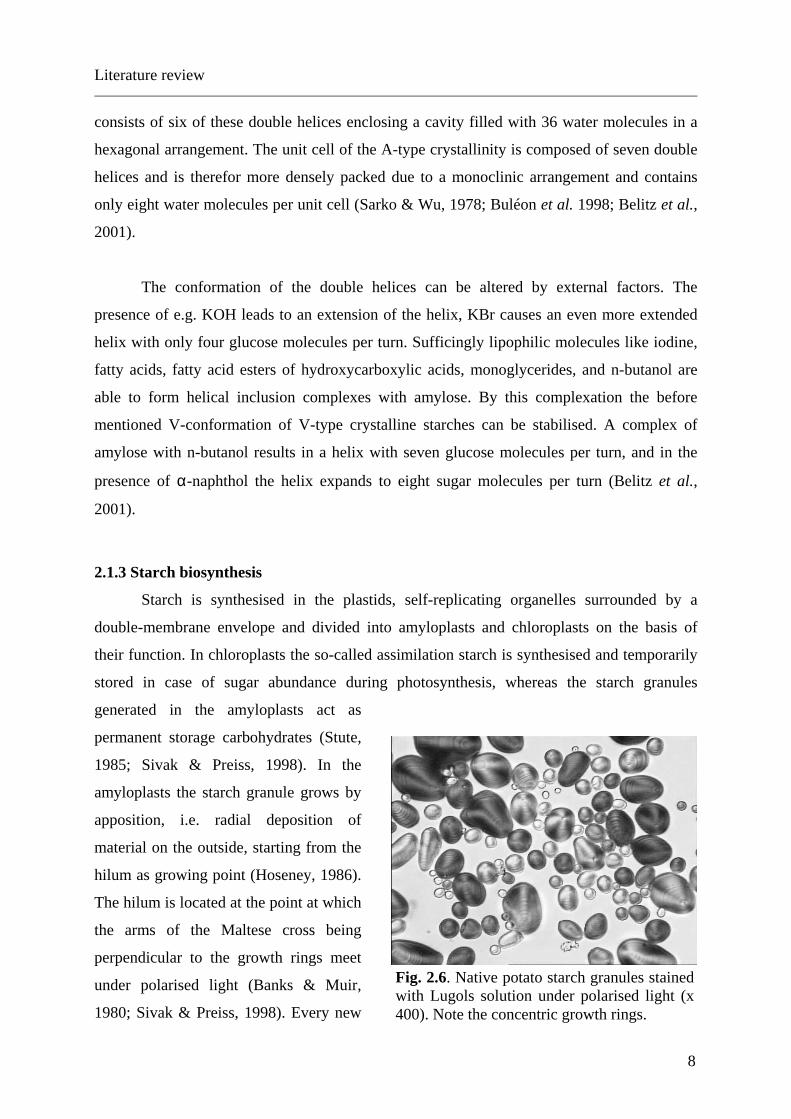
Fig. 2.6. Native potato starch granules stained with Lugols solution under polarised light (x 400). Note the concentric growth rings. .................................................................... 8
Fig. 2.7. Schematic overview of starch biosynthesis (Buléon et al, 1998; Sivak & Preiss, 1998; Tegge, 2004).................................................................................................... 9
Fig. 2.9. Wheat starch suspensions (5 % w/ w, x 400) native (a), 15 min at 500 MPa, 20°C (b), 15 min at 0.1 MPa, 90°C (c). ............................................................................ 24
Fig. 2.10. Schematic depiction of RS 1, RS 2 and RS 3 (Cerestar, 2003). .............................. 26
Fig. 4.1. X-ray diffraction patterns of native wheat starch (a), tapioca starch (b) and potato starch (c). ................................................................................................................. 39
Fig. 4.2. DSC curves of dry, native wheat (a), tapioca (b), and potato (c) starches under anaerobic conditions at a heating rate of 10°K/ min................................................ 41
Fig. 4.3. TG (straight line) and DTG (dotted line) curves of dry, native wheat (a), tapioca (b), and potato (c) starches under anaerobic conditions at a heating rate of 10°K/ min. .......................................................................................................................... 42
Fig. 4.4. Sorption isotherms of native, heat-gelatinised and freeze-dried (Th), and pressure-gelatinised and freeze-dried (HP) wheat (W), tapioca (T), and potato starches (P).44
Fig. 4.5. Water content of commercial starches and native, heat-gelatinised and freeze-dried (therm), and pressure-gelatinised and freeze-dried (HP) wheat, tapioca, and potato starches at a water activity of 0.99........................................................................... 45
Fig. 4.6. Wheat starch suspension at 0.1 MPa (a), after 1 h at 300 MPa (b) and after pressure release at 0.1 MPa (c). ............................................................................................. 46
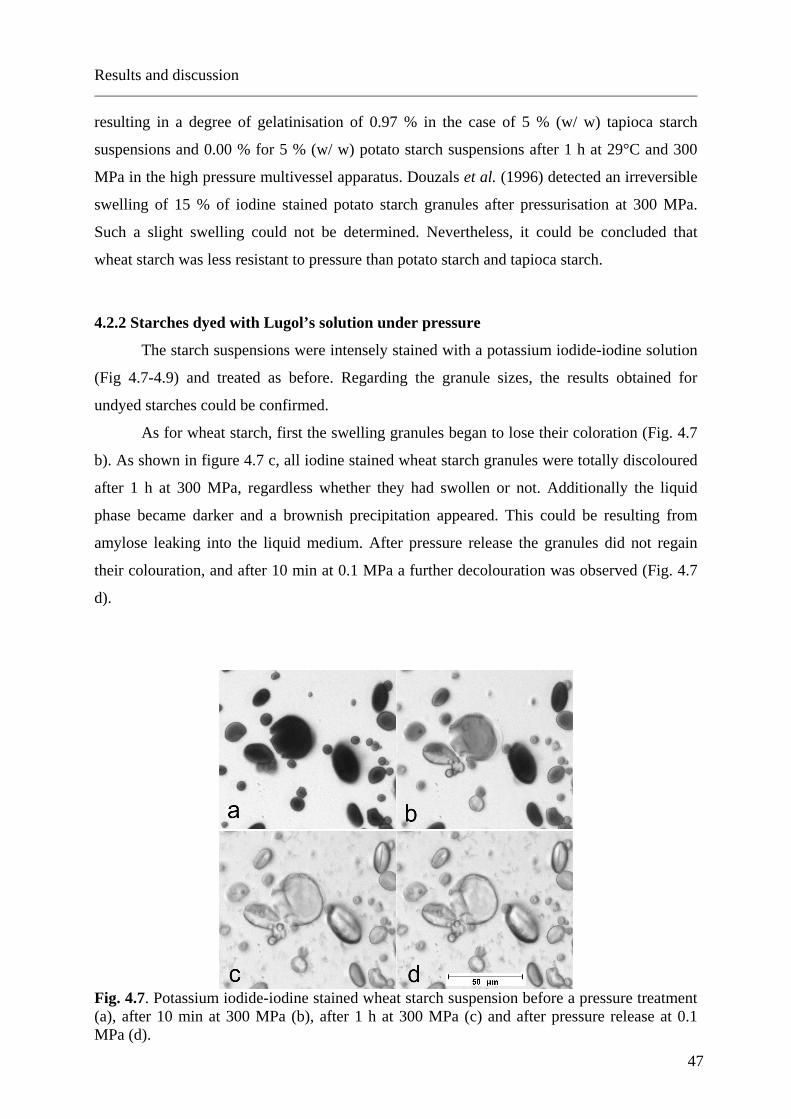
Fig. 4.7. Potassium iodide-iodine stained wheat starch suspension before a pressure treatment (a), after 10 min at 300 MPa (b), after 1 h at 300 MPa (c) and after pressure release at 0.1 MPa (d)................................................................................ 47
Fig. 4.8. Potassium iodide-iodine stained tapioca starch suspensions before a pressure treatment (a) and after pressure release at 0.1 MPa following a 1 h treatment at 300 MPa (b). ................................................................................................................... 48
VI
Fig. 4.9. Potassium iodide-iodine stained potato starch suspension before a pressure treatment (a) and after pressure release at 0.1 MPa following a 1 h treatment at 300 MPa (b). ................................................................................................................... 48
Fig. 4.10. Degree of gelatinisation [%] and electrical conductivity [µS/ cm] of pressure-treated wheat (a), tapioca (b), and potato (c) starch suspensions (5 % w/ w, 29°C, 15 min)..................................................................................................................... 51
Fig. 4.11. Electrical conductivity [µS/ cm] of pressurised (black) and washed and then pressurised (grey) wheat starch suspensions (5 % w/ w, 29°C, 15 min). ................ 52
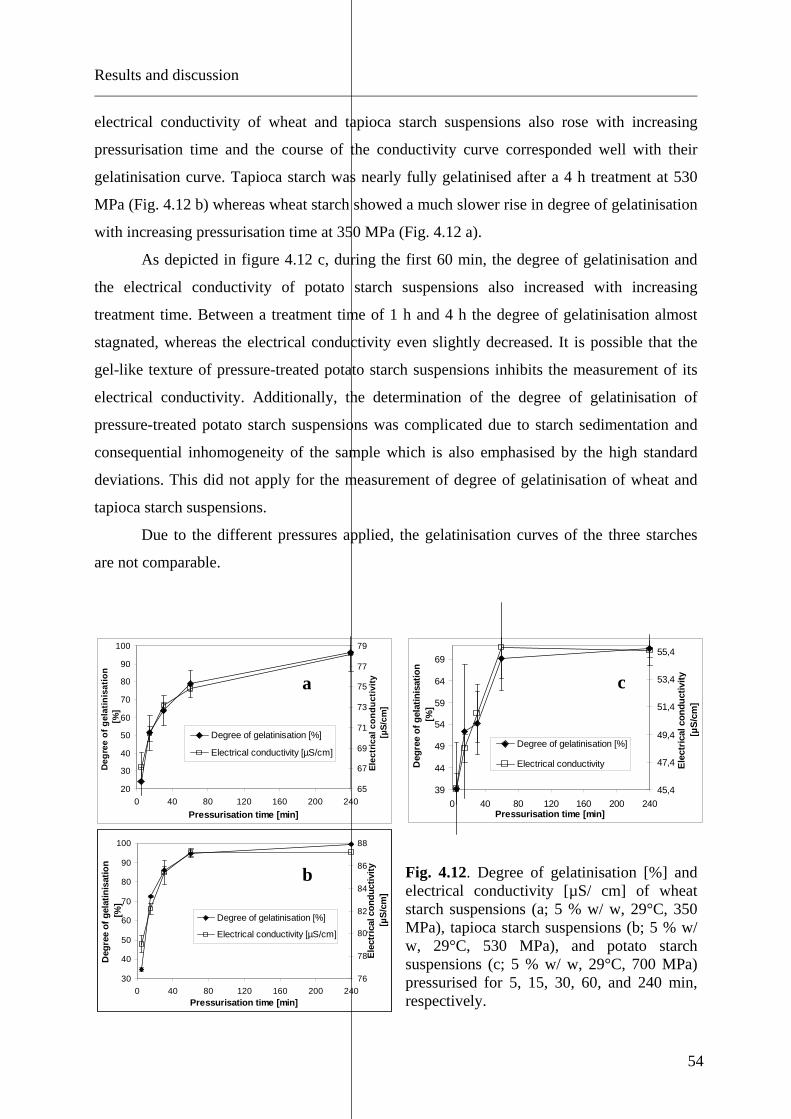
Fig. 4.12. Degree of gelatinisation [%] and electrical conductivity [µS/ cm] of wheat starch suspensions (a; 5 % w/ w, 29°C, 350 MPa), tapioca starch suspensions (b; 5 % w/ w, 29°C, 530 MPa), and potato starch suspensions (c; 5 % w/ w, 29°C, 700 MPa) pressurised for 5, 15, 30, 60, and 240 min, respectively. ........................................ 54
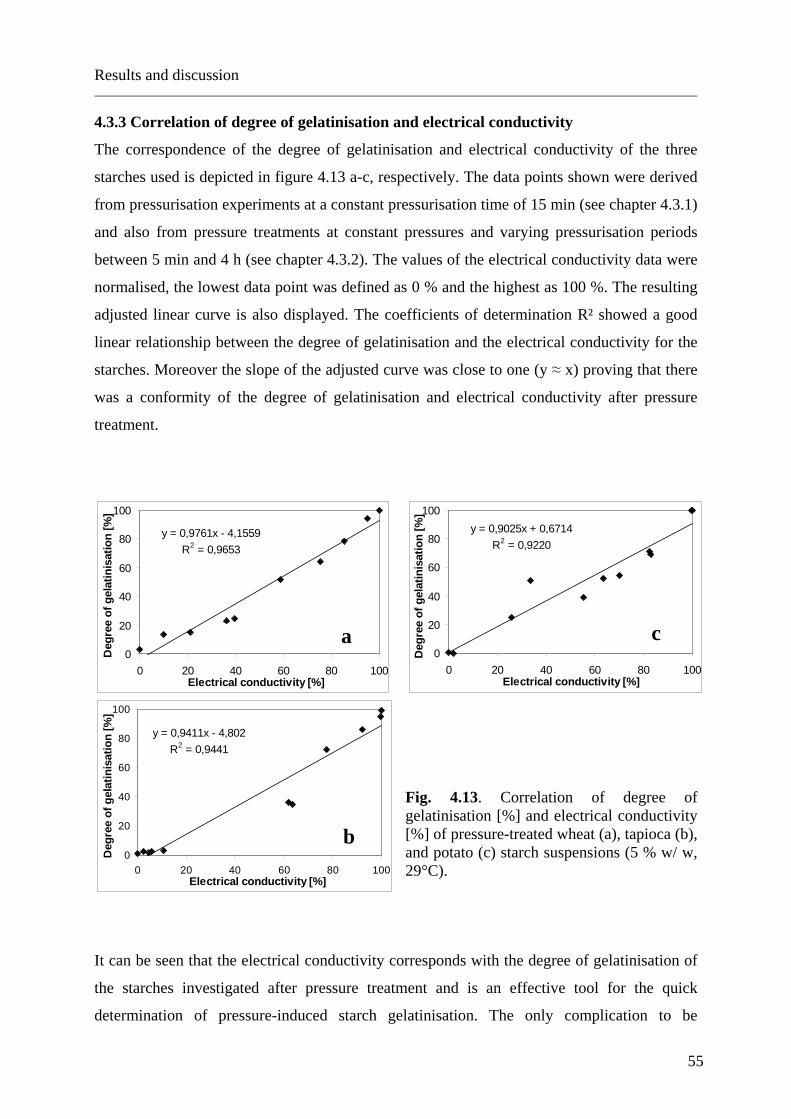
Fig. 4.13. Correlation of degree of gelatinisation [%] and electrical conductivity [%] of pressure-treated wheat (a), tapioca (b), and potato (c) starch suspensions (5 % w/ w, 29°C)........................................................................................................................ 55
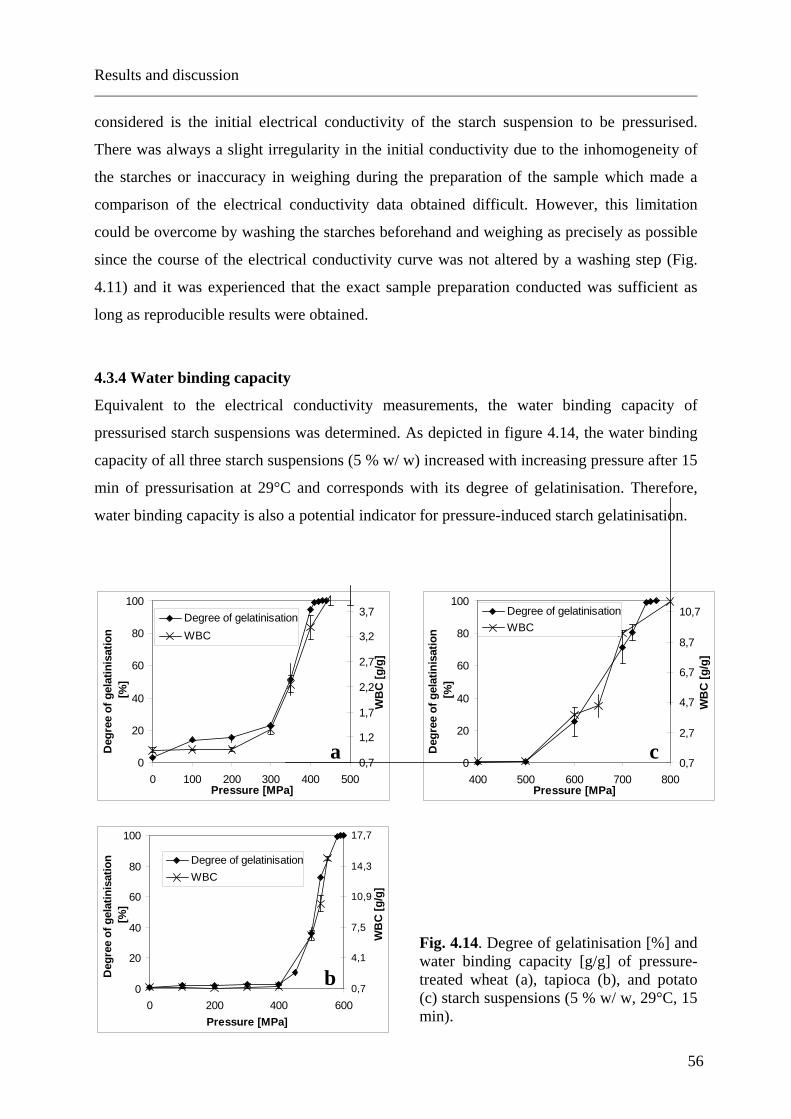
Fig. 4.14. Degree of gelatinisation [%] and water binding capacity [g/ g] of pressure-treated wheat (a), tapioca (b), and potato (c) starch suspensions (5 % w/ w, 29°C, 15 min)…...................................................................................................................... 56
Fig. 4.15. Phase diagram of complete gelatinisation of wheat, tapioca, and potato starch suspensions (5 % w/ w) after 15 min of pressure-temperature treatments. ............. 58
Fig. 4.16. Pressure-induced gelatinisation curves of wheat, tapioca and potato starch suspensions (5 % w/ w) after pressurisation for 15 min at 29°C............................. 59
Fig. 4.17. Pressure-induced gelatinisation curves of wheat (a), tapioca (b), and potato (c) starch suspensions (5 % w/ w, 15 min) at different temperatures. .......................... 60
Fig. 4.18. Correlation of pressure, temperature, and degree of gelatinisation of wheat starch suspensions (5 % w/ w) treated for 15 min.............................................................. 61
Fig. 4.19. Degree of gelatinisation of wheat, tapioca, and potato starch suspensions (5 % w/ w) after a pressure treatment at 29°C and a constant pressure of 350, 530, and 700 MPa, respectively, depending on the pressurisation time........................................ 62
Fig. 4.20. Degree of gelatinisation of wheat (left) and tapioca (right) starch suspensions (5 % w/ w) after a pressure treatment at 29°C and a constant pressure depending on the pressurisation time. .................................................................................................. 63
Fig. 4.21. Pressure-time phase diagrams of complete gelatinisation of wheat and tapioca starch suspensions (5 % w/ w) pressurised at 29°C................................................. 64
Fig. 4.22. Degree of gelatinisation of pressurised wheat, tapioca and potato starch suspensions at constant pressure (15 min, 29°C) with increasing starch concentration (% w/ w)… ......................................................................................................................... 68
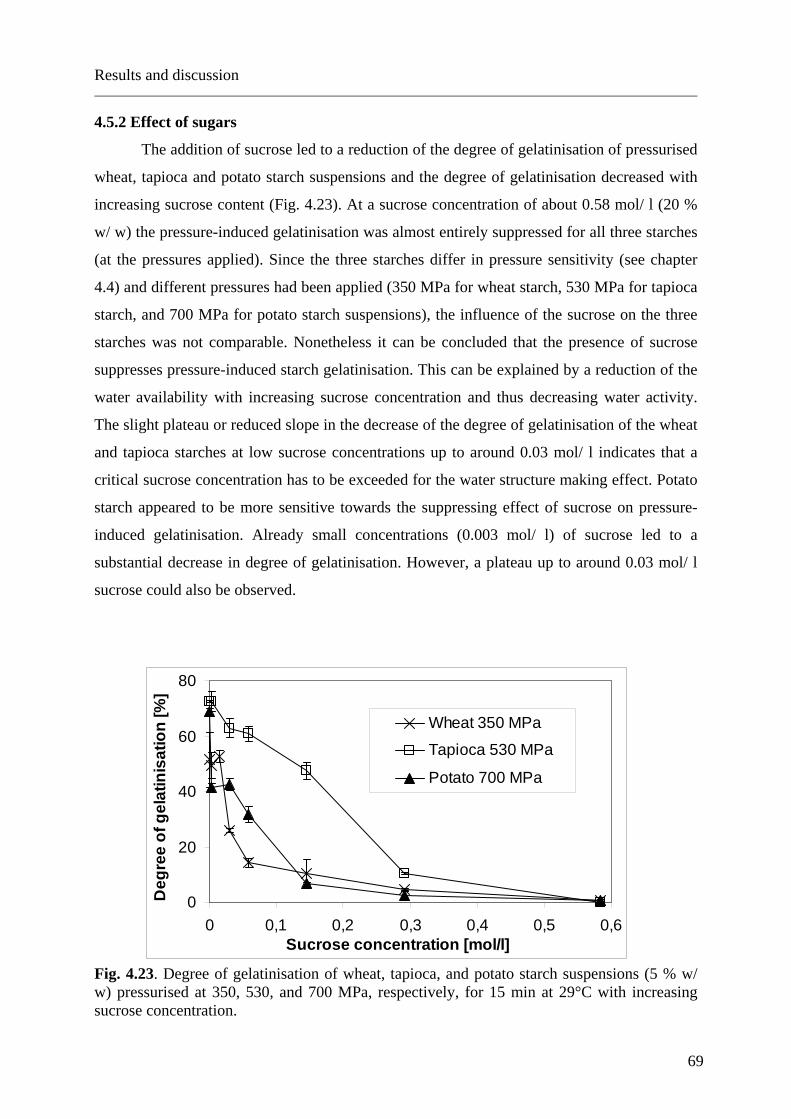
Fig. 4.23. Degree of gelatinisation of wheat, tapioca, and potato starch suspensions (5 % w/ w) pressurised at 350, 530, and 700 MPa, respectively, for 15 min at 29°C with increasing sucrose concentration. ............................................................................ 69
Fig. 4.24. Gelatinisation curves of wheat starch suspensions (5 % w/ w) without and with 1 % (w/ w) sucrose upon pressurisation (15 min, 29°C). ............................................... 70
Fig. 4.26. Degree of gelatinisation of pressurised wheat starch suspensions (5 % w/ w, 15 min, 350 MPa, 29°C) with 0.15 mol/ l sugar (1 fructose, 2 mannose, 3 galactose, 4 glucose, 5 sucrose, 6 lactose, 7 melibiose, 8 maltose, 9 trehalose, 10 melezitose). The numbers of equatorial hydroxyl groups for the sugars were derived from Uedaira 1980 & 1990, Gekko & Koga 1983, and Kato et al. 2001......................... 72
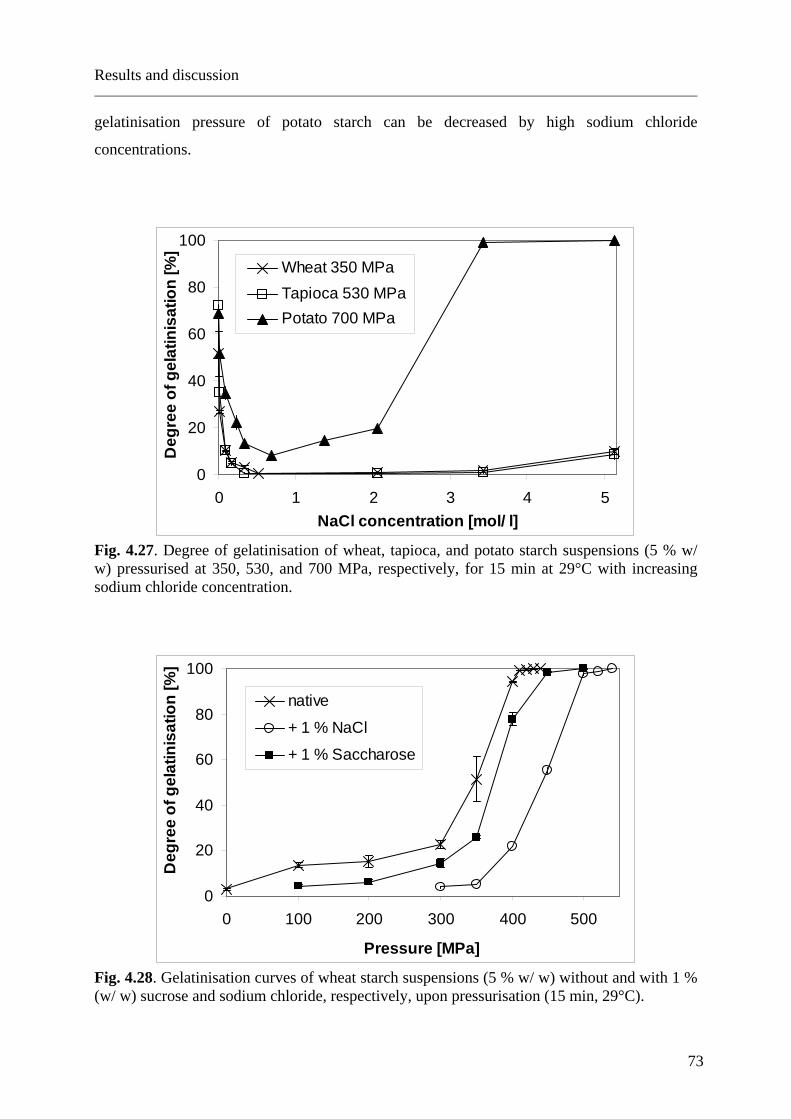
Fig. 4.27. Degree of gelatinisation of wheat, tapioca, and potato starch suspensions (5 % w/ w) pressurised at 350, 530, and 700 MPa, respectively, for 15 min at 29°C with increasing sodium chloride concentration. .............................................................. 73
Fig. 4.28. Gelatinisation curves of wheat starch suspensions (5 % w/ w) without and with 1 % (w/ w) sucrose and sodium chloride, respectively, upon pressurisation (15 min, 29°C)........................................................................................................................ 73
Fig. 4.29. Gelatinisation curves of potato starch suspensions (5 % w/ w) without and with 4, 20, and 30 % (w/ w) sodium chloride, respectively, upon pressurisation for 15 min at 29°C. .................................................................................................................... 74
Fig. 4.30. Degree of gelatinisation of wheat (a), tapioca (b) and potato (c) starch suspensions (5 % w/ w) pressurised at 350, 530 and 700 MPa, respectively for 15 min at 29°C with increasing chloride concentration. ................................................................... 75
Fig. 4.31. Degree of gelatinisation of wheat (a), tapioca (b) and potato (c) starch suspensions (5 % w/ w) pressurised at 350, 530 and 700 MPa, respectively for 15 min at 29°C with increasing concentration of potassium salts. ................................................... 76
Fig. 4.32. Degree of gelatinisation of wheat (a), tapioca (b) and potato (c) starch suspensions (5 % w/ w) pressurised at 350, 530 and 700 MPa, respectively for 15 min at 29°C with increasing concentration of sodium salts.........................................................77
Fig. 4.33. Resistant starch content of gelatinised wheat starch suspensions immediately after a thermal gelatinisation (15 min, 0.1 MPa, 90°C) and a pressure-induced gelatinisation (15 min, 500 MPa, room temperature), respectively, in dependence of the starch concentration. .......................................................................................... 79
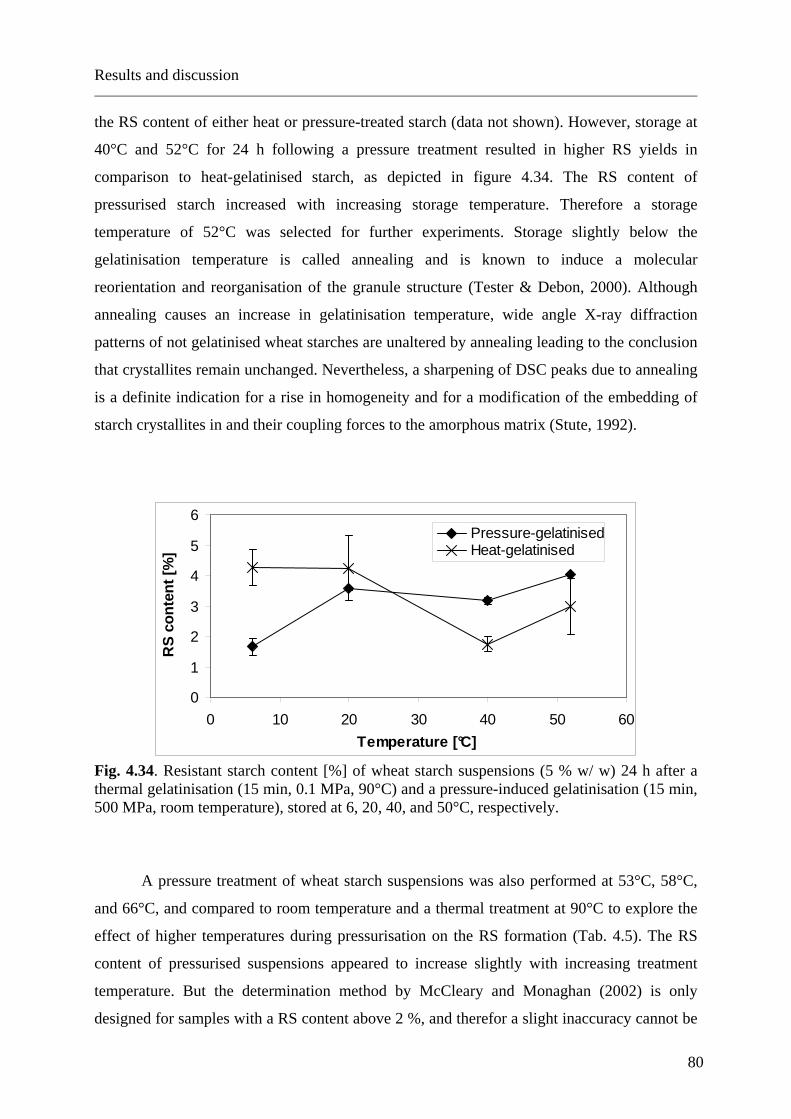
Fig. 4.34. Resistant starch content [%] of wheat starch suspensions (5 % w/ w) 24 h after a thermal gelatinisation (15 min, 0.1 MPa, 90°C) and a pressure-induced gelatinisation (15 min, 500 MPa, room temperature), stored at 6, 20, 40, and 50°C, respectively.. ............................................................................................................ 80
Fig. 4.35. Resistant starch content of wheat starch suspensions (5 % w/ w) pressurised at 500 MPa for 15 min at room temperature followed by continuous annealing at 52°C in comparison to annealing at 52°C interrupted by a pressurisation step every 24 h (Pressure-annealing-cycles). .................................................................................... 82
Fig. 4.36. Resistant starch content of wheat starch suspensions (5 % w/ w) alternately pressurised at 500 MPa for 15 min and stored at room temperature (RT) or at 52°C for 23 h 45 min (Pressure-storage-cycles and pressure-annealing-cycles).............. 82
Fig. 4.37. Resistant starch content of pressure-gelatinised native, acid hydrolysed and enzyme hydrolysed wheat starch suspensions annealed at 52°C interrupted by a
VIII
pressurisation step (500 MPa, 15 min, room temperature) every 24 h (Pressure-annealing-cycles). .................................................................................................... 83
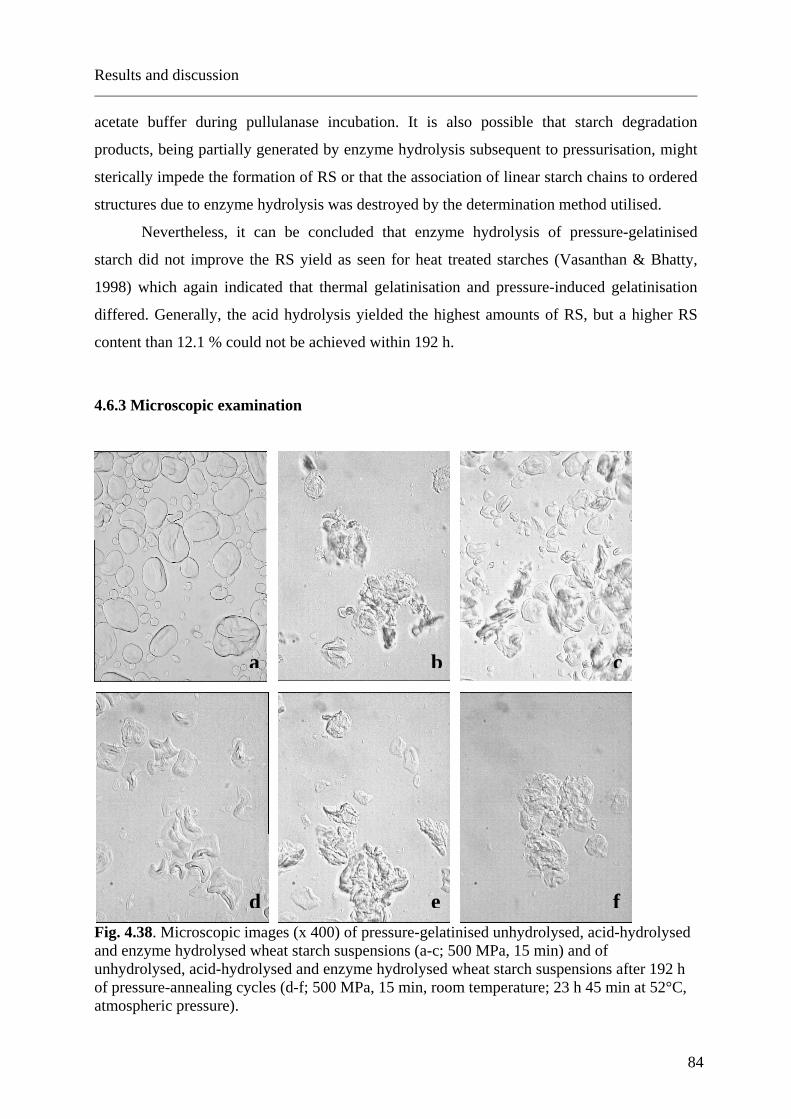
Fig. 4.38. Microscopic images (x 400) of pressure-gelatinised unhydrolysed, acid-hydrolysed and enzyme hydrolysed wheat starch suspensions (a-c; 500 MPa, 15 min) and of unhydrolysed, acid-hydrolysed and enzyme hydrolysed wheat starch suspensions after 192 h of pressure-annealing cycles (d-f; 500 MPa, 15 min, room temperature; 23 h 45 min at 52°C, atmospheric pressure)............................................................84
Fig. 4.39. X-ray diffraction pattern of native wheat starch (a), pressurised (500 MPa, 29°C, 15 min), freeze-dried wheat starch (b), pressurised, annealed (192 h, 52°C), freeze-dried wheat starch (c), and pressurised, unhydrolysed, acid-hydrolysed and enzyme hydrolysed wheat starch suspensions after 192 h of pressure-annealing cycles (500 MPa, 15 min, room temperature; 23 h 45 min at 52°C, atmospheric pressure) and a freeze-drying step (d-f). ........................................................................................... 86
Fig. 4.40. Wheat bread with 5 % high pressure (HP) treated wheat starch (5 g/ 100 g flour) and reference wheat bread without pressurised starch after one day of storage...... 89
Fig. 4.41. Firmness of wheat bread baked after a standard recipe (reference) and after a standard recipe but with 5 % of the wheat flour replaced by high pressure treated wheat starch (10 % suspension, 15 min, 600 MPa)................................................. 90
Fig. 4.42. Elasticity of wheat bread baked after a standard recipe (reference) and after a standard recipe but with 5 % of the wheat flour replaced by high pressure treated wheat starch (10 % suspension, 15 min, 600 MPa)................................................. 90
IX
LIST OF TABLES
Tab. 2.1. Characteristics of wheat, potato, and tapioca starch granules (Tscheuschner, 1996; Belitz et al., 2001) ................................................................................................... 11
Tab. 3.1. Relative humidity of saturated salt solutions at 25°C.............................................. 31
Tab. 3.2. Recipes for bread dough with and without high pressure-gelatinised wheat starch 37
Tab. 4.1. Properties and composition of the starches used ..................................................... 38
Tab. 4.2. ANOVA table for the degree of gelatinisation of wheat starch suspension (5 % w/ w) treated for 15 min ............................................................................................... 66
Tab. 4.3. ANOVA table for the degree of gelatinisation of tapioca starch suspension (5 % w/ w) treated for 15 min ............................................................................................... 66
Tab. 4.4. ANOVA table for the degree of gelatinisation of potato starch suspension (5 % w/ w) treated for 15 min ............................................................................................... 66
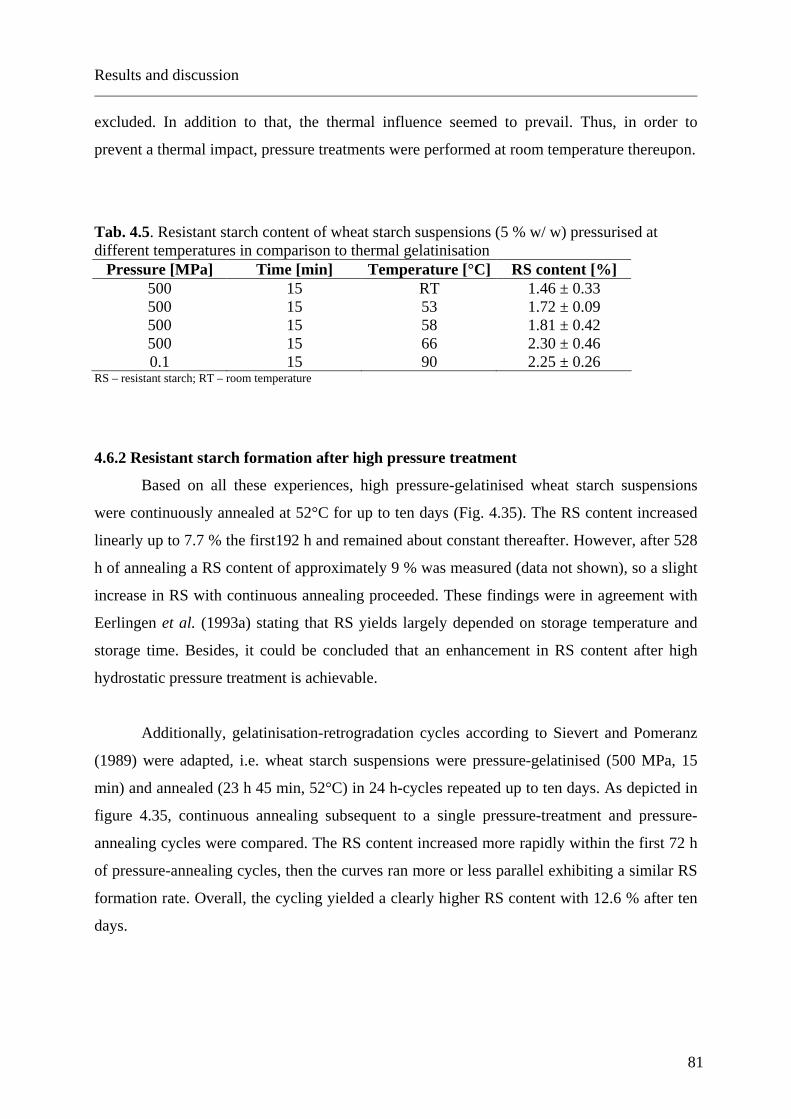
Tab. 4.5. Resistant starch content of wheat starch suspensions (5 % w/ w) pressurised at different temperatures in comparison to thermal gelatinisation .............................. 81
Tab. 4.6. Resistant starch content of pressure-gelatinised wheat starch suspensions (5 % w/ w) after 192 h of different treatments (annealing at 52°C, storage at room temperature) in comparison to RS contents of wheat starch suspensions yielded after thermal gelatinisation as stated in literature .................................................... 87
Introduction
1
1 INTRODUCTION
Starch is an abundant storage carbohydrate in plants, one of the most important
carbohydrate sources for human nutrition and widely used in the food industry. It exhibits
unique properties depending on its botanical origin, chemical composition and the chemical,
enzymatic, thermal, and/ or mechanical (pre-) treatment applied. The texturising properties of
starches are mainly based on a process called gelatinisation defined as a water uptake and
swelling of the starch granules accompanied by a viscosity increase of the suspension and
melting of starch crystals becoming visible by loss of birefringence. Generally, gelatinisation
occurs upon heating but it can also be induced e.g. chemically by addition of alkali. In 1982
Muhr and Blanshard first reported a gelatinisation of wheat starch in excess water at ambient
temperature under high hydrostatic pressure (450 MPa).
High hydrostatic pressurisation is a non-thermal physical process where a packed
product (e.g. starch suspension) is introduced into a high pressure vessel and pressure is built
up either directly or indirectly via a plunger and a pressure transmitting medium (e.g. water).
Thus upon pressurisation, reactions involving a reduction in volume are favoured and high
hydrostatic pressure can cause denaturation of proteins, inactivation of microorganisms and
enzymes at simultaneous preservation of the fresh-like character of a food product at
minimum thermal stress.
Up to now, several research groups dealt with the high hydrostatic pressure treatment
of starches of different origin. They discovered a swelling of starch granules upon
pressurisation associated by a loss of birefringence and gelatinisation. In contrast to heat-
gelatinised starches, the granular character was maintained and the textural properties such as
water binding, viscosity and gel characteristics differed. Consequently, high hydrostatic
pressure treatment of starch suspensions opens up new applications of starches in the food and
cosmetics industries with novel properties. Additionally, a relationship between physical
starch properties and pressure and time has been observed. Since starch gelatinisation and its
physical properties are evidentially temperature-dependent, this raises hope that starch could
be applicable as an intrinsic control indicator for pressure, temperature and treatment time
applied in a pressurisation process.
However, no thorough, methodical investigation on the impact of high hydrostatic
pressure has been performed. The effects of high pressure in combination with temperature
and treatment time on degree of gelatinisation and physical properties need to be studied
systematically as well as the influence of sugars and salts on pressure-induced starch
Introduction
2
gelatinisation. Since differing retrogradation and recrystallisation behaviour and enzymatic
degradability were obtained by several research groups comparing heat- and pressure-induced
gelatinised starch suspensions and healthy, functional nutrition has gained more and more
attention, it would be interesting to investigate the effect of pressure-induced starch
gelatinisation in combination with subsequent treatment steps favouring starch
recrystallisation on the content of resistant starch. In addition, the impact of pressurised wheat
starch replacing part of the flour in dough on the textural properties of wheat bread upon
storage appears to be an attractive survey.
Literature review
3
2 LITERATURE REVIEW
2.1 Starch Principles
Starch is a major storage product in plants and one of the most important carbohydrate
sources for human nutrition. In addition to the high nutritional value, starches play an
important role in food manufacturing processes due to their considerable effect on textural
properties of food products. They are utilised e.g. as gelling agents for puddings, as
thickeners, in sauces and desserts, in baking products, and also in the non-food sector such as
in the paper manufacturing industry.
Starch occurs in form of granules varying in size and shape depending on the plant of
origin. The granules can be e.g. spherical, oval, polygonal, and lenticular in shape with a
diameter of 2 to 175 µm and can be found single, assembled in compounds (Belitz et al.,
2001; Tegge, 2004), or ostensibly assembled. For compound starch granules, the single
granules do not become visible until after a swelling step. The amount of discrete granules in
compound starch granules ranges from a few to up to several thousand granules (Stute, 1985).
Wheat, rye and barley even contain two different types of starch granules: a large lenticular
type (25-40 µm) and a small spherical type (5-10 µm) (Hoseney, 1986). Depending on their
origin, starches have typical properties that are attributed to the size, shape, composition, and
crystallinity of the granules (Belitz et al., 2001). In addition to starch, starch granules contain
traces of fat, nitrogen, and phosphorous which potentially influence the properties of starches
despite negligibly small concentrations (Hoseney, 1986; Belitz et al., 2001). Water is also
detectable in starches, e.g. in wheat starch the water content amounts 13-15 %, in potato
starch around 20 %. One third thereof exists as free water, the rest is bound by adsorption and
capillary forces (Ternes, 1994).
2.1.1 Chemical structure
Starch consists of α-D-glucose molecules and is composed of a mixture of the two
glucanes amylose and amylopectin. The ratio of amylose to amylopectin averages 23 ± 3 %
Amylose is predominantly a linear molecule with a partially helical structure
consisting of α-1,4-linked D-glucose (Fig. 2.1) with an average molecular weight of 250,000
depending on the type of source plant and its growing stage (Hoseney, 1986; Tegge, 2004). At
a degree of polymerisation of about 1000, the
amylose molecule exhibits a length of 0.5 µm
(Ternes, 1994). The degree of polymerisation of
potato amylose can amount up to 4500
corresponding to a molecular mass of 750,000
(Belitz et al., 2001). Amylose has the ability to
form complexes with iodine, organic alcohols,
and acids, the so-called helical inclusion
complexes. It can thus be precipitated from a starch solution by addition of n-butyl-alcohol as
a result of forming an insoluble complex with the alcohol (Hoseney, 1986). Additionally, in
the presence of salts such as MgSO4 and low molecular fatty acids (caprylic and capric acid),
amylose can be separated from starch solutions by means of crystallisation (Belitz et al.,
2001). The long, linear structure of amylose is also responsible for its tendency to associate
with itself and precipitate from solution. Only at a high pH (e.g. in 1N KOH) amylose stays in
solution because small positive charges are induced on the hydroxyl groups that causes
adjacent chains to repel each other (Hoseney, 1986).
With a molecular weight of 108, amylopectin represents one of the largest molecules
found in nature. Just like amylose, amylopectin is composed of α-D-glucose being mostly α-
1,4-linked. In contrast to amylose however, it is highly branched and therefore also contains
α-1,6-links (4-5 %). The average chain length of the branches amounts up to 20-25 glucose
units (Hoseney, 1986). Amylopectin is a two-dimensional, discoidal molecule, which is
assumed to have a cluster-like structure (Sivak & Preiss, 1998; Tegge, 2004) and consists of
A-, B- and C-chains. A-chains are short, free of side chains and linked to the amylopectin
molecule by its reducing end. The longer B-chains bear side chains (A- and B-chains) and can
be divided into dense, crystalline sections (cluster) and less dense, amorphous sections
without side chains. Parallel A- and B-chains in the same cluster form right-handed double
helices originating from branch points with six glucose molecules per turn. The C-chain is
characterised by carrying the only reducing end of an amylopectin molecule (Banks & Muir,
1980; Belitz et al., 2001; Tegge, 2004). The molecular structure and an exemplary model of
Fig. 2.1. Schematic illustration of the amylose molecule.
Literature review
5
the cluster-structure of amylopectin are depicted in figure 2.2. The amylopectin molecule is
radially arranged within the starch granule
which leads to a tangential alignment of the
crystals. It is oriented with the non-reducing
ends of the chains towards the granule
surface. The molecule is divided in
alternating crystalline and amorphous
Fig. 2.3. Composition of starch blocklets and the assembly of small and large blocklets in soft and hard shells in a starch granule (Gallant et al., 1997).
Fig. 2.2. Molecular structure of amylopectin and a model for the helical and cluster-structure of the amylopectin molecule (according to Banks & Muir, 1980; Belitz et al., 2001).
α-1,6-branch points
6 Glucose
units
Reducing end
Non-reducing ends
C-chain
A-chain
B-chain
Cluster
α-1,6-linkage
Literature review
6
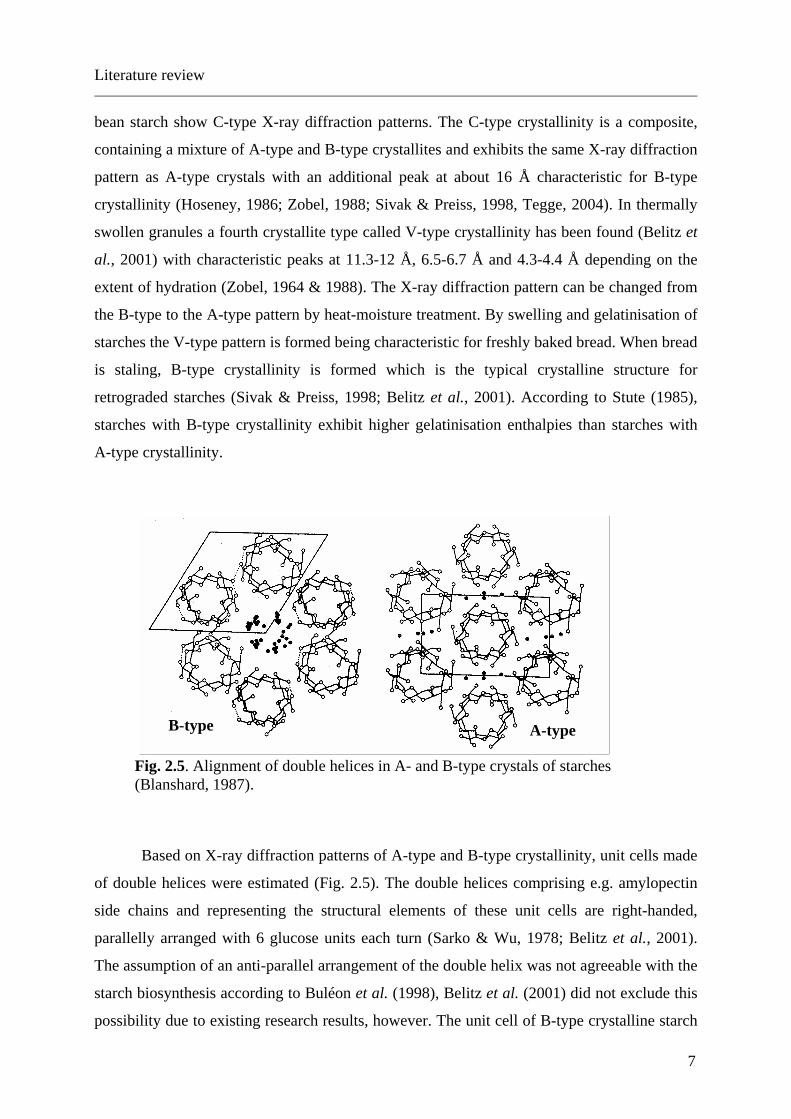
Fig. 2.4. Birefringent pattern of native potato starch granules in polarised light (x 400).
structures of sections (lamellae) with a periodicity of 9-10 nm. In the crystalline lamellae, as
mentioned before, the cluster-like structures are located. The amorphous lamellae contain the
branching points, the amylose and the amorphous amylopectin. The lamellae form larger,
ellipsoid structures, the so-called blocklets, which in turn form crystalline, hard and
semicrystalline, soft shells, i.e. growth rings (see fig. 2.6) being several 100 nm thick. The
soft shells are made of smaller blocklets (20-50 nm), the harder shells consist of larger
blocklets (50-500 nm) as can in detail be seen in figure 2.3 (Gallant, 1997; Tegge, 2004).
2.1.2 Starch crystallinity
Starch is partially crystalline, up to 30 % of starch in a starch granule consist of
crystallites (Hoseney, 1986). This crystallinity cannot be attributed to intermolecular
interactions between amylose chains analogous to
cellulose, but to the branched amylopectin. For amylose
being located in the amorphous regions of the starch
granules can be leached out of the granule without
destruction of the crystalline properties, and amylose-
free starches like waxy maize starch also exhibit
semicrystallinity (Hoseney, 1986; Sivak & Preiss,
1998; Belitz et al., 2001). An important property of
starches is their birefringent character being expressed
by the typical dark Maltese crosses in light microscopic
examinations (Fig. 2.4). This gives proof of a high
degree of order, i.e. molecular orientation within the
starch granule which is not to be mistaken with crystallinity. The birefringence is lost upon
potassium thiocyanate, potassium bromide, sodium sulphate and sodium hydroxide were
purchased from Merck (Darmstadt, Germany). Trehalose was a kind gift from Cargill
(Vilvoorde, Belgium).
3.3 Starch analysis
3.3.1 Specific density
The specific density was measured using the pycnometric method by a Multivolume
Pycnometer 1305 (micromeritics, Norcross, GA, USA) at the department of food quality and
material science, Berlin University of Technology.
3.3.2 Moisture content
The moisture content, and thus the dry matter content, was determined by gravimetric
differences before and after 5h at 105°C in oven UT 6060 (Heraeus Instruments, Hanau,
Germany).
Materials and methods
31
3.3.3 Ash content
The ash content of the starches was quantified according to EN ISO 3593 (1994) using
the oven M104 (Heraeus Instruments, Hanau, Germany).
3.3.4 Fat content
The fat content was quantified according to EN ISO 3947 (1994).
3.3.5 Amylose content
The amylose content of the starches was determined using the amylose/ amylopectin
assay kit by Megazyme (Bray, Ireland).
3.3.6 Sorption Isotherms
Sorption isotherms of native, pressure-gelatinised and freeze-dried, and heat-
gelatinised and freeze-dried starches were identified by a static gravimetric method. The
starch samples were weighed, placed for at least three weeks in air-tight desiccators
containing saturated salt solutions providing constant relative humidity environments at room
temperature, and again weighed when equilibrium was reached. The moisture contents were
calculated from differences in weight based on the dry matter content (Ch. 3.3.2). The relative
humidity of each saturated salt solution was established using thermoconstanter novasina
(MT-Technologies Meßtechnik GmbH, Gummersbach, Germany) and is shown in table 3.1.
Tab. 3.1. Relative humidity of saturated salt solutions at 25°C Saturated salt solution Relative humidity [%] PO5 1.9 LiCl 11.4 MgCl2 34.2 Mg(NO3)2 53.3 NaCl 74.2 KCl 83.8 KSO4 98.7
Complete pressure-induced gelatinisation of 5 % (w/ w) starch suspensions was
achieved by a pressure treatment at room temperature for 15 min at 500 MPa for wheat starch,
at 700 MPa for tapioca starch, and at 900 MPa for potato starch, and total thermal
Materials and methods
32
gelatinisation was accomplished by a heat treatment for 15 min at 90°C with continuous
manual stirring. The pressure-gelatinised and thermally gelatinised starch suspensions were
freeze-dried using the Freeze-Dryer Modulyo (Edwards, Sussex, UK). Potassium sulphate
was purchased by Carl Roth (Karlsruhe, Germany) the other salts were obtained by Merck
(Darmstadt, Germany).
3.3.7 Water binding capacity
The water-binding capacity of starches and starch suspensions was determined
according to Medcalf and Gilles (1965) using a Sorvall RC-5B Refrigerated Superspeed
centrifuge (Du Pont Instruments, Bad Homburg, Germany).
3.3.8 Thermoanalytic investigation
The thermal properties of native, dry starches were determined by non-isothermal
thermogravimetry (TG) combined with differential thermogravimetry (DTG) and differential
scanning calorimetry (DSC) at the department of food quality and material science, Berlin
University of Technology. The analysis was performed by a STA409C (Netzsch, Selb,
Germany) with a heating rate of 10 K/ min in a temperature range from 0°C to 450°C in a
platinum pan under anaerobic nitrogen atmosphere.
3.3.9 X-ray analysis
X-ray analysis of native starches and freeze-dried starch samples was performed at the
Rheinische Friedrich Wilhelms-Universität Bonn, Pharmazeutische Technologie with a
wavelength of 1.54 Å, a scanning speed of 0.02 °2Θ/ s and a scanning region of 5-45 °2Θ.
3.3.10 Degree of gelatinisation
The pressurised starch suspensions were analysed for their degree of gelatinisation by
loss of birefringence via a microscope (Eclipse E400, Nikon, Tokyo, Japan) and by means of
their electrical conductivity via a conductivity meter (LF 323, WTW, Weilheim, Germany).
All measurements were carried out at least in duplicates and for the determination of degree
of gelatinisation by loss of birefringence minimum 200 granules were counted.
Materials and methods
33
3.4 High hydrostatic pressure treatment
Directly before the pressurisation step the samples were thoroughly shaken, quickly
inserted into the vessel and pressurised in order to minimise sedimentation and avoid
inhomogeneity throughout the sample. It was abandoned to add thickeners such as heat-
gelatinised starch in order to increase the viscosity and thus prevent sedimentation, because it
was discovered that the reduction of free water depleted the pressure-induced gelatinisation
process. Therefore, sedimentation could not be entirely prevented but was neglected due to
the good reproducibility of the results.
3.4.1 High pressure multivessel apparatus
Samples of approximately 1.5 ml were filled in Nunc CryoTubes (Nunc A/S,
Roskilde, Denmark) and pressurised in a high pressure multivessel apparatus U111
(Unipressequipment, Warsaw, Poland) enabling operating pressures up to 700 MPa and being
equipped with a temperature control (Huber CC 245 oil bath, Huber Kältemaschinen GmbH,
Offenburg, Germany) generating temperatures between – 45 and 150°C. The pressure build-
up was performed in approximately 12 s/ 100 MPa, the pressure release took about 17 s/ 100
MPa, and the pressure transmitting medium was silicon oil (type 6163, Huber, Offenburg,
Germany).
The apparatus contains five high pressure vessels submerged in the oil bath and each
separately connected with the high pressure pump. This allows pressure treatments at five
different pressures for varying treatment times at the same temperature. The high pressure
system of the apparatus consists of a high pressure intensifier, eleven manually operated
valves (SITEC, Maur/ Zürich, Switzerland), connectors, capillary tubes and a hydraulic power
unit (Mannesmann Rexroth Polska Ltd., Warsaw, Poland) composed of a radial piston oil
pump, an electric motor controlled by a general-purpose Inverter Freqrol (Mitsubishi, Tokyo,
Japan), a block of hydraulic valves and an oil tank with filter.
This apparatus was utilised for the generation of phase diagrams of wheat and tapioca
starches, for the examination of pressure-temperature-time relationships on the degree of
gelatinisation, and for the influence of sugars and salts on starch gelatinisation.
3.4.2 High volume-pressure unit I (National Forge)
For experiments requiring higher volumes, e.g. water binding capacity, electrical
conductivity and production of RS, approx. 150 g of wheat and tapioca starch suspensions
Materials and methods
34
were sealed in polyethylene coated aluminium bags and pressurised in a high pressure vessel
(National Forge, St. Niklaas, Belgium) with a maximum operating pressure of 550 MPa, a
volume of 800 ml and equipped with double-acting pump P100-05CX-01 (Hydro-Pac Inc.,
Fairview, PA) and a temperature control (Haake water bath, Karlsruhe, Germany) generating
temperatures between 0 and 80°C. The pressure build-up was performed in approximately 7 s/
100 MPa, the pressure release took about 17 s/ 100 MPa.
3.4.3 High volume-pressure unit II (Unipress)
For measurements requiring higher volumes and pressures above 550 MPa or
generally pressures above 700 MPa, pressurisation was conducted by the high pressure single
vessel apparatus U400 (Unipressequipment, Warsaw, Poland) with a maximum operating
pressure of 1,000 MPa, a volume of approx. 0.75 l and a theoretically operable temperature
range of –25 to 100°C. This unit is composed of a biphasic pressure build-up with the initial
pump for pressures up to 600 MPa and the intensifier pump for the pressure build-up in the
second phase from 600 to 1,000 MPa in combination with a pressure intensifier
(transformation ratio 1:16). Up to 600 MPa, pressure build-up took about 5 s/ 100 MPa (30 s
from 0.1 to 600 MPa), above 600 MPa it took about 21 s/ 100 MPa (200 s from 0.1 to 950
MPa). Pressure release occurred within about 2 s.
3.4.4 In situ analysis with a high pressure cell
The high pressure cell connected with a microscope is described in detail elsewhere
(Hartmann et al., 2003) and consisted of an inverse light microscope (Leica DM IRB HC,
Germany), a CCD-camera (Basler, Germany) and the HPDS high pressure cell connected to a
screw press. A computer with image analysis software (Aquinto AG, Germany) was coupled
with the camera in order to evaluate and archive the pictures recorded.
Unstained and potassium iodide-iodine stained starch suspensions were filled in the
HPDS cell onto the microscope stage as described by Hartmann, Pfeifer, Dornheim, and
Sommer (2003) and during pressure build-up pictures were taken at 50 MPa intervals. At 300
MPa the pressure was held for one hour, while pictures were taken about every 10 min. In the
process of pressure release again pictures were taken at 50 MPa steps. Back at atmospheric
pressure the granules were observed another 10 min to detect whether further changes had
occurred. The pressure build-up and the decompression required about 7 min, respectively.
All experiments were performed at least in duplicates at room temperature. The temperature
Materials and methods
35
increase due to pressure generation is negligible, since the heat is dissipated through the body
of the high pressure cell during the slow pressure build-up.
The potassium iodide-iodine solution (Lugols solution) consisted of 0.2 g iodine
(Sigma, Deisenhofen, Germany) and 2 g potassium iodide (Merck, Darmstadt, Germany) in
100 ml distilled water.
3.4.5 Statistical evaluation
The statistical evaluation of the impact of pressure and temperature on the degree of
gelatinisation of starch suspensions (5 % w/ w) was performed using the software
Statgraphics 4.1 at the institute of food quality and material science, Berlin University of
Technology. Multifactor analysis of variance was chosen as evaluation tool.
3.5 Resistant starch production
3.5.1 Gelatinisation
For high pressure treatment, approx. 150ml of 5 % (w/ w) wheat starch suspensions
sealed in polyethylene-coated aluminium bags were pressurised in a high pressure vessel (see
3.4.2) at 500 MPa for 15 min at room temperature, 53°C, 58°C, and 66°C. Pressure build-up
was performed in 35 s, pressure release in 85 s.
Thermal gelatinisation was carried out in a water bath at 90°C for 15 min with continuous
manual stirring. Total gelatinisation was achieved after both treatments, respectively, as
ascertained by microscopic investigation.
3.5.2 Thermal Treatments
Subsequent to gelatinisation, samples of the starch suspensions were annealed at 40°C
for 24 h or 96 h and at 52°C for up to 240 h in a water bath, cooled and stored at room
temperature or at 6°C in a refrigerator, or frozen at –20°C. Gelatinised, frozen samples were
freeze-dried by Freeze-Dryer Modulyo (Edwards, Sussex, UK) at 0.06 mbar and –50°C.
3.5.3 Hydrolysis
Enzyme hydrolysis of high pressure treated wheat starch was accomplished according
to Vasanthan and Bhatty (1998) at 42°C using pullulanase (Megazyme, Bray, Ireland).
Materials and methods
36
High pressure treated wheat starch was also acid hydrolysed at 45°C after Vasanthan and
Bhatty (1998). A treatment time of 30 min was chosen since it resulted in the highest yields in
RS (Vasanthan & Bhatty, 1998). After hydrolysis the starch suspensions were dried at 30°C
over night in an oven.
3.5.4 Pressure-annealing cycles
Up to ten pressure-annealing cycles of untreated, acid hydrolysed, and enzyme
hydrolysed starches were performed with a 15 min pressure treatment (500 MPa, room
temperature) followed by annealing (23 h 45 min, 52°C).
3.5.5 Resistant starch analysis
The RS content of all samples was determined according to the AOAC 2002.02
method (McCleary & Monaghan, 2002) using α-amylase (Sigma, Mannheim, Germany),
amyloglucosidase (3300 U/ ml) and the glucose assay kit K-GLUC (both Megazyme, Bray,
Ireland). The method was validated by a sample with a known RS content (C�ActiStar)
which was a kind gift from Cargill/ Cerestar (Vilvoorde, Belgium).
3.6 Bread baking
3.6.1 Recipe and baking procedure
Pouches containing 150 ml of wheat starch suspensions (10 % w/ w) were pressurised for 15
min at 600 MPa. Bread dough without and with pressure-gelatinised wheat starch replacing 5
% of the flour was prepared according to the recipes in table 3.2. The solid components were
mixed and simultaneously tempered for 2 min at 30°C in a Farinograph (Brabender,
Duisburg, Germany), then the ascorbic acid solution, pressure-treated starch suspension
tempered at 30°C contingently on the recipe, and water tempered at 30°C were added until
500 FU were reached. The dough was kneaded for 5 min at 30°C in the farinograph at 63 rpm,
afterwards the dough was rested for 15 min at 35°C. After the first rising, each dough was
divided into two equal parts (~ 250 g), each portion was machine shaped with 15 turns and
put in spray-greased pans, the dough was again allowed to rise for 30 min at 35°C (second
rising), and finally baked for 20 min at 210°C including the application of steam.
Materials and methods
37
Tab. 3.2. Recipes for bread dough with and without high pressure-gelatinised wheat starch Ref. 1 Ref. 2 Starch 1 Starch 2 Flour type 550 [g] 300 300 285 285 Yeast [g] 15 15 15 15 Sodium chloride [g] 4.5 4.5 4.5 4.5 Sugar [g] 3 3 3 3 Peanut fat [g] 3 3 3 3 Malt flour [g] 1 1 1 1 Ascorbic acid solution (0.2g/ 100 ml) [ml] 3 3 3 3 Water (30°C) added up to 500 FU [ml] 180 189 59 60 Starch suspension (15 min, 600 MPa, 10 %) [g] 0 0 150 150
FU – Farinograph units
3.6.2 Texture analysis
The cooled down loafs of bread were sealed in plastic pouches and stored at room
temperature. One and five days after baking, a texture analysis with a Texture Analyser TA-
XT2 (Stable Micro Systems, Godalming, UK) was performed two times on two stacked slices
out of the centre of the bread loaf (speed 2.0 mm/ s, distance 7.0 mm, one-time repetition after
5 s, trigger force 1.0 g), respectively. One loaf of each set was examined one and five days
after baking, respectively, and information about firmness (first peak height) and elasticity
(second peak area over first peak area) was obtained.
Results and discussion
38
4 RESULTS AND DISCUSSION
4.1 Starch properties
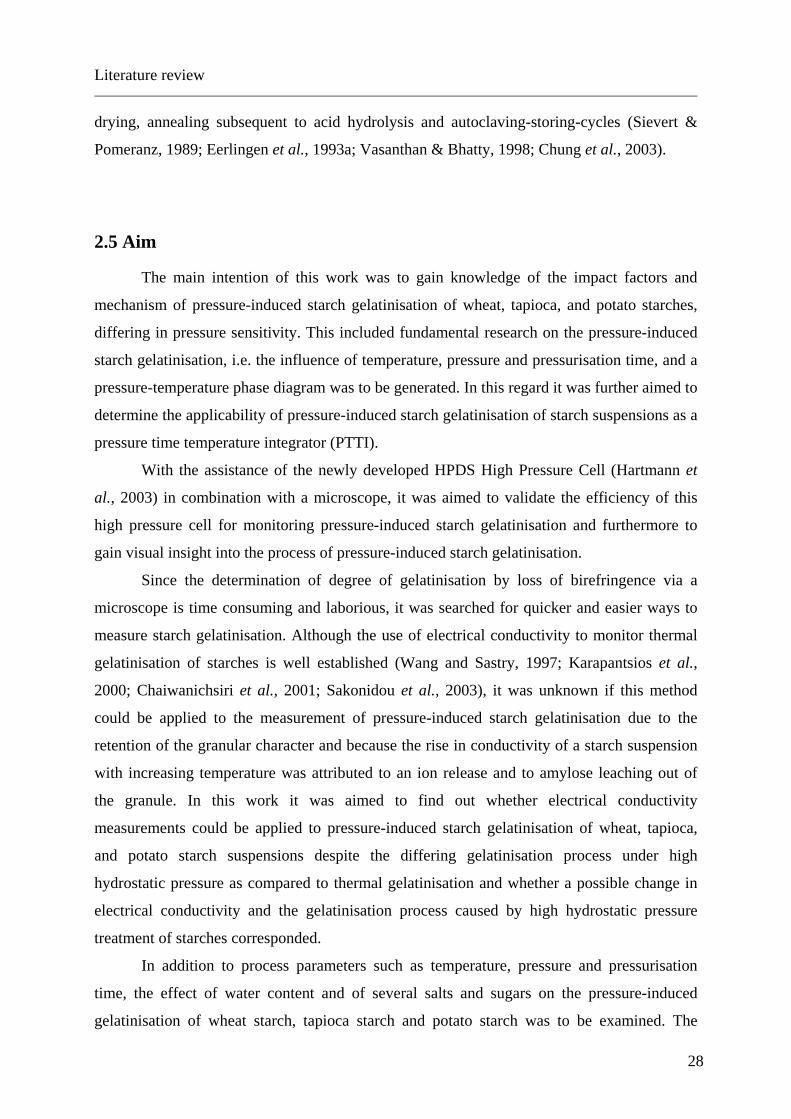
The wheat, tapioca, and potato starches were analysed for their chemical composition,
as well as by DSC, by X-ray diffraction analysis and for their water sorption behaviour in
order to become acquainted with the raw material and to understand and infer observations
made upon pressurisation from the properties of the starches if possible.
4.1.1 Starch composition
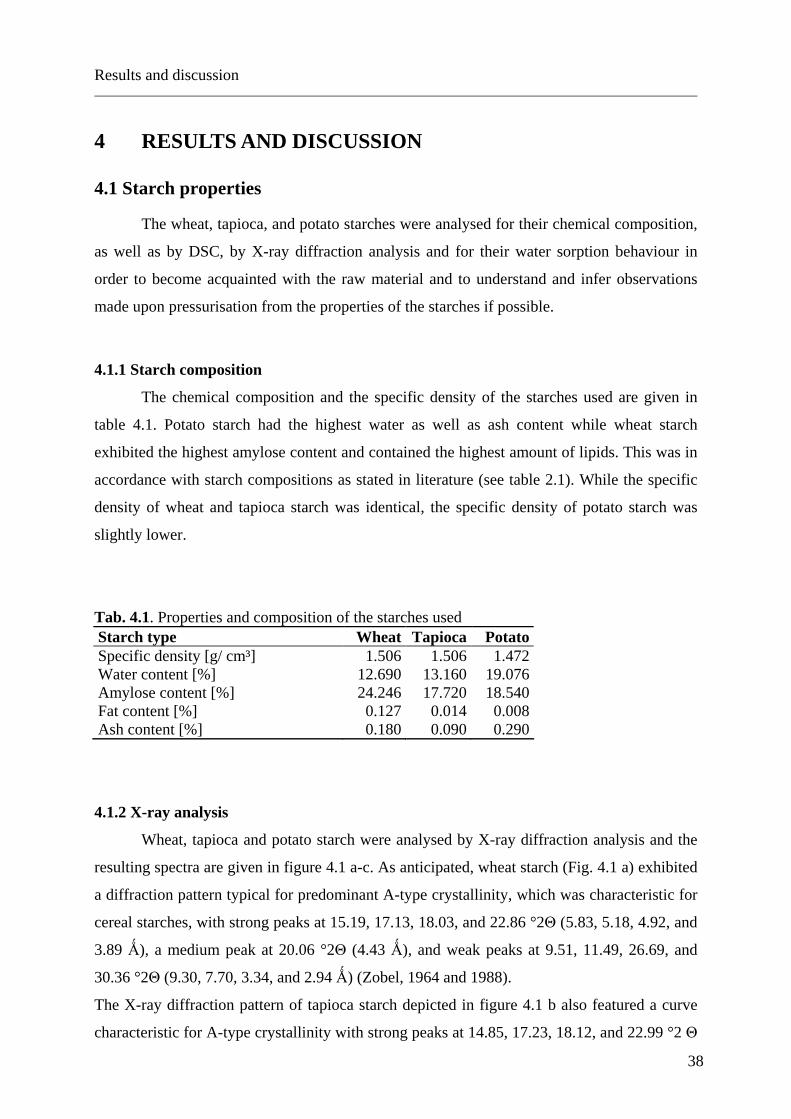
The chemical composition and the specific density of the starches used are given in
table 4.1. Potato starch had the highest water as well as ash content while wheat starch
exhibited the highest amylose content and contained the highest amount of lipids. This was in
accordance with starch compositions as stated in literature (see table 2.1). While the specific
density of wheat and tapioca starch was identical, the specific density of potato starch was
slightly lower.
Tab. 4.1. Properties and composition of the starches used Starch type Wheat Tapioca Potato Specific density [g/ cm³] 1.506 1.506 1.472 Water content [%] 12.690 13.160 19.076 Amylose content [%] 24.246 17.720 18.540 Fat content [%] 0.127 0.014 0.008 Ash content [%] 0.180 0.090 0.290
4.1.2 X-ray analysis
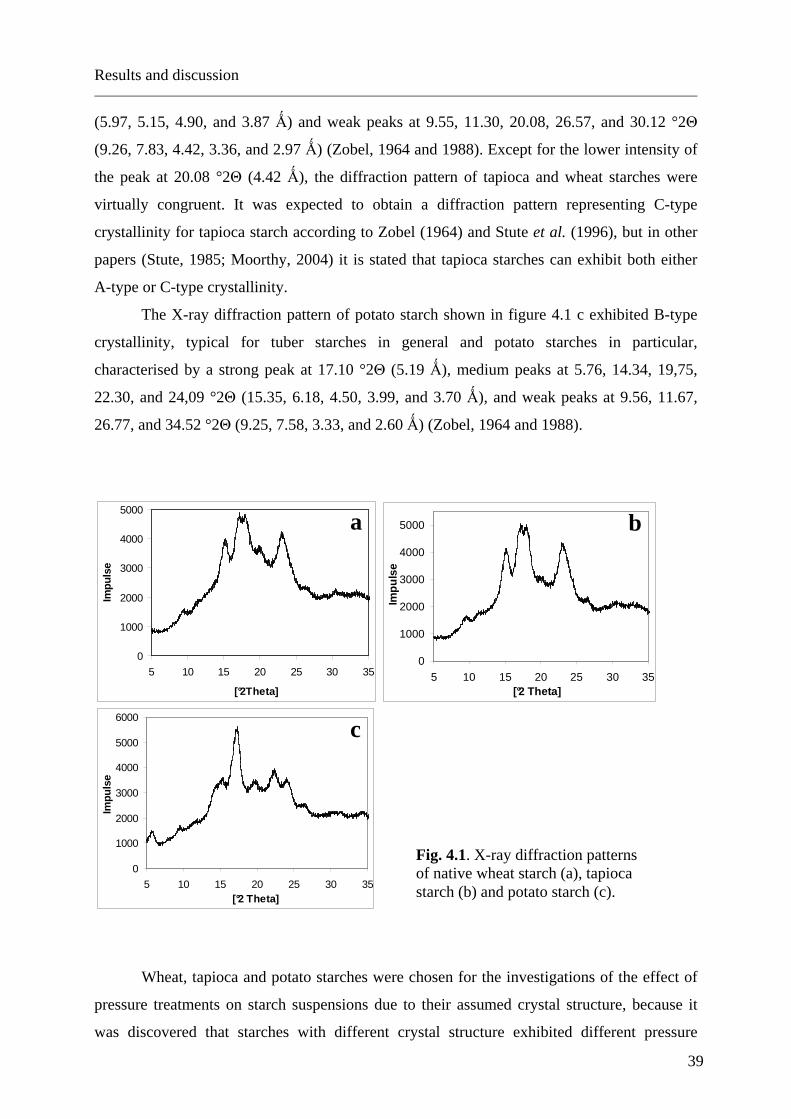
Wheat, tapioca and potato starch were analysed by X-ray diffraction analysis and the
resulting spectra are given in figure 4.1 a-c. As anticipated, wheat starch (Fig. 4.1 a) exhibited
a diffraction pattern typical for predominant A-type crystallinity, which was characteristic for
cereal starches, with strong peaks at 15.19, 17.13, 18.03, and 22.86 °2Θ (5.83, 5.18, 4.92, and
3.89 Ǻ), a medium peak at 20.06 °2Θ (4.43 Ǻ), and weak peaks at 9.51, 11.49, 26.69, and
30.36 °2Θ (9.30, 7.70, 3.34, and 2.94 Ǻ) (Zobel, 1964 and 1988).
The X-ray diffraction pattern of tapioca starch depicted in figure 4.1 b also featured a curve
characteristic for A-type crystallinity with strong peaks at 14.85, 17.23, 18.12, and 22.99 °2 Θ
Results and discussion
39
(5.97, 5.15, 4.90, and 3.87 Ǻ) and weak peaks at 9.55, 11.30, 20.08, 26.57, and 30.12 °2Θ
(9.26, 7.83, 4.42, 3.36, and 2.97 Ǻ) (Zobel, 1964 and 1988). Except for the lower intensity of
the peak at 20.08 °2Θ (4.42 Ǻ), the diffraction pattern of tapioca and wheat starches were
virtually congruent. It was expected to obtain a diffraction pattern representing C-type
crystallinity for tapioca starch according to Zobel (1964) and Stute et al. (1996), but in other
papers (Stute, 1985; Moorthy, 2004) it is stated that tapioca starches can exhibit both either
A-type or C-type crystallinity.
The X-ray diffraction pattern of potato starch shown in figure 4.1 c exhibited B-type
crystallinity, typical for tuber starches in general and potato starches in particular,
characterised by a strong peak at 17.10 °2Θ (5.19 Ǻ), medium peaks at 5.76, 14.34, 19,75,
22.30, and 24,09 °2Θ (15.35, 6.18, 4.50, 3.99, and 3.70 Ǻ), and weak peaks at 9.56, 11.67,
26.77, and 34.52 °2Θ (9.25, 7.58, 3.33, and 2.60 Ǻ) (Zobel, 1964 and 1988).
0
1000
2000
3000
4000
5000
5 10 15 20 25 30 35
[°2Theta]
Impu
lse
0
1000
2000
3000
4000
5000
5 10 15 20 25 30 35[°2 Theta]
Impu
lse
0
1000
2000
3000
4000
5000
6000
5 10 15 20 25 30 35[°2 Theta]
Impu
lse
Wheat, tapioca and potato starches were chosen for the investigations of the effect of
pressure treatments on starch suspensions due to their assumed crystal structure, because it
was discovered that starches with different crystal structure exhibited different pressure
a b
c
Fig. 4.1. X-ray diffraction patterns of native wheat starch (a), tapioca starch (b) and potato starch (c).
Results and discussion
40
sensitivity and that B-type crystalline starches were more resistant to pressure than starches
with A- and C-type crystallinity (Muhr & Blanshard, 1982; Ezaki & Hayashi, 1992; Stute et
al., 1996; Rubens et al., 1999). Furthermore, all three raw maerials present significant sources
for starch on an industrial level (Tscheuschner, 1996).
As expected, potato starch exhibited B-type crystallinity, while wheat starch showed
A-type crystallinity. Tapioca starch also exhibited A-type crystallinity, but due to its by
comparison intermediate pressure sensitivity (see chapter 4.4), it proved to be interesting for
this study.
4.1.3 Thermal analysis
For native, dry wheat, tapioca, and potato starches TG, DTG, and DSC curves were
generated.
The DSC patterns depicted in figure 4.2 emphasise the differences in potato starch and
wheat and tapioca starches that have also been observed by X-ray analysis (see chapter 4.1.2).
While wheat and tapioca starch exhibit similar DSC curves with four endothermic peaks
between 250 and 330°C for thermal degradation of starch, potato starch shows three peaks in
this temperature range. This might be due to the differing crystalline structure or the in
comparison low fat content of potato starch (see tab. 4.1). At intermediate water content (~ 50
%) potato starch suspensions fail to show the endothermic peak attributed to melting of the
amylose-lipid-complex as seen for wheat starch (Svensson & Eliasson, 1995; Jacobs et al.,
1998), however this effect might not be transferable to the DSC analysis of dry starches.
Noteworthy is also a considerable DSC peak representing water around 109 to 121°C
(see appendix fig. A1) without noticeable change in mass as shown in the TG diagrams. In
particular for wheat and tapioca starch a substantial amount of energy is required for the
removal of this minor amount of water in comparison to potato starch. This can be explained
by the differing crystalline structure. In B crystallites water molecules appear to possess a
higher mobility and accessibility due less hydrogen bonds to the starch molecule (Fig. 2.5).
The energy required for the removal of water does not correspond with the water content of
the starches as shown in table 4.1.
Figure 4.3 shows the TG and DTG curves of dry, native wheat, tapioca and potato
starches. The onset, peak, and offset temperatures as well as the points of inflexion are given
in the appendix in table A1.
Results and discussion
41
Fig. 4.2. DSC curves of dry, native wheat (a), tapioca (b), and potato (c) starches under anaerobic conditions at a heating rate of 10°K/ min.
a
b
c
Results and discussion
42
Fig. 4.3. TG (straight line) and DTG (dotted line) curves of dry, native wheat (a), tapioca (b), and potato (c) starches under anaerobic conditions at a heating rate of 10°K/ min.
a
b
c
Results and discussion
43
Comparing the graphs of each starch in figure 4.3, respectively, it can be concluded
that the peak temperatures of thermolysis from the DTG signal differ only slightly. Potato
starch exhibited the lowest peak temperature, tapioca starch the highest, but the peak
temperatures of all three starches examined were located in a temperature range between 303
and 313°C. The same temperature range was obtained for the points of inflexion of the TG
signal, accordingly. While the width of the DTG signals of wheat and potato starch amounted
about the same, a broader signal was obtained for tapioca starch. Consequently, the
thermolysis of tapioca starch occurred over a broader temperature range.
Tapioca starch also exhibited the highest mass loss of the three starches examined with
81.11 % (see appendix tab. A1), whereas wheat starch ranged in between (77.35 %) and
potato starch showed the lowest mass loss with 71.68 %. This is in correspondence with the
ash content of the starches (see tab. 4.1).
4.1.4 Sorption isotherms
The sorption isotherms of native, heat-gelatinised and freeze-dried, and pressure-
gelatinised and freeze-dried wheat, tapioca, and potato starches were generated (Fig. 4.4).
Generally, up to an aW value of 0.84 the water contents of the starches examined were in a
close range. The only exception was native potato starch containing a visibly higher amount
of water and having thus the best water sorption behaviour at water activities up to 0.84.
Between a water activity of 0.84 and 0.99 the water content of the starches increased
substantially, at an aW of 0.99 pressurised wheat starch exhibited the highest water uptake
with a water content of 0.49 g water per g oven dry starch.
Generally, no conclusions about the water uptake capability at a water activity of 0.99
could be drawn concerning the type of starch or pre-treatment. While native potato starch
exhibited a comparably high water content, native wheat starch and native tapioca starch
ranged at the lower end of water absorption of the starches examined. For wheat and tapioca
starches drying subsequent to a pre-gelatinisation step resulted in an enhanced water content,
but this is not valid for potato starch, where the pre-gelatinisation led to a decrease of water
uptake. The water absorption of pressure-gelatinised wheat and potato starches was higher
than of heat-gelatinised, whereas thermally gelatinised tapioca starches exhibited the highest
water content in comparison to native and pressurised tapioca starches.
Results and discussion
44
0
0,1
0,2
0,3
0,4
0,5
0 0,2 0,4 0,6 0,8 1Water activity
Wat
er c
onte
nt [g
/g o
ven
dry
star
ch]
W HP
W Th
W
0
0,1
0,2
0,3
0,4
0,5
0 0,2 0,4 0,6 0,8 1Water activity
Wat
er c
onte
nt [g
/g o
ven
dry
star
ch]
T HP
T Th
T
0
0,1
0,2
0,3
0,4
0,5
0 0,2 0,4 0,6 0,8 1Water activity
Wat
er c
onte
nt [g
/g o
ven
dry
star
ch]
P HP
P Th
P
Fig. 4.4. Sorption isotherms of native, heat-gelatinised and freeze-dried (Th), and pressure-gelatinised and freeze-dried (HP) wheat (W), tapioca (T), and potato starches (P).
In order to evaluate the method used and be able to compare the water contents
obtained with commercial standards, water contents of the five different commercial starches
Prejel VA70T, Ultra-Tex 2, Instant Clearjel E, C�Hiform 12742, and Paselli P were
determined at a water activity of 0.99. They were chemically modified cold water swelling
starches derived from waxy maize starch (Ultra-Tex 2, Instant Clearjel E, C�Hiform 12742),
tapioca starch (Prejel VA70T) or potato starch (Paselli P). A comparison of the water content
of these five commercial products with native and either pressure-induced or thermally
gelatinised wheat, tapioca and potato starches at a water activity of 0.99 is depicted in bar
chart of figure 4.5. Overall, all pre-gelatinised starches could match with the commercial
starches. It was observed that pressure-gelatinised wheat starch contained the highest amount
of water, followed by native potato starch and C�Hiform 12742. Consequently, it could be
concluded that pressure-gelatinised wheat starch exceeded the water absorption capacity of all
commercial starches analysed and thus met industrial norms in terms of water uptake. This
presents a potential usage of pressure-gelatinised wheat starch as a drying agent, e.g. in rubber
gloves, and opens up new possibilities for the application of chemically unmodified food
texturisers high good water sorption capacity. The high hydrostatic pressure treatment offers
Results and discussion
45
the opportunity to replace the chemical modification and the heat treatment with concurrent
maintenance or even improvement of the water uptake behaviour.
0,30
0,34
0,38
0,42
0,46
0,50
Prejel VA70T
Ultra-Tex 2
Instant Clearjel E
C Hiform 12742
Paselli P
Wheat HP
Wheat therm
Wheat native
Tapioca HP
Tapioca therm
Tapioca native
Potato HP
Potato therm
Potato nativeWat
er c
onte
nt [g
/ g o
ven
dry
star
ch]
Fig. 4.5. Water content of commercial starches and native, heat-gelatinised and freeze-dried (therm), and pressure-gelatinised and freeze-dried (HP) wheat, tapioca, and potato starches at a water activity of 0.99.
4.2 Optical In situ analysis of starch granules under high pressure
With the development of the HPDS high pressure cell in combination with an inverse
microscope (Hartmann et al., 2003), it was possible to obtain in situ images with both high
optical resolution and high quality up to pressures of 300 MPa. In cooperation with the chair
of process engineering of disperse systems at the TU Munich, the high hydrostatic pressure
treatment of native and potassium iodide-iodine stained wheat, tapioca, and potato starch
suspensions for 60 min at pressures up to 300 MPa was investigated. The filling of the cell
was easy and uncomplicated. Unfortunately, the cell could not be temperature-controlled, and
the quality of images with polarised light was too poor for measurements of loss of
birefringence.
4.2.1 Visual evaluation of starch pressurisation
Wheat, tapioca and potato starch suspensions were placed in the high pressure cell and
observed under pressure through the inverse light microscope. Examining wheat starch
Results and discussion
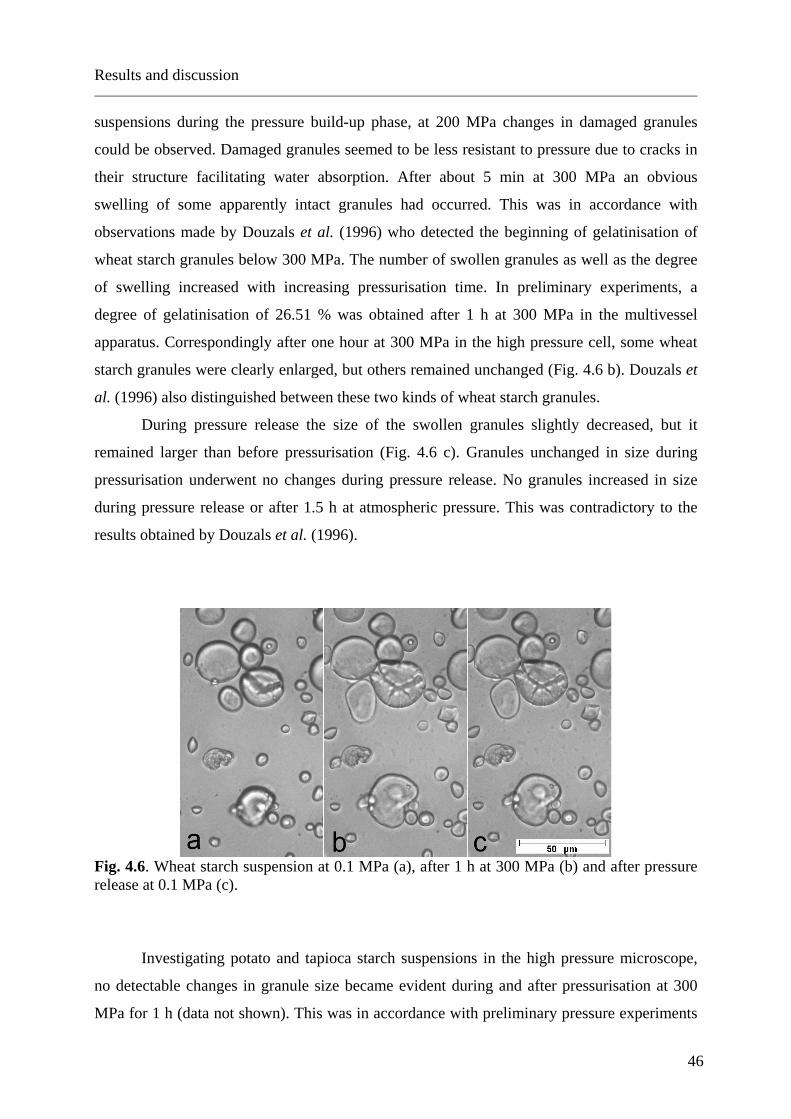
46
suspensions during the pressure build-up phase, at 200 MPa changes in damaged granules
could be observed. Damaged granules seemed to be less resistant to pressure due to cracks in
their structure facilitating water absorption. After about 5 min at 300 MPa an obvious
swelling of some apparently intact granules had occurred. This was in accordance with
observations made by Douzals et al. (1996) who detected the beginning of gelatinisation of
wheat starch granules below 300 MPa. The number of swollen granules as well as the degree
of swelling increased with increasing pressurisation time. In preliminary experiments, a
degree of gelatinisation of 26.51 % was obtained after 1 h at 300 MPa in the multivessel
apparatus. Correspondingly after one hour at 300 MPa in the high pressure cell, some wheat
starch granules were clearly enlarged, but others remained unchanged (Fig. 4.6 b). Douzals et
al. (1996) also distinguished between these two kinds of wheat starch granules.
During pressure release the size of the swollen granules slightly decreased, but it
remained larger than before pressurisation (Fig. 4.6 c). Granules unchanged in size during
pressurisation underwent no changes during pressure release. No granules increased in size
during pressure release or after 1.5 h at atmospheric pressure. This was contradictory to the
results obtained by Douzals et al. (1996).
Fig. 4.6. Wheat starch suspension at 0.1 MPa (a), after 1 h at 300 MPa (b) and after pressure release at 0.1 MPa (c).
Investigating potato and tapioca starch suspensions in the high pressure microscope,
no detectable changes in granule size became evident during and after pressurisation at 300
MPa for 1 h (data not shown). This was in accordance with preliminary pressure experiments
Results and discussion
47
resulting in a degree of gelatinisation of 0.97 % in the case of 5 % (w/ w) tapioca starch
suspensions and 0.00 % for 5 % (w/ w) potato starch suspensions after 1 h at 29°C and 300
MPa in the high pressure multivessel apparatus. Douzals et al. (1996) detected an irreversible
swelling of 15 % of iodine stained potato starch granules after pressurisation at 300 MPa.
Such a slight swelling could not be determined. Nevertheless, it could be concluded that
wheat starch was less resistant to pressure than potato starch and tapioca starch.
4.2.2 Starches dyed with Lugol’s solution under pressure
The starch suspensions were intensely stained with a potassium iodide-iodine solution
(Fig 4.7-4.9) and treated as before. Regarding the granule sizes, the results obtained for
undyed starches could be confirmed.
As for wheat starch, first the swelling granules began to lose their coloration (Fig. 4.7
b). As shown in figure 4.7 c, all iodine stained wheat starch granules were totally discoloured
after 1 h at 300 MPa, regardless whether they had swollen or not. Additionally the liquid
phase became darker and a brownish precipitation appeared. This could be resulting from
amylose leaking into the liquid medium. After pressure release the granules did not regain
their colouration, and after 10 min at 0.1 MPa a further decolouration was observed (Fig. 4.7
d).
Fig. 4.7. Potassium iodide-iodine stained wheat starch suspension before a pressure treatment (a), after 10 min at 300 MPa (b), after 1 h at 300 MPa (c) and after pressure release at 0.1 MPa (d).
Results and discussion
48
Iodine stained tapioca starch granules were also totally discoloured after 1 h at 300
MPa (Fig. 4.8 b) and a brownish precipitation could be observed in the continuous phase.
There was no visible elucidation of the granules after pressure release and 10 min at 0.1 MPa.
The potato starch granules were discoloured only slightly with a minor darkening of
the surrounding liquid phase. After pressure release and 10 min at atmospheric pressure, there
was a further very slight decolouration of the granules (Fig. 4.9 b).
Fig. 4.8. Potassium iodide-iodine stained tapioca starch suspensions before a pressure treatment (a) and after pressure release at 0.1 MPa following a 1 h treatment at 300 MPa (b).
Fig. 4.9. Potassium iodide-iodine stained potato starch suspension before a pressure treatment (a) and after pressure release at 0.1 MPa following a 1 h treatment at 300 MPa (b).
In order to ensure that the decolouration was not attributed to influences other than
pressure, e.g. the light or the possible development of heat by the illumination of the
microscope, the stained starch suspensions were investigated at atmospheric pressure for 1 h.
For the iodine stained tapioca and potato starch suspensions no alterations in colour or size of
the granules became visible. However, the continuous phase of the suspensions darkened
noticeably. Placing the wheat starch suspension under the light microscope for 1 h at
atmospheric pressure led to a very slight elucidation of the granules, which was not
comparable to the thorough decolouration at 300 MPa, without a deepening of colour of the
surrounding liquid (data not shown). Therefore, this minor elucidation was neglected.
The decolouration observed during and after pressurisation can also not be attributed
entirely to an uptake of water and resulting dilution because a pressurisation at 300 MPa for 1
h showed no measurable effects on the granule sizes of tapioca starch as well as potato starch
that could be attributed to a water uptake.
Results and discussion
49
According to Sarko and Wu (1978) all starches formed single helical complexes with
iodine in their amorphous regions. However, pure, highly oriented crystalline A- and B-
amylose molecules were unable to form a complex with iodine due to the double helices
(Sarko & Wu, 1978, French, 1984). This can be applied to the crystalline regions of starches
consisting of double helices (Sarko & Wu, 1978). Consequently, only the amorphous regions
acting more sensitive towards pressure and being the starting point of pressure induced
gelatinisation attributed to the colouration with iodine. Therefore the decolouration could not
be an indication for starch melting as suggested by Douzals et al. (1996) because the
crystalline regions are not involved in starch-iodine complexes.
It was striking that the decolouration appeared to be irreversible, since starch could be
iodine stained after a pressure treatment and hence had not lost its ability to form complexes
with iodine. A degradation of iodine due to pressure could also be excluded. The colour of the
iodine solution used remained unchanged in colour intensity and tinge when compared before
and after 1 h at 300 MPa (not shown). It is also unlikely that redox reactions could be
responsible for the decolouration of the starch granules because the colouring of potato starch
remained almost unchanged. If iodine would have been pushed out of the single helices by
pressure inducing a disassociation of the amylose-iodine complex, a pressure release should
lead to a reformation of the amylose-iodine complexes and a regeneration of the blue colour
unless the iodine was to be permanently displaced by water molecules or bound elsewhere.
But the permanent displacement of iodine by water molecules is contradictory to the starches
ability to form complexes with iodine after a pressurisation step.
It was discovered that the electrical conductivity of pressure-treated starch suspensions
increased with increasing degree of gelatinisation (see chapter 4.3). This was regarded as an
indication of an ion release during the pressure-induced gelatinisation process. It was possible
that leaking of amylose from the starch granule was partly responsible for this rise in
electrical conductivity. In literature, the opinions whether amylose release generally occurred
during pressurisation were conflicting, according to Douzals et al. (1998) there is only little
and after Stute et al. (1996) and Stolt et al. (2001) sometimes even no amylose release.
Kudla and Tomasik (1992) pressurised moistened potato starch with added iodine and
concluded that iodine present in starch caused significant deterioration of the starch matrix by
gelation and/ or hydrolysis of glycosidic bonds. Accordingly, an amylose release could also
originate from the presence of iodine during pressurisation.
The decolouration of the starch granules under high hydrostatic pressure suggested a
removal of iodine and the darkening of the surrounding liquid phase led to the assumption
Results and discussion
50
that an accumulation of amylose-iodine complexes in the liquid had occurred. Hence, the
decolouration could be caused by an amylose release from the amorphous regions during
pressure-induced starch gelatinisation where the released amylose molecules complexed with
iodine pushed out of the single helices by pressure and the complexes formed accumulated in
the thereby darkening liquid phase. So the removed iodine was again linked to amylose
molecules which would explain why the starch granules could still be iodine-stained after a
pressure treatment but would not regain their colour after pressure release if stained before the
pressure treatment.
Potato starch was apparently not only more resistant to pressure-induced swelling of the
granules than wheat starch but also more robust towards amylose release. Although tapioca
starch granules showed no visible swelling after 1 h at 300 MPa, the decolouration was
clearly evident. This demonstrated that decolouration and swelling were not connected and
suggested that the amylose release from the amorphous regions possibly started before the
swelling of the granules was initiated.
More data derived from complementary analysis methods is required for explaining
the experimental results.
4.3 Physical properties of pressurised starch suspensions
Upon pressurisation at different pressures and pressurisation times, the electrical
conductivity and the water binding capacity of wheat, tapioca, and potato starch suspensions
were determined and compared with its degree of gelatinisation. It was searched for possible
correlations analogous to the thermal gelatinisation and furthermore for a quick method for
the determination of the degree of gelatinisation.
4.3.1 Pressure gelatinisation curves and electrical conductivity
Wheat, tapioca, and potato starch suspensions (5 % w/ w) were pressurised at 29°C for
15 min at various pressures and the degree of gelatinisation as well as the electrical
conductivity of the starch suspensions were determined. Figure 4.10 shows the degree of
gelatinisation and the electrical conductivity of the pressure-treated starch suspensions in
relation to the pressure applied. The degree of gelatinisation of all three starches examined
increased with increasing pressure and the gelatinisation curves obtained strongly resembled
Results and discussion
51
thermal gelatinisation curves with their typical sigmoid shape. Hence the process of pressure-
induced gelatinisation appeared to proceed similarly to the process of thermal gelatinisation.
0
20
40
60
80
100
0 100 200 300 400 500
Pressure [MPa]
Deg
ree
of g
elat
inis
atio
n [%
]
60
65
70
75
Ele
ctric
al c
ondu
ctiv
ity
[µS
/cm
]
Degree ofgelatinisation
Electricalconductivity
0
20
40
60
80
100
0 200 400 600Pressure [MPa]
Deg
ree
of g
elat
inis
atio
n [%
]
65
70
75
80
85
90
Ele
ctric
al c
ondu
ctiv
ity
[µS
/cm
]
Degree ofgelatinisation
Electricalconductivity
0
20
40
60
80
100
400 500 600 700 800Pressure [MPa]
Deg
ree
of g
elat
inis
atio
n [%
]
25
35
45
55
Ele
ctric
al c
ondu
ctiv
ity
[µS
/cm
]
Degree ofgelatinisation
Electricalconductivity
Fig. 4.10. Degree of gelatinisation [%] and electrical conductivity [µS/ cm] of pressure-treated wheat (a), tapioca (b), and potato (c) starch suspensions (5 % w/ w, 29°C, 15 min).
Only at approximately 200 MPa there was a slight minimum in the gelatinisation curve of
tapioca starch and a reduced rise in the degree of gelatinisation for wheat starch. Both wheat
and tapioca starches seemed to be more stable towards pressure around 200 MPa. This could
be due to a change in volume owing to the pressure. For example, the gelatinisation
temperature was slightly increased by pressurisation up to 150-250 MPa and subsequently
decreased with rising pressure (Thevelein et al., 1981, Muhr & Blanshard, 1982). Muhr et al.
(1982) investigated starch gelatinisation using a HPDTA. Applying the Clapeyron equation,
the authors calculated the volume change (∆V) to decrease with increasing pressure and to be
zero around 150-250 MPa and suggested that the initial increase and subsequent decrease in
gelatinisation temperature following a pressure treatment was a consequence of a decrease in
∆V. Potato starch was less sensitive to pressure than tapioca and wheat starch, and since it
a
b
c
Results and discussion
52
exhibited a higher resistance to pressure in comparison to wheat and tapioca starches and did
not begin to gelatinise below 500 MPa, this does not apply for potato starch.
Tapioca starch gelatinised comparatively instantaneously within a pressure range of
around 200 MPa, complete gelatinisation was achieved at 600 MPa at the conditions applied
(5 % w/ w, 29°C, 15 min) while wheat and potato starch gelatinised over a broader pressure
range. Tapioca starch ranged intermediate in terms of pressure sensitivity of the three starches
investigated. Wheat starch exhibited the lowest resistance towards pressure and completely
gelatinised at 440 MPa at the conditions applied, whereas 100 % gelatinisation of potato
starch, showing the highest pressure resistance, was achieved at 770 MPa.
60
64
68
72
76
0 100 200 300 400 500Pressure [MPa]
Ele
ctric
al c
ondu
ctiv
ity [µ
S/
cm]
7
11
15
19
23
Ele
ctric
al c
ondu
ctiv
ity [µ
S/
cm]native
washed
Fig. 4.11. Electrical conductivity [µS/ cm] of pressurised (black) and washed and then pressurised (grey) wheat starch suspensions (5 % w/ w, 29°C, 15 min).
The electrical conductivity of the starch suspensions rose with increasing pressure.
Therefore there must have been an ion release during pressure-induced gelatinisation although
the starches retained their granular character. In order to prove that this increase in electrical
conductivity was based on an ion release from within the starch granule and not from ions
attached to the granule’s surface, the rise in electrical conductivity with increasing pressure of
native and three times washed wheat starch suspensions was compared, as depicted in figure
4.11. Since the absolute value of the increase in electrical conductivity was almost identical
for native and washed wheat starch suspensions, it was shown, that the there must be an ion
Results and discussion
53
release from within the granule. In addition it is possible that a concentrating effect due to
water uptake of the starch granules contributes to the rise in electrical conductivity.
On the whole, the electrical conductivity of the pressurised samples corresponded well
with the gelatinisation curves. As aforementioned, the tapioca starch suspensions gelatinised
over a comparatively narrow pressure range starting around 400 MPa and ending at 600 MPa,
and there was also a considerable rise in electrical conductance of the tapioca starch
suspension within this range (Fig. 4.10 b). Wheat starch being less resistant to pressure and
gelatinising over a much wider range (Fig. 4.10 a) practically started to gelatinise at 100 MPa
and ended at 440 MPa. There was a rise in the slope of the gelatinisation curve around 300
MPa, which correlated with a rise of the slope of the electrical conductivity. The rise in
electrical conductivity of potato starch suspensions due to a pressure treatment also correlated
well with its degree of gelatinisation (Fig. 4.10 c).
Generally, the initial electrical conductivity of 5 % starch suspensions of different
origins differed, which might be due to the manufacturing process of the starches resulting
from the embedding of the starch granules in the plant and to the content of mineral nutrients
of the starches. Additionally, the absolute value of increase in electrical conductivity differed
dependant on the type of starch, e.g. the electrical conductivity of wheat starch suspension
increased by 16.92 µS/ cm, of tapioca starch suspension by 28.68 µS/ cm, and of potato starch
suspension by 36.40 µS/ cm upon pressurisation at the gelatinisation pressure, defined as the
pressure where all starch granules have lost their birefringent properties. The increase in
electrical conductivity might be influenced by the water availability due to differing viscosity
increase.
4.3.2 Impact of pressurisation time on electrical conductivity
The influence of the pressure treatment time on the degree of gelatinisation and
electrical conductivity of the starch suspensions was also investigated (Fig. 4.12 a-c). Because
wheat starch, tapioca starch, and potato starch showed a different stability towards pressure,
different pressures were applied for each starch, i.e. 350 MPa for wheat starch, 530 MPa for
tapioca starch, and 700 MPa for potato starch suspensions. At constant temperature and
pressure, the degree of gelatinisation increased with increasing treatment time for all three
starches examined. The impact of treatment time was the most pronounced during the first
hour of pressurisation where a steep slope of the gelatinisation curve can be observed. The
Results and discussion
54
electrical conductivity of wheat and tapioca starch suspensions also rose with increasing
pressurisation time and the course of the conductivity curve corresponded well with their
gelatinisation curve. Tapioca starch was nearly fully gelatinised after a 4 h treatment at 530
MPa (Fig. 4.12 b) whereas wheat starch showed a much slower rise in degree of gelatinisation
with increasing pressurisation time at 350 MPa (Fig. 4.12 a).
As depicted in figure 4.12 c, during the first 60 min, the degree of gelatinisation and
the electrical conductivity of potato starch suspensions also increased with increasing
treatment time. Between a treatment time of 1 h and 4 h the degree of gelatinisation almost
stagnated, whereas the electrical conductivity even slightly decreased. It is possible that the
gel-like texture of pressure-treated potato starch suspensions inhibits the measurement of its
electrical conductivity. Additionally, the determination of the degree of gelatinisation of
pressure-treated potato starch suspensions was complicated due to starch sedimentation and
consequential inhomogeneity of the sample which is also emphasised by the high standard
deviations. This did not apply for the measurement of degree of gelatinisation of wheat and
tapioca starch suspensions.
Due to the different pressures applied, the gelatinisation curves of the three starches
are not comparable.
20
30
40
50
60
70
80
90
100
0 40 80 120 160 200 240
Pressurisation time [min]
Deg
ree
of g
elat
inis
atio
n [%
]
65
67
69
71
73
75
77
79
Ele
ctric
al c
ondu
ctiv
ity
[µS
/cm
]
Degree of gelatinisation [%]
Electrical conductivity [µS/cm]
30
40
50
60
70
80
90
100
0 40 80 120 160 200 240Pressurisation time [min]
Deg
ree
of g
elat
inis
atio
n [%
]
76
78
80
82
84
86
88
Ele
ctric
al c
ondu
ctiv
ity
[µS
/cm
]
Degree of gelatinisation [%]
Electrical conductivity [µS/cm]
39
44
49
54
59
64
69
0 40 80 120 160 200 240Pressurisation time [min]
Deg
ree
of g
elat
inis
atio
n [%
]
45,4
47,4
49,4
51,4
53,4
55,4
Ele
ctric
al c
ondu
ctiv
ity
[µS
/cm
]
Degree of gelatinisation [%]
Electrical conductivity
Fig. 4.12. Degree of gelatinisation [%] and electrical conductivity [µS/ cm] of wheat starch suspensions (a; 5 % w/ w, 29°C, 350 MPa), tapioca starch suspensions (b; 5 % w/ w, 29°C, 530 MPa), and potato starch suspensions (c; 5 % w/ w, 29°C, 700 MPa) pressurised for 5, 15, 30, 60, and 240 min, respectively.
a
b
c
Results and discussion
55
4.3.3 Correlation of degree of gelatinisation and electrical conductivity
The correspondence of the degree of gelatinisation and electrical conductivity of the three
starches used is depicted in figure 4.13 a-c, respectively. The data points shown were derived
from pressurisation experiments at a constant pressurisation time of 15 min (see chapter 4.3.1)
and also from pressure treatments at constant pressures and varying pressurisation periods
between 5 min and 4 h (see chapter 4.3.2). The values of the electrical conductivity data were
normalised, the lowest data point was defined as 0 % and the highest as 100 %. The resulting
adjusted linear curve is also displayed. The coefficients of determination R² showed a good
linear relationship between the degree of gelatinisation and the electrical conductivity for the
starches. Moreover the slope of the adjusted curve was close to one (y ≈ x) proving that there
was a conformity of the degree of gelatinisation and electrical conductivity after pressure
treatment.
y = 0,9761x - 4,1559
R2 = 0,9653
0
20
40
60
80
100
0 20 40 60 80 100Electrical conductivity [%]
Deg
ree
of g
elat
inis
atio
n [%
]
y = 0,9411x - 4,802
R2 = 0,9441
0
20
40
60
80
100
0 20 40 60 80 100Electrical conductivity [%]
Deg
ree
of g
elat
inis
atio
n [%
]
y = 0,9025x + 0,6714
R2 = 0,9220
0
20
40
60
80
100
0 20 40 60 80 100Electrical conductivity [%]
Deg
ree
of g
elat
inis
atio
n [%
]
Fig. 4.13. Correlation of degree of gelatinisation [%] and electrical conductivity [%] of pressure-treated wheat (a), tapioca (b), and potato (c) starch suspensions (5 % w/ w, 29°C).
It can be seen that the electrical conductivity corresponds with the degree of gelatinisation of
the starches investigated after pressure treatment and is an effective tool for the quick
determination of pressure-induced starch gelatinisation. The only complication to be
a
b
c
Results and discussion
56
considered is the initial electrical conductivity of the starch suspension to be pressurised.
There was always a slight irregularity in the initial conductivity due to the inhomogeneity of
the starches or inaccuracy in weighing during the preparation of the sample which made a
comparison of the electrical conductivity data obtained difficult. However, this limitation
could be overcome by washing the starches beforehand and weighing as precisely as possible
since the course of the electrical conductivity curve was not altered by a washing step (Fig.
4.11) and it was experienced that the exact sample preparation conducted was sufficient as
long as reproducible results were obtained.
4.3.4 Water binding capacity
Equivalent to the electrical conductivity measurements, the water binding capacity of
pressurised starch suspensions was determined. As depicted in figure 4.14, the water binding
capacity of all three starch suspensions (5 % w/ w) increased with increasing pressure after 15
min of pressurisation at 29°C and corresponds with its degree of gelatinisation. Therefore,
water binding capacity is also a potential indicator for pressure-induced starch gelatinisation.
0
20
40
60
80
100
0 100 200 300 400 500Pressure [MPa]
Deg
ree
of g
elat
inis
atio
n [%
]
0,7
1,2
1,7
2,2
2,7
3,2
3,7
WB
C [g
/g]
Degree of gelatinisation
WBC
0
20
40
60
80
100
0 200 400 600
Pressure [MPa]
Deg
ree
of g
elat
inis
atio
n [%
]
0,7
4,1
7,5
10,9
14,3
17,7
WB
C [g
/g]
Degree of gelatinisation
WBC
0
20
40
60
80
100
400 500 600 700 800Pressure [MPa]
Deg
ree
of g
elat
inis
atio
n [%
]
0,7
2,7
4,7
6,7
8,7
10,7
WB
C [g
/g]
Degree of gelatinisation
WBC
Fig. 4.14. Degree of gelatinisation [%] and water binding capacity [g/g] of pressure-treated wheat (a), tapioca (b), and potato (c) starch suspensions (5 % w/ w, 29°C, 15 min).
a
b
c
Results and discussion
57
Comparing the water binding capacity of the pressurised starch suspensions at a
degree of gelatinisation of 100 %, it is lowest for wheat starch, about threefold higher for
potato starch, and 4.5 times higher for tapioca starch. Consequently, completely pressure-
gelatinised tapioca starch exhibits the highest water binding capacity upon pressurisation of
the three starches examined. However at 450 MPa, wheat starch shows the highest water
binding capacity, since it is completely gelatinised, while the degree of gelatinisation of
tapioca starch is below 20 % and potato starch remains almost unaltered below 500 MPa.
4.4 Impact of pressure, temperature and treatment time on starch gelatinisation
The effect of pressure, temperature, and treatment time on the degree of gelatinisation
of wheat, tapioca, and potato starch suspensions was systematically investigated including a
statistical evaluation determining whether temperature and pressure have a statistically
significant effect on the degree of gelatinisation of wheat, tapioca, and potato starch at the
95.0 % confidence level, respectively. In this context, it was additionally scrutinised and
discussed if starch suspensions could be utilised as PTTI (see chapter 2.3.2).
4.4.1 Phase diagrams
The impact of pressure, temperature and treatment time on wheat, tapioca, and potato
starch suspensions was systematically determined. Primarily, a pressure-temperature phase
diagram of complete gelatinisation of the three starches was generated (Fig. 4.15).
As expected from previous findings (Muhr & Blanshard, 1982; Ezaki & Hayashi,
1992; Stute et al., 1996; Rubens et al., 1999), the wheat starch with an A-type X-ray
diffraction pattern proved to be the most sensitive to pressure. The course of the phase
transition curve of wheat starch was parabolic at temperatures above 0°C. This was in
accordance with results obtained by Douzals et al. (1999 and 2001). Below 0°C, the pressure
of phase transition increased highly, which was probably due to reduced water availability
because of freezing (data not shown).
The phase transition of tapioca starch occurred at higher temperatures and pressures
than the phase change of wheat starch but below the phase transformation of potato starch.
The course of the transition line of tapioca starch strongly resembled the pressure-induced
gelatinisation diagram of rice starch obtained by Rubens and Heremans (2000). Between
Results and discussion
58
10°C and 48°C the phase change appeared to be almost solely dependent on the pressure. A
decrease in the gelatinisation pressure with rising temperature of only 10 MPa/ 10°C could be
observed. Nearly regardless of the temperature applied, the gelatinisation pressure remained
around 600 MPa leading to a plateau-like progression of the phase transition line. Above
48°C the pressure of complete gelatinisation decreased rapidly with increasing temperature.
This course of the phase transition line between 10 and 50°C gave the impression that the
tapioca starch investigated was not applicable as a pressure time temperature integrator
(PTTI; see chapter 2.3.2) because the required temperature dependence was not ensured if
complete gelatinisation is the critical criterion chosen.
0
100
200
300
400
500
600
700
800
0 10 20 30 40 50 60 70 80
Temperature [°C]
Pre
ssur
e [M
Pa]
Wheat starch
Tapioca starch
Potato starch
Fig. 4.15. Phase diagram of complete gelatinisation of wheat, tapioca, and potato starch suspensions (5 % w/ w) after 15 min of pressure-temperature treatments.
Potato starch having a B-type crystalline pattern had the highest resistance to pressure.
Albeit at higher pressures, the phase transition line of potato starch proceeds similarly to the
line of wheat starch between 10 and 48°C except for an outlier at 39°C. The pressure of
complete gelatinisation decreases consistently with increasing temperature up to 58°C and
then declines rapidly. Assuming that the value for the pressure of complete gelatinisation of
potato starch at 39°C was derived from an error in measurement, potato starch suspensions as
Results and discussion
59
well as wheat starch suspensions are applicable as PTTIs if complete gelatinisation is the
chosen indicator.
4.4.2 Pressure-induced gelatinisation curves
As depicted in figure 4.16, the pressure dependence of wheat starch, tapioca starch and
potato starch suspensions at 29°C was investigated. As already observed before (Chapter
4.2.1; Fig. 4.15), wheat starch was more sensitive to pressure than tapioca and potato starch.
The degree of gelatinisation increased with increasing pressure. And for all three starches
examined, sigmoid shaped gelatinisation curves similar to thermal gelatinisation curves were
derived. As reported before (see chapter 4.3.1) the only discrepancy was a reduced rise of the
degree of gelatinisation around 200 MPa in the case of wheat starch and a minor local
minimum in the case of tapioca starch. This was probably due to a change in volume (∆v)
owing to the pressure (Muhr et al., 1982). Consequently for pressures below 200 MPa at
29°C, tapioca starch was not applicable as a pressure time temperature integrator (PTTI)
because at a constant, known temperature the pressure could not unambiguously be derived
from the degree of gelatinisation.
0
20
40
60
80
100
0 100 200 300 400 500 600 700 800Pressure [MPa]
Deg
ree
of g
elat
inis
atio
n [%
] Wheat starch
Tapioca starch
Potato starch
Fig. 4.16. Pressure-induced gelatinisation curves of wheat, tapioca and potato starch suspensions (5 % w/ w) after pressurisation for 15 min at 29°C.
Results and discussion
60
Above 200 MPa, tapioca starch gelatinisation possessed a satisfactory pressure dependency at
a constant temperature to function as a PTTI. Since most current high pressure applications
are performed above 200 MPa, this does not seem to be a major limitation of the applicability
of starches as PTTIs. Regardless of the change in slope of the gelatinisation curve, wheat
starch gelatinisation proved to have an adequate pressure dependency to yield distinct
information about the pressure applied at given temperatures and treatment times. Potato
starch could be applied as a PTTI at higher pressures above 500 MPa. For high pressure
processes below 500 MPa, potato starch would not be suitable.
0
20
40
60
80
100
0 100 200 300 400Pressure [MPa]
Deg
ree
of g
elat
inis
atio
n [%
]
29°C39°C48°C57°C
0
20
40
60
80
100
0 200 400 600Pressure [MPa]
Deg
ree
of g
elat
inis
atio
n [%
]
29°C39°C48°C57°C67°C
0
20
40
60
80
100
0 200 400 600 800Pressure [MPa]
Deg
ree
of g
elat
inis
atio
n [%
]
29°C39°C48°C57°C67°C
Fig. 4.17. Pressure-induced gelatinisation curves of wheat (a), tapioca (b), and potato (c) starch suspensions (5 % w/ w, 15 min) at different temperatures.
The starch suspensions were also pressurised at higher temperatures (39°C, 48°C,
57°C, and 67°C) in order to examine the influence of increasing temperatures (Fig. 4.17). The
higher the temperature, the lower was the pressure of complete gelatinisation at the
temperatures investigated. At 39°C the pressure-induced gelatinisation curve did not differ
considerably from the curve at 29°C. At 48°C, 57°C and 67°C, the effect of temperature was
much more distinct and the pressure-induced gelatinisation took place over a far smaller
a
b
c
Results and discussion
61
pressure range. Nevertheless, a pressure dependence was noticeable at higher temperatures
(below the gelatinisation temperature). In correspondence to the phase diagram of complete
gelatinisation (Fig. 4.15), figure 4.17 shows the higher sensitivity of wheat starch towards
pressure also at temperatures higher than 29°C in comparison to tapioca and potato starches.
At 57°C, the “initial” degree of gelatinisation at atmospheric pressure is above 90 % and only
a low pressure is required to achieve complete gelatinisation of wheat starch suspensions,
whereas pressures above 400 MPa are needed for tapioca and potato starch suspensions.
In figure 4.18 the relation between pressure, temperature and degree of gelatinisation
of wheat starch suspensions after a treatment of 15 min is recapitulatorily outlined in a three-
dimensional diagram. At constant temperature the degree of gelatinisation increases with
increasing pressure and at constant pressure it rises with increasing temperature. Furthermore,
at a consistent degree of gelatinisation the points for the appendant temperatures and
pressures form a parabolic-shaped graph. Additionally, the sigmoidal course of the thermal
gelatinisation becomes clearly visible.
Fig. 4.18. Correlation of pressure, temperature, and degree of gelatinisation of wheat starch suspensions (5 % w/ w) treated for 15 min.
Results and discussion
62
4.4.3 Pressurisation time
At constant temperature and pressure the treatment time was varied between 5 min and
4 h (Fig. 4.19) to gain insight into the relation between the degree of gelatinisation and
pressurisation time (see also chapter 4.3.2). The constant pressures chosen resulted in a
medium degree of gelatinisation at 15 min for each starch and hence permitted noticing a
possible rise or decrease in starch gelatinisation at different treatment times. For all three
starches examined the degree of gelatinisation increased with increasing treatment time during
the first hour of treatment. At treatment times longer than 1 h, there was only a minor change
in degree of gelatinisation in the case of potato starch. For wheat starch and tapioca starch the
degree of gelatinisation continued to increase at pressure treatments up to four hours but the
slope of the gelatinisation curve was reduced and the curve asymptotically approached 100 %.
0
20
40
60
80
100
0 60 120 180 240Treatment time [min]
Deg
ree
of g
elat
inis
atio
n [%
]
Wheat starch, 350 MPa
Tapioca starch, 530 MPa
Potato starch, 700 MPa
Fig. 4.19. Degree of gelatinisation of wheat, tapioca, and potato starch suspensions (5 % w/ w) after a pressure treatment at 29°C and a constant pressure of 350, 530, and 700 MPa, respectively, depending on the pressurisation time.
It can be concluded that the degree of gelatinisation of all three starches investigated
strongly depended on the treatment time applied during the first hour of treatment. At longer
treatment times the influence of pressurisation time diminishes and only wheat starch and
Results and discussion
63
tapioca starch fulfilled the requirements of a PTTI, potato starch yielded no significant change
in degree of gelatinisation upon pressurisation for more than 1 h. Because pressure treatments
lasting longer than 1 h are not economical at an industrial scale, potato starch could well
function as a PTTI. The apparently lacking influence of pressurisation time above 1 h on the
degree of gelatinisation of potato starch is inexplicable, but it is possibly a result of the
aforementioned inhomogeneity of the sample due to sedimentation. The experiment was
repeated eight times, and each time no further rise in degree of gelatinisation of potato starch
could be observed.
0
20
40
60
80
100
0 60 120 180 240Treatment time [min]
Deg
ree
of g
elat
inis
atio
n [%
]
250 MPa350 MPa400 MPa300 MPa
0
20
40
60
80
100
0 60 120 180 240Treatment time [min]
Deg
ree
of g
elat
inis
atio
n [%
]
300 MPa400 MPa450 MPa530 MPa600 MPa
Fig. 4.20. Degree of gelatinisation of wheat (left) and tapioca (right) starch suspensions (5 % w/ w) after a pressure treatment at 29°C and a constant pressure depending on the pressurisation time.
To ensure that the time dependency of starches was not only valid in the intermediate
pressure range, pressures at the initiation and shortly before completion of pressure-induced
wheat and tapioca starch gelatinisation (after 15 min) have also been investigated (Fig. 4.20).
At all pressures investigated, the degree of gelatinisation increased with increasing treatment
time. The velocity rate of gelatinisation also increased with increasing pressure which was in
accordance with results obtained by Stolt et al. (2001). Nonetheless the time dependency of
pressure-induced starch gelatinisation persisted at higher or lower pressures. It also appeared
that at any given pressure and temperature after an appropriate treatment time a complete
gelatinisation of wheat starch and tapioca starch could be achieved but this cannot be
concluded.
Pressure-time phase diagrams of wheat and tapioca starch suspensions (5 % w/ w)
have also been generated (Fig. 4.21), where the relationship between pressure and treatment
Results and discussion
64
time at a constant temperature (29°C) and achieved total gelatinisation is shown. As observed
before, tapioca starch pressure-gelatinises at higher pressures than wheat starch at the same
pressurisation time. The pressure required in order to attain complete gelatinisation decreases
with increasing pressurisation time. The phase transition lines proceed logarithmic, the slopes
of rise in gelatinisation pressure decrease with increasing treatment time. Additionally, both
phase transition lines asymptotically approach a particular pressure, respectively. This leads
to the conclusion that a threshold pressure is required to obtain total pressure-induced
gelatinisation at indefinite treatment time and disproves the assumption that at any given
pressure and temperature after an appropriate treatment time a complete gelatinisation of
wheat starch and tapioca starch could be achieved. Nevertheless in order to achieve complete
pressure-induced wheat and tapioca starch gelatinisation, the treatment time can be reduced to
some extent by increasing the pressure and the pressure can be reduced to a certain degree by
prolonging the pressurisation time.
400
450
500
550
600
650
700
750
0 200 400 600 800
Pressurisation time [s]
Pre
ssur
e [M
Pa]
Wheat starch
Tapioca starch
Fig. 4.21. Pressure-time phase diagrams of complete gelatinisation of wheat and tapioca starch suspensions (5 % w/ w) pressurised at 29°C.
4.4.4 Starch suspensions as pressure time temperature integrator
It can be concluded that the degree of gelatinisation of pressurised starch suspensions
is highly dependent on the pressure, temperature and treatment time applied. As a result,
pressure-induced starch gelatinisation qualifies as an adequate extrinsic PTTI. With its
sensitivity to pressure, temperature and treatment time it enables to quantitatively and directly
Results and discussion
65
measure the impact of the process as long as two process parameters are known. Due to its
varying resistance to pressure depending on the type of starch, a starch can be selected
meeting the precise requirements needed for a certain pressurisation process. If a pressure
indicator for a higher pressure range is desired, a B-type starch being more resistant to
pressure like potato starch would be suitable. However, the exact behaviour of the starch
towards changes in pressure, temperature, and treatment time has to be thoroughly
investigated and descried before it can be applied as a reliable pressurisation process
indicator. For example, the tapioca starch examined in this work would not be applicable for
temperatures below 50°C if the temperature was not held constant and the potato starch would
be inadequate as a PTTI at pressures below 500 MPa. The most pronounced changes in
degree of gelatinisation could be detected if starches were about midway of complete
gelatinisation at the process conditions applied i.e. where the slope of the pressure-induced
gelatinisation curve was the steepest. As a PTTI, a starch being in the intermediate range of
gelatinisation at the process conditions would detect even slightest changes in pressure at
known temperature characteristics and treatment time.
A quicker and easier possibility would be not to look at the degree of gelatinisation but
to aim for complete gelatinisation. Then a starch would have to be chosen which achieved
total gelatinisation at the desired process conditions. For the future it is desirable to develop a
very quick and sophisticated way of measuring complete gelatinisation e.g. by a colour
indicator which changes its colour when complete pressure-induced gelatinisation is achieved.
For example, a decolouration of iodine stained starch granules during a pressure treatment has
been observed and found to correspond with starch gelatinisation as confirmed by DSC
(Douzals et al., 1996). However, these results could not be confirmed in our laboratory (see
chapter 4.2.2) and further research is required.
Since starch is widely used in food products it suggests itself to be applied as an
intrinsic PTTI. In spite of this, the application of starch gelatinisation as an intrinsic PTTI is
not recommendable. Pressure-induced starch gelatinisation is highly dependent on the free
water content available (Stute et al., 1996) and is e.g. influenced by the starch concentration
of the suspension and the presence of salts and carbohydrates (see chapter 4.5). If there is a
slight variation in the ingredients in a production process, the gelatinisation behaviour of
starch under pressure would be altered. Accordingly, the use of starch gelatinisation as an
extrinsic indicator demands a pure starch suspension with an identical water content.
Results and discussion
66
4.4.5 Statistical evaluation
In order to investigate the statistically significant effect of temperature and pressure on the
degree of gelatinisation of starches in 5 % (w/ w) suspensions treated for 15 min, multifactor
analyses of variance (ANOVA) were performed for wheat, tapioca, and potato starch
suspensions (5 % w/ w) with the assistance of the computer software Statgraphics 4.1. In a
two-factor model, temperature and pressure functioned as independent factors and the degree
of gelatinisation represented the dependent response variable. The Type III sums of squares
have been chosen, where the contribution of each factor is measured having removed the
effects of all other factors. Tables 4.2 – 4.4 depict the resulting ANOVA tables.
Tab. 4.2. ANOVA table for the degree of gelatinisation of wheat starch suspension (5 % w/ w) treated for 15 min Source Sum of squares Degree of freedom Mean squares F-ratio P-value Temperature 30407.60 6 5067.94 9.05 0.0000 Pressure 21998.50 6 3666.42 6.55 0.0001 Residual 19592.50 35 559.79 Total (corrected) 72690.80 47
All F-ratios are based on the residual mean square error.
Tab. 4.3. ANOVA table for the degree of gelatinisation of tapioca starch suspension (5 % w/ w) treated for 15 min Source Sum of squares Degree of freedom Mean squares F-ratio P-value Temperature 20923.10 5 4184.61 11.69 0.0000 Pressure 35299.80 5 7059.95 19.73 0.0000 Residual 8945.59 25 357.82 Total (corrected) 65168.40 35
All F-ratios are based on the residual mean square error.
Tab. 4.4. ANOVA table for the degree of gelatinisation of potato starch suspension (5 % w/ w) treated for 15 min Source Sum of squares Degree of freedom Mean squares F-ratio P-value Temperature 34008.70 5 6801.74 12.36 0.0000 Pressure 11183.10 4 2795.78 5.08 0.0055 Residual 11009.20 20 550.46 Total (corrected) 56201.10 29
All F-ratios are based on the residual mean square error.
Results and discussion
67
The F-Test showed that the means of the factor levels differed, since all F-ratios (Tab.
4.2. - 4.4) were larger than the corresponding F-value derived from an F-distribution table
(Neter & Wasserman, 1974). As an example, the F-Test for effects of the factor pressure on
potato starch gelatinisation at the 95.0 % confidence level given in the following equation
F-ratio = 5.08 < F (0.95, 5, 20) = 2.87
demonstrates that not all factor level means of the factor temperature are equal, or that some
definite effects of pressure on the degree of gelatinisation of potato starch exist (Neter &
Wasserman, 1974). This can be transferred to both factors of all three starches investigated.
The P-values test the statistical significance of each of the factors. Because all P-
values are less than 0.05, the factors temperature and pressure have a statistically significant
effect on gelatinisation at the 95.0 % confidence level for all three starches investigated. Even
at a confidence level of 99.0 % the effects of the factors investigated on the response variable
are statistically significant, since all P-values are below 0.01 (Neter & Wasserman, 1974).
4.5 Effect of water content and additives on pressure-induced starch gelatinisation
The influence of water content as well as the effect of additives such as sugars and
salts on pressure-induced starch gelatinisation has also been investigated. Wheat, tapioca, and
potato starch suspensions with concentrations of one to at least 55 % (w/ w) were pressurised
at constant pressures for 15 min, respectively, to examine the impact of the water content. For
the investigation of the effect of additives, the starch concentration was kept constant at 5 %
(w/ w), as additives several mono-, di-, and trisaccharides, chlorides, sodium and potassium
salts have been chosen. For the examination of the impact of salts on pressure-induced starch
gelatinisation, emphasis was put on the effect of sodium chloride due to its importance in food
products and its interesting effects on pressure-induced potato starch gelatinisation.
The effect of numerous chlorides and sodium salts on pressure-treated (800-1,200
MPa for 60 and 300 s) dried potato starch (2-22 % moisture content) has already been
determined by Kudla and Tomasik (1992), they only obtained synergistic effects of the
additives iodine, ferric and cobaltous chlorides and high pressure on deterioration of the
Results and discussion
68
starch matrix. Since the water content was extremely low, the results could not be transferred
due to the entirely different experimental set-up chosen for this work.
4.5.1 Impact of water content
Starch suspensions with different starch concentrations and hence different water
contents were pressure-treated. At a constant pressure, it was observed that the degree of
gelatinisation decreased with increasing starch concentration (Fig. 4.22). This was in
accordance with results obtained by Kudla and Tomasik (1992) having obtained an
accelerated destruction of the starch matrix of potato starch granules with increasing
humidity. Below a water content of 50 % the influence of the pressure on starch gelatinisation
decreased rapidly. Even an increase in pressure in the case of wheat starch suspensions from
350 to 500 MPa exhibited a decreasing influence of pressure at a water content below 50 % as
represented by the abrupt decline in degree of gelatinisation. This clearly showed that water
influences the gelatinisation pressure and furthermore indicated that a certain amount of
water, i.e. 50 %, might be required for the pressure-induced starch gelatinisation and was in
accordance with findings made by Hibi et al. (1993) and Stute et al. (1996).
Fig. 4.23. Degree of gelatinisation of wheat, tapioca, and potato starch suspensions (5 % w/ w) pressurised at 350, 530, and 700 MPa, respectively, for 15 min at 29°C with increasing sucrose concentration.
Results and discussion
70
At a constant sucrose content of 1 % (w/ w), a shift in gelatinisation pressure could be
observed in comparison to native wheat starch suspension (Fig. 4.24). The gelatinisation
pressure increased with increasing sucrose content. This correlates with the influence of
sucrose on the thermal starch gelatinisation (Evans & Haisman, 1982; Spies & Hoseney,
1982; Chinachoti et al., 1991; Ahmad & Williams, 1999; Jang et al., 2001; Maaurf et al.,
2001). Consequently, sucrose could be used to alter and control the gelatinisation pressure
and to impede gelatinisation.
0
20
40
60
80
100
0 200 400 600Pressure [MPa]
Deg
ree
of g
elat
inis
atio
n [%
]
native
1 % sucrose
Fig. 4.24. Gelatinisation curves of wheat starch suspensions (5 % w/ w) without and with 1 % (w/ w) sucrose upon pressurisation (15 min, 29°C).
The effect of increasing concentration of fructose, glucose, sucrose, and trehalose on
wheat, tapioca, and potato starch suspensions pressurised for 15 min at 29°C and 350, 530,
and 700 MPa, respectively, is depicted in figure 4.25. All sugars led to a decrease in the
degree of gelatinisation and hence interfered with the pressure-induced gelatinisation process.
Disaccharides seemed to have a more pronounced effect than monosaccharides in terms of
hindering pressure-induced gelatinisation. This is in agreement with the hypothesis that longer
sugar molecules form more links with starch molecules than shorter sugar molecules leading
to an increased restriction and reduced flexibility of the starch chains and thus requiring more
energy for gelatinisation (Spies & Hoseney, 1982).
For wheat starch suspensions, the influence of 0.15 mol/ l of a variety of sugars on the
degree of gelatinisation after a pressure treatment was investigated (Fig. 4.26). It was
discovered that the degree of gelatinisation linearly correlated with the number of equatorial
hydroxyl groups of the sugars present. Additionally, it was observed that the degree of
gelatinisation decreased with increasing molecular weight and number of hydroxyl groups.
Since hydroxyl groups are presumably involved in forming bridges with starch molecules,
sugars with a higher number of hydroxyl groups and consequently mostly also with a higher
molecular weight were expected to lower starch gelatinisation under pressure. The correlation
of starch gelatinisation in the presence of low-molecular sugars and their number of equatorial
hydroxyl groups corroborates the theory that a reduction of water activity and decreased water
availability reduces gelatinisation as well as sugar-starch interactions (Spies & Hoseney,
1982). The higher the number of equatorial hydroxyl groups of a sugar, the easier it forms
hydrogen bonds with water (Kato et al., 2001) because an equatorial hydroxyl group will be
more strongly hydrated than an axial group (Kabayama & Patterson, 1958). Tamura (1999)
found a linear correlation of thermotolerance and barotolerance of yeasts with mean number
of equatorial OH groups of sugars, and Uedaira and Uedaira (1980) observed that the
denaturation temperature of lysozyme increased linearly with increasing number of equatorial
hydroxyl groups of sugars. Thus low-molecular sugars have a protective effect during heat
a
b
c
Results and discussion
72
and pressure treatment that corresponds with their mean number of equatorial OH groups, not
only on yeast vitality and protein denaturation, but also on starch gelatinisation during a
pressure treatment.
R2 = 0,8303
0
2
4
6
8
10
12
14
16
18
2 3 4 5 6 7 8 9Number of equatorial OH groups
Deg
ree
of g
elat
inis
atio
n [%
]
3
1 24
5
6
78
109
Fig. 4.26. Degree of gelatinisation of pressurised wheat starch suspensions (5 % w/ w, 15 min, 350 MPa, 29°C) with 0.15 mol/ l sugar (1 fructose, 2 mannose, 3 galactose, 4 glucose, 5 sucrose, 6 lactose, 7 melibiose, 8 maltose, 9 trehalose, 10 melezitose). The numbers of equatorial hydroxyl groups for the sugars were derived from Uedaira et al. 1980, 1985 & 1990, Gekko & Koga 1983, and Kato et al. 2001.
4.5.3 Impact of sodium chloride
The degree of gelatinisation of wheat, tapioca and potato starch suspensions with
increasing sodium chloride concentration is depicted in figure 4.27.
For wheat and tapioca starches, NaCl reduced gelatinisation. Between a NaCl
concentration of 0.5 and 2 M the gelatinisation was completely suppressed at the pressures
applied, above 2 M the protective effect on starch crystallites subsided and the gelatinisation
remained suppressed, but to a lesser extent. Consequently, sodium chloride can be utilised to
suppress wheat and tapioca starch gelatinisation under high pressure
For potato starch suspensions, small concentrations of NaCl up to 2 M suppressed
gelatinisation with a minimum at 0.7 M (4 %), above 3.4 M NaCl (20 %) the gelatinisation of
potato starch was enhanced until complete gelatinisation was achieved at 5.1 M. As a result,
small concentrations of NaCl can be used to impede potato starch gelatinisation, while the
Results and discussion
73
gelatinisation pressure of potato starch can be decreased by high sodium chloride
concentrations.
0
20
40
60
80
100
0 1 2 3 4 5
NaCl concentration [mol/ l]
Deg
ree
of g
elat
inis
atio
n [%
] Wheat 350 MPa
Tapioca 530 MPa
Potato 700 MPa
Fig. 4.27. Degree of gelatinisation of wheat, tapioca, and potato starch suspensions (5 % w/ w) pressurised at 350, 530, and 700 MPa, respectively, for 15 min at 29°C with increasing sodium chloride concentration.
0
20
40
60
80
100
0 100 200 300 400 500
Pressure [MPa]
Deg
ree
of g
elat
inis
atio
n [%
]
native
+ 1 % NaCl
+ 1 % Saccharose
Fig. 4.28. Gelatinisation curves of wheat starch suspensions (5 % w/ w) without and with 1 % (w/ w) sucrose and sodium chloride, respectively, upon pressurisation (15 min, 29°C).
Results and discussion
74
The inhibitory effect of NaCl on wheat starch gelatinisation under pressure is
displayed in figure 4.28. In comparison to 1 % (w/ w) sucrose, 1 % NaCl has a more retarding
effect on pressure-induced starch gelatinisation, which can partly be attributed to the higher
molar concentration (0.17 M NaCl in contrast to 0.03 M sucrose). Nonetheless, at the same
molar concentration the degree of gelatinisation of wheat starches is somewhat lower in the
presence of NaCl than of sucrose.
As shown in fig. 4.27, small concentrations of NaCl (2 M) reduced gelatinisation of
potato starch with a minimum at 0.7 M (4 %), above 3.4 M NaCl (20 %) the gelatinisation of
potato starch was enhanced. This phenomenon was confirmed by pressurising potato starch
suspensions with constant sodium chloride concentration and increasing pressure (Fig. 4.29).
The gelatinisation pressure of potato starch suspensions was higher at a NaCl concentration of
4 % than without salt added, it was reduced when 20 or 30 % NaCl were dissolved. This
corresponds roughly with observations made for thermal gelatinisation (Sandstedt et al.,
1960; Evans & Haisman, 1982; Maaurf et al., 2001). It can be concluded that low
concentrations of sodium chloride decreased the gelatinisation pressure of starches, at higher
concentrations it increased again. This effect was more pronounced for potato starches than
for tapioca and wheat starches where high NaCl concentrations led to complete gelatinisation.
This cannot be explained so far, but it is assumed that differences in the molecular and the
crystal structure and chemical composition of the starches might be responsible for that effect.
0
20
40
60
80
100
0 200 400 600 800Pressure [MPa]
Deg
ree
of g
elat
inis
atio
n [%
] native+ 20 % NaCl+ 30 % NaCl+ 4 % NaCl
Fig. 4.29. Gelatinisation curves of potato starch suspensions (5 % w/ w) without and with 4, 20, and 30 % (w/ w) sodium chloride, respectively, upon pressurisation for 15 min at 29°C.
Results and discussion
75
4.5.4 Influence of salts
The effect of several chlorides, sodium and potassium salts on the pressure
gelatinisation of wheat, tapioca and potato starches was also examined (Fig. 4.30-32).
Results obtained for sodium, lithium, calcium and potassium chlorides in wheat starch
suspensions and also for sodium chloride in potato and tapioca starch suspensions (Fig. 4.30)
agreed with findings made by Sandstedt et al. (1960), Evans and Haisman (1982), and Jane
(1993) for thermal starch gelatinisation. The gelatinisation pressure first increased and then
decreased with increasing chloride concentrations as evidenced by a decrease and subsequent
increase in degree of gelatinisation with increasing chloride concentration.
For other chlorides than NaCl in potato and tapioca starch suspensions a slight
decrease in gelatinisation pressure was detected at low chloride concentrations (0.1 M) before
the gelatinisation pressure increased and then decreased again with increasing chloride
concentrations. This was not reported for the effect of these salts on the thermal gelatinisation.
At high chloride concentrations (> 2 M) the impact of the salts on starch gelatinisation
augmentation followed the order Na+<K+<Li+<Ca2+, which corresponds to the order of the
lyotropic series (v. Hippel, 1975).
0
20
40
60
80
100
0 2 4 6Concentration [mol/l]
Deg
ree
of g
elat
inis
atio
n [%
]
CaClLiClKClNaClCsCl
0
20
40
60
80
100
0 2 4 6Concentration [mol/l]
Deg
ree
of g
elat
inis
atio
n [%
]
CaClLiClKClNaClCsCl
0
20
40
60
80
100
0 2 4 6Concentration [mol/l]
Deg
ree
of g
elat
inis
atio
n [%
]
CaClLiClKCl
NaClCsCl
2
Fig. 4.30. Degree of gelatinisation of wheat (a), tapioca (b) and potato (c) starch suspensions (5 % w/ w) pressurised at 350, 530 and 700 MPa, respectively for 15 min at 29°C with increasing chloride concentration.
a
b
c
2
2
Results and discussion
76
In the case of caesium chloride for all three starches investigated, there was first a
decrease at very low CsCl concentrations followed by an increase of the gelatinisation
pressure. The molar concentrations examined (0.6 M) were probably not high enough to show
a subsequent decrease in gelatinisation. The effect of all chlorides examined on starch
gelatinisation was the most pronounced for potato starch suspensions.
The investigation of the effect of potassium salts on pressure-induced starch
gelatinisation included potassium thiocyanate, iodide, bromide and chloride (Fig. 4.31). Just
as for chlorides, the effect of potassium salts on the degree of gelatinisation differed
depending on the type of starch and on the counter ion. The effect of potassium salts on starch
gelatinisation was again the most distinct for potato starch suspensions. For all starches an
increase in the degree of gelatinisation could be detected above a salt concentration of 1.3 M.
0
20
40
60
80
100
0 1 2 3 4Concentration [mol/l]
Deg
ree
of g
elat
inis
atio
n [%
]
KSCN
KI
KBr
KCl
0
20
40
60
80
100
0 1 2 3 4
Concentration [mol/l]
Deg
ree
of g
elat
inis
atio
n [%
]
KSCN
KI
KBr
KCl
0
20
40
60
80
100
0 1 2 3 4
Concentration [mol/l]
Deg
ree
of g
elat
inis
atio
n [%
]
KSCN
KI
KBr
KCl
Fig. 4.31. Degree of gelatinisation of wheat (a), tapioca (b) and potato (c) starch suspensions (5 % w/ w) pressurised at 350, 530 and 700 MPa, respectively for 15 min at 29°C with increasing concentration of potassium salts.
Except for KCl in wheat and tapioca starch suspensions, a decrease in gelatinisation pressure
could be observed at high concentrations. At concentrations above 1 M the effect of the
potassium salts on starch gelatinisation upon pressurisation also followed the order of the
lyotropic series (Cl-<Br-<I-<SCN-) (v. Hippel, 1975). Just as for the thermal gelatinisation, KI
and KSCN reduced the energy required for starch gelatinisation. This is due to their low
a
b
c
Results and discussion
77
viscosity, to their good hydrating properties by increasing the free water fraction and their low
charge-density ions SCN¯ and I3¯ (structure breakers) interacting with starch and facilitating
dissociation by inducing single helical conformation (Jane, 1993). This could also be
observed to a lower extent after 15 min at atmospheric pressure, where a degree of
gelatinisation of wheat starch suspension of approximately 15 % was achieved at a potassium
iodide concentration of 0.96 M (data not shown). The influence of high hydrostatic pressure
treatment is much more pronounced, since complete gelatinisation was accomplished at the
same KI concentration at 350 MPa.
0
20
40
60
80
100
0 0,2 0,4 0,6 0,8 1Concentration [mol/l]
Deg
ree
of g
elat
inis
atio
n [%
]
NaOH
NaCL
Na2SO4
0
20
40
60
80
100
0 0,2 0,4 0,6 0,8 1Concentration [mol/l]
Deg
ree
of g
elat
inis
atio
n [%
]
NaOH
NaCL
Na2SO4
0
20
40
60
80
100
0 0,2 0,4 0,6 0,8 1Concentration [mol/l]
Deg
ree
of g
elat
inis
atio
n [%
]
NaOH
NaCL
Na2SO4
Fig. 4.32. Degree of gelatinisation of wheat (a), tapioca (b) and potato (c) starch suspensions (5 % w/ w) pressurised at 350, 530 and 700 MPa, respectively for 15 min at 29°C with increasing concentration of sodium salts.
Sodium hydroxide and sulphate in addition to sodium chloride have also been
investigated (Fig. 4.32). Sodium sulphate causes a rise in gelatinisation pressure at
concentrations below 0.07 M and a subsequent reduction with increasing sodium sulphate
concentration above 0.07 M. At concentrations of around 0.7 M the gelatinisation process is
almost entirely suppressed at the pressures applied. Sulphate ions are so-called structure
makers, ions with a high charge density reducing the amount of free water and decreasing the
viscosity of aqueous liquids by breaking or weakening hydrogen bonds between water
molecules due to strong electrostatic interactions with water molecules (Jane, 1993). At
concentrations above 0.07 M this appeared to be also applicable under pressure. Sodium
Results and discussion
78
hydroxide led, in the case of wheat and tapioca starch, first to an increase in gelatinisation
pressure, above 0.01 M the gelatinisation pressure decreased again until complete
gelatinisation was obtained at 0.1 M NaOH. For potato starch, the degree of gelatinisation
increased from the outset and complete gelatinisation was already achieved at 0.05 M NaOH
at 700 MPa. Just as for other salts examined, potato starch appears to be the most susceptible
to starch gelatinisation under pressure in the presence of sodium salts. The observed rise in
degree of gelatinisation with increasing NaOH concentration was not solely due to an alkaline
gelatinisation. At atmospheric pressure and 0.1 M NaOH in wheat starch suspensions, a
degree of gelatinisation of 17 % was achieved (data not shown), whereas at 350 MPa
complete gelatinisation was obtained. The influence of sodium chloride was described in
detail above (Fig. 4.27).
4.6 Formation of resistant starch from pressurised wheat starch
It was investigated whether a pressure-gelatinisation of wheat starch suspensions in
combination with additional treatment steps resulted in a formation of resistant starch (RS) in
high amounts being advantageous to conventional resistant starch production without the use
of high hydrostatic pressure. After determining process parameters such as starch
concentration and storage temperature being favourable for the formation of RS,
gelatinisation-retrogradation cycles according to Sievert and Pomeranz (1989) were adapted
also after acid and enzyme hydrolysis and the RS content as well as the microscopic images
and the X-ray diffraction patterns of the treated samples were determined and discussed. The
RS amounts yielded were compared with RS yields obtained from thermally gelatinised wheat
starch as stated in literature.
4.6.1 Preliminary tests
In preliminary tests, several process parameters were optimised in order to obtain an
enhanced RS content in wheat starch by retrogradation subsequent to high hydrostatic
pressure-induced gelatinisation. It was observed that the starch concentration ranging between
5 % and 20 % (w/ w) of pressure-treated suspensions did not have a notable influence on the
RS content, whereas the RS content of heat treated wheat starch suspensions increased with
increasing concentration (Fig. 4.33). This was presumably due to the increasing amount of
released amylose molecules realigning with increasing starch concentration during thermal
Results and discussion
79
gelatinisation in contrast to the low amylose release (Douzals et al, 1998) in the course of
pressure-induced gelatinisation. A starch concentration of 5 % was chosen for all subsequent
experiments.
Figure 4.33 also shows that the RS content in heat treated wheat starch suspensions
immediately after the gelatinisation was clearly higher or about equal to pressure treated
suspensions depending on the starch concentration. This is a strong indication that the rapid
retrogradation immediately after pressurisation observed by DSC measurements by Stute et
al. (1996) did not include the formation of RS.
0
1
2
3
4
5
6
7
5 10 15 20Starch concentration [%]
RS
con
tent
[%]
Pressure-gelatinisedHeat-gelatinised
Fig. 4.33. Resistant starch content of gelatinised wheat starch suspensions immediately after a thermal gelatinisation (15 min, 0.1 MPa, 90°C) and a pressure-induced gelatinisation (15 min, 500 MPa, room temperature), respectively, in dependence on the starch concentration.
The storage temperature subsequent to pressurisation was also evaluated. As Douzals
et al. (1998) already indicated analysing the retrogradation behaviour of pressure-gelatinised
wheat starch, low storage temperatures (6°C and room temperature for 24 h) yielded lower RS
contents compared to thermally gelatinised wheat starch (Fig. 4.34). Freeze-thawing (-20°C to
room temperature) of pressurised starch did also not lead to an enhanced RS content in
comparison to heat-treated or unfrozen pressure-treated starch , while freeze-thawing of
thermally treated starch resulted in an enhancement of RS content. This was in accordance
with findings made by Chung et al. (2003). Subsequent freeze-drying did not further enhance
Results and discussion
80
the RS content of either heat or pressure-treated starch (data not shown). However, storage at
40°C and 52°C for 24 h following a pressure treatment resulted in higher RS yields in
comparison to heat-gelatinised starch, as depicted in figure 4.34. The RS content of
pressurised starch increased with increasing storage temperature. Therefore a storage
temperature of 52°C was selected for further experiments. Storage slightly below the
gelatinisation temperature is called annealing and is known to induce a molecular
reorientation and reorganisation of the granule structure (Tester & Debon, 2000). Although
annealing causes an increase in gelatinisation temperature, wide angle X-ray diffraction
patterns of not gelatinised wheat starches are unaltered by annealing leading to the conclusion
that crystallites remain unchanged. Nevertheless, a sharpening of DSC peaks due to annealing
is a definite indication for a rise in homogeneity and for a modification of the embedding of
starch crystallites in and their coupling forces to the amorphous matrix (Stute, 1992).
0
1
2
3
4
5
6
0 10 20 30 40 50 60
Temperature [°C]
RS
con
tent
[%]
Pressure-gelatinisedHeat-gelatinised
Fig. 4.34. Resistant starch content [%] of wheat starch suspensions (5 % w/ w) 24 h after a thermal gelatinisation (15 min, 0.1 MPa, 90°C) and a pressure-induced gelatinisation (15 min, 500 MPa, room temperature), stored at 6, 20, 40, and 50°C, respectively.
A pressure treatment of wheat starch suspensions was also performed at 53°C, 58°C,
and 66°C, and compared to room temperature and a thermal treatment at 90°C to explore the
effect of higher temperatures during pressurisation on the RS formation (Tab. 4.5). The RS
content of pressurised suspensions appeared to increase slightly with increasing treatment
temperature. But the determination method by McCleary and Monaghan (2002) is only
designed for samples with a RS content above 2 %, and therefor a slight inaccuracy cannot be
Results and discussion
81
excluded. In addition to that, the thermal influence seemed to prevail. Thus, in order to
prevent a thermal impact, pressure treatments were performed at room temperature thereupon.
Tab. 4.5. Resistant starch content of wheat starch suspensions (5 % w/ w) pressurised at different temperatures in comparison to thermal gelatinisation
4.6.2 Resistant starch formation after high pressure treatment
Based on all these experiences, high pressure-gelatinised wheat starch suspensions
were continuously annealed at 52°C for up to ten days (Fig. 4.35). The RS content increased
linearly up to 7.7 % the first192 h and remained about constant thereafter. However, after 528
h of annealing a RS content of approximately 9 % was measured (data not shown), so a slight
increase in RS with continuous annealing proceeded. These findings were in agreement with
Eerlingen et al. (1993a) stating that RS yields largely depended on storage temperature and
storage time. Besides, it could be concluded that an enhancement in RS content after high
hydrostatic pressure treatment is achievable.
Additionally, gelatinisation-retrogradation cycles according to Sievert and Pomeranz
(1989) were adapted, i.e. wheat starch suspensions were pressure-gelatinised (500 MPa, 15
min) and annealed (23 h 45 min, 52°C) in 24 h-cycles repeated up to ten days. As depicted in
figure 4.35, continuous annealing subsequent to a single pressure-treatment and pressure-
annealing cycles were compared. The RS content increased more rapidly within the first 72 h
of pressure-annealing cycles, then the curves ran more or less parallel exhibiting a similar RS
formation rate. Overall, the cycling yielded a clearly higher RS content with 12.6 % after ten
days.
Results and discussion
82
0
2
4
6
8
10
12
14
0 60 120 180 240 300Time [h]
RS
con
tent
[%]
Annealing at 52°C
Pressure-Annealing-Cycles at 52°C
Fig. 4.35. Resistant starch content of wheat starch suspensions (5 % w/ w) pressurised at 500 MPa for 15 min at room temperature followed by continuous annealing at 52°C in comparison to annealing at 52°C interrupted by a pressurisation step every 24 h (Pressure-annealing-cycles).
0
2
4
6
8
10
12
14
16
0 50 100 150 200 250 300Time [h]
RS
con
tent
[%]
52°C
RT
Fig. 4.36. Resistant starch content of wheat starch suspensions (5 % w/ w) alternately pressurised at 500 MPa for 15 min and stored at room temperature (RT) or at 52°C for 23 h 45 min (Pressure-storage-cycles and pressure-annealing-cycles).
Although the RS content of wheat starch suspensions was enhanced by pressure-
annealing cycles respective to continuous annealing after a sole pressure-gelatinisation, the
storage temperature nevertheless appeared to be determining for the increase in RS. Pressure-
storage cycles at room temperatures resulted in much less RS formation in comparison to both
pressure-annealing cycles and persistent annealing (Fig. 4.36). There is an increase in RS with
Results and discussion
83
increasing treatment time but the RS formation is visibly slower and a RS content of about 5.6
% is reached after 10 cycles. However, a higher yield in RS is produced by cycles in
comparison to continuous storage at room temperature (data not shown). Consequently, stored
at the same temperature, the pressure-storage cycles improved the RS yield, while a higher
temperature (below the gelatinisation temperature) leads to a further enhancement in RS
content.
0
2
4
6
8
10
12
14
0 50 100 150 200Time [h]
RS
con
tent
[%]
Acid hydrolysed
Enzyme hydrolysed
Unhydrolysed
Fig. 4.37. Resistant starch content of pressure-gelatinised native, acid hydrolysed and enzyme hydrolysed wheat starch suspensions annealed at 52°C interrupted by a pressurisation step (500 MPa, 15 min, room temperature) every 24 h (Pressure-annealing-cycles).
For an additional increase in RS, high pressure gelatinised wheat starch suspensions
were enzyme and acid hydrolysed prior to pressure-annealing cycles, respectively. Figure
4.37 shows the RS content of unhydrolysed, acid hydrolysed, and enzyme hydrolysed wheat
starch suspensions during eight days of pressure-annealing cycles. For the hydrolysed
samples, the RS content was also determined directly after the hydrolysis step and after the
pressurisation following hydrolysis. Initially, a hydrolysis step increased the RS content,
whereas acid hydrolysis led to a higher yield than enzyme hydrolysis. This could be explained
by the maintaining of the granular form of the pressure-gelatinised starches which possibly
impaired an enzyme attack (Fig. 4.38). However, it was surprising that the RS content after
enzyme hydrolysis was lower than of unhydrolysed starch after four to eight cycles. Although
leading to an initial increase in RS, the enzyme treatment obviously reduced the maximum
yield at the conditions applied. This could possibly be due to the pH decrease by addition of
Results and discussion
84
acetate buffer during pullulanase incubation. It is also possible that starch degradation
products, being partially generated by enzyme hydrolysis subsequent to pressurisation, might
sterically impede the formation of RS or that the association of linear starch chains to ordered
structures due to enzyme hydrolysis was destroyed by the determination method utilised.
Nevertheless, it can be concluded that enzyme hydrolysis of pressure-gelatinised
starch did not improve the RS yield as seen for heat treated starches (Vasanthan & Bhatty,
1998) which again indicated that thermal gelatinisation and pressure-induced gelatinisation
differed. Generally, the acid hydrolysis yielded the highest amounts of RS, but a higher RS
content than 12.1 % could not be achieved within 192 h.
4.6.3 Microscopic examination
Fig. 4.38. Microscopic images (x 400) of pressure-gelatinised unhydrolysed, acid-hydrolysed and enzyme hydrolysed wheat starch suspensions (a-c; 500 MPa, 15 min) and of unhydrolysed, acid-hydrolysed and enzyme hydrolysed wheat starch suspensions after 192 h of pressure-annealing cycles (d-f; 500 MPa, 15 min, room temperature; 23 h 45 min at 52°C, atmospheric pressure).
a b c
d e f
Results and discussion
85
Figure 4.38 depicts the optical appearance of non-hydrolysed, acid hydrolysed, and
enzyme hydrolysed wheat starch suspensions after pressure-induced gelatinisation (Fig. 4.38
a-c) and after 8 pressure-annealing cycles (192 h) (Fig. 4.38 d-f).
It becomes clearly visible that the granular structure remained intact after all
treatments. However, after acid hydrolysis the granule surfaces appeared to be slightly jagged
and damaged suggesting a minor degradation which could possibly be responsible for
realignment of degraded starch chains leading to retrogradation and crystal formation and the
consequential rise in RS. After 8 pressure-annealing cycles, the starch granules seemed to be
stressed as expressed by loss of shape reminding of ghost remnants. But a staining with iodine
did not reveal a visible amylose leaching. Microscopic observations through polarised light
featured absolutely no maltese crosses or any birefringency before the pressure-annealing
cycles, however after 8 days of pressure-annealing cycles, regions of several starch granules
exhibited the development of remote luminance indicating birefringence (data not shown).
4.6.4 X-ray analyses
X-ray diffraction patterns of native (a), pressure-gelatinised (b), pressurised and
annealed (c), and pressurised unhydrolysed, acid hydrolysed and enzyme hydrolysed,
respectively, prior to pressure-annealing cycled (d-f) wheat starches are shown in figure 4.39.
Peaks at 9.5 °2Θ were caused by the aluminium sample carrier. The native wheat starch
exhibited an evident A-type crystallinity as identified by strong peaks at 15.18, 17.13, 18.03,
and 22.86 °2Θ (5.83, 5.17, 4.91, and 3.89 Å) and weaker peaks at 11.49, 20.06, 26.69, and
30.36 °2Θ (7.70, 4.42, 3.34, and 2.94 Å) (Fig. 4.39 a; Zobel, 1964). A transformation of the A
towards a weak B-type pattern could be observed for all pressurised starches which was in
agreement with results obtained by other research groups (Hibi et al., 1993; Stute et al., 1996;
Katopo et al., 2002). The intensity as well as the sharpness of the peaks of the X-ray patterns
of pressure-gelatinised and pressurised, annealed wheat starch (Fig. 4.39 b-c) decreased as a
result of loss of crystallinity. One blurred double peak (17.2 and 19.5 °2Θ, i.e. 5.16 and 4.54
Å) was obtained. When undergone pressure-annealing cycles after pressurisation, the peak
intensity of the X-ray pattern slightly increased but was still to some extent lower in
comparison to native wheat starch and a third peak around 21.82 °2Θ (4.07 Å) became visible
(Fig. 4.39 d). This indicated a rise in B-type crystallinity. Enzyme hydrolysis prior to
pressure-annealing cycles resulted in equal peak intensity and hence crystallinity as native
wheat starch and a distinct B-type pattern could be observed (Fig. 4.39 f). In contrast, acid
Results and discussion
86
0
1000
2000
3000
4000
5000
5 10 15 20 25 30 35
[°2Theta]
Impu
lse
0
1000
2000
3000
4000
5 10 15 20 25 30 35[°2Theta]
Impu
lse
0
1000
2000
3000
5 10 15 20 25 30 35[°2Theta]
Impu
lse
0
1000
2000
3000
4000
5 10 15 20 25 30 35[°2Theta]
Impu
lse
0
2000
4000
6000
5 10 15 20 25 30 35[°2Theta]
Impu
lse
0
1000
2000
3000
4000
5000
5 10 15 20 25 30 35[°2Theta]
Impu
lse
Fig. 4.39. X-ray diffraction pattern of native wheat starch (a), pressurised (500 MPa, 29°C, 15 min), freeze-dried wheat starch (b), pressurised, annealed (192 h, 52°C), freeze-dried wheat starch (c), and pressurised, unhydrolysed, acid-hydrolysed and enzyme hydrolysed wheat starch suspensions after 192 h of pressure-annealing cycles (500 MPa, 15 min, room temperature; 23 h 45 min at 52°C, atmospheric pressure) and a freeze-drying step (d-f).
hydrolysis prior to pressure-annealing cycles led to a major decrease in peak intensity of
peaks representing B-type crystallinity. Therefor, a small peak at 27.57 °2Θ (3.24 Å) and an
intense sharp peak around 31.86 °2Θ (2.8 Å) appeared (Fig. 4.39 e). It was unlikely that these
peaks represented RS because they could not be found in the X-ray diffraction patterns of all
a b
c d
e f
Results and discussion
87
other samples. So it was assumed that they depicted crystalline regions of starch degradation
products.
Except for the hydrolysed samples, the rise in peak intensity and consequently in
crystallinity was accompanied by an increase in RS. But since the acid hydrolysis yielded the
highest amount of RS, no association between crystallinity and RS content could be
concluded. Furthermore, no peak was discovered that increased analogously with increasing
RS content and thus represented RS crystallinity.
4.6.5 Résumé
Comparing the impact of gelatinisation process on enhancement in RS content, the
influence of the starch type needed to be considered. High amounts of RS (up to 48 %) were
1989; Chiu et al., 1994; Vasanthan & Bhatty, 1998; Chung et al., 2003) while Kettlitz et al.
(2000) achieved a RS content of more than 55 % by producing an acid-thinned, enzymatically
debranched, spray-dried starch product. This gives the impression that pressure-gelatinisation
is not an effective method for the production of RS-rich starches considering the RS yields
obtained. However, using wheat starch for the enhancement of RS content, the thermal
gelatinisation did not appear superior to pressure-gelatinisation as can be seen in table 4.6.
Tab. 4.6. Resistant starch content of pressure-gelatinised wheat starch suspensions (5 % w/ w) after 192 h of different treatments (annealing at 52°C, storage at room temperature) in comparison to resistant starch contents of wheat starch suspensions yielded after thermal gelatinisation as stated in literature Pressure-gelatinised (192 h) RS [%] Continuous annealing 7.74 Pressure-storage-cycle 5.14 Pressure-annealing-cycle 11.52 Acid hydrolysed, pressure-annealing-cycle 12.08 Enzyme hydrolysed, pressure-annealing-cycle 10.22 Heat-gelatinised Boiling, autoclaving (1 h), cooling, freeze-drying (Siljeström et al., 1989) 6.20 Autoclaving (1 h) once; cooling (1 h), boiling (30 min), 3 cyclesn (Björck et al., 1987) 7.80 Autoclaving (1 h), cooling, freeze-drying (Sievert & Pomeranz, 1989) 7.80 Autoclaving (1 h), overnight at 4°C, 2 cycles(defatted) (Eerlingen et al., 1994) 9.00 Autoclaving (1 h), 5000 min at 100°C (Eerlingen et al., 1993a) >10.00 Autoclaving (45 min), 24 h at 4°C, 5 cycles (Berry, 1986) 15.00
Results and discussion
88
As stated in literature, the yields in RS obtained by thermal gelatinisation of wheat
starches ranged between 6.2 and 15 %, whereas RS yields obtained after pressure-induced
gelatinisation ranged between 5.14 and 12.08 %. Champ (1992) observed in an
interlaboratory study that the method by Berry (1986) resulted in higher RS contents for
cereal products in comparison to other determination methods. Consequently, the 15 % RS
produced by Berry (1986) might be slightly inflated. Thus, the pressure-induced gelatinisation
of starches produced comparable yields in RS at conditions optimised for pressure-gelatinised
wheat starches. Further studies of the impact of high hydrostatic pressure treatment on the RS
content of other starches, especially of high amylose starches, is required to confirm this
observation for starches in general.
Although the pressure treatment of wheat starches does not appear to provide
advantages regarding RS production in comparison to heat treated wheat starches, the
resulting physico-chemical properties of the pressure-treated starch suspensions differ and
thus offer opportunities for the development of novel food products with a supplementarily
enhanced RS content. In contrast to thermal processing, high hydrostatic pressure treatment of
starch suspensions leads to e.g. a limited retrogradation and a limited expansion of molten
granules under pressure (Douzals et al., 1998) and differing paste/ gel properties with lower
viscosity and higher storage moduli (Stolt et al., 2001). Therefore, products richer in starch
but with the same viscosity can be obtained by high pressure treatment. Additionally, high
pressure processing enables control of a desired degree of crystallinity by modulating process
parameters such as pressure, temperature, water content and treatment time (Douzals et al.,
1998; see chapter 4.4 and 4.5).
4.7 Impact of pressurised wheat starch on bread
The influence of pressure-gelatinised wheat starch replacing 5 % (w/ w) of the flour in
bread dough on the firmness and elasticity of the bread texture upon storage for one and five
days was investigated. Since it was stated in literature that high hydrostatic pressure treated
starches exhibited a slower retrogradation compared to thermally treated starches (Ezaki &
Hayashi, 1992; Douzals et al., 1998), it was aimed to obtain bread with better storage
properties in terms of ageing. This was affirmed by a patent specification (Codovilli, 2004)
proprietary of the manufacturer of pasta and bakery products Barilla, where it was claimed
Results and discussion
89
that a replacement of 2-20 %, advantageously 5-10 %, high pressure treated starch (300-700
MPa, preferably 550-650 MPa, for 5-15 min) for flour resulted in a by at least 20 % decreased
hardness measured after 30 days of storage in comparison to the reference bread without
pressure treated starch.
Fig. 4.40. Wheat bread with 5 % high pressure (HP) treated wheat starch (5 g/ 100 g flour) and reference wheat bread without pressurised starch after one day of storage.
However, it is unusual to determine textural properties of bread after a storage time as
long as 30 days, since wheat bread is supposed to be consumed within approx. 3 days after
baking. Additionally, contradictory statements concerning the retrogradation behaviour of
pressurised starches could be found in literature. Stute et al. (1996) and Katopo et al. (2002)
observed an additional DSC peak upon pressurisation of starches, which Stute et al. (1996)
attributed to rapid retrogradation, and Katopo et al. (2002) concluded the peak to be an
indication for the formation of B-type crystals out of A-type crystallinity due to the pressure
treatment. Stolt et al. (2001) observed comparable retrogradation behaviour of heat-induced
and pressure-induced starch gels. Except for the patent specification (Codovilli, 2004), all
investigations regarding the retrogradation behaviour of pressure treated starches were
Reference HP starch
Results and discussion
90
performed on mere starch suspensions without further treatment steps such as mixing or
baking and without any solutes or acids such as sugar, salt and ascorbic acid. According to the
patent specification mentioned before, the effect of pressure gelatinised wheat starch
suspensions replacing flour (and water) on hardness and elasticity of bread was examined.
The baking as well as the subsequent texture measurements of the breads were performed in
the laboratory of food technology I at the University of Applied Sciences TFH Berlin, from
where also the standard recipe and the baking procedure had been adopted. The baking
temperature was chosen at 210°C according to the patent specification. Firmness and
elasticity of the bread crumbs were determined after one and five days of storage at room
temperature in a sealed plastic bag.
Generally, the pressurised starch containing breads had roughly the same size as the
reference breads, only one was slightly smaller as can be seen exemplary in figure 4.40. The
appearance of the breads as well as the crumb structure of the slices exhibited no visible
discrepancies.
0
200
400
600
800
1000
1200
1 day storage 5 days storage
Firm
ness
[g]
reference
with starch
Fig. 4.41. Firmness of wheat bread baked after a standard recipe (reference) and after a standard recipe but with 5 % of the wheat flour replaced by high pressure treated wheat starch (10 % suspension, 15 min, 600 MPa).
0,50
0,55
0,60
0,65
0,70
0,75
0,80
1 day storage 5 days storage
Ela
stic
ity [m
m²/m
m²]
reference
with starch
Fig. 4.42. Elasticity of wheat bread baked after a standard recipe (reference) and after a standard recipe but with 5 % of the wheat flour replaced by high pressure treated wheat starch (10 % suspension, 15 min, 600 MPa).
The firmness of the bread crumbs of the reference bread and of the bread containing
pressure-gelatinised starch after one and five days of storage at room temperature is depicted
Results and discussion
91
in the column chart in figure 4.41. The firmness was derived from the height of the first peak
of the texture analysis (see appendix fig. A2).
In general, it can be concluded that the firmness of all breads increased after five days
of storage with respect to one day of storage. One day after baking, the bread containing
pressurised starch and the reference bread exhibited no difference in firmness. However, there
appeared to be a trend that the bread containing pressurised wheat starch revealed a slightly
higher firmness than the reference bread after one day of storage if the column heights were
compared. This trend consisted five days after baking, where the mean firmness of
pressurised starch containing bread was visibly higher than the mean firmness of the reference
bread. Since the standards deviations of the measurements overlapped however, no clear
statement can be made regarding the influence of pressure gelatinised starch on the firmness
of bread crumbs.
The elasticity of the bread crumbs of the reference sample and of the bread containing
pressure-gelatinised starch after one and five days of storage at room temperature is depicted
in the column chart in figure 4.42. The elasticity was obtained from the ratio of the second
peak area over the first peak area of the texture analysis (see appendix fig. A2).
Comparing the elasticity of the crumbs one and five days after baking, a decrease in
elasticity can be observed with increasing storage time. After one day of storage, the
elasticities of the bread containing pressurised starch and the reference bread showed no
differences. In accordance with the firmness of the crumbs, there appeared to be a trend that
the bread containing pressurised wheat starch revealed a somewhat lower elasticity than the
reference bread after one day of storage if the column heights were compared. This trend
enhanced five days after baking, where the average elasticity of pressurised starch containing
bread was visibly lower than the average elasticity of the reference bread. Since the deviations
of the measurements overlapped however, no explicit statement can be made regarding the
influence of pressure gelatinised starch on the elasticity of bread crumbs at the conditions
applied.
Recapitulatorily, it can be said that the expected reducing effect of pressurised starch
on staling of bread and starch retrogradation as expressed by firmness and elasticity was not
observed and the results of the patent specification (Codovilli, 2004) could not be confirmed.
On the contrary, the firmness of the bread crumb showed an increasing trend for pressurised
starch containing bread whereas the elasticity exhibited a decreasing trend. One reason for
Results and discussion
92
this could be the lower content of flour ingredients besides starch such as wheat protein and
pentosans due to a replacement of wheat flour by mere starch. Wheat proteins and pentosans
have a high influence on bread quality e.g. pentosans cause better crumb properties and
increased freshness (Ternes, 1994). However, Ottenhof and Farhat (2004) found no evidence
for significant effects of gluten on amylopectin retrogradation, so a decreased gluten content
should not alter the bread firmness. On the other hand it is assumed that bread firmness
development and starch recrystallisation, although being related are separate events, because
bread firmness was not determined by the total amount of crystalline fraction but the the type
of crystallites formed (Osella et al., 2005). Since an increase in B-crystallites in relation to V-
crystallites enhanced bread firmness (Osella et al., 2005) and A-type crystals underwent a
transformation to B-type crystals upon pressurisation (Hibi et al., 1993; Katopo et al., 2002),
it is therefore possible, that pressurised starch granules promote bread firmness.
Another possibility could be that the pressurised, swollen starch granules are disrupted
during the mixing process leading to free amylose and amylopectin in the dough. Once
released from the granular containment, the starch molecules might tend to retrogradation and
thus increase the firmness and decrease the elasticity of the bread crumb.
Conclusions
93
5 CONCLUSIONS
With the development of the HPDS high pressure cell in combination with an inverse
microscope it was possible to obtain in situ images with both high optical resolution and high
quality up to pressures of 300 MPa. The maximum pressure of 300 MPa was not sufficient
enough to observe swelling of potato and tapioca starch granules whereas wheat starch
granules showed a thorough swelling of most granules during pressurisation. Further
development is required to enable in situ microscopic observations at higher pressures.
A pressure treatment of potassium iodide-iodine stained wheat starch and tapioca
starch suspensions resulted in a complete decolouration of the starch granules while
pressurised potato starch granules discoloured only slightly. The decolouration was regarded
as a cause of dilution due to water uptake as well as a possible amylose release from the
amorphous regions in the process of pressure-induced starch gelatinisation where released
amylose molecules formed complexes with iodine pushed out of the single helices by pressure
and the complexes formed accumulated in the darkening liquid phase. More data derived from
complementary analysis methods is required for explaining these experimental results.
The electrical conductivity of starch suspensions increased with increasing pressure
which suggested an ion release during pressure-induced starch gelatinisation as well as an ion
concentrating effect due to water uptake of the starch granules. Since the starch granules
maintained their granular form, it was still uncertain if there was a release of ions during
pressurisation or after pressure release. This needs to be clarified in future investigations.
There was a good linear relationship between the degree of gelatinisation and the
electrical conductivity data for all three starches investigated. Since the electrical conductivity
of wheat, tapioca and potato starch suspensions correlated well with the degree of
gelatinisation of the starches after pressure treatment it could be applied as a tool for the quick
and simple determination of pressure-induced starch gelatinisation. The same was valid for
the degree of gelatinisation and the water binding capacity of pressurised starch suspensions.
Online-measurements of the electrical conductivity during a pressure treatment need to
be developed and performed in order to ascertain if this method could be applicable for in situ
monitoring and controlling the degree of gelatinisation obtained after a pressurisation step.
It was shown that pressure-induced starch gelatinisation was highly sensitive to
changes in temperature, pressure and treatment time. The degree of gelatinisation of all three
Conclusions
94
starches examined increased with increasing temperature, pressure and treatment time. Hence,
an application as an extrinsic PTTI seems possible. A major benefit of pressure-induced
starch gelatinisation is the variation of pressure sensitivity depending on the type of starch.
Starches can be systematically selected that gelatinise over a pressure range at the temperature
and treatment time applied in the high hydrostatic pressure process that reflects the pressure
range requested for ensuring process efficiency and safety. Furthermore, they can easily be
encapsulated within the packaging material and thus provide, in conjunction with a colour
indicator, a simple tool for the monitoring of high pressure processing conditions.
Additionally, it can be concluded that in general the effects of salts and sugars on
starch gelatinisation were comparable for thermal and pressure treatments. However, the
extent of influence of salts on pressure-induced starch gelatinisation seems to be dependent on
the type of starch. Potato starch, although the most pressure resistant, appears to be the most
susceptible to salts and gelatinises at lower salt concentrations under pressure in comparison
to wheat and tapioca starches at the pressures applied. At high concentrations (> 2 M) the
impact of chlorides on pressure-induced starch gelatinisation followed the order
Na<K<Li<Ca, which corresponds to the order of the Hofmeister series. At concentrations
above 1 M the effect of potassium salts on pressure-induced starch gelatinisation upon
pressurisation also followed the order of the lyotropic series (Cl<Br<I<SCN). The
gelatinisation pressure is increased by sugars and the degree of gelatinisation is linearly
correlated with the number of equatorial hydroxyl groups. Since pressure-induced starch
gelatinisation is strongly dependent on the water content and is decreased in the presence of
sugars and water structure making ions (e.g. SO42-) and increased by water structure breaking
ions such as SCN-, it is suggested that the availability of free water is crucial for starch
gelatinisation under pressure.
Heat and pressure-gelatinised wheat starch suspensions exhibited differing resistant
starch (RS) formation behaviours as expressed in e.g. optimum storage temperature and
treatment steps such as enzyme hydrolysis not having improved the RS yield of pressure-
gelatinised starch as seen for heat treated starches. This proves the differences in
gelatinisation processes. It can be concluded that a RS enhancement after high hydrostatic
pressure treatment is achievable, since RS yields of approx. 12 % were obtained. In
comparison to patented RS formation via enzyme degradation subsequent to thermal
gelatinisation yielding an RS content of above 55 % (Kettlitz et al., 2000), pressure treatment
Conclusions
95
did not appear to be beneficial for the production of high amounts of RS. However, in
comparison to heat gelatinised wheat starch, the RS yields achieved after pressure-induced
gelatinisation were in the same range. This is an indication that high hydrostatic pressure-
induced gelatinisation might well be used as an alternative for the production of high amounts
of RS, though there is apparently no advantage in RS production from wheat starch by means
of high pressure gelatinisation.
Further research should involve the influence of high pressure on high amylose
starches and starches of different origins, pressure-temperature combinations above 66°C,
enzymatic treatments during pressurisation, and the resistant starch formation due to long-
time-pressurisation as suggested by Hayashi and Hayashida (1989).
Investigating the impact of pressure gelatinised wheat starch replacing 5 % of the flour on the
storage stability of wheat bread no definite statement can be made. The expected
improvements of the textural properties and the shelf life of the bread could not be detected.
However, a trend towards a decrease in elasticity and increase in firmness of pressurised
starch containing bread could be observed after five days of storage. This leads to the
conclusion that pressurised wheat starch does not reduce retrogradation but shows a trend
towards enhanced deterioration of quality in terms of textural attributes.
It can be concluded that pressure-induced starch gelatinisation offers a lot of potential
for the development of novel food properties due to its differing physical and textural
properties in comparison to heat-induced gelatinisation. More research is required to fully
comprehend the differences in thermal and pressure-induced gelatinisation mechanisms in
order to make use of the advantages of pressure-gelatinised starches for industrial products.
References
96
REFERENCES
Ahmad, F.B. and Williams, P.A. (1999). Effect of sugars on the thermal and rheological
properties of sago starch. Biopolymers 50, 401-412.
Asp, N.-G. (1992). Resistant starch proceedings from the second plenary meeting of
EURESTA: European FLAIR concerted action No. 11 on physiological implications of
the consumption of resistant starch in man. Eur. J. Clin. Nutr. 46 (Suppl. 2), 1.
Asp, N.-G., Tovar, J., and Bairoliya, S. (1992). Determination of resistant starch in vitro with
three different methods, and in vivo with a rat model. Eur. J. Clin. Nutr. 46 (Suppl. 2),
117-119.
Atwell, W.A., Hood, L.F., Lineback, D.R., Varriano-Marston, E., and Zobel, H.F. (1988). The
terminology and methodology associated with basic starch phenomena. Cereal Foods
World 33 (3), 306-311.
Baek, M.H., Yoo, B., and Lim, S.-T. (2004). Effects of sugars and sugar alcohols on thermal
transition and cold stability of corn starch gel. Food Hydrocoll. 18, 133-142.
Banks, W. and Muir, D.D. (1980). Structure and chemistry of the starch granule. In: J. Preiss.
The biochemistry of plants Vol. 3 (pp. 321-369). Academic Press, New York, New
York.
Begg, D.A., Salmon, E.D., and Hyatt, H.A. (1983). The changes in structural organization of
actin in the sea urchin egg cortex in response to hydrostatic pressure. J. Cell Biology 97
(6), 1795-1805.
Behall, K.M. and Howe, J.C. (1996). Resistant starch energy. J. Am. College Nutr. 15 (3),
248-254.
References
97
Beleia, A., Miller, R.A., and Hoseney, R.C. (1996). Starch gelatinization in sugar solutions.
Starch/ Stärke 48, 259-262.
Belitz, H.-D., Grosch, W., and Schieberle, P. (2001). Lehrbuch der Lebensmittelchemie.
Springer Verlag, Berlin.
Bello-Pérez, L.A. and Paredes-López, O. (1995). Starch and amylopectin: effect of solutes on
their calorimetric behavior. Food Chem. 53, 243-247.
Berry, C.S. (1986). Resistant starch: formation and measurement of starch that survives
exhaustive digestion with amylolytic enzymes during the determination of dietary fibre.
J. Cereal Sci. 4, 301-314.
Berry, C.S., l`Anson, K., Miles, M.J., Morris, V.J., and Russell, P.L. (1988). Physical
chemical characterisation of resistant starch from wheat. J. Cereal Sci. 8, 203-206.
Björck, I., Nyman, M., Pedersen, B., Siljeström, M., Asp, N.-G., and Eggum, B.O. (1987).
Formation of enzyme resistant starch during autoclaving of wheat starch: studies in
vitro and in vivo. J. Cereal Sci. 6, 159-172.
Blanshard, J.M.V. (1987). Starch granule structure and function: a physicochemical approach.
In: T. Galliard. Starch: properties and potential (pp.16-54). John Wiley and Sons,
Chichester, Great Britain.
Brabender (2000). Starch measurement with the BRABENDER® Viscograph family.
http://www.brabender.com/89.0.html (14.09.2004).
Bridgman, P.W. (1914). The coagulation of albumen by pressure. J. Biol. Chem. 19, 511-512.
Brouns, F., Kettlitz, B., and Arrigoni, E. (2002). Resistant starch and “the butyrate
Methods in carbohydrate chemistry (pp. 240-242). Academic Press, New York and
London.
Watzl, B. and Leitzmann, C. (1999). Bioaktive Substanzen in Lebensmitteln. Hippokrates
Verlag GmbH, Stuttgart.
Wootton, M. and Ho, P. (1999). Alkali gelatinisation of wheat starch. Starch/ Stärke 41, 261-
265.
References
112
Yen, G.-C. and Lin, H.-T. (1996). Comparison of high pressure treatment and thermal
pasteurization effects on the quality and shelf life of guava puree. Int. J. Food Sci. &
Technol. 31, 205-213.
Yook, C., Sosulski, F., and Bhirud, P.R. (1994). Effects of cationization on functional
properties of pea and corn starches. Starch/ Stärke 46, 393-399.
Zobel, H.F. (1964). X-ray analysis of starch granules. In: R.L. Whistler. Methods in
carbohydrate chemistry (pp. 109-113). Academic Press, New York and London.
Zobel, H.F. (1984). Gelatinization of starch and mechanical properties of starch pastes. In:
R.L. Whistler, J.N. Bemiller, and E.F. Paschall. Starch: chemistry and technology (pp.
285-309). Academic Press, Inc., Orlando, Florida.
Zobel, H.F. (1988). Starch crystal transformation and their industrial importance. Starch/
Stärke 40 (1), 1-7.
Appendix
113
APPENDIX
Tab. A1. Peak temperatures, inflexion points, and mass loss of DSC, TG, and DTG analyses of dry, native wheat, tapioca, and potato starches under anaerobic conditions at a heating rate of 10°K/ min in a temperature range from 0°C to 450°C DSC curve Wheat starch Tapioca starch Potato starch Onset T [°C] 55.3 20.5 46.5 Peak T [°C] 114.4 109.6 120.5 Offset T [°C] 153.1 265.6 178.2 Onset T [°C] 262.6 265.6 253.0 Peak T [°C] 286.5 281.0 276.5 Peak T [°C] 294.9 290.2 280.5 Peak T [°C] 304.0 304.2 286.0 Peak T [°C] 310.3 315.2 - Offset T [°C] 320.1 332.8 314.0 TG curve Inflexion point [°C] 308.9 313.8 303.2 mass loss [%] 77.35 81.11 71.68 DTG curve Onset T [°C] 293.0 289.7 285.5 Peak T [°C] 308.7 312.8 303.1 Offset T [°C] 319.4 331.7 314.1
Appendix
114
Fig. A1. DSC, TG, and DTG curves of dry, native tapioca starch under anaerobic conditions at a heating rate of 10 °K/min in a temperature range from 0°C to 450°C.
Appendix
115
Fig. A2. Exemplary texture analysis diagram of bread containing pressurised wheat starch suspension after one day of storage.
116
SUMMARY
The impact of high hydrostatic pressure on wheat, tapioca, and potato starch
suspensions at different pressures, temperatures and treatment times was investigated. The
degree of gelatinisation as well as the electrical conductivity and the water binding capacity of
the suspensions increased with increasing pressure and with increasing treatment time. The
gelatinisation curves obtained with increasing pressure resembled sigmoid curves
characteristic for thermal gelatinisation. The gelatinisation pressure of the three starches
examined differed. Potato starch exhibited the highest pressure resistance, followed by
tapioca and wheat starch. This was attributed to the crystalline structure of the starches.
Due to its sensitivity to pressure, temperature, and pressurisation time, it was
suggested that starch could function as a pressure time temperature integrator (PTTI) in
pressurisation processes. Additionally, the electrical conductivity was identified as a
convenient tool for the quick measurement of pressure-induced starch gelatinisation.
Pressure treatment up to 300 MPa in a high pressure cell under a microscope enabled
in situ observation of swelling of wheat starch granules during pressurisation without granule
disintegration. This proved that the water uptake of the granules is associated with a volume
decrease of the suspension and also emphasised the differing gelatinisation process under heat
and under pressure. For tapioca and potato starches, 300 MPa was not sufficient to monitor
any visible changes in volume. The starch suspensions were also stained with Lugol`s
solution and a decolouration was observed upon pressurisation for 1 h at 300 MPa. This
decolouration was the most pronounced for wheat starch granules, but also observable for
tapioca and potato starch granules.
The effect of water content as well as sugars and salts on pressure-induced starch
gelatinisation was also investigated. Generally, similar effects compared to thermal starch
gelatinisation in the presence of sugars and salts were found. The gelatinisation pressure was
increased by sugars and the degree of gelatinisation was linearly correlated with the number
of equatorial hydroxyl groups of the sugars. Pressure-induced starch gelatinisation was
strongly dependent on the water content of the starch suspension and the degree of
gelatinisation was decreased in the presence of sugars and water structure making ions (e.g.
SO42-) and increased by water structure breaking ions such as SCN-. Therefore, the
availability of free water was crucial for starch gelatinisation under pressure. The extent of
influence of salts on pressure-induced starch gelatinisation was dependent on the type of
starch and regardless of the pressure sensitivity of the starch. At high salt concentrations (> 2
117
M), the impact of chlorides on pressure-induced starch gelatinisation of all three starches
examined followed the order Na<K<Li<Ca, which corresponds to the order of the Hofmeister
series. And at concentrations above 1 M, the effect of potassium salts on pressure-induced
starch gelatinisation upon pressurisation also followed the order of the lyotropic series
(Cl<Br<I<SCN).
Since functional food ingredients are becoming increasingly important, it was aimed to
develop a process for resistant starch (RS) production from wheat starch including high
hydrostatic pressure treatment. Of all treatment steps and combinations explored, acid
hydrolysis of pressurised wheat starch prior to 192 h of pressure-annealing cycles resulted in
the highest RS yield with 12.08 %. High pressure-induced starch gelatinisation did not prove
to be superior to heat-induced gelatinsation for the production of RS from wheat starch.
However, the RS yields obtained were in the same range as yields from heat-gelatinised
wheat starches as stated in the literature.
In accordance with a patent (Codovilli, 2004) where it was claimed that pressurised
starch suspensions replacing part of the flour in a wheat bread dough enhanced storage
properties of bread in terms of ageing, 5 % of the flour in a wheat bread was replaced by
pressure-gelatinised wheat starch. The elasticity and hardness of the baked breads were
determined after one and five days of storage. The expected improvement of storage
properties could not be confirmed, on the contrary a trend towards increased firmness and
decreased elasticity of the bread was obtained.
It can be concluded that pressure-induced starch gelatinisation offers a lot of potential
for the development of novel food properties due to its differing physical and textural
properties in comparison to heat-induced gelatinisation. More research is required to fully
comprehend the differences between temperature-induced and pressure-induced gelatinisation
mechanisms in order to take optimum advantages of pressure-induced starch gelatinisation for
industrial products.
118
ZUSAMMENFASSUNG
Der Einfluss von hohem hydrostatischem Druck auf Weizen-, Tapioka- und
Kartoffelstärke bei verschiedenen Drücken, Temperaturen und Behandlungszeiten wurden
untersucht. Der Verkleisterungsgrad, die elektrische Leitfähigkeit und die
Wasserbindekapazität der Stärkesuspensionen erhöhten sich mit steigendem Druck und
steigender Behandlungsdauer. Die erhaltenen Verkleisterungskurven mit steigendem Druck
ähnelten dem sigmoiden Verlauf, der charakteristisch für die thermische Verkleisterung ist.
Der Verkleisterungsdruck der drei untersuchten Stärken war verschieden. Kartoffelstärke wies
die höchste Druckresistenz auf, gefolgt von Tapioka- und Weizenstärke. Dies wurde auf die
kristalline Struktur der Stärken zurückgeführt.
Aufgrund ihrer Empfindlichkeit gegenüber Druck, Temperatur und Druckhaltezeit
wurde vorgeschlagen, Stärke als Druck-Temperatur-Zeit-Integrator (PTTI) in Druckprozessen
einzusetzen. Zusätzlich wurde die elektrische Leitfähigkeit als ein effektives Medium für die
schnelle Messung des Verkleisterungsgrades aufgezeigt.
Druckbehandlungen bis 300 MPa in einer Hochdruckzelle unter einem Mikroskop
ermöglichten in situ-Beobachtung von Quellung von Weizenstärkekörnern ohne
Desintegration während einer Druckbehandlung. Dies bewies, dass eine Wasseraufnahme der
Körner mit einer Volumenabnahme der Suspension verbunden ist, und bestärkte den
Unterschied zwischen thermischem und druckinduziertem Verkleisterungsprozess. Für
Tapioka- und Kartoffelstärken waren 300 MPa nicht ausreichend, um sichtbare
Volumenveränderungen zu detektieren. Die Stärkesuspensionen wurden zusätzlich mit
Lugol´scher Lösung angefärbt, und eine Entfärbung konnte nach einer Druckbehandlung für
eine Stunde bei 300 MPa erfasst werden. Diese Entfärbung war für Weizenstärkekörner am
deutlichsten, aber auch für Tapioka- und Kartoffelstärkekörner zu beobachten.
Auch der Einfluss vom Wassergehalt der Stärkesuspensionen, von Salzen und Zuckern
auf die druckinduzierte Verkleisterung wurde ermittelt. Grundsätzlich wurden in der
Anwesenheit von Salzen und Zuckern ähnliche Effekte wie bei der thermischen
Stärkeverkleisterung gefunden. Der Verkleisterungsdruck stieg in der Gegenwart von
Zuckern, und der Verkleisterungsgrad korrelierte linear mit der Anzahl der äquatorialen
Hydroxyl-Gruppen der Zucker. Druckinduzierte Stärkeverkleisterung hing stark vom
Wassergehalt der Stärkesuspensionen ab, und der Verkleisterungsgrad sank in der Gegenwart
von Zuckern und Wasserstruktur gebenden Ionen (z.B. SO42-) und stieg in der Anwesenheit
von Wasserstruktur zerstörenden Ionen (z.B. SCN-). Demzufolge war die Verfügbarkeit an
119
freiem Wasser entscheidend für die Verkleisterung von Stärke unter hydrostatischem Druck.
Das Ausmaß des Einflusses von Salzen auf die druckinduzierte Stärkeverkleisterung hing von
der Stärkesorte ab und war unabhängig von deren Druckresistenz. Bei hohen
Salzkonzentrationen (> 2 M) folgte der Effekt von Chloriden auf die Druckverkleisterung von
allen drei untersuchten Stärken der Reihenfolge Na<K<Li<Ca, was der Reihenfolge der
Hofmeister-Reihe entspricht. Und bei Konzentrationen über 1M folgte der Effekt von
Kaliumsalzen auf die Druckverkleisterung auch der Reihenfolge der Hofmeister-Reihe
(Cl<BR<I<SCN).
Da funktionelle Lebensmittelinhaltsstoffe mehr und mehr in den Vordergrund rücken,
wurde angestrebt, einen Herstellungsprozess von resistenter Stärke (RS) aus Weizenstärke zu
entwickeln, der einen Hochdruckbehandlungsschritt einschließt. Von allen getesteten
Behandlungsschritten und - kombinationen ergab eine Säurehydrolyse hochdruckbehandelter
Stärke gefolgt von 192 h Druck-Temper-Zyklen den höchsten Ertrag an RS mit 12.08 %.
Hochdruck hat sich damit gegenüber der thermischen Behandlung zur Produktion von RS aus
Weizenstärke nicht als überlegen erwiesen, allerdings befanden sich die Ausbeuten an RS aus
thermisch verkleisterter Weizenstärke, wie in der Literatur beschrieben, in derselben
Größenordnung.
In Anlehnung an ein Patent (Codovilli, 2004), das beansprucht, dass durch den Einsatz
von druckbehandelten Weizenstärke, die einen Teil des Mehls in Weizenbrotteig ersetzt, die
Alterungseigenschaften von Brot verbessert werden, wurden 5 % des Mehls in Brotteig durch
hochdruckbehandelte Weizenstärke ersetzt, und die Elastizität und die Festigkeit der
gebackenen Brote nach einem und fünf Tagen Lagerung bestimmt. Die erwartete
Verbesserung der Lagerungseigenschaften konnte nicht bestätigt werden, im Gegenteil, ein
Trend zu erhöhter Festigkeit und sinkender Elastizität des Brotes wurde festgestellt.
Es kann geschlussfolgert werden, dass druckinduzierte Verkleisterung viel Potential
für die Entwicklung neuartiger Lebensmitteleigenschaften aufgrund abweichender
physikalischer und struktureller Eigenschaften im Vergleich zu thermisch induzierter
Verkleisterung bietet. Um die Unterschiede der Mechanismen von temperaturinduzierter und
druckinduzierter Verkleisterung voll zu verstehen, ist zusätzliche Forschung notwendig, damit
die Vorteile der druckinduzierten Stärkeverkleisterung für industrielle Produkte ausgenutzt
werden können.
120
LIST OF PUBLICATIONS
Bauer, B.A. and Knorr, D. (2004). Electrical conductivity: A new tool for the determination
of high hydrostatic pressure-induced starch gelatinisation. Innov. Food Sci. & Emerging
Technol. 5/4, 437-442.
Bauer, B.A., Hartmann, M., Sommer, K., and Knorr, D. (2004). Optical in-situ analysis of
starch granules under high pressure with a high pressure cell. Innov. Food Sci. & Emerging
Technol. 5, 293-298.
Bauer, B.A. and Knorr, D. (2005). The impact of pressure, temperature and treatment time on
starches: Pressure-induced starch gelatinisation as pressure time temperature indicator for
high hydrostatic pressure processing. J. Food. Eng. 68 (3), 329-334.
Bauer, B.A., Wiehle, T., and Knorr, D. (2005). Impact of high hydrostatic pressure treatment
on the resistant starch content of wheat starch. Starch/ Stärke 57 (3-4), 124-133.
Rumpold, B.A. and Knorr, D. (2005). Effect of salts and sugars on pressure-induced starch
gelatinisation of wheat, tapioca and potato starches. Starch/ Stärke 57 (8), 370-377.
Ananta, E., Bauer, B.A., Volkert, M., and Knorr, D. (2005). Sprühtrocknung von
probiotischen Bakterien. Deutsche Molkerei Zeitung 2, 32-35.