31
25/03/2013 IMPACT OF HYBRID STRATEGY ON TAIL PIPE EMISSIONS PSA PEUGEOT-CITROEN

25/03/2013
IMPACT OF HYBRID STRATEGY ON TAIL PIPE EMISSIONSPSA PEUGEOT-CITROEN

2
INTRODUCTION
BACKGROUND THEORY
IMPACT OF HYBRID STRATEGY ON EMISSION
CONCLUSION
SUMMARY

Thermo-chemical simulation of an after-treatment system
Functional conception constraints:
Take into account the thermal phenomena
Take into account the chemical phenomena
Reduce calculation time
Compatibility for both gasoline and Diesel engines
Immediate gains expected :
Rapid evaluation of emissions systems in terms of after-treatment without using prototypes (different geometrical and chemical configurations)
Targets:
Acceleration of the conception & validation process of an emissions systems
Investigation of new after-treatment technologies
Points of vigilance:
Model limitation: The model is precise for certain conditions
Engine start and shut-off
3
INTRODUCTION

GT-SUITE users conference 2013 – France
Study of after-treatment system validation
Simulation � DOC
Phenomena taken into account
• Thermal
• Chemical
Model calibration on WLTP drive cycle
Model validation on NEDC drive cycle
Results
• Thermal
• Chemical
Impact of hybrid strategy on emissions
4
INTRODUCTION

5
Drive Cycles : NEDC and WLTP (partial)
Constant convection coefficientSCR FAP
DO
C
Thermal simulation - Exhaust temperature after catalyst

0 200 400 600 800 1000 1200 1400 1600 1800Time (s)
6
Drive Cycles : NEDC and WLTP (partial)
Constant convection coefficient
SIMULATIONTEST
INPUT DATA
WLTPNEDC
Vitesse véhicule
0
20
40
60
80
100
120
140
160
0 200 400 600 800 1000 1200 1400 1600 1800 2000
Temps (s)
Vitesse (km/h)
SCR FAP
DO
C
NEDC
WLTP
3,42 % 2,31 %
Thermal simulation - Exhaust temperature after catalyst

Drive Cycles : NEDC and WLTP (partial)
Constant convection coefficient
Pollutants simulated CO, C3H6, C3H8, NO et NO2
7
SCR FAP
DO
C
WLTPNEDC
Vitesse véhicule
0
20
40
60
80
100
120
140
160
0 200 400 600 800 1000 1200 1400 1600 1800 2000
Temps (s)
Vitesse (km/h)
0 200 400 600 800 1000Time (s)
NEDC
SIMULATIONTEST
INPUT DATA
CHEMICAL SIMULATION - CO

0 200 400 600 800 1000 1200 1400 1600 1800Time (s)
Drive Cycles : NEDC and WLTP (partial)
Constant convection coefficient
Pollutants simulated CO, C3H6, C3H8, NO et NO2
8
SCR FAP
DO
C
WLTPNEDC
Vitesse véhicule
0
20
40
60
80
100
120
140
160
0 200 400 600 800 1000 1200 1400 1600 1800 2000
Temps (s)
Vitesse (km/h)
WLTP
SIMULATIONTEST
INPUT DATA
CHEMICAL SIMULATION - CO

Drive Cycles : NEDC and WLTP (partial)
Constant convection coefficient
Pollutants simulated CO, C3H6, C3H8, NO et NO2
9
SCR FAP
DO
C
WLTPNEDC
Vitesse véhicule
0
20
40
60
80
100
120
140
160
0 200 400 600 800 1000 1200 1400 1600 1800 2000
Temps (s)
Vitesse (km/h)
0 200 400 600 800 1000Time (s)
NEDC
0 200 400 600 800 1000 1200 1400 1600 1800Time (s)
WLTP
16,10 %8,86 %
SIMULATIONTEST
INPUT DATA
CHEMICAL SIMULATION - CO

10
Drive Cycles : NEDC and WLTP (partial)
Constant convection coefficient
Pollutants simulated CO, C3H6, C3H8, NO et NO2
WLTPNEDC
Vitesse véhicule
0
20
40
60
80
100
120
140
160
0 200 400 600 800 1000 1200 1400 1600 1800 2000
Temps (s)
Vitesse (km/h)
SCR FAP
DO
C
0 200 400 600 800 1000Time (s)
NEDC
CHEMICAL SIMULATION - HC
SIMULATIONTEST
INPUT DATA

11
Drive Cycles : NEDC and WLTP (partial)
Constant convection coefficient
Pollutants simulated CO, C3H6, C3H8, NO et NO2
WLTPNEDC
Vitesse véhicule
0
20
40
60
80
100
120
140
160
0 200 400 600 800 1000 1200 1400 1600 1800 2000
Temps (s)
Vitesse (km/h)
SCR FAP
DO
C
0 200 400 600 800 1000 1200 1400 1600 1800Time (s)
WLTP
CHEMICAL SIMULATION - HC
SIMULATIONTEST
INPUT DATA

12
Drive Cycles : NEDC and WLTP (partial)
Constant convection coefficient
Pollutants simulated CO, C3H6, C3H8, NO et NO2
WLTPNEDC
Vitesse véhicule
0
20
40
60
80
100
120
140
160
0 200 400 600 800 1000 1200 1400 1600 1800 2000
Temps (s)
Vitesse (km/h)
SCR FAP
DO
C
0 200 400 600 800 1000Time (s)
NEDC
0 200 400 600 800 1000 1200 1400 1600 1800Time (s)
WLTP
20,5 %7,4 %
CHEMICAL SIMULATION - HC
SIMULATIONTEST
INPUT DATA

13
Drive Cycles : NEDC and WLTP (partial)
Constant convection coefficient
Pollutants simulated CO, C3H6, C3H8, NO et NO2
WLTPNEDC
Vitesse véhicule
0
20
40
60
80
100
120
140
160
0 200 400 600 800 1000 1200 1400 1600 1800 2000
Temps (s)
Vitesse (km/h)
SCR FAP
DO
C
0 200 400 600 800 1000Time (s) 0 200 400 600 800 1000 1200 1400 1600 1800Time (s)
NEDCWLTP
5,95 % 8,26 %
CHEMICAL SIMULATION - NO
SIMULATIONTEST
INPUT DATA

14
Drive Cycles : NEDC and WLTP (partial)
Constant convection coefficient
Pollutants simulated CO, C3H6, C3H8, NO et NO2
WLTPNEDC
Vitesse véhicule
0
20
40
60
80
100
120
140
160
0 200 400 600 800 1000 1200 1400 1600 1800 2000
Temps (s)
Vitesse (km/h)
SCR FAP
DO
C
NEDC WLTP
49,38 %21,53 %
CHEMICAL SIMULATION - NO2
SIMULATIONTEST
INPUT DATA

15
Drive Cycles : NEDC and WLTP (partial)
Constant convection coefficient
Pollutants simulated CO, C3H6, C3H8, NO et NO2
WLTPNEDC
Vitesse véhicule
0
20
40
60
80
100
120
140
160
0 200 400 600 800 1000 1200 1400 1600 1800 2000
Temps (s)
Vitesse (km/h)
SCR FAP
DO
C
0 200 400 600 800 1000Time (s) 0 200 400 600 800 1000 1200 1400 1600 1800Temps (s)
NEDC WLTP
3,13 %3,63 %
CHEMICAL SIMULATION - NOx
SIMULATIONTEST
INPUT DATA

16
INTRODUCTION
BACKGROUND THEORY
IMPACT OF HYBRID STRATEGY ON EMISSION
CONCLUSION
SUMMARY

17
Automotive Catalyse
Catalyst :
Change the reaction speed without being consumed
Automotive Catalyse � Heterogeneous
Solid Phase : catalyst
Gaseous Phase : reactive
The catalyst is composed macroscopically
Brick catalytic in ceramic material
One or more insulator in alumina fiber
Canning in stainless steel
Microscopically:
Catalyst cells composed of a neutral Alumina washcoat (Al2O3)
The washcoat contains the precious metals (Platinum, Palladium, Rhodium). The precious metals loading is expressed in (g/ft3)
Zeolite for storage and adsorption of HC at cold conditions
Cerium for oxygen storage
BACKGROUND THEORY

18
POLLUTANTS CONVERSION
Pollutant conversion efficiency:
Me : Pollutant mass before catalyst
Ms : Pollutant mass after catalyst
Light-off temperature: Temperature which correspond to 50 % of pollutant conversion
Exhaust flow hypothesis
Exhaust flow temperature depends on the conduction, convection and radiation
Hypothesis of incompressible fluid
Quasi-static flow
Gasoline Catalyse
Three-way catalyst (CO/HC/NOx)
Optimum conversion rate at lambda 1
Diesel Catalyse
Diesel engine works at lambda > 1
Catalyst for oxidation (DOC : Diesel Oxide Catalyst)
Catalyst for reduction for NH3 (SCR : Selective Catalyst Reduction)
GAZ
SUBSTRAT
ISOLANT
CANNING
BACKGROUND THEORY

19
Three-way catalyst simulation
Chemical species concerned
CO, C3H6, C3H8, CO2, NO, O2, N2, H2, H2O
Global chemical simulation � 60 equations in average
Reactions of the TWC
CO + 1/2 O2 ���� CO2 (1)H2 + 1/2 O2 ���� H2O (2)C3H6 + 9/2 O2 ���� 3CO2 + 3H2O (3)C3H8 + 5 O2 ���� 3CO2 + 4H2O (4)CO + NO ���� CO2+ 1/2 N2 (5)
BACKGROUND THEORY
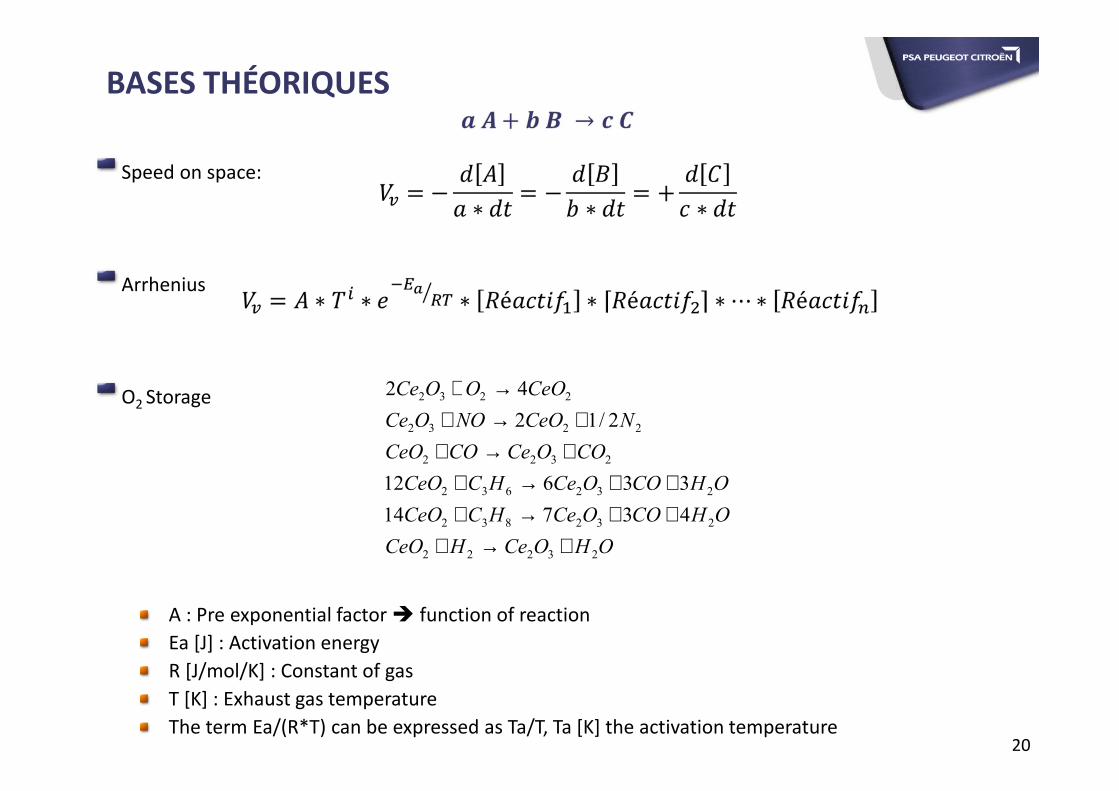
Speed on space:
Arrhenius
O2 Storage
A : Pre exponential factor � function of reaction
Ea [J] : Activation energy
R [J/mol/K] : Constant of gas
T [K] : Exhaust gas temperature
The term Ea/(R*T) can be expressed as Ta/T, Ta [K] the activation temperature20
BASES THÉORIQUES
OHOCeHCeO
OHCOOCeHCCeO
OHCOOCeHCCeO
COOCeCOCeO
NCeONOOCe
CeOOOCe
23222
232832
232632
2322
2232
2232
43714
33612
2/12
42
+→+++→+++→+
+→++→+
→+

21
INTRODUCTION
BACKGROUND THEORY
IMPACT OF HYBRID STRATEGY ON EMISSION
CONCLUSION
SUMMARY

IMPACT OF HYBRID STRATEGY ON EMISSIONS
Engine type: gasoline
Evaluation on WLTP drive cycle
Evaluation of energetic scenario (internal combustion engine +
hybridisation, time to shut-off the internal combustion engine)
Exhaust line thermal behaviour
Tailpipe emissions
Methodology to evaluate the scenarios
22
Pollutantsgeneration
ScenarioConditions
Speed / Torque
After-treatmentsimulation
Internal combustion
engine usage
Raw pollutants
emissions
• Exhaust line thermal behaviour
• Tailpipe pollutant emissions

THREE-WAY CATALYST MODEL
23
Input data to the model:
Exhaust gas mass flowPollutants concentration Exhaust gas temperatureAmbient temperatureVehicle speed

IMPACT OF HYBRID STRATEGY ON EMISSIONS
Energetic scenario evaluation (internal combustion engine + hybridisation)
Impact of catalyst thermal behaviour
24
Catalyst Temperature
Impact
tailpipe
emission
CO
HC
NOx
Thermal reductionScénario 1 -10,48%
Scénario 2 -15,48%
Scénario 3 -21,54%
Reference scenario 4

IMPACT OF HYBRID STRATEGY ON EMISSIONS
Evaluation of energetic scenarios (ICE + hybridisation)
Impact on CO conversion
25
CO emissions increaseScénario 1 9,74%
Scénario 2 34,35%
Scénario 3 78,18%
Reference scenario 4
Integral CO
Catalyst Temperature

IMPACT OF HYBRID STRATEGY ON EMISSIONS
26
HC emissions increase
Scénario 1 20,91%
Scénario 2 47,07%
Scénario 3 92,85%
Reference scenario 4
Evaluation of energetic scenarios (ICE + hybridisation)
Impact on HC conversion
Integral HC
Catalyst Temperature
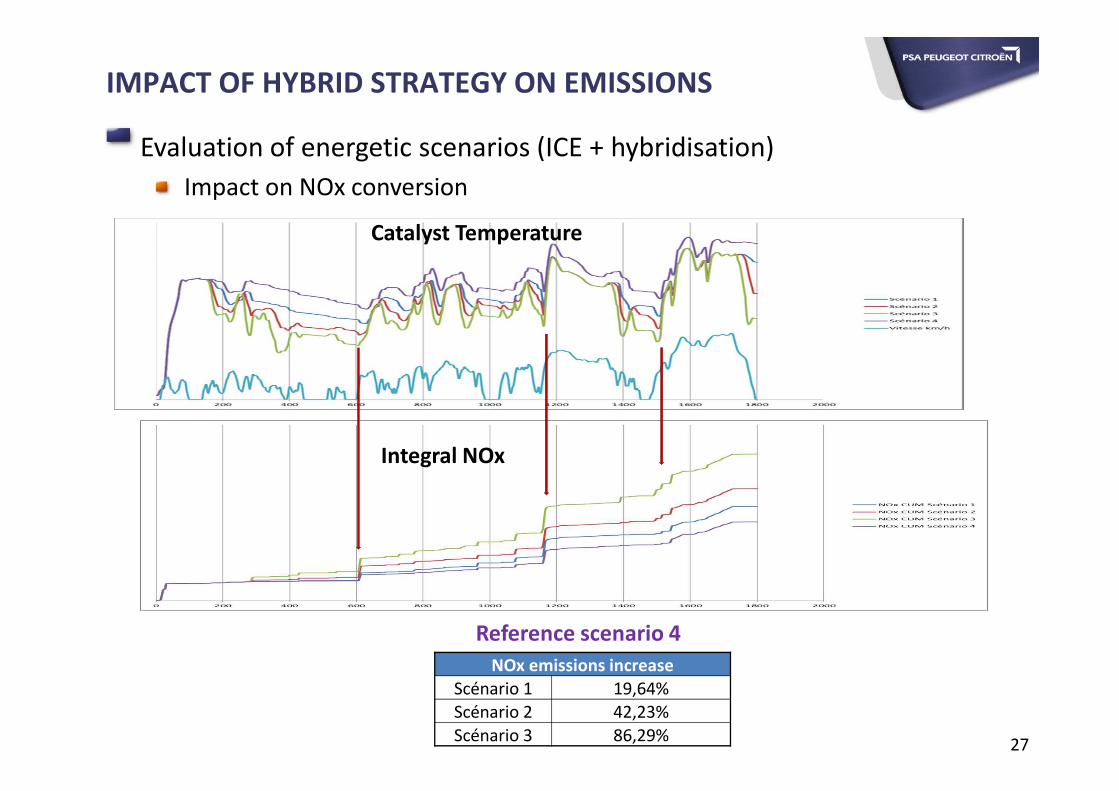
IMPACT OF HYBRID STRATEGY ON EMISSIONS
27
NOx emissions increaseScénario 1 19,64%
Scénario 2 42,23%
Scénario 3 86,29%
Reference scenario 4
Evaluation of energetic scenarios (ICE + hybridisation)
Impact on NOx conversion
Integral NOx
Catalyst Temperature
28
INTRODUCTION
BACKGROUND THEORY
IMPACT OF HYBRID STRATEGY ON EMISSION
CONCLUSION
SUMMARY

29
Advantages of using GT-SUITE
Easy to use
Different after-treatment technologies available
Easy coupling with other tools (such as MATLAB-SIMULINK)
Software updates constantly
Data post processing tool directly incorporated and easy to use
Good thermal results
Good chemical results
Fast evaluation of different technologies by simulation
Fast evaluation of different configuration
CONCLUSION

30
THANK YOU FOR YOUR ATTENTION

BIBLIOGRAPHY
31
http://www.km77.com/marcas/peugeot/motores/16hdi/gra/04.asp
http://www.basf.com/group/corporate/en/brand/BASF_SCR
http://www.huihuang-packing.com
http://www.jom.de/products/gb/Vehicle-Types/Peugeot/207/Exhausts/Muffler/Steel-muffler/Muffler-Peugeot-207-14-14-16V-16-16V-14-Hdi-16-Hdi-all-
from-2001-up-to-2006-2-x-76-mm-EC-approved.html
http://www.eostis.com/kw/equipements-accessoires-flexible-echappement-406__a96450198
http://www.bmcatalysts.co.uk/diesel_particulate_filters.php
GT-POWER user ‘s manual


![Medieval Sheep and Wool Types · Mouflon* 0.70 short tail Soay* 0.96 short tail Orkney]" -- short tail Shetlandt o.69 short tail St Kilda (Hebridean) *(4) Black short tail Manx Loghtan](https://static.documents.pub/doc/80x56/5fc6398b3821403e177e8284/medieval-sheep-and-wool-types-mouflon-070-short-tail-soay-096-short-tail-orkney.jpg)


