Acc
epte
d A
rtic
le
This article has been accepted for publication and undergone full peer review but has not been through the copyediting, typesetting, pagination and proofreading process, which may lead to differences between this version and the Version of Record. Please cite this article as doi: 10.1111/1365-2664.12140 This article is protected by copyright. All rights reserved.
Received Date: 23-Oct-2012
Accepted Date: 18-Jun-2013
Article Type: Standard Paper
Editor: Julia Blanchard
Impact of increasing deployment of artificial floating objects on the spatial
distribution of social fish species
Grégory Sempo, Laurent Dagorn, Marianne Robert & Jean-Louis Deneubourg
Corresponding author: Grégory Sempo. *Unit of Social Ecology, Université libre de Bruxelles CP231, av. F. Roosevelt 50, 1050 Brussels, Belgium. Email: [email protected] Phone : +32.2.650.56.21 Fax: +32.2.650.59.87 Co-authors : Laurent Dagorn : *UMR 212, Ecosystèmes Marins Exploités, Centre de Recherche Halieutique Méditerranéenne et Tropicale (CRH), IRD, France Email: [email protected] Marianne Robert *UMR 212, Ecosystèmes Marins Exploités, Centre de Recherche Halieutique Méditerranéenne et Tropicale (CRH), IRD, France *Institut français de recherche pour l'exploitation de la mer (Ifremer), Laboratoire de Technologie et Biologie Halieutiques, Lorient, France Email:[email protected]
Acc
epte
d A
rtic
le
This article is protected by copyright. All rights reserved.
Jean-Louis Deneubourg *Unit of Social Ecology, Université libre de Bruxelles, Brussels, Belgium. Email : [email protected]
Running title: Social interaction and fish distribution
Abstract
1. Approximately 300 pelagic fish species naturally aggregate around floating
objects (FOBs) at the surface of the oceans. Currently, more than 50% of the
world catch of tropical tuna comes from the industrial tuna fisheries around
drifting FOBs. Greater understanding of the complex decision-making
processes leading to this aggregation pattern and the impact of the massive
release of artificial FOBs by fishermen on the spatial distribution and
management of tuna is needed.
2. We analyse how the interplay between social (relationships between
individuals) and non-social (responses to the environment) behaviours may
affect the spatial distribution of a population in a multi-FOB environment.
Taking the example of tropical tunas associating with FOBs and using
differential equations and stochastic simulations, we examine how, when
increasing the number of FOBs, fish aggregation dynamics and the distribution
of the population among patches are affected by the population size, level of
sociality and the natural retentive and/or attractive forces of FOBs on
individual tuna.
3. Our model predicts that, depending on the species' level of sociality, fish will
be scattered among FOBs or aggregated around a single FOB based on the
Acc
epte
d A
rtic
le
This article is protected by copyright. All rights reserved.
number of FOBs deployed in a homogeneous oceanic region.
4. For social species, we demonstrated that the total fish catch is reduced with
increasing FOBs number. Indeed, for each size of population, there is a
number of FOBs minimizing the total population of fish associated with FOBs
and another number of FOBs maximizing the total population of associated
fish.
5. Synthesis and applications. In terms of fisheries management, the total catch
volume is directly linked to the total number of floating objects (FOBs) for
non-social species, and any limit on the number of sets would then result in a
limit on the total catch. For social species (e.g. tuna), however, increasing the
number of FOBs does not necessarily lead to an increase in the total catch,
which is a non-intuitive result. Indeed, our model shows that, for specific
values of the parameters, deploying a greater number of FOBs in the water
(all other parameters being constant) does not necessarily help fishermen to
catch more tuna but does increase the level of fishing effort and bycatch.
Keywords: behaviour-based modelling, bycatch, FAD, FOB, sustainable fishery, tuna
Introduction
In the wild, the spatial distribution of individuals is usually patchy (Parrish & Hamner
1997), resulting from animals' reactions to biotic or abiotic factors, which are
themselves often patchy, or, in the case of social species, from the interactions
among conspecifics (Parrish & Hamner 1997; Parrish & Edelstein-Keshet 1999;
Krause & Ruxton 2002; Stephens et al. 2002). These two processes structure
Acc
epte
d A
rtic
le
This article is protected by copyright. All rights reserved.
scientific investigations of the spatial dynamics of wild animals; ecologists usually
favour the importance of environmental stimuli, whereas ethologists often emphasize
the relationships between conspecifics. However, these two approaches are non-
exclusive.
Advances in the understanding of the spatial dynamics of fish illustrate this
dichotomy. Ecologists generally try to interpret the observed distributions of fish as a
result of interactions between fish and their environment (Pitcher 1992; Bertignac,
Lehodey & Hampton 1998), while ethologists have extensively studied the schooling
behaviour of fish, focusing on the mechanisms by which local interactions between
members of the same school control the motion of the school (Viscido, Parrish &
Grunbaum 2004; Hemelrijk & Hildenbrandt 2008; Couzin 2009; Capello et al. 2011).
The functionality of aggregates that tropical tunas often form around floating objects
(FOBs) were studied at short scales by ethologists while ecologists favour longer and
larger scales. For years, it has been reported that tropical tunas (mainly skipjack
Katsuwonus pelamis, yellowfin Thunnus albacares, and bigeye T. obesus,) naturally
aggregate around objects floating at the surface of the ocean, such as logs, and
debris (Uda 1936; Hunter & Mitchell 1967), but the reasons that tunas associate with
FOBs are still unknown. The first hypothesis to explain these fish aggregations came
from ecologists, who proposed that tunas were feeding on smaller fish that were
associated with the FOBs (Kojima 1956; Bard, Stretta & Slepoukha 1985). Tunas,
however, do not generally feed on prey associated with drifting FOBs (Ménard et al.
2000). Later, ecologists advanced the indicator-log hypothesis (Hall 1992): natural
FOBs (e.g. logs) could be indicators of productive areas, either because most
originate in nutrient rich areas, such as river mouths, or because they aggregate in
Acc
epte
d A
rtic
le
This article is protected by copyright. All rights reserved.
rich frontal zones offshore. In the late 1990s, ethologists suggested that tunas could
associate with FOBs for social reasons (Dagorn & Freon 1999; Freon & Dagorn
2000). Floating objects could act as meeting points where individuals or small
schools could gather to form larger schools, providing advantages to their members
(Pitcher & Parrish 1993).
A better understanding of this associative behaviour is of increasing
importance because tropical tuna purse seine fisheries exploit this behaviour to
facilitate and enhance their catch. Initially, purse seine vessels targeted tunas that
were aggregated around natural FOBs, such as logs. However, since the 1990s,
fishermen have been using artificial floating objects, called fish aggregating devices
(FADs), to facilitate the capture of these species. Globally, several thousands of FADs
(usually rafts made of bamboo sticks that are equipped with satellite buoys that
allow fishermen to relocate them) are regularly deployed in the oceans (Moreno et
al. 2007; Dagorn et al. 2013). The use of FADs has largely contributed to an increase
in the total catch of tuna: the catch of tropical tunas around drifting FADs by purse
seine vessels has accounted for almost 50% of the tuna catch in the Pacific Ocean
and 25% in other oceans (Fonteneau, Pallares & Pianet 2000; Dagorn et al. 2012b).
Several authors have modelled the dynamics of tuna aggregations around
FOBs (Clark & Mangel 1979; Hilborn & Medley 1989; Dagorn, Bach & Josse 2000).
Surprisingly, although tropical tunas are known to school, a form of social behaviour
(Norris & Schilt 1988), all of these studies considered individuals that were
independent, with no interaction between conspecifics fish (Robert et al. 2013). The
fact that tunas school does not indicate, however, whether their social behaviour
Acc
epte
d A
rtic
le
This article is protected by copyright. All rights reserved.
plays a key role in the aggregations that they form around FOBs. While recent
studies (Soria et al. 2009; Capello et al. 2011) have described the role of social
behaviour in the aggregations of smaller, pelagic fish species (e.g. the bigeye scad
Selar crumenophthalmus) around FADs, the influence of the social behaviour of tunas
on the dynamics of their aggregations around FOBs is still poorly understood.
The study of the spatio-temporal distribution of tuna in a network of FOBs falls
within the scope of metapopulation analysis and the influence of multi-patch
environment on the spatial distribution of populations. With this theoretical approach,
we developed a behavioural model based on differential equations coupled to
stochastic simulations to address the consequences of including individual social
behaviour on the spatio-temporal dynamics of a tuna population around FOBs. One
of the main tasks requested by the Regional Fisheries Management Organizations
(RFMO), who are in charge of the management of tuna fisheries, is an assessment of
the consequences of the increasing number of FOBs in the ocean due to the release
of large numbers of FADs. Consequently, we specifically examined the effects of an
increase in the number of FOBs, the level of inter-individuals sociality and the size of
the fish population on the aggregation dynamics and distribution of tunas among
FOBs.
Materials and methods
The model
Using a system of differential equations, we studied the patterns that were generated
by fish interacting with each other while joining and leaving FOBs, as opposed to
Acc
epte
d A
rtic
le
This article is protected by copyright. All rights reserved.
independent fish. In addition, due to the non-linearity of the model, we also
performed stochastic simulations, where the random aspects of processes are
automatically incorporated through stochastic components of fish behaviour. This
approach where all individuals behave independently in the limit of parameters
values allows us to investigate the main effects arising from fluctuations.
The model consists of a system of p+1 interconnected populations: xi is the
fraction of the total population (N) around the FOB i, one of the p FOBs, and xe is the
fraction of the total population (N) outside the FOBs (Fig. 1). All FOBs are identical
(same design or same potential to attract and/or retain fish) and are located in a
homogeneous environment. The population outside the FOBs is homogeneously
distributed within this environment and the total fish population stays constant in the
area (the recruitment and arrival of new fish in the population = mortality of fish).
The differential equations describing the evolution of the fraction of the population
around each FOB (xi) through time can be written as in Eq 1,a:
(1,a)
(1,b)
Ri (Qi) is the probability of joining (leaving) the FOB i. (Eq 2) and these probabilities
depend on the interaction between the fishes. The model neglects the social
interaction between fish outside the FOBs. We made the assumption that the
interaction between fish implies that the greater the number of individuals around
the FOB i Xi (=Nxi), the greater the probability Ri of joining this FOB (Eq 2,a) and the
lower the probability of leaving it. (Eq 2,b).
Acc
epte
d A
rtic
le
This article is protected by copyright. All rights reserved.
(2,a)
(2,b)
μ is the kinetic constant of joining the FOB i (when a FOB is “empty”) and θ is the
maximal probability of leaving the FOB i per time unit. β and ε are the strengths of
the social interaction and we assume, to simplify the analysis, that these strengths
are the same (β = ε ) for the both probabilities (joining and leaving). When β= 0,
it corresponds to the case of independent or asocial fish and Ri and Qi are constant
(Ri=μ; Qi=θ).
In biological terms, we assume that the social interaction is proportional to the
population size. The influence of a large number of individuals with a small β is
equivalent to the influence of a small population with a large β. Consequently, the
parameter b corresponds to large populations (N) and/or large inter-attraction
between fishes (β) (Eq 3).
(3)
Dividing Equation 1 by μ, we define a new time τ = μt and the ratio
g= θμ and we obtain:
(4,a)
(4,b)
Monte Carlo simulations
To understand the main effects arising from the fluctuations in the non-linear process
of aggregation, we used Monte Carlo simulations including stochasticity in the
Acc
epte
d A
rtic
le
This article is protected by copyright. All rights reserved.
simulation through the probabilities of joining and leaving FOBs (see details
hereafter). The simulations were based on the same mechanisms that were defined
in the differential system of equations (Eq. 4a,b). The following steps summarize our
analysis. (1) Initial conditions: the number of individuals around each FOB is fixed at
0, and the number outside the FOBs equals N; (2) Decision process: p+1 states are
possible for each individual around each FOB i (i=1,…,p) and outside the FOBs. At
each time step (t), the position of each individual is checked. Then, its probability of
leaving FOB i is given by Qi (Eq. 2b). Its change of state at time t depends on the
comparison between the calculated value Qi and a random number sampled from a
uniform distribution between 0 and 1. If this random value is less than or equal to Qi,
the individual leaves the FOB i. If not, it stays associated to FOB i. The probability of
joining a FOB is implemented similarly using the probability Ri. With such procedure,
the probability of resting around the FOB is 1-Qi and the probability of non-joining
the FOB is 1-Ri.
The probabilities Qi and Ri, of moving are updated at each simulation step in relation
to the number of individuals already present on site i. The process is repeated for
10,000 steps to reach the stationary state (e.g. Figure 3d,f,h). Monte Carlo
simulations are run 1000 times with a population of 1000 individuals. The simulation
results allowed us to follow the progress towards the stationary state for FOB i
through the distributions of the numbers of individuals present in FOB i in relation to
time.
Non-social system
This model includes the scenario consisting of the absence of interaction between
Acc
epte
d A
rtic
le
This article is protected by copyright. All rights reserved.
individuals (b =0). As each individual settles randomly under one of the p FOBs, the
model has only one stationary symmetrical solution (x1=x2=...=xp). The populations
around each FOB are identical and can be expressed as a function of g and p (Eq.
5a,b). The total fraction of the population associated with the p FOBs is T = p*xi.
(5,a)
(5,b)
Social systems
The case of one FOB
In the case of one FOB (p =1) with social interactions between individuals, at the
stationary state Eq. 4a is
(6a)
or (6b)
with (6c)
The solutions of this algebraic equation (6a–c) are the stationary states of Eq. 4. This
equation has only one stationary solution, except for b>8 and g-<g<g+, where three
stationary states exist: two stable and one unstable (Figure 2a).
g- and g+ are well approximated by the following equations (see Supporting Information for
the exact solution).
(7,a)
(7,b)
Based on Eq. 7a,b, we show in Figure 2a the zones where the model has one or
Acc
epte
d A
rtic
le
This article is protected by copyright. All rights reserved.
three stationary solutions with greater b, greater the g+, g- and the zone g-<g<g+
where the model has three stationary states.
Figure 2b, describing x1 as a function of g for 3 values of b, shows a classical
hysteresis effect. For small values of g (g<g-), i.e. a strong tendency to associate
with the FOB and/or a weak tendency to leave it, a large fraction of the population
aggregates around the FOB. However, for large values of g (g >g+), a small fraction
aggregates around the FOB. For g-<g<g+ and b>8, the system adopts one of the
two stable states based on its history and random events (i.e. a large or small
population around the FOB). The medium value is a threshold that is always
unstable.
Similarly, Figure 2c, describing xi as a function of b for 3 values of g, shows a similar
hysteresis behaviour. Indeed, when increasing b (keeping g constant), the
aggregated population around the FOB increases. For large values of g, we observe
two stable states: a small population or a large one aggregated around the FOB.
The case of two FOBs
With two FOBs (p=2), the model has two families of stationary states (Figure 3a,b).
The first family corresponds to an equal but small number of individuals around both
FOBs (x1=x2). The solutions for the second family are asymmetrical states with
unequal numbers of individuals on each site (x1>x2 or x1<x2) (Figure 3a,b). This
result implies that one of the sites (FOB) is selected by the majority of the
population.
The detailed analysis of the solutions indicates that the symmetrical solution (equal
distribution of fish under the 2 FOBs) is stable for b<2, for 2<b<6 and g>4b-8, and
Acc
epte
d A
rtic
le
This article is protected by copyright. All rights reserved.
for for b>6 and g>(1+0.5b)0.5 (Figure 3g,h).
In contrast, the system exhibits an asymmetric stable steady state (x1>x2 or x1<x2)
when b>2 and g< 4b-8. In such a scenario, the selection of one FOB occurs through
amplification (Figure 3c,d).
Finally, one symmetrical and one asymmetrical solution are stable for b>6 and 4b-
8<g<(1+0.5b)² (see Figure 3e,f). In this case, the initial condition (or randomness,
for the stochastic model) determines which steady state will be reached.
If we convert back into biologically meaningful variables, the stable stationary states
for this model for a large population (N) and/or strong social interactions β
demonstrate that for two FOBs, the greater is the clustering asymmetry with one
FOB capturing the whole population (Figure 3b,c). For small populations N and/or
weak social interactions β or a weak affinity for FOBs (large value of g), the
population is equally distributed between the two FOBs.
Generalization to p FOBs
For social species (b>0) and p FOBs, according to the population size, the social
interactions between individuals and the affinity for FOBs, the model has three zones
of stationary states: (1) a scattering pattern with an homogeneous distribution of
fish among FOBs (symmetrical steady state solution x1=x2=...=xp), (2) a clustering
pattern around only one FOB (asymmetrical steady state solution x1>x2=...=xp or
x2>x1=x3=...=xp, … or xp> x1=...=xp-1) and (3) a zone where the system will reach
either the symmetrical or the asymmetrical steady state depending on the initial
conditions. (Figure 4a,b). For p > 0.25b²+1, the model has only the homogeneous
Acc
epte
d A
rtic
le
This article is protected by copyright. All rights reserved.
and symmetrical steady state solution.
For instance, for b=10, g=20 and an increasing p, the model shifts from an
asymmetrical steady state to a symmetrical one via the bistability situation, where
the symmetrical and asymmetrical solutions are stable. Indeed, for these values of
the parameters b and g, we observed the asymmetrical solution x1>x2 (or x1<x2) for
p=2 (Figure 3a), the bistability solution for p=10 (Figure 4a) and the symmetrical
solution for p=25 (Figure 4b). This result highlights the tendency of fish to scatter
due to an increasing number of FOBs, similar to what happens when there is no
social interaction between fish (see the Discussion section).
As shown in Figure 4c,d, when the number of FOBs is small (<10) and g=10, one
FOB is randomly selected (with a frequency of 1/p). When the steady state is
reached, the fraction of the population xi around this "winning" FOB is high, nearly
the entire population (Figure 5a). However, when the numbers of FOBs increases,
both solutions are initially stable (asymmetrical and symmetrical solutions). For very
large numbers of FOBs, we do not observe such selection, and the fish are equally
distributed among all of the FOBs. For g≥34, the asymmetrical steady state
disappears and only the symmetrical steady state exists. In each of these three cases
(g=10, g=34, g=60), not surprisingly, there is agreement between analytical (Figure
4c,e,g) and simulated results (Figure 4d,f,h).
Non-social vs. social systems: a case study
The level of fish association to FOBs, as well as the asymmetrical or symmetrical
pattern, can deeply influence the pattern of fishing effort. In this respect, we present
Acc
epte
d A
rtic
le
This article is protected by copyright. All rights reserved.
an example of the variation in these parameters through a comparison of the
influence of the number of FOBs (p) on the total fraction of the population under
FOBs (T, Figure 5a) and on the maximum fraction of the population observed under
one FOB (xi_max, Figure 5b) for different values of b (inter-attraction between fishes
and/or population size, Figure 5, see Eq. 3a).
For non-social species (b=0), we observe that for a small number of FOBs (p), the
majority of individuals are outside the FOBs (Figure 5b). Then, with the increase of
FOBs number, the proportion of the population associated with FOBs (T) increases
non linearly (p, Figure 5b). However, this increase is associated to a negative
consequence in terms of fishery: a scattering of individuals among all FOBs and a
decrease of the maximum number of individuals observed under one FOB (xi_max,
Figure 5a).
For social species, the fraction of the population associated to FOBs (T) is always
higher than 75%, whatever the number of FOBs (p, Figure 5b). Interestingly, for
small number of FOBs, the majority of individuals are aggregated around only one
FOB: xi_max ~ T (Figure 5a). However, for a critical number of FOBs (p) depending on
b, the system switches abruptly from an asymmetrical to a symmetrical state. In
other words, the aggregate disappears and individuals scatter among FOBs in
identical small groups (Figure 5a,b).
Discussion
The dynamics and distribution of tunas within an array of FOBs can be studied using
the theoretical ambit of metapopulation analyses and the spatial distribution of
Acc
epte
d A
rtic
le
This article is protected by copyright. All rights reserved.
populations in multi-patch environments (Gotelli & Kelley 1993). In this study, we
examined how aggregation dynamics are affected by the size of the fish population
(N), the level of sociality between individuals (b), the total number p of aggregation
sites available (i.e. FOBs) and the natural retentive and/or attractive forces of FOBs
on single individuals (Qi, Ri). We demonstrate that, depending on the values of these
parameters , we could firstly predict that within a homogeneous oceanic region, the
fraction of the population associated with FOBs can strongly vary and secondly, that
the different FOBs will be equivalently occupied or that only one of them will be
selected.
Distribution of non-social fish among FOBs
Without social interactions (b = 0), as individuals respond individually to a
unique stimulus (i.e. the FOB), the fraction of the population associated with FOBs
will slowly increase with the number of FOBs. In this context, aggregation
corresponds to the summation of all individuals responses. This has been the
common vision of tuna aggregations around FOBs. If FOBs are equivalent in quality,
the proportion of the population associated with each of them will be identical and
inversely proportional to their number (Eq. 5). The total number of individuals
associated with FOBs will only depend on g, the intrinsic retention power of FOBs.
These results are in agreement with previous studies that have modelled the
behaviour of fish around FOBs (Clark & Mangel 1979; Hilborn & Medley 1989;
Dagorn et al. 2000).
In this case, the aggregation pattern of individuals is influenced more by the sum of
individual responses (Fraenkel & Gunn 1961) than by a true collective decision
Acc
epte
d A
rtic
le
This article is protected by copyright. All rights reserved.
process (Camazine 2001; Halloy et al. 2007; Sumpter 2010). If FOBs differ in quality
(i.e. some naturally attract or retain more fish than others), a non-homogeneous
situation exists. In such a case, the most favourable FOBs will aggregate a large
percentage of the population, and each FOB will be characterized by its own value of
g. The FOB with the highest quality (i.e. the lowest value of g) will aggregate the
most individuals.
Distribution of social fish among FOBs
When fish of the same species interact with each other (i.e. when the presence of
conspecifics under a FOB influences the probability of reaching or staying around this
FOB), our model and simulations show a different pattern. Indeed, for social species
with a constant population size in an area with two or more FOBs of the same
quality, the aggregative patterns predominantly arise from an amplification process
that depends on the number of fish associated with each FOB (xi) and on the level of
social interactions between fish and/or the population size (b, see Eq. 1a). This
observation indicates that the greater the number of fish around a FOB and/or the
higher the attraction between fish, the lower the probability that a fish will leave it
and/or the greater the probability that a fish will join it. Nonetheless, for high
numbers of FOBs (Figure 4a), the scattering of the population among all FOBs
precludes the amplification process from occurring, and the system shifts back to an
equal distribution, which could be considered suboptimal in terms of fish exploitation
if the number of fish around each FOB is too small (Auger et al. 2010). This complex
dynamics contrast with the commonly admitted aggregation mechanisms
implemented for non-social fish. Even for social species, an equal distribution of fish
Acc
epte
d A
rtic
le
This article is protected by copyright. All rights reserved.
among FOBs can be obtained for some particular values of the parameters. Indeed,
for a steady-state population of fish (the recruitment and arrival of new fish in the
population = mortality and emigration of fish), we observe a shift from the selection
of one FOB to an equal distribution of fish among all FOBs when the number of FOBs
increases (Figure 6). This observation corresponds to the steady-state, so it may only
be reached after an infinite length of time. For a large social interaction, increasing
the number of FOBs should, in general, lead to a shift from an aggregation around
only one FOB to the vast majority of fish associating with all FOBs (Figure 6). For a
smaller social interaction and a medium or large number of FOBs, a small proportion
of the population is scattered among FOBs (Figure 6).
In summary, it is noteworthy that for social species, the largest total number
of individuals associated with FOBs can be reached in two different situations,
depending on the size of the population and the number of FOBs. When few FOBS
are present, there is selection, and a large proportion of the population is aggregated
around one FOB. When there are many FOBs, there is an equal distribution of fish
among all of the FOBs, each of them being occupied by a small number of
individuals. Our model shows that for small or intermediate numbers of FOBs, the
population around a FOB is higher for social species, in comparison to non-social
ones, or social situations with a scattered population among a large number of FOBs
(Figure 5). Another important result is that for each size of population of fish (for
social species), there is a number of FOBs that minimizes the total population of fish
associated with FOBs, and another number of FOBs that maximizes the total
population of associated fish. Those theoretical results are close to experimental and
Acc
epte
d A
rtic
le
This article is protected by copyright. All rights reserved.
theoretical dynamics previously reported for social species. Asymmetrical
distributions have been theoretically studied and experimentally highlighted in social
insects during foraging and aggregation (Camazine 2001; Jeanson et al. 2004;
Sempo 2006), in gregarious insects (Halloy et al. 2007; Sempo et al. 2009), in
crustacean (Farr 1978; Devigne, Broly & Deneubourg 2011) and vertebrates (Hoare
et al. 2004; Michelena et al. 2010). The shift between selection of a patch and the
dispersion due to the increase of the number of patches is reported during ant's
foraging activity (Hahn & Maschwitz 1985; Deneubourg et al. 1989; Franks et al.
1991; Nicolis & Deneubourg 1999).
What can we say in terms of management? The release of thousands of FADs
into the ocean by purse seine vessels drastically increases the number of floating
objects. Indeed, concerning the Indian Ocean, the number of FOBs has at least
double since the introduction of FADs and in Somalia area for instance, the
multiplication factor has reached as high as 20 or 40 (Dagorn et al. 2012b; Dagorn et
al. 2013). In the Mozambique Channel and Chagos area, few FADs are deployed by
fishers because the density of FOBs is naturally high i.e. they regularly drift in from
both the eastern coast of Africa and Madagascar. The consequences of this increase
differ between social and non-social species. First, for social species only, above a
critical number of FOBS, fish are less associated to FOBs. If implications for purse
seine fishery are evident, this higher proportion of the population non-associated
with FOBs could have ecological impact on social species by preventing them to
access to potential benefits resulting from FOBs association (see Introduction
section). Second, as already highlighted by previous studies (Auger et al. 2010), a
Acc
epte
d A
rtic
le
This article is protected by copyright. All rights reserved.
very large number of FOBs in comparison to the local abundance of the fish
population (under the parameter range: number of FOBS> 0.25*N²) results in a
small number of fish aggregated under each object, which confirms our theoretical
results. This pattern is shared by both non-social and social models, under the
specific conditions of a small inter-attraction between fish for the social model. This
situation would reduce the catch uncertainty (almost all FOBs have fish) but lead to
an increase in the number of sets needed to reach a commercially viable level of
total catch. Fishing on FOBs contributes to the catch of other species that naturally
aggregate around these objects, called bycatch (Romanov 2002; Amandè et al.
2010). In the ecosystem approach to fisheries (Pikitch et al. 2004), such non-
desirable catch should be minimized, knowing that some of those species are
threatened (e.g. pelagic sharks; Gilman (2011). It appears that the total amount of
bycatch is more dependent on the number of fishing sets (fishing effort) rather than
the total amount of tuna caught (Dagorn et al. 2012a). This led scientists to consider
whether the fishery could reduce its impacts on the ecosystem by avoiding targeting
small tuna schools around FOBs, i.e. catching the same total amount of tuna with a
smaller number of sets (Dagorn et al. 2012a). Limiting the number of sets on FOBs is
one of the possible means to mitigate the impact of fishing on FOBs (Dagorn et al.
2012b). Therefore, any increase in the number of fishing sets would counteract the
reduction of bycatch. For non-social species, the total amount of catch of target
species is directly linked to the total number of FOBs, and any limit on the number of
sets (e.g. to limit bycatch) would then result in a limit on the total catch. For social
species, however, increasing the number of FOBs does not necessarily lead to an
increase in the total catch, a result that is non-intuitive. Our model shows that, for
Acc
epte
d A
rtic
le
This article is protected by copyright. All rights reserved.
some particular values of the parameters, deploying a greater number of FOBs in the
water does not always result in a higher tuna catch, all other parameters being
constant. However, it does increase the number of fishing sets, which certainly
increases the bycatch (Dagorn et al. 2012a).
Interestingly, the model properties and behaviours are unchanged if we increase the
grain by considering small schools of fish as the basic units instead of individual fish
(e.g. Dagorn et al. (2000). Our model based on social interactions between fish
describes how the change in the number of FOBs, which can be adjusted by
managing the number of FADs that are deployed by fishermen, could affect the
spatial distribution of fish. In particular for social species, a scattering distribution
could then impact key behavioural and biological parameters of the species such as
all advantages linked to the living in group. We consider that assessing the effects of
the deployment of FADs on the distribution of fish within an array of FOBs is a key
step in evaluating the impacts of FOBs on the ecology of species, and our model
could provide a framework to guide future experiments aiming to quantify in the field
the spatial distribution and fidelity of fish in a network of FOBs. As our approach
including social interactions is complementary to density dependent habitat selection
models (Lehodey et al. 1997; Bertignac, Lehodey & Hampton 1998; Sibert &
Hampton 2003), future works should focus on the integration of both models to
reach a more realistic description of the system.
This study identified tropical tunas as the main species of interest because they are
the target species of large-scale fisheries in all oceans. Fish aggregations, however,
often comprise several fish species (Romanov 2002; Taquet et al. 2007; Amandè et
Acc
epte
d A
rtic
le
This article is protected by copyright. All rights reserved.
al. 2010), and our model could easily be used to investigate the effects of increasing
the number of FOBs on these other species, both social and non-social. Moreover,
fish around a FOB could display some inter-specific relationships (e.g. predator–prey
interactions). Our model could be adapted to the dynamics of two interacting
species, with one species influencing the presence or residence time of the other
species around a FOB.
There is no doubt that our analysis and model have some weakness. Indeed,
in our analysis, we mainly focused on the stationary solutions of the model in a
constant environment. In addition, the space is not explicitly modelled. However, a
preliminary analysis of the dynamics of a spatial version of the model indicates that
our main conclusions remain valid, for example in terms of the influence of the
number of FOBs and the size of the population of fish on the selection of a single
FOB by the population.
This model highlights the need for experiments to characterize the role of the
social behaviour of tunas (or other species) in their association with FOBs (e.g.
measure of mean resting time with acoustic tagging in relation with population
around the FOB). In addition, it appears essential to simultaneously observe the tuna
prey densities in the vicinity of each FAD using acoustic survey and all non-tuna
species associated with each FAD through underwater visual census. Various types of
dataset from observers, fisheries and NGOs should be used to parameterize our
model and to confront output to data. Each of these databases displays advantages
and disadvantages, with none being perfect at this time. As a case study, we used
observer’s data on board commercial purse seine trip (Data Collection Framework –
Acc
epte
d A
rtic
le
This article is protected by copyright. All rights reserved.
Obstuna database http://sirs.agrocampus-ouest.fr/atlas_thoniers/). This choice was
mainly driven by the fact that logbook do not provide information on “empty” FOBS,
data are only available for fished FOBs. Even with observer database, fish biomass
associated to FOBs is probably underestimated. Indeed, if this biomass does not
reach a threshold determine by fishers FOBs are visited but not fished. Nevertheless,
with these unsatisfactory data, we can illustrate one of our social model predictions:
the scattering of the population for high number of FOBs. Indeed, the observer’s
data in the Atlantic and Indian Ocean between January 2006 and August 2010
highlight that around 50% of FOBs contained fish in quadrates (2° squared) with 2
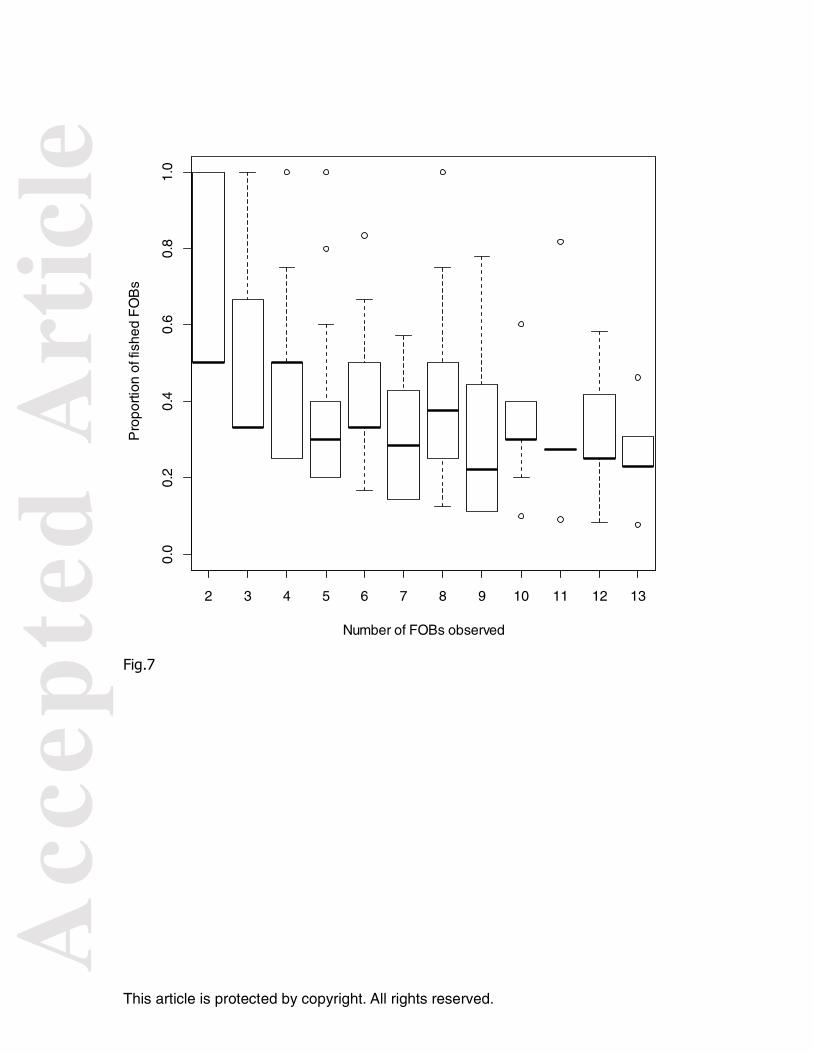
FOBs while this proportion dropped to 20% for 13 FOBS (Figure 7). To confirm such
preliminary results, it would be useful to link them to local abundance of the
population using total catches of tuna, including all fleet, available at the RFMOs
level. To quantify more precisely the occupancy pattern of FOBs in a given area,
another source of data, soon available to scientists, consist in the tuna biomass
estimates provided by the satellite linked sonar buoys that fishermen recently
deployed around their FOBs.
These preliminary results stress the need to collect accurate data on the number of
FOBs in the ocean and to better characterize fish behaviour at FOBs (Dagorn et al.
2012a; Dagorn et al. 2012b). Here, we have shown the sensitivity of the aggregation
patterns to the individual behaviour (probabilities of leaving and joining a FOB),
population size and number of FOBs. However, we assert that the main challenges
concerning the questions addressed in this paper and the model predictions are not
theoretical, but experimental ones. Specific experiments are required to provide data
Acc
epte
d A
rtic
le
This article is protected by copyright. All rights reserved.
needed to calibrate the model parameter. Recent experiments could bring important
information to quantify the extent to which social interactions modulate the
probability of leaving and reaching a FOBs or a network of FOBs (Robert et al. 2013).
Acknowledgments
J.L. Deneubourg is Senior Research Associate of the FRS-FNRS. This study was
achieved with financial support from the Commission of the European Communities,
specific RTD programme of Framework Programme 7, ‘‘Theme 2-Food, Agriculture,
Fisheries and Biotechnology’’ through the research project MADE (Mitigating adverse
ecological impacts of open ocean fisheries) and the Action de Recherches Concertées
de la Communauté Française de Belgique: Individual and collective issues in dispersal
and aggregation: from proximal causes to ultimate consequences at contrasting
scales.
References
Amandè, M.J., Ariz, J., Chassot, E., de Molina, A.D., Gaertner, D., Murua, H., Pianet, R.,
Ruiz, J. & Chavance, P. (2010) Bycatch of the European purse seine tuna fishery in the Atlantic Ocean for the 2003–2007 period. Aquatic Living Resources, 23, 353-362.
Auger, P., Lett, C., Moussaoui, A. & Pioch, S. (2010) Optimal number of sites in artificial pelagic multisite fisheries. Canadian Journal of Fisheries and Aquatic Sciences, 67, 296-303.
Bard, F.-X., Stretta, J.-M. & Slepoukha, M. (1985) Les épaves artificielles comme auxiliaires de la pêche thonière en océan Atlantique : quel avenir ? Pêche Maritime, 1291, 655-659.
Bertignac, M., Lehodey, P. & Hampton, J. (1998) A spatial population dynamics simulation model of tropical tunas using a habitat index based on environmental parameters. Fisheries Oceanography, 7, 326-334.
Camazine, S. (2001) Self-organization in biological systems. Princeton University Press, Princeton, N.J.; Oxford.
Capello, M., Soria, M., Cotel, P., Deneubourg, J.L. & Dagorn, L. (2011) Quantifying the Interplay between Environmental and Social Effects on Aggregated-Fish Dynamics. Plos One, 6.
Clark, C., W. & Mangel, M. (1979) Aggregation and fishery dynamics: a theoretical study of
Acc
epte
d A
rtic
le
This article is protected by copyright. All rights reserved.
schooling and the purse seine tuna fisheries. Fishery Bulletin, 77, 317-337. Couzin, I.D. (2009) Collective cognition in animal groups. Trends in Cognitive Sciences, 13,
36-43. Dagorn, L., Bach, P. & Josse, E. (2000) Movement patterns of large bigeye tuna (Thunnus
obesus) in the open ocean, determined using ultrasonic telemetry. Marine Biology, 136, 361-371.
Dagorn, L., Bez, N., Fauvel, T. & Walker, E. (2013) How much do fish aggregating devices (FADs) modify the floating object environment in the ocean? Fisheries Oceanography, n/a-n/a.
Dagorn, L., Filmalter, John D., Forget, F., Amandè, M.J., Hall, Martin A., Williams, P., Murua, H., Ariz, J., Chavance, P. & Bez, N. (2012a) Targeting bigger schools can reduce ecosystem impacts of fisheries. Canadian Journal of Fisheries and Aquatic Sciences, 69, 1463-1467.
Dagorn, L. & Freon, P. (1999) Tropical tuna associated with floating objects: a simulation study of the meeting point hypothesis. Canadian Journal of Fisheries and Aquatic Sciences, 56, 984-993.
Dagorn, L., Holland, K.N., Restrepo, V. & Moreno, G. (2012b) Is it good or bad to fish with FADs ? What are the real impacts of the use of drifting FADs on pelagic marine ecosystems? . Fish and Fisheries, n/a-n/a.
Dagorn, L., Josse, E., Bach, P. & Bertrand, A. (2000) Modeling tuna behaviour near floating objects: from individuals to aggregations. Aquatic Living Resources, 13, 203-211.
Deneubourg, J.L., Goss, S., Franks, N. & Pasteels, J.M. (1989) The blind leading the blind: modeling chemically mediated army ant raid patterns. J. Insect Behav., 2, 719-725.
Devigne, C., Broly, P. & Deneubourg, J.-L. (2011) Individual preferences and social interactions determine the aggregation of woodlice. Plos One, 6, e17389.
Farr, J.A. (1978) Orientation and Social Behavior in the Supralittoral Isopod Ligia Exotica (Crustacea: Oniscoidea). Bulletin of Marine Science, 28, 659-666.
Fonteneau, A., Pallares, P. & Pianet, R. (2000) Worldwide review of purse-seine fisheries on FADs. Pêche thonière et dispositifs de concentration de poissons (ed. A.C. Ifremer), pp. 15-35. Le Gall JY, Cayré P, Taquet M, Martinique.
Fraenkel, G.S. & Gunn, D.L. (1961) The orientation of animals, kineses, taxes and compass reactions. Dover Publications.
Franks , N.R., Gomez , N., Goss , S. & Deneubourg , J.L. (1991) The blind leading the blind in army ant raid patterns: testing a model of self-organization (Hymenoptera: Formicidae). Journal of Insect Behaviour, 4, 583-607.
Freon, P. & Dagorn, L. (2000) Review of fish associative behaviour: toward a generalisation of the meeting point hypothesis. Reviews in Fish Biology and Fisheries, 10, 183-207.
Gilman, E.L. (2011) Bycatch governance and best practice mitigation technology in global tuna fisheries. Marine Policy, 35, 590-609.
Gotelli, N.J. & Kelley, W.G. (1993) A general-model of metapopulation dynamics. Oikos, 68, 36-44.
Hahn, M. & Maschwitz, U. (1985) Foraging strategies and recruitment behaviour in the european harvester ant Messor rufitarsis (F.). Oecologia, 68, 45-51.
Hall, M.A. (1992) The association of tunas with floating objects and dolphins in the Eastern Pacific ocean: VII. Some hypotheses on the mechanisms governing the association of tunas with floating objects and dolphins. Backgound document for the International Workshop on the Ecology and Fisheries for Tunas Associated with Floating Objects, February 11-13 1992, La Jolla, CA, pp. 6. Inter-American Tropical Tuna Commission, 8604 La Jolla Shores Dr, La Jolla, CA 92037 (mimeo).
Halloy, J., Sempo, G., Caprari, G., Rivault, C., Asadpour, M., Tache, F., Said, I., Durier, V.,
Acc
epte
d A
rtic
le
This article is protected by copyright. All rights reserved.
Canonge, S., Ame, J.M., Detrain, C., Correll, N., Martinoli, A., Mondada, F., Siegwart, R. & Deneubourg, J.L. (2007) Social integration of robots into groups of cockroaches to control self-organized choices. Science, 318, 1155-1158.
Hemelrijk, C.K. & Hildenbrandt, H. (2008) Self-organized shape and frontal density of fish schools. Ethology, 114, 245-254.
Hilborn, R. & Medley, P. (1989) Tuna Purse-Seine Fishing with Fish-Aggregating Devices (Fad) - Models of Tuna Fad Interactions. Canadian Journal of Fisheries and Aquatic Sciences, 46, 28-32.
Hoare, D.J., Couzin, I.D., Godin, J.G.J. & Krause, J. (2004) Context-dependent group size choice in fish. Animal Behaviour, 67, 155-164.
Hunter, J.R. & Mitchell, C.T. (1967) Association of fishes with flotsam in the offshore waters of central America. Fish. Bull. U.S, 66, 13-29.
Jeanson, R.l., Deneubourg, J.-L., Grimal, A. & Theraulaz, G. (2004) Modulation of individual behavior and collective decision-making during aggregation site selection by the ant Messor barbarus. Behavioral Ecology and Sociobiology, 55, 388-394.
Kojima, S. (1956) Fishing for Dolphins in the Western Part of the Japan Sea- II Why Do the Fish Take Shelter under Floating Materials ? Bull. Japan. Soc. Sci. Fish, 21, 1049-1052.
Krause, J. & Ruxton, G.D. (2002) Living in groups. Oxford University Press. Lehodey, P., Bertignac, M., Hampton, J., Lewis, A. & Picaut, J. (1997) El Niño Southern
Oscillation and tuna in the western Pacific. Nature, 389, 715-718. Ménard, F., Stéquert, B., Rubin, A., Herrera, M. & Marchal, É. (2000) Food consumption of
tuna in the Equatorial Atlantic ocean: FAD-associated versus unassociated schools. Aquatic Living Resources, 13, 233-240.
Michelena, P., Jeanson, R., Deneubourg, J.-L. & Sibbald, A.M. (2010) Personality and collective decision-making in foraging herbivores. Proceedings of the Royal Society B: Biological Sciences, 277, 1093-1099.
Moreno, G., Dagorn, L., Sancho, G. & Itano, D. (2007) Fish behaviour from fishers' knowledge: the case study of tropical tuna around drifting fish aggregating devices (DFADs). Canadian Journal of Fisheries and Aquatic Sciences, 64, 1517-1528.
Nicolis , S.C. & Deneubourg , J.L. (1999) Emerging patterns and food recruitment in ants: an analytical study. Journal of Theoretical Biology, 198, 575-592.
Norris, K.S. & Schilt, C.R. (1988) Cooperative societies in three- dimensional space: On the origins of aggregations, flocks, and schools, with special reference to dolphins and fish. Ethology and Sociobiology, 9, 149-179.
Parrish, J.K. & Edelstein-Keshet, L. (1999) Complexity, pattern, and evolutionary trade-offs in animal aggregation. Science, 284, 99-101.
Parrish, J.K. & Hamner, W. (1997) Animal Groups in Three Dimensions. Cambridge University Press.
Pikitch, E.K., Santora, C., Babcock, E.A., Bakun, A., Bonfil, R., Conover, D.O., Dayton, P., Doukakis, P., Fluharty, D., Heneman, B., Houde, E.D., Link, J., Livingston, P.A., Mangel, M., McAllister, M.K., Pope, J. & Sainsbury, K.J. (2004) Ecosystem-based fishery management. Science, 305, 346-347.
Pitcher, T.J. (1992) Behaviour of Teleost Fishes. Springer. Pitcher, T.J. & Parrish, J.K. (1993) Function of shoaling behavior in Teleosts. The Behaviour
of Teleost Fishes 2nd ed. (ed. T.J. Pitcher), pp. 363-440. Chapman & Hall. Robert, M., Dagorn, L., Lopez, J., Moreno, G. & Deneubourg, J.-L. (2013) Does social
behavior influence the dynamics of aggregations formed by tropical tunas around floating objects? An experimental approach. Journal of Experimental Marine Biology and Ecology, 440, 238-243.
Acc
epte
d A
rtic
le
This article is protected by copyright. All rights reserved.
Romanov, E.V. (2002) Bycatch in the tuna purse-seine fisheries of the western Indian Ocean. Fishery Bulletin, 100, 90-105.
Sempo, G. (2006) Spatial organization in a dimorphic ant: caste specificity of clustering patterns and area marking. Behavioral Ecology, 17, 642-650 %U internal-pdf://sempo et al behav ecol 2006-0791270176/sempo et al behav ecol 0791272006.pdf.
Sempo, G., Canonge, S., Detrain, C. & Deneubourg, J.-L. (2009) Complex Dynamics Based on a Quorum: Decision-Making Process by Cockroaches in a Patchy Environment. Ethology, 115, 1150-1161.
Sibert, J. & Hampton, J. (2003) Mobility of tropical tunas and the implications for fisheries management. Marine Policy, 27, 87-95.
Soria, M., Dagorn, L., Potin, G. & Freon, P. (2009) First field-based experiment supporting the meeting point hypothesis for schooling in pelagic fish. Animal Behaviour, 78, 1441-1446.
Stephens, P.A., Frey-Roos, F., Arnold, W. & Sutherland, W.J. (2002) Sustainable exploitation of social species: a test and comparison of models. Journal of Applied Ecology, 39, 629-642.
Sumpter, D.J.T. (2010) Collective Animal Behavior. Princeton University Press. Taquet, M., Sancho, G., Dagorn, L., Gaertner, J.C., Itano, D., Aumeeruddy, R., Wendling, B.
& Peignon, C. (2007) Characterizing fish communities associated with drifting fish aggregating devices (FADs) in the Western Indian Ocean using underwater visual surveys. Aquatic Living Resources, 20, 331-341.
Uda, M. (1936) Distribution of Drifting Bodies in the Ocean Current. Bull. Japan. Soc. Sci. Fish, 4, 289-293.
Viscido, S.V., Parrish, J.K. & Grunbaum, D. (2004) Individual behavior and emergent properties of fish schools: a comparison of observation and theory. Marine Ecology-Progress Series, 273, 239-249.
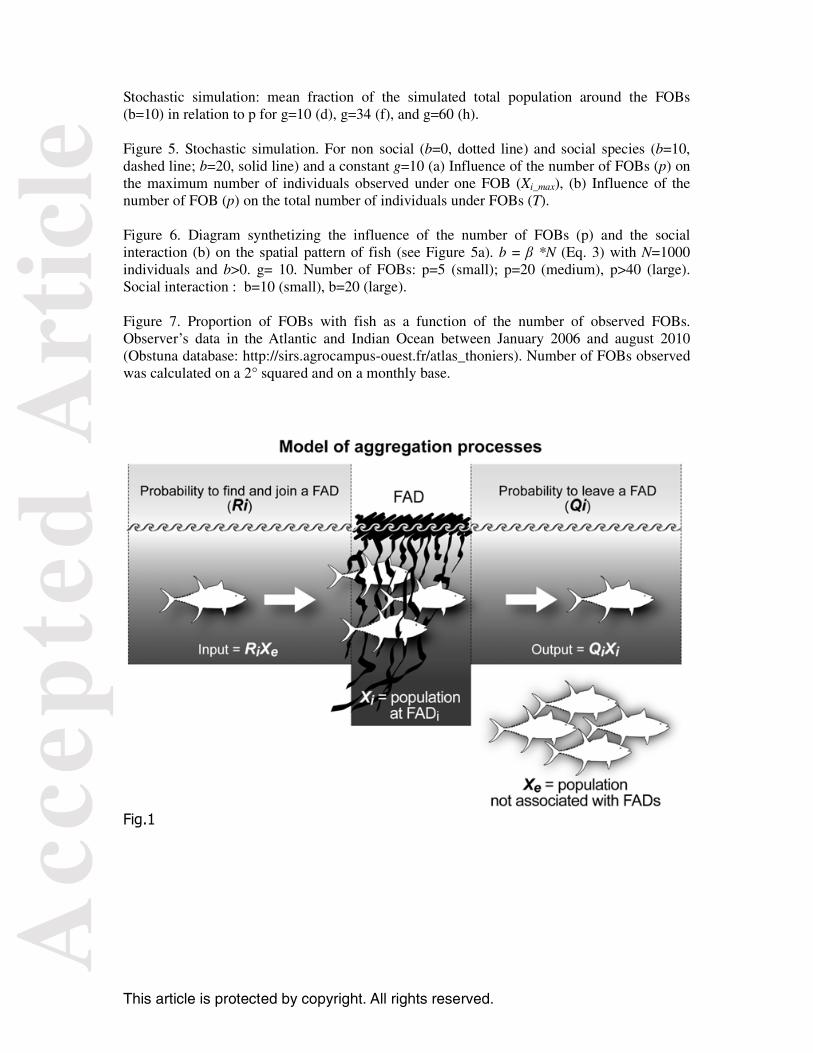
Figure 1. Model of aggregation process.
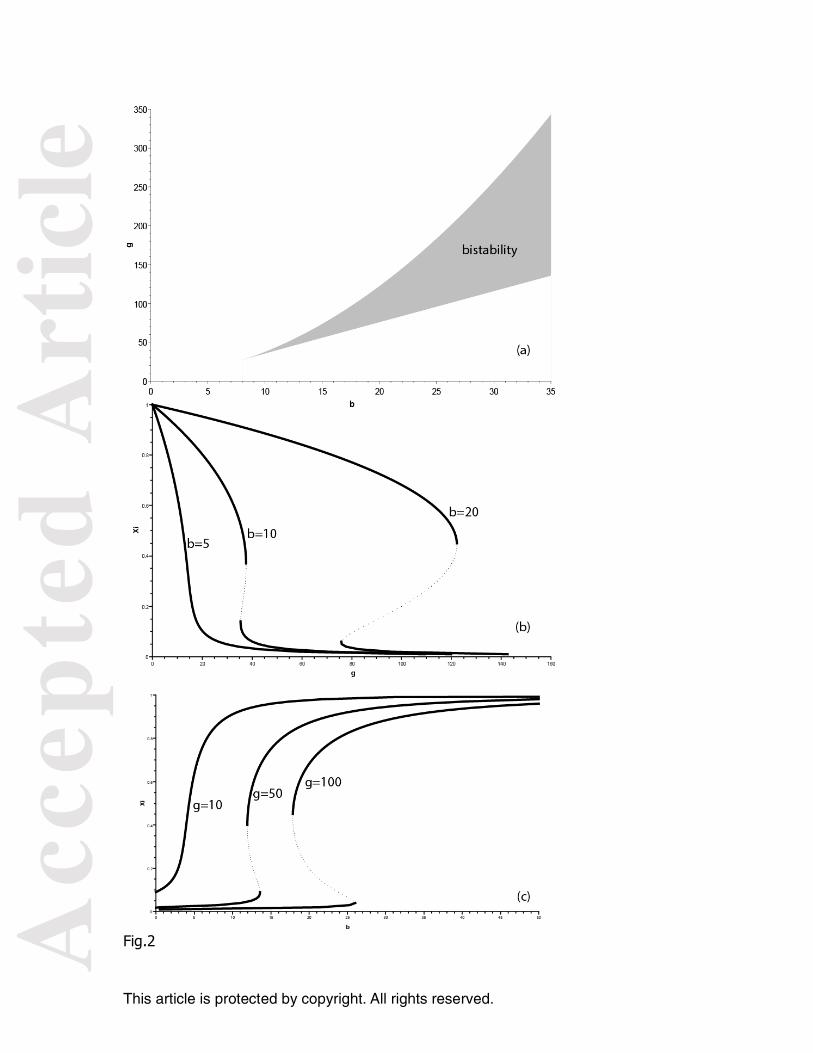
Figure 2. Diagrams of solutions for 1 FOB. (a) Space parameters: number of solutions as a function of the parameters g and b (b) Fraction of the total number of individuals around the FOB (x1) in relation to g for b=5, b=10, and b=20. Solid lines: stable solutions; dashed lines: unstable solutions. (c) Fraction of the total number of individuals around the FOB (x1) in relation to b for g=10, g=50, and g=100. Solid lines: stable solutions; dashed lines: unstable solutions.
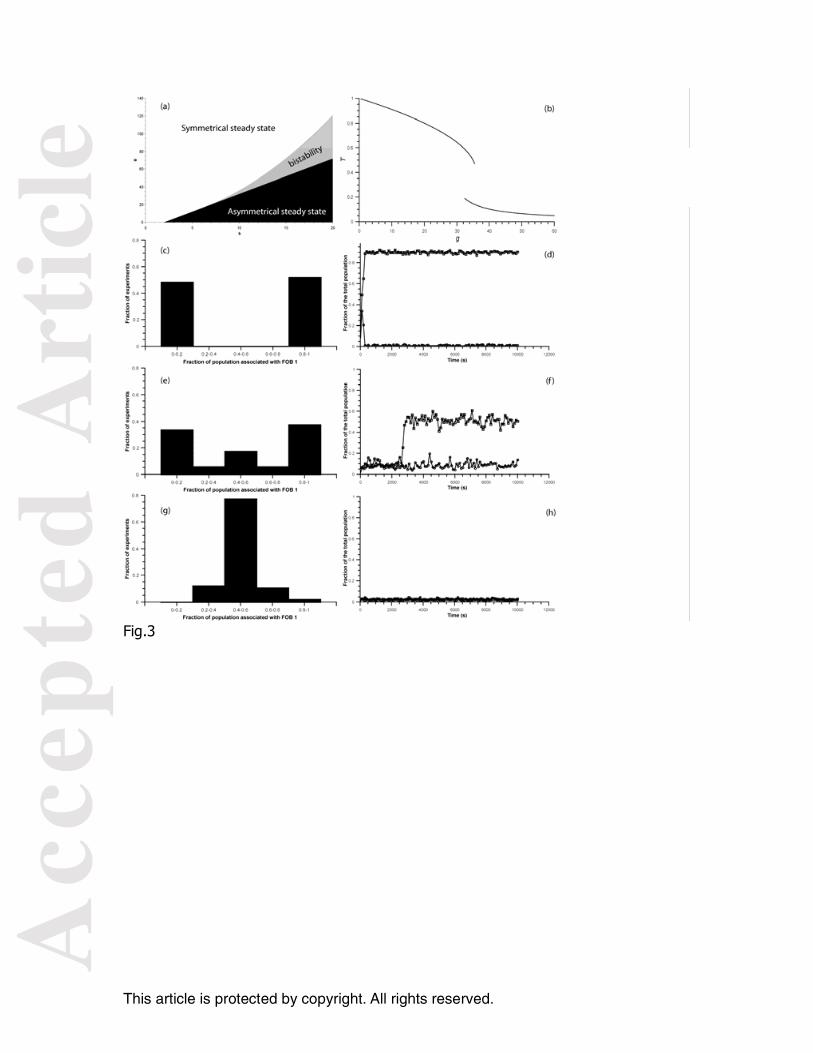
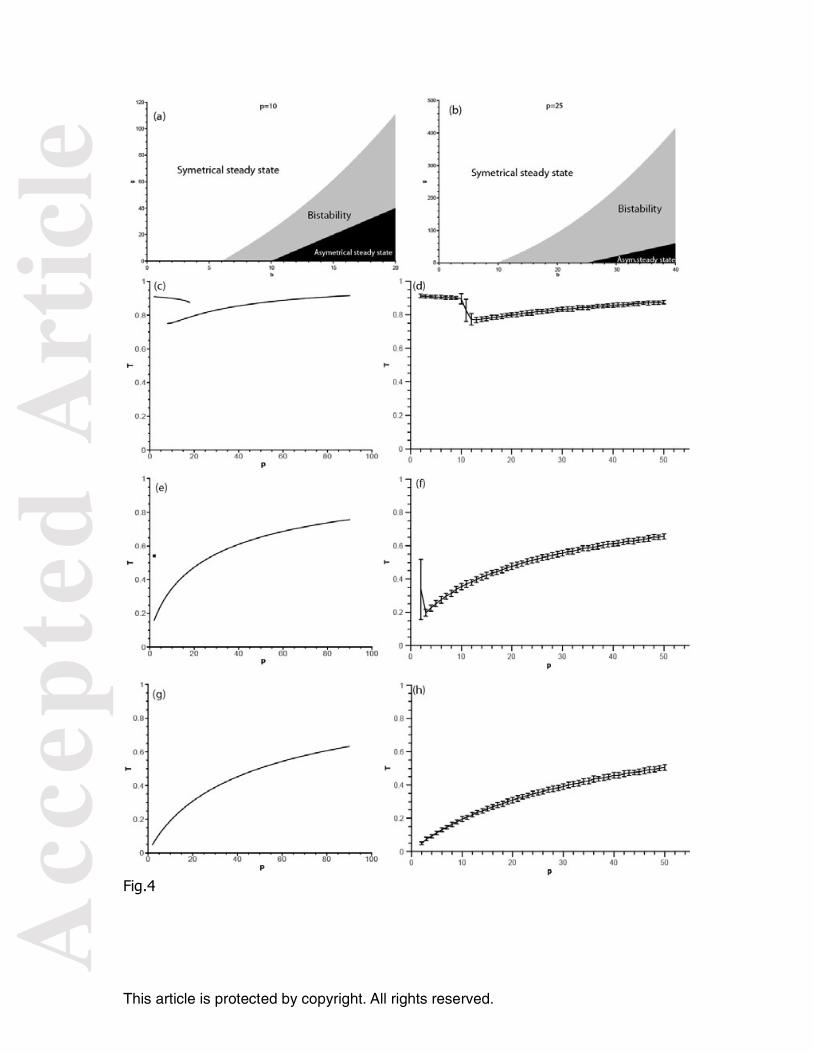
Figure 3. Diagrams of solutions for 2 FOBs. (a) Space parameters: number of solutions as a function of the parameters g and b (b) fraction of the total population around the FOBs as a function of g for a network of 2 FOBs. Stochastic simulation: for b=10 and 2 FOBs: Distribution of experiments according to the fraction of the total population associated with the FOB 1 for g= 10 (c), 34 (e) and 60 (g). Case study of the stochastic simulation of the time evolution of the fraction of the total population associated to each FOBs for g= 10 (d), 34 (f) and 60 (h). Figure 4. Diagrams of solutions for p FOBs. Space parameters: number of solutions as a function of the parameters g and b for p=10 (a) and p=25 (b) For b=10, fraction of the total population around the FOBs (T) in relation to p for g=10 (c), g=34 (e), and g=60 (g).
Acc
epte
d A
rtic
le
This article is protected by copyright. All rights reserved.
Stochastic simulation: mean fraction of the simulated total population around the FOBs (b=10) in relation to p for g=10 (d), g=34 (f), and g=60 (h). Figure 5. Stochastic simulation. For non social (b=0, dotted line) and social species (b=10, dashed line; b=20, solid line) and a constant g=10 (a) Influence of the number of FOBs (p) on the maximum number of individuals observed under one FOB (Xi_max), (b) Influence of the number of FOB (p) on the total number of individuals under FOBs (T). Figure 6. Diagram synthetizing the influence of the number of FOBs (p) and the social interaction (b) on the spatial pattern of fish (see Figure 5a). b = β *N (Eq. 3) with N=1000 individuals and b>0. g= 10. Number of FOBs: p=5 (small); p=20 (medium), p>40 (large). Social interaction : b=10 (small), b=20 (large). Figure 7. Proportion of FOBs with fish as a function of the number of observed FOBs. Observer’s data in the Atlantic and Indian Ocean between January 2006 and august 2010 (Obstuna database: http://sirs.agrocampus-ouest.fr/atlas_thoniers). Number of FOBs observed was calculated on a 2° squared and on a monthly base.
Fig.1