IMPACT OF INFORMATION TECHNOLOGY ON THE PERFORMANCE OF TUNISIAN BANKS: A STOCHASTIC
FRONTIER ANALYSIS WITH PANEL DATA
Syrine Ben Romdhane
Faculty of Economics and Management Sciences, University Tunis El Manar, Tunisia Department of Finance, High Institute of Management, University of Tunis, Tunisia
Department of Finance and Accounting, Economics and Financial Engineering Laboratory (LIFE), Tunisia
ABSTRACT This paper investigates the performance of information technology (IT) investments in a sample of 15 Tunisian banks over the period 1998–2009. We employ the standard Stochastic Frontier Approach on panel data to generate estimates of cost efficiencies. The study is enhanced by a comparison between the results found using the Data Envelopment Analysis (DEA) method and the Stochastic Frontier Analysis (SFA) method to test the soundness of these approaches to efficiency measurement. The empirical findings suggest that the impact of IT investments on Tunisian banks’ performance is positive. The analysis of the internal determinants of banks’ efficiency levels shows that size and managerial capacity positively and significantly affect the Tunisian banks’ cost efficiency, while the share of non-performing loans represents a source of inefficiency. Measuring the impact of various categories of IT investments (hardware, software and IT services) on banks’ cost efficiencies suggests that “the Productivity Paradox” does not affect all IT investments. Keywords: Information Technology, X-efficiency, internal determinants, Stochastic Frontier Approach, translog form, data envelopment analysis
INTRODUCTION During the past decade, information technology (IT) has been at the heart of international competition. It has had a deep impact in all economic fields, and it is now integrated into most production activities. However, it has been difficult to determine the relationship between IT investment and the financial performance or productivity gains of businesses. Therefore, some authors questioned the impact of information technology on productivity in the banking industry. This question began as a major literary trend in 1987 when Robert Solow, winner of the Nobel Prize in Economics, proposed his famous "productivity paradox" during his Nobel speech. “You can see the computer age everywhere but in the
Syrine Ben Romdhane
96
productivity statistics!”. This statement led to countless studies in the United States and Europe and gave birth to varied explanations. Research assessing the impact of IT investment had begun.
The issue of measuring the contribution of IT investments to the performance of an organisation has been addressed quite frequently, and specialists agree about the difficulties that arise. Several studies were conducted regarding the link between productivity and IT investments to attempt to understand the explanations behind the "productivity paradox". Some of these studies were formulated to explain the ineffectiveness of information technology in improving the performance of banks. These mainly include the works of Loverman (1994), Morrisson and Brendt (1990), Licht and Moch (1999), and Oluwagbemi, Abah and Achimugu (2011). In addition, some studies have found a positive relationship between IT investment and the productivity of a banking firm (including the works of Lichtenberg (1995), Brynjolfsson and Hitt (1996), and Prasad and Harker (1997)).
While several authors studied the effects of investments in information technology on the productivity of banks, very few economists showed interest in studying the effects of these investments on profitability. Most of these studies, including those of Licht and Moch (1999), and Prasad and Harker (1997), concluded that there was no link between IT investments and bank profitability. However, Brynjolfsson and Hitt (1996), Siegel and Griliches (1992), and Greenan, L'Horty and Mairesse (2002) reached the opposite conclusion.
As for the impact of IT investment on the performance of banks, few studies were actually interested in evaluating performance following the adoption of information technology. Nevertheless, the need for the IT remains undeniable for any strategic or technological change. The first study conducted in this context was in 2000 by Sullivan, who was the first economist to measure the effects of the risks related to Internet activity on the banking industry. Simpson's work in 2002 and the study by De Young and Hunter (2002) further complemented that of Sullivan (2000). A study conducted by Chen and Zhu in 2004 focused on the indirect effects of information technology on the performance of banks. That study highlighted the fact that IT can make a substantial contribution to performance.
By interpreting the previous findings on "the productivity paradox", our research attempts to empirically validate the relationship between IT investment and performance in the context of the emerging country of Tunisia. Our study is therefore devoted to examining the following key question: What is the impact of information technology on the performance of Tunisian banks?
To empirically validate the relationship between IT investment and the
Impact of IT on the Performance of Tunisian Banks
97
performance of Tunisian banks, we use the most commonly used parametric method in the literature, the Stochastic Frontier Approach. Thus, the objective of this work is to evaluate the X-efficiency in banks during the period 1998–2009 while identifying, on the one hand, the impact of information technologies introduced by banks on their X-efficiency, and on the other hand, the internal determinants of inefficiency levels in these banks.
In addition, this study is enhanced by a comparison between the results
found using the DEA method (Data Envelopment Analysis) and the SFA method (Stochastic Frontier Approach)1 to test the soundness of these approaches to efficiency measurement. Finally, we analyse not only the relationship between IT investment and the performance of banks but also the impact of different IT components on banks’ performance.
LITERATURE REVIEW
As outlined above, the results of previous studies on the impact of IT investment on firm performance are contradictory, which arouses the interest of researchers who wish to clarify the nature of this relationship and its main determinants. Several methods have been used for this purpose, but very few studies evaluated the impact of IT investment on the performance of banks using the Stochastic Frontier Approach.
One objective of banks is to minimise the cost of their payment systems, which involves searching for economies of scale based on technical changes. Despite the difficulties of representing and incorporating technical changes in productivity analyses, an econometric approach can be used to measure the impact of technological changes on banking efficiency. In his book devoted to the productivity of banking branch networks, Rowe (1994) identified three empirical studies on the relationship between bank efficiency and effective technical changes measured by computerisation. These three studies are all based on data from U.S. banks since 1968.
Daniel, Longbrake and Murphy (1973) attempted to explain the influence
of the diffusion of computers on the operating costs of U.S. banks. The authors represented these costs with a Cobb-Douglas function under the assumption of constant returns to scale, where production was measured by the number of deposit accounts. The study showed that banks that had a computer for less than one year had higher costs compared with more experienced banks that had been equipped with a computer for more than two years. This result was a consequence of technology learning, but the study did not provide a direct answer to the question of the influence of IT on operating costs and did not explain the
Syrine Ben Romdhane
98
choice of hypothesis concerning supposed constant returns to scale. Kolari and Zardkoohi (1987) used a model that tested the relationship between the cost of deposits and a ratio that related IT costs to personnel costs allocated to deposits to show that computerisation reduced the cost of deposits, but the resulting gains had not been exhausted. The authors attributed this result to indivisibilities associated with centralised computer systems in the United States that constituted a limit to computerisation. Lawrence and Shay (1986) measured the efficiency of banks with a multi-product translog function in which they incorporated the cost of computer rental. They showed that the decline in the price of personal computers led to a significant decline in banking employment. The authors concluded that the development of personal computers at the expense of central computers resulted in a significant reduction of the workforce. The model produced estimates for four groups of banks classified by size to show that computerisation allowed significant economies of scale and scope. The obvious limitation of this model was the low importance given to the costs arising from the rental of computers as opposed to the costs of computerisation.
Thus, the studies exploring the impact of technological changes on the U.S. banking sector concluded that there was a reduction in the processing costs of banking transactions along with a decrease in banking employment.
In a more recent study, Beccalli (2007) found a positive relationship between total IT investment and performance in a study of the European banking sector (a sample of 737 banks) during the period 1994–2000. The author used the SFA to estimate the efficiencies of costs and benefits for European banks. His main objective was to determine whether IT investments improved the profitability of banks, and whether banks could gain a competitive advantage by investing in IT and therefore obtain higher short- and long-term profits. The empirical results of the study showed that the impact of IT investment on banks was negative on short-term profitability as measured by ROA and ROE ratios. However, IT had a positive contribution to the long-term costs (technological changes) for all European banks, thus reducing the actual annual costs of production by approximately 3.1%. In addition, the impact of technological changes on cost reductions consistently increased over the studied period. A final result of the study showed that the impact of different types of IT (hardware, software and services) on the performance of European banks was heterogeneous. While investment in services was positively related to bank profitability, acquisitions of hardware and software had a negative impact on performance.
In the Tunisian context, the use of parametric methods in studies of the efficiency of banks was often used in the context of the restructuring of the banking system or of transformations due to structural changes (Kablan, 2009).
Impact of IT on the Performance of Tunisian Banks
99
According Zaghla and Boujelbene (2008), out of the 130 studies on banking efficiency surveyed by Berger and Humphrey (1997), only seven were based on developing countries. The authors noted that none of the selected works covered Tunisia.
Chaffai (1997) was the first researcher to analyse the efficiency of Tunisian commercial banks. This author, evaluating the experience of the deregulation of the Tunisian banking system, found that the total efficiency of banks increased following the liberalisation process initiated in 1986. Another study conducted by Chaffai and Dietsch (1998) undertook an analysis of the evolution of efficiency over time in Tunisia and Morocco. Joumady (2000), furthering the work of Chaffai and Dietsch (1998), adopted a broader approach that considered the pace of technological development. The author showed that the commercial banks were more efficient than the development banks in Tunisia. However, he concluded that in the absence of a competitive environment, there was no clear trend in the evolution of efficiency over the period 1989–1995. Dahmane (2002) followed the approach of Rouabah (2002) to measure the impact of financial liberalisation on the efficiency of Tunisian commercial banks. This author used an SFA to compare the efficiency of banks in the sample over the period 1983–2000. The theoretical and empirical developments showed that the choice of banking output played a particularly important role in the degree of efficiency of 10 Tunisian commercial banks. Thus, activities relating to "collecting deposits" and loans were positively correlated to the efficiency of commercial banks. As for the evolution of efficiency scores, the results of panel data suggested that banks, whether small, medium or large, showed degrees of (in)efficiency, the extent of which varied based on a certain number of determinants. Zaghla and Boujelbene (2008) resorted to an extension of the SFA called "Improved SFA2", which assumes a truncation parameter that was specific to each bank. The SFA was used with a deterministic model of inefficiency to assess the X-efficiency of Tunisian commercial banks during the period 1989–2003 while identifying the factors that explained the level of efficiency. The results of this study revealed pronounced differences in efficiency depending on the size and structure of bank ownership. The average efficiency of small and medium sized banks was significantly greater than large banks. In addition, public banks were relatively more efficient than private banks. Bannour (2008) attempted to assess the productive efficiency scores of 20 Tunisian commercial banks throughout the 1990–2007 period, which was marked by major changes following the adoption of various financial liberalisation measures by the Tunisian government. To study the cost efficiency levels achieved by these banks, the author used the SFA and tried to identify variables that explained the level of inefficiency (efficiency) of the banks in the sample. The results suggested that Tunisian banks, whether small or large, featured quite different degrees of efficiency. Banks that achieved the best
Syrine Ben Romdhane
100
efficiency scores were STB (93.3%), BNA (92%) and UIB (89.5%), followed by BIAT (86.4%) and ATB (83.5%).
However, despite the scientific contribution of this work, the authors did not integrate IT into their studies, although it certainly contributed to the development of the Tunisian banking sector. To fill this gap, Omri and Hachana (2008) followed the approach of Beccalli (2007) and attempted to assess the impact of IT investment on productivity in six Tunisian commercial banks over a five-year period (2000-2006). The authors first attempted to identify the nature of the relationship between IT investment and productivity, and then they explained this relationship using the stochastic frontier method to estimate a cost and banking profit function. The obtained results demonstrated the important role played by IT in financial institutions. In fact, the results showed that IT investments improved banking productivity. Moreover, the authors indicated that taking into consideration the delay between IT investment and performance measures slightly improved the relationship between the two variables. In addition, the authors also showed that measures of X-efficiency better explained the relationship between IT investment and performance than traditional ratios. STOCHASTIC FRONTIER: THE MODEL OF AIGNER, LOVELL AND SCHMIDT (1977) The stochastic method, also called the “composed error model”, was simultaneously introduced by Aigner, Lovell and Schmidt (1977) and Meeusen and Van Den Broeck (1977), who specified the production function fitted on individual data with an error term composed of two independent parts, namely, a purely random component (v) distributed on each side of the production frontier and a component representing technical inefficiency (u) distributed on only one side of the frontier. The random component follows a normal symmetric distribution, while the inefficiency component follows a positively skewed distribution for the cost function and a negatively skewed distribution for the production function. Stochastic Frontier Cost Function Schmidt and Lovell (1979) showed that under the hypothesis of cost minimisation, the stochastic production frontier of a firm can be written in the form of a cost function. To specify a stochastic frontier cost function, the sign of the inefficiency term must be changed3. Thus, the cost frontier described by Schmidt and Lovell (1979) is given by: Yi = Xi β + (Vi + Ui) i = 1, ………, N (1)
Impact of IT on the Performance of Tunisian Banks
101
where: Yi is the log of production cost of the ith firm; Xi the vector (K × 1) of input and output prices; β is a vector of parameters to be estimated; Vi are the measurement errors and are iid according to symmetric normal distribution N (0, σv
2). They are independent of the Ui terms, which are positive and represent the inefficiency cost in production. They are often assumed iid according to skewed normal distribution N(0,σu
2). Time-Varying Efficiency Effect: Battese and Coelli Model Specification (1995) To avoid the pitfalls of the two-step approach proposed by Battese and Coelli (1992), we implement the one-step approach recommended by the authors in 1995, where a deterministic component is dissociated at the level of inefficiency, represented by a set of variables assumed to influence the efficiency of the bank, from a random part associated with unobservable factors. Thus, the distribution of the random term µit related to the measurement of inefficiency is a normal distribution truncated at zero variance σu
2, and the mean mit is defined as mit = Zit δ, where δ is a vector of p parameters to be estimated and vector of p variables that can affect the efficiency of the “i” bank at a “t” time.
IMPACT OF IT ON THE PERFORMANCE OF TUNISIAN BANKS: ESTIMATION OF A STOCHASTIC FRONTIER TRANSLOG COST FUNCTION In this section, we attempt to conduct an econometric analysis of IT’s impact on the performance of Tunisian banks. The technique used is a stochastic frontier function applied to a multi-product translog cost. The methodology we use is based on the estimation of a model that meets the objectives of the issues raised. In this section, we specify the empirical approach, the model that is the subject of subsequent estimates, our research hypotheses, the definition of our sample and a detailed description of the variables. We then present the results of the estimation of the stochastic frontier translog cost function. Empirical Approach The question to be answered concerns the best combination of inputs that can produce an optimal combination of outputs while minimising production costs. Given the multiplicity of functions of a bank, we consider the translog function to be the most appropriate compared with other functional forms because it takes
Syrine Ben Romdhane
102
into account multiple complementary links between the explanatory factors and does not impose any restriction on the form of the cost function. We specify this function in its standard form for m outputs and k inputs, where the values of TC (total cost of the bank), q (outputs) and w (input price) are taken in natural logs as follows: Ln TCit = α0+ k ln qit + j ln wjt + ij ln qit ln qjt +
ij ln qit ln wjt + ij ln wit ln wjt + µit + νit (2)
However, to satisfy the symmetry condition of the cost function, the
following restrictions must be imposed: δhj = δjh and σjk = σkj. This function is assumed to be positive (because prices and outputs are positive), homogeneous at degree 1, monotonic and concave in prices (because prices cannot increase infinitely). Some restrictions must also be imposed on the parameter so that the cost function is homogeneous, i.e., j = 1, ij = 0 and ij = 0. We also believe that σij = 0 because of collinearity. The estimation of the model using the method of maximum likelihood provides the cost efficiency measures of the studied banks.
In the case of three inputs and two outputs, Specification (2) includes 25 parameters of interest to be estimated. The constraints of symmetry and homogeneity significantly reduce the number of parameters (15 parameters of interest instead of 25). These homogeneity restrictions materialise in the cost function by normalising the inputs of total cost and prices by one of the prices (we choose the price of the input L, wL). The stochastic frontier translog cost function is thus given for two outputs (q1) and (q2) and three input prices (wL), (wD) and (wk), as follows:
i (1 → 15): refers to the number of banks; t (1 → 12): refers to the years of study (1998–2009).
Impact of IT on the Performance of Tunisian Banks
103
Hypotheses and Research Methodology
The research hypotheses
Hypothesis 1: Impact of information technology
Studies conducted on the impact of IT on the productivity of firms are often contradictory. While the works of Brynjolfsson and Hitt (1996), Siegel and Griliches (1992) and Lichtenberg (1995) asserted that there is a positive impact of IT on productivity, the results of Dos Santos, Peffers and Mauer (1993), Prasad and Harker (1997) and Licht and Moch (1999) argued the opposite. Therefore, we expect a positive sign for this variable because IT has the potential to reduce operating costs. Our first hypothesis is therefore as follows:
H1: Investment in information technology has a positive impact on bank performance.
Hypothesis 2: Impact of the “intermediation” variable
To examine the relationship between intermediation activity and bank efficiency, we use the ratio "intermediation margin/GNP". A low ratio may result in improved efficiency of banks because they benefit from economies of scale. Our second hypothesis is therefore as follows:
H2: The “intermediation” variable has a positive impact on performance.
Hypothesis 3: Impact of size
It is clear that the size variable is largely associated with economies or diseconomies of scale. According to Berger, Hancock and Humphrey (1993), “large firms tend to be closer to the efficient frontier than smaller firms”. However, in analysing the effects of financial liberalisation on the efficiency of Tunisian banks, Cook, Hababou and Roberts (2000) reached a contradictory result. The authors emphasised the fact that the big banks, which are generally publicly owned, operate at a suboptimal scale and tend to extend credit to promote essentially political priorities regardless of profitability. The big banks therefore have a large amount of credit losses. Hence, we expect a negative effect of size on bank performance.
H3: The size variable has a negative impact on performance.
Hypothesis 4: Impact of credit risk
According to the Basel Committee (2007), the largest bank risk is credit risk. Increased risks can be explained through provisions enacted by banks. This
Syrine Ben Romdhane
104
increase in provisions affects banks’ results. We conclude that the higher the risk, the greater probability of having bad debts, which therefore results in lower bank performance.
H4: The risk variable has a negative impact on performance.
Hypothesis 5: Impact of management/staff ratio
According to Chaffai (1997) and Berger et al. (1993), “The productivity gains from improved managerial efficiency are much more important than those which might be achieved by the size effect” (quoted in Zaghla and Boujelbene, 2008, p.2). The “management/staff” ratio therefore influences the performance of banks positively because it causes an improvement in agents’ productivity.
H5: The “management/staff” variable has a positive impact on performance.
Research design
Presentation of the sample
To determine the impact of IT investment on banking performance, we selected a sample of 15 Tunisian banks (10 commercial banks: STB, BNA, BIAT, BH, Attijari Bank, Amen Bank, UIB, BT, ATB and BTS and five universal banks: BTK, TQB, BTL, STUSID and BTE).
The analysed sample consists of all the commercial banks with the exception of the Arab Banking Corporation (ABC), which had no regular activity during our study period (the ABC Tunisia Bank was created in 2000). In addition, for reasons of statistical homogeneity, we excluded two small banks from our survey: Citibank (CB) and the Banque Franco-Tunisienne (BFT).
Definition of variables
In the model we adopt, performance is regressed on the use of information technology (the variable of interest) and on other relevant variables (control variables).
We consider the X-efficiency a measure of performance (or productivity, as we are analysing the banking sector), and we attempt to investigate the effect of IT investment on this measure.
Performance (efficiency-X) = f (IT)
Impact of IT on the Performance of Tunisian Banks
105
In this study, we adopt the intermediation approach originally developed by Sealey and Lindley in 1977. The range of variables is composed of a vector of input prices (wit) and a vector of outputs (qit). Input prices are related to three categories of production factors: labour (L), measured by the number of employees, the financial capital (D), measured by the sum of sight deposits to customers, savings deposits, bonds, term deposits and other financial products, and other amounts due to customers. The different forms of deposits that constitute the financial capital are considered inputs, as stipulated by the supporters of the intermediation approach.
The physical capital (K) is appreciated by net fixed assets. The total cost (TC) includes all operating and financial costs: the "financial costs" are principally interest expenses. The "operating costs" are the expenses for labour and capital, that is, personnel expenses and depreciation and amortisation of fixed assets. The cost calculation is based on bank accounts and bank balance sheet results.
The composition of these costs is summarised as follows: 1. The price of labour (wL) is measured as the ratio of personnel expenses
resulting from the sum of annual salaries for the bank’s staff and expenses relating those salaries to the annual number of employees. We therefore have: wL = Personnel expenses / Number of employees.
2. The price of financial capital (wD) is measured by the average cost of borrowed resources as the ratio of paid interest to deposits. It therefore consists of comparing accrued interest and similar expenses on deposits and customer assets with total deposits. We therefore have: wD = Interest Expense / Total borrowings.
3. The price of physical capital (wk) is approximated as the ratio of the amortisation and impairment of assets to fixed assets. We therefore have: wk = amortisation and impairment of assets / Fixed assets.
Concerning banking products, we consider the following two outputs: 1. Output 1 (q1): Total credits, which includes credits to customers
(portfolio discount accounts receivable of clients + Credits on special resources + Other customer loans) and interbank loans (loans to banks and specialised agencies + cash, BCT, certificates of deposit and commercial paper).
2. Output 2 (q2): The securities portfolio, which represents the commercial securities portfolio and the investment portfolio.
• The variable of interest
Syrine Ben Romdhane
106
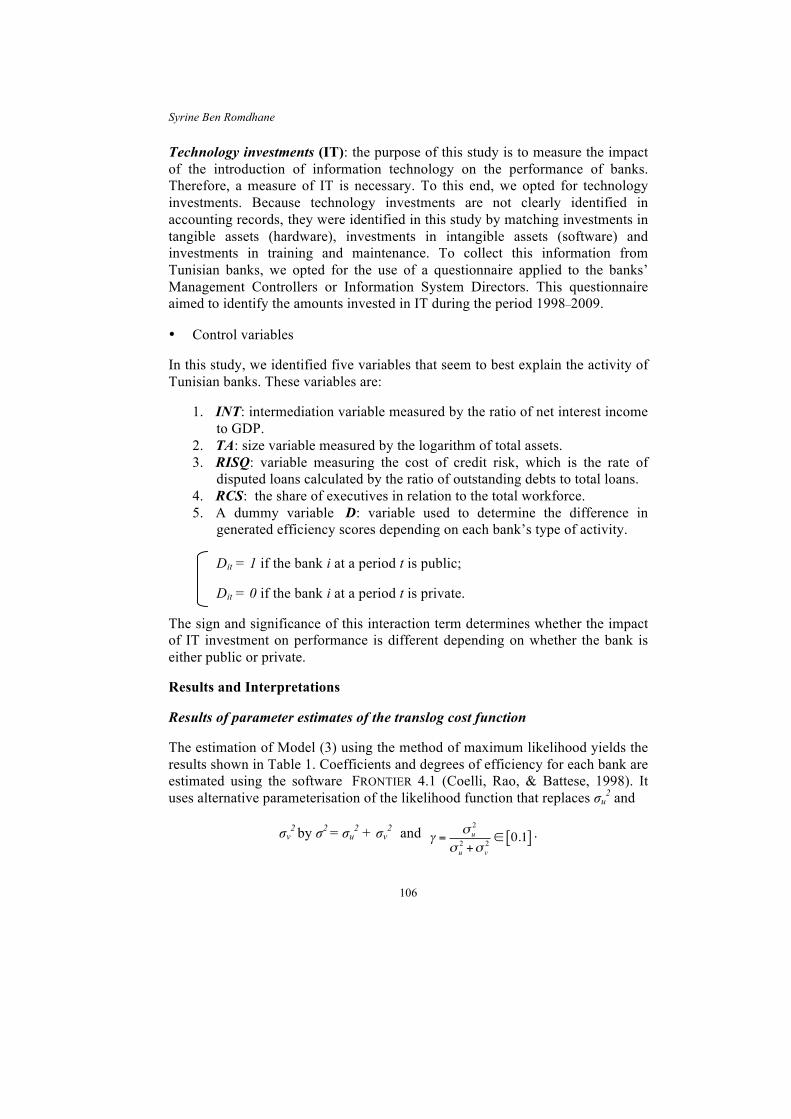
Technology investments (IT): the purpose of this study is to measure the impact of the introduction of information technology on the performance of banks. Therefore, a measure of IT is necessary. To this end, we opted for technology investments. Because technology investments are not clearly identified in accounting records, they were identified in this study by matching investments in tangible assets (hardware), investments in intangible assets (software) and investments in training and maintenance. To collect this information from Tunisian banks, we opted for the use of a questionnaire applied to the banks’ Management Controllers or Information System Directors. This questionnaire aimed to identify the amounts invested in IT during the period 1998–2009.
• Control variables
In this study, we identified five variables that seem to best explain the activity of Tunisian banks. These variables are:
1. INT: intermediation variable measured by the ratio of net interest income to GDP.
2. TA: size variable measured by the logarithm of total assets. 3. RISQ: variable measuring the cost of credit risk, which is the rate of
disputed loans calculated by the ratio of outstanding debts to total loans. 4. RCS: the share of executives in relation to the total workforce. 5. A dummy variable D: variable used to determine the difference in
generated efficiency scores depending on each bank’s type of activity. Dit = 1 if the bank i at a period t is public;
Dit = 0 if the bank i at a period t is private.
The sign and significance of this interaction term determines whether the impact of IT investment on performance is different depending on whether the bank is either public or private.
Results and Interpretations
Results of parameter estimates of the translog cost function
The estimation of Model (3) using the method of maximum likelihood yields the results shown in Table 1. Coefficients and degrees of efficiency for each bank are estimated using the software FRONTIER 4.1 (Coelli, Rao, & Battese, 1998). It uses alternative parameterisation of the likelihood function that replaces σu
2 and
σv2 by σ2 = σu
2 + σv2 and γ = σ u
2
σ u2 +σ v
2 ∈ 0.1[ ] .
Impact of IT on the Performance of Tunisian Banks
107
Table 1 Results of parameter estimates of the Translog cost function under the hypothesis of time variable effect
Variables Coefficient Standard deviation t-ratio
⎟⎟⎠
⎞⎜⎜⎝
⎛
L
K
wwLn
0.054
0.198
0.782
⎟⎟⎠
⎞⎜⎜⎝
⎛
L
D
wwLn
–0.189
0.283
–0.504
1Lnq 1.043 0.373 2.413**
2Lnq 1.472 0.343 10.213***
2
21
⎟⎟⎠
⎞⎜⎜⎝
⎛⎟⎟⎠
⎞⎜⎜⎝
⎛
L
K
wwLn
–0.034
0.026
-0.196
2
21
⎟⎟⎠
⎞⎜⎜⎝
⎛⎟⎟⎠
⎞⎜⎜⎝
⎛
L
D
wwLn
0.017
0.0198
0.396
⎟⎟⎠
⎞⎜⎜⎝
⎛⎟⎟⎠
⎞⎜⎜⎝
⎛⎟⎟⎠
⎞⎜⎜⎝
⎛
L
D
L
K
wwLn
wwLn
–0.027
0.133
–2.040**
( )2121 Lnq
0.098
0.053
2.69**
( )2221 Lnq
0.004
0.009
0.687
( )21LnqLnq –0.077 0.316 –2.045**
⎟⎟⎠
⎞⎜⎜⎝
⎛⎟⎟⎠
⎞⎜⎜⎝
⎛1Lnq
wwLnL
K
–0.089
0.0233
–9.546***
⎟⎟⎠
⎞⎜⎜⎝
⎛⎟⎟⎠
⎞⎜⎜⎝
⎛2Lnq
wwLnL
K
0.076
0.0204
14.325***
⎟⎟⎠
⎞⎜⎜⎝
⎛⎟⎟⎠
⎞⎜⎜⎝
⎛1Lnq
wwLnL
D
–0.008
0.280
0.774
⎟⎟⎠
⎞⎜⎜⎝
⎛⎟⎟⎠
⎞⎜⎜⎝
⎛2Lnq
wwLnL
D
0.024
0.0159
0.134
***, **,* t of student acceptable to the threshold of 1%, 5% and 10%.
Syrine Ben Romdhane
108
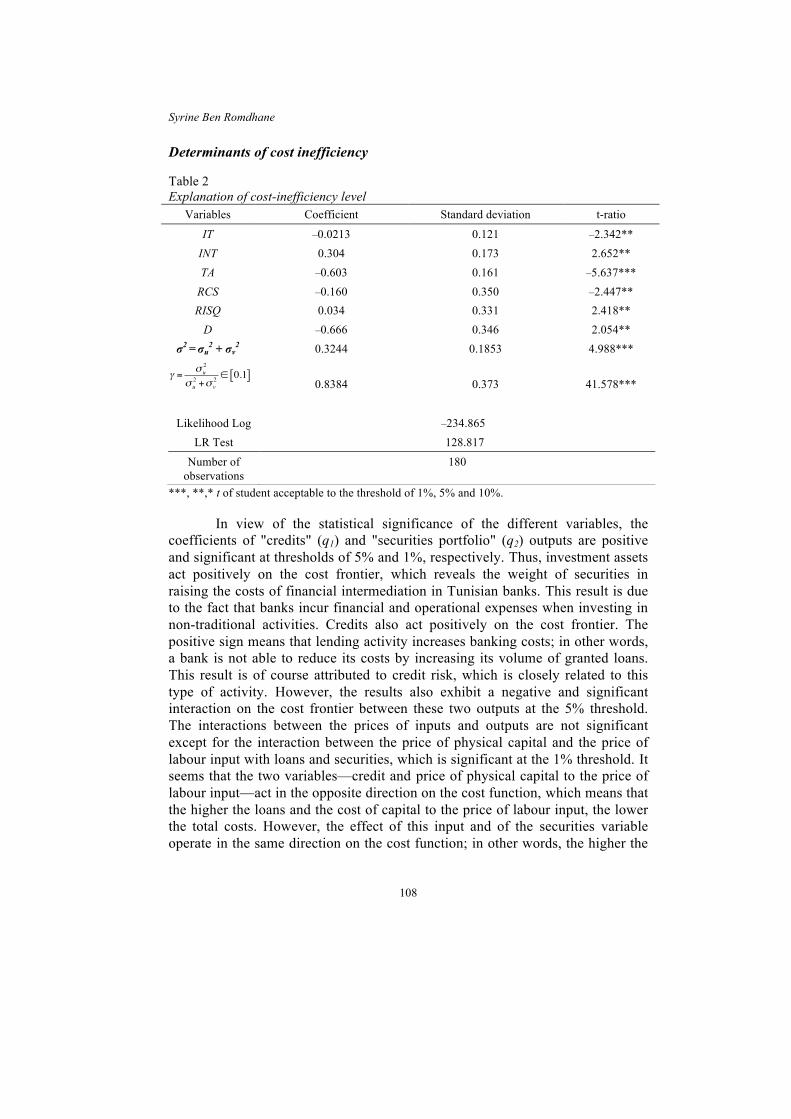
Determinants of cost inefficiency
Table 2 Explanation of cost-inefficiency level
Variables Coefficient Standard deviation t-ratio
IT –0.0213 0.121 –2.342** INT 0.304 0.173 2.652** TA –0.603 0.161 –5.637***
***, **,* t of student acceptable to the threshold of 1%, 5% and 10%.
In view of the statistical significance of the different variables, the coefficients of "credits" (q1) and "securities portfolio" (q2) outputs are positive and significant at thresholds of 5% and 1%, respectively. Thus, investment assets act positively on the cost frontier, which reveals the weight of securities in raising the costs of financial intermediation in Tunisian banks. This result is due to the fact that banks incur financial and operational expenses when investing in non-traditional activities. Credits also act positively on the cost frontier. The positive sign means that lending activity increases banking costs; in other words, a bank is not able to reduce its costs by increasing its volume of granted loans. This result is of course attributed to credit risk, which is closely related to this type of activity. However, the results also exhibit a negative and significant interaction on the cost frontier between these two outputs at the 5% threshold. The interactions between the prices of inputs and outputs are not significant except for the interaction between the price of physical capital and the price of labour input with loans and securities, which is significant at the 1% threshold. It seems that the two variables—credit and price of physical capital to the price of labour input—act in the opposite direction on the cost function, which means that the higher the loans and the cost of capital to the price of labour input, the lower the total costs. However, the effect of this input and of the securities variable operate in the same direction on the cost function; in other words, the higher the
Likelihood Log –234.865 LR Test 128.817
Number of observations
180
Impact of IT on the Performance of Tunisian Banks
109
securities and the cost of capital to the price of labour input, the higher the total costs.
The main results that emerge from Table 2 are:
a. The parameter estimation of variance γ = 0.8384 is close to unity and significant to 1%, indicating that the determinants of inefficiency seem to act significantly on the cost efficiency of Tunisian banks. As a result, the distance of a bank from the "best practices" frontier is largely explained by the inefficiency cost (83.84%), and measurement errors contribute only 16.16%.
b. With the test of the maximum likelihood ratio, we can check if a model is generally explanatory. The null hypothesis that indicates whether the determinants of inefficiency are absent from the model is strongly rejected. Indeed, when the empirical LR4 ratio is greater than the theoretical value of the chi-square law at the 1% threshold, we can conclude that the model is generally explanatory. In our case, the empirical value of ratio LR = 128.817 is much higher than the theoretical value of chi-square at the 1% threshold and at 6 degrees of freedom5 χ1% (6) = 16.8119.
c. Table 2 shows that the (IT) variable, as measured by the “IT investment / equity” proxy, acts positively and significantly on the cost efficiency of Tunisian banks (negative and significant at the 5% threshold). This expected result contradicts the "productivity paradox", whereby IT is in no way associated with better performance. It is in the interest of Tunisian banks, which are interested in improving their productivity and efficiency, to invest more in IT because it plays an important role in improving their cost efficiency. Therefore, we accept the H1 hypothesis, and we confirm that Tunisian banks have an incentive to invest more in IT.
d. The results show that the intermediation ratio (INT), as measured by the weight of the intermediation margin in the GDP, acts negatively (positive and significant) on the cost efficiency of banks, in the sense that a bank with a certain level of intermediation certainly has the opportunity to benefit from economies of scale and consequently reduce its costs. However, a volume of credit that is too large may increase the use of more expensive financial resources. We therefore reject the H2 hypothesis.
e. The TA variable acts positively and significantly at the 1% threshold (negative sign) on the cost efficiency of banks. The greater the size, the higher the efficiency level (rejection of the H3 hypothesis).
f. The RISQ variable is an indicator of the quality of assets generating interest. However, the higher the risk, the higher the likelihood of bad
Syrine Ben Romdhane
110
debts. This variable acts positively and significantly on the cost inefficiency of Tunisian banks (at the 5% threshold) and thus negatively on cost efficiency (validation of the H4 hypothesis). Thus, the costs for banks increase with non-performing loans. The Tunisian banking sector does not seem to adopt a risk-averse strategy.
g. We used the managerial capacity of staff as an environmental variable. This variable acts negatively and significantly at the 5% threshold on the cost inefficiency of the banks in the sample. This factor therefore positively affects the efficiency of these banks, given the added value of executives. We therefore accept the H5 hypothesis.
h. The Dummy variable is negative and significant at 5%. We conclude that public banks have an average level of cost efficiency that is higher than that of private banks.
Estimation of cost efficiency scores
Table 3 shows the average annual cost effectiveness of Tunisian banks in our sample over the period 1998-2009.
Table 3 Scores of X-efficiency during the period 1998–2009
What do these efficiency scores reveal? The results obtained from the
panel data suggest that the banks in the sample show a relatively high degree of efficiency. The average efficiency of the sector as a whole during the period (1998–2009) is estimated at 95.42%. This result means that the banking costs are above the efficiency frontier of 4.688%6; in other words, the inefficiency term reflects a waste of resources in the Tunisian banking sector of approximately 4.688%.
Impact of IT on the Performance of Tunisian Banks
111
Over the studied period, the banks that obtained the highest efficiency scores are STUSID (95.59%) and TQB (95.58%), followed by BNA (95.57%). These results imply that with the same resources, these banks are able to increase efficiency by 4.41%, 4.42% and 4.43%, respectively, while maintaining the same level of activity. STUSID and TQB are universal banks, and BNA is one of the largest commercial banks in Tunisia (with STB). STUSID and TQB are medium sized and are not comparable to the largest public bank in the industry, which demonstrates the absence of a linear relationship between size and efficiency. In addition, universal activities must be taken into account in explaining the efficiency of banks. STB, which is tied for the largest public bank with BNA, and BIAT, the largest private bank in Tunisia, have the lowest scores and are the most inefficient. STB particularly suffered from a significant amount of receivables from Tunisian companies; the bank’s dependence on the Central Bank’s refinancing strategy may have decreased, but it still remains. Despite being a private bank that is known for its strict and prudent behaviour regarding its credit policy, BIAT is the most inefficient private bank. Competition appears to play a role. Indeed, most Tunisian private banks, including Attijari Bank and UIB, have strengthened their performance through the acquisition of radically new information technology to address the challenges of "DELTA Global-Banking".
Figure 1 shows that the growth in the average efficiency of the banks in the sample showed mixed progress between 1998 and 2009. The efficiency of Tunisian banks therefore fluctuates. This result confirms the findings of Chaffai and Dietsch (1998), Cook et al. (2000) and Zaghla and Boujelbene (2008). However, those studies noted fluctuations in efficiency scores despite a general trend upward that was not observed in our study. We observe that starting in 2004, the Tunisian banking sector showed a steady decline in efficiency, with decreasing X-efficiency scores that reached their lowest level in 2009, at approximately 95.32%. This result may be due to acquisitions of extremely expensive new software that led to an increase in general operating expenses and a decrease in efficiency, especially for the private Tunisian banks.
Can the banking sector be described as efficient? We answer this
question by conducting an analysis on another aspect of the sector. We split the sample into two groups of banks according to ownership structure and examine their efficiency scores. The mean values for X-efficiency by type of bank (public banks and private banks) are shown in Table 4.
Table 4 Annual evolution of X-efficiency scores of public and private banks in Tunisia, during the period 1998–2000
The data show that public banks are slightly more efficient than private banks, confirming the results of our model’s estimations. This result can be explained by the fact that the Tunisian government recognised the problems caused by non-performing loans, particularly for public banks, and decided to back the debts of public enterprises. Given the large amount of bad loans in their portfolios, this decision primarily benefited the public banks. The government’s action likely improved the public banks’ performance as assessed by the efficiency scores. Impact of IT Components on Cost Efficiency in Tunisian Banks
Our aim is to study the impact of different components of information technology (hardware, software and services) on the cost efficiency of Tunisian banks. We use 107 banks for this analysis because we do not have complete data for all the banks. The study period remains 1998–2009. We use the following regression model:
Pit = β0 + βit HAit + βit SOit + βit SEit + εit (4)
where Pit = the performance of bank i at time t measured by cost efficiency; HAit = investment in hardware (equipment) of bank i at time t; SOit = investment in software (programs) of bank i at time t; SEit = investment in services of bank i at time t; and εit = error term.
The estimation results by Ordinary Least Squares provided by STATA version 10.1 are presented in Table 5. The impact of IT on each component of X-efficiency is heterogeneous: if the coefficient for hardware and services is positive, the coefficient for software is negative. On the one hand, investment in software (programs, processes, and software) negatively affects the cost efficiency of banks, and on the other hand, the acquisition of hardware (equipment) and investments in services (consulting, implementation services, operation services, education, training and maintenance) have a positive and significant effect on the performance of the banks in the sample. This result may suggest that the opportunities associated with the acquisition of software are only beneficial in combination with hardware acquisitions and investments in services.
These findings demonstrate an important implication: the "productivity paradox" does not affect all IT investments. Therefore, we can conclude that Tunisian banks should devote the largest share of their resources to investing in hardware and services because by combining such investments with investments in software, banks can improve their X-efficiency scores.
Syrine Ben Romdhane
114
Table 5 Results of estimations
Variables Cost-efficiency HA/TC SO/TC SE/TC
.1985258** –.1247661
.1059517** HA/CP SO/CP SE/CP
.2996206* –.2000667 .105542**
Note: **,* t of student acceptable at threshold
In addition, the negative impact of investments in software on the cost efficiency of Tunisian banks may be explained by the huge budgets allocated by the banks to the acquisition of extremely expensive software, especially in recent years. The allocation of resources to the acquisition of these programs affects the banks’ cost efficiency because the software is very expensive and has a negative impact on other operating expenses.
As part of the modernisation and renovation of their information systems, Tunisian banks will certainly require new solutions or new software (namely, Global Banking solutions) to cope with increased competition on the domestic market and to strengthen their positions in the international market. The banks will then develop the requisite knowledge and experience to cope with the increase in costs caused by the adoption of new electronic procedures and computerised systems.
IT AND PERFORMANCE OF TUNISIAN BANKS: APPLICATION OF THE DEA METHOD
The use of Data Envelopment Analysis leads to interesting findings. DEA makes it possible to assess the X-efficiency of Tunisian banks over the 1998–2009 period while also identifying the factors that explain the level of inefficiency by using the Tobit model recommended in the literature (Kobou, Ngoa Tabi, & Moungou, 2009; Weill, 2006; Ajmi & Taktak, 2006; Bourdon, 2009). Thus, we use a two-step approach: first, we estimate the technical efficiency of Tunisian banks using the DEA method through the software program DEAP 2.1 (Coelli, 1996). Second, the efficiency scores are used in a TOBIT regression model to analyse predictors of the inefficiency gaps between banks. The results of the regression models are provided by the software program STATA 10.1.
Impact of IT on the Performance of Tunisian Banks
115
Analysis of Efficiency Scores of Tunisian Banks
It should be noted that the measure of efficiency by the DEA method is conducted on all 180 observations assuming that over the period 1998–2009 there were no technology changes that were likely to affect the production process8. The implementation of the DEA method with the selected inputs and outputs allows us to identify the banks’ efficiency scores (Table 6). For an easier interpretation of the results, the efficiency scores are presented in terms of distance of Farrell (if θi is strictly less than 1, then the DMU ‘Decision Making Unit’ is technically inefficient). The models are estimated under variable returns to scale because this option simultaneously provides results in the variable returns to scale and constant returns to scale formats.
Table 6 provides the results of the efficiency measures estimated by the DEA method. The technical efficiency scores presented in the table are input-oriented measures of efficiency, and the complementary measure related to each unit of the efficiency score measures the proportional reduction of inputs without reducing the level of outputs. The empirical results show that the average X-efficiency level of Tunisian banks varies from 51.4% in 1998 to 87.5% in 2009, with an average of 76.3% over the entire period. Thus, if banks use the available inputs in an efficient manner, they can reduce their production costs by 23.7% while maintaining the same level of production. This result shows that banks did not succeed in maximising outputs given the available inputs (technical efficiency). A more detailed analysis of the degree of efficiency by bank and year reveals a degree of heterogeneity in the efficiency levels by bank. Indeed, UIB has the lowest degree of average efficiency over the entire period, followed by TQB, and STUSID has the highest average efficiency over the period, followed by BTE.
Syrine Ben Romdhane
116
Table 6 Annual efficiency scores θi of Tunisian banks (1998–2009)
Note: The scores are calculated under the hypothesis of constant returns to scale. Estimate by TOBIT Model (Tobin, 1958)
Considering that technical efficiency scores range between zero and one, the use of censored models such as the Tobit censored Model is recommended over Ordinary Least Squares regression (Kablan, 2009; Wélé, 2008; Weill, 2006). This model is used when two conditions are met, namely, the dependent variable is continuous in an interval, and the probability that the dependent variable takes a zero value is positive. For the determinants of bank efficiency, the dependent variable "level of efficiency" is continuous in the interval [0,1]. The censored Tobit Model is not appropriate because the dependent variable does not accept null values (Maddala, 1983; Greene, 1995). To overcome this difficulty, we instead explain the inefficiency of the banks using the Tobit censored Model because the level of inefficiency takes null and positive values and is continuous in the interval [0,1]. The dependent variable is censored to keep observations in the sample for which the value of the dependent variable is zero. Therefore, a censored Tobit Model can be used to explain the inefficiency of banks.
Results Analysis of Model Estimates
At this stage, we are prompted to explain the inefficiency factors measured at the initial stage through the DEA model. The dependent variable “inefficiency” is
Impact of IT on the Performance of Tunisian Banks
117
continuous and limited to zero. To better examine the relationship between banking performance and information technology, investments in IT are regressed, as indicated by the following tested model (Model 5):
where TIit represents the technical inefficiency of the bank i at period t, measured by the DEA approach. The ITit: “information technology” variable is measured by the weight of IT investments in the total costs of banks9. TAit is a size variable that is measured by the logarithm of total assets, INTit is an intermediation variable that is measured by the ratio of interest margin over GNP, RISQit is a risk variable that is calculated by the ratio of non-performing loans compared with total loans, RCSit is the staff ratio variable and is measured by the share of senior managers compared with the total workforce, Dit is a dummy variable that = 1 if bank i at period t is public and = 0 if bank i at period t is private and εit is an error term. Table 7 presents the estimates of Model (5) performed according to a Tobit model with random effects.
Table 7 Result of TOBIT Regression Model
Inefficiency Coefficient S. D. z P > z [95% Conf. Interval]
***Significance at the threshold of 1%; **Significance at the threshold of 5%; *Significance at the threshold of 10%.
Our research demonstrates the important role played by IT in financial institutions and particularly in Tunisian banks because IT investments clearly improve banking productivity. This result confirms the results found through the SFA method. The factors that positively affect the level of efficiency in Tunisian banks include the variables "size", "managerial capacity of staff" and "intermediation". These results suggest that large banks are more efficient because they must demonstrate their managerial capacity with a large amount of total assets. Concerning the analysis of the impact of labour, the results show that managerial capacity over personnel positively and significantly affects the efficiency of banks given the high value added from executives. It also appears that the role played by Tunisian banks in the financing of the economy, combined
Syrine Ben Romdhane
118
with the use of IT, positively affects the performance of the banks. Among the factors that adversely affect levels of efficiency, we can cite “credit risk”, which is measured by comparing non-performing loans with total loans. The negative relationship is obvious, and it corroborates the results found in previous studies finding that Tunisian banks are excessively involved in risky activities, and the deterioration of asset quality is the main source of their failure. Thus, Tunisian banks can be expected to improve their efforts to establish adequate reserves to hedge against potential risks.
DEA AND SFA APPROACHES: COMPARISON OF EFFICIENCY LEVELS
In the literature on banking efficiency, only a few studies have used two or more techniques to estimate efficiency scores on a single sample. We briefly summarise these works to extract the most relevant findings and compare them to the results of our study.
The first study was performed by Ferrier and Lovell (1990), who applied the parametric SFA and the non-parametric DEA on a sample of 575 American banks to estimate cost efficiencies. Their findings suggested similarities and differences between the two approaches. The two techniques largely concurred on the average value of cost efficiency: 74% with the SFA and 79% with the DEA. However, the two techniques revealed clear differences in the breakdown of technical and allocative inefficiencies. Technical inefficiencies dominated with the DEA, while the best allocative inefficiencies were provided by the SFA. Resti (1997) measured the cost efficiency of a sample of 270 Italian banks using both DEA and SFA approaches. He noted similarities between the techniques. On the one hand, the average efficiency values were comparable (68.1% with the DEA and 69.5% with the SFA), but on the other hand, there was a strong positive correlation between the scores (86.7%). The author concluded that both efficiency approaches provided sound efficiency measures for the Italian banking sector. Drake and Weyman-Jones (1996) also applied the same two approaches to estimate the cost efficiency of a sample of 46 British real estate companies. They observed differences in average efficiency scores (98% with the SFA and 87.6% with the DEA), although the correlation ratio was very high (97.15%). Sheldon’s (1994) study of a sample of 477 Swiss banks yielded more impressive results: the average efficiency score was approximately 3.9% with the SFA and approximately 56% with the DEA. Furthermore, the author observed an absence of a correlation between the two approaches because the correlation coefficient was 1% and non-significant.
Several general conclusions emerge from this literature review. First, there is a consensus on the soundness of the scores provided by the parametric
Impact of IT on the Performance of Tunisian Banks
119
approaches. Second, the studies do not agree on the differences between the average efficiency scores provided by the parametric and non-parametric approaches. Third, while the studies on American banks suggested a lack of correlation between the scores given by the DEA and SFA approaches, the studies on European banks attempted to demonstrate the existence of a strong correlation between the scores. Nonetheless, these studies are scarce and limited.
Therefore, we try to provide further evidence on the subject first by comparing the efficiency scores provided by the DEA and the SFA, and second by measuring the correlation between the scores. This comparison allows us to test the soundness of the different approaches of measuring efficiency. Table 8 reports the main characteristics of the different efficiency scores obtained through each of the two approaches (average, standard deviation, minimum and maximum). On the one hand, we observe that there are differences in the average X-efficiency scores provided by each approach (75.50% with the DEA and 95.42% with the SFA), and, on the other hand, we see that the SFA approach provides the highest scores.
Table 8 Descriptive statistics of average efficiency scores
Average S. D. Minimum Maximum
DEA .7550833 .1012301 .514 .875
SFA .9542006 .0010769 .9524229 .9559394
We then proceed to measure the correlations between the efficiency
scores calculated through each approach. The results of the correlation tests are shown in Table 9.
Table 9 Correlation between scores
DEA SFA
DEA 1.0000 –0.3294 SFA –0.3294 1.0000
These results show a negative and non-significant correlation between
the efficiency scores calculated through the two approaches. Therefore, our results are consistent with those of Lozano (1997) on Spanish banks and Sheldon (1994) on Swiss banks, who both showed no significant positive relationship between the X-efficiency scores calculated through DEA and SFA. However, our findings do not concur with those of Resti (1997) on Italian banks or Drake and Weyman-Jones (1996) on British companies, who both highlighted the existence
Syrine Ben Romdhane
120
of a strong correlation between the average efficiency scores calculated by the parametric and non-parametric methods.
CONCLUSION
In the context of this research, we examine the relationship between IT investment and the performance of Tunisian banks using the Stochastic Frontier Approach of a translog cost function. Our study includes 15 Tunisian banks over a 12-year period (1998–2009). The study is enhanced by a comparison between the results found according to the DEA method and the SFA method to test the soundness of both approaches to efficiency measurement.
The results obtained show that information technology positively and significantly affects the cost efficiency of Tunisian banks (results from both the DEA and SFA approaches). This result contradicts the "productivity paradox", whereby IT is in no way associated with better performance. It is in the interest of Tunisian banks, which wish to improve their productivity and efficiency, to invest more in IT because it plays a major role in improving their cost efficiency. As for the evolution of the efficiency scores, the results obtained from the panel data suggest that the banks in our sample show degrees of (in)efficiency, but the extent of the (in)efficiency varies according to a number of determinants, especially the determinants that indicate a negative impact. The observation of the dispersion of the degree of effectiveness by bank is highly instructive on the competitiveness of banks in terms of costs. As for the relationship between size and efficiency, large institutions do not show the highest efficiency scores over the period. In addition, the results show that public banks are slightly more efficient than private banks. Finally, our examination of the impact of different IT components (hardware, software and services) on the cost efficiency of Tunisian banks provides an important conclusion: the "productivity paradox" does not affect the entire IT investment: opportunities associated with the acquisition of software are only effective in combination with hardware acquisitions and investments in services.
Finally, given the scarcity of studies on the impact of IT on the performance of banks, new lines of research are open to researchers. Though this research does not pretend to be exhaustive, we recommend furthering this study by adopting other approaches to measure efficiency or by adding other variables (macro-economic, market structure etc.) to the inefficiency term, considering the importance of these variables in explaining banks’ levels of efficiency. We also recommend studying the impact of IT on the performance of Tunisian banks before and after the 2008 financial crisis, which naturally raises the following questions: If the financial crisis affected the IT sector, was the performance of Tunisian banks affected? In other words, does IT always have a positive impact
Impact of IT on the Performance of Tunisian Banks
121
on the technical efficiency and cost efficiency of Tunisian banks, even after the global financial crisis of 2008?
To conclude this study, we are able to highlight the role of information technology in improving the performance of Tunisian banks. These banks must demonstrate expertise and a sufficient learning capacity to cope with the current global financial crisis and to overcome the problems associated with this phenomenon. Finally, despite the contributions of this research, many research opportunities are open, and much work remains to be done to move toward a better understanding of the effects of information technology, an extremely exciting variable.
NOTES
1. The essential characteristic of the DEA approach is that it does not require a particular specification of the production function. This important element has two major advantages. First, we know that in a heterogeneous sample, a specification that would suit the majority of production units is not necessarily relevant to one of their subsets. Second, this approach allows us to simultaneously consider multiple inputs and multiple outputs. Although this approach has been widely used in studies of efficiency, it has a major drawback: it does not take into account errors that can affect the data. Indeed, the DEA method does not address statistical noise and does not envelop the data as in an econometric model. The SFA method, in turn, consists of an econometric frontier estimation of best practices. It has two main advantages over the non-parametric approach. On the one hand, it helps to distinguish the effects of noise (measurement errors) from the effects of inefficiency and thus takes into account the presence of exogenous shocks. Therefore, errors are broken down into two components: an inefficiency component and a random component that combines the measurement errors and exogenous shocks. On the other hand, the SFA method is less sensitive to outliers.
2. This method, also referred to as the "Improved Stochastic Frontier Approach, or ISFA", assumes a different truncation parameter for each bank. The method was first introduced by Battese and Coelli (1995) and was an extension of the work of Huang and Liu (1994), Reifschneider and Stevenson (1991) and Kumbhakar, Ghosh and Mc Guekin (1991).
3. In a cost function, inefficiency is a positive sign because a lack of performance generates a cost to a firm.
4. The likelihood ratio test is given by the following statistic: LR = [Ln(H0) – Ln(H1)], where Ln(H0) and Ln(H1) represent the logarithms of likelihood in the estimated models under the null hypothesis and the alternative hypothesis, respectively. This statistic asymptotically follows a chi-square, having the number of restrictions under the null hypothesis as degrees of freedom, with H0:γ = δ1 = ... = δ7 = 0 .
Syrine Ben Romdhane
122
5. The degrees of freedom correspond to the number of exogenous variables in the model of inefficiency.
6. Since the cost-efficiency score it = exp (-Uit), then the inefficiency term Uit = log (1/ efficiency score).
7. The banks included the sample are five commercial banks (BNA, BH, BT, ATB and BIAT) and five universal banks (BTK, DTE, BTL, STUSID and TQB).
8. This assumption implies that the production function retains the same type of relationship between inputs and outputs, and any technological change is attributable to efficiency.
9. The total costs include personnel costs, interest expenses and depreciation and amortisation of fixed assets.
REFERENCES Aigner, D. J., Lovell, C. A. K. & Shmidt, P. (1977). Formulation and estimation of
stochastic frontier production function models. Journal of Econometrics, 6, 21–37.
Ajmi, D., & Taktak, N. (2006). Inefficience des banques dans un pays en mutation: cas de la Tunisie. Revue Libanaise de Gestion et d’Economie, Revue No. 2. Retrieved from www. religec.org/lodel/docannexe/file/159
Bannour, M. (2008). Efficience des Banques Commerciales Tunisiennes: Etude par l’Approche de Frontière Stochastique. Applied Economics and Simulation, Faculty of Economic Sciences and Management of Mehdia, Tunis.
Battese, G. E. & Coelli, T. J. (1992). Frontier production functions, Technical efficiency and panel data: With application to paddy farmers in India. Journal of Productivity Analysis, 3, 153–169.
Battese, G. E. & Coelli, T. J. (1995). A model for technical inefficiency effects in a stochastic frontier production function and panel data. Empirical Economics, 20, 325–332.
Beccalli, E. (2007). Does IT investments improve bank performance? Evidence from Europe. Journal of Banking and Finance, 31, 2205–2230.
Berger, A. N., & Humphrey, D. B. (1997). Efficiency of Financial Institutions: International survey and directions for future research. European Journal of Operational Research, 98, 175–212.
Berger, A. N., Hancock, D. & Humphrey, D. B. (1993, April). Bank efficiency derived from the profit function. Journal of Banking and Finance, 17, 317–347.
Bourdon, J. (2009). La mesure de l’efficacité scolaire par la méthode de l’enveloppe: test des filières alternatives de recrutement des enseignants dans le cadre du processus Education pour tous. Paper presented at 26th Applied Microeconomics Days, Dijon, France.
Brynjolfsson, E., & Hitt, L. (1996). Paradox lost? Firm-level evidence of high returns to information systems spending. Management Science, 42(4), 1996.
Chaffai, M. E. (1997). Estimation des frontières d’efficience : un survol des développements récents de la littérature. Revue d’Economie du Développement, 3, 33–67.
Impact of IT on the Performance of Tunisian Banks
123
Chaffai, M. E. & Dietsch, M. (1998). Comment accroître les performances des banques commerciales tunisiennes : une question d’organisation ou de taille ? Finance et Développement au Maghreb, 24, 79–89.
Chen, Y. & Zhu, J. (2004). Measuring Information Technology’s indirect impact on firm performance. Information Technology and Management, 5, 9–22.
Coelli, T. (1996). A guide to Frontier Version 4.1: A computer program for stochastic frontier production and cost function estimation (Working paper 96/08). Center
for Efficiency and Productivity Analysis(CEPA), University of New England, Armidale, Australia.
Coelli, T., Rao, D. S. P. & Battese, G. E. (1998). An introduction to efficiency and productivity analysis. Boston: Kluwer Academic Publishers.
Cook, W. D., Hababou, M., & Roberts, G. S. (2000). The effects of financial liberalization on the Tunisian banking industry: A non-parametric approach. Revue d’Economie Industrielle, 29, 22–45.
Dahmane, D. (2002). Réformes du Secteur Bancaire et Efficience: Cas des Banques Commerciales Tunisiennes. Research Institute for Development (IRD), 30 pp.
Daniel, D. L., Longbrake, W. A., & Murphy, N. B. (1973). The effect of technology on bank economies of scale for demand deposits. Journal of Finance, 28(1), 131–146.
De Young, R., & Hunter, W. (2002). Deregulation, the internet and the competitive viability of large banks and community banks (Working paper No. 2001–11). Federal Reserve Bank of Chicago.
Dos Santos, B., Peffers, G., & Mauer, D. (1993). The impact of information technology investment announcements on the market value of the firm. Information Systems Research, 4, 1–23.
Drake, L., & Weyman-Jones, T. (1996). Productive and allocative inefficiencies in U.K. building societies: A comparison of non-parametric and stochastic frontier techniques. The Manchester School, 64, 22–37.
Ferrier, G. D., & Lovell, C. A. K. (1990). Measuring cost fficiency in banking: Econometric and linear programming evidence. Journal of Econometrics, 46, 229–245.
Greenan, N., L’Horty, Y., & Mairesse, J. (2002). La responsabilité des TIC surestimée. The 4 pages of Center for Employment Studies, July, 52.
Greene, W. (1995). Sample selection in the Poisson regression model (Working paper EC-95-06). Department of Economics, Stern School of Business, New York University.
Joumady, O. (2000). Efficacité et productivité des banques au Maroc durant la période de libéralisation financière: 1990–1996. Paper presented at 17th Banking and Monetary Economies International Days, Lisbon, Portugal, 7–9 June, pp. 1–24.
Kablan, S. (2009). Mesure de la performance des banques dans les pays en voie de développement : le cas de l’Union Economique et Monétaire Ouest Africaine. African Development Review, 21(2), 367–399.
Kobou, G., Ngoa Tabi, H., & Moungou, S. (2009). L’efficacité du financement des micro et petites entreprises dans la lutte contre la pauvreté au Cameroun. Paper presented at 11th Scientific Day of the Network Entrepreneurship, INRPME-AUF-AIREPME, Canada, 27–29 May.
Syrine Ben Romdhane
124
Kolari, A., & Zardkoohi, J. (1987). Branch office economies of scale and scope: Evidence from savings banks in Finland. Journal of Banking and Finance, 18(3), 421–432.
Lawrence, C., & Shay, R. (1986). Technology and financial intermediation in a multiproduct banking firm: An econometric study of I.S.S. banks, 1979–1982. In C. Lawrence & R. Shay (eds.), Technological Innovation, Regulation and the Monetary Economy. Cambridge: Ballinger Publishing co.
Licht, G., & Moch, D. (1999). Innovation and information technology in services. Canadian Journal of Economics, 32(2), 48–61.
Lichtenberg, F. (1995). The output contributions of computer equipment and personal: level analysis. Economics of innovation and new technology, 4, 38–58.
Loverman, G. (1994). An assessment of the productivity impact of information technologies. In T. J. Allen, & M. S. Morton (eds.), Information Technology and corporation of the 1990’s: Research studies. Cambridge: MIT Press.
Lozano-Vivas, A. (1997). Profit efficiency of Spanish savings banks. European Journal of Operational Research, 98(2), 381–394.
Maddala, G. (1983). Limited-dependent and qualitative variables in econometrics (Econometric Society Monographs No. 3). Cambridge: Cambridge University Press.
Meeusen, W., & Van Den Broeck, J. (1977). Efficiency estimation from Cobb-Douglas Production functions with composed error. International Economic Review, 18, 435–444.
Morrisson, C. & Brendt, R. (1990). Assessing the productivity of information technology equipments in the US manufacturing industries (Working paper no. 3582). National Bureau of Economic Research.
Oluwagbemi, O., Abah, J., & Achimugu, P. (2011). The impact of Information Technology in Nigeria’s banking industry. Journal of Computer Science and Engineering, 7(2), 63–67.
Omri, A., & Hachana, R. (2008, May). L’investissement en technologies de l’information et la productivité bancaire: Cas des banques tunisiennes. Paper presented at 17th Association of Information and Management Conference, Nice, France.
Prasad, B. & Harker, P. T. (1997). Examining the contribution of information technology toward productivity in US retail banking. (Working paper), Wharton School, University of Pennsylvania.
Resti, A. (1997). Evaluating the Cost-Efficiency of the Italian Banking System: What Can Be Learned from the Joint Application of Parametric and Non-Parametric Techniques. Journal of Banking and Finance, 21, 221–250.
Rouabah, A. (2002). Economies d’échelle, Economies de diversification et Efficacité productive des banques luxembourgeoises. Cahier d’Etudes (Working Paper), Central Bank of Luxembourg, 3, 1–40.
Rowe, F. (1994). Des banques et des réseaux: Productivité et avantages concurrentiels. Economica ENSPTT, Paris.
Schmidt, P., & Lovell, C. A. K. (1979). Estimating technical and allocative inefficiency relative to stochastic production and cost frontiers. Journal of Econometrics, 9, 344–366.
Sealey, C., & Lindley, J. T. (1977). Inputs, outputs and a theory of production and cost at depositary financial institutions. Journal of Finance, 32, 1251–1266.
Impact of IT on the Performance of Tunisian Banks
125
Sheldon, G. (1994). Economies, inefficiencies and technical progress in Swiss banking. In D. Fair, & R. Raymond (Series eds.), The competitiveness of financial institutions and centers in Europe: Financial and Monetary Policy Studies, Vol. 28 (pp. 115–133). The Netherland: Kluwer Academic Publishers.
Siegel, D., & Griliches, Z. (1992). Purchased services, outsourcing, computers, and productivity in manufacturing. In Griliches Z. (ed.), Output measurement in the service sectors (pp. 429–460). Chicago, IL: University of Chicago Press.
Simpson, J. (2002). The impact of the Internet in banking: Observations and evidence from developed and emerging markets. Telematics and Informatics, 19, 315–330.
Solow, R. (1987). We’d better watch out. New York Times Book Review, p. 36. Sullivan, R. J. (2000). How has the adoption of Internet banking affected performance
and risk at banks? A look at Internet banking in the Tenth Federal Reserve District. Federal Reserve Bank of Kansas, Financial Industry Perspectives, 1–16.
Tobin, J. (1958). Estimation of relationships for limited dependent variables. Econometrica, 26(1), 24–36.
Weill, L. (2006). Propriété étrangère et efficience technique des banques dans les pays en transition : Une analyse par la méthode DEA. Revue Economique, 57(5), 1093–1108.
Wele, I. P. (2008). La pérennité des institutions de microfinance dans les pays de l’UEMOA: le cas du Bénin. Unpublished doctoral dissertation, HEC-Université de Liège, Belgium.
Zaghla, A. & Boujelbene, Y. (2008). Explanatory factors of X-efficiency in the Tunisian Banks: A stochastic frontier approach. MPRA Munich Personal RePEc Archive, February, 1–24.