1 Impact of intelligence on performance on the Test of Variables of Attention in children with Attention-Deficit/Hyperactivity Disorder or Attention Deficit Disorder. Stina Bak Julsgaard 1 , Christina Mohr Jensen 2 , Marlene Briciet Lauritsen 2 1 Medical student, Aalborg University, Denmark 2 Supervisors, Research Unit of Child and Adolescent Psychiatry, Aalborg Psychiatry, Aalborg University Hospital, Denmark ABSTRACT Introduction: Test of Variables of Attention (TOVA) is used as a diagnostic tool in the assesment of Attention-Deficit/Hyperactivity Disorder (ADHD) and Attention Deficit Disorder (ADD). Existing literature suggests that intelligence may influence performance on TOVA, however research on this topic is limited. The purpose of this study was to identify whether there exists a correlation between Full Scale Intelligence Quotient (FSIQ) and TOVA scores among children with ADHD or ADD. A second aim was to investigate if IQ index scores correlated with TOVA scores in the same group of children. Methods: Hospital records of children aged six to 17 years with ADHD or ADD who attended the Department of Child and Adolescent psychiatry, Aalborg University Hospital from 1 st June 2014 to 31 st May 2015 were collected. To be included, the child had to have completed both an intelligence test and a TOVA test. Data were analyzed using descriptive statistics, Pearson’s correlation test and Kruskal Wallis test.
Transcript
1
Impact of intelligence on performance on the Test of Variables of Attention
in children with Attention-Deficit/Hyperactivity Disorder or Attention
Deficit Disorder.
Stina Bak Julsgaard1, Christina Mohr Jensen2, Marlene Briciet Lauritsen 2
1Medical student, Aalborg University, Denmark
2Supervisors, Research Unit of Child and Adolescent Psychiatry, Aalborg Psychiatry, Aalborg
University Hospital, Denmark
ABSTRACT
Introduction: Test of Variables of Attention (TOVA) is used as a diagnostic tool in the assesment
of Attention-Deficit/Hyperactivity Disorder (ADHD) and Attention Deficit Disorder (ADD).
Existing literature suggests that intelligence may influence performance on TOVA, however
research on this topic is limited. The purpose of this study was to identify whether there exists a
correlation between Full Scale Intelligence Quotient (FSIQ) and TOVA scores among children with
ADHD or ADD. A second aim was to investigate if IQ index scores correlated with TOVA scores
in the same group of children.
Methods: Hospital records of children aged six to 17 years with ADHD or ADD who attended the
Department of Child and Adolescent psychiatry, Aalborg University Hospital from 1st June 2014 to
31st May 2015 were collected. To be included, the child had to have completed both an intelligence
test and a TOVA test. Data were analyzed using descriptive statistics, Pearson’s correlation test and
Kruskal Wallis test.
2
Results: The sample comprised 75 children. There were significant correlations between FSIQ and
all TOVA variables except from response time (RT). Additionally, IQ index scores correlated with
some of the TOVA variables as well. Correlations were positively associated and weak to moderate
in strength. Significant differences in some TOVA variables were demonstrated when children were
grouped according to IQ.
Discussion and conclusion: Intellectual functioning significantly influenced TOVA performance.
Children with low IQ performed significantly poorer than children with high IQ of whom some
despite ADHD/ADD passed the TOVA test. This questions sensitivity and specificity of the test. A
small sample size, no appropriate control group and lack of a limited time span between conduction
of the intelligence- and TOVA test impaired results, thus results must be interpreted with caution.
DANSK RESUMÈ
Baggrund: Test of Variables of Attention (TOVA) er en neuropsykologisk test, der anvendes som
et led i diagnostikken af Attention-Deficit/Hyperactivity Disorder (ADHD) og Attention Deficit
Disorder (ADD). Eksisterende litteratur peger på, at intelligens muligvis påvirker udfaldet af testen,
men viden på området er til stadighed begrænset, hvorfor yderligere forskning er nødvendig for at
klarlægge sammenhængen. Formålet med studiet var, at undersøge om Total IQ på Wechslers
Intelligence Scale korrelerede med TOVA variable hos børn med ADHD eller ADD. Sekundært
ønskede vi, at undersøge om IQ indeks scorerne korrelerede med TOVA variablene.
Metode: Vi indhentede journaloplysninger på børn i alderen seks til 17 år med ADHD og ADD,
som var set i Børne Ungdomspsykiatrisk regi Aalborg Universitetshospital i perioden 01.06.2014 til
31.05.2015. Barnet skulle have gennemført en intelligenstest og en TOVA test for at blive
3
inkluderet. Data blev analyseret ved brug af deskriptiv statistik. Pearson’s korrelations analyse
beskrev sammenhængen mellem IQ og TOVA præstation. Tilmed udførtes Kruskal Wallis test for,
at undersøge om der var signifikante forskelle på TOVA præstationen, når børnene blev grupperet
efter IQ. Signifikansniveauet var accepteret ved en p-værdi <0.05.
Resultater: 509 børn var set I Børne- og Ungdomspsykiatrisk regi i inklusionsperioden, hvoraf 75
børn opfyldte inklusionskriterierne. Pearsons korrelations analyse viste, at Total IQ korrelerede
signifikant med alle TOVA variable fraset reaktionstid parameteren (RT). Korrelationsstyrken var
svag til moderat og varierede fra 0.279 til 0.473. Ligeledes blev analysen udført for IQ-indeksene,
hvor arbejdshukkommelses-, forarbejdsningshastigheds- og verbalforståelses indeks korrelerede
signifikant med flere af TOVA variablene. Korrelationerne var signifikante, men svage til moderate
i styrke, idet de rangerede fra 0.248 til 0.417. Kruskal Wallis test påviste signifikante forskelle i
TOVA variablene commission errors (impulsivitetsfejl), omission errors (uopmærksomhedsfejl) og
attention performance index (ADHD score), når børnene blev grupperet efter IQ.
Diskussion og konklusion: Total IQ korrelerede signifikant med alle TOVA parametre med
undtagelse af RT. Korrelationen viste en positiv kurve af svag til moderat styrke, hvilket indikerer,
at præstationen på TOVA forbedres i takt med intellekt, hvorfor vi med rette kan konkludere, at
intelligens påvirker TOVA performance. Yderligere påviste vi, at flere af TOVA variablene
korrelerer signifikant med IQ indeksene verbalforståelse, arbejdshukkommelse og
forarbejdsningshastighed. På baggrund af resultaterne bør det fremtidigt overvejes, om TOVA skal
revideres, så testen foruden alder og køn også standardiseres med IQ. TOVA vil da formidle et
mere korrekt billede af barnets eventuelle opmærksomhedsproblemer, hvorved forekomsten af
fejldiagnosticering af ADHD eller ADD vil mindskes. Yderligere forskning kræves på området pga.
4
tvivlsom repræsentativitet i dette studie samt en række andre fejlkilder, hvor blandt andet mangel på
en kontrolgruppe er en væsentlig. Fejlkilderne reducerer resultaternes validitet, hvorfor
konklusioner fra dette studie må fortolkes med forsigtighed.
ABBREVIATIONS:
ADHD Attention-Deficit/Hyperactivity Disorder
ADD Attention Deficit Disorder
TOVA Test of Variables of Attention
RTV Response Time Variability
RT Response Time
CE Commission Errors
OE Omission Errors
API Attention Performance Index
WISC Wechsler’s Intelligence Scale for Children
WAIS Wechsler’s Intelligence Scale for Adults
FSIQ Full Scale Intelligence Quotient
VCI Verbal Comprehension Index
PRI Perceptual Reasoning Index
WMI Working Memory Index
PSI Processing Speed Index.
5
BACKGROUND: The neuropsychological test Continuos Performace Test (CPT) is widely used
for evaluating children suspected for deficits in attention functioning e.g. attention-
deficit/hyperactivity disorder (ADHD) and attention deficit disorder (ADD). CPT, developed by
Rosvold, Mirsky, Sarason, Brandsome and Beck (1956), was originally aimed at detecting brain
damage in children and adults. Presently, CPT is used in the diagnostic process of detecting ADHD
and ADD due to findings of Rosvold et al., as their research indicated that brain damaged subjects
performed inferiorly on the test compared to controls due to lack of alertness.
More types of CPTs exist and one of them is Test of Variables of Attention (TOVA). TOVA
differentiates from other CPTs by its simplicity, as no letters or auditory stimuli challenge the child,
thereby avoiding confounding factors as e.g. language difficulties and short-term memory problems
(Forbes 1998). Furthermore, time duration of the test is extended challenging the attention
functioning of the child. These features are considered advantageous when identifying children with
ADHD or ADD
TOVA test results must be interpreted in agreement with the additional test battery when evaluating
ADHD or ADD. This typically consists of clinical observation, questionnaires about ADHD
symptoms replied by parents and teachers and additional parental interviews (Naglieri et al. 2005).
Subjectivity mainly characterizes such information, hence integration of neuropsychological test is
of great importance due to its objective perspective.
However, there is disagreement about the use of TOVA because of a potential correlation to
intelligence. Studies have investigated the relationship of TOVA and intellectual functioning, but
no overall consensuses have been reached, as results are few and conflicting.
6
Naglieri et al. (2005) investigated whether consistency between diagnostic tools used in the
evaluation of ADHD existed. The sample group comprised 117 children aged six to 16 years. They
reported only few significant correlations between CPT and Wechsler Intelligence Scale for
Children third edition (WISC-III), indicating that intellect did not affect performance on CPT. In
contrast, another study found all variables in the TOVA test to significantly correlate with IQ in a
group of 138 elementary students aged six to ten years. This result indicated that intelligence
influenced performance on the TOVA test (Hurford et al. 2014).
In a clinical setting, it makes it uncertain and difficult to interpret TOVA results in relation to the
child’s intellectual functioning, thus more research is required to establish consistency.
The aim of this study was therefore to clarify whether there exists a significant correlation between
Full Scale Intelligence Quotient (FSIQ) and TOVA scores among children with ADHD or ADD. A
second aim was to identify, whether any IQ index scores significantly correlated with TOVA test
scores.
We hypothesized that children with high IQ performed superiorly compared to children below
average intelligence.
MATERIALS AND METHODS
Participants
Hospital records from children aged six to 17 years diagnosed with ADHD or ADD who attended
the Department of Child and Adolescent psychiatry, Aalborg University Hospital, Denmark from 1st
June 2014 to 31st May 2015 were collected. Only children who had both completed the TOVA and
an intelligence test were included. In each electronic hospital record we searched for the following
words “Test of Variables of Attention”, or “TOVA” or “T.O.V.A” and “Wechsler’s Intelligence
7
Scale for Children” or “WISC” or “Wechsler’s Intelligence Scale for Adults” or “WAIS” or
“Intelligence Quotient” or “IQ” or “Intelligence” or “Giftedness”. Patients were excluded from the
study due to misdiagnosing of ADHD/ADD, lack of intelligence test and discontinued TOVA test,
or no obtainable TOVA test in the hospital record. The above-described criteria resulted in the data
pool, which formed the foundation for this analysis. To validate our method, a random sample of
ten hospital records was examined, to assure that none of the excluded subjects had conducted a
TOVA test.
Test of Variables of Attention
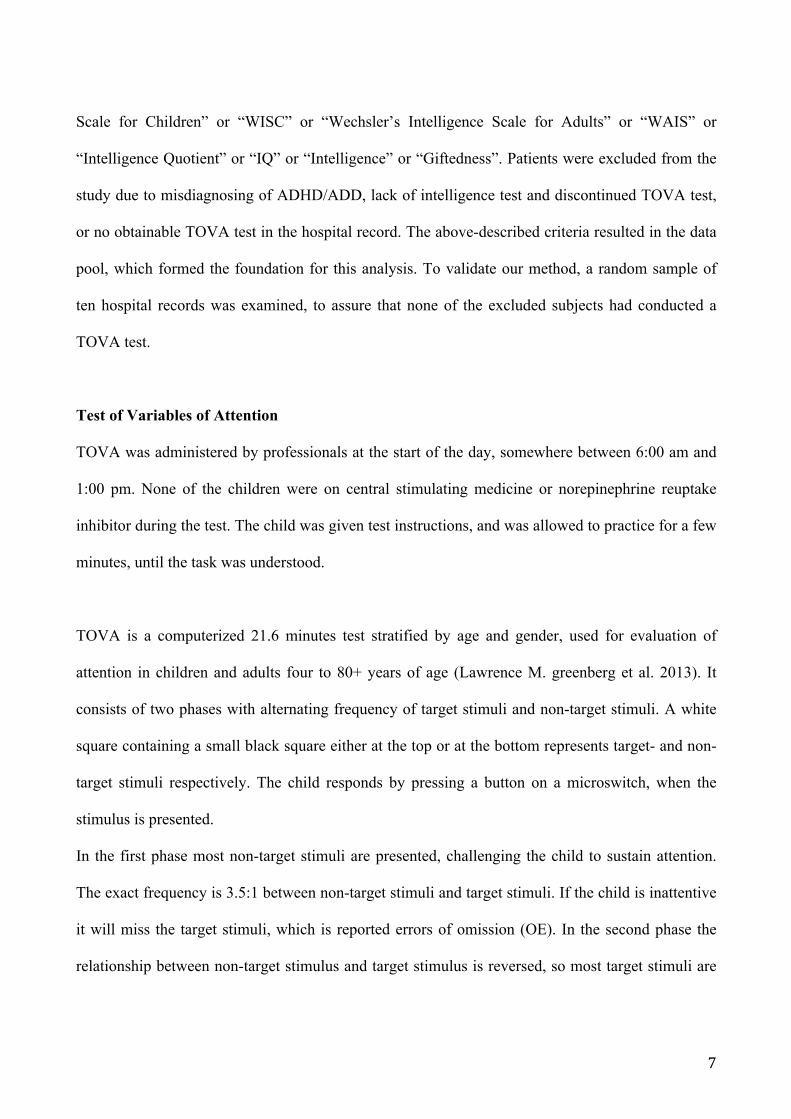
TOVA was administered by professionals at the start of the day, somewhere between 6:00 am and
1:00 pm. None of the children were on central stimulating medicine or norepinephrine reuptake
inhibitor during the test. The child was given test instructions, and was allowed to practice for a few
minutes, until the task was understood.
TOVA is a computerized 21.6 minutes test stratified by age and gender, used for evaluation of
attention in children and adults four to 80+ years of age (Lawrence M. greenberg et al. 2013). It
consists of two phases with alternating frequency of target stimuli and non-target stimuli. A white
square containing a small black square either at the top or at the bottom represents target- and non-
target stimuli respectively. The child responds by pressing a button on a microswitch, when the
stimulus is presented.
In the first phase most non-target stimuli are presented, challenging the child to sustain attention.
The exact frequency is 3.5:1 between non-target stimuli and target stimuli. If the child is inattentive
it will miss the target stimuli, which is reported errors of omission (OE). In the second phase the
relationship between non-target stimulus and target stimulus is reversed, so most target stimuli are
8
presented, with a frequency of 3.5:1. The child must react more often, but also restrict oneself from
responding to non-targets stimuli that are rarely presented. If the child responds to a non-target
stimulus it reflects impulsivity, because of the lack of ability towards inhibition, and it is registered
errors of commission (CE). Children with ADHD usually tend to make more errors of omission and
commission than their peers (Munkvold et al., 2014, Keith & al, 2003). The TOVA test also
measures the time duration from presenting stimulus to pressing the button, representing response
time (RT), and response time variability (RTV), which is the standard deviation of response time.
Important measures of TOVA are total scores and attention performance index (API). API is a score
representing the child’s overall performance, when compared to a group of subjects with ADHD. It
is calculated on the basis of RT from the first half of the test, response sensitivity (d’) from the
second half of the test, Total-RTV and a calibration constant of 1.80. When the API score is below
0 it indicates impaired function of attention (Hughes 2008).
TOVA results are reported as standard scores, where 100 is average standard with a standard
deviation of 15. Scores above 85 are within normal limits. Scores in the range from 80 to 85
constitute a borderline area, and scores below 80 indicates an abnormal outcome. (Lawrence M.
greenberg et al. 2013)
Wechsler’s Intelligence Scale
Wechsler’s Intelligence Scale is used for evaluation of intellectual functioning in children and
adults. It is considered reliable, and explores different facets of intellectual abilities due to the many
different types of tasks it includes.
Wechsler’s Intelligence Scale for Children (WISC) is available in a third- (WISC-III) and a fourth
(WISC-IV) edition, which is aimed at children aged six to 16 years. Likewise, Wechsler’s Adult
9
Intelligence Scale (WAIS) exists in a third (WAIS-III) and fourth (WAIS-IV) edition, and is used to
test adolescents and adults aged 16 to 89 years.
WISC-III and WAIS-III are divided into FSIQ, Verbal IQ (VIQ) and Performance IQ (PIQ), which
are calculated on the basis of scores obtained from ten subtests. WISC-IV and WAIS-IV have
replaced above-mentioned IQ scores with Verbal Comprehension Index (VCI), Perceptual
Reasoning index (PRI), Working Memory Index (WMI), Processing Speed Index (PSI), FSIQ and
General Ability Index (GAI) (Andersen & Jensen 2015). Furthermore all measured variables in
WISC-IV are equally weighted, whereas WISC-III does not consider WMI and PRI as important as
the other variables measured. Therefore, WMI and PRI are not as heavily weighted as the other
variables when FSIQ is calculated (Garcia 2009). In this study the majority of subjects had
completed WISC-IV or WAIS-IV and only a small number was evaluated with WISC-III.
Statistical analysis
SPSS version 23.0 was used for analysis. Data were reported as means ± standard deviations (SD)
and frequencies. Pearson’s correlation coefficient r was computed to identify correlations between
intelligence- and TOVA variables. The correlations were made only for Total-RTV, Total-RT,
Total-CE, Total-OE and API. Significance was accepted at the level of p<0.05.
Based on scores of FSIQ, children were categorized into four IQ groups: Very low IQ (0-69, n=2),
low IQ (70-84, n=25), normal IQ (85-115, n=45) and high IQ (≥116, n=3). Kruskal Wallis test
investigated whether there existed statistical significant differences between the IQ groups
according to TOVA performance.
10
RESULTS
A total of 509 patients in the age from six to 17 years with ADHD or ADD attended the Department
of Child and Adolescent Psychiatry during the inclusion period. Of these, 99 patients had conducted
a TOVA test. In the sample of 99 patients, four were misdiagnosed with ADHD/ADD, seven had no
intelligence test carried out, eight did not complete the TOVA test, and five of the TOVA tests were
not obtainable in the hospital record. In total 75 patients were included in the study.
Demographics
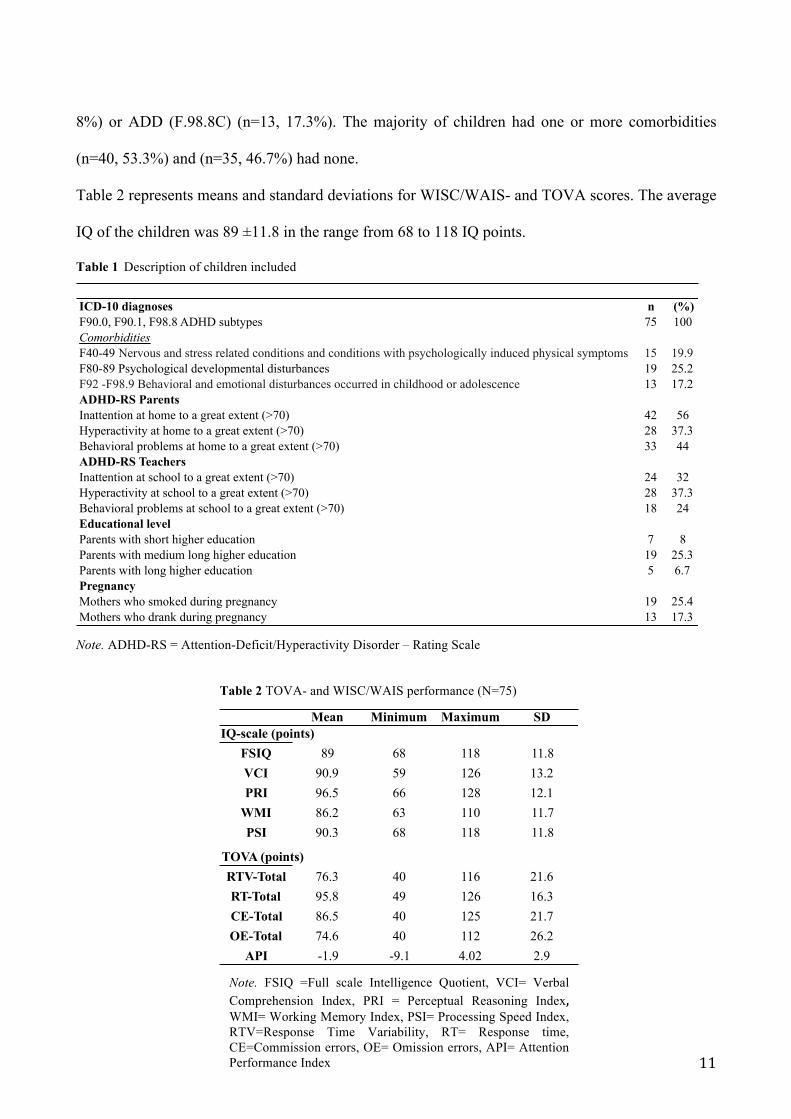
A complete description of the sample is available in table 1. The sample comprised 47 (62.7%)
male subjects and 28 (37.3%) female subjects with a mean age of 13.5 years ±2.7 SD, ranging from
7.8 to 17.7 years of age. Most children were Danish (n=73, 97.3%) and the remainders were Thai
(n=1, 1.3%) or Icelandic (n=1, 1.3%). All children had an ICD-10 diagnosis, which was either
ICD-10 diagnoses n (%)F90.0, F90.1, F98.8 ADHD subtypes 75 100ComorbiditiesF40-49 Nervous and stress related conditions and conditions with psychologically induced physical symptoms 15 19.9F80-89 Psychological developmental disturbances 19 25.2F92 -F98.9 Behavioral and emotional disturbances occurred in childhood or adolescence 13 17.2ADHD-RS ParentsInattention at home to a great extent (>70) 42 56Hyperactivity at home to a great extent (>70) 28 37.3Behavioral problems at home to a great extent (>70) 33 44ADHD-RS TeachersInattention at school to a great extent (>70) 24 32Hyperactivity at school to a great extent (>70) 28 37.3Behavioral problems at school to a great extent (>70) 18 24Educational level Parents with short higher education 7 8Parents with medium long higher education 19 25.3Parents with long higher education 5 6.7PregnancyMothers who smoked during pregnancy 19 25.4Mothers who drank during pregnancy 13 17.3
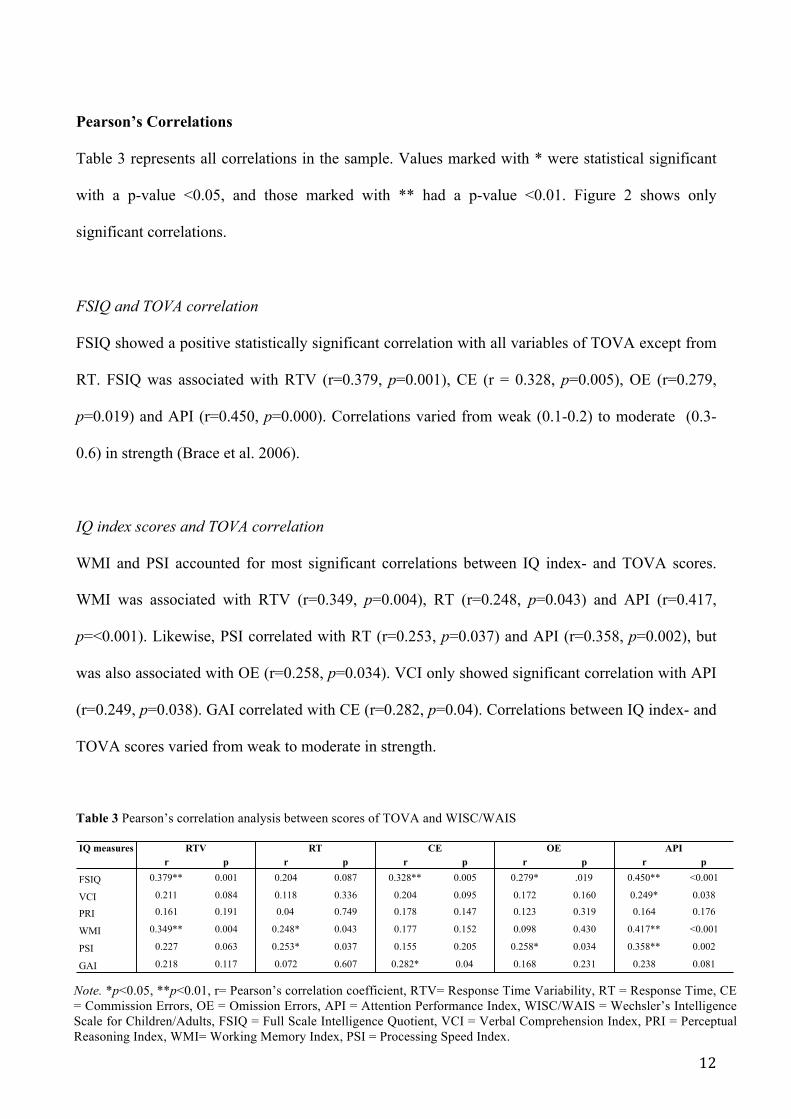
Note. *p<0.05, **p<0.01, r= Pearson’s correlation coefficient, RTV= Response Time Variability, RT = Response Time, CE = Commission Errors, OE = Omission Errors, API = Attention Performance Index, WISC/WAIS = Wechsler’s Intelligence Scale for Children/Adults, FSIQ = Full Scale Intelligence Quotient, VCI = Verbal Comprehension Index, PRI = Perceptual Reasoning Index, WMI= Working Memory Index, PSI = Processing Speed Index.
13
Correlations were all positively associated, indicating when one variable increases in value the
second variable increases correspondingly i.e. when FSIQ increases in value the scores of TOVA
variables increase as well (Brace et al. 2006).
Kruskal Wallis Test
Figure 3 illustrates TOVA scores distributed according to IQ. Children with very low- (0-69) and
low IQ (70-84) performed inferiorly on all TOVA variables except from RT, which was the only
variable within normal limits. Interestingly, the group with very low IQ (0-69) made fewer CE
compared to children in the IQ group (70-84). The IQ group (85-115) obtained scores within
normal limits of RT and CE, but remaining variables of TOVA were in the abnormal area. Children
with high IQ (>116) performed superiorly on all TOVA variables.
Kruskal Wallis test was conducted to identify significant differences between the IQ groups in
relation to TOVA performance. The test showed significant differences of the variables CE, OE and
Figure 2 Statistical significant correlations between TOVA variables and intelligence parameters
14
API. χ2(3, n=71)= 13.15, p< 0.05 for CE, χ2(3, n=71)= 11.77, p<0.05 for OE and χ2(3, n=74)= 9.02,
p< 0.05 for API.
DISCUSSION
The purpose of this study was to investigate if FSIQ from Wechsler’s Intelligence Scale
significantly correlated with TOVA variables and secondly investigate if any of the IQ index scores
correlated with scores on the TOVA test.
Figure 3 Distribution of scores of Response Time Variability, Response Time, Errors of Commission and Errors of Omissions within the IQ groups. The lines drawn indicate areas of normal, borderline and abnormal scores. Scores ≥85 are within normal limits, while scores of 80-85 are in the borderline area, and scores below 80 are abnormal.
15
In total 30 correlations were computed using Pearson’s correlation, in which 12 were statistically
significant. FSIQ correlated with all of the TOVA variables except from RT. The correlations were
significant, but weak to moderate in strength as they varied in range from 0.279 to 0.450. Since all
correlations were positively associated, performance on the TOVA test increased correspondingly
with FSIQ. Furthermore, significant differences in scores of OE, CE and API between IQ groups
were identified using Kruskal Wallis test. These findings suggested that FSIQ significantly
influenced the majority of the TOVA variables.
The IQ indexes VCI, WMI, PSI and GAI were significantly associated with some of the TOVA
variables. PSI and WMI correlated with RT, indicating that processing speed and working memory
are essential factors when it comes to tasks, which requires rapidity. PSI was the only variable,
which correlated with OE, indicating that processing speed affects the number of omission errors.
PSI, VCI and WMI correlated with API, thereby influencing the overall performance in TOVA.
Additionally, API was the variable, which was influenced most by intelligence parameters, as the
correlations were most, strongest and approached highest level of significance. Correlations were
weak to moderate in strength ranging from 0.248 to 0.417.
Andersen & Jensen (2005) conducted a meta-analysis of five papers, which explored the correlation
between intelligence and performance on CPT in children aged seven to 16 years. Male subjects
comprised the largest percentage of included children. In most cases Conner’s CPT were used,
which is not directly comparable to TOVA parameters. Results reported were almost similar to
findings of this study. A significant correlation between FSIQ and RTV, RT and OE existed, but
they could not conduct correlation analysis for API, as it was not obtainable in the investigated
studies, except from one study, where no significant correlation was found. Correlations for FSIQ
16
and TOVA scores were all weakly associated and in the range from -0.203 to -0.285. Only one
included study had a control group, thereby diminishing validity of their results.
None of our findings regarding IQ index scores were consistent with the findings in the meta-
analysis. Besides FSIQ, PSI was the only variable associated with sustained attention, whereas the
meta-analytic findings revealed that almost all other indexes of IQ, being PIQ, PRI, WMI and PSI
were associated with OE.
Correlations of this study were all positively associated while meta-analytic correlations were
negatively associated. This difference might be due to comparison of different TOVA scores. We
used TOVA scores that were already processed and standardized, whereas the meta-analysis used
raw test scores of TOVA. Still, results agreed that TOVA performance depended on FSIQ.
This study differs from others, by including all children despite IQ, thereby providing a wider
clinical understanding of the relationship between intellectual functioning and TOVA performance.
Most other studies excluded children with an IQ below 80, which is a problem as it reduces
knowledge about how children in both ends of the IQ spectrum perform on TOVA.
Only a minority of patients entered the IQ groups very low- (0-69) and high IQ (≥116), namely n=2
and n=3 respectively, which makes the interpretation difficult and conclusions can barely be made.
However, correlations indicated that children at the low end of the IQ spectrum performed
significantly poorer on all variables of TOVA except from RT compared to children with high IQ,
as hypothesized.
This may indicate that the test is too difficult for children below average intelligence. These
children are at risk of being misdiagnosed with ADHD/ADD if the clinician is not aware of
TOVA’s relation to intelligence. In contrast, a third of children diagnosed with ADHD pass CPTs.
(Naglieri et al. 2005). A reasonable explanation could be that children with high IQ’s might
17
compensate by overexerting themselves in order to remain focused and attentive during the test to
do well. With this knowledge in mind, it is vital to critically question the sensitivity and specificity
of the TOVA test, which needs to be studied further. Forbes (1998) investigated whether TOVA
could differentiate children with ADHD from children with other diagnoses, but did not take IQ
into consideration. TOVA was reported to correctly identify 80% of children with ADHD. In
addition, another study reported the sensitivity and specificity to be 85.7% and 70% respectively,
thus 30% of children in the control group were incorrectly identified with attention problems
(Schatz et al. 2001).
Currently, the TOVA test is stratified by age and gender. Prospectively, it should be considered to
also stratify it by intelligence, as FSIQ correlated with all variables of TOVA except from RT. In
this way the TOVA test would provide a more accurate assessment of the child. Before
implementing such a suggestion further studies must be carried out with a larger sample group of
children. Also the fact that correlations only were weak to moderate in strength indicates the need
for further research. A larger sample group would probably contribute to stronger associations, and
presumably more significant results.
Another strength of this study is that all types of children were included. The sample group was
heterogeneous due to no exclusion criteria for comorbidities or family circumstances, which is
advantageous rather than disadvantageous. It provides a representative and real picture of the
general population, however risk of confounders, which can impact results, and thus be a limitation.
18
Limitations
In this study a number of limitations were present. Our sample comprised only 75 patients out of
509 in total. This sample is small and may not be representative for the entire ADHD population.
Also the fact that included children were all clinical referred in the region of Northern Jutland and
none were from the general population questions the representativity of the results. A larger sample
group and inclusion of children from more regions across the country would provide more
generalizable results.
Absence of an appropriate control group reduces validity of our results. Prospectively, a control
group consisting of children without ADHD or ADD is needed to fully clarify the correlation
between IQ and performance on the TOVA test.
Another limitation of this study was an infinite time span between conduction of the two
neuropsychological tests TOVA and WISC/WAIS was allowed. IQ is an unstable factor over time,
and it typically improves with age. If the time span was too large, the child might have an improved
IQ, higher than assumed at the time testing with TOVA, which would make discrepancies in the
results. For improvement of the study, a time limitation between the two tests is required. This was
not feasible in our study as this would result in a massive reduction of the sample size.
CONCLUSION
FSIQ correlated significantly with RTV, CE, OE and API. The IQ indexes, being VCI, WMI, PSI
and GAI did also correlate with some of the TOVA variables. API accounted for most and strongest
correlations. These results indicate that the TOVA test is influenced by intelligence. The TOVA test
19
must be interpreted with caution and with the child’s IQ in mind. This especially applies for
children with low IQ, as they are at greater risk of being misdiagnosed with ADHD or ADD, when
using TOVA. However, some intellectual gifted children with ADHD or ADD pass the TOVA test.
This questions sensitivity and specificity of TOVA, and emphasizes a potentially need for revision.
A small sample size and no control group questions the representativity and validity of our findings,
hence they must be interpreted with caution.
ACKNOWLEDGEMENTS
A great thank to both of my supervisors psychologist Christina Mohr Jensen and dr. Marlene Briciet
Lauritsen for providing valuable advise and guidance during the process of making this report.
REFERENCES Andersen, S.M. & Jensen, C.M., 2015. A systematic review and meta-analysis of how performance
on continuous performance tests correlate with IQ. Unpublished
Brace, N., Kemp, R. & Snelgar, R., 2006. SPSS for psychologists,
Forbes, G.B., 1998. Clinical utility of the Test of Variables of Attention (TOVA) in the diagnosis of attention-deficit/hyperactivity disorder. Journal of clinical psychology, 54(4), pp.461–76. Available at: http://www.ncbi.nlm.nih.gov/pubmed/9623751 [Accessed November 25, 2015].
Garcia, J., 2009. The relationship between aspects of cognitive functioning and academic skills in a clinically referred population. , 69, p.5024. Available at: http://ovidsp.ovid.com/ovidweb.cgi?T=JS&PAGE=reference&D=psyc6&NEWS=N&AN=2009-99040-339.
Hughes, S.J., 2008. A Guide to Clinical Interpretation of the TOVA. , pp.1–12. Available at: http://www.tovatest.com/.
Hurford, D.P. et al., 2014. Examination of the Effects of Intelligence on the Test of Variables of Attention for Elementary Students. Journal of Attention Disorders. Available at: http://jad.sagepub.com/cgi/doi/10.1177/1087054714550480.
Keith, C. & al, et, 2003. Relations Between Continuous Performance Test Performance Measures and ADHD Behaviors. Journal of Abnormal Child Psychology, 31(5).
20
Lawrence M. greenberg, M. et al., 2013. The TOVA Company.
Munkvold, L.H., Manger, T. & Lundervold, A.J., 2014. Conners’ continuous performance test (CCPT-II) in children with ADHD, ODD, or a combined ADHD/ODD diagnosis. Child neuropsychology : a journal on normal and abnormal development in childhood and adolescence, 20(1), pp.106–26. Available at: http://dx.doi.org/10.1080/09297049.2012.753997\nhttp://www.ncbi.nlm.nih.gov/pubmed/23244393.
Naglieri, J. a. et al., 2005. Relationships between the WISC-III and the Cognitive Assessment System with Conners’ rating scales and continuous performance tests. Archives of Clinical Neuropsychology, 20(3), pp.385–401.
Schatz, A.M., Ballantyne, A.O. & Traumer, D.A., 2001. Sensitivity and Specificity of a Computerized Test of Attention in the diagnosis of Attention-Deficit/hyperactivity Disorder. Journal of Composite Materials, 33(10), pp.928–940.